User login
Richard Franki is the associate editor who writes and creates graphs. He started with the company in 1987, when it was known as the International Medical News Group. In his years as a journalist, Richard has worked for Cap Cities/ABC, Disney, Harcourt, Elsevier, Quadrant, Frontline, and Internet Brands. In the 1990s, he was a contributor to the ill-fated Indications column, predecessor of Livin' on the MDedge.
Young adults lead the ranks of recently insured
The uninsured rate for young adults fell 50% from 2010 to 2016, according to the Agency for Healthcare Research and Quality.
In the first quarter of 2010, 30.6% of adults aged 18-29 years did not have health insurance at the time they were interviewed for the National Health Interview Survey. By the last quarter of 2016, that figure was down to 15.4%, a drop of nearly 50%, the AHRQ said in its annual National Healthcare Quality and Disparities Report.
For the total population under age 65 years, the uninsured rate dropped from 17.5% in the first quarter of 2010 to 10.8% in the fourth quarter of 2016, the AHRQ said, for an overall decline of 38%.
The future needs more surgeons
By 2030, the U.S. health care system could be facing a shortage of 19,800-29,000 surgeons, which means that things are looking up.
Last year, the Association of American Medical Colleges projected a shortage of 25,200-33,200 surgeons by the year 2025, which is larger than the 15,000- to 24,000-surgeon shortfall now projected for 2025 – larger even than the shortage that the AAMC is currently projecting for 2030.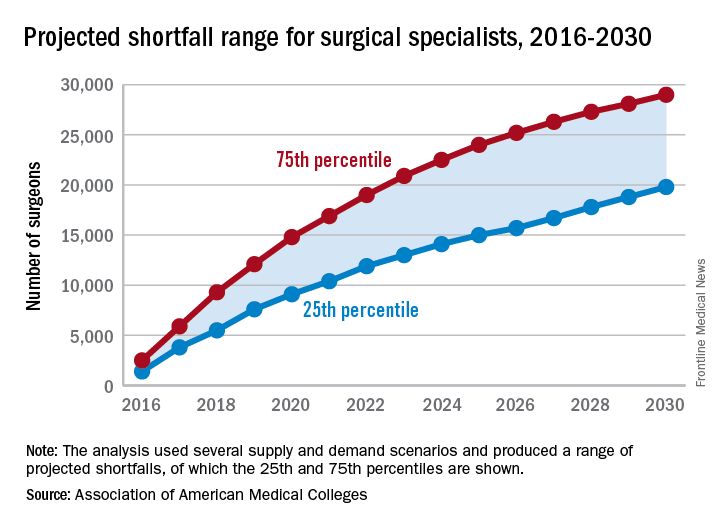
“On the basis of current trends, the number of newly trained surgeons is almost equal to projected future attrition, so there is little (if any) projected growth in supply,” the report’s authors wrote. Demand – mainly in the form of population growth and aging – is another story. From 2015 to 2030, “the U.S. population is projected to grow by close to 12%, from about 321 million to 359 million. The population under age 18 is projected to grow by only 5%, while the population aged 65 and over is projected to grow by 55%,” they said.
In other words, it may not be the best time to be a pediatrician.
Safety issues not that unusual in medical offices
More than a quarter of medical offices report that they are contacted by pharmacies on a daily or weekly basis to clarify or correct prescriptions, according to the Agency for Healthcare Research and Quality.
That safety issue – reported by 27% of outpatient medical offices – was the most common among those included in the Medical Office Survey on Patient Safety Culture from November 2013 to November 2015, the AHRQ said in its annual National Healthcare Quality and Disparities Report. Another 12% of respondents said that such contact with a pharmacy was a monthly occurrence.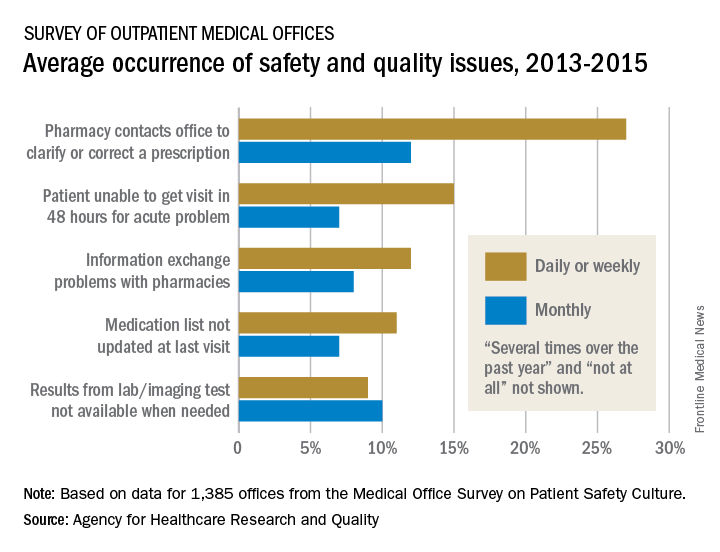
Information exchange problems with pharmacies occurred daily or weekly in 12% of offices and monthly in 8%, while the occurrence of medication lists not being updated at the last visit was 11% daily/weekly and 7% monthly. Additionally, 9% of offices reported that results from laboratory or imaging tests were not available when needed on a daily/weekly basis and 10% on a monthly basis, the AHRQ reported.
“Lack of access to care and lack of access to timely and accurate medical information and test results may contribute to patient safety events such as missed or delayed diagnoses, medication errors, failure to order appropriate diagnostic or laboratory tests, incorrect interpretation of tests, and inadequate follow-up on results,” the AHRQ said in the report.
Insurance coverage gainers outnumber coverage losers
Fewer nonelderly adults lost their health insurance in 2015 than in 2013, while more gained coverage, according to the Agency for Healthcare Research and Quality.
The presence of chronic conditions played a part for those who lost coverage. From 2012 to 2013, 2.9% of adults aged 18-64 years with one or more chronic conditions lost their insurance, compared with 1.5% who lost coverage from 2014 to 2015. Those with no chronic conditions saw a corresponding drop from 4% to 3.2%, but that change was not significant, AHRQ investigators reported.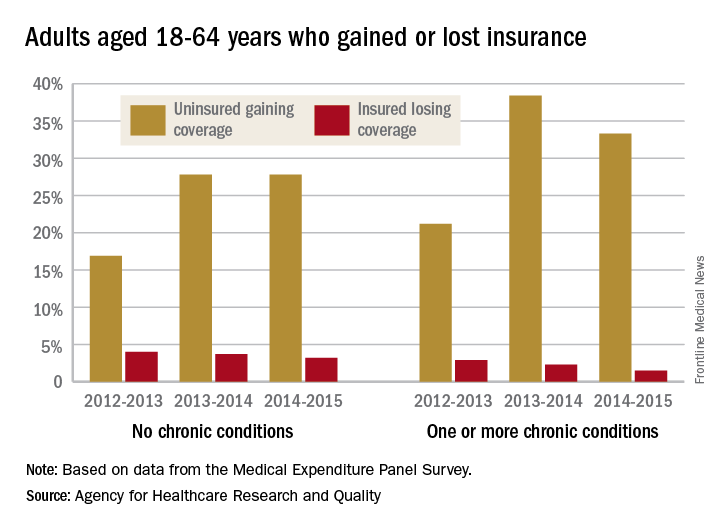
For this analysis, the chronic conditions were active asthma, arthritis, diabetes, emphysema, heart disease, high blood pressure, high cholesterol, bronchitis, and stroke. The source of the data was the Medical Expenditure Panel Survey.
Obstetric trauma rates show long-term decline
Obstetric trauma rates have dropped since 2000 for vaginal deliveries both with and without instrument assistance, but assisted deliveries are still six times more likely to result in injuries, according to the Agency for Healthcare Research and Quality.
In 2014, the trauma rate for unassisted vaginal deliveries was 19 per 1,000, a drop of 51% from the rate of 39 per 1,000 deliveries in 2000. 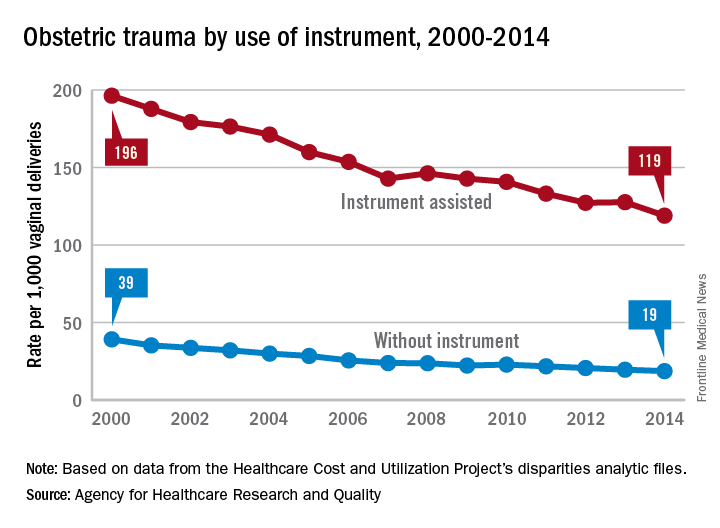
For this analysis, injuries were defined as third- or fourth-degree lacerations of the perineum; rates were adjusted by age using hospitalizations for 2010 as the standard population.
Obstetric trauma rates have dropped since 2000 for vaginal deliveries both with and without instrument assistance, but assisted deliveries are still six times more likely to result in injuries, according to the Agency for Healthcare Research and Quality.
In 2014, the trauma rate for unassisted vaginal deliveries was 19 per 1,000, a drop of 51% from the rate of 39 per 1,000 deliveries in 2000.
For this analysis, injuries were defined as third- or fourth-degree lacerations of the perineum; rates were adjusted by age using hospitalizations for 2010 as the standard population.
Standardized infection ratio for CLABSI almost halved since 2009
The standardized infection ratio (SIR) for central line–associated bloodstream infections dropped 42% from 2009 to 2014, according to the Agency for Healthcare Research and Quality.
For acute care hospitalizations, the SIR for central line–associated bloodstream infections (CLABSIs) fell from 0.854 in 2009 to 0.495 in 2014. Over that same time period, the SIR for surgical site infections involving Surgical Care Improvement Project procedures decreased from 0.981 to 0.827 – almost 16%, the AHRQ said in its annual National Healthcare Quality and Disparities Report.
From 2010 to 2014, the SIR for catheter-associated urinary tract infections increased 6.7% from 0.937 to 1.000, but that change was not significant. For laboratory-identified hospital-onset Clostridium difficile infection, the SIR dropped from 0.963 to 0.924 – about 4% – from 2012 to 2014, the AHRQ reported using data from the National Center for Emerging and Zoonotic Infectious Diseases and the National Healthcare Safety Network.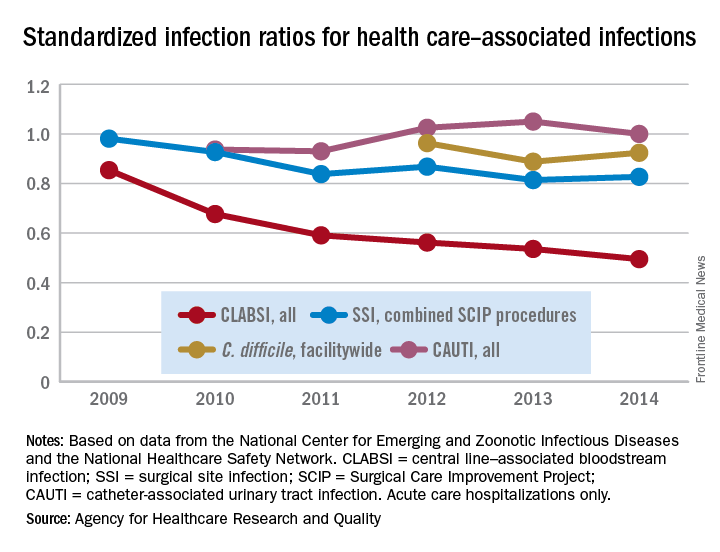
Physicians shift on support of single-payer system
, according to a recent survey by physician recruiting firm Merritt Hawkins.
A single-payer system was “strongly supported” by 42% and “somewhat supported” by 14% of the 1,033 physicians who responded to the email survey, which was sent out on Aug. 3. Compared with the 41% who expressed opposition to a single payer – 35% “strongly opposed” and 6% “somewhat opposed” – the total of 56% supporting it was more than enough to cover the margin of error of ±3.1%. The remaining 3% of physicians said that they neither support nor oppose a single-payer system, Merritt Hawkins reported.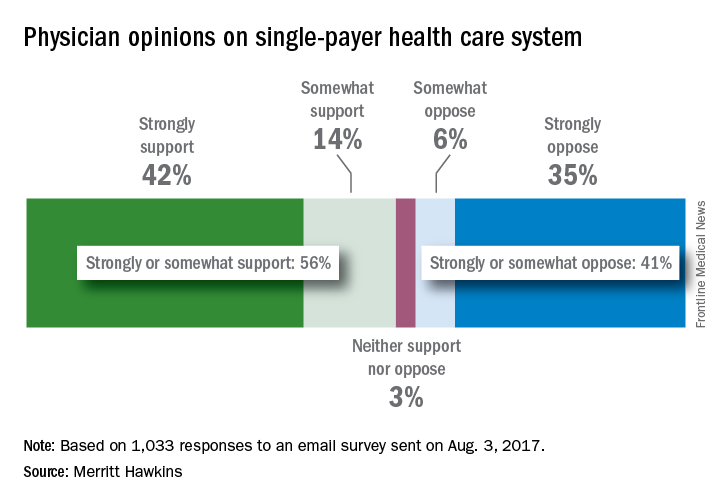
In a survey the company conducted in 2008, just 42% of physicians supported a single-payer system and 58% opposed it. “Physicians appear to have evolved on single payer,” Travis Singleton, senior vice president of Merritt Hawkins, said in a statement. “Whether they are enthusiastic about it, are merely resigned to it, or are just seeking clarity, single payer is a concept many physicians appear to be embracing.”
Say ‘Aloha’ to the best health care
It probably should come as no surprise that Hawaii, which has been named the healthiest state for 5 consecutive years, is now being honored for having the best health care by personal finance website WalletHub.
The state’s high scores in two of the three broad dimensions of health care – first in outcomes and third in cost – used in the WalletHub analysis allowed it to overcome its ranking of 42nd in the third dimension, access, and finish ahead of Iowa and Minnesota, which tied for second. New Hampshire earned a fourth-place finish and the District of Columbia was fifth, courtesy of its first-place finish in the cost dimension, WalletHub reported. Maine, which finished 14th overall, was No. 1 in access.
The state in 51st place is Louisiana, which placed in the top 5 in both cancer and heart disease rates. Mississippi was credited with the 50th-best health care system, just behind Alaska (49), Arkansas (48), North Carolina (47), and Georgia (46). The lowest ranking in each dimension went to Alaska (cost), Texas (access), and Mississippi (outcomes), according to WalletHub’s analysts.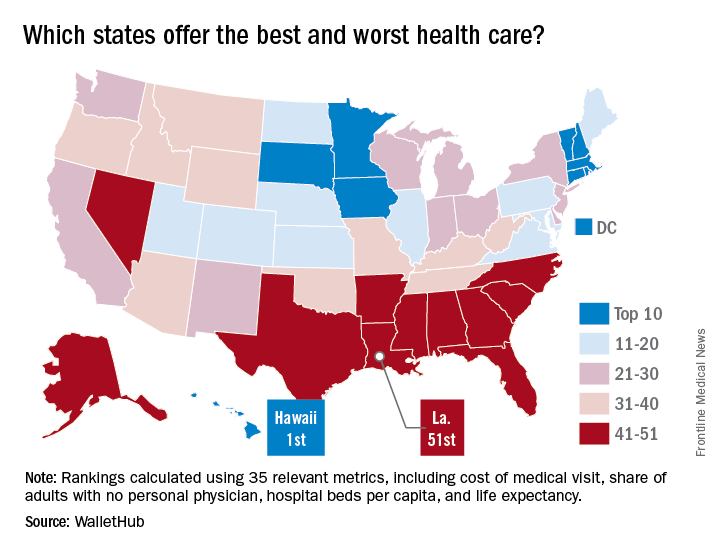
A closer look at some of the individual metrics shows that the District of Columbia has the most physicians per capita and Idaho has the fewest, Medicare acceptance is highest among physicians in North Dakota and lowest in Hawaii, and infant mortality is lowest in New Hampshire and highest in Mississippi, according to the WalletHub analysis, which was based on data from 19 sources, including the Centers for Medicare & Medicaid Services, the Association of American Medical Colleges, and the Social Science Research Council.
Cancer the most common diagnosis in palliative care patients
More than a quarter of the patients in palliative care have a primary diagnosis of cancer, according to the Center to Advance Palliative Care.
A survey of 351 palliative care programs showed that 27% of their patients had been diagnosed with cancer in 2016, more than twice as many patients who had a cardiac (13%) or pulmonary (12%) diagnosis. The next most common primary diagnosis category in 2016 was neurologic at 8%, with a tie at 6% between diagnoses classified as infectious or complex chronic, followed by patients with dementia at 5%, Maggie Rogers and Tamara Dumanovsky, PhD, of the CAPC reported.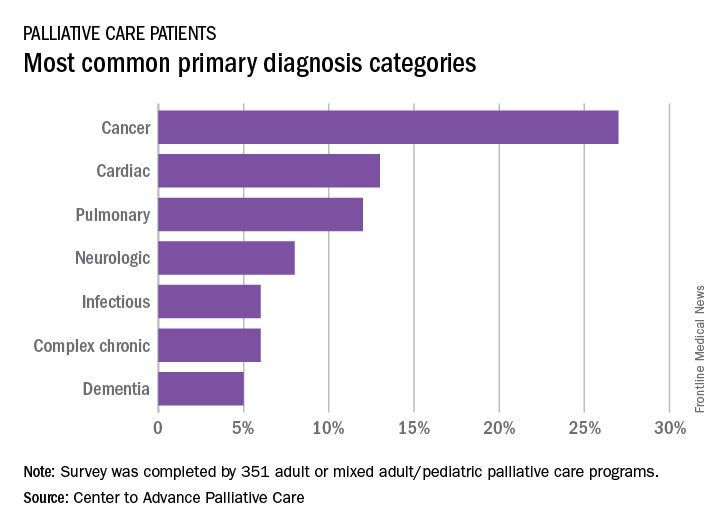
A medical/surgical unit was the referring site for 43% of palliative care referrals in 2016, with 26% of patients coming from an intensive care unit, 13% from a step-down unit, and 8% from an oncology unit, they noted.
CDC: 3.4 million Americans have epilepsy
Epilepsy estimates available for the first time for every state show that the disorder is widespread, with at least 3.4 million people affected, according to the Centers for Disease Control and Prevention.
The CDC data also show that the number of people with epilepsy is increasing, probably as a result of population growth. The number of affected adults went from 2.3 million in 2010 to 3 million in 2015, and the number of children with epilepsy rose from 450,000 in 2007 to 470,000 in 2015, CDC investigators reported (MMWR. 2017 Aug 11;66[31]:821-5).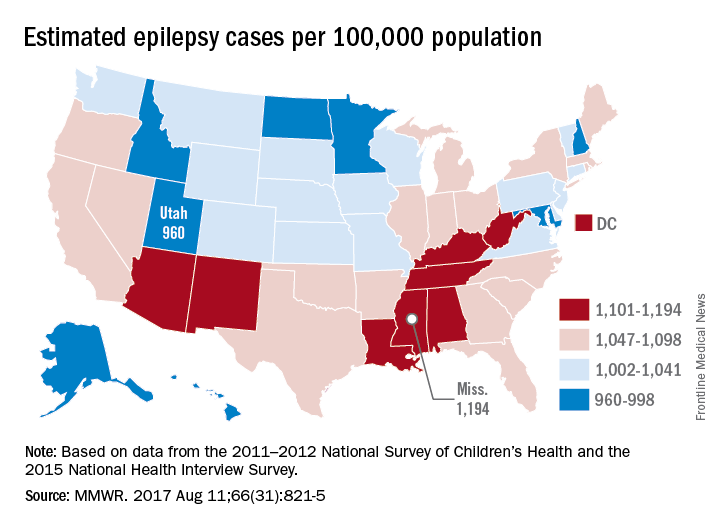
“Millions of Americans are impacted by epilepsy, and unfortunately, this study shows cases are on the rise,” CDC Director Brenda Fitzgerald said in a separate statement. “Proper diagnosis is key to finding an effective treatment – and at CDC we are committed to researching, testing, and sharing strategies that will improve the lives of people with epilepsy.”
The CDC investigators based their estimates for children under age 18 years on data from the 2011-2012 National Survey of Children’s Health; estimates for those age 18 and over are based on data from the 2015 National Health Interview Survey.
FROM MMWR