User login
Richard Franki is the associate editor who writes and creates graphs. He started with the company in 1987, when it was known as the International Medical News Group. In his years as a journalist, Richard has worked for Cap Cities/ABC, Disney, Harcourt, Elsevier, Quadrant, Frontline, and Internet Brands. In the 1990s, he was a contributor to the ill-fated Indications column, predecessor of Livin' on the MDedge.
Award for best hospital goes to … the Mayo Clinic
For the second consecutive year, the Mayo Clinic was named the top hospital in the country by U.S. News & World Report.
Also for the second consecutive year, the Cleveland Clinic is ranked second, while Johns Hopkins Hospital in Baltimore and Massachusetts General Hospital in Boston finished third and fourth – switching their places from last year’s ranking – and UCSF Medical Center in San Francisco is fifth after ranking seventh last year, according to the 2017-2018 Best Hospitals ranking.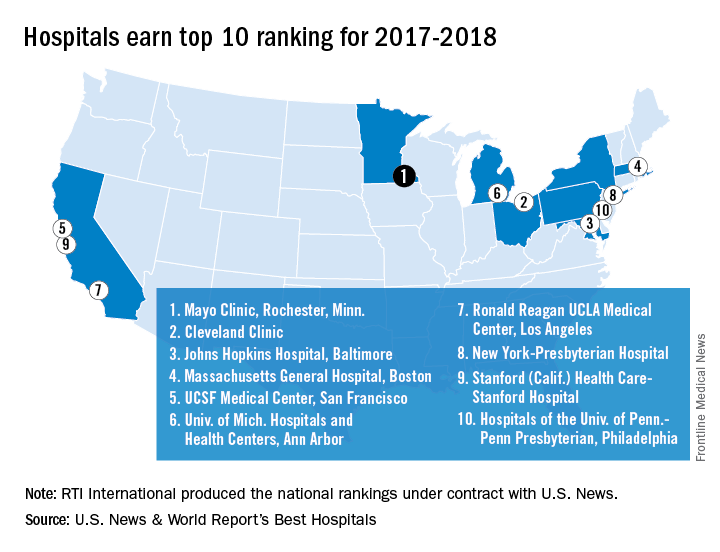
The Mayo Clinic is nationally ranked in 15 of the 16 specialties included in the overall process, which started with 4,658 community inpatient hospitals and finished with 152 ranking nationally in at least one specialty and 20 earning Honor Roll status with high rankings in multiple specialties. The specialties used in the ranking process include 12 that are data driven – cancer; cardiology and heart surgery; diabetes and endocrinology; otolaryngology; gastroenterology and gastrointestinal surgery; geriatrics; gynecology; nephrology; neurology and neurosurgery; orthopedics; pulmonology; and urology – and four rated by reputation only – ophthalmology; psychiatry; rehabilitation; and rheumatology.
The research organization RTI International conducted the physician survey and produced the Best Hospitals methodology and national rankings under contract with U.S. News. The launch of this year’s edition of Best Hospitals is sponsored by Fidelity Investments.
Cardiovascular risk factors more common in girls
Girls were more likely than boys to have cardiovascular disease risk factors such as poor aerobic capacity and a high percentage of body fat in a study involving almost 1,800 elementary school students.
Using the FITNESSGRAM Healthy Fitness Zone (HFZ) standards in 1,775 fourth- and fifth-grade students (879 boys, 896 girls) from an urban, predominantly black population, investigators found that significantly more girls than boys did not meet the HFZ for aerobic capacity (71% vs. 42%), percent body fat (53% vs. 30%), and body mass index (44% vs. 34%). Those who did not meet the HFZ for each measure were classified as “needs improvement” or “needs improvement – health risk.”
Overall, more than 66% of the study sample “had metabolic syndrome risk factors based on FITNESSGRAM assessments,” said Susan B. Racette, PhD, of Washington University, St. Louis, and her associates (Prev Med. 2017. doi: 10.1016/j.ypmed.2017.07.032).
More than half of the girls (51%) didn’t meet the HFZ for aerobic capacity and one of the body composition measures, compared with 32% of the boys, and 38% of the girls failed to meet the HFZ for all three measures, compared with 21% of the boys. The reverse side of that coin – those who did meet the HFZ for all three – favored the boys, 46% to 21%, the investigators reported.
“The presence of these cardiovascular disease risk factors in girls, in particular, highlights an important need for creative strategies to mitigate the long-term health and societal consequences of these modifiable risk factors,” Dr. Racette and her associates wrote.
This work was supported by the U.S. Department of Education and the Washington University division of biostatistics. The investigators said that they had no conflicts of interest.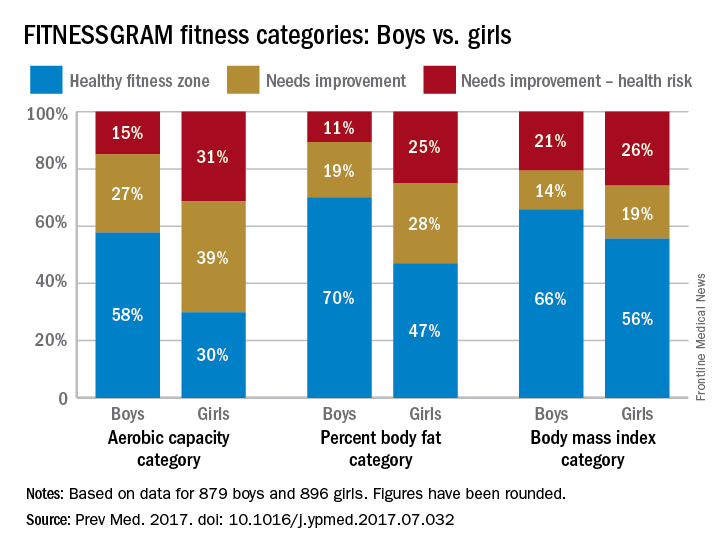
FROM PREVENTIVE MEDICINE
Less than half of office visits involve primary care
, according to the National Center for Health Statistics.
Primary care physicians’ share of office visits fell from 66.2% in 1980 to 49.1% in 2013, the NCHS reported in “Health, United States, 2016.” The corresponding increase among specialty care physicians gave them a total of 50.9% of all office visits in 2013, up from 33.8% in 1980.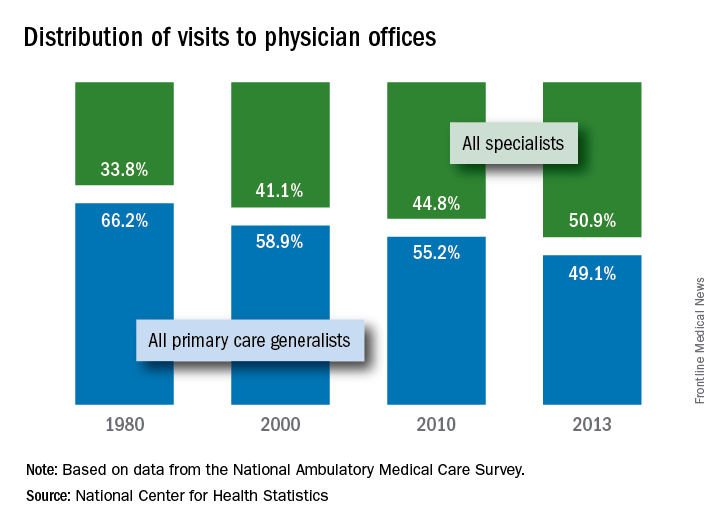
The NCHS estimates are based on data collected by the National Ambulatory Medical Care Survey, which excluded Alaska and Hawaii in 1980.
Pain frequency varies by employment status
Adults who were previously employed are twice as likely to report daily or almost-daily pain than are those who are currently employed, according to the Centers for Disease Control and Prevention.
In an ongoing survey, just over 30% of adults aged 18 years and older who were previously employed reported that they experienced pain on “most days or every day” in the past 6 months, compared with 15% of those who were currently employed and 19% of those classified as never employed, investigators from the CDC estimated (MMWR. 2017 Jul 28;66[29]:796).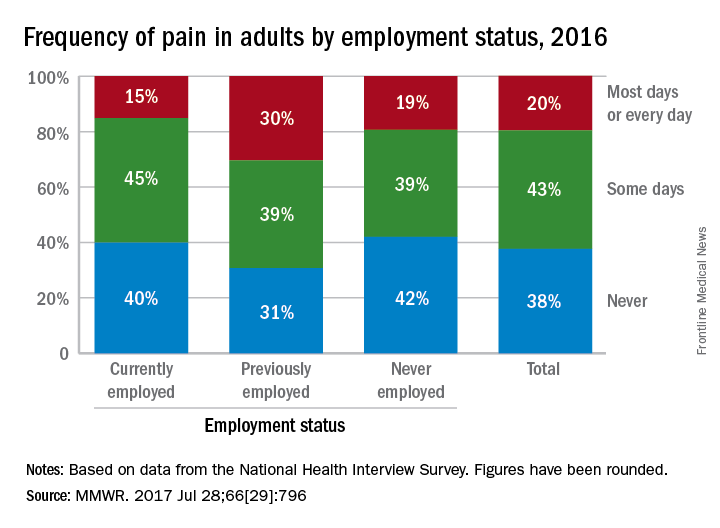
FROM MMWR
Opioid use higher in adults with health conditions
Use of prescription opioids is higher among adults with health conditions such as cirrhosis and diabetes, compared with those who do not have the conditions, according to an analysis of national survey data.
In 2015, reported use of opioids was 71.7% in adults with cirrhosis, compared with 37.8% for those who did not have cirrhosis. That is the largest difference among any of the various health conditions included in a report by Beth Han, MD, PhD, of the Substance Abuse and Mental Health Services Administration in Rockville, Md., which conducts the ongoing survey, and her associates (Ann Intern Med. 2017 July 31. doi: 10.7326/M17-0865).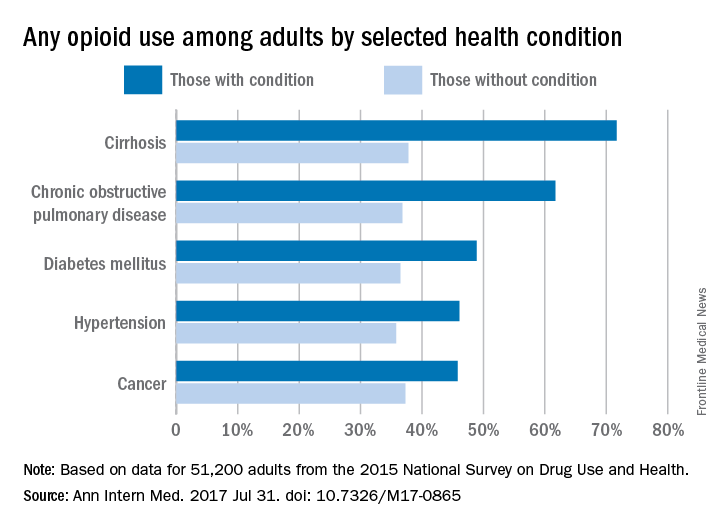
Of those with cirrhosis who reported any use of prescription opioids, 86.1% said that they did so without misuse, while the other four conditions had rates ranging from 91.3% to 93.9%. Among those with chronic obstructive pulmonary disease, 6.2% misused opioids without use disorder, and 2.5% had opioid use disorder. These estimates were not available for cirrhosis because of low statistical precision, but the corresponding figures were 6.9% and 1.5% for diabetes, 6% and 2.1% for hypertension, and 5.3% and 0.8% for cancer, the investigators said.
Overall prescription opioid use in 2015 was 37.8% for the civilian, noninstitutionalized adult population, about 91.8 million individuals. Estimates suggest that 4.7% (1.5 million) of all adults misused them in some way, and that 0.8% (1.9 million) had a use disorder, they reported.
“Among adults with misuse of prescription opioids, 59.9% used them without a prescription at least once in 2015, and 40.8% obtained them from friends or relatives for free for their most recent episode of misuse. Such widespread social availability of prescription opioids suggests that they are commonly dispensed in amounts not fully consumed by the patients to whom they are prescribed,” the authors wrote.
Funding for the study came from the Substance Abuse and Mental Health Services Administration, the National Institute on Drug Abuse, and the Office of the Assistant Secretary for Planning and Evaluation of the Department of Health and Human Services. One investigator reported stock holdings in 3M, General Electric, and Pfizer, and another reported stock holdings in Eli Lilly, General Electric, and Sanofi. Dr. Han and the other three investigators disclosed that they had no conflicts of interest.
Talk to any busy full-time primary care physician, and it becomes evident that writing an opioid prescription is much easier than exploring other options for addressing chronic pain in the course of a 15-minute visit. The same stressful work conditions likely also make it difficult for primary care providers to appropriately monitor patients who take opioids in the long term with urine drug tests and pill counts to assess for opioid diversion or other substance use.
A potential solution to the problem of the overburdened primary care physician is to distribute some of the work to other members of the health care team. Indeed, we have found that using a nurse care manager with a registry increased receipt of guideline-concordant care (urine drug testing and patient-provider agreements) among patients receiving long-term opioid therapy. The intervention also resulted in reductions in opioid doses at a large urban safety-net hospital and three community health centers.
Karen E. Lasser, MD, is with Boston Medical Center and Boston University. Her remarks are excerpted from an editorial response (Ann Intern Med. 2017 Jul 31. doi: 10.7326/M17-1559) to Dr. Han’s study.
Use of prescription opioids is higher among adults with health conditions such as cirrhosis and diabetes, compared with those who do not have the conditions, according to an analysis of national survey data.
In 2015, reported use of opioids was 71.7% in adults with cirrhosis, compared with 37.8% for those who did not have cirrhosis. That is the largest difference among any of the various health conditions included in a report by Beth Han, MD, PhD, of the Substance Abuse and Mental Health Services Administration in Rockville, Md., which conducts the ongoing survey, and her associates (Ann Intern Med. 2017 July 31. doi: 10.7326/M17-0865).
Of those with cirrhosis who reported any use of prescription opioids, 86.1% said that they did so without misuse, while the other four conditions had rates ranging from 91.3% to 93.9%. Among those with chronic obstructive pulmonary disease, 6.2% misused opioids without use disorder, and 2.5% had opioid use disorder. These estimates were not available for cirrhosis because of low statistical precision, but the corresponding figures were 6.9% and 1.5% for diabetes, 6% and 2.1% for hypertension, and 5.3% and 0.8% for cancer, the investigators said.
Overall prescription opioid use in 2015 was 37.8% for the civilian, noninstitutionalized adult population, about 91.8 million individuals. Estimates suggest that 4.7% (1.5 million) of all adults misused them in some way, and that 0.8% (1.9 million) had a use disorder, they reported.
“Among adults with misuse of prescription opioids, 59.9% used them without a prescription at least once in 2015, and 40.8% obtained them from friends or relatives for free for their most recent episode of misuse. Such widespread social availability of prescription opioids suggests that they are commonly dispensed in amounts not fully consumed by the patients to whom they are prescribed,” the authors wrote.
Funding for the study came from the Substance Abuse and Mental Health Services Administration, the National Institute on Drug Abuse, and the Office of the Assistant Secretary for Planning and Evaluation of the Department of Health and Human Services. One investigator reported stock holdings in 3M, General Electric, and Pfizer, and another reported stock holdings in Eli Lilly, General Electric, and Sanofi. Dr. Han and the other three investigators disclosed that they had no conflicts of interest.
FROM ANNALS OF INTERNAL MEDICINE
CT scoring system may improve sacroiliitis treatment in IBD
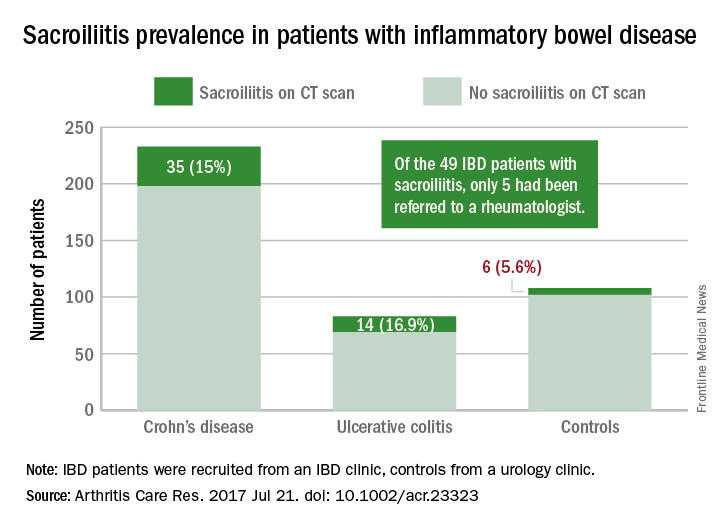
A standardized scoring system to identify sacroiliitis could enable patients with inflammatory bowel disease to get earlier rheumatology referrals and improve treatment, according to an analysis of IBD patients with pre-existing abdominal CT scans.
Of the 316 patients recruited from an IBD clinic in Toronto, the validated CT scan scoring system identified 49 with sacroiliitis, of whom only 5 had been referred to an outpatient rheumatology clinic in the city. Rates of sacroiliitis were similar between the 233 patients with Crohn’s disease (15%) and the 83 with ulcerative colitis (16.9%). The scoring system indicated sacroiliitis in 6 (5.6%) of the 108 control subjects, who were recruited from a urology clinic and had no prior history of chronic back pain, reported Jonathan Chan, MD, of the University of Toronto and his associates (Arthritis Care Res. 2017 Jul 21. doi: 10.1002/acr.23323).“Previous studies using CT scan to detect sacroiliitis have relied upon an adaptation of the [modified New York] criteria or a radiologist’s gestalt. Such an adaptation may not be appropriate since changes suggestive of sacroiliitis can be found in the healthy population due to the increased sensitivity of CT scans,” the investigators said. They developed a CT-scan scoring system in which the sacroiliac joints are divided into left/right and iliac/sacral segments. The slice with the greatest number of erosions in each of the four segments contributes that value to the total erosion score, with a score of 3 or greater identifying the presence of sacroiliitis.
By demonstrating that sacroiliitis is three times more prevalent among IBD patients and can be reliably detected in CT scans performed in the clinical care of those patients, this study suggests that “more timely referral for rheumatology assessment” could avoid unnecessary treatment with biologics, Dr. Chan and his associates wrote.
The study was supported in part by a fellowship grant from the Assessment of Spondyloarthritis International Society and in part by Janssen. The investigators reported having no conflicts of interest for the study.
FROM ARTHRITIS CARE & RESEARCH
Over 45% of American adults have type 2 diabetes mellitus or prediabetes
More than 114 million American adults have type 2 diabetes mellitus or prediabetes, according to estimates from the Centers for Disease Control and Prevention.
As of 2015, the combined prevalence of diabetes and prediabetes was 45.4% among adults in the United States: 11.5% (30.3 million) have diabetes and 33.9% have prediabetes, representing 84.1 million people who could develop type 2 diabetes within 5 years, the CDC said in the National Diabetes Statistics Report, 2017.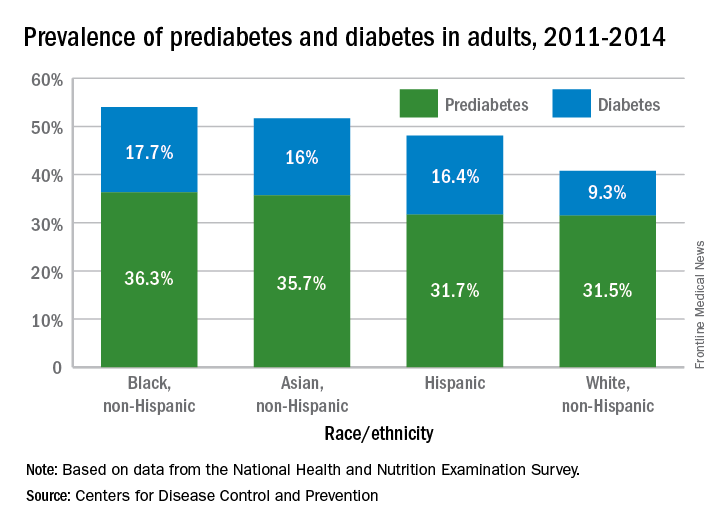
Lack of knowledge about having the disease was common: Almost a quarter (23.8%) of adults with diabetes didn’t know they had it, and the number jumped to 88% for those with prediabetes, based on data from the National Health and Nutrition Examination Survey, which included a blood test for fasting plasma glucose or hemoglobin A1c.
“More than a third of U.S. adults have prediabetes, and the majority don’t know it. Now, more than ever, we must step up our efforts to reduce the burden of this serious disease,” CDC Director Brenda Fitzgerald, MD, said in a statement.
“Diabetes and prediabetes remain serious threats for more than one-third of Americans – the statistics are staggering,” William T. Cefalu, MD, chief scientific, medical, and mission officer of the American Diabetes Association, said in a written statement.
“We must continue to innovate in scientific research and to translate findings to the clinical level to decrease the prevalence of diabetes. These data clearly confirm it is critical for us to continue to provide the education and support needed to improve health outcomes and decrease the daily burden of diabetes. We must reduce the incidence of diabetes and its enormous costs, including both the financial costs and the human toll of lost quality of life,” he said.
More than 114 million American adults have type 2 diabetes mellitus or prediabetes, according to estimates from the Centers for Disease Control and Prevention.
As of 2015, the combined prevalence of diabetes and prediabetes was 45.4% among adults in the United States: 11.5% (30.3 million) have diabetes and 33.9% have prediabetes, representing 84.1 million people who could develop type 2 diabetes within 5 years, the CDC said in the National Diabetes Statistics Report, 2017.
Lack of knowledge about having the disease was common: Almost a quarter (23.8%) of adults with diabetes didn’t know they had it, and the number jumped to 88% for those with prediabetes, based on data from the National Health and Nutrition Examination Survey, which included a blood test for fasting plasma glucose or hemoglobin A1c.
“More than a third of U.S. adults have prediabetes, and the majority don’t know it. Now, more than ever, we must step up our efforts to reduce the burden of this serious disease,” CDC Director Brenda Fitzgerald, MD, said in a statement.
Substance use treatment cost $34 billion in 2014
Total spending on the treatment of substance use disorder reached $34 billion in 2014, with outpatient care taking the largest share, according to the National Center for Health Statistics.
That $34 billion represents an increase of 273% from the $9.1 billion spent in 1986 and a considerable shift in the distribution of spending over the last 30 years. In 1986, the largest share of spending – 50%, or $4.6 billion – for substance use disorder went toward inpatient care and only $2.4 billion (27%) was used for outpatient care. In 2014, outpatient treatment of substance use disorder had a 40% share ($13.6 billion) of all spending, and inpatient care was down to 19% ($6.4 billion), the NCHS reported in “Health, United States, 2016.”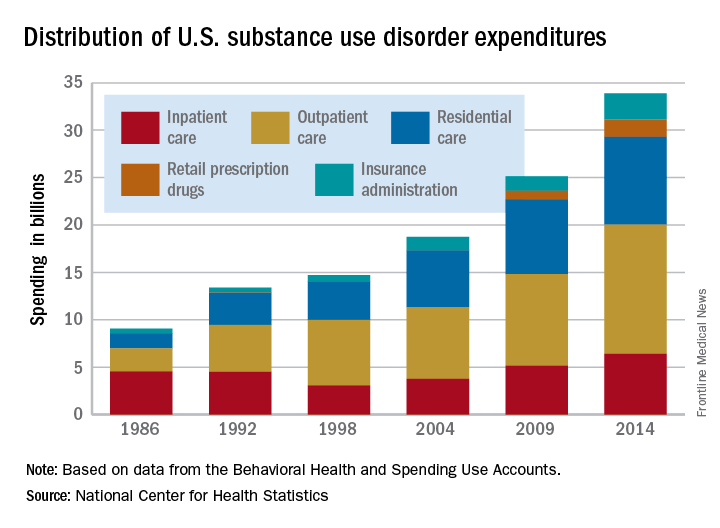
Since methadone is not considered a retail drug by SAMHSA, it is classified under specialty substance use disorder treatment centers, which are included in the estimate for outpatient care, the NCHS noted.
Use of Pap smears, mammography on the decline
Use of Pap smears and mammography has slowly but steadily declined since both peaked in the year 2000, according to the National Center for Health Statistics.
The age-adjusted rate of women aged 18 years and over who reported having had a Pap smear in the past 3 years dropped from 81.3% in 2000 to 70.2% in 2015. Over that same time period, the age-adjusted rate of women aged 40 years and over who had a mammogram over the previous 2 years declined from 70.4% in 2000 to 64% in 2015, the NCHS reported in “Health, United States, 2016.”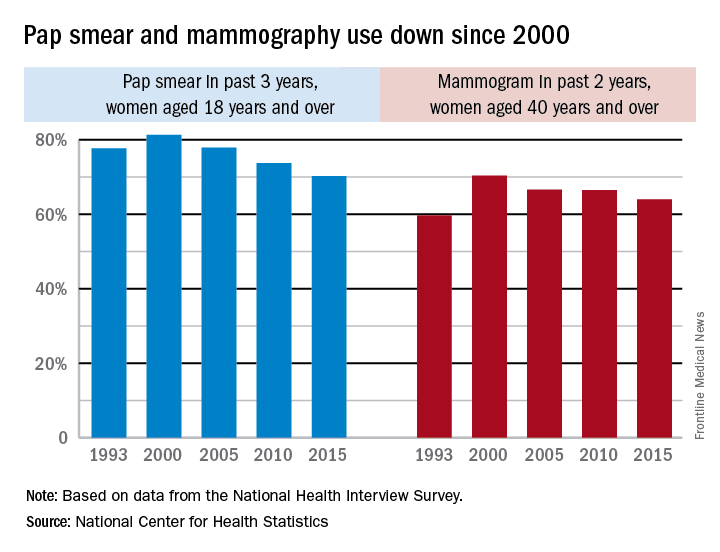
The pattern for mammography use, however, was somewhat different. Declines in use were consistent by age group, but not by race. White women were less likely to get a mammogram in 2015 (65.3%), compared with 2000 (71.4%), while Hispanic women experienced a small drop from 61.2% to 60.9%, but black, American Indian/Alaska Native, and Asian women all increased their use of mammography over that time period, the NCHS reported.
Federal exchanges attract fewer insurers for 2018
The number of health plans submitting applications to offer coverage on the federal insurance exchanges in 2018 was down 38% from last year, officials at the Centers for Medicare & Medicaid announced July 10. At this year’s initial filing deadline for fiscal year 2018, 141 qualified health plans had submitted applications to offer coverage in the 39 states that use healthcare.gov, the federally facilitated exchange platform, compared with 227 last year and 281 the year before, CMS officials said in a statement.
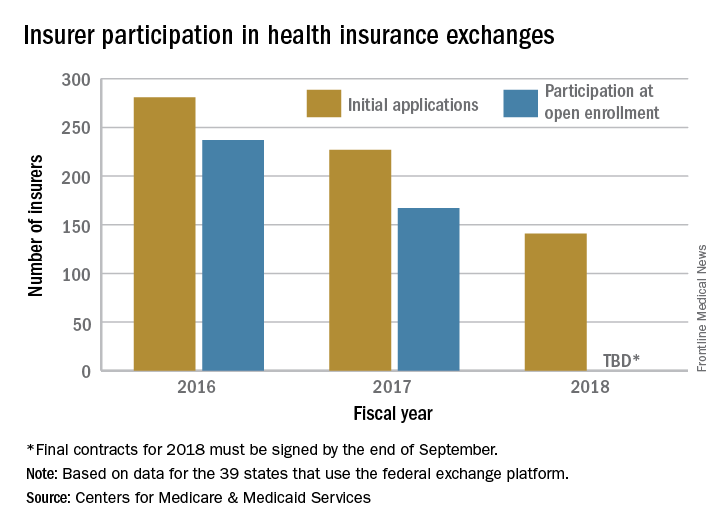
“This is further proof that the Affordable Care Act is failing,” CMS Administrator Seema Verma said in the statement. “Insurers continue to flee the Exchanges, causing Americans to lose their choice for health insurance or lose their coverage all together. These numbers are clear; the status quo is not working. The American people deserve health care choices and access to quality, affordable health care coverage.”
The number of health plans submitting applications to offer coverage on the federal insurance exchanges in 2018 was down 38% from last year, officials at the Centers for Medicare & Medicaid announced July 10. At this year’s initial filing deadline for fiscal year 2018, 141 qualified health plans had submitted applications to offer coverage in the 39 states that use healthcare.gov, the federally facilitated exchange platform, compared with 227 last year and 281 the year before, CMS officials said in a statement.
“This is further proof that the Affordable Care Act is failing,” CMS Administrator Seema Verma said in the statement. “Insurers continue to flee the Exchanges, causing Americans to lose their choice for health insurance or lose their coverage all together. These numbers are clear; the status quo is not working. The American people deserve health care choices and access to quality, affordable health care coverage.”