User login
Richard Franki is the associate editor who writes and creates graphs. He started with the company in 1987, when it was known as the International Medical News Group. In his years as a journalist, Richard has worked for Cap Cities/ABC, Disney, Harcourt, Elsevier, Quadrant, Frontline, and Internet Brands. In the 1990s, he was a contributor to the ill-fated Indications column, predecessor of Livin' on the MDedge.
Outpatient care 35% of mental health costs and growing
Outpatient care represents the largest share of mental health treatment expenditures, and it continues to get larger, while components such as retail drug prescriptions and inpatient care have declined, according to the National Center of Health Statistics.
In 2014, outpatient care took a $65.5-billion slice (about 35%) out of the $186-billion mental health care spending pie, compared with the $51.1 billion (27%) spent on retail drug prescriptions, which was the next-largest portion. Inpatient care was third with $30.3 billion in spending (16% of the total), followed by residential care at $23.2 billion (12%), and insurance administration at $15.9 billion (9%), the NCHS reported in “Health, United States, 2016.”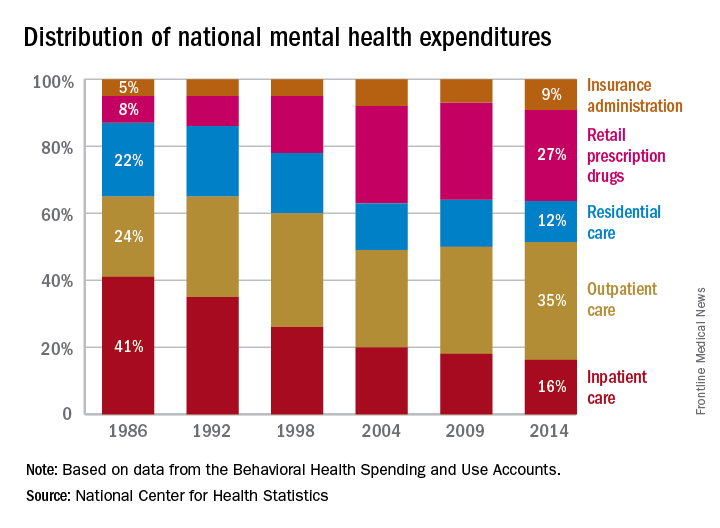
Septicemia admissions almost tripled from 2005 to 2014
Admissions for septicemia nearly tripled from 2005 to 2014, as it became the third most common diagnosis for hospital stays, according to the Agency for Healthcare Research and Quality.
There were over 1.5 million hospital stays with a principal diagnosis of septicemia in 2014, an increase of 192% over the 518,000 stays in 2005. The only diagnoses with more admissions in 2014 were pregnancy/childbirth with 4.1 million stays and newborns/neonates at almost 4 million, although both were down from 2005. That year, septicemia did not even rank among the top 10 diagnoses, the AHRQ reported.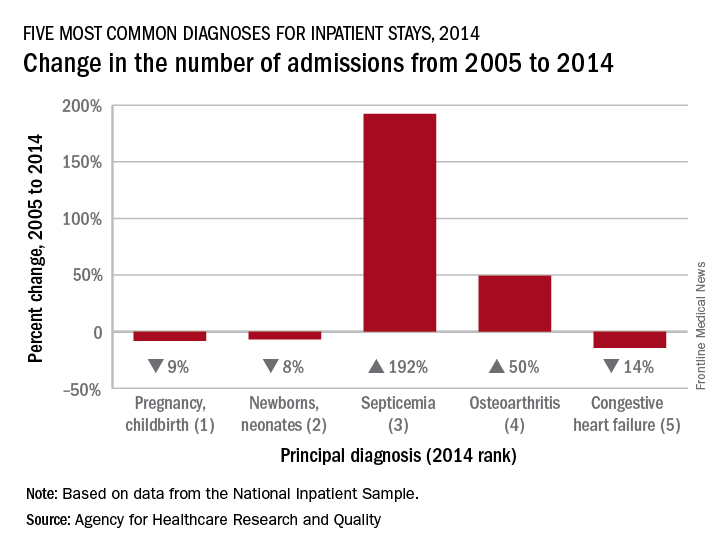
Pneumonia, which was the third most common diagnosis in 2005, dropped by 32% and ended up in sixth place in 2014, while admissions for coronary atherosclerosis, which was fourth in 2005, decreased by 63%, dropping out of the top 10, by 2014, the AHRQ said.
Septicemia was the most common diagnosis for inpatient stays among those aged 75 years and older and the second most common for those aged 65-74 and 45-64. The leading nonmaternal, nonneonatal diagnosis in the two youngest age groups, 0-17 and 18-44 years, was mood disorders, and the most common cause of admissions for those aged 45-64 and 65-74 was osteoarthritis, the AHRQ reported.
Adult diabetes up 35% over 25 years
The overall prevalence of diabetes increased 35% from 1988-1994 to 2011-2014 among adults aged 20 years and over, according the National Center for Health Statistics.
During 2011-2014, the age-adjusted prevalence of diabetes was 11.9% in adults aged 20 years and over, compared with 8.8% in 1988-1994. That 35% increase came despite a decrease in undiagnosed diabetes from 3.6% to 2.9% over that time period, which was not enough to offset a jump in physician-diagnosed disease from 5.2% to 9%, the NCHS reported in “Health, United States, 2016.”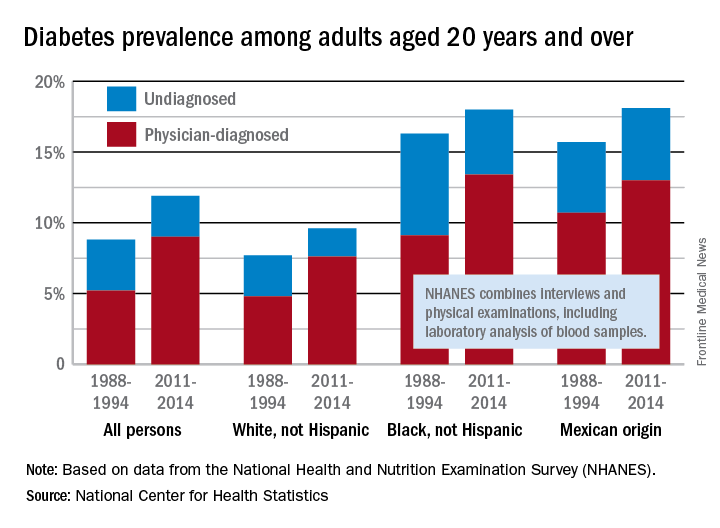
Undiagnosed diabetes dropped from 2.9% to 2% in whites and from 7.2% to 4.6% in blacks, but adults of Mexican origin saw a slight increase from 5% in 1988-1994 to 5.1% in 2011-2014. The physician-diagnosed side of the equation rose from 4.8% to 7.6% in whites, 9.1% to 13.4% in blacks, and 10.7% to 13% in those of Mexican origin, according to data from the National Health and Nutrition Examination Survey, which combines interviews and physical examinations, including laboratory analysis of blood samples.
Medicaid expansion produced opposing cost effects
States that expanded Medicaid in 2014 both increased and decreased their Medicaid spending that year, compared with the nonexpansion states, according to an analysis from the Centers for Medicare & Medicaid Services.
The 26 states, along with the District of Columbia, that expanded Medicaid eligibility by the end of 2014 had an increase in total Medicaid spending of 12.3% over 2013, compared with an increase of 6.2% in nonexpansion states.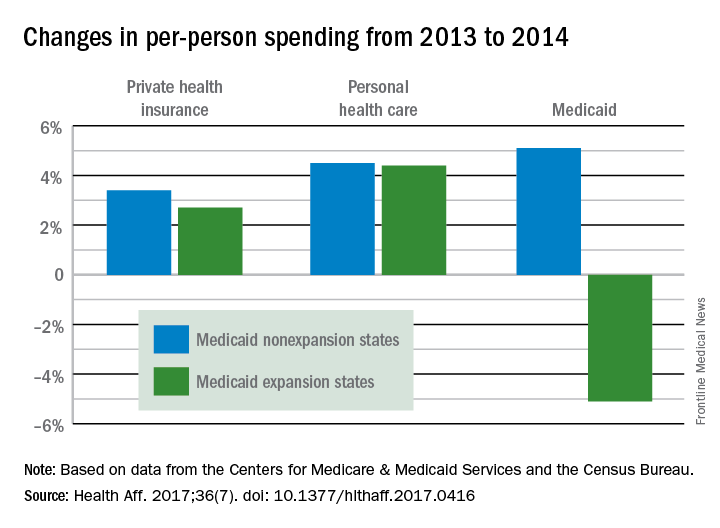
The expansion of coverage “increased the share of ... less expensive enrollees relative to the previous Medicaid beneficiary population mix,” the investigators said. Medicaid expansion brought in more relatively inexpensive adults – 43% of total enrollment in 2014, compared with 32% in 2013 – and reduced the proportion of disabled and aged enrollees, whose cost per person is much higher, they explained.
Private health insurance spending showed a different pattern: Nonexpansion states had larger increases in both higher per-person and overall costs than did expansion states. Per-person costs were up 3.4% for nonexpanders and 2.7% for expanders, and total costs rose 6.8% in nonexpansion states and 4.6% in the Medicaid expanders, Mr. Lassman and his associates said. Higher per-person spending growth for enrollees in the state and federal marketplaces, compared with nonmarketplace individual coverage, was partially responsible for this trend, they pointed out.
FROM HEALTH AFFAIRS
Boston Children’s Hospital tops annual ranking
Boston Children’s Hospital is the country’s top hospital for children, according to U.S. New & World Report.
This marks the 3rd consecutive year and the fifth time in 6 years that Boston Children’s Hospital either has earned the honor on its own or been tied for the top spot. This year’s second-place finisher, Children’s Hospital of Philadelphia, was first in 2013-2014 and tied for first in 2014-2015 and 2012-2013.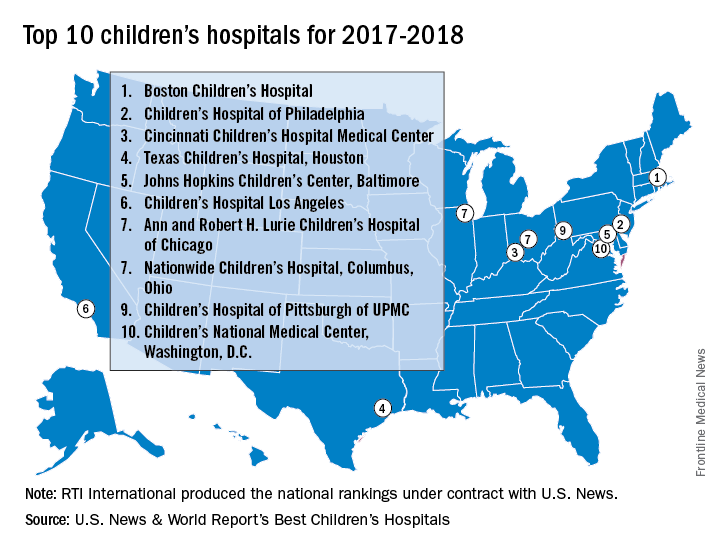
Of the 187 facilities that qualified for inclusion this year, 113 submitted sufficient data to be considered in at least one of the 10 specialties that make up the rating: cancer, cardiology and heart surgery, diabetes and endocrinology, gastroenterology and gastrointestinal surgery, neonatology, nephrology, neurology and neurosurgery, orthopedics, pulmonology, and urology. In addition, a survey of individuals conducted to establish the hospitals’ reputations – generally worth about 15% of a hospital’s score in each specialty – was completed by 3,269 physicians.
Boston Children’s Hospital was ranked first in five of the ten specialties, Children’s Hospital of Philadelphia finished first in diabetes/endocrinology and pulmonology, Texas Children’s Hospital was first in cardiology/heart surgery, Children’s National Medical Center was first in neonatology, and St. Jude Children’s Research Hospital in Memphis topped the cancer ranking, U.S. News & World Report said.
The research organization, RTI International, conducted the physician survey and produced the methodology and national rankings under contract with U.S. News & World Report.
For opioid-related hospitalizations, men and women are equal
Equality is not always a good thing, particularly with opioids.
In 2005, the rate of opioid-related inpatient hospital stays was 145.6 per 100,000 population for males of all ages and 127.8 for females of all ages. By 2014, however, equality had arrived: Females had a rate of 224.1 per 100,000, compared with 225 for males, according to the Agency for Healthcare Research and Quality. Those increases in hospital admissions work out to 75% for females and 55% for males.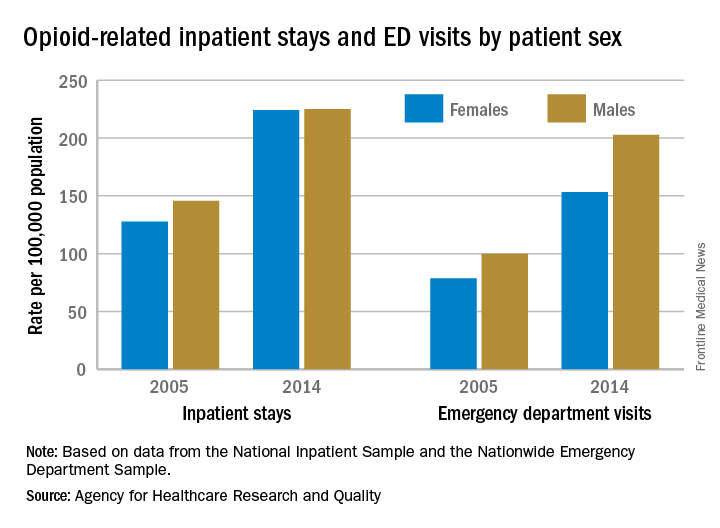
The states tell a similarly unequal story for opioid-related ED visits. In 2014, males had the higher rate in 23 states, and females had the higher rate in 7 states. (Washington, D.C., and 20 states do not participate in the State Emergency Department Databases and were not included in this analysis.)
Among the 30 participating states, Massachusetts had the highest visit rates for both males (598.8) and females (310.4), and Iowa had the lowest at 37 for males and 53.1 for females, AHRQ said.
The roles were reversed for opioid-related hospital admissions in the states in 2014: Females had the higher rate in 33 of the states participating in the State Inpatient Databases, compared with 11 states and the District of Columbia for males.
West Virginia had the highest rate for females at 371.2, and Washington, D.C., had the highest rate for males at 472. The lowest rates for both females (82.3) and males (63) were found in Iowa, according to the report.
Average cost of Healthcare.gov policy up 105% since 2013
The average monthly premium for individuals purchasing a plan from Healthcare.gov increased by 105% from 2013 to 2017, according to the Department of Health & Human Services.
In the 39 states that use Healthcare.gov, the average monthly exchange plan premium went from $232 in 2013 to $476 in 2017, an increase of $244 (105%), the HHS Office of the Assistant Secretary for Planning and Evaluation (ASPE) reported.
All 39 states experienced an increase in the cost of an average premium, but there was considerable variation in the size. Alabama had the largest percent increase at 223%, but Alaska had the largest absolute increase – $697 – to go with the second-largest percent increase – 203%. Oklahoma, where the average premium jumped 201%, was third, the ASPE said.
The state with the smallest change, both in terms of dollars and percents, was New Jersey, which had an increase of $51 (12%) over the 4-year period. The only other states with less than a 50% increase were New Hampshire at 32% and North Dakota at 44%, the report showed.
“States with benefit mandates similar to those required in the [Affordable Care Act] in effect before 2014 had smaller premium increases between 2013 and 2017,” the ASPE noted.
One limitation to the analysis is the change among those enrolling from 2013 to 2017. “Older and less healthy people are a larger share of the individual market risk pool now than in 2013. The changing mix of enrollees and adverse selection pressure has likely been a significant cause of the large average premium increases,” the ASPE said.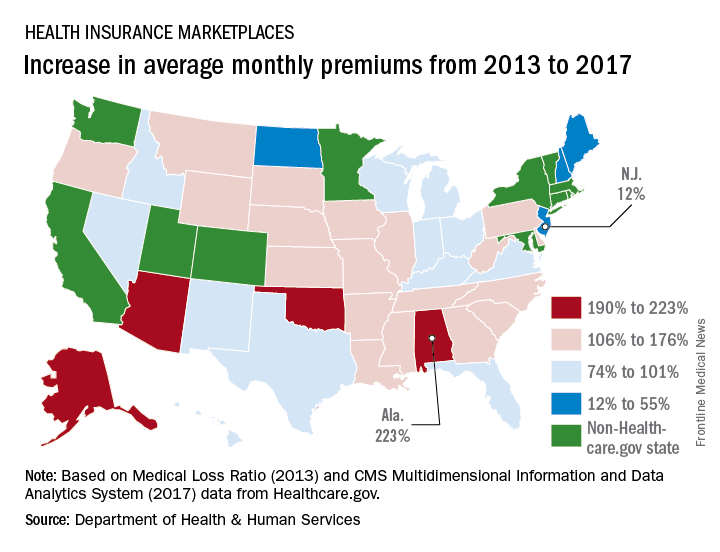
Consensus on isotretinoin monitoring elusive
For dermatologists searching for consensus on isotretinoin monitoring – keep looking. There is no consensus to be found from a new survey of U.S. dermatologists.
There were some trends among the 2,322 responses to the national email survey of American Academy of Dermatology members, but the researchers at the University of Vermont in Burlington said that no real agreement on monitoring emerged.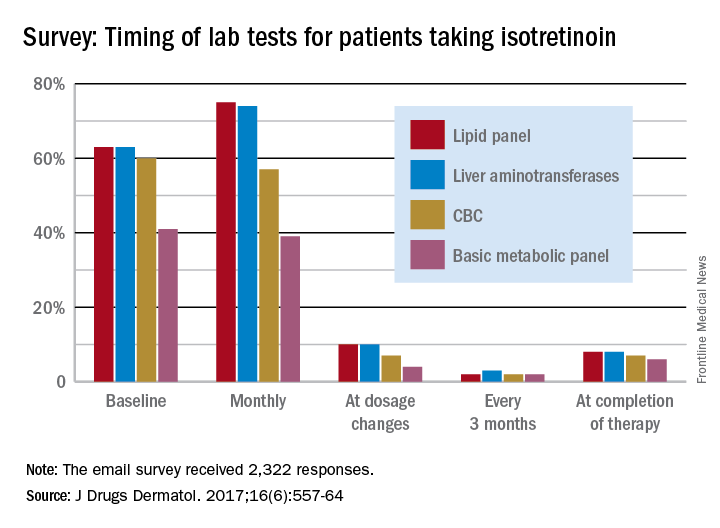
Very few dermatologists do any testing when the dosage is changed – a lipid panel and liver enzymes being the most popular response at 10% – or when therapy is completed – a lipid panel (8%) and liver enzyme check (8%) were the most common, they said.
In response to abnormal test results, 75% of respondents would take patients off isotretinoin if their liver enzyme levels were three times normal, and 89% would stop the medication if the enzyme level were four times normal. Between 30% and 40% of dermatologists would “order further testing” if liver enzyme levels were even slightly elevated, the investigators said.
Most respondents (70%) would not make a change if triglyceride levels were twice normal or less, and 72% would stop isotretinoin if triglyceride levels were four times normal, but “only 26% would add a lipid-lowering agent when triglyceride levels reach three times normal,” Dr. Hobson and her associates wrote.
“Based on the available literature and low incidence of adverse events, less monitoring is probably required,” they said, adding that “over-monitoring may no longer be justified or considered a good use of resources.”
The investigators said that they had no conflicts of interest to report.
FROM JOURNAL OF DRUGS IN DERMATOLOGY
Cardiovascular risks vary by race/ethnicity in lupus patients
Black patients with systemic lupus erythematosus (SLE) are more likely than whites to have a cardiovascular event, but Hispanics, Asians, and American Indians/Alaska natives with SLE are less likely than whites to experience a CV event, according to a study involving almost 66,000 Medicaid patients.
In a comparison of incidence rate ratios with whites as the reference group (IRR, 1.0), black patients with SLE had an IRR of 1.18 for cardiovascular events (defined as a first acute myocardial infarction or stroke), Hispanic patients had an IRR of 0.84, Asians had an IRR of 0.75, and American Indians/Alaska natives had an IRR of 1.06, reported Medha Barbhaiya, MD, MPH, of Brigham and Women’s Hospital, Boston, and her associates (Arthritis Rheumatol. 2017. doi: 10.1002/art.40174).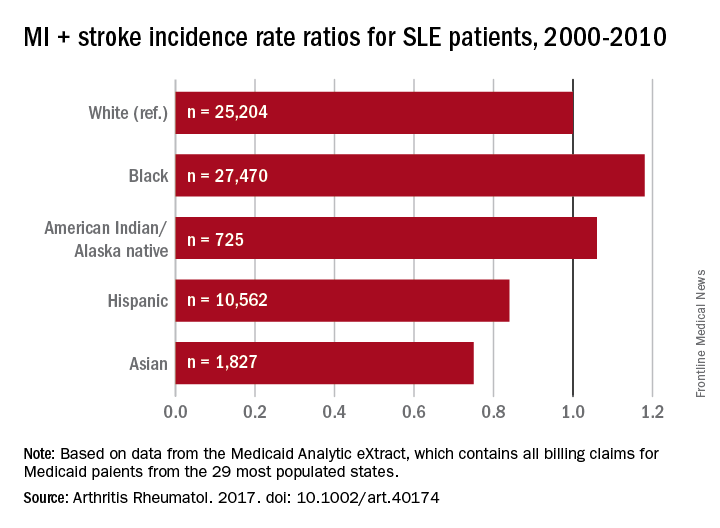
The substantial reduction in MI risk among Hispanics and Asians, compared with white SLE patients, suggests an “Hispanic and Asian paradox” since “SLE has been reported to be more prevalent, more severe, and to result in more end-organ damage in Hispanics and Asians compared to white patients,” Dr. Barbhaiya and her associates wrote.
The data for 65,788 cases of SLE from Jan. 1, 2000, to Dec. 31, 2010, were taken from the Medicaid Analytic eXtract, which contains all Medicaid billing claims from the 29 most populous states. Over a mean follow-up of 3.8 years, those SLE patients had 2,259 first-CV events, which works out to an overall incidence rate of 9.31 per 1,000 person-years.
The study was supported by awards from the National Institute of Arthritis and Musculoskeletal and Skin Diseases. Dr. Barbhaiya and one of her associates are supported by awards from the Rheumatology Research Foundation. The investigators did not disclose any conflicts.
In the 1,000 Faces of Lupus study, which showed a comparable racial and ethnic paradox, “lower annual income was associated with more health care barriers” and “difficulty in obtaining medications was associated with higher disease activity,” Janet E. Pope, MD, and her associates said in an accompanying editorial.
“The observed ‘paradox’ from the Barbhaiya study may be the result of complex interactions between environmental, cultural, socioeconomic, psychosocial, genetic, and other clinical factors.

Dr. Pope is with the University of Western Ontario in London. Her coauthors were Michael H. Weisman, MD, who is with Cedars-Sinai Medical Center in Los Angeles and Christopher Sjöwall, MD, of Linköping (Sweden) University.
In the 1,000 Faces of Lupus study, which showed a comparable racial and ethnic paradox, “lower annual income was associated with more health care barriers” and “difficulty in obtaining medications was associated with higher disease activity,” Janet E. Pope, MD, and her associates said in an accompanying editorial.
“The observed ‘paradox’ from the Barbhaiya study may be the result of complex interactions between environmental, cultural, socioeconomic, psychosocial, genetic, and other clinical factors.
Dr. Pope is with the University of Western Ontario in London. Her coauthors were Michael H. Weisman, MD, who is with Cedars-Sinai Medical Center in Los Angeles and Christopher Sjöwall, MD, of Linköping (Sweden) University.
Black patients with systemic lupus erythematosus (SLE) are more likely than whites to have a cardiovascular event, but Hispanics, Asians, and American Indians/Alaska natives with SLE are less likely than whites to experience a CV event, according to a study involving almost 66,000 Medicaid patients.
In a comparison of incidence rate ratios with whites as the reference group (IRR, 1.0), black patients with SLE had an IRR of 1.18 for cardiovascular events (defined as a first acute myocardial infarction or stroke), Hispanic patients had an IRR of 0.84, Asians had an IRR of 0.75, and American Indians/Alaska natives had an IRR of 1.06, reported Medha Barbhaiya, MD, MPH, of Brigham and Women’s Hospital, Boston, and her associates (Arthritis Rheumatol. 2017. doi: 10.1002/art.40174).
The substantial reduction in MI risk among Hispanics and Asians, compared with white SLE patients, suggests an “Hispanic and Asian paradox” since “SLE has been reported to be more prevalent, more severe, and to result in more end-organ damage in Hispanics and Asians compared to white patients,” Dr. Barbhaiya and her associates wrote.
The data for 65,788 cases of SLE from Jan. 1, 2000, to Dec. 31, 2010, were taken from the Medicaid Analytic eXtract, which contains all Medicaid billing claims from the 29 most populous states. Over a mean follow-up of 3.8 years, those SLE patients had 2,259 first-CV events, which works out to an overall incidence rate of 9.31 per 1,000 person-years.
The study was supported by awards from the National Institute of Arthritis and Musculoskeletal and Skin Diseases. Dr. Barbhaiya and one of her associates are supported by awards from the Rheumatology Research Foundation. The investigators did not disclose any conflicts.
FROM ARTHRITIS AND RHEUMATOLOGY
Key clinical point:
Major finding: With whites as the reference group, incidence rate ratios of cardiovascular disease were 1.18 for blacks, 1.06 for American Indians/Alaska natives, 0.84 for Hispanics, and 0.75 for Asians.
Data source: 65,788 cases of SLE from Jan. 1, 2000, to Dec. 31, 2010, were taken from the Medicaid Analytic eXtract.
Disclosures: The study was supported by awards from the National Institute of Arthritis and Musculoskeletal and Skin Diseases. Dr. Barbhaiya and one of her associates are supported by awards from the Rheumatology Research Foundation. The investigators did not disclose any conflicts.
Infant mortality down in most states
Infant mortality in the United States was down by 15% from 2005 to 2014, with 33 states reporting significant declines, according to the National Center for Health Statistics.
The overall rate for 2014 was 5.82 infant deaths per 1,000 live births, compared with 6.84 per 1,000 in 2005. The data for individual states were grouped into 3-year periods, so between the periods of 2005-2007 and 2012-2014, there were 33 states (and the District of Columbia) with a significant decline and 17 states with no significant change. Three states – Maine, South Dakota, and Utah – had increased infant mortality, but the changes did not reach significance, the NCHS reported, using data from the National Vital Statistics System.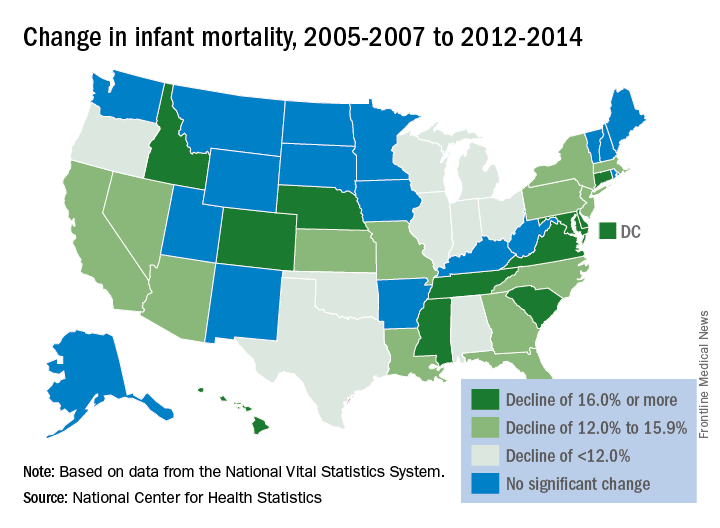