User login
Richard Franki is the associate editor who writes and creates graphs. He started with the company in 1987, when it was known as the International Medical News Group. In his years as a journalist, Richard has worked for Cap Cities/ABC, Disney, Harcourt, Elsevier, Quadrant, Frontline, and Internet Brands. In the 1990s, he was a contributor to the ill-fated Indications column, predecessor of Livin' on the MDedge.
Skin cancer procedures up by 35% since 2012
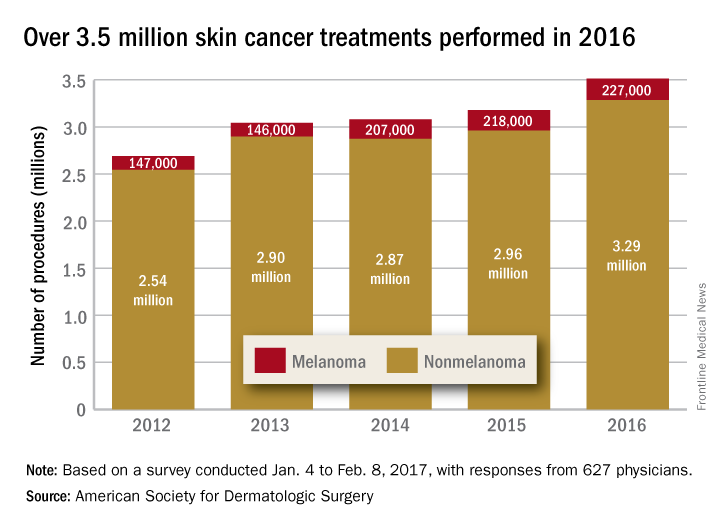
The number of skin cancer procedures in 2016 was up by 10.5% since 2015 and by 35% since 2012, according to the American Society for Dermatologic Surgery.
Of the estimated 3.5 million skin cancer treatments provided by dermatologic surgeons in 2016, just over 227,000, or 6.5%, were for melanoma – a 4% increase over those diagnosed in 2015. Since 2012, the annual number of melanoma procedures has risen by 55%. The 3.29 million nonmelanoma procedures performed in 2016 represent a 10% increase over 2015, the ASDS said in a report on its 2016 Survey on Dermatologic Procedures.
“The public is increasingly aware of the need to have any new or suspicious lesions checked,” ASDS President Thomas Rohrer, MD, said in a written statement.
In addition to the skin cancer treatments, ASDS members also performed over 7 million cosmetic procedures in 2016, including 2.8 million involving laser, light, and energy-based devices. Additionally, 1.7 million involving neuromodulators, and 1.35 million involved soft-tissue fillers, the ASDS said.
The procedures survey was conducted Jan. 4 to Feb. 8, 2017, and included 627 physicians’ responses, which were then generalized to represent all of the almost 6,100 ASDS members.
Medicare Advantage enrollment up again in 2017
Enrollment in Medicare Advantage plans increased for the 13th consecutive year in 2017 and now represents one-third of all Medicare beneficiaries, according to the Kaiser Family Foundation.
Currently, 19 million beneficiaries are enrolled in Medicare Advantage, more than triple the number who were enrolled when the program hit its low point of 5.3 million (13% of all beneficiaries) in 2003 and 2004 and 71% higher since the Affordable Care Act was passed in 2010, Kaiser said in a recent report.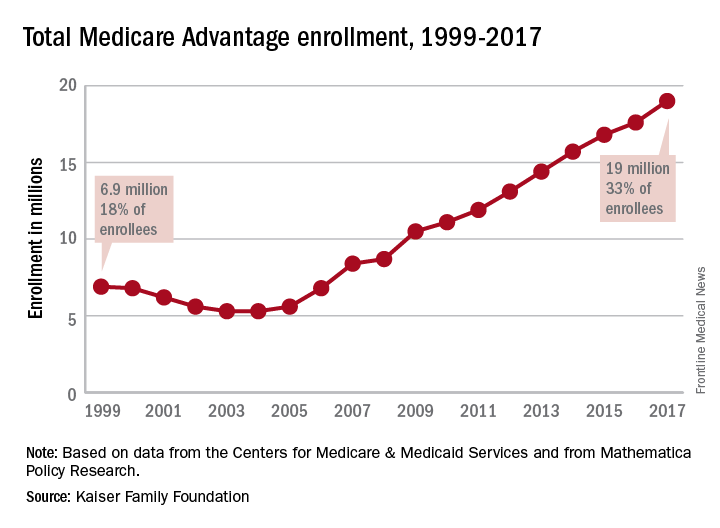
As growth continues, however, so does concentration among the private firms administering the plans. In 2017, UnitedHealthcare and Humana together account for 41% of enrollment in Medicare Advantage, “and, in 17 states, one company has more than half of all Medicare Advantage enrollment – an indicator that these markets may not be very competitive,” they noted.
For Americans, less salt is still too much
Americans are buying less packaged food and beverages these days, and they’re getting less salt in the food that they do buy, but very few are getting the optimal sodium density in their purchases, according to a study involving more than 170,000 households.
First, salt content: In 2014, the households taking part in the Nielsen Homescan Consumer Panel were getting 361 mg of salt per 100 g of packaged food purchased, which is 12% less than the 411 mg per 100 g of food purchased in 2000. Overall sodium content, which includes beverages, dropped from 192 mg/100 g to 186 mg/100 g, said Jennifer M. Poti, PhD, of the University of North Carolina at Chapel Hill, and her associates.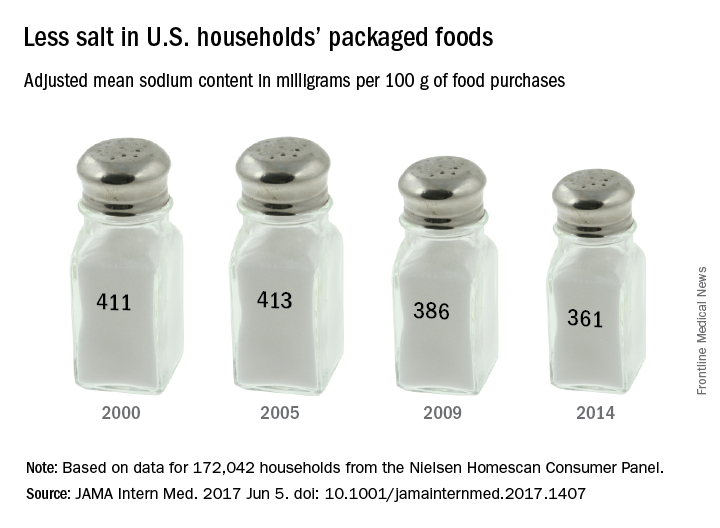
Total food and beverage purchases also were down from 1,328 g/day in 2000 to 1,134 in 2014, and the total sodium content of those purchases followed suit, dropping from 2,363 mg/day in 2000 to 1,967 mg/day in 2014. The decline in total purchases, however, was driven largely by beverages, which fell 21% from 2000 to 2014, while packaged food purchases fell by only 2%, the investigators reported (JAMA Intern Med. 2017 June 5. doi: 10.1001/jamainternmed.2017.1407).
Median sodium density was down significantly from 1,712 to 1,628 mg of sodium per 1,000 kcal, but by 2014, only 1.2% of the 172,042 households included in the study were purchasing the optimal level of 1,100 mg per 1,000 kcal, based on the DASH-Sodium trial and the Health Eating Index-2010, Dr. Poti and her associates said.
“Additional studies are needed to examine whether decreases in sodium from packaged foods were offset by increases in sodium from away-from-home sources,” they said, and since “there were no major shifts in the amount purchased for key food groups … sodium declines may relate mainly to reformulation.”
The study was funded by the Robert Wood Johnson Foundation, the National Institutes of Health, and the Carolina Population Center at the University of North Carolina. One of the investigators is supported by a National Health and Medical Research Council of Australia Early Career Fellowship. The investigators did not report any conflicts of interest.
FROM JAMA INTERNAL MEDICINE
Zika-related birth defects up in recent weeks
Zika virus infection has been occurring in pregnant women at a slow but steady clip over the last couple of months, but cases of liveborn infants with Zika-related birth defects have jumped in recent weeks, according to the Centers for Disease Control and Prevention.
Eight liveborn infants with Zika-related birth defects were reported to the U.S. Zika Pregnancy Registry during the 2 weeks ending May 23, more than any other 2-week period this year, and that was after six such infants were reported for the 2 weeks ending May 9. The total for the 50 states and the District of Columbia is now 72 for 2016-2017. No new pregnancy losses with birth defects were reported over the same 4-week span, so the 50 state/D.C. total remained at eight for 2016-2017, CDC data show.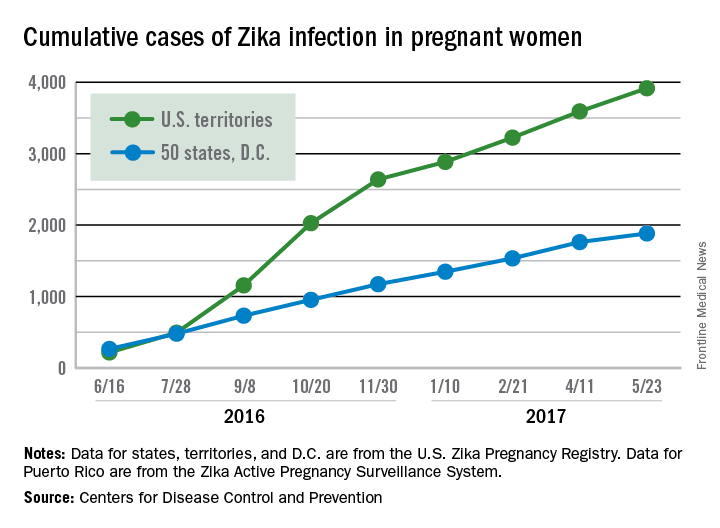
The CDC notes that these are not real-time data and reflect only pregnancy outcomes for women with any laboratory evidence of possible Zika virus infection, although it is not known if Zika virus was the cause of the poor outcomes. Zika-related birth defects recorded by the CDC could include microcephaly, calcium deposits in the brain indicating possible brain damage, excess fluid in the brain cavities and surrounding the brain, absent or poorly formed brain structures, abnormal eye development, or other problems resulting from brain damage that affect nerves, muscles, and bones. The pregnancy losses encompass any miscarriage, stillbirth, or termination with evidence of birth defects.
Minimally invasive cosmetic procedures more popular than ever
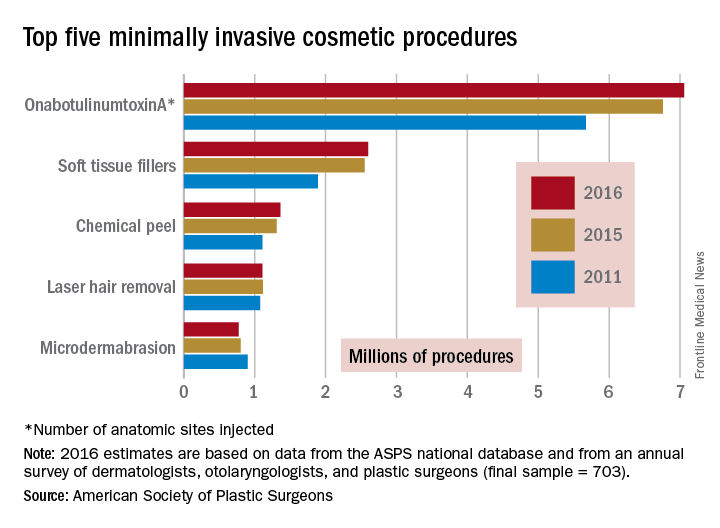
The total number of minimally invasive cosmetic procedures topped 15 million for the first time in 2016, with onabotulinumtoxinA injections leading the way, according to the American Society of Plastic Surgeons.
An estimated 15.4 million minimally invasive cosmetic procedures were performed last year, with onabotulinumtoxinA making up over 45% – approximately 7.1 million anatomic sites injected – of that total, ASPS data show.
Next in popularity was injection of soft tissue fillers, with just over 2.6 million procedures – almost 17% of the procedures performed in 2016 – followed by chemical peels with almost 1.4 million procedures, laser hair removal with 1.1 million procedures, and microdermabrasion at 775,000, the ASPS reported.
The total number of minimally invasive procedures was up 3% from the 14.96 million performed in 2015, while onabotulinumtoxinA was up 4%, soft tissue fillers were up 2%, chemical peels were up 4%, laser hair removal was down 1%, and microdermabrasion was down 3%. Larger changes were seen among some less common procedures: injection lipolysis was up 18% (55,660 procedures in 2016), fat injection was up 13% (79,208 procedures in 2016), and acellular dermal matrix procedures were down 18% (7,809 in 2016), according to the ASPS Tracking Operations and Outcomes for Plastic Surgeons database and an annual survey of board-certified dermatologists, otolaryngologists, and plastic surgeons (final sample = 703).
Public favors Obamacare over Trumpcare
The American Health Care Act, the House Republicans’ replacement for the Affordable Care Act, is currently viewed less favorably than its predecessor, according to a new poll by the Kaiser Family Foundation.
In the survey, 40% of respondents said that they had a “very unfavorable” opinion of the AHCA, compared with 29% for the ACA. The “very favorable” opinions also favored the ACA: 29% to 12%, according to a Kaiser report released May 31.
The Kaiser Health Tracking Poll involved 1,205 adults and was conducted May 16-22, 2017.
Few states fully support HCV prevention, treatment
The prevalence of hepatitis C virus (HCV) varies considerably by state, and the same can be said for the state laws and policies attempting to decrease that prevalence, according to an assessment by the Centers for Disease Control and Prevention.
In 2015, incidence of acute HCV infection exceeded the national average of 0.8 per 100,000 population in 17 states, including seven with rates that at least doubled it, the report noted. New HCV infections have increased in recent years despite curative therapies “and known preventive measures to interrupt transmission.”
The U.S. incidence of HCV jumped by 294% from 2010 to 2015, and “this increase in acute cases of HCV is largely attributed to injection drug use,” the CDC investigators said. Since state laws and policies affect access to HCV preventive and treatment measures, the researchers reviewed laws related to access to clean needles and policies on Medicaid fee-for-service treatment.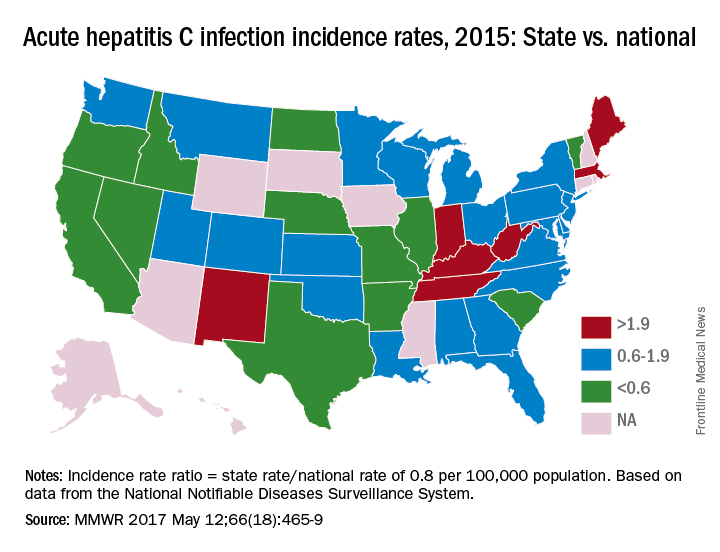
Only three states – Massachusetts, New Mexico, and Washington – had a comprehensive (all three were considered “more comprehensive”) set of prevention laws and a permissive treatment policy, the investigators said, while also noting that two of the three – Massachusetts and New Mexico – were among the states with acute HCV rates that were at least twice the national average.
“Although the costs of HCV therapies have raised budgetary issues for state Medicaid programs in the past, the costs of HCV treatment have declined in recent years, increasing the cost-effectiveness of treatment, particularly among persons who inject drugs and who might serve as an ongoing source of transmission to others,” the report concluded.
The analysis examined three types of laws on access to clean needles and syringes: authorization of exchange programs, the scope of drug paraphernalia laws, and retail sale of needles and syringes. Each law was assessed for five elements, including authorization of syringe exchange statewide or in selected jurisdictions and exemption of needles or syringes from the definition of drug paraphernalia.
For the accompanying map (see “Acute hepatitis C infection incidence rates, 2015: State vs. national”), each state’s acute HCV incidence rate for 2015 was divided by the national rate to determine the incidence rate ratio, with data unavailable for 10 states.
AGA Resource
The AGA HCV Clinical Service Line offers tools to help you become more efficient, understand quality standards and improve the process of care for patients. Read more at http://www.gastro.org/patient-care/conditions-diseases/hepatitis-c.
FROM MMWR
Few states fully back HCV prevention, treatment
The prevalence of hepatitis C virus (HCV) varies considerably by state, and the same can be said for the state laws and policies attempting to decrease that prevalence, according to an assessment by the Centers for Disease Control and Prevention.
In 2015, incidence of acute HCV infection exceeded the national average of 0.8 per 100,000 population in 17 states, including seven with rates that at least doubled it, the report noted. New HCV infections have increased in recent years despite curative therapies “and known preventive measures to interrupt transmission.”
The “most comprehensive” laws on prevention through clean needle access as of 2016 were found in Maine, Nevada, and Utah, with laws in 12 other states categorized as “more comprehensive” and 18 states falling into the “least comprehensive” category. On the Medicaid side of the equation, 16 states had permissive policies that did not require sobriety or required only screening and counseling before treatment, 24 states had restrictive policies that requited sobriety, and 10 states had no policy available, the report showed (MMWR. 2017 May 12:66[18]:465-9).
Only three states – Massachusetts, New Mexico, and Washington – had a comprehensive (all three were considered “more comprehensive”) set of prevention laws and a permissive treatment policy, the investigators said, while also noting that two of the three – Massachusetts and New Mexico – were among the states with acute HCV rates that were at least twice the national average.
“Although the costs of HCV therapies have raised budgetary issues for state Medicaid programs in the past, the costs of HCV treatment have declined in recent years, increasing the cost-effectiveness of treatment, particularly among persons who inject drugs and who might serve as an ongoing source of transmission to others,” the report concluded.
The analysis examined three types of laws on access to clean needles and syringes: authorization of exchange programs, the scope of drug paraphernalia laws, and retail sale of needles and syringes. Each law was assessed for five elements, including authorization of syringe exchange statewide or in selected jurisdictions and exemption of needles or syringes from the definition of drug paraphernalia.
For the accompanying map (see “Acute hepatitis C infection incidence rates, 2015: State vs. national”), each state’s acute HCV incidence rate for 2015 was divided by the national rate to determine the incidence rate ratio, with data unavailable for 10 states.
FROM MMWR
More pulmonary patients getting palliative care
Patients referred to palliative care are most likely to have cancer, but the proportion has gone down since 2009 as other diagnoses have increased, according to a report from the National Palliative Care Registry.
In 2015, cancer patients made up 26% of the patients referred to palliative care, compared with 35% in 2009. The situation was reversed for the next three most common diagnoses in 2015: Cardiac diagnoses rose from 5% in 2009 to 13%, pulmonary diagnoses increased from 6% to 12%, and neurologic diagnoses went from 3% to 8%, the report showed.
An increase in overall palliative care penetration was seen from 2009 to 2015, as the percentage of annual hospital admissions seen by a palliative care team increased from 2.7% to 4.8%. Over that same time period, the percentage of palliative care patients who died in the hospital decreased from 29% to 22%, according to the report.
In 2015, there were 420 palliative care programs participating in the registry, which is a joint project of the Center to Advance Palliative Care and the National Palliative Care Research Center.
More neurology patients getting palliative care
Patients referred to palliative care are most likely to have cancer, but the proportion has gone down since 2009 as other diagnoses have increased, according to a report from the National Palliative Care Registry.
In 2015, cancer patients made up 26% of the patients referred to palliative care, compared with 35% in 2009. The situation was reversed for the next three most common diagnoses in 2015: Cardiac diagnoses rose from 5% in 2009 to 13%, pulmonary diagnoses increased from 6% to 12%, and neurologic diagnoses went from 3% to 8%, the report showed.
An increase in overall palliative care penetration was seen from 2009 to 2015, as the percentage of annual hospital admissions seen by a palliative care team increased from 2.7% to 4.8%. Over that same time period, the percentage of palliative care patients who died in the hospital decreased from 29% to 22%, according to the report.
In 2015, there were 420 palliative care programs participating in the registry, which is a joint project of the Center to Advance Palliative Care and the National Palliative Care Research Center.