User login
Richard Franki is the associate editor who writes and creates graphs. He started with the company in 1987, when it was known as the International Medical News Group. In his years as a journalist, Richard has worked for Cap Cities/ABC, Disney, Harcourt, Elsevier, Quadrant, Frontline, and Internet Brands. In the 1990s, he was a contributor to the ill-fated Indications column, predecessor of Livin' on the MDedge.
More cardiac patients getting palliative care
Patients referred to palliative care are most likely to have cancer, but the proportion has gone down since 2009 as other diagnoses have increased, according to a report from the National Palliative Care Registry.
In 2015, cancer patients made up 26% of the patients referred to palliative care, compared with 35% in 2009. The situation was reversed for the next three most common diagnoses in 2015: Cardiac diagnoses rose from 5% in 2009 to 13%, pulmonary diagnoses increased from 6% to 12%, and neurologic diagnoses went from 3% to 8%, the report showed.
An increase in overall palliative care penetration was seen from 2009 to 2015, as the percentage of annual hospital admissions seen by a palliative care team increased from 2.7% to 4.8%. Over that same time period, the percentage of palliative care patients who died in the hospital decreased from 29% to 22%, according to the report.
In 2015, there were 420 palliative care programs participating in the registry, which is a joint project of the Center to Advance Palliative Care and the National Palliative Care Research Center.
Noncancer diagnoses on the rise in palliative care
Patients referred to palliative care are most likely to have cancer, but the proportion has gone down since 2009 as other diagnoses have increased, according to a report from the National Palliative Care Registry.
In 2015, cancer patients made up 26% of the patients referred to palliative care, compared with 35% in 2009. The situation was reversed for the next three most common diagnoses in 2015: Cardiac diagnoses rose from 5% in 2009 to 13%, pulmonary diagnoses increased from 6% to 12%, and neurologic diagnoses went from 3% to 8%, the report showed.
Referrals by specialty were led by hospital medicine, which accounted for 48% of all patients referred to palliative care in 2015, with internal medicine/family medicine next at 14%, followed by pulmonary/critical care at 13% and oncology at 7%, the report said.
An increase in overall palliative care penetration was seen from 2009 to 2015, as the percentage of annual hospital admissions seen by a palliative care team increased from 2.7% to 4.8%. Over that same time period, the percentage of palliative care patients who died in the hospital decreased from 29% to 22%, according to the report.
In 2015, there were 420 palliative care programs participating in the registry, which is a joint project of the Center to Advance Palliative Care and the National Palliative Care Research Center.
"But doc, isn't hospice just for cancer patients?"
"But doc, isn't hospice just for cancer patients?"
"But doc, isn't hospice just for cancer patients?"
Patients referred to palliative care are most likely to have cancer, but the proportion has gone down since 2009 as other diagnoses have increased, according to a report from the National Palliative Care Registry.
In 2015, cancer patients made up 26% of the patients referred to palliative care, compared with 35% in 2009. The situation was reversed for the next three most common diagnoses in 2015: Cardiac diagnoses rose from 5% in 2009 to 13%, pulmonary diagnoses increased from 6% to 12%, and neurologic diagnoses went from 3% to 8%, the report showed.
Referrals by specialty were led by hospital medicine, which accounted for 48% of all patients referred to palliative care in 2015, with internal medicine/family medicine next at 14%, followed by pulmonary/critical care at 13% and oncology at 7%, the report said.
An increase in overall palliative care penetration was seen from 2009 to 2015, as the percentage of annual hospital admissions seen by a palliative care team increased from 2.7% to 4.8%. Over that same time period, the percentage of palliative care patients who died in the hospital decreased from 29% to 22%, according to the report.
In 2015, there were 420 palliative care programs participating in the registry, which is a joint project of the Center to Advance Palliative Care and the National Palliative Care Research Center.
U.S. Zika epidemic could cost billions, or less
A Zika virus epidemic could cost the United States $183 million … or $680 million … or $2.2 billion, according to a new computational model developed to estimate Zika’s economic impact.
The model’s seeming lack of conviction comes from its options for an attack rate – the percentage of the population infected by the virus. An epidemic with a low attack rate of 0.01% would be expected to result in over 7,000 symptomatic cases and cost $183 million in direct medical costs and losses in productivity, said Bruce Y. Lee, MD, of Johns Hopkins Bloomberg School of Public Health, Baltimore, and his associates (PLoS Negl Trop Dis. 2017 Apr 27;11[4]:e0005531).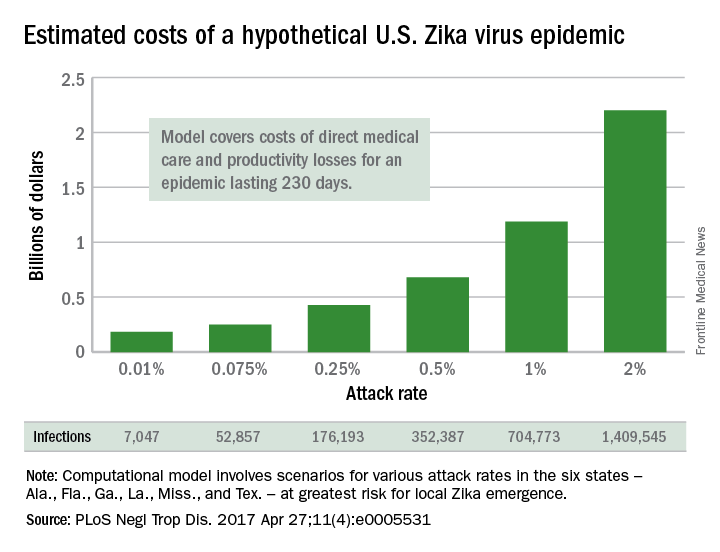
The investigators based their model on the six states at the highest risk for local Zika emergence: Alabama, Florida, Georgia, Louisiana, Mississippi, and Texas. The hypothetical epidemic lasts 230 days, which is equivalent to the Zika-related microcephaly outbreak in Brazil in 2015.
The National Institutes of Health, the Agency for Healthcare Research and Quality, and the United States Agency for International Development funded the study. The authors declared that no competing interests exist.
FROM PLOS NEGLECTED TROPICAL DISEASES
Lifetime risk of hand OA comes close to 40%
Almost 40% of Americans can expect to develop hand osteoarthritis (OA) in their lifetimes, according to an analysis involving participants from an ongoing population-based, prospective cohort study.
The overall risk, 39.8%, is based on data from 2,218 eligible subjects in the Johnston County Osteoarthritis Project, but there is significant variation among various subgroups, said Jin Qin, ScD, of the Centers for Disease Control and Prevention, and her associates (Arthritis Rheumatol. 2017 May 4. doi: 10.1002/art.40097).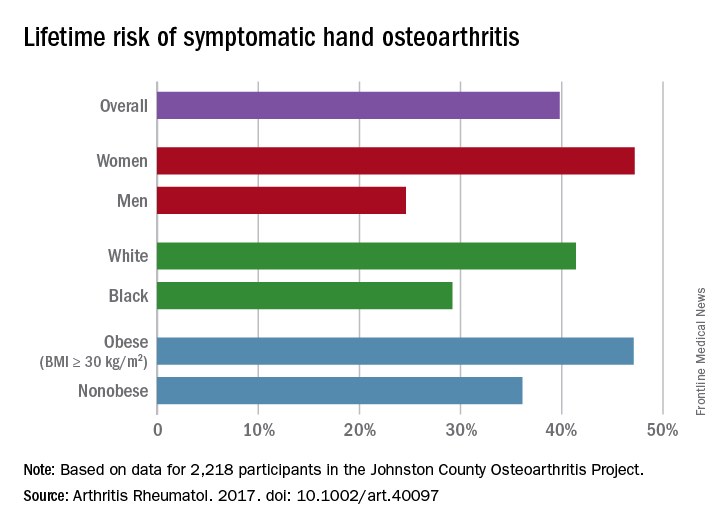
This report is the first to estimate the lifetime risk of symptomatic hand OA, they noted, and “given the aging population and increasing life expectancy in the United States, it is reasonable to expect that more Americans will be affected by this painful and debilitating condition in the years to come.”
The study was funded by the CDC and the National Institute of Arthritis and Musculoskeletal and Skin Diseases. The investigators did not include any disclosures in the report.
FROM ARTHRITIS & RHEUMATOLOGY
Fewer adults unaware of their hypertension
Hypertension awareness has improved significantly in adults since 2002, according to the National Center for Health Statistics.
The percentage of adults aged 18-39 years who had hypertension but reported not being told about it by a health care provider dropped 36% from 1999-2002, when it was 48.3%, to 2011-2014, when it was down to 30.8%. For adults aged 40-59 years, 26.6% were unaware of their hypertension in 1999-2002, compared with 17.4% in 2011-2014, a relative decrease of almost 35%. The decline was an even larger 55% for those aged 60 years and over – from 27.6% in 1999-2002 to 12.5% in 2011-2014, the NCHS reported.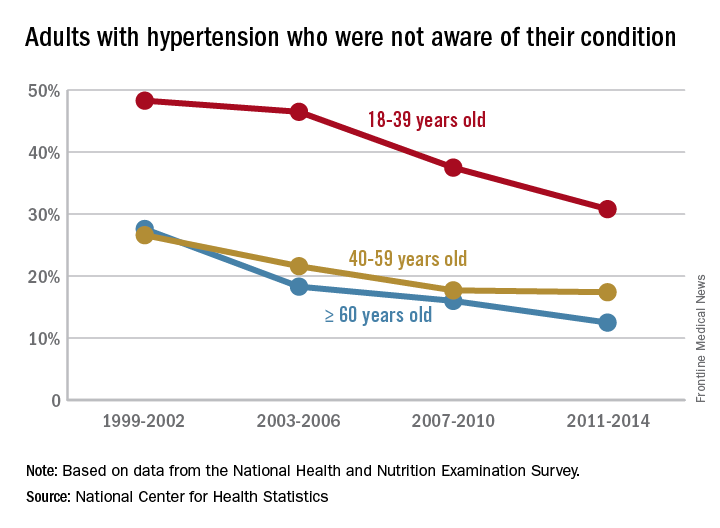
Medicaid acceptance up among cardiologists
Medicaid acceptance was 77% among cardiologists in the 2017 edition of an ongoing survey conducted in 15 large cities by physician recruitment firm Merritt Hawkins.
That was up from 61% in the previous survey, conducted in 2014, and higher than the average of 72% for cardiologists in 15 midsized cities that were included for the first time in 2017, the company reported.
There were four large cities with Medicaid acceptance rates of 100% – Boston, Detroit, Minneapolis (up from just 7% in 2014), and Portland, Ore. – along with four midsized cities – Cedar Rapids, Iowa; Evansville, Ind.; Fargo, N.D.; and Yakima, Wash. The lowest rate among the large cities was in Dallas (15%), with the midsized basement occupied by Lafayette, La., at 13%, Merritt Hawkins said.
Investigators called 259 randomly selected cardiologists in the large cities and 87 cardiologists in the midsized cities in January and February. It was the fourth such survey the company has conducted since 2004.
The survey also included four other specialties – dermatology, family medicine, ob.gyn., and orthopedic surgery. The Medicaid acceptance rate for all 1,414 physicians in all five specialties in the 15 large cities was 53%, and the average rate for all specialties in the midsized cities was 60% for the 494 offices surveyed, the company said. Cardiology had the highest rates by specialty and dermatology the lowest in both the large and midsized cities.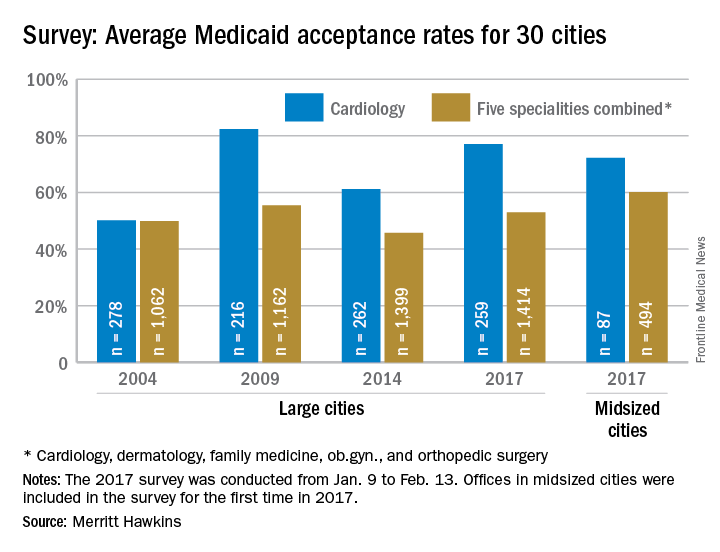
Preeclampsia/eclampsia rate highest in black women
The rate of preeclampsia and eclampsia for black women is 61% higher than it is for white women and 50% higher than for women overall, according to the Agency for Healthcare Research and Quality.
In 2014, black women experienced preeclampsia/eclampsia in 69.8 of every 1,000 deliveries, compared with 43.3 per 1,000 deliveries in white women and 46.6 per 1,000 for all women. Hispanic women were just above the overall rate at 46.8 per 1,000 deliveries, and Asian/Pacific Islander women were 38% lower than the overall rate at 28.8 per 1,000 deliveries, AHRQ said in its report. The overall rate was up 21% over the 38.4 per 1,000 reported in 2005.
Looking at degree of severity, 1.7% of all preeclampsia/eclampsia births in black women were eclampsia, compared with 1.4% for white and Hispanic women and 0.9% for Asian/Pacific Islanders. Severe preeclampsia was most common in Asian/Pacific Islanders – 40.4% of those diagnosed – with Hispanics at 40.3%, blacks at 38.5%, and whites at 34.3%. Mild or unspecified preeclampsia was diagnosed in 52% of preeclamptic/eclamptic white women, 46% of Hispanic women, 45% of Asians/Pacific Islanders, and 37% of black women, the AHRQ said in its analysis of data from the National Inpatient Sample.
Altogether, there were almost 177,000 delivery hospitalizations with preeclampsia/eclampsia in 2014, representing 4.7% of all deliveries and making it the most common hypertension-related diagnosis, followed by gestational hypertension (3.8%) and preexisting hypertension (1.7%). Compared with hospital stays for all other deliveries, those complicated by preeclampsia/eclampsia were 70% longer (mean, 4.4 vs. 2.6 days) and 70% more expensive (mean, $7,500 vs. $4,400), according to the report. 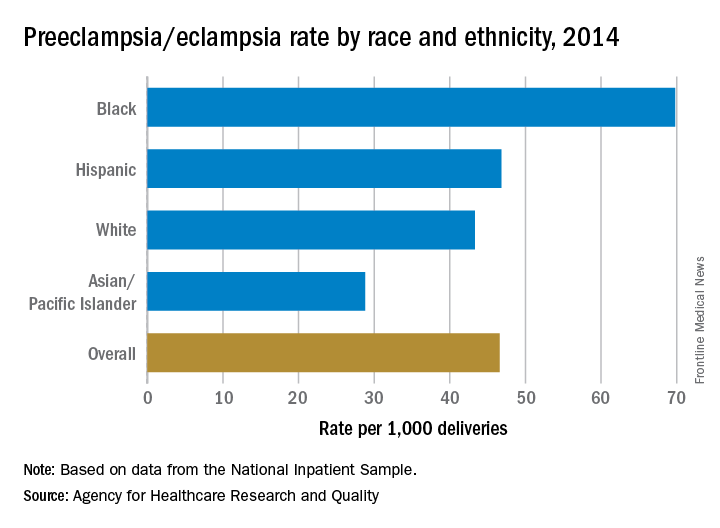
The rate of preeclampsia and eclampsia for black women is 61% higher than it is for white women and 50% higher than for women overall, according to the Agency for Healthcare Research and Quality.
In 2014, black women experienced preeclampsia/eclampsia in 69.8 of every 1,000 deliveries, compared with 43.3 per 1,000 deliveries in white women and 46.6 per 1,000 for all women. Hispanic women were just above the overall rate at 46.8 per 1,000 deliveries, and Asian/Pacific Islander women were 38% lower than the overall rate at 28.8 per 1,000 deliveries, AHRQ said in its report. The overall rate was up 21% over the 38.4 per 1,000 reported in 2005.
Looking at degree of severity, 1.7% of all preeclampsia/eclampsia births in black women were eclampsia, compared with 1.4% for white and Hispanic women and 0.9% for Asian/Pacific Islanders. Severe preeclampsia was most common in Asian/Pacific Islanders – 40.4% of those diagnosed – with Hispanics at 40.3%, blacks at 38.5%, and whites at 34.3%. Mild or unspecified preeclampsia was diagnosed in 52% of preeclamptic/eclamptic white women, 46% of Hispanic women, 45% of Asians/Pacific Islanders, and 37% of black women, the AHRQ said in its analysis of data from the National Inpatient Sample.
Altogether, there were almost 177,000 delivery hospitalizations with preeclampsia/eclampsia in 2014, representing 4.7% of all deliveries and making it the most common hypertension-related diagnosis, followed by gestational hypertension (3.8%) and preexisting hypertension (1.7%). Compared with hospital stays for all other deliveries, those complicated by preeclampsia/eclampsia were 70% longer (mean, 4.4 vs. 2.6 days) and 70% more expensive (mean, $7,500 vs. $4,400), according to the report.
Just over half of FPs accept Medicaid
Medicaid acceptance was 55% among family physicians in the 2017 edition of an ongoing survey conducted in 15 large cities by physician recruitment firm Merritt Hawkins.
That was up from almost 52% in the previous survey, conducted in 2014, but lower than the average of 64% for FPs in 15 midsized cities that were included for the first time in 2017, the company reported.
There was one large city with a Medicaid acceptance rate of 100% – Minneapolis (up from 35% in 2014) – along with three midsized cities – Billings, Mt.; Dayton, Ohio; and Fargo, N.D. The lowest rate among the large cities was in Denver (20%), with the midsized basement occupied by Lafayette, La., at 20%, Merritt Hawkins reported.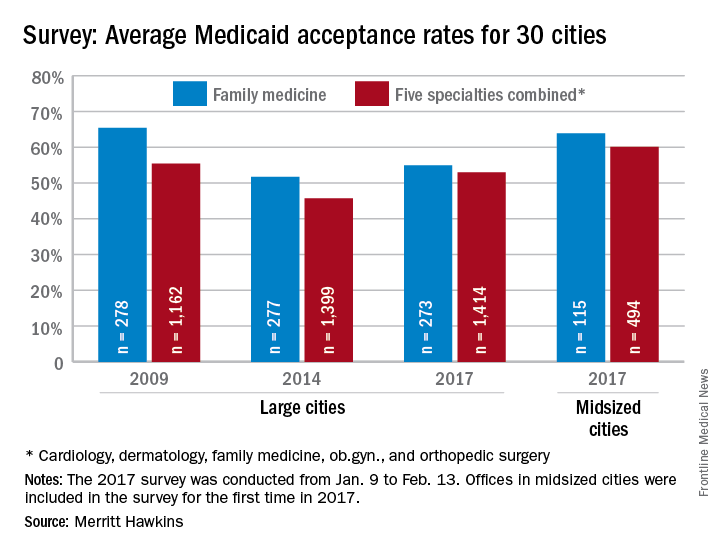
Investigators called 273 randomly selected family physicians in the large cities and 115 FPs in the midsized cities in January and February. It was the fourth such survey the company has conducted since 2004.
The survey included four other specialties – cardiology, dermatology, ob.gyn., and orthopedic surgery. The Medicaid acceptance rate for all 1,414 physicians in all five specialties in the 15 large cities was 53%, and the average rate for all specialties in the midsized cities was 60% for the 494 offices surveyed, the company noted.
Cardiology had the highest rates by specialty and dermatology the lowest in both the large and midsized cities. For all five specialties combined, Minneapolis (97%) and Fargo (100%) had the highest acceptance rates, with the lowest rates coming from Dallas (17%) for large cities and Lafayette (11%) for midsized cities, the Merritt Hawkins data show.
Medicaid acceptance at 33% for dermatologists
Medicaid acceptance was just over 33% among dermatologists in the 2017 edition of an ongoing survey conducted in 15 large cities by physician recruitment firm Merritt Hawkins.
That was up from 27% in the previous survey, conducted in 2014, but lower than the average of 41% for dermatologists in 15 midsized cities that were included for the first time in 2017, the company reported.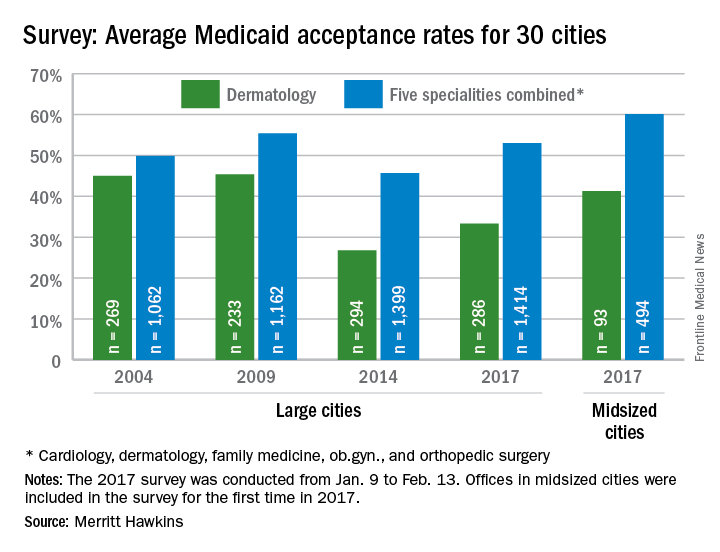
Investigators called 286 randomly selected dermatologists in the large cities and 93 dermatologists in the midsized cities in January and February. It was the fourth such survey the company has conducted since 2004.
The survey also included four other specialties – cardiology, family medicine, ob.gyn., and orthopedic surgery. The Medicaid acceptance rate for all 1,414 physicians in all five specialties in the 15 large cities was 53%, and the average rate for all specialties in the midsized cities was 60% for the 494 offices surveyed. Cardiology had the highest rates by specialty and dermatology the lowest in both the large and midsized cities, the company said.
Just over half of ob.gyns. accept Medicaid
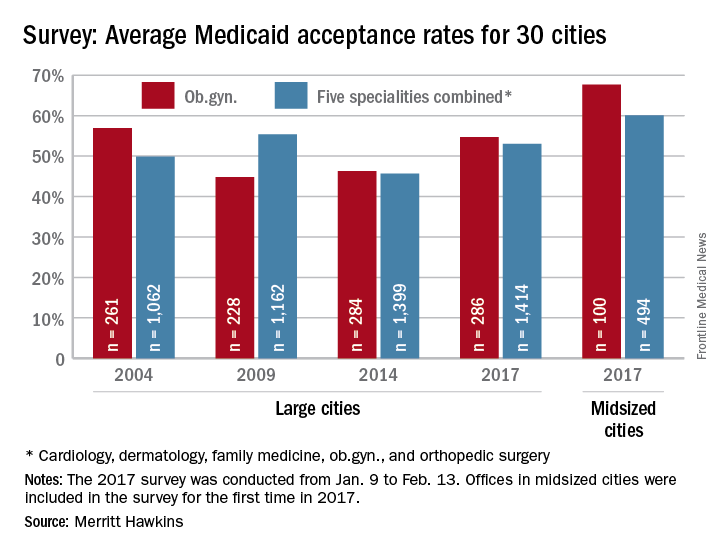
Medicaid acceptance was nearly 55% among ob.gyns. in the 2017 edition of an ongoing survey conducted in 15 large cities by physician recruitment firm Merritt Hawkins.
It was up from almost 46% in the previous survey, conducted in 2014, but lower than the average of 68% for ob.gyns. in 15 midsized cities that were included for the first time in 2017, the company reported.
There were two large cities with Medicaid acceptance rates of 100% – Boston and Minneapolis (up from 40% in 2014) – along with four midsized cities – Billings, Mt.; Fargo, N.D.; Fort Smith, Ark.; and Yakima, Wash. The lowest rate among the large cities was in Dallas (15%), with the midsized basement occupied by Lafayette, La., at 10%, Merritt Hawkins said.
Investigators called 286 randomly selected ob.gyns. in the large cities and 100 ob.gyns. in the midsized cities in January and February. It was the fourth such survey the company has conducted since 2004.
The survey also included four other specialties – cardiology, dermatology, family medicine, and orthopedic surgery. The Medicaid acceptance rate for all 1,414 physicians in all five specialties in the 15 large cities was 53%, and the average rate for all specialties in the midsized cities was 60% for the 494 offices surveyed, the company said.
Cardiology had the highest rates by specialty and dermatology the lowest in both the large and midsized cities. For all five specialties combined, Fargo (100%) and Minneapolis (97%) had the highest acceptance rates, and Dallas (17%) and Lafayette (11%) had the lowest, the report showed.