User login
Richard Franki is the associate editor who writes and creates graphs. He started with the company in 1987, when it was known as the International Medical News Group. In his years as a journalist, Richard has worked for Cap Cities/ABC, Disney, Harcourt, Elsevier, Quadrant, Frontline, and Internet Brands. In the 1990s, he was a contributor to the ill-fated Indications column, predecessor of Livin' on the MDedge.
Just the FRAX: National fracture risks estimated
Adults aged 40 years and over have a mean 10-year risk of 5.3% for major osteoporotic fracture, according to the National Center for Health Statistics.
That risk includes a 10-year probability of 0.5% for hip fracture, based on estimates using the FRAX algorithm. These nationally representative estimates, the first to use the FRAX algorithm in this population, are based on 2013-2014 data from the National Health and Nutrition Examination Survey and show that the adjusted mean risks for those aged 50 years and over are 7.4% for major osteoporotic fracture and 0.9% for hip fracture, the NCHS reported.
The risk estimates in this analysis agree in large part with guidelines from the National Osteoporosis Foundation, which “use elevated FRAX scores in combination with low bone mass to define treatment eligibility,” the investigators said. FRAX-based findings, they noted, may provide “a more global evaluation of fracture risk than can be obtained from estimates based on [bone mineral density] alone.”
ACA brought down veterans’ uninsured rate
The percentage of uninsured veterans dropped by almost 40% in the first 2 years after the Affordable Care Act’s major coverage provisions were implemented, according to a report from the Robert Wood Johnson Foundation and the Urban Institute.
In 2015, 5.9% of the almost 9.4 million veterans aged 19-64 years were uninsured, down from 9.6% in 2013 – the statistically significant difference of 3.8 percentage points representing a relative decline of 38.5%. The difference was even greater for veterans living in the states that had expanded Medicaid by mid-2015, who saw their uninsured rate fall from 9% to 4.8%, compared with those in states that had not, whose uninsured rate declined from 10.3% to 7.1%, the report’s authors said.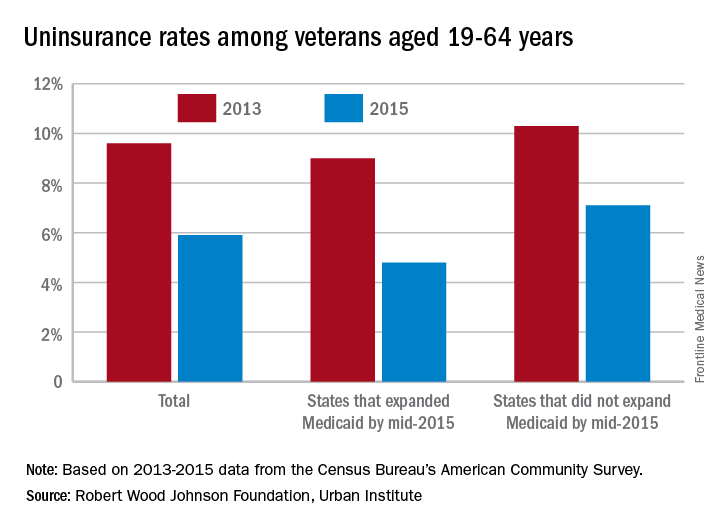
“These findings suggest that repeal of the ACA or particular components of the ACA (such as the Medicaid expansion) could reverse these coverage gains, increasing the number of veterans without health insurance coverage,” they wrote.
Of those currently uninsured, the report notes that “one-quarter are eligible for Medicaid but not enrolled, and … a number of uninsured veterans may qualify for VA care.” One option from the Department of Veterans Affairs, the Veterans Choice Program, was just extended beyond its expiration in August, ensuring that veterans will “continue to have access to care through local community providers [and] will not have to wait weeks or months, or drive long distances, to get the care they need,” Patrice A. Harris, MD, chair of the American Medical Association’s Board of Trustees, said in a statement.
The study was conducted by the Urban Institute with funding by the Robert Wood Johnson Foundation. Data for the analysis came from the Census Bureau’s American Community Survey and from the Centers for Disease Control and Prevention’s National Health Interview Survey.
Genital HPV prevalence tops 42% in adults
The overall prevalence of genital human papillomavirus (HPV) among adults aged 18-59 years was 42.5% in 2013-2014, with more than half of that representing infection with high-risk types, according to the National Center for Health Statistics.
Prevalence of the 14 HPV types (out of 37 total) considered to be high risk was almost 23% in 2013-2014. Men were significantly more likely than women to have any genital HPV (45% vs. 40%) and high-risk genital HPV (25% vs. 20%), the NCHS reported.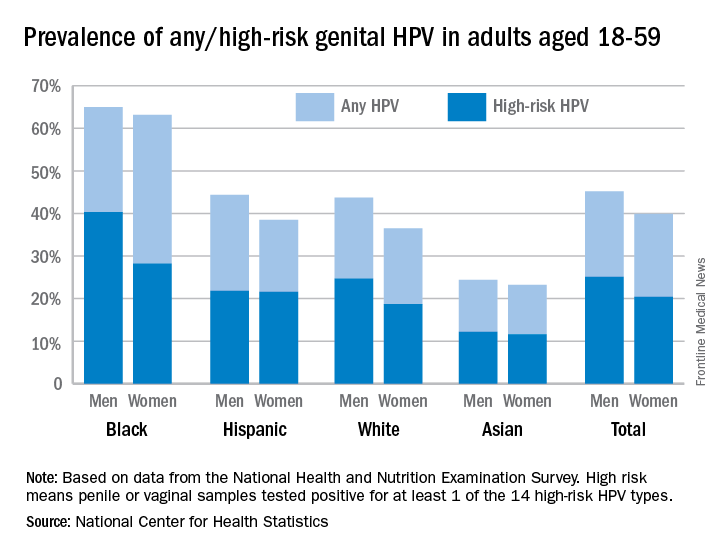
Oral rinse samples were collected as well for adults aged 18-69 years, and the overall prevalence was 7.3% for any oral HPV and 4% for high-risk HPV in 2011-2014. Prevalence among men was significantly higher than among women for all oral HPV (11.5% vs. 3.3%) and for high-risk HPV (6.8% vs. 1.2%), the NCHS said.
Teens’ marijuana use higher during pregnancy
The prevalence of marijuana use among pregnant teenagers is more than double that among teens who are not pregnant, according to a study involving 410,000 females aged 12-44 years.
For pregnant teens aged 12-17 years, the past-month prevalence of marijuana use was 14% between 2002 and 2015, compared with 6.5% for their nonpregnant peers, Nora D. Volkow, MD, director of the National Institute on Drug Abuse in Bethesda, Md., and her associates reported in a letter on April 17 (Ann Intern Med. 2017 Apr 17. doi: 10.7326/L17-0067).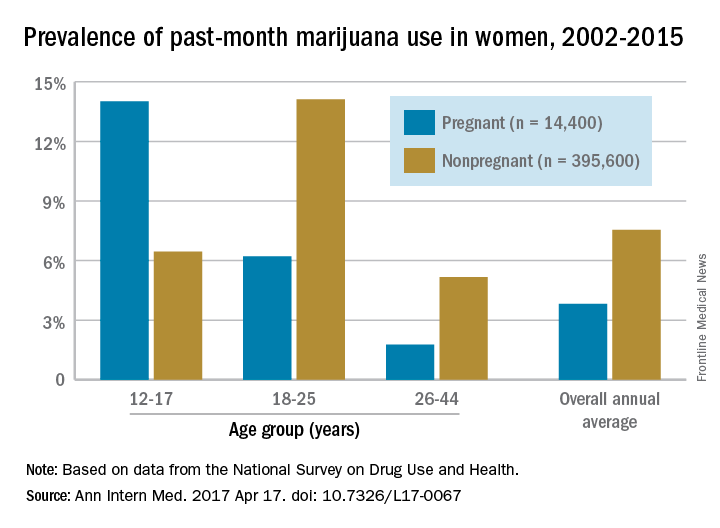
The pattern of use in the youngest age group “may reflect underlying risky behavior common to both teen pregnancy and early substance use and suggests the importance of intervention for teenagers,” the researchers wrote. “Because of consistent overlap between use of marijuana and other substances, identification of marijuana use during pregnancy warrants evaluation for comorbid substance abuse.”
The overall annual average prevalence of marijuana use was 3.8% among the 14,400 pregnant women and 7.5% for the 395,600 nonpregnant women who responded to the survey from 2002 to 2015. The investigators also found that marijuana use was higher in the first trimester (6.4%) than in the second (3.3%) or third (1.8%) trimesters and that use was higher in pregnant black women (6.5%) than in white (3.8%) or Hispanic women(2.9%) or women of other races/ethnicities (1.4%).
Although evidence on the effects of marijuana on prenatal development is limited, “pregnant females and those considering becoming pregnant should be advised not to use marijuana or other cannabinoids recreationally or to treat nausea,” Dr. Volkow and her associates wrote.
The study was sponsored by the National Institute on Drug Abuse and the Substance Abuse and Mental Health Services Administration. Dr. Volkow reported having no financial disclosures. One coauthor reported stock ownership of Pfizer, and another reported stock ownership of Sanofi and Eli Lilly.
FROM ANNALS OF INTERNAL MEDICINE
Crohn’s hospitalizations up significantly … or not
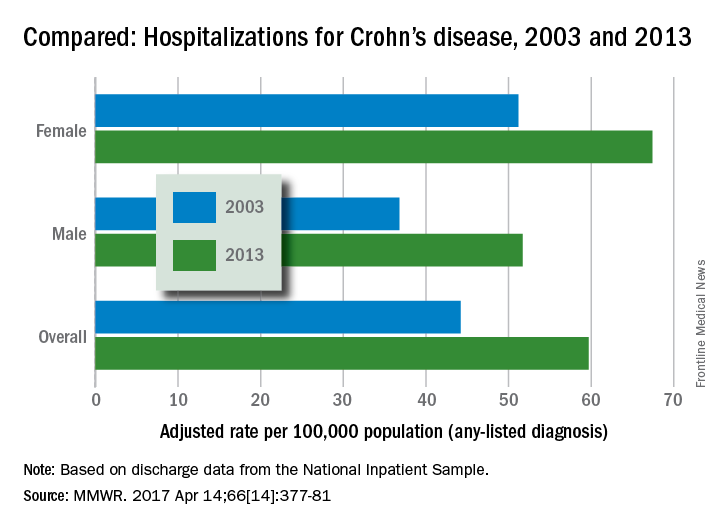
Hospitalizations for Crohn’s disease were up by a statistically significant 35% from 2003 to 2013 … or they were up just 5%, according to the Centers for Disease Control and Prevention.
It depends on how you look at it. In 2013, age-adjusted hospitalization was 59.7 stays per 100,000 population for Crohn’s as any-listed diagnosis – indicating that patients had Crohn’s disease but that it was not necessarily the main reason they were being hospitalized – compared with 44.2 per 100,000 in 2003. That’s an increase of 35%, the CDC said (MMWR. 2017 Apr 14;66[14]:377-81).
Hospitalizations with Crohn’s as the first-listed diagnosis – making it the main reason for the admission – were up 5% over the same period: 18.2 stays per 100,000 pop. in 2003 and 19.1 per 100,000 in 2013. That increase is not statistically significant, the CDC noted.
The increase in any-listed diagnosis “might represent greater physician awareness and diagnosis of Crohn’s disease or more complete coding of secondary diagnoses by physicians,” CDC investigators suggested.
Increases in hospitalizations for any-listed Crohn’s were significant for both men (40.5%) and women (31.6%). For first-listed Crohn’s, women saw a slight but not significant decrease of 1% while men had a significant 14.5% increase, according to the report, which was based on data from the National Inpatient Sample.
FROM MORBIDITY AND MORTALITY WEEKLY REPORT
Decline in U.S. flu activity puts end of season within sight
Outpatient visits for influenza were down again in the United States during the week ending April 1, and the number of states at the highest level of flu activity dropped from seven to four, according to the Centers for Disease Control and Prevention.
The national proportion of outpatient visits for influenza-like illness (ILI) was 2.9% for the week ending April 1, compared with 3.2% the week before, the CDC’s Outpatient Influenza-like Illness Surveillance Network reported. The national baseline level is 2.2%.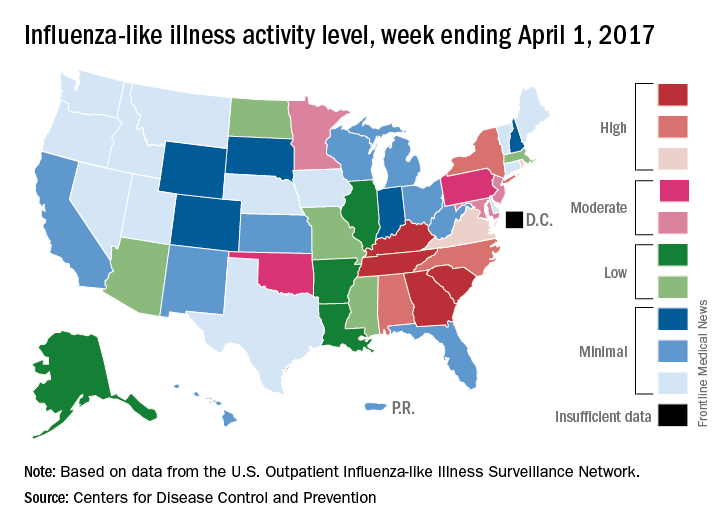
There were 7 flu-related pediatric deaths reported for the week ending April 1 – six of the deaths occurred in previous weeks – which brings the total for the 2016-2017 season to 68, the CDC said. The largest share of those deaths by age group has been among 5- to 11-year-olds (36.8%), followed by those aged 12-17 years (26.5%), 6-23 months (16.2%), 2-4 years (14.7%), and 0-5 months (5.9%).
Number of U.S. Zika-infected pregnancies tops 5,100
Almost 200 cases of pregnant women with Zika virus infection were reported in the United States during the 2 weeks ending March 28, with the number split evenly between the territories and the 50 states and Washington, D.C., according to the Centers for Disease Control and Prevention.
These latest 197 cases – 98 in the territories and 99 in the states/D.C. – bring the U.S. total since the beginning of 2016 to 5,177 pregnant women with laboratory evidence of Zika virus infection: 3,461 in the U.S. territories and 1,716 in the states/D.C., the CDC reported on April 6.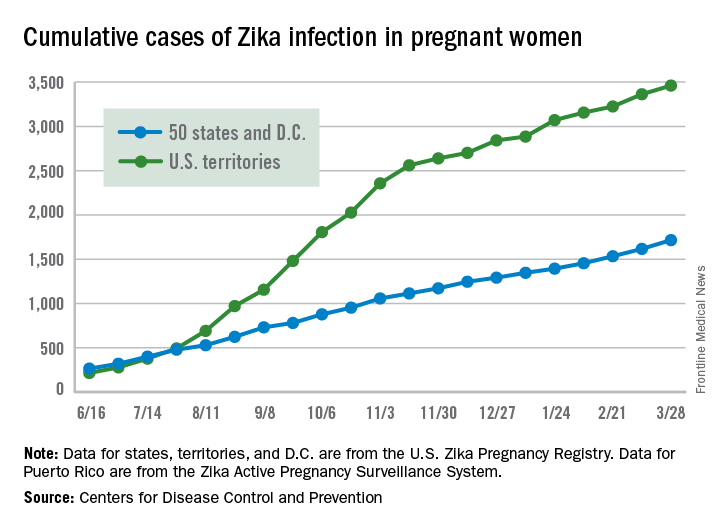
Since Jan. 1, 2015, a total of 41,701 cases of Zika virus infection have been reported among all Americans: 5,197 in the states/D.C. and 36,504 in the territories. Almost all of the territorial cases (97%) have occurred in Puerto Rico, while Florida (21%), New York (20%), and California (9%) together have accounted for half of the cases in the states/D.C., the CDC said.
These are not real-time data and reflect only pregnancy outcomes for women with any laboratory evidence of possible Zika virus infection, although it is not known if Zika virus was the cause of the poor outcomes. Zika-related birth defects recorded by the CDC could include microcephaly, calcium deposits in the brain indicating possible brain damage, excess fluid in the brain cavities and surrounding the brain, absent or poorly formed brain structures, abnormal eye development, or other problems resulting from brain damage that affect nerves, muscles, and bones. The pregnancy losses encompass any miscarriage, stillbirth, or termination with evidence of birth defects.
Wait times for cardiologist visits up 4.3 days since 2014
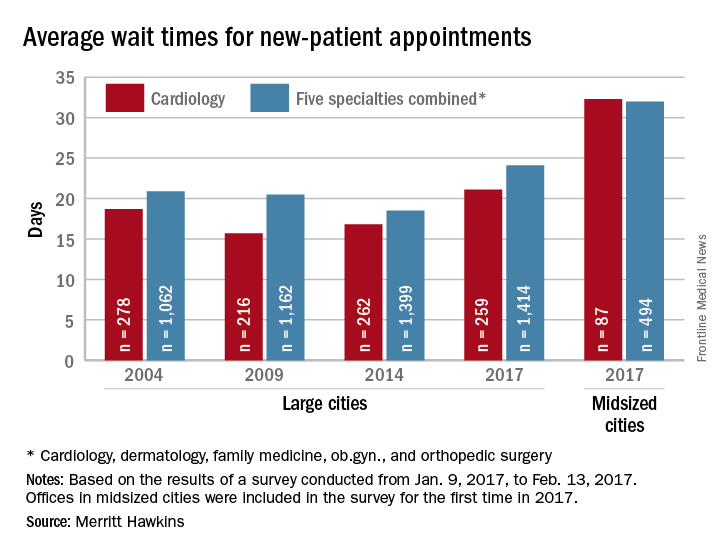
New patients are waiting 4.3 days longer for an appointment with a cardiologist in 2017 than they did in 2014, according to physician recruitment firm Merritt Hawkins.
The average wait time for a new patient to see a cardiologist for a checkup was 21.1 days in 2017, an almost 26% increase from the 16.8 days reported in 2014. Investigators called and made appointments with 259 randomly selected cardiologists in 15 large cities in January and February. It was the fourth such survey the company has conducted since 2004.
This year, the survey also included cardiologists in 15 midsized cities for the first time. The average wait time in these cities was even longer: 32.3 days for the 87 offices contacted. Odessa, Tex., had the longest average wait in a midsized city – 63 days – while Albany, N.Y., and Cedar Rapids, Iowa, had a shortest-for-the-group wait of 10 days, Merritt Hawkins reported. In the large cities, the longest average wait was 45 days (Boston) and the shortest wait was 12 days (Dallas and Houston).
The survey also included four other specialties – dermatology, family medicine, ob.gyn., and orthopedic surgery – and the average wait time for a new-patient appointment for all 1,414 physicians in all five specialties in the 15 large cities was 24.1 days, an increase of 30% from 2014. The average wait time for all specialties in the midsized cities was 32 days for the 494 offices surveyed, the company said.
“Physician appointment wait times are the longest they have been since we began conducting the survey,” Mark Smith, president of Merritt Hawkins, said in a written statement. “Growing physician appointment wait times are a significant indicator that the nation is experiencing a shortage of physicians.”
Wait times for dermatologist visits up 3.5 days since 2014
New patients are waiting 3.5 days longer for an appointment with a dermatologist in 2017 than they did in 2014, according to physician recruitment firm Merritt Hawkins.
The average wait time for a new patient to see a dermatologist for a “routine skin exam to detect possible carcinomas/melanomas” was 32.3 days in 2017, a 12.2% increase over the 28.8 days reported in 2014. Investigators called and made appointments with 286 randomly selected dermatologists in 15 large cities in January and February during the fourth such survey the company has conducted since 2004.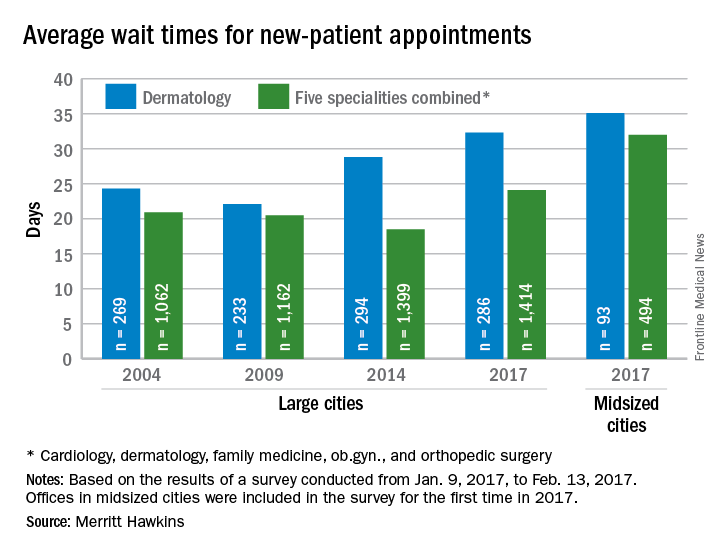
The survey also included four other specialties – cardiology, family medicine, obstetrics and gynecology, and orthopedic surgery – and the average wait time for a new-patient appointment for all 1,414 physicians in all five specialties in the 15 large cities was 24.1 days, an increase of 30% from 2014. The average wait time for all specialties in the midsized cities was 32 days for the 494 offices surveyed, the company said.
“Physician appointment wait times are the longest they have been since we began conducting the survey,” Mark Smith, president of Merritt Hawkins, said in a written statement. “Growing physician appointment wait times are a significant indicator that the nation is experiencing a shortage of physicians.”
Wait times for ob.gyn. visits up by 9 days since 2014
New patients are waiting 9 days longer for an appointment with an ob.gyn. in 2017 than they did in 2014, according to physician recruitment firm Merritt Hawkins.
The average wait time for a new patient to see an ob.gyn. for a routine gynecologic exam was 26.4 days in 2017, a nearly 53% increase from the 17.3 days reported in 2014. Investigators called and made appointments with 286 randomly-selected ob.gyns. in 15 large cities in January and February during the fourth such survey the company has conducted since 2004.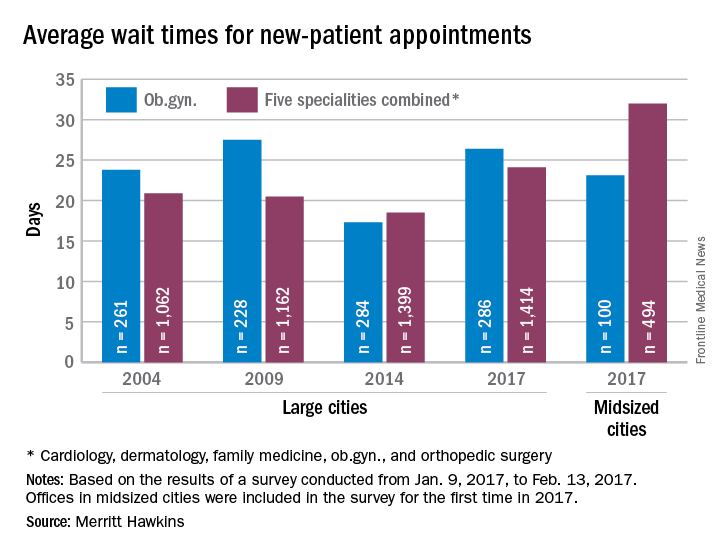
The survey also included four other specialties – cardiology, dermatology, family medicine, and orthopedic surgery – and the average wait time for a new-patient appointment for all 1,414 physicians in all five specialties in the 15 large cities was 24.1 days, an increase of 30% over 2014. The average wait time for all specialties in the mid-sized cities was 32 days for the 494 offices surveyed, the company said.
“Physician appointment wait times are the longest they have been since we began conducting the survey,” Mark Smith, president of Merritt Hawkins, said in a statement. “Growing physician appointment wait times are a significant indicator that the nation is experiencing a shortage of physicians.”