User login
Richard Franki is the associate editor who writes and creates graphs. He started with the company in 1987, when it was known as the International Medical News Group. In his years as a journalist, Richard has worked for Cap Cities/ABC, Disney, Harcourt, Elsevier, Quadrant, Frontline, and Internet Brands. In the 1990s, he was a contributor to the ill-fated Indications column, predecessor of Livin' on the MDedge.
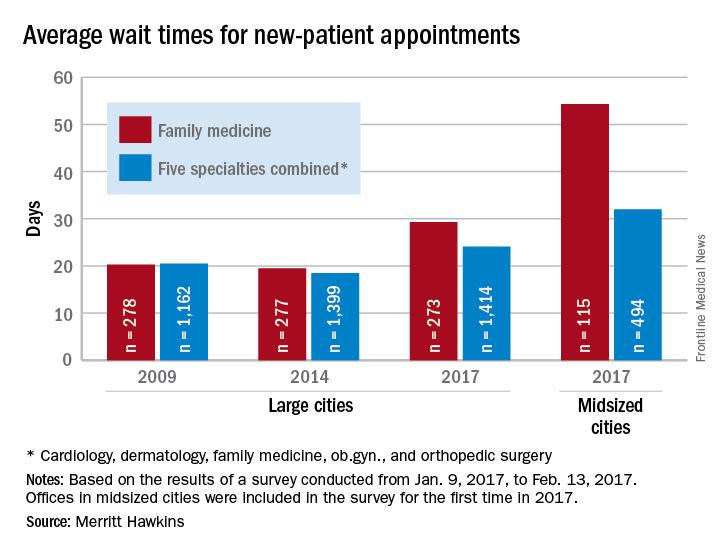
Wait times for family physician visits up almost 10 days since 2014
New patients are waiting almost 10 days longer for an appointment with a family physician in 2017 than they did in 2014, according to physician recruitment firm Merritt Hawkins.
The average wait time for a new patient to see a family physician for a routine physical was 29.3 days in 2017, a 50% increase from the 19.5 days reported in 2014. Investigators called and made appointments with 273 randomly selected family physicians in 15 large cities in January and February. This was the fourth such survey the company has conducted since 2004, although family physicians were not included until the second survey in 2009.
The survey also included four other specialties – cardiology, dermatology, obstetrics and gynecology, and orthopedic surgery – and the average wait time for a new-patient appointment for all 1,414 physicians in all five specialties in the 15 large cities was 24.1 days, an increase of 30% from 2014. The average wait time for all specialties in the midsized cities was 32 days for the 494 offices surveyed, the company said.
“Physician appointment wait times are the longest they have been since we began conducting the survey,” Mark Smith, president of Merritt Hawkins, said in a written statement. “Growing physician appointment wait times are a significant indicator that the nation is experiencing a shortage of physicians.”
Latest weekly flu data show no decline in visits
Outpatient visits for influenza-like illness (ILI) held steady for the week ending March 25, but the number of states at the “high” range of activity dropped from 12 from 10 the previous week, according to the Centers for Disease Prevention and Control.
The proportion of outpatient visits for ILI was 3.2% for the second consecutive week, which halted the slowdown in activity that began the week ending Feb. 18. That 3.2% represents just under 25,000 visits for ILI of the almost 747,000 total visits reported to the Outpatient Influenza-like Illness Surveillance Network (ILINet) for the week ending March 25. By age, the largest groups with ILI visits for the week were individuals aged 5-24 years (41%) and those aged 4 years and under (20%), the CDC reported.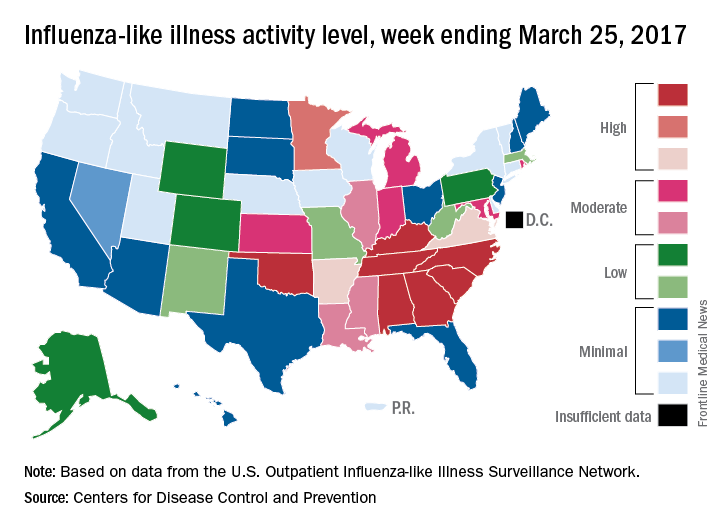
There were six flu-related pediatric deaths reported during the week ending March 25, but all occurred in earlier weeks. The total number of such deaths is now 61 for the 2016-2017 season, the CDC said.
Moving or starting a practice? Consider Iowa
The federal government may or may not believe in global warming, but when it comes to states’ medical practice climates, Iowa trumps them all, according to the personal finance website WalletHub.
The Hawkeye State came out on top of WalletHub’s list of the Best States to Practice Medicine for 2017 with 68.7 out of a possible 100 points, while New York finished 51st (Washington, D.C., was 50th) with 28.5 points. Minnesota is the second-best state for physicians, followed by Idaho, Wisconsin, and Kansas. The rest of the bottom five included New Jersey at 49th, Maryland at 48th, and Rhode Island at 47th, WalletHub reported.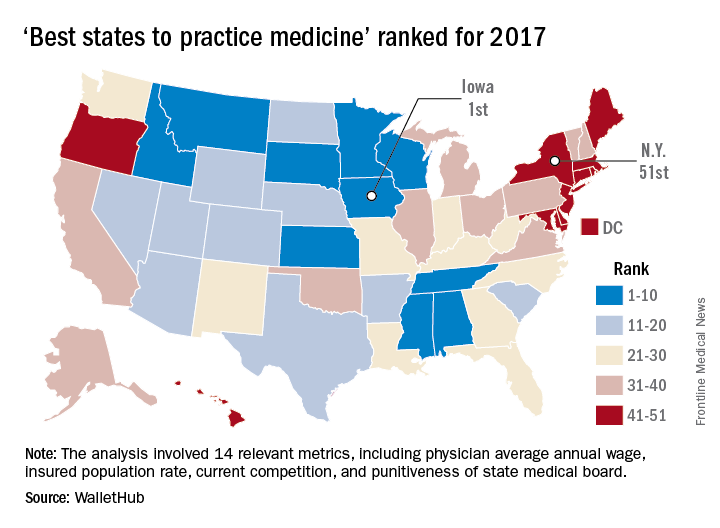
WalletHub compared the 50 states and Washington using 14 different metrics across two broad categories: “opportunity and competition” (70 points) and “medical environment” (30 points). Metrics included physicians’ average annual wage (adjusted for cost of living), hospitals per capita, quality of public hospital system, and annual malpractice liability insurance rate.
South dominates rankings of most obese U.S. cities
Jackson, Miss., is the most obese city in the United States for 2017, according to the personal finance website WalletHub.
The city topped the ranking of the 100 heaviest metro areas in the country with a score of 84.9 out of a possible 100 points based on 17 key metrics in three broad categories: obese and overweight people (50 points), weight-related health problems (30 points), and health environment (20 points), according to WalletHub.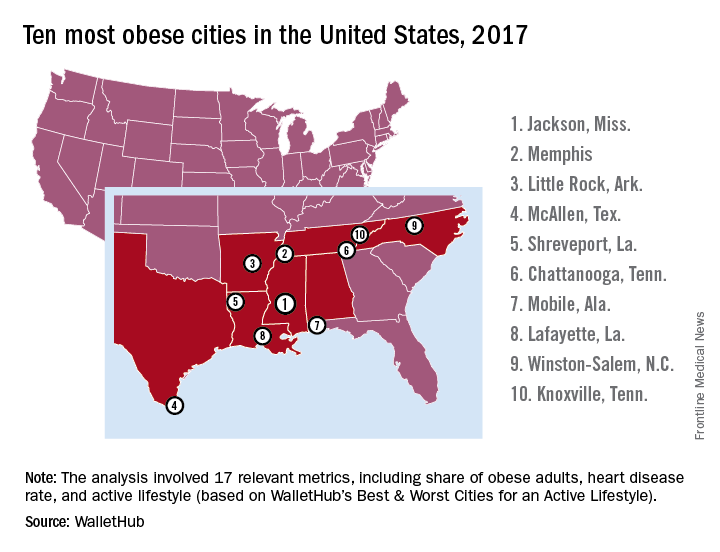
The second-most obese city for 2017 is Memphis, with Little Rock, Ark.; McAllen, Tex.; and Shreveport, La., occupying the rest of the top five. All of the cities in the top 10 – all of the cities in the top 20, actually – are located in the South, with the first non–Southern city (Indianapolis) making its appearance at number 21, the WalletHub analysis shows. At number 100 in the rankings is Seattle/Tacoma.
Data for the analysis came from the Centers for Disease Control and Prevention, County Health Rankings, the Department of Agriculture’s Economic Research Service, the Child and Adolescent Health Measurement Initiative, the Trust for America’s Health, and WalletHub’s own research, including its report Best & Worst Cities for an Active Lifestyle.
2016-2017 flu season continues to wind down
Influenza activity took another healthy step down as outpatient visits continued to drop, according to the Centers for Disease Control and Prevention.
The proportion of outpatient visits for influenza-like illness (ILI) was down to 3.2% for the week ending March 18, 2017, the CDC reported, compared with 3.6% the week before. (The figure of 3.7% previously reported for last week has been adjusted this week, so the halt in the decline in outpatient visits was actually more of a slowdown.) The national baseline for outpatient ILI visits is 2.2%.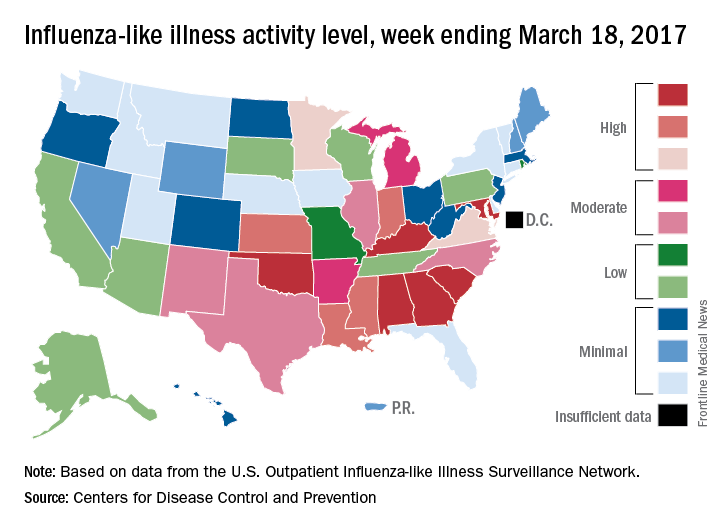
Two flu-related pediatric deaths were reported during the week of March 18, but both occurred earlier: one during the week ending Feb. 18 and the other in the week ending Feb. 25, the CDC reported. The total number of pediatric flu deaths reported is now 55 for the 2016-2017 season.
CDC reports two new Zika-related pregnancy losses
The first pregnancy losses with Zika-related birth defects since last summer were reported March 14 by the Centers for Disease Control and Prevention.
Two new cases were reported to the U.S. Zika Pregnancy Registry between Feb. 21 and March 14 – the time period covered by the most recent release of data from the CDC. That brings the total number of Zika virus–related pregnancy losses to seven since the beginning of 2016 in the 50 states and the District of Columbia, along with 54 liveborn infants with Zika-related birth defects. The CDC stopped reporting adverse pregnancy outcomes in Puerto Rico and the other U.S. territories in early October 2016 because Puerto Rico’s Zika Active Pregnancy Surveillance System is not using the same inclusion criteria as its mainland counterpart.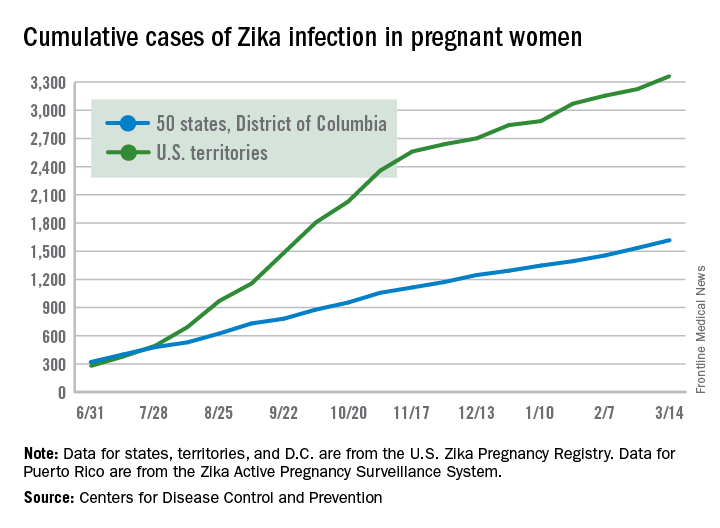
These are not real-time data and reflect only pregnancy outcomes for women with any laboratory evidence of possible Zika virus infection, although it is not known if Zika virus was the cause of the poor outcomes. Zika-related birth defects recorded by the CDC could include microcephaly, calcium deposits in the brain indicating possible brain damage, excess fluid in the brain cavities and surrounding the brain, absent or poorly formed brain structures, abnormal eye development, or other problems resulting from brain damage that affect nerves, muscles, and bones. The pregnancy losses encompass any miscarriage, stillbirth, or termination with evidence of birth defects.
U.S. influenza activity remains steady
The decline in U.S. influenza activity that started in February paused during the week ending March 11, according to the U.S. Centers for Disease Control and Prevention.
The proportion of outpatient visits for influenza-like illness (ILI) stayed at 3.7% for a second consecutive week after declining for 3 weeks in a row. The peak for the season, 5.2%, came during the week ending Feb. 11, CDC data show. The national baseline is 2.2%.
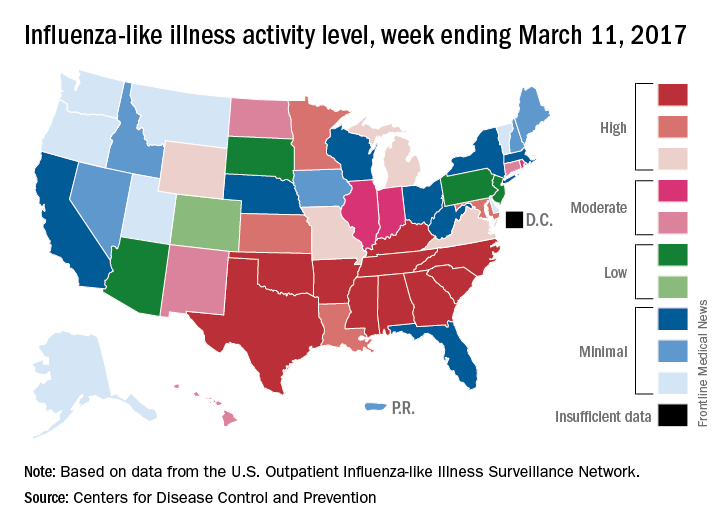
Five ILI-related pediatric deaths were reported to the CDC for the week – all of which occurred during previous weeks – bringing the total to 53 for the 2016-2017 season, the CDC said.
The decline in U.S. influenza activity that started in February paused during the week ending March 11, according to the U.S. Centers for Disease Control and Prevention.
The proportion of outpatient visits for influenza-like illness (ILI) stayed at 3.7% for a second consecutive week after declining for 3 weeks in a row. The peak for the season, 5.2%, came during the week ending Feb. 11, CDC data show. The national baseline is 2.2%.
Five ILI-related pediatric deaths were reported to the CDC for the week – all of which occurred during previous weeks – bringing the total to 53 for the 2016-2017 season, the CDC said.
Increased IUD use suggests ‘Trump effect’
Patient visits for IUD prescriptions and insertions were up 21% between October 2016 and January 2017, compared with those in the same period a year earlier, according to athenahealth, a provider of EHR systems and point-of-care mobile applications.
The rise in IUD-related visits since the presidential election – the first time in 5 years that the volume of visits for IUD procedures and follow-ups has increased in both November and December – suggests a “Trump effect.” As the replacement of the Affordable Care Act is debated, “uncertainly swirls over whether any new law would mandate free insurance coverage without copays for birth control and contraception devices,” athenahealth said.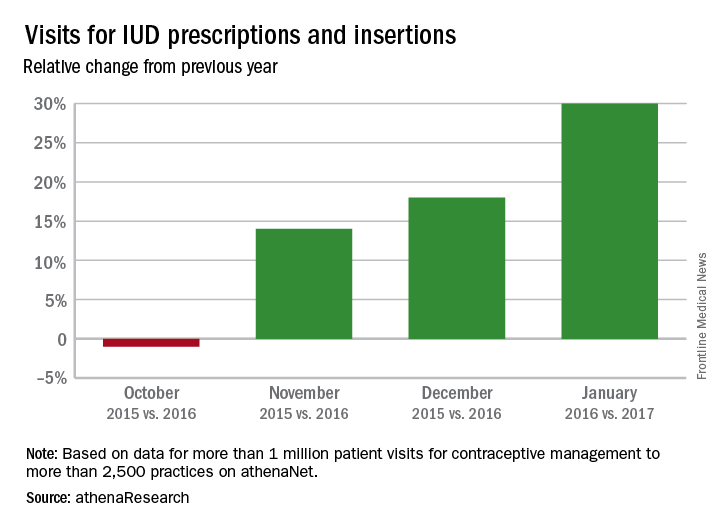
The athenahealth data include more than 1 million visits for IUD management to more than 2,500 practices using the company’s EHRs.
U.S. flu activity continues to decline
The 2016-2017 U.S. influenza season appears to have peaked, as activity measures dropped for the third consecutive week, the Centers for Disease Control and Prevention reported.
For the week ending March 4, there were 11 states at level 10 on the CDC’s 1-10 scale of influenza-like illness (ILI) activity, with another three in the “high” range at levels 8 and 9. The previous week (Feb. 25), there were 22 states at level 10, with a total of 27 in the high range of ILI activity. At the peak of activity during the week of Feb. 11, there were 25 states at level 10, data from the CDC’s Outpatient ILI Surveillance Network show.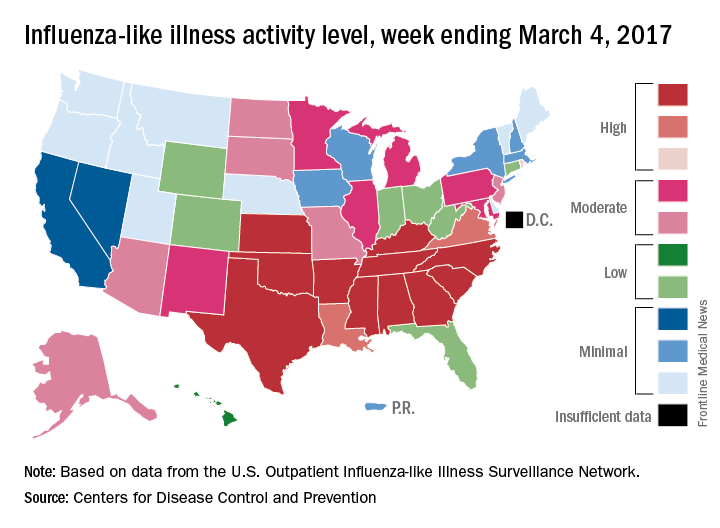
There were eight ILI-related pediatric deaths reported during the week ending March 4, although all occurred in earlier weeks. For the 2016-2017 season so far, 48 ILI-related pediatric deaths have been reported, the CDC said.
For the 70 counties in 13 states that report to the Influenza Hospitalization Surveillance Network, the flu-related hospitalization rate for the season is 43.5 per 100,000 population. The highest rate by age group is for those 65 years and over at 198.8 per 100,000, followed by 50- to 64-year-olds at 42.2 per 100,000 and children aged 0-4 years at 28.8 per 100,000, according to the CDC.
Social media may be isolating young adults
Among young adults, those who most frequently use social media are more likely to feel socially isolated than are less frequent users, according to results of a survey of almost 1,800 respondents.
Adults aged 19-32 years who were in the highest quartile of social media use – 58 or more times a week – had an adjusted odds ratio of 3.4 for perceived social isolation, compared with those in the lowest quartile, who reported using social media less than 9 times a week, said Brian A. Primack, MD, PhD, of the University of Pittsburgh and his associates (Am J Prev Med. 2017 Mar 6. doi: 10.1016/j.amepre.2017.01.010).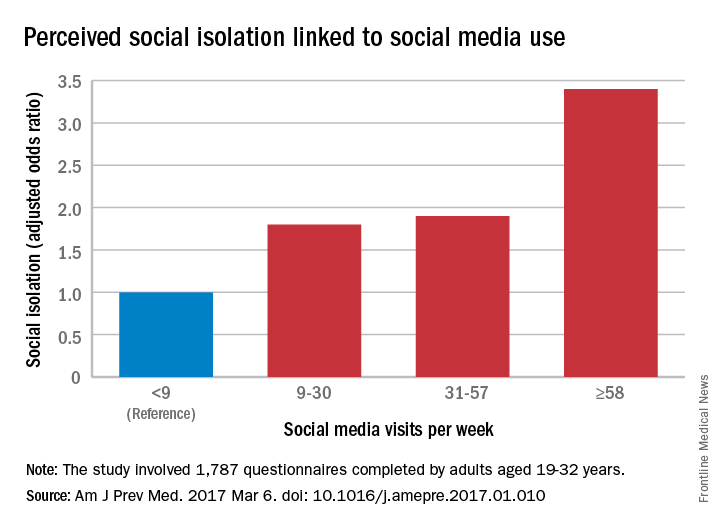
“We are inherently social creatures, but modern life tends to compartmentalize us instead of bringing us together. While it may seem that social media presents opportunities to fill that social void, I think this study suggests that it may not be the solution people were hoping for,” Dr. Primack said in a separate written statement.
The cross-sectional survey was conducted in October and November 2014, and the 11 social media platforms included were Facebook, Twitter, Google+, YouTube, LinkedIn, Instagram, Pinterest, Tumblr, Vine, Snapchat, and Reddit.
FROM THE AMERICAN JOURNAL OF PREVENTIVE MEDICINE