User login
Richard Franki is the associate editor who writes and creates graphs. He started with the company in 1987, when it was known as the International Medical News Group. In his years as a journalist, Richard has worked for Cap Cities/ABC, Disney, Harcourt, Elsevier, Quadrant, Frontline, and Internet Brands. In the 1990s, he was a contributor to the ill-fated Indications column, predecessor of Livin' on the MDedge.
Health care costs higher after prolonged ventilation
Postadmission health care costs varied considerably by the duration of patients’ in-hospital mechanical ventilation, according to a study of Canadian administrative databases.
Critically ill patients in the province of Ontario who received mechanical ventilation for more than 21 days (n = 3,891) had a median health care cost of $42,784 (all costs are in Canadian dollars) in the year after their discharge, compared with $13,005 for patients who were ventilated for 21 or fewer days (n = 78,984), reported Andrea D. Hill, PhD, of Sunnybrook Health Sciences Centre, Toronto, and her associates (Ann Am Thorac Soc. 2017;14[3]:355-62).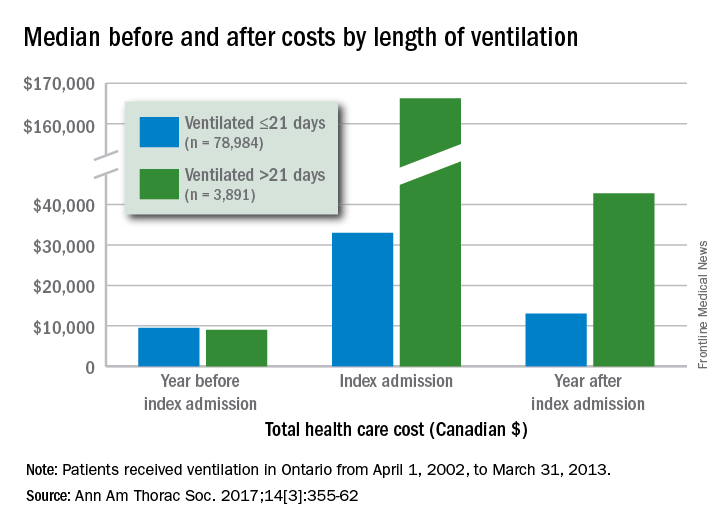
Dr. Hill and her associates also found that patients with longer-term ventilation were less likely to be discharged home (15% vs. 57%) and more likely to be readmitted after 6 months (36% vs. 29%) or 1 year (47% vs. 38%), but were not more likely to have an emergency department visit after 6 months (46% vs. 45%).
All patients received ventilation from April 1, 2002, to March 31, 2013. The population-based cohort study used four databases: the Canadian Institute of Health Information Discharge Abstract Database, the Ontario Health Insurance Plan database, the National Ambulatory Care Reporting System database, and the Ontario Registered Persons Database.
FROM ANNALS OF THE AMERICAN THORACIC SOCIETY
Skin disease costs $75 billion a year
The direct cost of treating skin diseases in the United States was almost $75 billion in 2013, according to a report on the burden of skin disease from the American Academy of Dermatology.
For the nearly 85 million Americans who were seen by a physician for a skin disease in 2013, about $45.9 billion was spent on medical costs such as office visits, procedures, and tests; $15 billion was spent on prescription drugs; and $4.1 billion went for vaccines and skin cancer screening. Another $10 billion was spent on OTC products, the AAD’s Burden of Skin Disease Work Group reported (J Am Acad Dermatol. 2017 Feb 24. doi: 10.1016/j.jaad.2016.12.043).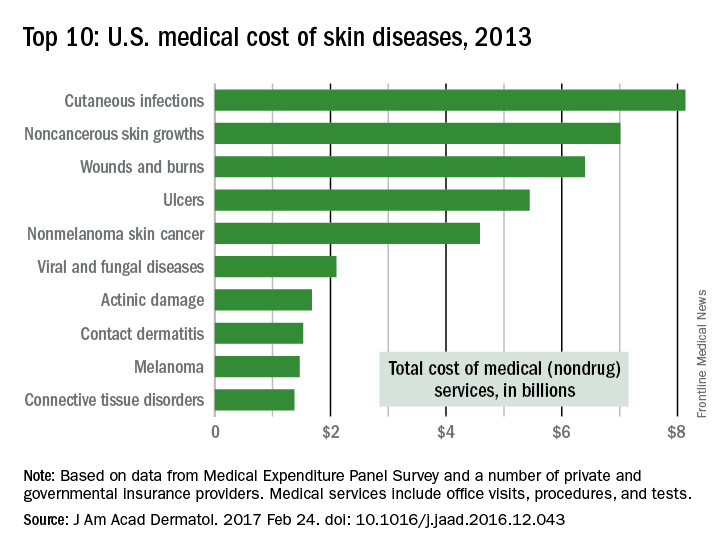
The per-capita cost of skin disease in 2013 was $213, compared with $950 per person for cardiovascular disease, $785 for diabetes, and $147 for end-stage renal disease, they noted.
In discussing the future burden of skin disease, the work group noted that the aging U.S. population and “the increased costs of currently in-use and newly developed dermatologic treatment options [need] to be addressed by an appropriate increase in dermatologic care providers.”
Zika-infected pregnancies continue to rise in U.S.
Reports of new cases of Zika infection in pregnant women held steady during the 2 weeks ending Feb. 21 as the number of new cases dropped in the territories and rose in the 50 states and D.C., according to the Centers for Disease Control and Prevention.
Compared with the previous 2-week period (Jan. 25-Feb.7), reports of new cases of pregnant women with laboratory evidence of Zika virus infection were up from 146 to 148, an increase from 61 to 79 in the states/D.C. and a decrease from 85 to 69 in the territories. The total number of Zika cases among pregnant women in the United States for 2016-2017 is 4,759, with 1,534 occurring in the states/D.C. and 3,225 in the territories, the CDC reported March 2.
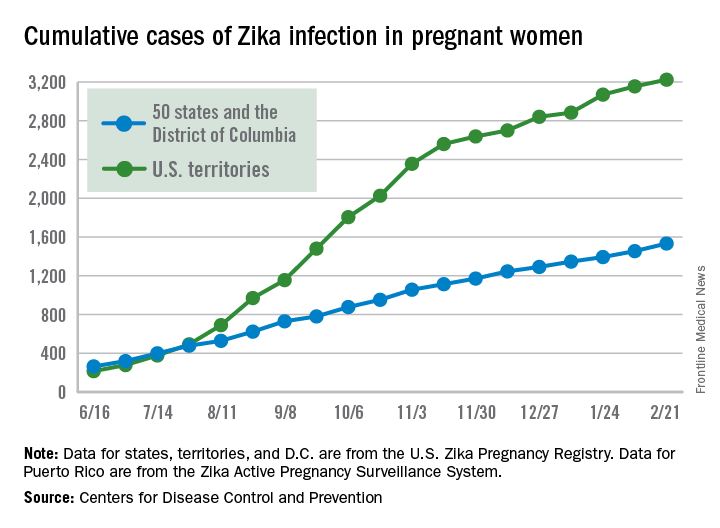
Among all Americans, the number of Zika cases reported is now up to 43,380 since Jan. 1, 2015, with 38,306 occurring in the territories and 5,074 in the states and D.C. The state with the most cases is Florida at 1,107, followed by New York at 1,007 and California with 431. Puerto Rico has reported 37,515 cases so far, and the U.S. Virgin Islands have reported 989, the CDC said.
The figures for states, territories, and the District of Columbia are reported to the U.S. Zika Pregnancy Registry; data for Puerto Rico are reported to the U.S. Zika Active Pregnancy Surveillance System. These are not real-time data and reflect only pregnancy outcomes for women with any laboratory evidence of possible Zika virus infection, although it is not known if Zika virus was the cause of the poor outcomes.
Zika-related birth defects recorded by the CDC could include microcephaly, calcium deposits in the brain indicating possible brain damage, excess fluid in the brain cavities and surrounding the brain, absent or poorly formed brain structures, abnormal eye development, or other problems resulting from brain damage that affect nerves, muscles, and bones. The pregnancy losses encompass any miscarriage, stillbirth, or termination with evidence of birth defects.
Reports of new cases of Zika infection in pregnant women held steady during the 2 weeks ending Feb. 21 as the number of new cases dropped in the territories and rose in the 50 states and D.C., according to the Centers for Disease Control and Prevention.
Compared with the previous 2-week period (Jan. 25-Feb.7), reports of new cases of pregnant women with laboratory evidence of Zika virus infection were up from 146 to 148, an increase from 61 to 79 in the states/D.C. and a decrease from 85 to 69 in the territories. The total number of Zika cases among pregnant women in the United States for 2016-2017 is 4,759, with 1,534 occurring in the states/D.C. and 3,225 in the territories, the CDC reported March 2.
Among all Americans, the number of Zika cases reported is now up to 43,380 since Jan. 1, 2015, with 38,306 occurring in the territories and 5,074 in the states and D.C. The state with the most cases is Florida at 1,107, followed by New York at 1,007 and California with 431. Puerto Rico has reported 37,515 cases so far, and the U.S. Virgin Islands have reported 989, the CDC said.
The figures for states, territories, and the District of Columbia are reported to the U.S. Zika Pregnancy Registry; data for Puerto Rico are reported to the U.S. Zika Active Pregnancy Surveillance System. These are not real-time data and reflect only pregnancy outcomes for women with any laboratory evidence of possible Zika virus infection, although it is not known if Zika virus was the cause of the poor outcomes.
Zika-related birth defects recorded by the CDC could include microcephaly, calcium deposits in the brain indicating possible brain damage, excess fluid in the brain cavities and surrounding the brain, absent or poorly formed brain structures, abnormal eye development, or other problems resulting from brain damage that affect nerves, muscles, and bones. The pregnancy losses encompass any miscarriage, stillbirth, or termination with evidence of birth defects.
Breast cancer mortality mapped for 2017
U.S. breast cancer mortality will be an estimated 25.3 per 100,000 females in 2017, with the highest state rates in the East and the lowest in the West and Midwest.
Approximately 40,600 breast cancer deaths are predicted for the year in the United States by the American Cancer Society in its Cancer Facts & Figures 2017, based on 2000-2014 data from the National Center for Health Statistics. With the U.S. population currently around 321 million, that works out to a completely unadjusted death rate of 25.3 per 100,000 women. Doing a little more math puts the highest death rate (29.8) in West Virginia and the lowest (18.8) in Utah.
The incidence rate for female breast cancer was 123.3 per 100,000 for 2009-2013, with that figure age adjusted to the 2000 U.S. standard population, according to data from the North American Association of Central Cancer Registries, the ACS reported.
Wyoming had the lowest incidence over that time period (109.6 per 100,000), and New Hampshire had the highest at 138.1. Utah had the fifth-lowest incidence in that period at 112.7, but West Virginia, the state with the highest estimated mortality for 2017, had a relatively low incidence of 114.4 in 2009-2013, the ACS said.
Colorectal cancer mortality highest in W.Va., lowest in Utah
Mortality from cancers of the colon and rectum is expected to be about 15.6 per 100,000 in 2017, with the highest rate in West Virginia and the lowest in Utah.
Approximately 50,260 colorectal cancer deaths are predicted for the year in the United States by the American Cancer Society in its Cancer Facts & Figures 2017, based on 2000-2014 data from the National Center for Health Statistics. With the population currently around 321 million, that works out to an expected death rate of 15.6 per 100,000 population. Doing a little more math produces death rates of 23.4 for West Virginia and 8.7 for Utah.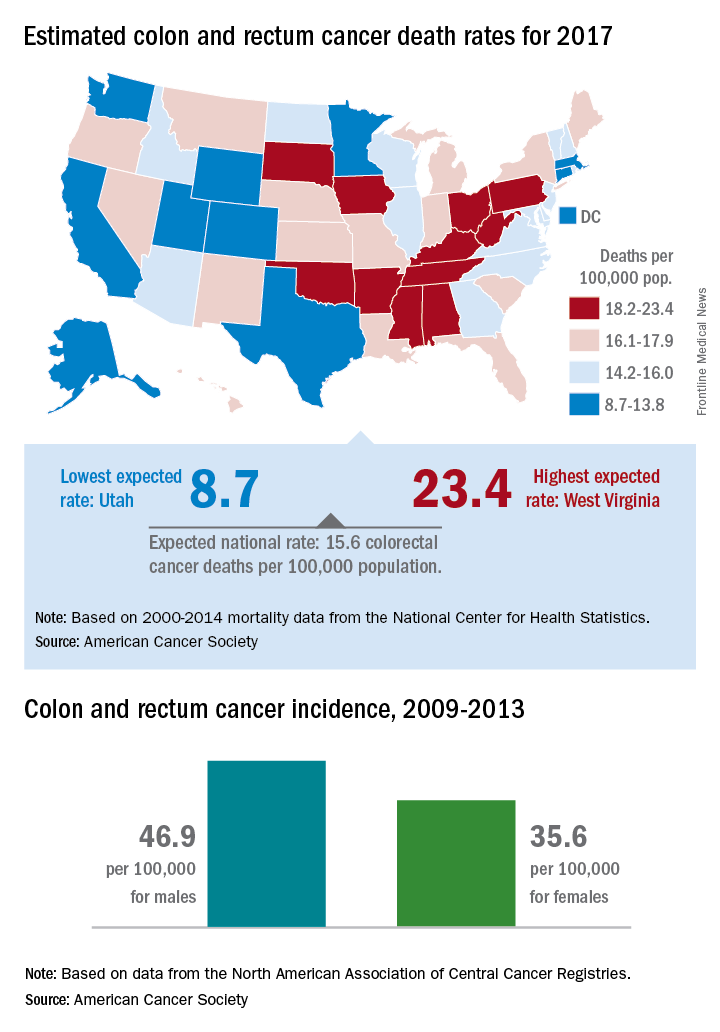
Utah had the lowest incidence rate over that time period for both men (36.1 per 100,000) and women (28.2 per 100,000), and Kentucky had the highest for both, with rates of 59.6 for men and 43.7 for women, the ACS said.
Humira Pen topped per-person drug spending in 2016
Humira Pen (adalimumab) was the most expensive drug in 2016 when ranked by spending per person, according to pharmacy benefits manager Express Scripts.
Total spending per person with employer-sponsored insurance was $45.11 last year for Humira Pen, which is indicated for rheumatoid arthritis, psoriatic arthritis, ankylosing spondylitis, Crohn’s disease, ulcerative colitis, and plaque psoriasis. Next in spending per person was Enbrel (etanercept) – another drug for arthritis, psoriatic arthritis, ankylosing spondylitis, and psoriasis – at $26.82, followed by the diabetes drug Lantus (insulin glargine) and two multiple sclerosis drugs: Tecfidera (dimethyl fumarate) and Copaxone (glatiramer), Express Scripts said in its “2016 Drug Trend Report.”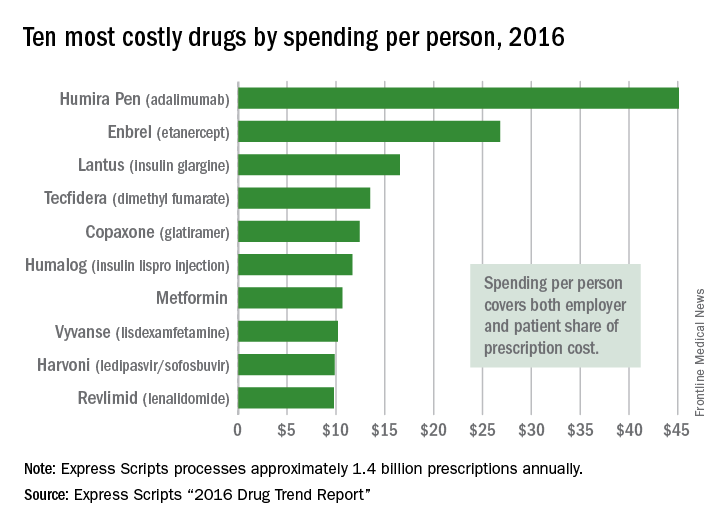
Humira Pen had the next-largest increase from 2015 – a mere 28% – while the hepatitis C drug Harvoni (ledipasvir/sofisbuvir) had the largest decrease in per-person spending among the top 10, dropping 54%, the report noted.
Express Scripts processes approximately 1.4 billion prescriptions annually for 85 million insured members from 3,000 client companies.
Outpatient flu visits down slightly
The overall national measure of outpatient flu activity was down for the week ending Feb. 18, and the number of states at the highest level of activity dropped from 25 to 24, according to the Centers for Disease Control and Prevention.
The national proportion of outpatient visits for influenza-like illness (ILI) decreased from 5.2% the previous week to 4.8% for the week ending Feb. 18, the CDC reported.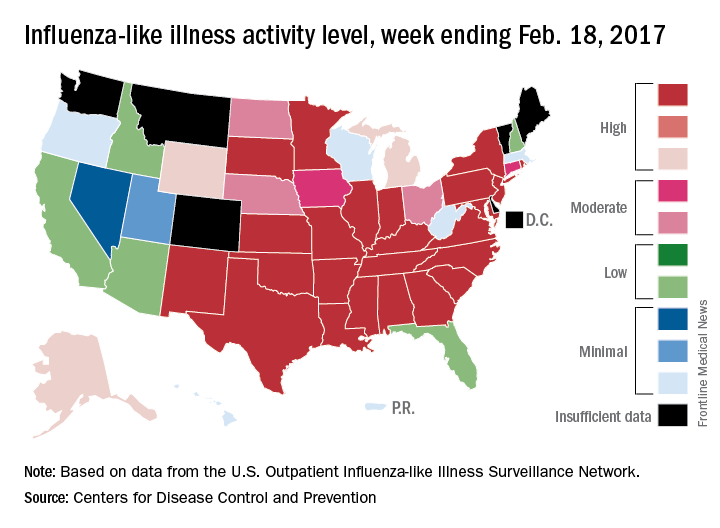
There were 5 ILI-related pediatric deaths reported during the week, bringing the total to 34 for the season so far, but none of the 5 occurred in the current week, the CDC said. There were 89 pediatric deaths reported during the 2015-2016 season, with the peak week occurring in late March/early April (11 deaths). During the 2014-2015 season, there were 148 deaths reported, and 111 were reported in 2013-2014.
Personal finances affect cancer survivors’ medication use
Adult cancer survivors under the age of 65 are more likely to alter their use of prescription drugs for financial reasons than are those without a history of cancer, according to a report published online Feb. 20.
Among nonelderly adults, 31.6% of those who had been diagnosed within the previous 2 years and 27.9% of those who had been diagnosed 2 or more years earlier reported a change in prescription drug use for financial reasons, compared with 21.4% of adults without a history of cancer, said Zhiyuan Zheng, PhD, of the American Cancer Society, Atlanta, and his associates (Cancer 2017 Feb 20. doi: 10.1002/cncr.30560).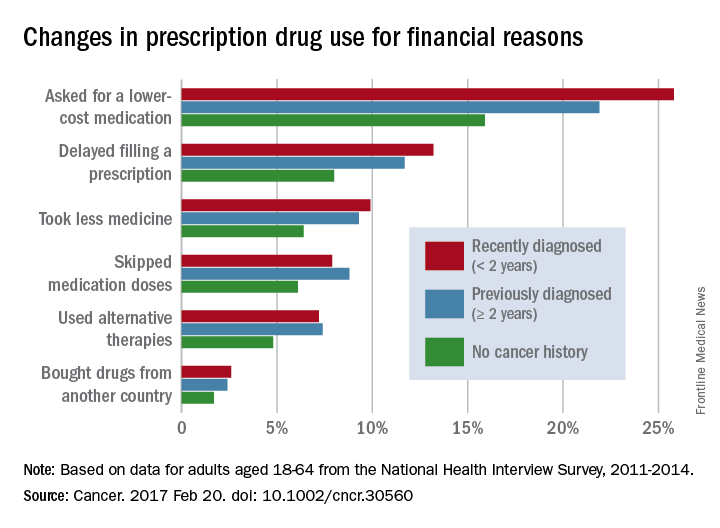
The differences between cancer survivors and those with no cancer history were much smaller for those aged 65 years and over: 24.9% of recent survivors and 21.8% of previous survivors changed their behavior for financial reasons, compared with 20.4% for those with no history of cancer, according to the analysis of data from the National Health Interview Survey for 2011-2014.
No funding source for the study was disclosed, and the investigators did not make any disclosures of conflicts of interest.
FROM CANCER
Twenty-five states at highest flu activity level
Flu activity in the United States continued to increase as half of the states reached the highest level of influenza-like illness (ILI) activity in the week ending Feb. 11, according to the Centers for Disease Control and Prevention.
For the week, the 25 states at level 10 on the CDC’s 1-10 scale of ILI activity were joined in the high range by Illinois and Kentucky at level 9 and Iowa at level 8, the CDC reported. The previous week, there were 23 states in the high range.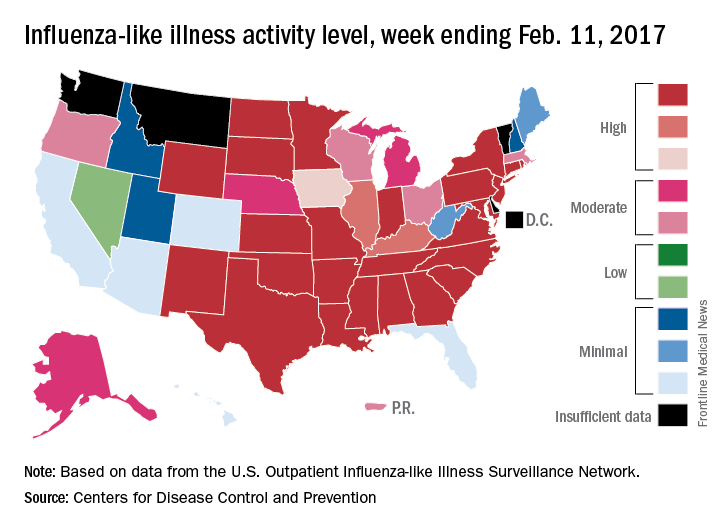
Of the nine flu-related pediatric deaths reported to the CDC during the latest week, eight occurred in earlier weeks. For the 2016-2017 season so far, 29 flu-related pediatric deaths have been reported, the CDC said.
Zika slowing, but not going away
New cases of pregnant women with laboratory evidence of Zika virus infection were down for the 2 weeks ending Feb. 7, with a big drop in the U.S. territories offsetting an increase among the 50 states and the District of Columbia, according to the Centers for Disease Control and Prevention.
There were 146 new cases of Zika infection reported in pregnant women over that period, compared with 233 over the previous 2 weeks. Of the new cases, 85 were reported in the U.S. territories (down from 186) and 61 were reported in the 50 states and D.C. (up from 47), the CDC reported. These are not real-time estimates, the CDC noted. They reflect only the number of reports received, so the cases may have occurred during earlier reporting periods.
Of the cases in the states/D.C., 1,047 pregnancies have been completed with or without birth defects. There have been 43 liveborn infants with Zika-related birth defects and five pregnancy losses with Zika-related defects, the CDC said. The number of liveborn infants was up from 38 for the previous 2-week span, which was the largest increase since mid-November.
The Zika caseload for all Americans is 42,063 (from Jan. 1, 2015 to Feb. 15, 2017), of which 5,040 cases were reported in the 50 states/D.C. and 37,023 were reported in the territories (98% in Puerto Rico), the CDC reported.
Zika-related birth defects reported by the CDC could include microcephaly, calcium deposits in the brain indicating possible brain damage, excess fluid in the brain cavities and surrounding the brain, absent or poorly formed brain structures, abnormal eye development, or other problems resulting from brain damage that affect nerves, muscles, and bones. The pregnancy losses encompass any miscarriage, stillbirth, and termination with evidence of birth defects.