User login
Richard Franki is the associate editor who writes and creates graphs. He started with the company in 1987, when it was known as the International Medical News Group. In his years as a journalist, Richard has worked for Cap Cities/ABC, Disney, Harcourt, Elsevier, Quadrant, Frontline, and Internet Brands. In the 1990s, he was a contributor to the ill-fated Indications column, predecessor of Livin' on the MDedge.
CDC: More preterm births after fertility treatments
Infants conceived through assisted reproductive technology (ART) represented less than 2% of all children born in the United States in 2014, but they experienced disproportionately large shares of adverse perinatal outcomes, according to the Centers for Disease Control and Prevention.
Of the 4.02 million children born in the United States in 2014, a total of 65,296 (1.6%) were conceived with ART procedures. ART-conceived children, however, represented 5.5% of all low-birth-weight infants (less than 2,500 g) and 5.6% of all very-low-birth-weight infants (less than 1,500 g). ART-conceived children also represented 4.7% of all preterm births (less than 37 weeks) in 2014 and 5.0% of all very preterm (less than 32 weeks) infants nationally, the CDC reported (MMWR Surveill Summ. 2017;66[SS-6]:1-24).
These poor outcomes are related, at least in part, to the effect of infertility treatment on multiple births. The percentage of triplets or higher-order infants among ART-conceived infants has decreased since 2000, but “the percentage of twin infants has remained persistently high,” the CDC noted. Multiple-birth infants represent 39.4% of all ART infants but only 3.5% of all infants, and ART-conceived multiple-birth infants represent 18.3% of all multiple-birth infants, the CDC said.
The multiple-birth effect varied considerably by state, however. In Hawaii, ART-conceived multiple-birth infants accounted for 37.3% of all multiple births in 2014, while Alaska and West Virginia both had rates of 5.5%. Poor outcomes also varied by state: In Massachusetts, ART infants represented 14.2% of all low-birth-weight infants, compared with 1.2% in West Virginia. Massachusetts had the highest rate of ART preterm infants to all infants, 13.4%, and Puerto Rico had the lowest, 1.2%, according to the CDC report, which was based on data from the National ART Surveillance System.
Puerto Rico’s rate of 364 ART procedures per 1 million women aged 15-44 years was the lowest in the country, and the highest rate belonged to Massachusetts at 6,726 per 1 million women aged 15-44 years.
FROM MMWR SURVEILLANCE SUMMARIES
Flu activity levels high in 23 states
The number of states at the highest level of flu activity jumped from 7 to 19 during the week ending Feb. 4, 2017, according to the Centers for Disease Control and Prevention.
The 19 states at level 10 on the CDC’s 1-10 scale of influenza-like illness (ILI) activity were largely concentrated in the South and lower Midwest, with another grouping mainly in the Mid-Atlantic. They were joined in the “high” range of ILI activity by four other states: Indiana and Minnesota at level 9 and New Mexico and Virginia at level 8, the CDC reported.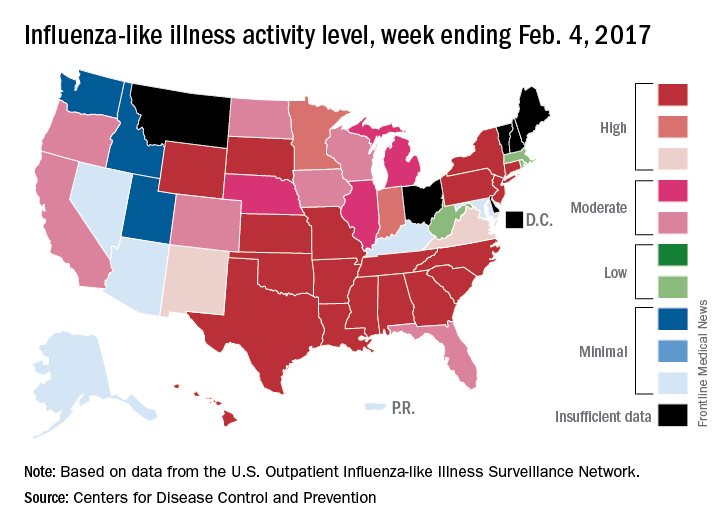
For the 2016-2017 season, 20 flu-related pediatric deaths have been reported: 5 were reported during the week ending Feb. 4, but 4 occurred during the week ending Jan. 28 and 1 occurred during the week ending Jan. 14, according to the CDC.
Since Oct. 1, 2016, there have been 6,804 laboratory-confirmed flu-related hospitalizations reported in the 13 states – including California, Georgia, New York, and Ohio – of the CDC’s Influenza Hospitalization Surveillance Network, for an overall hospitalization rate of 24.3 per 100,000 population. That rate, however, is “likely to be an underestimate as influenza-related hospitalizations can be missed, either because testing is not performed, or because cases may be attributed to other causes of pneumonia or other common influenza-related complications,” the CDC said.
Increase in U.S. drug spending slowed in 2016
Prescription drug spending for those with employer-sponsored insurance increased by 3.8% in 2016, compared with a rise of 5.2% in 2015, according to pharmacy benefits manager Express Scripts.
Commercial plans managed by Express Scripts saw the cost of prescription drugs rise by 2.5% per person, while utilization was up by 1.3%, which adds up to the 3.8% overall increase. That represents a 27% drop from 2015, when drug use rose 2.0% and costs went up by 3.2%, Express Scripts said in its “2016 Drug Trend Report.”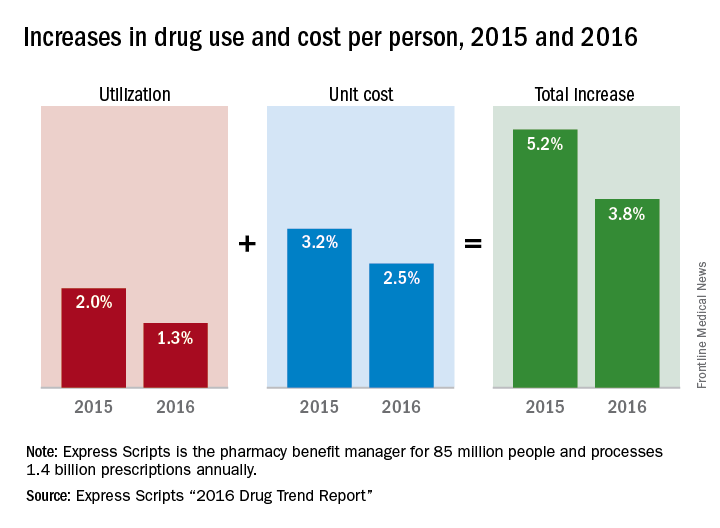
For a second consecutive year, patients of pharmacy plans managed by Express Scripts had a smaller out-of-pocket share of their total pharmacy costs, 14.6%, compared with 14.8% in 2015. That smaller share did represent an increase from $11.25 in 2015 to $11.34 in 2016, however, as the adjusted total cost per prescription rose from $75.85 to $77.84, Express Scripts said.
The company is the largest pharmacy benefits manager in the country, according to its corporate overview, processing 1.4 billion prescriptions annually for 85 million people.
Locum tenens physicians more popular than ever
Use of locum tenens physicians reached a new high in 2016, according to an annual survey by Staff Care, a health care staffing company.
Last year, 94% of hospitals, medical groups, and other health care facilities reported using temporary physicians, compared with 91% in 2014, which was the previous high, Staff Care reported in its “2017 Survey of Temporary Physician Staffing Trends.”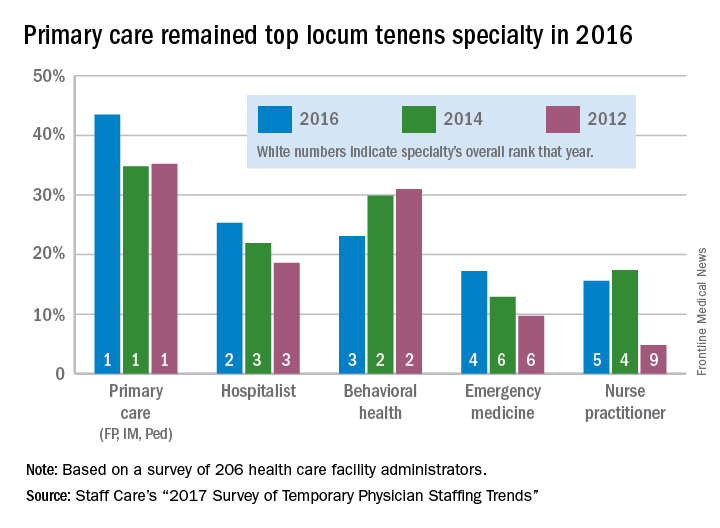
Primary care physicians (family physicians, internists, and pediatricians) were the leading locum tenens choice by specialty, with 43.5% of health care facilities reporting their use in 2016. Hospitalists were the next most popular specialists at 25%, followed by behavioral health professionals (23%), emergency physicians (17%), and nurse practitioners (16%), according to survey responses from 206 administrators of health care facilities.
Since about one-third of U.S. physicians practice primary care, “it is not particularly surprising that they are more utilized as locum tenens,” the report noted, but “only about 3.5% of all physicians are psychiatrists, [so] the fact that behavioral health professionals are the third most utilized type of locum tenens provider underlines the acute shortage of providers in this field.”
High levels of flu activity reported in 15 states
Fifteen states experienced high levels of flu activity for the week ending Jan. 28 as the 2016-2017 season moved past last season’s peak, according to the Centers for Disease Control and Prevention.
The proportion of outpatient visits for influenza-like illness (ILI) was 3.9% for the week ending Jan. 28, 2017, the CDC reported. That level is higher than the national baseline level of 2.2% and higher than the peak of 3.6% for the 2015-2016 season.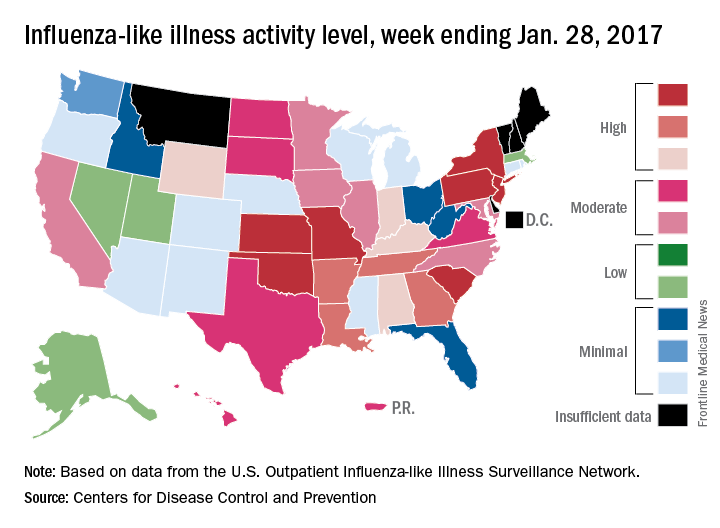
The week also brought reports of seven flu-related pediatric deaths, although five actually occurred during previous weeks. There have now been 15 flu-related pediatric deaths during the 2016-2017 season, the CDC reported.
New Zika-infected pregnancies down for most of United States
New cases of Zika infection in pregnant women were down again for the 50 states over the 2-week reporting period ending Jan. 24, but U.S. territories saw a big increase, according to the Centers for Disease Control and Prevention.
It is important to note, however, that Puerto Rico, where most U.S. Zika cases are occurring, has been retroactively reporting cases for months, which can result in larger-than-normal increases.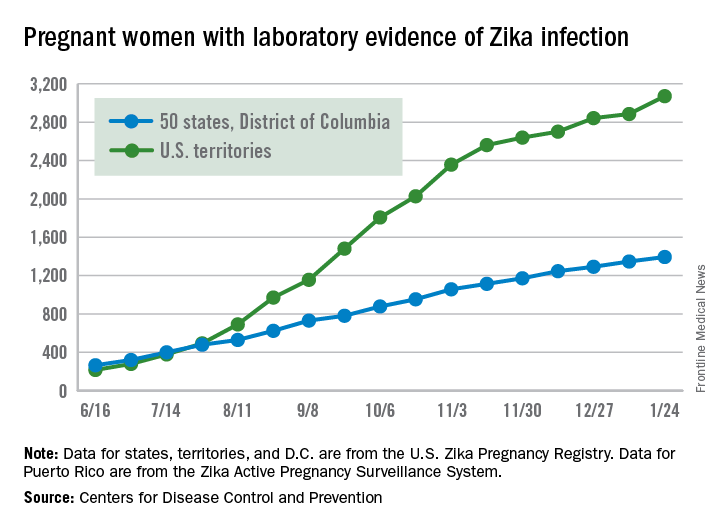
The territories had 186 new cases of pregnant women with laboratory evidence of Zika virus infection for the 2 weeks ending Jan. 24, compared with 43 for the previous 2-week period. The corresponding numbers for the 50 states and the District of Columbia were 47 (Jan. 24) and 55 (Jan. 10), the CDC data show.
So far for 2016-2017, there have been 4,465 pregnant women reported to have Zika virus infection in the United States: 3,071 in the territories and 1,394 in the 50 states and D.C., according to the U.S. Zika Pregnancy Registry (states, territories, and the District of Columbia) and the U.S. Zika Active Pregnancy Surveillance System (Puerto Rico).
Of the nearly 1,400 state/D.C. Zika-infected pregnancies, 999 have been completed, with 38 infants born with birth defects and 5 defect-related pregnancy losses, the CDC said. There have been no Zika-related pregnancy losses reported in the states/D.C. since late June. The CDC is no longer reporting adverse pregnancy outcomes for the territories because Puerto Rico is not using the same inclusion criteria.
Among all Americans in 2015-2017, there have been 41,387 cases of Zika infection as of Feb. 1. Of that total, 35,334 cases, which is more than 85%, have occurred in Puerto Rico, according to data from the CDC’s Arboviral Disease Branch.
Zika-related birth defects reported by the CDC could include microcephaly, calcium deposits in the brain indicating possible brain damage, excess fluid in the brain cavities and surrounding the brain, absent or poorly formed brain structures, abnormal eye development, or other problems resulting from brain damage that affect nerves, muscles, and bones. The pregnancy losses encompass any miscarriage, stillbirth, and termination with evidence of birth defects.
Increase brings flu activity back to seasonal high
for the week ending Jan. 21, compared with three states the week before, according to the Centers for Disease Control and Prevention.
Alabama, Kansas, New Jersey, Oklahoma, and South Carolina were at level 10 on the CDC’s 1-10 scale of ILI activity, with Oklahoma reaching that level for the third consecutive week. Georgia (level 9) and Louisiana, Minnesota, Missouri, and Tennessee (level 8) were also in the “high” range, the CDC reported.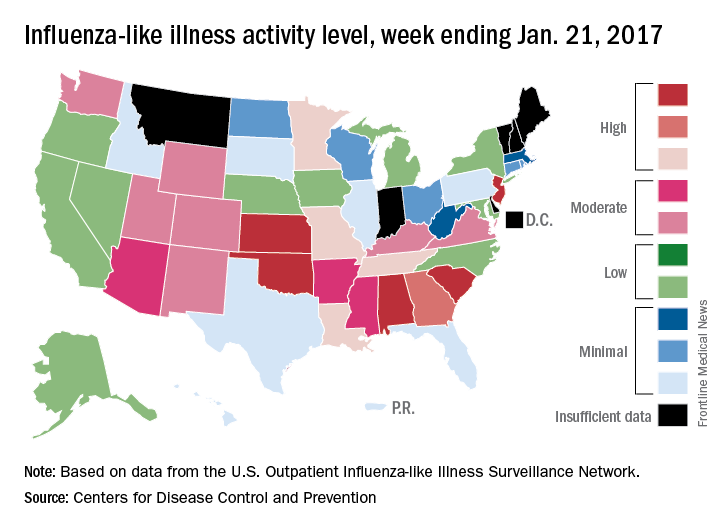
Three flu-related pediatric deaths were reported for the week, although two occurred during the week ending Jan. 14. The two earlier deaths were associated with an influenza A (H3) virus, and the more recent death was associated with an influenza B virus. For the 2016-2017 season so far, there have been a total of eight pediatric deaths, the CDC said.
Substantial long-term increase seen in multiple myeloma survival
The 5-year survival rate for multiple myeloma increased eightfold over an approximately 60-year span starting in the early 1950s, said Ali H. Mokdad, PhD, and his associates.
Patients with multiple myeloma had a 5-year relative survival rate of 6% in 1950-1954, compared with 49.8% in 2008-2013, according to data from the Surveillance, Epidemiology, and End Results Program (JAMA 2017;317[4]:388-406).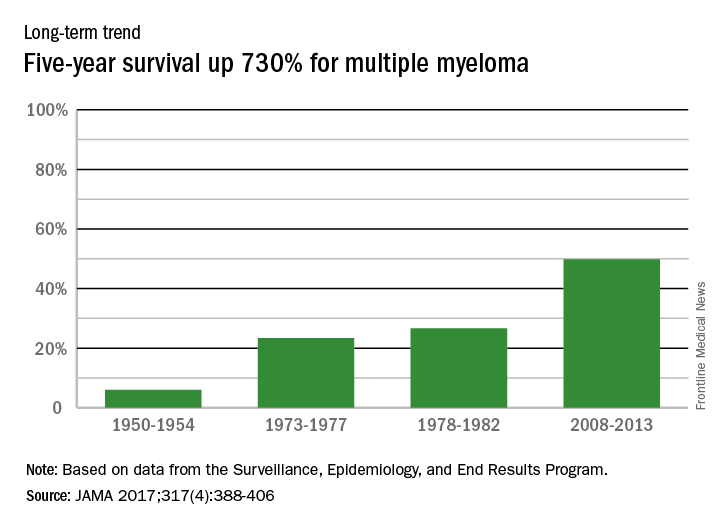
In 2014, there were about 13,000 deaths resulting from multiple myeloma, with 219,000 years of life lost, which ranked 17th among the 29 selected cancers, noted Dr. Mokdad and his associates at the Institute for Health Metrics and Evaluation at the University of Washington, Seattle.
FROM JAMA
AML leads percent gains in 5-year survival among leukemias
Over the 60-year span from the early 1950s to 2013, the 5-year survival rate for all leukemias increased by 500%, according to data from the Surveillance, Epidemiology, and End Results Program.
For 2008-2013, the 5-year relative survival rate for all leukemias was 60.1%, compared with 10% during 1950-1954, said Ali H. Mokdad, PhD, and his associates at the Institute for Health Metrics and Evaluation at the University of Washington, Seattle (JAMA 2017;317[4]:388-406).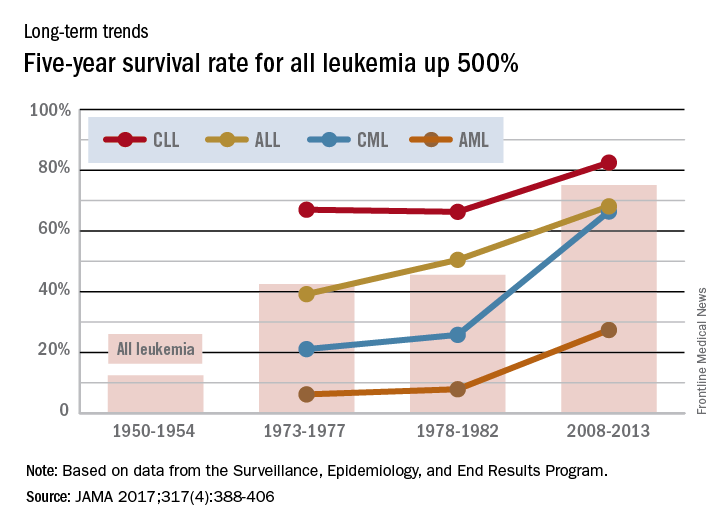
Long view shows doubling of survival in non-Hodgkin lymphoma
Five-year survival for patients with non-Hodgkin lymphoma has more than doubled since the early 1950s, according to Ali H. Mokdad, PhD, and his associates.
Data from the Surveillance, Epidemiology, and End Results Program show that the 5-year relative survival rate for non-Hodgkin lymphoma in the United States went from 33% in 1950-1954 to 71.2% in 2008-2013, an increase of 116%, Dr. Mokdad and his associates reported (JAMA 2017;317[4]:388-406).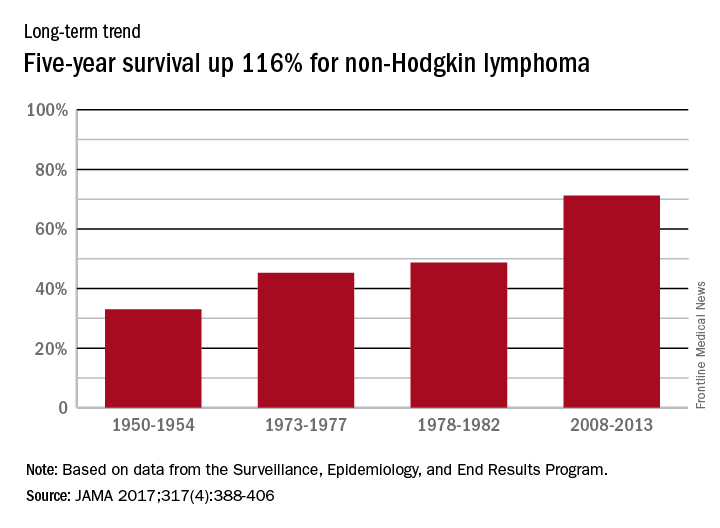
In 2014, mortality for non-Hodgkin lymphoma was the 7th highest among the 29 cancers included in the study, and more than 487,000 years of life were lost, which put it 6th among the 29 cancers, said Dr. Mokdad and his associates from the Institute for Health Metrics and Evaluation at the University of Washington, Seattle.
FROM JAMA