User login
Richard Franki is the associate editor who writes and creates graphs. He started with the company in 1987, when it was known as the International Medical News Group. In his years as a journalist, Richard has worked for Cap Cities/ABC, Disney, Harcourt, Elsevier, Quadrant, Frontline, and Internet Brands. In the 1990s, he was a contributor to the ill-fated Indications column, predecessor of Livin' on the MDedge.
Hodgkin lymphoma survival has nearly tripled since the 1950s
Five-year relative survival for Hodgkin lymphoma increased 189% over the approximately 60 years from the early 1950s to 2013, according to investigators looking at data from the Surveillance, Epidemiology, and End Results Program.
During 1950-1954, the 5-year relative survival rate for Hodgkin lymphoma was 30%, compared with 86.6% in 2008-2013, said Ali H. Mokdad, PhD, and his associates at the Institute for Health Metrics and Evaluation at the University of Washington, Seattle.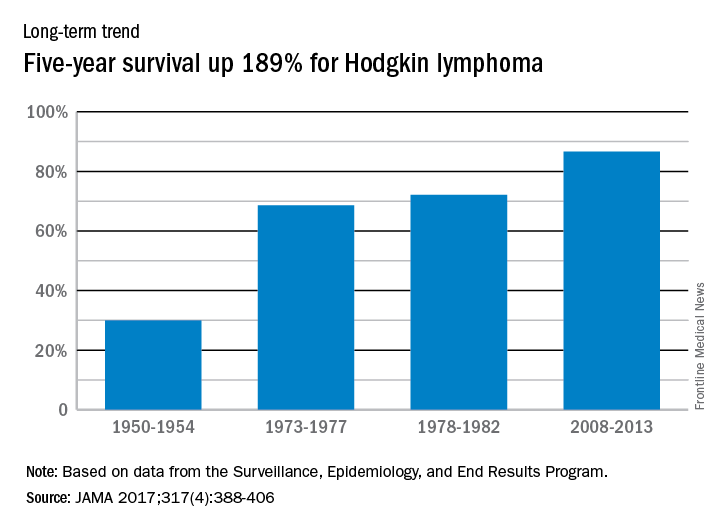
In 2014, mortality for Hodgkin lymphoma was 0.4 per 100,000 population, which put it 27th among the 29 included cancers, with about 36,000 years of life lost, which was 26th of the 29 cancers, Dr. Mokdad and his associates said. This part of their study used deidentified death records from the National Center for Health Statistics and population counts from the Census Bureau, the NCHS, and the Human Mortality Database.
FROM JAMA
Flu activity up slightly, but still down from seasonal peak
After rising to a high point for the season in the last week of 2016, influenza activity dropped a bit in the first week of the new year but then rose again in the second week, according to the Centers for Disease Control and Prevention.
As measured by outpatient visits for influenza-like illness (ILI), activity slipped from 3.4% at the end of 2016 to 3.2% for the week ending Jan. 7 but then ticked up to 3.3% for the week ending Jan. 14, the CDC reported. The national baseline level of outpatient visits is 2.2% for ILI, which is defined as fever (temperature of 100° F or greater) and cough and/or sore throat.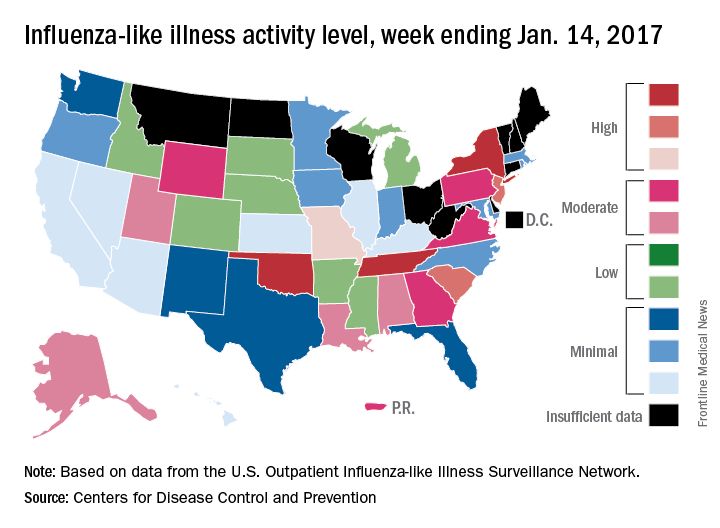
Two influenza-related pediatric deaths were reported for the week ending Jan. 14, although both occurred in earlier weeks: one during the week ending Dec. 10 and one during the week ending Jan. 7. So far for the 2016-2017 season, a total of five flu-related pediatric deaths have been reported, according to the CDC.
Zika virus slowdown continues
Zika activity is slowing as winter progresses, with less than a hundred new cases of pregnant women with laboratory evidence of infection reported over the 2 weeks ending Jan. 10, according to data from the Centers for Disease Control and Prevention.
The most recent CDC data show that, for the first time since early August, the majority of new cases of Zika infection among pregnant women were reported in the 50 states and the District of Columbia, compared with the U.S. territories. There were a total of 98 new cases, with 55 reported in the states and 43 in the U.S. territories.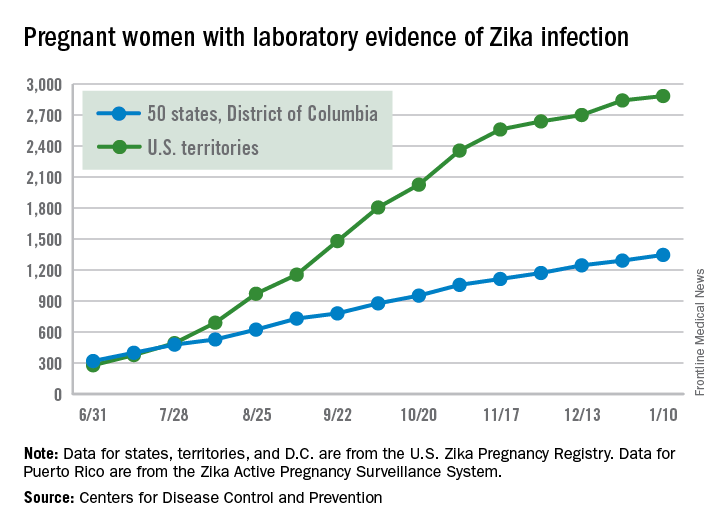
The total number of Zika-infected pregnant women in the United States is now 4,232 for 2016-2017. There have been 2,885 cases in the territories and 1,347 cases reported in the states/D.C. Among the cases in the states/D.C., 940 pregnancies have been completed, with Zika-related birth defects seen in 37 live-born infants and five pregnancy losses, the CDC said. The CDC is no longer reporting adverse pregnancy outcomes for the territories because Puerto Rico is not using the same inclusion criteria.
Zika cases among all Americans are still being reported weekly by the CDC, and the increase there has slowed as well: Total cases were up by 146 for the week ending Jan. 18, compared with 294 and 205 for each of the previous 2 weeks, according to CDC reports.
Zika-related birth defects reported by the CDC could include microcephaly, calcium deposits in the brain indicating possible brain damage, excess fluid in the brain cavities and surrounding the brain, absent or poorly formed brain structures, abnormal eye development, or other problems resulting from brain damage that affect nerves, muscles, and bones. The pregnancy losses encompass any miscarriage, stillbirth, and termination with evidence of birth defects.
CKD death rate highest in Mexico
A global measure of chronic kidney disease dropped by 3.9% from 2005 to 2015, but CKD remains a top-10 burden in 63 countries, according to the Global Burden of Disease 2015 study.
The age-standardized rate of years of life lost (YLL) for CKD dropped by 3.9%, even though its global YLL rank rose from 21st to 17th and total CKD mortality was up by almost 32%, the Global Burden of Disease 2015 Mortality and Causes of Death Collaborators reported (Lancet. 2016 Oct 8;388[10053]:1459-544). The increase in the number of deaths comes largely “because of improved estimates within countries with large populations such as China, India, and Russia,” the collaborators pointed out.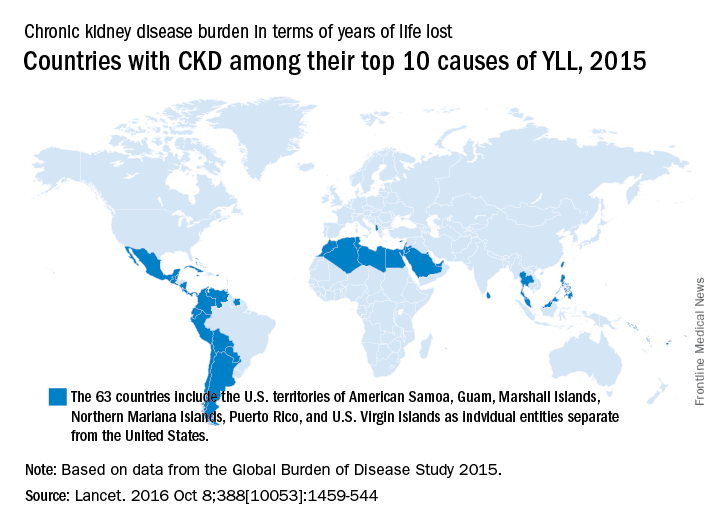
“In 2015, Latin America had the highest chronic kidney disease death rates in the world. Within Mexico, the country with the highest chronic kidney disease death rate, more than half of patients with incident end-stage renal disease have an underlying diagnosis of diabetes mellitus,” the investigators wrote.
The study is funded by the Bill & Melinda Gates Foundation.
FROM THE LANCET
Smoking-cessation interest and success vary by race, ethnicity
Just over 55% of adult cigarette smokers made an attempt to quit in the past year, and 7.4% said that they recently quit, according to investigators from the Centers or Disease Control and Prevention.
Data from the 2015 National Health Interview Survey (NHIS) show that 68% of cigarette smokers were interested in quitting, with considerable variation seen according to race and ethnicity (MMWR. 2017;65[52]:1457-64).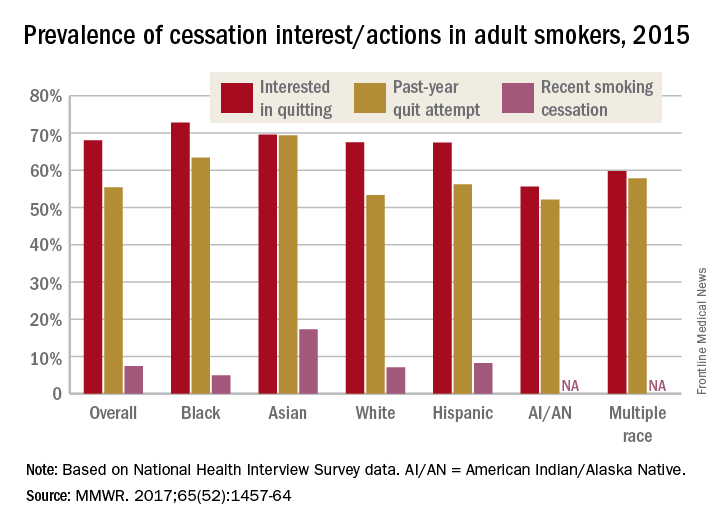
American Indian/Alaska Native smokers were the least likely to be interested in quitting (55.6%) and to have attempted to quit (52.1%), but the sample size was too small to report a reliable quit rate. The amount of survey participants of multiple races was also too small to report a reliable quit rate. Among that group, 59.8% were interested in quitting and 57.8% had attempted to quit in the past year, the NHIS data showed.
The sizes of surveyed populations for individual races and ethnicities were not reported, but the total sample size for the 2015 NHIS was 33,672.
Most cigarette smokers attempt to quit without evidence-based techniques
More than half of cigarette smokers have received advice to quit from a health care professional, but less than a third used medication or counseling in their cessation attempt, according to investigators from the Centers for Disease Control and Prevention.
In 2015, just over 57% of adult smokers said that a health care professional had advised them to quit in the past year. Of those who tried to quit, 29% used medication such as nicotine patches or gum, varenicline, or bupropion; 7% used counseling (including a stop-smoking clinic, class, or support group and a telephone help line); and 31% used counseling and/or medication, the investigators reported (MMWR 2017;65[52]:1457-64).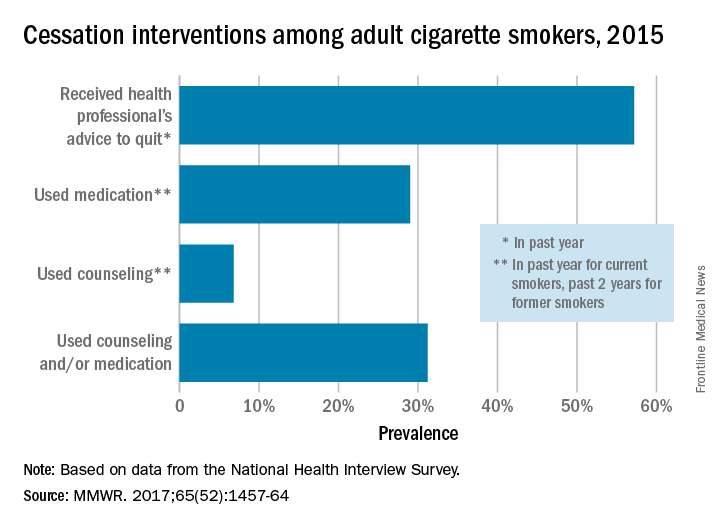
With the overall cessation rate at less than 10%, “it is critical for health care providers to consistently identify smokers, advise them to quit, and offer evidence-based cessation treatments, and for insurers to cover and promote the use of these treatments and remove barriers to accessing them,” the investigators wrote.
FROM MMWR
Survey: Docs see health care improvements as unlikely in 2017
Physicians appear to be quite pessimistic about the chances for improving health care quality, costs, and access in 2017, according to a survey conducted by InCrowd, a market insights technology firm.
Of the 150 physicians who responded to the 3-minute “mobile microsurvey” conducted on Dec. 4, 2016, 70% said it was unlikely that the cost of health care would improve under the incoming Trump administration, 69% said it was unlikely that access to care would improve, and 60% said it was unlikely that the quality of health care would improve, InCrowd reported.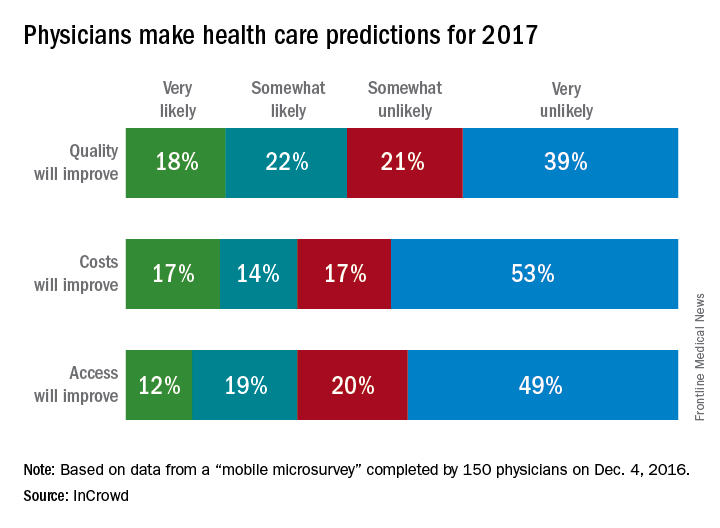
High levels of flu activity in 10 U.S. states
The 2016-2017 flu season shifted into high gear at the end of calendar year 2016, as four states were reported to be at the highest level of flu activity and six others were close behind, according to the Centers for Disease Control and Prevention.
For the week ending Dec. 31, 2016, Georgia, New Jersey, Oklahoma, and Oregon were at level 10 on the CDC’s 1-10 scale of influenza-like illness (ILI). Others in the “high” range were New York at level 9 and Alabama, Louisiana, Missouri, South Carolina, and Utah at level 8. Puerto Rico was also at level 8, after being at level 10 for the previous few weeks. An additional 10 states were in the “moderate” range (6-7), the CDC reported.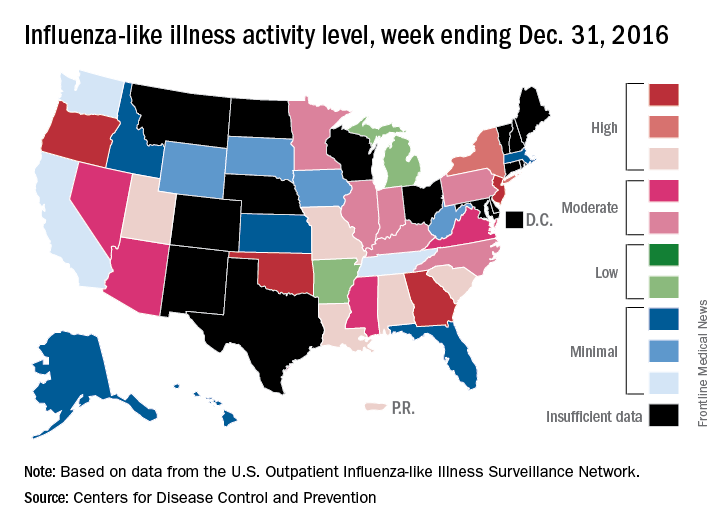
The CDC has not reported any flu-related pediatric deaths yet this season. Pediatric death totals for each of the last 3 years were 111 for 2013-2014, 148 for 2014-2015, and 89 for 2015-2016, the CDC said.
United States about to top 40,000 Zika cases
The number of pregnant women with laboratory evidence of Zika infection jumped up a bit at the end of 2016, and the United States approached 40,000 Zika cases among all Americans at the beginning of the new year, according to reports from the Centers for Disease Control and Prevention.
There were 187 additional pregnant women with Zika virus infection reported in the 2 weeks ending Dec. 27, compared with the 136 new reports of infected women in each of the two previous comparable periods (Dec. 1-13 and Nov. 18-30). Most of the 187 new cases were reported in the U.S. territories, while 46 were reported in the 50 states and the District of Columbia. There have been delays in reporting, the CDC noted, so these cannot be considered real-time estimates.
For the 2 weeks ending Dec. 27, there were reports of two more infants born with Zika-related birth defects, bringing the total to 36 for the states/D.C. The CDC is no longer reporting adverse pregnancy outcomes for the territories because Puerto Rico is not using the same inclusion criteria. The number of pregnancy losses remains at five in the states/D.C., where it has been since August. Aggregated data from the U.S. Zika Pregnancy Registry show that there have been 875 completed pregnancies with or without birth defects, the CDC said.
Zika-related birth defects reported by the CDC could include microcephaly, calcium deposits in the brain indicating possible brain damage, excess fluid in the brain cavities and surrounding the brain, absent or poorly formed brain structures, abnormal eye development, or other problems resulting from brain damage that affect nerves, muscles, and bones. The pregnancy losses encompass any miscarriage, stillbirth, and termination with evidence of birth defects.
Fewer people having problems with medical bills
The number of people under age 65 years who were in families having trouble paying medical bills dropped by more than 22% from 2011 to 2016, according to the National Center for Health Statistics.
For the first 6 months of 2016, there were 43.8 million people, or 16.2% of the population under age 65 years, who were in families that had problems paying medical bills in the past year, which was down from 56.5 million (21.3 % of the population) in 2011, the NCHS reported.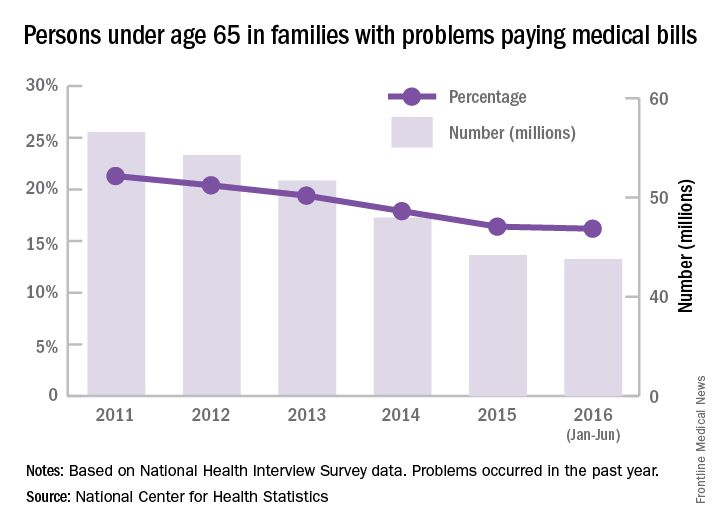
The drop was consistent across race/ethnicity lines, but not the start and endpoints. The percentage of non-Hispanic blacks in families having trouble paying their medical bills dropped from 27.3% in 2011 to 23% in 2016, although there was actually a small increase from 2015 to 2016. Hispanics dropped from 24.3% in 2011 to 17.4% in 2016, non-Hispanic whites dropped from 19.8% to 15.1%, and non-Hispanic Asians went from 11% to 6%, according to data collected from 579,379 people for the National Health Interview Survey.