User login
Richard Franki is the associate editor who writes and creates graphs. He started with the company in 1987, when it was known as the International Medical News Group. In his years as a journalist, Richard has worked for Cap Cities/ABC, Disney, Harcourt, Elsevier, Quadrant, Frontline, and Internet Brands. In the 1990s, he was a contributor to the ill-fated Indications column, predecessor of Livin' on the MDedge.
Hawaii continues to top ‘America’s Health Rankings’
2016 has been a year full of surprises, but not when it comes to the state leading “America’s Health Rankings.” For the fifth consecutive year, Hawaii has been named the healthiest state by the United Health Foundation’s annual report.
Also not a surprise was Mississippi’s 50th-place finish. The Magnolia State most recently finished last in 2014 and has never finished out of the bottom three in the annual ranking. Hawaii, on the other hand, has finished first eight times in the 27 years of the rankings – more than any other state – and has never finished out of the top six, according to the foundation’s 2016 report.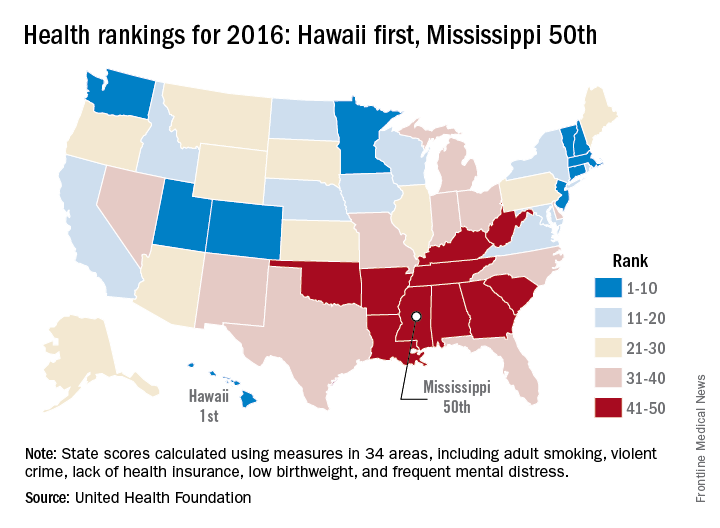
The other states ranked in the top five were well behind Hawaii’s score of 0.905 (representing the weighted standard deviation relative to the U.S. value): Massachusetts was second at 0.760, followed by Connecticut (0.747), Minnesota (0.727), and Vermont (0.709). Just above Mississippi’s score of –1.123 were Louisiana (–1.043), Arkansas (–0.834), Alabama (–0.793), and Oklahoma (–0.691), the foundation reported.
The report ranks states using 34 measures in five broad areas: behaviors, community and environment, policy, clinical care, and outcomes. Measures include drug death rate, air pollution, child immunization rate, preventable hospitalization rate, and premature death rate.
“America’s Health Rankings” is a joint effort by the United Health Foundation and the American Public Health Association. It is funded entirely by the private, not-for-profit United Health Foundation, founded by UnitedHealth Group, which operates UnitedHealthcare.
University of Minnesota producing more than its fair share of FPs
, according to the American Academy of Family Physicians.
Data from the AAFP’s annual survey of family medicine residency programs showed that, over a 3-year period from 2013 to 2015, 19% of the University of Minnesota’s medical school graduates entered a family medicine residency, reported Stanley M. Kozakowski, MD, and his associates (Fam Med. 2016;48[9]:688-95).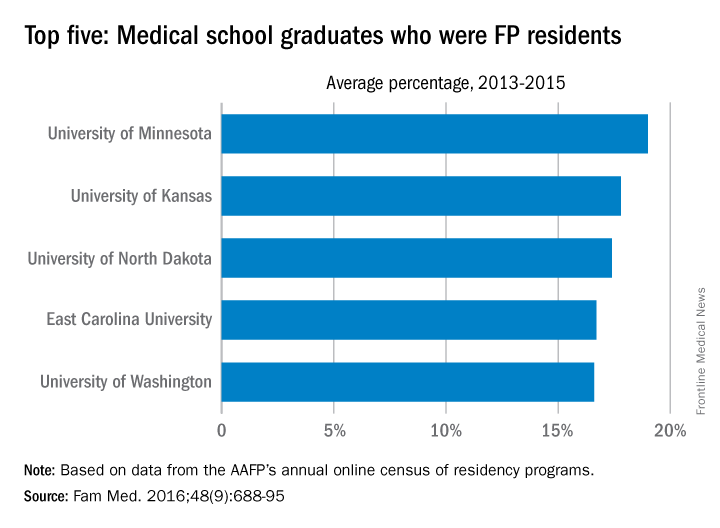
In 2015, the University of Minnesota produced 42 graduates who became FP residents, the highest number for any of the 134 U.S. medical schools granting MD degrees in family medicine. Among schools granting DO degrees, however, the leader for 2015 was Des Moines University, which had 68 students (32.7%) enter family medicine, the investigators said. Of the 2,463 individuals who were first-year family medicine residents in 2015, 1,640 graduated from MD-granting schools and 823 graduated from DO-granting schools.
FROM FAMILY MEDICINE
New Zika cases in pregnant women continue to drop
There were 136 new cases of pregnant women with laboratory evidence of Zika infection reported during the 2-week period ending Nov. 30, along with four liveborn infants with Zika-related birth defects, according to the Centers for Disease Control and Prevention.
The CDC did not report new totals for pregnant women and pregnancy outcomes for the week ending Nov. 23, so the most recent data release covers the 2-week period from Nov. 17-30. That 2-week total was barely more than the 124 reported for the week ending Nov. 10.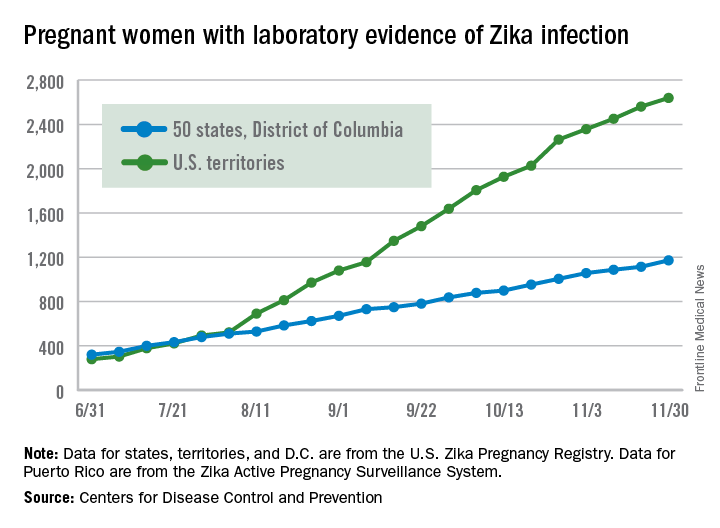
The four infants born with Zika-related birth defects were all born in the 50 states and D.C., as the CDC is no longer reporting adverse pregnancy outcomes for the territories because Puerto Rico is not using the same “inclusion criteria to monitor brain abnormalities and other adverse pregnancy outcomes.” As of Sept. 29 – the date of the last territorial report – there had been one liveborn infant and one pregnancy loss related to Zika. There were no new pregnancy losses with Zika-related birth defects in the states/D.C., so that number remains at five, while the total number of liveborn infants with Zika-related birth defects is now 32, the CDC reported.
Zika-related birth defects reported by the CDC could include microcephaly, calcium deposits in the brain indicating possible brain damage, excess fluid in the brain cavities and surrounding the brain, absent or poorly formed brain structures, abnormal eye development, or other problems resulting from brain damage that affect nerves, muscles, and bones. The pregnancy losses encompass any miscarriage, stillbirth, and termination with evidence of birth defects.
The pregnancy-related figures for states, territories, and D.C. reflect reporting to the U.S. Zika Pregnancy Registry; data for Puerto Rico are reported to the U.S. Zika Active Pregnancy Surveillance System.
Fewer Zika-infected pregnancies reported for second week in a row
The number of new Zika cases reported among pregnant women in the United States dropped for the second week in a row, according to data from the Centers for Disease Control and Prevention.
For the week ending Nov. 10, there were 124 new cases of pregnant women with laboratory evidence of Zika virus infection reported to the CDC: 30 in the states and the District of Columbia and 94 in the U.S. territories. The previous week (Nov. 3), the number of new cases was 146, which came on the heels of a new weekly high of 288 for the week of Oct. 27.
The total number of pregnant women with Zika now stands at 3,538 for the year: 1,087 for the states and 2,451 for the territories, the CDC said.
Among all Americans, there have been 36,323 cases of Zika reported to the CDC: 4,255 have occurred in the states/D.C. and 32,068 in the territories. About 98% of territorial cases have occurred in Puerto Rico, the CDC said.
No new cases of infants with Zika-related birth defects were reported for the week ending Nov. 10, so the totals hold at 26 infants born with Zika-related birth defects and five Zika-related pregnancy losses, according to the CDC.
The CDC is no longer reporting adverse pregnancy outcomes for the territories because Puerto Rico is not using the same “inclusion criteria to monitor brain abnormalities and other adverse pregnancy outcomes.” As of Sept. 29 – the date of the last territorial report – there had been one liveborn infant and one pregnancy loss related to Zika.
Zika-related birth defects reported by the CDC could include microcephaly, calcium deposits in the brain indicating possible brain damage, excess fluid in the brain cavities and surrounding the brain, absent or poorly formed brain structures, abnormal eye development, or other problems resulting from brain damage that affect nerves, muscles, and bones. The pregnancy losses encompass any miscarriage, stillbirth, and termination with evidence of birth defects.
The pregnancy-related figures for states, territories, and D.C. reflect reporting to the U.S. Zika Pregnancy Registry; data for Puerto Rico are reported to the U.S. Zika Active Pregnancy Surveillance System.
Weekly number of Zika-infected pregnancies drops by half
There were 146 new cases of pregnant women with laboratory evidence of Zika infection reported in the United States for the week ending Nov. 3 – just about half of the 288-case increase reported the week before, according to Centers for Disease Control and Prevention.
For the year so far, there have been 1,057 cases of pregnant women with Zika in the states and the District of Columbia – 52 for the week ending Nov. 3 – and 2,357 cases in the territories, the CDC announced, with 94 reported in the most recent week. The total number of U.S. cases – 3,414 – is up by 4.4% over the previous week.
The CDC also reported one new infant born with Zika-related birth defects for the week ending Nov. 3, bringing the total for the year to 26 in the states/D.C. There were no new Zika-related pregnancy losses reported, so the total remains at five. State-level data are not being reported to protect the privacy of affected women and children.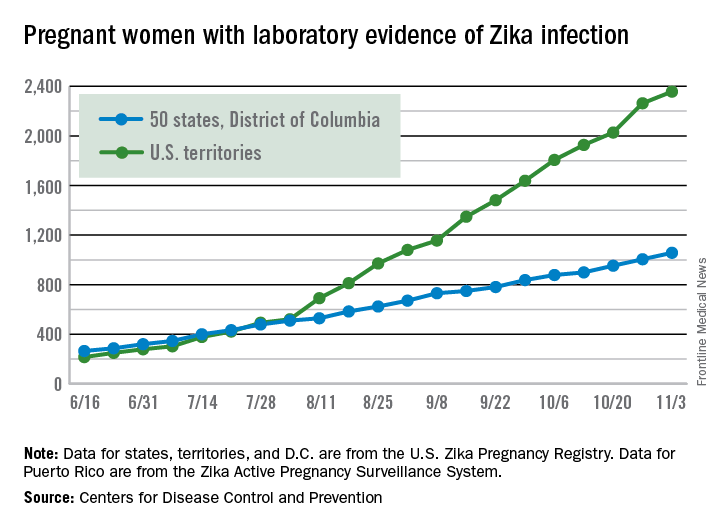
The CDC is no longer reporting adverse pregnancy outcomes for the territories because Puerto Rico is not using the same “inclusion criteria to monitor brain abnormalities and other adverse pregnancy outcomes.” As of Sept. 29 – the date of the last territorial report – there had been one liveborn infant and one pregnancy loss related to Zika.
Zika-related birth defects reported by the CDC could include microcephaly, calcium deposits in the brain indicating possible brain damage, excess fluid in the brain cavities and surrounding the brain, absent or poorly formed brain structures, abnormal eye development, or other problems resulting from brain damage that affect nerves, muscles, and bones. The pregnancy losses encompass any miscarriage, stillbirth, and termination with evidence of birth defects.
The pregnancy-related figures for states, territories, and D.C. reflect reporting to the U.S. Zika Pregnancy Registry; data for Puerto Rico are reported to the U.S. Zika Active Pregnancy Surveillance System.
Large increase seen in number of Zika-infected pregnancies
The 288 new cases of pregnant women in the United States with laboratory evidence of Zika infection reported for the week ending Oct. 27, 2016, represent the largest weekly increase so far this year, according to new data from the Centers for Disease Control and Prevention.
The 52 new cases in the 50 states and the District of Columbia and the 236 cases in the U.S. territories bring the totals for the year to 1,005 and 2,263, respectively, and to 3,268 for the United States as a whole, the CDC reported.
The week ending Oct. 27 also brought reports of two more infants born with Zika-related birth defects in the 50 states/D.C., but there were no reports of Zika-related pregnancy losses. So far in 2016, there have been 25 liveborn infants with Zika-related birth defects and five pregnancy losses in the states.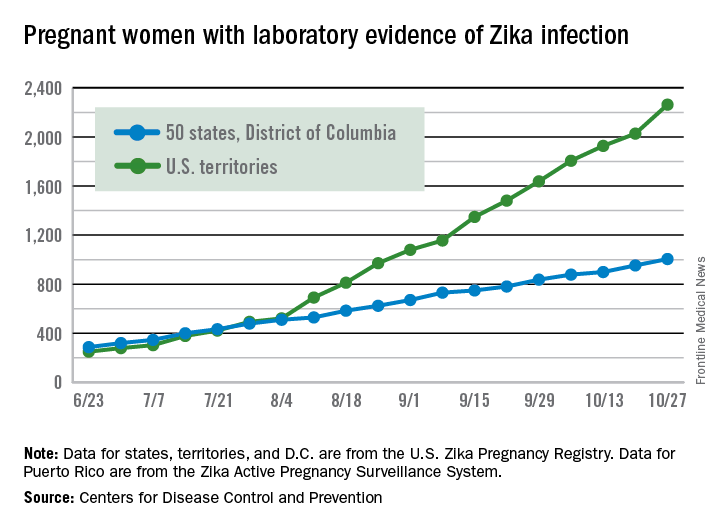
The CDC is no longer reporting adverse pregnancy outcomes for the territories because Puerto Rico is not using the same “inclusion criteria to monitor brain abnormalities and other adverse pregnancy outcomes.” As of Sept. 29 – the date of the last territorial report – there had been one liveborn infant and one pregnancy loss related to Zika.
Zika-related birth defects reported by the CDC could include microcephaly, calcium deposits in the brain indicating possible brain damage, excess fluid in the brain cavities and surrounding the brain, absent or poorly formed brain structures, abnormal eye development, or other problems resulting from brain damage that affect nerves, muscles, and bones. The pregnancy losses encompass any miscarriage, stillbirth, and termination with evidence of birth defects.
The pregnancy-related figures for states, territories, and D.C. reflect reporting to the U.S. Zika Pregnancy Registry; data for Puerto Rico are reported to the U.S. Zika Active Pregnancy Surveillance System.
U.S. preterm birth rate rose slightly in 2015
The preterm birth rate in the United States for 2015 increased for the first time in 8 years, according to the March of Dimes.
The national preterm birth rate rose from 9.57% in 2014 to 9.63% last year, earning an overall grade of C on the March of Dimes 2016 Premature Birth Report Card.
The March of Dimes also ranked preterm births in the states by racial/ethnic disparity: Maine had the least disparity, followed by New Hampshire and Utah, while Hawaii had the greatest disparity, just ahead of Pennsylvania and Louisiana. Using an average of the 2012-2014 national preterm birth rates, the March of Dimes calculated that Asian/Pacific Islanders had the lowest preterm birth rate at 8.5%, compared with 9% for whites, 9.1% for Hispanics, 10.4% for American Indian/Alaska Natives, and 13.3% for blacks.
The report card shows “that there is an unfair burden of premature birth among specific racial and ethnic groups as well as geographic areas,” Jennifer L. Howse, PhD, president of the March of Dimes, said in a statement. “Babies in this country have different chances of surviving and thriving simply based on the circumstances of their birth.”
Employer-provided insurance stable after ACA implementation
Concerns that Affordable Care Act (ACA) provisions implemented in 2014 would lead large numbers of employers to drop health insurance coverage appear to have been unfounded, according to a study published in the journal Health Affairs.
More than 95% of employers did not change their insurance coverage policy between 2013 and 2014: 46.4% offered coverage in 2013 and continued it in 2014 and 49.1% did not offer coverage either year. Of the 21,900 private-sector employers included in the analysis, 3.5% provided coverage in 2013 but not in 2014 and 1.1% did not offer it in 2013 but did in 2014, reported Jean Abraham, PhD, of the University of Minnesota, Minneapolis, and her associates (Health Aff. 2016 Oct 26;35[11]. doi: 10.1377/hlthaff.2016.0631).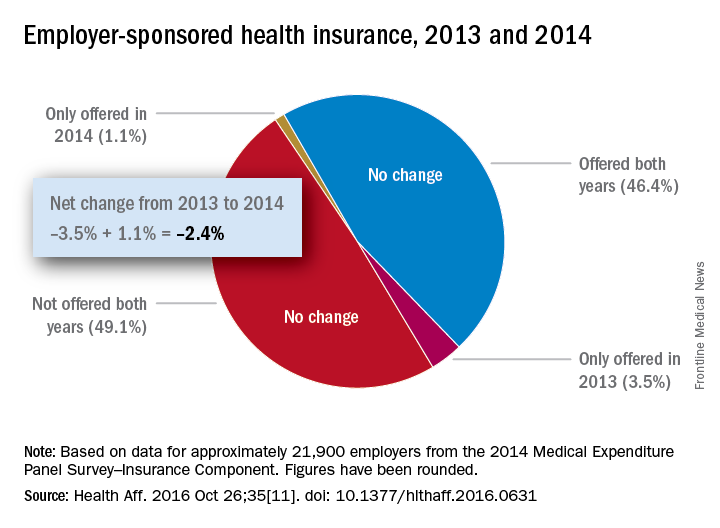
The analysis of data from the 2014 Medical Expenditure Panel Survey–Insurance Component, however, did show associations between coverage changes and several workforce and employer characteristics. “Small firms were more likely to drop coverage compared to large ones, as were those with more low-wage workers compared to those with fewer such workers, newer establishments compared to older ones, and those in the service sector compared to those in blue- and white-collar industries,” Dr. Abraham and her associates wrote.
The Robert Wood Johnson Foundation’s State Health Access Reform Evaluation program supported the study. No other financial disclosures were provided.
Number of Medicare part D drug plans continues to decline
There will be 16% fewer Medicare part D prescription drug plans available in 2017, compared with 2016, according to an analysis by the Kaiser Family Foundation.
In 2017, there will be 746 stand-alone prescription drug plans available to Medicare beneficiaries in the 50 states and the District of Columbia, which is 140 (16%) less than were available in 2016 and 1,129 (60%) less than the peak in 2007, Kaiser reported.
Of the nearly 41 million people enrolled in Medicare part D plans in 2016, about 12 million receive the low-income subsidy. The Congressional Budget Office estimates that spending on part D benefits will be $94 billion in 2017, which is 15.6% of overall Medicare costs. Medicare actuaries have projected that the cost per enrollee will increase by 5.8% annually from 2015 to 2025, Kaiser reported.
Connecticut gets top ranking for mental health
The state of mental health in Connecticut makes it the state for mental health in 2016, according to the advocacy group Mental Health America.
Connecticut had the top overall score in an analysis that combined 15 prevalence and access measures for adults and children. Massachusetts finished second, and Vermont was third for a New England sweep of the medal positions, with South Dakota and Minnesota rounding out the top five, Mental Health America reported.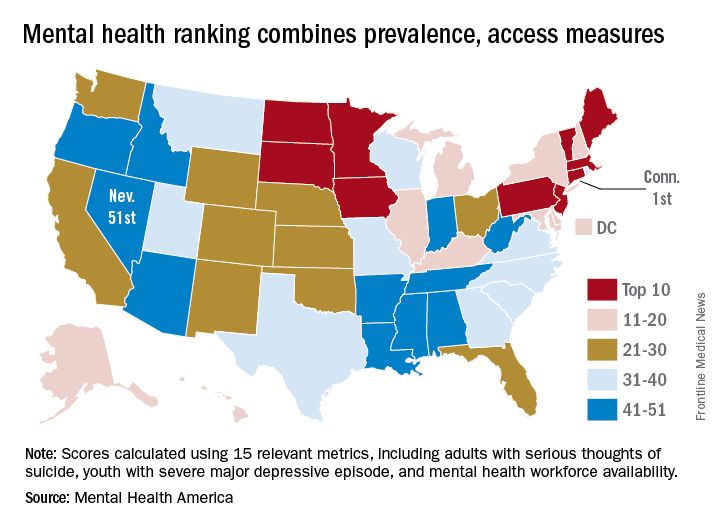
Connecticut finished first in the subgroups of measures pertaining to adults and to prevalence, Minnesota ranked first in the subgroup of child measures, and Vermont was first in access to care. Nevada was 51st in the adult measures and in access to care, Arkansas ranked 51st in the child measures, and Oregon was 51st in the prevalence ranking, noted Mental Health America, which also gave a ranking to the District of Columbia.
Considerable variation can be seen between states on some of the 15 measures. For mental health workforce availability, Massachusetts was first with 1 mental health provider per 200 residents, while Alabama was 51st with one provider for every 1,200 individuals. In South Dakota, 39.5% of children with severe depression received some consistent treatment, compared with 9.4% in Nevada. In Hawaii, 13.6% of adults with mental illness were not able to get the treatment they needed, compared with 25.9% in Missouri, according to Mental Health America.
The Substance Abuse and Mental Health Services Administration was the main source of data for the analysis; other sources included the Centers for Disease Control and Prevention, the Centers for Medicare & Medicaid Services, and the Department of Education.