User login
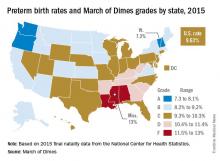
The preterm birth rate in the United States for 2015 increased for the first time in 8 years, according to the March of Dimes.
The national preterm birth rate rose from 9.57% in 2014 to 9.63% last year, earning an overall grade of C on the March of Dimes 2016 Premature Birth Report Card.
The March of Dimes also ranked preterm births in the states by racial/ethnic disparity: Maine had the least disparity, followed by New Hampshire and Utah, while Hawaii had the greatest disparity, just ahead of Pennsylvania and Louisiana. Using an average of the 2012-2014 national preterm birth rates, the March of Dimes calculated that Asian/Pacific Islanders had the lowest preterm birth rate at 8.5%, compared with 9% for whites, 9.1% for Hispanics, 10.4% for American Indian/Alaska Natives, and 13.3% for blacks.
The report card shows “that there is an unfair burden of premature birth among specific racial and ethnic groups as well as geographic areas,” Jennifer L. Howse, PhD, president of the March of Dimes, said in a statement. “Babies in this country have different chances of surviving and thriving simply based on the circumstances of their birth.”

