User login
PTSD, depression combo tied to high risk for early death in women
Middle-aged women with PTSD and comorbid depression have a nearly fourfold increased risk for early death from a variety of causes in comparison with their peers who do not have those conditions, new research shows.
“Women with more severe symptoms of depression and PTSD were more at risk, compared with those with fewer symptoms or women with symptoms of only PTSD or only depression,” lead investigator Andrea Roberts, PhD, Harvard School of Public Health, Boston, said in an interview.
Health care providers “should be aware that mental health is a critical component of overall health and is tightly entwined with physical health. Identifying and treating mental health issues should be a foundational part of general health practice,” said Dr. Roberts.
The study was published online Dec. 4 in JAMA Network Open.
Mental health fundamental to survival
The researchers studied more than 51,000 mostly White women from the Nurses Health Study II who were followed for 9 years (2008-2017). At baseline in 2008, the women were aged between 43 and 64 years (mean age, 53.3 years).
Women with high levels of PTSD (six or seven symptoms) and probable depression were nearly four times more likely to die during follow-up than their peers who did not have these conditions (hazard ratio, 3.8; 95% confidence interval, 2.65-5.45; P < .001).
With adjustment for health factors such as smoking and body mass index, women with a high level of PTSD and depression remained at increased risk for early death (HR, 3.11; 95% CI, 2.16-4.47; P < .001).
The risk for early death was also elevated among women with moderate PTSD (four or five symptoms) and depression (HR, 2.03; 95% CI, 1.35-3.03; P < .001) and women with subclinical PTSD and depression (HR, 2.85; 95% CI, 1.99-4.07; P < .001) compared with those who did not have PTSD or depression.
Among women with PTSD symptoms and depression, the incidence of death from nearly all major causes was increased, including death from cardiovascular disease, respiratory disease, type 2 diabetes, unintentional injury, suicide, and other causes.
“These findings provide further evidence that mental health is fundamental to physical health – and to our very survival. We ignore our emotional well-being at our peril,” senior author Karestan Koenen, PhD, said in a news release.
New knowledge
Commenting on the findings, Jennifer Sumner, PhD, said that it’s “critical to appreciate the physical health consequences of psychopathology in individuals who have experienced trauma. This study adds to a growing literature demonstrating that the impact extends far beyond emotional health.
“Furthermore, these results highlight the potential value of promoting healthy lifestyle changes in order to reduce the elevated mortality risk in trauma-exposed individuals with co-occurring PTSD and depression,” said Dr. Sumner, who is with the department of psychology, University of California, Los Angeles.
She noted that this study builds on other work that links PTSD to mortality in men.
“Most work on posttraumatic psychopathology and physical health has actually been conducted in predominantly male samples of veterans, so said Dr. Sumner.
“It’s also important to note that PTSD and depression are more prevalent in women than in men, so demonstrating these associations in women is particularly relevant,” she added.
Funding for the study was provided by the National Institutes of Heath. The authors disclosed no relevant financial relationships. Dr. Sumner has collaborated with the study investigators on prior studies.
A version of this article originally appeared on Medscape.com.
ADA 2021 standards address financial hardship in diabetes
For 2021, the American Diabetes Association offers new guidance on assessing patients’ financial and social barriers to care, especially given the COVID-19 pandemic, individualizing treatment of patients with type 2 diabetes, and use of diabetes technology.
As it does every year, the annual update incorporates new clinical information that has become available since the last guideline, with occasional revisions during the year as needed. “Standards of Medical Care in Diabetes – 2021,” was published online as a supplement to Diabetes Care.
The new standards advise that patients be assessed for food and housing insecurity, social support, and “cost-related medication nonadherence,” and those found to have difficulty referred to appropriate community resources.
“Clinicians need to be sensitive to the fact that patients may have very good reasons for not taking their medication, [as in] if they can’t afford it,” ADA chief science & medical officer Robert A. Gabbay, MD, PhD, said in an interview.
Dr. Gabbay noted that “a heightened awareness” of social determinants of health is weaved throughout the 2021 standards because of the pandemic, with information on the topic derived from a July 2020 joint consensus statement in Diabetes Care, endorsed by a number of other societies, as well as a November publication also in Diabetes Care.
“We made several recommendations that speak to social determinants of health, placing an emphasis on engaging in conversations around this subject and screening for related issues such as food insecurity that weren’t there previously,” he said.
“Screening tools are suggested. It helped us to have an in-depth scientific review of the literature to know the prevalence of this in people with diabetes. ... Having the science to put it in was a key step,” Dr. Gabbay noted.
Consider kidney, heart disease in type 2 treatment individualization
Recent data from trials such as CREDENCE and DAPA-HF, among others, have been added to inform the choice of pharmacologic treatment in patients with type 2 diabetes with comorbid diabetic kidney disease and chronic heart failure.
“ADA has been advocating individualization of treatment based on comorbidities for a while, but we’ve taken more steps in that direction. Beyond lifestyle for all individuals with type 2 diabetes, clinicians want to think early on about which comorbidities patients have and then think about the appropriate treatment based on that,” Dr. Gabbay said.
And for the third year in a row, the section on cardiovascular disease and risk management has been endorsed by the American College of Cardiology.
“All the things in that section are very much aligned with ACC and that’s been a great partnership,” Dr. Gabbay said.
Now, ADA is in discussions with other professional societies representing relevant specialties to create further such unified messages.
“What we all want to avoid is having multiple different guidelines. We want to speak with one voice and find common ground as much as possible. … It makes it much easier for clinicians to know what to do. That’s the goal of all this,” he noted.
Diabetes technology: The rise of CGM during pandemic and beyond
New information about continuous glucose monitoring (CGM) has been added to the diabetes technology section. Use of CGM is now recommended for anyone with diabetes who takes multiple daily injections or uses an insulin pump, regardless of age or diabetes type. The document provides expanded advice on use of time in range data for glycemic monitoring, particularly during the COVID-19 pandemic when remote monitoring is preferable.
Insurers are increasingly covering CGM for patients on insulin, but it’s far from universal. While the ultimate goal is to ensure access to CGM for everyone with diabetes, those treated with multiple daily insulin doses are the priority for now.
“Our hope is that as there’s greater evidence there will be more movement towards coverage. There are still so many people for whom it’s quite clear they would benefit because they’re on insulin but don’t have access to it. That’s an important area that ADA is advocating for, and it’s reflected in the standards of care,” Dr. Gabbay said.
In another technology-related revision, the term “blinded” CGM has been replaced with “professional CGM,” because clinic-based use of the devices can be “blinded” to the patient or monitored in real-time by both the patient and clinician. Also, a new recommendation has been added to address skin reactions associated with diabetes technology use.
Information about use of CGM in hospital settings during the COVID-19 pandemic has also been added in the technology section.
The COVID-19 pandemic comes up again in the section on vaccines.
“We mention that people with diabetes should be considered high priority [for COVID-19 vaccines], and that’s something that ADA is strongly advocating for because 40% of COVID-19 deaths have been in people with diabetes,” Dr. Gabbay said.
Dr. Gabbay reported being on the advisory boards of Onduo, Health Reveal, Vida Health, Lark, and Form Health.
A version of this article originally appeared on Medscape.com.
Sac/val heart failure benefit extends to diabetes patients
The beneficial effects of sacubitril/valsartan on reverse cardiac remodeling in patients with heart failure and reduced ejection fraction have been well established, but those benefits haven’t been as clearly demonstrated to carry over to HFrEF patients who also have type 2 diabetes mellitus (T2DM).

Now, a post-hoc analysis of a pivotal clinical trial reports that those benefits do extend to patients with HFrEF and T2DM.
“It’s really not about a Sophie’s choice of whether you give this or that drug in these patients,” said corresponding author Javed Butler, MD, MPH, MBA. “We really ought to be giving all of these drugs – the angiotensin receptor neprilysin inhibitors (ARNIs) and sodium-glucose transporter 2 (SGLT-2) inhibitors – to our patients for the best outcomes.”
The post-hoc analysis, published in JACC: Heart Failure, evaluated 361 patients with T2DM who were enrolled in the PROVE-HF trial of sac/val therapy for HF, published in JAMA.
PROVE-HF evaluated biomarkers, myocardial remodeling, and outcomes through a year of treatment with sac/val. The primary endpoint was the level of changes in natriuretic peptide (NT-proBNP) concentrations, left-ventricle ejection fraction (LVEF) and overall Kansas City Cardiomyopathy Questionnaire (KCCQ)-23 scores through 12 months of treatment.
The post hoc study reported that baseline NT-proBNP concentrations were higher in the DM patients (854 pg/mL vs. 706 pg/mL), but at 12 months those levels were 513 and 441 pg/mL, respectively.
LVEF changed similarly from baseline to 12 months in both groups: from 28.3% to 37% in the DM patients and from 28.1% to 38.34% in non-DM patients. Overall KCCQ-23 scores improved similarly in both groups, but longitudinal analyses found modestly higher gains in the T2DM group, 9.3 vs. 8.6 points (P = .07).
“The real reason I wanted to do this study is that I’m a huge fan of all the SGLT-2 inhibitors, and I’m very involved in those trials, and there is right now so much momentum behind SGLT-2 inhibitors that I don’t want people to forget that ARNI is still the base therapy for HF,” said Dr. Butler, chair of cardiovascular research and the department of medicine at the University of Mississippi in Jackson.
He noted that the size of the diabetes cohort in PROVE-HF “is a nonissue” for evaluating power of the post hoc analysis because it tracked key measures in the study population continuously at eight intervals over the 12 months.
The analysis further demonstrates the synergistic effects of ARNI and SGLT-2 inhibitors in patients with T2DM and HF that were also reported in the PARADIGM-HF study, Dr. Butler said.
“We have sort of moved on, saying that SGLT-2 inhibitors have a benefit on the heart, but the reverse is also true: ARNIs are still heart failure drugs, and we don’t think of them as diabetes drugs, but the PARADIGM-HF data showed that there was a substantial reduction in hemoglobin A1c in those who had diabetes,” he said.
The researchers noted that an absence of a control group may contribute to an overestimation of reverse cardiac remodeling in the T2DM patients, and that the PROVE-HF study wasn’t prospectively powered to delineate differences in how sac/val therapy affected patients with or without diabetes. “Future investigations seeking to evaluate differences by T2DM status after sacubitril/valsartan initiation may use our findings to plan prospective sample sizes,” the researchers wrote.
Dr. Butler disclosed financial relationships with Abbott, Amgen, Array, AstraZeneca, Bayer, Boehringer Ingelheim, CVRx, Eli Lilly, G3 Pharmaceutical, Impulse Dynamics, Innolife, Janssen, Luitpold, Medtronic, Merck, Novartis, Novo Nordisk, Relypsa, Sequana, StealthPeptide and Vifor. Lead author Muhammad Shahzeb Khan, MD, MSc, a professor at the University of Mississippi, has no relevant financial relationships to disclose.
SOURCE: Kahn MS et al. JACC: HF. 2020 Dec 9. doi: 10.1016/j.jchf.2020.09.014.
The beneficial effects of sacubitril/valsartan on reverse cardiac remodeling in patients with heart failure and reduced ejection fraction have been well established, but those benefits haven’t been as clearly demonstrated to carry over to HFrEF patients who also have type 2 diabetes mellitus (T2DM).
Now, a post-hoc analysis of a pivotal clinical trial reports that those benefits do extend to patients with HFrEF and T2DM.
“It’s really not about a Sophie’s choice of whether you give this or that drug in these patients,” said corresponding author Javed Butler, MD, MPH, MBA. “We really ought to be giving all of these drugs – the angiotensin receptor neprilysin inhibitors (ARNIs) and sodium-glucose transporter 2 (SGLT-2) inhibitors – to our patients for the best outcomes.”
The post-hoc analysis, published in JACC: Heart Failure, evaluated 361 patients with T2DM who were enrolled in the PROVE-HF trial of sac/val therapy for HF, published in JAMA.
PROVE-HF evaluated biomarkers, myocardial remodeling, and outcomes through a year of treatment with sac/val. The primary endpoint was the level of changes in natriuretic peptide (NT-proBNP) concentrations, left-ventricle ejection fraction (LVEF) and overall Kansas City Cardiomyopathy Questionnaire (KCCQ)-23 scores through 12 months of treatment.
The post hoc study reported that baseline NT-proBNP concentrations were higher in the DM patients (854 pg/mL vs. 706 pg/mL), but at 12 months those levels were 513 and 441 pg/mL, respectively.
LVEF changed similarly from baseline to 12 months in both groups: from 28.3% to 37% in the DM patients and from 28.1% to 38.34% in non-DM patients. Overall KCCQ-23 scores improved similarly in both groups, but longitudinal analyses found modestly higher gains in the T2DM group, 9.3 vs. 8.6 points (P = .07).
“The real reason I wanted to do this study is that I’m a huge fan of all the SGLT-2 inhibitors, and I’m very involved in those trials, and there is right now so much momentum behind SGLT-2 inhibitors that I don’t want people to forget that ARNI is still the base therapy for HF,” said Dr. Butler, chair of cardiovascular research and the department of medicine at the University of Mississippi in Jackson.
He noted that the size of the diabetes cohort in PROVE-HF “is a nonissue” for evaluating power of the post hoc analysis because it tracked key measures in the study population continuously at eight intervals over the 12 months.
The analysis further demonstrates the synergistic effects of ARNI and SGLT-2 inhibitors in patients with T2DM and HF that were also reported in the PARADIGM-HF study, Dr. Butler said.
“We have sort of moved on, saying that SGLT-2 inhibitors have a benefit on the heart, but the reverse is also true: ARNIs are still heart failure drugs, and we don’t think of them as diabetes drugs, but the PARADIGM-HF data showed that there was a substantial reduction in hemoglobin A1c in those who had diabetes,” he said.
The researchers noted that an absence of a control group may contribute to an overestimation of reverse cardiac remodeling in the T2DM patients, and that the PROVE-HF study wasn’t prospectively powered to delineate differences in how sac/val therapy affected patients with or without diabetes. “Future investigations seeking to evaluate differences by T2DM status after sacubitril/valsartan initiation may use our findings to plan prospective sample sizes,” the researchers wrote.
Dr. Butler disclosed financial relationships with Abbott, Amgen, Array, AstraZeneca, Bayer, Boehringer Ingelheim, CVRx, Eli Lilly, G3 Pharmaceutical, Impulse Dynamics, Innolife, Janssen, Luitpold, Medtronic, Merck, Novartis, Novo Nordisk, Relypsa, Sequana, StealthPeptide and Vifor. Lead author Muhammad Shahzeb Khan, MD, MSc, a professor at the University of Mississippi, has no relevant financial relationships to disclose.
SOURCE: Kahn MS et al. JACC: HF. 2020 Dec 9. doi: 10.1016/j.jchf.2020.09.014.
FROM JACC: HEART FAILURE
Twincretin ‘impressive’: Topline data from phase 3 trial in diabetes
Tirzepatide, a novel subcutaneously injected drug that acts via two related but separate pathways of glucose control, produced strikingly positive effects in top-line results from the phase 3, placebo-controlled study SURPASS-1 in 478 adults with type 2 diabetes, according to a Dec. 9 press release from the manufacturer, Lilly.
The tirzepatide molecule exerts agonist effects at both the glucose-dependent insulinotropic polypeptide (GIP) receptor and the glucagon-like peptide-1 (GLP-1) receptor, and has been called a “twincretin” for its activity encompassing two different incretins. Phase 2 trial results caused excitement, with one physician calling the data “unbelievable” when reported in 2018.
SURPASS-1 enrolled patients who were very early in the course of their disease, had on average relatively mild elevation in glucose levels, and few metabolic comorbidities. They took one of three doses of the agent (5, 10, or 15 mg) as monotherapy or placebo for 40 weeks.
Julio Rosenstock, MD, said in the Lilly statement: “The study took a bold approach in assessing A1c targets. Not only did nearly 90% of all participants taking tirzepatide meet the standard A1c goal of less than 7%, more than half taking the highest dose also achieved an A1c less than 5.7%, the level seen in people without diabetes.”
Dr. Rosenstock is principal investigator of SURPASS-1 and director of the Dallas Diabetes Research Center in Texas.
The discontinuation rate in the high-dose group was 21.5% compared with less than 10% in the two lower-dose cohorts. Lilly said most of the dropouts “were due to the pandemic and family or work reasons.” The dropout rate in the placebo group was 14.8%.
These data were not included in the efficacy analysis, however, which “muddied” the analysis somewhat, one pharma analyst told BioPharma Dive.
Commenting on the new trial data, Ildiko Lingvay, MD, said in an interview: “I am very impressed with these results,” which are “unprecedented for any glucose-lowering medication that has ever been tested.”
Dr. Lingvay, of the department of internal medicine/endocrinology, and medical director, office of clinical trials management at UT Southwestern Medical Center, Dallas, was not involved in the study.
She added that the weight loss seen with tirzepatide “is equally impressive with greater than 10% of body weight loss above placebo achieved within 40 weeks of treatment and without any directed weight loss efforts.”
If the agent is eventually approved, “I am enthusiastic about the prospect of having another very powerful tool to address both diabetes and obesity,” she added.
The full results of SURPASS-1 will be presented at the American Diabetes Association 81st Scientific Sessions and published in a peer-reviewed journal in 2021.
SURPASS-1 is one of eight phase 3 studies of the drug, including five registration studies and one large 12,500-patient cardiovascular outcomes trial.
Tirzepatide patients lost up to 20 lb, side effect profile ‘reassuring’
In the study, patients had been recently diagnosed with type 2 diabetes (average duration, 4.8 years) and 54% were treatment-naive. Average baseline hemoglobin A1c was 7.9% and mean weight was 85.9 kg (189 pounds).
Patients started on a subcutaneous injectable dose of tirzepatide of 2.5 mg per week, which was titrated up to the final dose – 5, 10, or 15 mg – in 2.5-mg increments given as monotherapy for 40 weeks and compared with placebo.
Treatment with tirzepatide resulted in average reductions in A1c from baseline that ranged from 1.87% to 2.07%, depending on the dose, and were all significant compared with an increase of 0.4% with placebo.
The percentage of patients whose A1c fell to normal levels (less than 5.7%) ranged from 30.5% to 51.7%, compared with 0.9% among controls, and again, was significant for all doses.
Patients treated with tirzepatide also lost weight. Average weight reductions after 40 weeks were significant and ranged from 7.0 to 9.5 kg (15-21 pounds) compared with an average loss of 0.7 kg (1.5 pounds) among patients who received placebo.
The most common adverse events were gastrointestinal-related and mild to moderate in severity, and usually occurred during dose escalation.
Dr. Lingvay said the safety data reported are “reassuring, with side effects in the anticipated range and comparable with other medications in the GLP-1 agonist class.”
And no hypoglycemic (level 2, < 54 mg/dL) events were reported, “which is impressive considering the overall glucose level achieved,” she noted.
“I am eagerly awaiting the results of the other studies within the SURPASS program and hope those will confirm these initial findings and provide additional safety and efficacy information in a wider range of patients with type 2 diabetes,” she concluded.
Dr. Lingvay has reported receiving research funding, advisory/consulting fees, and/or other support from Novo Nordisk, Eli Lilly, Sanofi, AstraZeneca, Boehringer Ingelheim, Janssen, Intercept, Intarcia, Target Pharma, Merck, Pfizer, Novartis, GI Dynamics, Mylan, MannKind, Valeritas, Bayer, and Zealand Pharma.
A version of this article originally appeared on Medscape.com.
How to refine your approach to peripheral arterial disease
Peripheral arterial disease (PAD), the progressive disorder that results in ischemia to distal vascular territories as a result of atherosclerosis, spans a wide range of presentations, from minimally symptomatic disease to limb ischemia secondary to acute or chronic occlusion.
The prevalence of PAD is variable, due to differing diagnostic criteria used in studies, but PAD appears to affect 1 in every 22 people older than age 40.1 However, since PAD incidence increases with age, it is increasing in prevalence as the US population ages.1-3
PAD is associated with increased hospitalizations and decreased quality of life.4 Patients with PAD have an estimated 30% 5-year risk for myocardial infarction, stroke, or death from a vascular cause.3
Screening. Although PAD is underdiagnosed and appears to be undertreated,3 population-based screening for PAD in asymptomatic patients is not recommended. A Cochrane review found no studies evaluating the benefit of asymptomatic population-based screening.5 Similarly, in 2018, the USPSTF performed a comprehensive review and found no studies to support routine screening and determined there was insufficient evidence to recommend it.6,7
Risk factors and associated comorbidities
PAD risk factors, like the ones detailed below, have a potentiating effect. The presence of 2 risk factors doubles PAD risk, while 3 or more risk factors increase PAD risk by a factor of 10.1
Increasing age is the greatest single risk factor for PAD.1,2,8,9 Researchers using data from the National Health and Nutrition Examination Survey (NHANES) found that the prevalence of PAD increased from 1.4% in individuals ages 40 to 49 years to almost 17% in those age 70 or older.1

Demographic characteristics. Most studies demonstrate a higher risk for PAD in men.1-3,10 African-American patients have more than twice the risk for PAD, compared with Whites, even after adjustment for the increased prevalence of associated diseases such as hypertension and diabetes in this population.1-3,10
Continue to: Genetics...
Genetics. A study performed by the National Heart Lung and Blood Institute suggested that genetic correlations between twins were more important than environmental factors in the development of PAD.11
Smoking. Most population studies show smoking to be the greatest modifiable risk factor for PAD. An analysis of the NHANES data yielded an odds ratio (OR) of 4.1 for current smokers and of 1.8 for former smokers.1 Risk increases linearly with cumulative years of smoking.1,2,9,10
Diabetes is another significant modifiable risk factor, increasing PAD risk by 2.5 times.2 Diabetes is also associated with increases in functional limitation from claudication, risk for acute coronary syndrome, and progression to amputation.1
Hypertension nearly doubles the risk for PAD, and poor control further increases this risk.2,9,10
Chronic kidney disease (CKD). Patients with CKD have a progressively higher prevalence of PAD with worsening renal function.1 There is also an association between CKD and increased morbidity, revascularization failure, and increased mortality.1
Two additional risk factors that are less well understood are dyslipidemia and chronic inflammation. There is conflicting data regarding the role of individual components of cholesterol and their effect on PAD, although lipoprotein (a) has been shown to be an independent risk factor for both the development and progression of PAD.12 Similarly, chronic inflammation has been shown to play a role in the initiation and progression of the disease, although the role of inflammatory markers in evaluation and treatment is unclear and assessment for these purposes is not currently recommended.12,13
Continue to: Diagnosis...
Diagnosis
Clinical presentation
Lower extremity pain is the hallmark symptom of PAD, but presentation varies. The classic presentation is claudication, pain within a defined muscle group that occurs with exertion and is relieved by rest. Claudication is most common in the calf but also occurs in the buttock/thigh and the foot.
However, most patients with PAD present with pain that does not fit the definition of claudication. Patients with comorbidities, physical inactivity, and neuropathy are more likely to present with atypical pain.14 These patients may demonstrate critical or acute limb ischemia, characterized by pain at rest and most often localized to the forefoot and toes. Patients with critical limb ischemia may also present with nonhealing wounds/ulcers or gangrene.15
Physical exam findings can support the diagnosis of PAD, but none are reliable enough to rule the diagnosis in or out. Findings suggestive of PAD include cool skin, presence of a bruit (iliac, femoral, or popliteal), and palpable pulse abnormality. Multiple abnormal physical exam findings increase the likelihood of PAD, while the absence of a bruit or palpable pulse abnormality makes PAD less likely.16 In patients with PAD, an associated wound/ulcer is most often distal in the foot and usually appears dry.17
The differential diagnosis for intermittent leg pain is broad and includes neurologic, musculoskeletal, and venous etiologies. Table 118 lists some common alternate diagnoses for patients presenting with leg pain or claudication.

Continue to: Diagnostic testing...
Diagnostic testing
An ankle-brachial index (ABI) test should be performed in patients with history or physical exam findings suggestive of PAD. A resting ABI is performed with the patient in the supine position, with measurement of systolic blood pressure in both arms and ankles using a Doppler ultrasound device. Table 213 outlines ABI scoring and interpretation.

An ABI > 1.4 is an invalid measurement, indicating that the arteries are too calcified to be compressed. These highly elevated ABI measurements are common in patients with diabetes and/or advanced CKD. In these patients, a toe-brachial index (TBI) test should be performed, because the digital arteries are almost always compressible.13
Patients with symptomatic PAD who are under consideration for revascularization may benefit from radiologic imaging of the lower extremities with duplex ultrasound, computed tomography angiography, or magnetic resonance angiography to determine the anatomic location and severity of stenosis.13
Management of PAD
Lifestyle interventions
For patients with PAD, lifestyle modifications are an essential—but challenging—component of disease management.
Continue to: Smoking cessation...
Smoking cessation. As with other atherosclerotic diseases, PAD progression is strongly correlated with smoking. A trial involving 204 active smokers with PAD showed that 5-year mortality and amputation rates dropped by more than half in those who quit smoking within a year, with numbers needed to treat (NNT) of 6 for mortality and 5 for amputation.19 Because of this dramatic effect, American College of Cardiology/American Heart Association (ACC/AHA) guidelines encourage providers to address smoking at every visit and use cessation programs and medication to increase quit rates.13
Exercise may be the most important intervention for PAD. A 2017 Cochrane review found that supervised, structured exercise programs increase pain-free and maximal walking distances by at least 20% and also improve physical and mental quality of life.20 In a trial involving 111 patients with aortoiliac PAD, supervised exercise plus medical care led to greater functional improvement than either revascularization plus medical care or medical care alone.21 In a 2018 Cochrane review, neither revascularization or revascularization added to supervised exercise were better than supervised exercise alone.22 ACC/AHA guidelines recommend supervised exercise programs for claudication prior to considering revascularization.13TABLE 313 outlines the components of a structured exercise program.

Unfortunately, the benefit of these programs has been difficult to reproduce without supervision. Another 2018 Cochrane review demonstrated significant improvement with supervised exercise and no clear improvement in patients given home exercise or advice to walk.23 A recent study examined the effect of having patients use a wearable fitness tracker for home exercise and demonstrated no benefit over usual care.24
Diet. There is some evidence that dietary interventions can prevent and possibly improve PAD. A large randomized controlled trial showed that a Mediterranean diet lowered rates of PAD over 1 year compared to a low-fat diet, with an NNT of 336 if supplemented with extra-virgin olive oil and 448 if supplemented with nuts.25 A small trial of 25 patients who consumed non-soy legumes daily for 8 weeks showed average ABI improvement of 6%, although there was no control group.26
Medical therapy to address peripheral and cardiovascular events
Standard medical therapy for coronary artery disease (CAD) is recommended for patients with PAD to reduce cardiovascular and limb events. For example, treatment of hypertension reduces cardiovascular and cerebrovascular events, and studies verify that lowering blood pressure does not worsen claudication or limb perfusion.
13TABLE 413,27-30 outlines the options for medical therapy.

Continue to: Statins...
Statins reduce cardiovascular events in PAD patients. A large study demonstrated that 40 mg of simvastatin has an NNT of 21 to prevent a coronary or cerebrovascular event in PAD, similar to the NNT of 23 seen in treatment of CAD.27 Statins also reduce adverse limb outcomes. A registry of atherosclerosis patients showed that statins have an NNT of 56 to prevent amputation in PAD and an NNT of 28 to prevent worsening claudication, critical limb ischemia, revascularization, or amputation.28
Antiplatelet therapy with low-dose aspirin or clopidogrel is recommended for symptomatic patients and for asymptomatic patients with an ABI ≤ 0.9.13 A Cochrane review demonstrated significantly reduced mortality with nonaspirin antiplatelet agents vs aspirin (NNT = 94) without increase in major bleeding.29 Only British guidelines specifically recommend clopidogrel over aspirin.31
Dual antiplatelet therapy has not shown consistent benefits over aspirin alone. ACC/AHA guidelines state that dual antiplatelet therapy is not well established for PAD but may be reasonable after revascularization.13
Voraxapar is a novel antiplatelet agent that targets the thrombin-binding receptor on platelets. However, trials show no significant coronary benefit, and slight reductions in acute limb ischemia are offset by increases in major bleeding.13
For patients receiving medical therapy, ongoing evaluation and treatment should be based on claudication symptoms and clinical assessment.
Medical therapy for claudication
Several medications have been proposed for symptomatic treatment of intermittent claudication. Cilostazol is a phosphodiesterase inhibitor with the best risk-benefit ratio. A Cochrane review showed improvements in maximal and pain-free walking distances compared to placebo and improvements in quality of life with cilostazol 100 mg taken twice daily.32 Adverse effects included headache, dizziness, palpitations, and diarrhea.29
Continue to: Pentoxifylline...
Pentoxifylline is another phosphodiesterase inhibitor with less evidence of improvement, higher adverse effect rates, and more frequent dosing. It is not recommended for treatment of intermittent claudication.13,33
Supplements. Padma 28, a Tibetan herbal formulation, appears to improve maximal walking distance with adverse effect rates similar to placebo.34 Other supplements, including vitamin E, ginkgo biloba, and omega-3 fatty acids, have no evidence of benefit.35-37
When revascularizationis needed
Patients who develop limb ischemia or lifestyle-limiting claudication despite conservative therapy are candidates for revascularization. Endovascular techniques include angioplasty, stenting, atherectomy, and precise medication delivery. Surgical approaches mainly consist of thrombectomy and bypass grafting. For intermittent claudication despite conservative care, ACC/AHA guidelines state endovascular procedures are appropriate for aortoiliac disease and reasonable for femoropopliteal disease, but unproven for infrapopliteal disease.13
Acute limb ischemia is an emergency requiring immediate intervention. Two trials revealed identical overall and amputation-free survival rates for percutaneous thrombolysis and surgical thrombectomy.38,39 ACC/AHA guidelines recommend anticoagulation with heparin followed by the revascularization technique that will most rapidly restore arterial flow.13
For chronic limb ischemia, a large trial showed angioplasty had lower initial morbidity, length of hospitalization, and cost than surgical repair. However, surgical mortality was lower after 2 years.40 ACC/AHA guidelines recommend either surgery or endovascular procedures and propose initial endovascular treatment followed by surgery if needed.13 After revascularization, the patient should be followed periodically with a clinical evaluation and ABI measurement with further consideration for routine duplex ultrasound surveillance.13
Outcomes
Patients with PAD have variable outcomes. About 70% to 80% of patients with this diagnosis will have a stable disease process with no worsening of symptoms, 10% to 20% will experience worsening symptoms over time, 5% to 10% will require revascularization within 5 years of diagnosis, and 1% to 5% will progress to critical limb ischemia, which has a 5-year amputation rate of 1% to 4%.2 Patients who require amputation have poor outcomes: Within 2 years, 30% are dead and 15% have had further amputations.18
In addition to the morbidity and mortality from its own progression, PAD is an important predictor of CAD and is associated with a significant elevation in morbidity and mortality from CAD. One small but well-designed prospective cohort study found that patients with PAD had a more than 6-fold increased risk of death from CAD than did patients without PAD.41
Acknowledgement
The authors thank Francesca Cimino, MD, FAAFP, for her help in reviewing this manuscript.
CORRESPONDENCE
Dustin K. Smith, DO, 2080 Child Street, Jacksonville, FL 32214; [email protected]
1. Eraso LH, Fukaya E, Mohler ER 3rd, et al. Peripheral arterial disease, prevalence and cumulative risk factor profile analysis. Eur J Prev Cardiol. 2014;21:704-711.
2. Pasternak RC, Criqui MH, Benjamin EJ, et al; American Heart Association. Atherosclerotic Vascular Disease Conference: Writing Group I: epidemiology. Circulation. 2004;109:2605-2612.
3. Hirsch AT, Criqui MH, Treat-Jacobson D, et al. Peripheral arterial disease detection, awareness, and treatment in primary care. JAMA. 2001;286:1317-1324.
4. Olin JW, Sealove BA. Peripheral artery disease: current insight into the disease and its diagnosis and management. Mayo Clin Proc. 2010;85:678-692.
5. Andras A, Ferkert B. Screening for peripheral arterial disease. Cochrane Database Syst Rev. 2014;(4):CD010835.
6. Guirguis-Blake JM, Evans CV, Redmond N, et al. Screening for peripheral artery disease using ankle-brachial index: updated evidence report and systematic review for the US Preventive Services Task Force. JAMA. 2018;320:184-196.
7. US Preventive Services Task Force. Screening for peripheral artery disease and cardiovascular disease risk assessment with ankle-brachial index: US Preventive Services Task Force recommendation statement. JAMA. 2018;230:177-183.
8. American Heart Association Writing Group 2. Atherosclerotic Peripheral Vascular Disease Symposium II: screening for atherosclerotic vascular diseases: should nationwide programs be instituted? Circulation. 2008;118:2830-2836.
9. Berger JS, Hochman J, Lobach I, et al. Modifiable risk factor burden and the prevalence of peripheral artery disease in different vascular territories. J Vasc Surg. 2013;58:673-681.
10. Joosten MM, Pai JK, Bertoia ML, et al. Associations between conventional cardiovascular risk factors and risk of peripheral artery disease in men. JAMA. 2012;308:1660-1667.
11. Carmelli D, Fabsitz RR, Swan GE, et al. Contribution of genetic and environmental influences to ankle-brachial blood pressure index in the NHLBI Twin Study. National Heart, Lung, and Blood Institute. Am J Epidemiol. 2000;151:452-458.
12. Aboyans V, Criqui MH, Denenberg JO, et al. Risk factors for progression of peripheral arterial disease in large and small vessels. Circulation. 2006;113:2623-2629.
13. Gerald-Herman MD, Gornik HL, Barrett C, et al. 2016 AHA/ACC guideline on the management of patients with lower extremity peripheral artery disease: a report of the American College of Cardiology/American Heart Association Task Force on Clinical Practice Guidelines. Circulation. 2017;135:e726-e779.
14. McDermott MM, Greenland P, Liu K, et al. Leg symptoms in peripheral arterial disease: associated clinical characteristics and functional impairment. JAMA. 2001;286:1599-1606.
15. Cranley JJ. Ischemic rest pain. Arch Surg. 1969;98:187-188.
16. Khan NA, Rahim SA, Anand SS, et al. Does the clinical examination predict lower extremity peripheral arterial disease? JAMA. 2006;295:536-546.
17. Wennberg PW. Approach to the patient with peripheral arterial disease. Circulation. 2013;128:2241-2250.
18. Norgren L, Hiatt WR, Dormandy JA, et al. Inter-society consensus for the management of peripheral arterial disease (TASC II). Eur J Vas Endovasc Surg. 2007;33:S1-S75.
19. Armstrong EJ, Wu J, Singh GD, et al. Smoking cessation is associated with decreased mortality and improved amputation-free survival among patients with symptomatic peripheral artery disease. J Vasc Surg. 2014;60:1565-1571.
20. Lane R, Harwood A, Watson L, et al. Exercise for intermittent claudication. Cochrane Database Syst Rev. 2017;(12):CD000990.
21. Murphy TP, Cutlip DE, Regensteiner JG, et al; CLEVER Study Investigators. Supervised exercise versus primary stenting for claudication resulting from aortoiliac peripheral artery disease: six-month outcomes from the claudication: exercise versus endoluminal revascularization (CLEVER) study. Circulation. 2012;125:130-139.
22. Fakhry F, Fokkenrood HJP, Pronk S, et al. Endovascular revascularization versus conservative management for intermittent claudication. Cochrane Database Syst Rev. 2018;(3):CD010512.
23. Hageman D, Fokkenrood HJ, Gommans LN, et al. Supervised exercise therapy versus home-based exercise therapy versus walking advice for intermittent claudication. Cochrane Database Syst Rev. 2018;(4):CD005263.
24. McDermott MM, Spring B, Berger JS, et al. Effect of a home-based exercise intervention of wearable technology and telephone coaching on walking performance in peripheral artery disease: the HONOR randomized clinical trial. JAMA. 2018;319:1665-1676.
25. Ruiz-Canela M, Estruch R, Corella D, et al. Association of Mediterranean diet with peripheral artery disease: the PREDIMED randomized trial. JAMA. 2014;311:415-417.
26. Zahradka P, Wright B, Weighell W, et al. Daily non-soy legume consumption reverses vascular impairment due to peripheral artery disease. Atherosclerosis. 2013;230:310-314.
27. Heart Protection Study Collaborative Group. Randomized trial of the effects of cholesterol-lowering with simvastatin on peripheral vascular and other major vascular outcomes in 20536 people with peripheral arterial disease and other high-risk conditions. J Vasc Surg. 2007;45:645-655.
28. Kumbhani DJ, Steg G, Cannon CP, et al. Statin therapy and long-term adverse limb outcomes in patients with peripheral artery disease: insights from the REACH registry. Eur Heart J. 2014;35:2864-2872.
29. Wong PF, Chong LY, Mikhailidis DP, et al. Antiplatelet agents for intermittent claudication. Cochrane Database Syst Rev. 2011;(11):CD001272.
30. Critical Leg Ischaemia Prevention Study (CLIPS) Group, Catalano M, Born G, Peto R. Prevention of serious vascular events by aspirin amongst patients with peripheral arterial disease: randomized, double-blind trial. J Intern Med. 2007;261:276-284.
31. Morley RL, Sharma A, Horsch AD, et al. Peripheral artery disease. BMJ. 2018;360:j5842.
32. Bedenis R, Stewart M, Cleanthis M, et al. Cilostazol for intermittent claudication. Cochrane Database Syst Rev. 2014;(10):CD003748.

33. Salhiyyah K, Forster R, Senanayake E, et al. Pentoxifylline for intermittent claudication. Cochrane Database Syst Rev. 2015;(9):CD005262.
34. Stewart M, Morling JR, Maxwell H. Padma 28 for intermittent claudication. Cochrane Database Syst Rev. 2016;(3):CD007371.
35. Kleijnen J, Mackerras D. Vitamin E for intermittent claudication. Cochrane Database Syst Rev. 1998;(1):CD000987.
36. Nicolai SPA, Kruidenior LM, Bendermacher BLW, et al. Ginkgo biloba for intermittent claudication. Cochrane Database Syst Rev. 2013;(6):CD006888.
37. Campbell A, Price J, Hiatt WR. Omega-3 fatty acids for intermittent claudication. Cochrane Database Syst Rev. 2013;(7):CD003833.
38. American Surgical Association, New York Surgical Society, Philadelphia Academy of Surgery, Southern Surgical Association (US), Central Surgical Association. Results of a prospective randomized trial evaluating surgery versus thrombolysis for ischemia of the lower extremity: the STILE trial. Ann Surg. 1994;220:251-268.
39. Ouriel K, Veith FJ, Sasahara AA.
40. Bradbury AW, Ruckley CV, Fowkes FGR, et al. Bypass versus angioplasty in severe ischaemia of the leg (BASIL): multicentre, randomised, controlled trial. Lancet. 2005;366:1925-1934.
41. Criqui MH, Langer RD, Fronek A, et al. Mortality over a period of 10 years in patients with peripheral arterial disease. N Engl J Med. 1992;326:381-386.
Peripheral arterial disease (PAD), the progressive disorder that results in ischemia to distal vascular territories as a result of atherosclerosis, spans a wide range of presentations, from minimally symptomatic disease to limb ischemia secondary to acute or chronic occlusion.
The prevalence of PAD is variable, due to differing diagnostic criteria used in studies, but PAD appears to affect 1 in every 22 people older than age 40.1 However, since PAD incidence increases with age, it is increasing in prevalence as the US population ages.1-3
PAD is associated with increased hospitalizations and decreased quality of life.4 Patients with PAD have an estimated 30% 5-year risk for myocardial infarction, stroke, or death from a vascular cause.3
Screening. Although PAD is underdiagnosed and appears to be undertreated,3 population-based screening for PAD in asymptomatic patients is not recommended. A Cochrane review found no studies evaluating the benefit of asymptomatic population-based screening.5 Similarly, in 2018, the USPSTF performed a comprehensive review and found no studies to support routine screening and determined there was insufficient evidence to recommend it.6,7
Risk factors and associated comorbidities
PAD risk factors, like the ones detailed below, have a potentiating effect. The presence of 2 risk factors doubles PAD risk, while 3 or more risk factors increase PAD risk by a factor of 10.1
Increasing age is the greatest single risk factor for PAD.1,2,8,9 Researchers using data from the National Health and Nutrition Examination Survey (NHANES) found that the prevalence of PAD increased from 1.4% in individuals ages 40 to 49 years to almost 17% in those age 70 or older.1
Demographic characteristics. Most studies demonstrate a higher risk for PAD in men.1-3,10 African-American patients have more than twice the risk for PAD, compared with Whites, even after adjustment for the increased prevalence of associated diseases such as hypertension and diabetes in this population.1-3,10
Continue to: Genetics...
Genetics. A study performed by the National Heart Lung and Blood Institute suggested that genetic correlations between twins were more important than environmental factors in the development of PAD.11
Smoking. Most population studies show smoking to be the greatest modifiable risk factor for PAD. An analysis of the NHANES data yielded an odds ratio (OR) of 4.1 for current smokers and of 1.8 for former smokers.1 Risk increases linearly with cumulative years of smoking.1,2,9,10
Diabetes is another significant modifiable risk factor, increasing PAD risk by 2.5 times.2 Diabetes is also associated with increases in functional limitation from claudication, risk for acute coronary syndrome, and progression to amputation.1
Hypertension nearly doubles the risk for PAD, and poor control further increases this risk.2,9,10
Chronic kidney disease (CKD). Patients with CKD have a progressively higher prevalence of PAD with worsening renal function.1 There is also an association between CKD and increased morbidity, revascularization failure, and increased mortality.1
Two additional risk factors that are less well understood are dyslipidemia and chronic inflammation. There is conflicting data regarding the role of individual components of cholesterol and their effect on PAD, although lipoprotein (a) has been shown to be an independent risk factor for both the development and progression of PAD.12 Similarly, chronic inflammation has been shown to play a role in the initiation and progression of the disease, although the role of inflammatory markers in evaluation and treatment is unclear and assessment for these purposes is not currently recommended.12,13
Continue to: Diagnosis...
Diagnosis
Clinical presentation
Lower extremity pain is the hallmark symptom of PAD, but presentation varies. The classic presentation is claudication, pain within a defined muscle group that occurs with exertion and is relieved by rest. Claudication is most common in the calf but also occurs in the buttock/thigh and the foot.
However, most patients with PAD present with pain that does not fit the definition of claudication. Patients with comorbidities, physical inactivity, and neuropathy are more likely to present with atypical pain.14 These patients may demonstrate critical or acute limb ischemia, characterized by pain at rest and most often localized to the forefoot and toes. Patients with critical limb ischemia may also present with nonhealing wounds/ulcers or gangrene.15
Physical exam findings can support the diagnosis of PAD, but none are reliable enough to rule the diagnosis in or out. Findings suggestive of PAD include cool skin, presence of a bruit (iliac, femoral, or popliteal), and palpable pulse abnormality. Multiple abnormal physical exam findings increase the likelihood of PAD, while the absence of a bruit or palpable pulse abnormality makes PAD less likely.16 In patients with PAD, an associated wound/ulcer is most often distal in the foot and usually appears dry.17
The differential diagnosis for intermittent leg pain is broad and includes neurologic, musculoskeletal, and venous etiologies. Table 118 lists some common alternate diagnoses for patients presenting with leg pain or claudication.
Continue to: Diagnostic testing...
Diagnostic testing
An ankle-brachial index (ABI) test should be performed in patients with history or physical exam findings suggestive of PAD. A resting ABI is performed with the patient in the supine position, with measurement of systolic blood pressure in both arms and ankles using a Doppler ultrasound device. Table 213 outlines ABI scoring and interpretation.
An ABI > 1.4 is an invalid measurement, indicating that the arteries are too calcified to be compressed. These highly elevated ABI measurements are common in patients with diabetes and/or advanced CKD. In these patients, a toe-brachial index (TBI) test should be performed, because the digital arteries are almost always compressible.13
Patients with symptomatic PAD who are under consideration for revascularization may benefit from radiologic imaging of the lower extremities with duplex ultrasound, computed tomography angiography, or magnetic resonance angiography to determine the anatomic location and severity of stenosis.13
Management of PAD
Lifestyle interventions
For patients with PAD, lifestyle modifications are an essential—but challenging—component of disease management.
Continue to: Smoking cessation...
Smoking cessation. As with other atherosclerotic diseases, PAD progression is strongly correlated with smoking. A trial involving 204 active smokers with PAD showed that 5-year mortality and amputation rates dropped by more than half in those who quit smoking within a year, with numbers needed to treat (NNT) of 6 for mortality and 5 for amputation.19 Because of this dramatic effect, American College of Cardiology/American Heart Association (ACC/AHA) guidelines encourage providers to address smoking at every visit and use cessation programs and medication to increase quit rates.13
Exercise may be the most important intervention for PAD. A 2017 Cochrane review found that supervised, structured exercise programs increase pain-free and maximal walking distances by at least 20% and also improve physical and mental quality of life.20 In a trial involving 111 patients with aortoiliac PAD, supervised exercise plus medical care led to greater functional improvement than either revascularization plus medical care or medical care alone.21 In a 2018 Cochrane review, neither revascularization or revascularization added to supervised exercise were better than supervised exercise alone.22 ACC/AHA guidelines recommend supervised exercise programs for claudication prior to considering revascularization.13TABLE 313 outlines the components of a structured exercise program.
Unfortunately, the benefit of these programs has been difficult to reproduce without supervision. Another 2018 Cochrane review demonstrated significant improvement with supervised exercise and no clear improvement in patients given home exercise or advice to walk.23 A recent study examined the effect of having patients use a wearable fitness tracker for home exercise and demonstrated no benefit over usual care.24
Diet. There is some evidence that dietary interventions can prevent and possibly improve PAD. A large randomized controlled trial showed that a Mediterranean diet lowered rates of PAD over 1 year compared to a low-fat diet, with an NNT of 336 if supplemented with extra-virgin olive oil and 448 if supplemented with nuts.25 A small trial of 25 patients who consumed non-soy legumes daily for 8 weeks showed average ABI improvement of 6%, although there was no control group.26
Medical therapy to address peripheral and cardiovascular events
Standard medical therapy for coronary artery disease (CAD) is recommended for patients with PAD to reduce cardiovascular and limb events. For example, treatment of hypertension reduces cardiovascular and cerebrovascular events, and studies verify that lowering blood pressure does not worsen claudication or limb perfusion.
13TABLE 413,27-30 outlines the options for medical therapy.
Continue to: Statins...
Statins reduce cardiovascular events in PAD patients. A large study demonstrated that 40 mg of simvastatin has an NNT of 21 to prevent a coronary or cerebrovascular event in PAD, similar to the NNT of 23 seen in treatment of CAD.27 Statins also reduce adverse limb outcomes. A registry of atherosclerosis patients showed that statins have an NNT of 56 to prevent amputation in PAD and an NNT of 28 to prevent worsening claudication, critical limb ischemia, revascularization, or amputation.28
Antiplatelet therapy with low-dose aspirin or clopidogrel is recommended for symptomatic patients and for asymptomatic patients with an ABI ≤ 0.9.13 A Cochrane review demonstrated significantly reduced mortality with nonaspirin antiplatelet agents vs aspirin (NNT = 94) without increase in major bleeding.29 Only British guidelines specifically recommend clopidogrel over aspirin.31
Dual antiplatelet therapy has not shown consistent benefits over aspirin alone. ACC/AHA guidelines state that dual antiplatelet therapy is not well established for PAD but may be reasonable after revascularization.13
Voraxapar is a novel antiplatelet agent that targets the thrombin-binding receptor on platelets. However, trials show no significant coronary benefit, and slight reductions in acute limb ischemia are offset by increases in major bleeding.13
For patients receiving medical therapy, ongoing evaluation and treatment should be based on claudication symptoms and clinical assessment.
Medical therapy for claudication
Several medications have been proposed for symptomatic treatment of intermittent claudication. Cilostazol is a phosphodiesterase inhibitor with the best risk-benefit ratio. A Cochrane review showed improvements in maximal and pain-free walking distances compared to placebo and improvements in quality of life with cilostazol 100 mg taken twice daily.32 Adverse effects included headache, dizziness, palpitations, and diarrhea.29
Continue to: Pentoxifylline...
Pentoxifylline is another phosphodiesterase inhibitor with less evidence of improvement, higher adverse effect rates, and more frequent dosing. It is not recommended for treatment of intermittent claudication.13,33
Supplements. Padma 28, a Tibetan herbal formulation, appears to improve maximal walking distance with adverse effect rates similar to placebo.34 Other supplements, including vitamin E, ginkgo biloba, and omega-3 fatty acids, have no evidence of benefit.35-37
When revascularizationis needed
Patients who develop limb ischemia or lifestyle-limiting claudication despite conservative therapy are candidates for revascularization. Endovascular techniques include angioplasty, stenting, atherectomy, and precise medication delivery. Surgical approaches mainly consist of thrombectomy and bypass grafting. For intermittent claudication despite conservative care, ACC/AHA guidelines state endovascular procedures are appropriate for aortoiliac disease and reasonable for femoropopliteal disease, but unproven for infrapopliteal disease.13
Acute limb ischemia is an emergency requiring immediate intervention. Two trials revealed identical overall and amputation-free survival rates for percutaneous thrombolysis and surgical thrombectomy.38,39 ACC/AHA guidelines recommend anticoagulation with heparin followed by the revascularization technique that will most rapidly restore arterial flow.13
For chronic limb ischemia, a large trial showed angioplasty had lower initial morbidity, length of hospitalization, and cost than surgical repair. However, surgical mortality was lower after 2 years.40 ACC/AHA guidelines recommend either surgery or endovascular procedures and propose initial endovascular treatment followed by surgery if needed.13 After revascularization, the patient should be followed periodically with a clinical evaluation and ABI measurement with further consideration for routine duplex ultrasound surveillance.13
Outcomes
Patients with PAD have variable outcomes. About 70% to 80% of patients with this diagnosis will have a stable disease process with no worsening of symptoms, 10% to 20% will experience worsening symptoms over time, 5% to 10% will require revascularization within 5 years of diagnosis, and 1% to 5% will progress to critical limb ischemia, which has a 5-year amputation rate of 1% to 4%.2 Patients who require amputation have poor outcomes: Within 2 years, 30% are dead and 15% have had further amputations.18
In addition to the morbidity and mortality from its own progression, PAD is an important predictor of CAD and is associated with a significant elevation in morbidity and mortality from CAD. One small but well-designed prospective cohort study found that patients with PAD had a more than 6-fold increased risk of death from CAD than did patients without PAD.41
Acknowledgement
The authors thank Francesca Cimino, MD, FAAFP, for her help in reviewing this manuscript.
CORRESPONDENCE
Dustin K. Smith, DO, 2080 Child Street, Jacksonville, FL 32214; [email protected]
1. Eraso LH, Fukaya E, Mohler ER 3rd, et al. Peripheral arterial disease, prevalence and cumulative risk factor profile analysis. Eur J Prev Cardiol. 2014;21:704-711.
2. Pasternak RC, Criqui MH, Benjamin EJ, et al; American Heart Association. Atherosclerotic Vascular Disease Conference: Writing Group I: epidemiology. Circulation. 2004;109:2605-2612.
3. Hirsch AT, Criqui MH, Treat-Jacobson D, et al. Peripheral arterial disease detection, awareness, and treatment in primary care. JAMA. 2001;286:1317-1324.
4. Olin JW, Sealove BA. Peripheral artery disease: current insight into the disease and its diagnosis and management. Mayo Clin Proc. 2010;85:678-692.
5. Andras A, Ferkert B. Screening for peripheral arterial disease. Cochrane Database Syst Rev. 2014;(4):CD010835.
6. Guirguis-Blake JM, Evans CV, Redmond N, et al. Screening for peripheral artery disease using ankle-brachial index: updated evidence report and systematic review for the US Preventive Services Task Force. JAMA. 2018;320:184-196.
7. US Preventive Services Task Force. Screening for peripheral artery disease and cardiovascular disease risk assessment with ankle-brachial index: US Preventive Services Task Force recommendation statement. JAMA. 2018;230:177-183.
8. American Heart Association Writing Group 2. Atherosclerotic Peripheral Vascular Disease Symposium II: screening for atherosclerotic vascular diseases: should nationwide programs be instituted? Circulation. 2008;118:2830-2836.
9. Berger JS, Hochman J, Lobach I, et al. Modifiable risk factor burden and the prevalence of peripheral artery disease in different vascular territories. J Vasc Surg. 2013;58:673-681.
10. Joosten MM, Pai JK, Bertoia ML, et al. Associations between conventional cardiovascular risk factors and risk of peripheral artery disease in men. JAMA. 2012;308:1660-1667.
11. Carmelli D, Fabsitz RR, Swan GE, et al. Contribution of genetic and environmental influences to ankle-brachial blood pressure index in the NHLBI Twin Study. National Heart, Lung, and Blood Institute. Am J Epidemiol. 2000;151:452-458.
12. Aboyans V, Criqui MH, Denenberg JO, et al. Risk factors for progression of peripheral arterial disease in large and small vessels. Circulation. 2006;113:2623-2629.
13. Gerald-Herman MD, Gornik HL, Barrett C, et al. 2016 AHA/ACC guideline on the management of patients with lower extremity peripheral artery disease: a report of the American College of Cardiology/American Heart Association Task Force on Clinical Practice Guidelines. Circulation. 2017;135:e726-e779.
14. McDermott MM, Greenland P, Liu K, et al. Leg symptoms in peripheral arterial disease: associated clinical characteristics and functional impairment. JAMA. 2001;286:1599-1606.
15. Cranley JJ. Ischemic rest pain. Arch Surg. 1969;98:187-188.
16. Khan NA, Rahim SA, Anand SS, et al. Does the clinical examination predict lower extremity peripheral arterial disease? JAMA. 2006;295:536-546.
17. Wennberg PW. Approach to the patient with peripheral arterial disease. Circulation. 2013;128:2241-2250.
18. Norgren L, Hiatt WR, Dormandy JA, et al. Inter-society consensus for the management of peripheral arterial disease (TASC II). Eur J Vas Endovasc Surg. 2007;33:S1-S75.
19. Armstrong EJ, Wu J, Singh GD, et al. Smoking cessation is associated with decreased mortality and improved amputation-free survival among patients with symptomatic peripheral artery disease. J Vasc Surg. 2014;60:1565-1571.
20. Lane R, Harwood A, Watson L, et al. Exercise for intermittent claudication. Cochrane Database Syst Rev. 2017;(12):CD000990.
21. Murphy TP, Cutlip DE, Regensteiner JG, et al; CLEVER Study Investigators. Supervised exercise versus primary stenting for claudication resulting from aortoiliac peripheral artery disease: six-month outcomes from the claudication: exercise versus endoluminal revascularization (CLEVER) study. Circulation. 2012;125:130-139.
22. Fakhry F, Fokkenrood HJP, Pronk S, et al. Endovascular revascularization versus conservative management for intermittent claudication. Cochrane Database Syst Rev. 2018;(3):CD010512.
23. Hageman D, Fokkenrood HJ, Gommans LN, et al. Supervised exercise therapy versus home-based exercise therapy versus walking advice for intermittent claudication. Cochrane Database Syst Rev. 2018;(4):CD005263.
24. McDermott MM, Spring B, Berger JS, et al. Effect of a home-based exercise intervention of wearable technology and telephone coaching on walking performance in peripheral artery disease: the HONOR randomized clinical trial. JAMA. 2018;319:1665-1676.
25. Ruiz-Canela M, Estruch R, Corella D, et al. Association of Mediterranean diet with peripheral artery disease: the PREDIMED randomized trial. JAMA. 2014;311:415-417.
26. Zahradka P, Wright B, Weighell W, et al. Daily non-soy legume consumption reverses vascular impairment due to peripheral artery disease. Atherosclerosis. 2013;230:310-314.
27. Heart Protection Study Collaborative Group. Randomized trial of the effects of cholesterol-lowering with simvastatin on peripheral vascular and other major vascular outcomes in 20536 people with peripheral arterial disease and other high-risk conditions. J Vasc Surg. 2007;45:645-655.
28. Kumbhani DJ, Steg G, Cannon CP, et al. Statin therapy and long-term adverse limb outcomes in patients with peripheral artery disease: insights from the REACH registry. Eur Heart J. 2014;35:2864-2872.
29. Wong PF, Chong LY, Mikhailidis DP, et al. Antiplatelet agents for intermittent claudication. Cochrane Database Syst Rev. 2011;(11):CD001272.
30. Critical Leg Ischaemia Prevention Study (CLIPS) Group, Catalano M, Born G, Peto R. Prevention of serious vascular events by aspirin amongst patients with peripheral arterial disease: randomized, double-blind trial. J Intern Med. 2007;261:276-284.
31. Morley RL, Sharma A, Horsch AD, et al. Peripheral artery disease. BMJ. 2018;360:j5842.
32. Bedenis R, Stewart M, Cleanthis M, et al. Cilostazol for intermittent claudication. Cochrane Database Syst Rev. 2014;(10):CD003748.
33. Salhiyyah K, Forster R, Senanayake E, et al. Pentoxifylline for intermittent claudication. Cochrane Database Syst Rev. 2015;(9):CD005262.
34. Stewart M, Morling JR, Maxwell H. Padma 28 for intermittent claudication. Cochrane Database Syst Rev. 2016;(3):CD007371.
35. Kleijnen J, Mackerras D. Vitamin E for intermittent claudication. Cochrane Database Syst Rev. 1998;(1):CD000987.
36. Nicolai SPA, Kruidenior LM, Bendermacher BLW, et al. Ginkgo biloba for intermittent claudication. Cochrane Database Syst Rev. 2013;(6):CD006888.
37. Campbell A, Price J, Hiatt WR. Omega-3 fatty acids for intermittent claudication. Cochrane Database Syst Rev. 2013;(7):CD003833.
38. American Surgical Association, New York Surgical Society, Philadelphia Academy of Surgery, Southern Surgical Association (US), Central Surgical Association. Results of a prospective randomized trial evaluating surgery versus thrombolysis for ischemia of the lower extremity: the STILE trial. Ann Surg. 1994;220:251-268.
39. Ouriel K, Veith FJ, Sasahara AA.
40. Bradbury AW, Ruckley CV, Fowkes FGR, et al. Bypass versus angioplasty in severe ischaemia of the leg (BASIL): multicentre, randomised, controlled trial. Lancet. 2005;366:1925-1934.
41. Criqui MH, Langer RD, Fronek A, et al. Mortality over a period of 10 years in patients with peripheral arterial disease. N Engl J Med. 1992;326:381-386.
PRACTICE RECOMMENDATIONS
❯ Use the ankle-brachial index for diagnosis in patients with history/physical exam findings suggestive of peripheral arterial disease (PAD). A
❯ Strongly encourage smoking cessation in patients with PAD as doing so reduces 5-year mortality and amputation rates. B
❯ Use structured exercise programs for patients with intermittent claudication prior to consideration of revascularization; doing so offers similar benefit and lower risks. A
❯ Recommend revascularization for patients who have limb ischemia or lifestyle-limiting claudication despite medical and exercise therapy. B
Strength of recommendation (SOR)
A Good-quality patient-oriented evidence
B Inconsistent or limited-quality patient-oriented evidence
C Consensus, usual practice, opinion, disease-oriented evidence, case series

Home visits: A practical approach
CASE
Mr. A is a 30-year-old man with neurofibromatosis and myelopathy with associated quadriplegia, complicated by dysphasia and chronic hypercapnic respiratory failure requiring a tracheostomy. He is cared for at home by his very competent mother but requires regular visits with his medical providers for assistance with his complex care needs. Due to logistical challenges, he had been receiving regular home visits even before the COVID-19 pandemic.
After estimating the risk of exposure to the patient, Mr. A’s family and his physician’s office staff scheduled a home visit. Before the appointment, the doctor conducted a virtual visit with the patient and family members to screen for COVID-19 infection, which proved negative. The doctor arranged a visit to coincide with Mr. A’s regular appointment with the home health nurse. He invited the patient’s social worker to attend, as well.
The providers donned masks, face shields, and gloves before entering the home. Mr. A’s temperature was checked and was normal. The team completed a physical exam, assessed the patient’s current needs, and refilled prescriptions. The doctor, nurse, and social worker met afterward in the family’s driveway to coordinate plans for the patient’s future care.
This encounter allowed a vulnerable patient with special needs to have access to care while reducing his risk of undesirable exposure. Also, his health care team’s provision of care in the home setting reduced Mr. A’s anxiety and that of his family members.
Home visits have long been an integral part of what it means to be a family physician. In 1930, roughly 40% of all patient-physician encounters in the United States occurred in patients’ homes. By 1980, this number had dropped to < 1%.1 Still, a 1994 survey of American doctors in 3 primary care specialties revealed that 63% of family physicians, more than the other 2 specialties, still made house calls.2 A 2016 analysis of Medicare claims data showed that between 2006 and 2011, only 5% of American doctors overall made house calls on Medicare recipients, but interestingly, the total number of home visits was increasing.3
This resurgence of interest in home health care is due in part to the increasing number of homebound patients in America, which exceeds the number of those in nursing homes.4 Further, a growing body of evidence indicates that home visits improve patient outcomes. And finally, many family physicians whose work lives have been centered around a busy office or hospital practice have found satisfaction in once again seeing patients in their own homes.
The COVID-19 pandemic has of course presented unique challenges—and opportunities, too—for home visits, which we discuss at the end of the article.
Why aren’t more of us making home visits?
For most of us, the decision not to make home visits is simply a matter of time and money. Although Medicare reimbursement for a home visit is typically about 150% that of a comparable office visit,5 it’s difficult, if not impossible, to make 2 home visits in the time you could see 3 patients in the office. So, economically it’s a net loss. Furthermore, we tend to feel less comfortable in our patients’ homes than in our offices. We have less control outside our own environment, and what happens away from our office is often less predictable—sometimes to the point that we may be concerned for our safety.
Continue to: So why make home visits at all?
So why make home visits at all?
First and foremost, home visits improve patient outcomes. This is most evident in our more vulnerable patients: newborns and the elderly, those who have been recently hospitalized, and those at risk because of their particular home situation. Multiple studies have shown that, for elders, home visits reduce functional decline, nursing home admissions, and mortality by around 25% to 33%.6-8 For those at risk of abuse, a recent systematic review showed that home visits reduce intimate partner violence and child abuse.9 Another systematic review demonstrated that patients with diabetes who received home visits vs usual care were more likely to show improvements in quality of life.10 These patients were also more likely to have lower HbA1c levels and lower systolic blood pressure readings.10 A few caveats apply to these studies:
- all of them targeted “vulnerable” patients
- most studies enlisted interdisciplinary teams and had regular team meetings
- most findings reached significance only after multiple home visits.
A further reason for choosing to become involved in home care is that it builds relationships, understanding, and empathy with our patients. “There is deep symbolism in the home visit.... It says, ‘I care enough about you to leave my power base … to come and see you on your own ground.’”11 And this benefit is 2-way; we also grow to understand and appreciate our patients better, especially if they are different from us culturally or socioeconomically.
Home visits allow the medical team to see challenges the patient has grown accustomed to, and perhaps ones that the patient has deemed too insignificant to mention. For the patient, home visits foster a strong sense of trust with the individual doctor and our health delivery network, and they decrease the need to seek emergency services. Finally, it has been demonstrated that provider satisfaction improves when home visits are incorporated into the work week.12
What is the role of community health workers in home-based care?
Community health workers (CHWs), defined as “frontline public health workers who are trusted members of and/or have an unusually close understanding of the community they serve,”13 can be an integral part of the home-based care team. Although CHWs have variable amounts of formal training, they have a unique perspective on local health beliefs and practices, which can assist the home-care team in providing culturally competent health care services and reduce health care costs.
In a study of children with asthma in Seattle, Washington, patients were randomized to a group that had 4 home visits by CHWs and a group that received usual care. The group that received home visits demonstrated more asthma symptom–free days, improved quality-of-life scores, and fewer urgent care visits.14 Furthermore, the intervention was estimated to save approximately $1300 per patient, resulting in a return on investment of 190%. Similarly, in a study comparing inappropriate emergency department (ED) visits between children who received CHW visits and those who did not, patients in the intervention group were significantly less likely to visit the ED for ambulatory complaints (18.2% vs 35.1%; P = .004).15
Continue to: What is the role of social workersin home-based care?
What is the role of social workersin home-based care?
Social workers can help meet the complex medical and biopsychosocial needs of the homebound population.16 A study by Cohen et al based in Israel concluded that homebound participants had a significantly higher risk for mortality, higher rates of depression, and difficulty completing instrumental activities of daily living when compared with their non-homebound counterparts.17
The Mount Sinai (New York) Visiting Doctors Program (MSVD) is a home-based care team that uses social workers to meet the needs of their complex patients.18 The social workers in the MSVD program provide direct counseling, make referrals to government and community resources, and monitor caregiver burden. Using a combination of measurement tools to assess caregiver burden, Ornstein et al demonstrated that the MSVD program led to a decrease in unmet needs and in caregiver burden.19,20 Caregiver burnout can be assessed using the Caregiver Burden Inventory, a validated 24-item questionnaire.21
What electronic tools are availableto monitor patients at home?
Although expensive in terms of both dollars and personnel time, telemonitoring allows home care providers to receive real-time, updated information regarding their patients.
Chronic obstructive pulmonary disease (COPD). One systematic review showed that although telemonitoring of patients with COPD improved quality of life and decreased COPD exacerbations, it did not reduce the risk of hospitalization and, therefore, did not reduce health care costs.22 Telemonitoring in COPD can include transmission of data about spirometry parameters, weight, temperature, blood pressure, sputum color, and 6-minute walk distance.23,24
Congestive heart failure (CHF). A 2010 Cochrane review found that telemonitoring of patients with CHF reduced all-cause mortality (risk ratio [RR] = 0.66; P < .0001).25 The Telemedical Interventional Management in Heart Failure II (TIM-HF2) trial,conducted from 2013 to 2017, compared usual care for CHF patients with care incorporating daily transmission of body weight, blood pressure, heart rate, electrocardiogram tracings, pulse oximetry, and self-rated health status.26 This study showed that the average number of days lost per year due to hospital admission was less in the telemonitoring group than in the usual care group (17.8 days vs. 24.2 days; P = .046). All-cause mortality was also reduced in the telemonitoring group (hazard ratio = 0.70; P = .028).
Continue to: What role do “home hospitals” play?
What role do “home hospitals” play?
Home hospitals provide acute or subacute treatment in a patient’s home for a condition that would normally require hospitalization.27 In a meta-analysis of 61 studies evaluating the effectiveness of home hospitals, this option was more likely to reduce mortality (odds ratio [OR] = 0.81; P = .008) and to reduce readmission rates (OR = 0.75; P = .02).28 In a study of 455 older adults, Leff et al found that hospital-at-home was associated with a shorter length of stay (3.2 vs. 4.9 days; P = .004) and that the mean cost was lower for hospital-at-home vs traditional hospital care.29
However, a 2016 Cochrane review of 16 randomized controlled trials comparing hospital-at-home with traditional hospital care showed that while care in a hospital-at-home may decrease formal costs, if costs for caregivers are taken into account, any difference in cost may disappear.30
Although the evidence for cost saving is variable, hospital-at-home admission has been shown to reduce the likelihood of living in a residential care facility at 6 months (RR = 0.35; P < .0001).30 Further, the same Cochrane review showed that admission avoidance may increase patient satisfaction with the care provided.30
Finally, a recent randomized trial in a Boston-area hospital system showed that patients cared for in hospital-at-home were significantly less likely to be readmitted within 30 days and that adjusted cost was about two-thirds the cost of traditional hospital care.31
What is the physician’s rolein home health care?
While home health care is a team effort, the physician has several crucial roles. First, he or she must make the determination that home care is appropriate and feasible for a particular patient. Appropriate, meaning there is evidence that this patient is likely to benefit from home care. Feasible, meaning there are resources available in the community and family to safely care for the patient at home. “Often a house call will serve as the first step in developing a home-based-management plan.”32
Continue to: Second, the physician serves...
Second, the physician serves an important role in directing and coordinating the team of professionals involved. This primarily means helping the team to communicate with one another. Before home visits begin, the physician’s office should reach out not only to the patient and family, but also to any other health care personnel involved in the patient’s home care. Otherwise, many of the health care providers involved will never have face-to-face interaction with the physician. Creation of the coordinated health team minimizes duplication and miscommunication; it also builds a valuable bond.
How does one go about making a home visit?
Scheduling. What often works best in a busy practice is to schedule home visits for the end of the workday or to devote an entire afternoon to making home visits to several patients in one locale. Also important is scheduling times, if possible, when important family members or other caregivers are at home or when other members of the home care team can accompany you.
What to bring along. Carry a “home visit bag” that includes equipment you’re likely to need and that is not available away from your office. A minimally equipped visit bag would include different-sized blood pressure cuffs, a glucometer, a pulse oximeter, thermometers, and patient education materials. Other suggested contents are listed in TABLE 1.

Dos and don’ts. Take a few minutes when you first arrive to simply visit with the patient. Sit down and introduce yourself and any members of the home care team that the patient has not met. Take an interim history. While you’re doing this, be observant: Is the home neat or cluttered? Is the indoor temperature comfortable? Are there fall hazards? Is there a smell of cigarette smoke? Are there any indoor combustion sources (eg, wood stove or kerosene heater)? Ask questions such as: Who lives here with you? Can you show me where you keep your medicines? (If the patient keeps insulin or any other medicines in the refrigerator, ask to see it. Note any apparent food scarcity.)
During your exam, pay particular attention to whether vital signs are appreciably different than those measured in the office or hospital. Pay special attention to the patient’s functional abilities. “A subtle, but critical distinction between medical management in the home and medical management in the hospital, clinic, or office is the emphasis on the patient’s functional abilities, family assistance, and environmental factors.”33
Observe the patient’s use of any home technology, if possible; this can be as simple as home oxygenation or as complex as home hemodialysis. Assess for any apparent caregiver stress. Finally, don’t neglect to offer appropriate emotional and spiritual support to the patient and family and to schedule the next follow-up visit before you leave.
Continue to: Documentation and reimbursement.
Documentation and reimbursement. While individual electronic medical records may require use of particular forms of documentation, using a home visit template when possible can be extremely helpful (TABLE 2). A template not only assures thoroughness and consistency (pharmacy, home health contacts, billing information) but also serves as a prompt to survey the patient and the caregivers about nonmedical, but essential, social and well-being services. The document should be as simple and user-friendly as possible.

Not all assessments will be able to be done at each visit but seeing them listed in the template can be helpful. Billing follows the same principles as for office visits and has similar requirements for documentation. Codes for the most common types of home visits are listed in TABLE 3.
Where can I get help?
Graduates of family medicine residency programs are required to receive training in home visits by the Accreditation Council for Graduate Medical Education (ACGME). Current ACGME program requirements stipulate that “residents must demonstrate competence to independently diagnose, manage, and integrate the care of patients of all ages in various outpatient settings, including the FMP [family medicine practice] site and home environment,” and “residents must be primarily responsible for a panel of continuity patients, integrating each patient’s care across all settings, including the home ...” [emphasis added].34

For those already in practice, one of the hardest parts of doing home visits is feeling alone, especially if few other providers in your community engage in home care. As you run into questions and challenges with incorporating home care of patients into your practice, one excellent resource is the American Academy of Home Care Medicine (www.aahcm.org/). Founded in 1988 and headquartered in Chicago, it not only provides numerous helpful resources, but serves as a networking tool for physicians involved in home care.
This unprecedented pandemichas allowed home visits to shine
As depicted in our opening patient case, patients who have high-risk conditions and those who are older than 65 years of age may be cared for more appropriately in a home visit rather than having them come to the office. Home visits may also be a way for providers to “lay eyes” on patients who do not have technology available to participate in virtual visits.
Before performing a home visit, inquire as to whether the patient has symptoms of COVID-19. Adequate PPE should be donned at all times and social distancing should be practiced when appropriate. With adequate PPE, home visits may also allow providers to care for low-risk patients known to have COVID-19 and thereby minimize risks to staff and other patients in the office. JFP
CORRESPONDENCE
Curt Elliott, MD, Prisma Health USC Family Medicine Center, 3209 Colonial Drive, Columbia, SC 29203; [email protected].
1. Unwin BK, Tatum PE. House calls. Am Fam Physician. 2011;83:925-938.
3. Sairenji T, Jetty A, Peterson LE. Shifting patterns of physician home visits. J Prim Care Community Health. 2016;7:71-75.
4. Ornstein KA, Leff B, Covinsky K, et al. Epidemiology of the homebound population in the United States. JAMA Intern Med. 2015;175;1180-1186.
5. CMS. Current Procedural Terminology, Fourth Edition ("CPT®"). www.cms.gov/apps/physician-fee-schedule/license-agreement.aspx. Accessed November 30, 2020.
6. Elkan R, Kendrick D, Dewey M, et al. Effectiveness of home based support for older people: systematic review and meta-analysis. BMJ. 2001;323:719-725.
7. Stuck AE, Egger M, Hammer A, et al. Home visits to prevent nursing home admission and functional decline in elderly people: systematic review and meta-regression analysis. JAMA. 2002;287:1022-1028.
8. Stall N, Nowaczynski M, Sinha SK. Systematic review of outcomes from home-based primary care programs for homebound older adults. J Am Geriatr Soc. 2014;62:2243-2251.
9. Prosman GJ, Lo Fo Wong SH, van der Wouden JC, et al. Effectiveness of home visiting in reducing partner violence for families experiencing abuse: a systematic review. Fam Pract. 2015;32:247-256.
10. Han L, Ma Y, Wei S, et al. Are home visits an effective method for diabetes management? A quantitative systematic review and meta-analysis. J Diabetes Investig. 2017;8:701-708.
11. McWhinney IR. Fourth annual Nicholas J. Pisacano Lecture. The doctor, the patient, and the home: returning to our roots. J Am Board Fam Pract. 1997;10:430-435.
12. Kao H, Conant R, Soriano T, et al. The past, present, and future of house calls. Clin Geriatr Med. 2009;25:19-34.
13. American Public Health Association. Community health workers. www.apha.org/apha-communities/member-sections/community-health-workers. Accessed November 30, 2020.
14. Campbell JD, Brooks M, Hosokawa P, et al. Community health worker home visits for Medicaid-enrolled children with asthma: effects on asthma outcomes and costs. Am J Public Health. 2015;105:2366-2372.
15. Anugu M, Braksmajer A, Huang J, et al. Enriched medical home intervention using community health worker home visitation and ED use. Pediatrics. 2017;139:e20161849.
16. Reckrey JM, Gettenberg G, Ross H, et al. The critical role of social workers in home-based primary care. Soc Work in Health Care. 2014;53:330-343.
17. Cohen-Mansfield J, Shmotkin D, Hazan H. The effect of homebound status on older persons. J Am Geriatr Soc. 2010;58:2358-2362.
18. Mt. Sinai Visiting Doctors Program. www.mountsinai.org/care/primary-care/upper-east-side/visiting-doctors/about. Accessed November 30, 2020.
19. Ornstein K, Hernandez CR, DeCherrie LV, et al. The Mount Sinai (New York) Visiting Doctors Program: meeting the needs of the urban homebound population. Care Manag J. 2011;12:159-163.
20. Ornstein K, Smith K, Boal J. Understanding and improving the burden and unmet needs of informal caregivers of homebound patients enrolled in a home-based primary care program. J Appl Gerontol. 2009;28:482-503.
21. Novak M, Guest C. Application of a multidimensional caregiver burden inventory. Gerontologist. 1989;29:798-803.
22. Cruz J, Brooks D, Marques A. Home telemonitoring effectiveness in COPD: a systematic review. Int J Clin Pract. 2014;68:369-378.
23. Antoniades NC, Rochford PD, Pretto JJ, et al. Pilot study of remote telemonitoring in COPD. Telemed J E Health. 2012;18:634-640.
24. Koff PB, Jones RH, Cashman JM, et al. Proactive integrated care improves quality of life in patients with COPD. Eur Respir J. 2009;33:1031-1038.
25. Inglis SC, Clark RA, McAlister FA, et al. Which components of heart failure programmes are effective? A systematic review and meta-analysis of the outcomes of structured telephone support or telemonitoring as the primary component of chronic heart failure management in 8323 patients: abridged Cochrane review. Eur J Heart Fail. 2011;13:1028-1040.
26. Koehler F, Koehler K, Deckwart O, et al. Efficacy of telemedical interventional management in patients with heart failure (TIM-HF2): a randomised, controlled, parallel-group, unmasked trial. Lancet. 2018;392:1047-1057.
27. Ticona L, Schulman KA. Extreme home makeover–the role of intensive home health care. New Eng J Med. 2016;375:1707-1709.
28. Caplan GA. A meta-analysis of “hospital in the home.” Med J Aust. 2013;198:195-196.
29. Leff B, Burton L, Mader SL, et al. Hospital at home: feasibility and outcomes of a program to provide hospital-level care at home for acutely ill older patients. Ann Intern Med. 2005;143:798-808.
30. Shepperd S, Iliffe S, Doll HA, et al. Admission avoidance hospital at home. Cochrane Database Syst Rev. 2016;9:CD007491.
31. Levine DM, Ouchi K, Blanchfield B, et al. Hospital-level care at home for acutely ill adults: a randomized controlled trial. Ann Intern Med. 2020;172:77-85.
32. Cornwell T and Schwartzberg JG, eds. Medical Management of the Home Care Patient: Guidelines for Physicians. 4th ed. Chicago, IL: American Medical Association and American Academy of Home Care Physicians; 2012:p18.
33. Cornwell T and Schwartzberg JG, eds. Medical Management of the Home Care Patient: Guidelines for Physicians. 4th ed. Chicago, IL: American Medical Association and American Academy of Home Care Physicians; 2012:p19.
34. Accreditation Council for Graduate Medical Education. ACGME Program Requirements for Graduate Medical Education in Family Medicine. www.acgme.org/Portals/0/PFAssets/ProgramRequirements/120_FamilyMedicine_2020.pdf. (section IV.C.1.b). Accessed November 30, 2020.
CASE
Mr. A is a 30-year-old man with neurofibromatosis and myelopathy with associated quadriplegia, complicated by dysphasia and chronic hypercapnic respiratory failure requiring a tracheostomy. He is cared for at home by his very competent mother but requires regular visits with his medical providers for assistance with his complex care needs. Due to logistical challenges, he had been receiving regular home visits even before the COVID-19 pandemic.
After estimating the risk of exposure to the patient, Mr. A’s family and his physician’s office staff scheduled a home visit. Before the appointment, the doctor conducted a virtual visit with the patient and family members to screen for COVID-19 infection, which proved negative. The doctor arranged a visit to coincide with Mr. A’s regular appointment with the home health nurse. He invited the patient’s social worker to attend, as well.
The providers donned masks, face shields, and gloves before entering the home. Mr. A’s temperature was checked and was normal. The team completed a physical exam, assessed the patient’s current needs, and refilled prescriptions. The doctor, nurse, and social worker met afterward in the family’s driveway to coordinate plans for the patient’s future care.
This encounter allowed a vulnerable patient with special needs to have access to care while reducing his risk of undesirable exposure. Also, his health care team’s provision of care in the home setting reduced Mr. A’s anxiety and that of his family members.
Home visits have long been an integral part of what it means to be a family physician. In 1930, roughly 40% of all patient-physician encounters in the United States occurred in patients’ homes. By 1980, this number had dropped to < 1%.1 Still, a 1994 survey of American doctors in 3 primary care specialties revealed that 63% of family physicians, more than the other 2 specialties, still made house calls.2 A 2016 analysis of Medicare claims data showed that between 2006 and 2011, only 5% of American doctors overall made house calls on Medicare recipients, but interestingly, the total number of home visits was increasing.3
This resurgence of interest in home health care is due in part to the increasing number of homebound patients in America, which exceeds the number of those in nursing homes.4 Further, a growing body of evidence indicates that home visits improve patient outcomes. And finally, many family physicians whose work lives have been centered around a busy office or hospital practice have found satisfaction in once again seeing patients in their own homes.
The COVID-19 pandemic has of course presented unique challenges—and opportunities, too—for home visits, which we discuss at the end of the article.
Why aren’t more of us making home visits?
For most of us, the decision not to make home visits is simply a matter of time and money. Although Medicare reimbursement for a home visit is typically about 150% that of a comparable office visit,5 it’s difficult, if not impossible, to make 2 home visits in the time you could see 3 patients in the office. So, economically it’s a net loss. Furthermore, we tend to feel less comfortable in our patients’ homes than in our offices. We have less control outside our own environment, and what happens away from our office is often less predictable—sometimes to the point that we may be concerned for our safety.
Continue to: So why make home visits at all?
So why make home visits at all?
First and foremost, home visits improve patient outcomes. This is most evident in our more vulnerable patients: newborns and the elderly, those who have been recently hospitalized, and those at risk because of their particular home situation. Multiple studies have shown that, for elders, home visits reduce functional decline, nursing home admissions, and mortality by around 25% to 33%.6-8 For those at risk of abuse, a recent systematic review showed that home visits reduce intimate partner violence and child abuse.9 Another systematic review demonstrated that patients with diabetes who received home visits vs usual care were more likely to show improvements in quality of life.10 These patients were also more likely to have lower HbA1c levels and lower systolic blood pressure readings.10 A few caveats apply to these studies:
- all of them targeted “vulnerable” patients
- most studies enlisted interdisciplinary teams and had regular team meetings
- most findings reached significance only after multiple home visits.
A further reason for choosing to become involved in home care is that it builds relationships, understanding, and empathy with our patients. “There is deep symbolism in the home visit.... It says, ‘I care enough about you to leave my power base … to come and see you on your own ground.’”11 And this benefit is 2-way; we also grow to understand and appreciate our patients better, especially if they are different from us culturally or socioeconomically.
Home visits allow the medical team to see challenges the patient has grown accustomed to, and perhaps ones that the patient has deemed too insignificant to mention. For the patient, home visits foster a strong sense of trust with the individual doctor and our health delivery network, and they decrease the need to seek emergency services. Finally, it has been demonstrated that provider satisfaction improves when home visits are incorporated into the work week.12
What is the role of community health workers in home-based care?
Community health workers (CHWs), defined as “frontline public health workers who are trusted members of and/or have an unusually close understanding of the community they serve,”13 can be an integral part of the home-based care team. Although CHWs have variable amounts of formal training, they have a unique perspective on local health beliefs and practices, which can assist the home-care team in providing culturally competent health care services and reduce health care costs.
In a study of children with asthma in Seattle, Washington, patients were randomized to a group that had 4 home visits by CHWs and a group that received usual care. The group that received home visits demonstrated more asthma symptom–free days, improved quality-of-life scores, and fewer urgent care visits.14 Furthermore, the intervention was estimated to save approximately $1300 per patient, resulting in a return on investment of 190%. Similarly, in a study comparing inappropriate emergency department (ED) visits between children who received CHW visits and those who did not, patients in the intervention group were significantly less likely to visit the ED for ambulatory complaints (18.2% vs 35.1%; P = .004).15
Continue to: What is the role of social workersin home-based care?
What is the role of social workersin home-based care?
Social workers can help meet the complex medical and biopsychosocial needs of the homebound population.16 A study by Cohen et al based in Israel concluded that homebound participants had a significantly higher risk for mortality, higher rates of depression, and difficulty completing instrumental activities of daily living when compared with their non-homebound counterparts.17
The Mount Sinai (New York) Visiting Doctors Program (MSVD) is a home-based care team that uses social workers to meet the needs of their complex patients.18 The social workers in the MSVD program provide direct counseling, make referrals to government and community resources, and monitor caregiver burden. Using a combination of measurement tools to assess caregiver burden, Ornstein et al demonstrated that the MSVD program led to a decrease in unmet needs and in caregiver burden.19,20 Caregiver burnout can be assessed using the Caregiver Burden Inventory, a validated 24-item questionnaire.21
What electronic tools are availableto monitor patients at home?
Although expensive in terms of both dollars and personnel time, telemonitoring allows home care providers to receive real-time, updated information regarding their patients.
Chronic obstructive pulmonary disease (COPD). One systematic review showed that although telemonitoring of patients with COPD improved quality of life and decreased COPD exacerbations, it did not reduce the risk of hospitalization and, therefore, did not reduce health care costs.22 Telemonitoring in COPD can include transmission of data about spirometry parameters, weight, temperature, blood pressure, sputum color, and 6-minute walk distance.23,24
Congestive heart failure (CHF). A 2010 Cochrane review found that telemonitoring of patients with CHF reduced all-cause mortality (risk ratio [RR] = 0.66; P < .0001).25 The Telemedical Interventional Management in Heart Failure II (TIM-HF2) trial,conducted from 2013 to 2017, compared usual care for CHF patients with care incorporating daily transmission of body weight, blood pressure, heart rate, electrocardiogram tracings, pulse oximetry, and self-rated health status.26 This study showed that the average number of days lost per year due to hospital admission was less in the telemonitoring group than in the usual care group (17.8 days vs. 24.2 days; P = .046). All-cause mortality was also reduced in the telemonitoring group (hazard ratio = 0.70; P = .028).
Continue to: What role do “home hospitals” play?
What role do “home hospitals” play?
Home hospitals provide acute or subacute treatment in a patient’s home for a condition that would normally require hospitalization.27 In a meta-analysis of 61 studies evaluating the effectiveness of home hospitals, this option was more likely to reduce mortality (odds ratio [OR] = 0.81; P = .008) and to reduce readmission rates (OR = 0.75; P = .02).28 In a study of 455 older adults, Leff et al found that hospital-at-home was associated with a shorter length of stay (3.2 vs. 4.9 days; P = .004) and that the mean cost was lower for hospital-at-home vs traditional hospital care.29
However, a 2016 Cochrane review of 16 randomized controlled trials comparing hospital-at-home with traditional hospital care showed that while care in a hospital-at-home may decrease formal costs, if costs for caregivers are taken into account, any difference in cost may disappear.30
Although the evidence for cost saving is variable, hospital-at-home admission has been shown to reduce the likelihood of living in a residential care facility at 6 months (RR = 0.35; P < .0001).30 Further, the same Cochrane review showed that admission avoidance may increase patient satisfaction with the care provided.30
Finally, a recent randomized trial in a Boston-area hospital system showed that patients cared for in hospital-at-home were significantly less likely to be readmitted within 30 days and that adjusted cost was about two-thirds the cost of traditional hospital care.31
What is the physician’s rolein home health care?
While home health care is a team effort, the physician has several crucial roles. First, he or she must make the determination that home care is appropriate and feasible for a particular patient. Appropriate, meaning there is evidence that this patient is likely to benefit from home care. Feasible, meaning there are resources available in the community and family to safely care for the patient at home. “Often a house call will serve as the first step in developing a home-based-management plan.”32
Continue to: Second, the physician serves...
Second, the physician serves an important role in directing and coordinating the team of professionals involved. This primarily means helping the team to communicate with one another. Before home visits begin, the physician’s office should reach out not only to the patient and family, but also to any other health care personnel involved in the patient’s home care. Otherwise, many of the health care providers involved will never have face-to-face interaction with the physician. Creation of the coordinated health team minimizes duplication and miscommunication; it also builds a valuable bond.
How does one go about making a home visit?
Scheduling. What often works best in a busy practice is to schedule home visits for the end of the workday or to devote an entire afternoon to making home visits to several patients in one locale. Also important is scheduling times, if possible, when important family members or other caregivers are at home or when other members of the home care team can accompany you.
What to bring along. Carry a “home visit bag” that includes equipment you’re likely to need and that is not available away from your office. A minimally equipped visit bag would include different-sized blood pressure cuffs, a glucometer, a pulse oximeter, thermometers, and patient education materials. Other suggested contents are listed in TABLE 1.
Dos and don’ts. Take a few minutes when you first arrive to simply visit with the patient. Sit down and introduce yourself and any members of the home care team that the patient has not met. Take an interim history. While you’re doing this, be observant: Is the home neat or cluttered? Is the indoor temperature comfortable? Are there fall hazards? Is there a smell of cigarette smoke? Are there any indoor combustion sources (eg, wood stove or kerosene heater)? Ask questions such as: Who lives here with you? Can you show me where you keep your medicines? (If the patient keeps insulin or any other medicines in the refrigerator, ask to see it. Note any apparent food scarcity.)
During your exam, pay particular attention to whether vital signs are appreciably different than those measured in the office or hospital. Pay special attention to the patient’s functional abilities. “A subtle, but critical distinction between medical management in the home and medical management in the hospital, clinic, or office is the emphasis on the patient’s functional abilities, family assistance, and environmental factors.”33
Observe the patient’s use of any home technology, if possible; this can be as simple as home oxygenation or as complex as home hemodialysis. Assess for any apparent caregiver stress. Finally, don’t neglect to offer appropriate emotional and spiritual support to the patient and family and to schedule the next follow-up visit before you leave.
Continue to: Documentation and reimbursement.
Documentation and reimbursement. While individual electronic medical records may require use of particular forms of documentation, using a home visit template when possible can be extremely helpful (TABLE 2). A template not only assures thoroughness and consistency (pharmacy, home health contacts, billing information) but also serves as a prompt to survey the patient and the caregivers about nonmedical, but essential, social and well-being services. The document should be as simple and user-friendly as possible.
Not all assessments will be able to be done at each visit but seeing them listed in the template can be helpful. Billing follows the same principles as for office visits and has similar requirements for documentation. Codes for the most common types of home visits are listed in TABLE 3.
Where can I get help?
Graduates of family medicine residency programs are required to receive training in home visits by the Accreditation Council for Graduate Medical Education (ACGME). Current ACGME program requirements stipulate that “residents must demonstrate competence to independently diagnose, manage, and integrate the care of patients of all ages in various outpatient settings, including the FMP [family medicine practice] site and home environment,” and “residents must be primarily responsible for a panel of continuity patients, integrating each patient’s care across all settings, including the home ...” [emphasis added].34
For those already in practice, one of the hardest parts of doing home visits is feeling alone, especially if few other providers in your community engage in home care. As you run into questions and challenges with incorporating home care of patients into your practice, one excellent resource is the American Academy of Home Care Medicine (www.aahcm.org/). Founded in 1988 and headquartered in Chicago, it not only provides numerous helpful resources, but serves as a networking tool for physicians involved in home care.
This unprecedented pandemichas allowed home visits to shine
As depicted in our opening patient case, patients who have high-risk conditions and those who are older than 65 years of age may be cared for more appropriately in a home visit rather than having them come to the office. Home visits may also be a way for providers to “lay eyes” on patients who do not have technology available to participate in virtual visits.
Before performing a home visit, inquire as to whether the patient has symptoms of COVID-19. Adequate PPE should be donned at all times and social distancing should be practiced when appropriate. With adequate PPE, home visits may also allow providers to care for low-risk patients known to have COVID-19 and thereby minimize risks to staff and other patients in the office. JFP
CORRESPONDENCE
Curt Elliott, MD, Prisma Health USC Family Medicine Center, 3209 Colonial Drive, Columbia, SC 29203; [email protected].
1. Unwin BK, Tatum PE. House calls. Am Fam Physician. 2011;83:925-938.
3. Sairenji T, Jetty A, Peterson LE. Shifting patterns of physician home visits. J Prim Care Community Health. 2016;7:71-75.
4. Ornstein KA, Leff B, Covinsky K, et al. Epidemiology of the homebound population in the United States. JAMA Intern Med. 2015;175;1180-1186.
5. CMS. Current Procedural Terminology, Fourth Edition ("CPT®"). www.cms.gov/apps/physician-fee-schedule/license-agreement.aspx. Accessed November 30, 2020.
6. Elkan R, Kendrick D, Dewey M, et al. Effectiveness of home based support for older people: systematic review and meta-analysis. BMJ. 2001;323:719-725.
7. Stuck AE, Egger M, Hammer A, et al. Home visits to prevent nursing home admission and functional decline in elderly people: systematic review and meta-regression analysis. JAMA. 2002;287:1022-1028.
8. Stall N, Nowaczynski M, Sinha SK. Systematic review of outcomes from home-based primary care programs for homebound older adults. J Am Geriatr Soc. 2014;62:2243-2251.
9. Prosman GJ, Lo Fo Wong SH, van der Wouden JC, et al. Effectiveness of home visiting in reducing partner violence for families experiencing abuse: a systematic review. Fam Pract. 2015;32:247-256.
10. Han L, Ma Y, Wei S, et al. Are home visits an effective method for diabetes management? A quantitative systematic review and meta-analysis. J Diabetes Investig. 2017;8:701-708.
11. McWhinney IR. Fourth annual Nicholas J. Pisacano Lecture. The doctor, the patient, and the home: returning to our roots. J Am Board Fam Pract. 1997;10:430-435.
12. Kao H, Conant R, Soriano T, et al. The past, present, and future of house calls. Clin Geriatr Med. 2009;25:19-34.
13. American Public Health Association. Community health workers. www.apha.org/apha-communities/member-sections/community-health-workers. Accessed November 30, 2020.
14. Campbell JD, Brooks M, Hosokawa P, et al. Community health worker home visits for Medicaid-enrolled children with asthma: effects on asthma outcomes and costs. Am J Public Health. 2015;105:2366-2372.
15. Anugu M, Braksmajer A, Huang J, et al. Enriched medical home intervention using community health worker home visitation and ED use. Pediatrics. 2017;139:e20161849.
16. Reckrey JM, Gettenberg G, Ross H, et al. The critical role of social workers in home-based primary care. Soc Work in Health Care. 2014;53:330-343.
17. Cohen-Mansfield J, Shmotkin D, Hazan H. The effect of homebound status on older persons. J Am Geriatr Soc. 2010;58:2358-2362.
18. Mt. Sinai Visiting Doctors Program. www.mountsinai.org/care/primary-care/upper-east-side/visiting-doctors/about. Accessed November 30, 2020.
19. Ornstein K, Hernandez CR, DeCherrie LV, et al. The Mount Sinai (New York) Visiting Doctors Program: meeting the needs of the urban homebound population. Care Manag J. 2011;12:159-163.
20. Ornstein K, Smith K, Boal J. Understanding and improving the burden and unmet needs of informal caregivers of homebound patients enrolled in a home-based primary care program. J Appl Gerontol. 2009;28:482-503.
21. Novak M, Guest C. Application of a multidimensional caregiver burden inventory. Gerontologist. 1989;29:798-803.
22. Cruz J, Brooks D, Marques A. Home telemonitoring effectiveness in COPD: a systematic review. Int J Clin Pract. 2014;68:369-378.
23. Antoniades NC, Rochford PD, Pretto JJ, et al. Pilot study of remote telemonitoring in COPD. Telemed J E Health. 2012;18:634-640.
24. Koff PB, Jones RH, Cashman JM, et al. Proactive integrated care improves quality of life in patients with COPD. Eur Respir J. 2009;33:1031-1038.
25. Inglis SC, Clark RA, McAlister FA, et al. Which components of heart failure programmes are effective? A systematic review and meta-analysis of the outcomes of structured telephone support or telemonitoring as the primary component of chronic heart failure management in 8323 patients: abridged Cochrane review. Eur J Heart Fail. 2011;13:1028-1040.
26. Koehler F, Koehler K, Deckwart O, et al. Efficacy of telemedical interventional management in patients with heart failure (TIM-HF2): a randomised, controlled, parallel-group, unmasked trial. Lancet. 2018;392:1047-1057.
27. Ticona L, Schulman KA. Extreme home makeover–the role of intensive home health care. New Eng J Med. 2016;375:1707-1709.
28. Caplan GA. A meta-analysis of “hospital in the home.” Med J Aust. 2013;198:195-196.
29. Leff B, Burton L, Mader SL, et al. Hospital at home: feasibility and outcomes of a program to provide hospital-level care at home for acutely ill older patients. Ann Intern Med. 2005;143:798-808.
30. Shepperd S, Iliffe S, Doll HA, et al. Admission avoidance hospital at home. Cochrane Database Syst Rev. 2016;9:CD007491.
31. Levine DM, Ouchi K, Blanchfield B, et al. Hospital-level care at home for acutely ill adults: a randomized controlled trial. Ann Intern Med. 2020;172:77-85.
32. Cornwell T and Schwartzberg JG, eds. Medical Management of the Home Care Patient: Guidelines for Physicians. 4th ed. Chicago, IL: American Medical Association and American Academy of Home Care Physicians; 2012:p18.
33. Cornwell T and Schwartzberg JG, eds. Medical Management of the Home Care Patient: Guidelines for Physicians. 4th ed. Chicago, IL: American Medical Association and American Academy of Home Care Physicians; 2012:p19.
34. Accreditation Council for Graduate Medical Education. ACGME Program Requirements for Graduate Medical Education in Family Medicine. www.acgme.org/Portals/0/PFAssets/ProgramRequirements/120_FamilyMedicine_2020.pdf. (section IV.C.1.b). Accessed November 30, 2020.
PRACTICE RECOMMENDATIONS
❯ Consider incorporating home visits into the primary care of select vulnerable patients because doing so improves clinical outcomes, including mortality rates in neonates and elders. A
❯ Employ team-based home care and include community health workers, nurses, pharmacists, social workers, chaplains, and others. B
Strength of recommendation (SOR)
A Good-quality patient-oriented evidence
B Inconsistent or limited-quality patient-oriented evidence
C Consensus, usual practice, opinion, disease-oriented evidence, case series

Whole-person care: Our foundation, our future
In this issue of The Journal of Family Practice, Dr. Wayne Jonas explains his model for Advanced Primary Care (see page 493). The figure he uses to illustrate Advanced Primary Care is compelling, and the effectiveness of this model of health care is supported by a great deal of research and evaluation over the past 20 years. Let me provide some historical context.
The idea that healing requires more than curative, biology-based medical care dates back to Greek mythology. Asclepius, the god of medicine, had 5 daughters, Hygeia (the goddess of good health and hygiene), Iaso (cures and remedies), Aceso (healing wounds), Aegle (radiant good health), and Panacea (cures).1 Clearly, the Greeks believed that integrative care is essential for maintaining good health!
Modern, scientific medicine is a relatively recent development in human history. Other traditions of healing such as acupuncture and herbal medicines are actually much older than mainstream Western medicine. But they come together in family medicine—a specialty founded on the principles of whole person, whole family, and whole community care.
The first modern model of comprehensive care, the patient-centered medical home (PCMH), was introduced by the American Academy of Pediatrics in 1967. This idea caught on widely and was institutionalized by the National Committee for Quality Assurance in 2008 with PCMH certification.
Advanced Primary Care is the latest and best rendition of comprehensive primary health care. Funding this model through our current payment mechanisms, however, has been difficult because of the need to support social and behavioral interventions in addition to medical care—areas of care not traditionally paid for by medical premiums. In 2011, CMS collaborated with private insurers in a national demonstration project to test the financial feasibility of implementing Advanced Primary Care. Some organizations have been highly successful; others not as much.
We can no longer go “halfway” into whole-person care. The COVID-19 pandemic has put a spotlight on our need to transform payment models away from fee-for-service to reimbursement for whole person primary care. Our nation’s health and the viability of our health care system depend on it.
PS: I recommend reading Dr. Jonas’ book, How Healing Works, which provides a scientific rationale for the application of whole-person care to healing.
1. Theoi Greek Mythology Web site. https://www.theoi.com/Ouranios/Asklepios.html. Accessed November 30, 2020.
Editor-in-Chief

Editor-in-Chief
Editor-in-Chief
In this issue of The Journal of Family Practice, Dr. Wayne Jonas explains his model for Advanced Primary Care (see page 493). The figure he uses to illustrate Advanced Primary Care is compelling, and the effectiveness of this model of health care is supported by a great deal of research and evaluation over the past 20 years. Let me provide some historical context.
The idea that healing requires more than curative, biology-based medical care dates back to Greek mythology. Asclepius, the god of medicine, had 5 daughters, Hygeia (the goddess of good health and hygiene), Iaso (cures and remedies), Aceso (healing wounds), Aegle (radiant good health), and Panacea (cures).1 Clearly, the Greeks believed that integrative care is essential for maintaining good health!
Modern, scientific medicine is a relatively recent development in human history. Other traditions of healing such as acupuncture and herbal medicines are actually much older than mainstream Western medicine. But they come together in family medicine—a specialty founded on the principles of whole person, whole family, and whole community care.
The first modern model of comprehensive care, the patient-centered medical home (PCMH), was introduced by the American Academy of Pediatrics in 1967. This idea caught on widely and was institutionalized by the National Committee for Quality Assurance in 2008 with PCMH certification.
Advanced Primary Care is the latest and best rendition of comprehensive primary health care. Funding this model through our current payment mechanisms, however, has been difficult because of the need to support social and behavioral interventions in addition to medical care—areas of care not traditionally paid for by medical premiums. In 2011, CMS collaborated with private insurers in a national demonstration project to test the financial feasibility of implementing Advanced Primary Care. Some organizations have been highly successful; others not as much.
We can no longer go “halfway” into whole-person care. The COVID-19 pandemic has put a spotlight on our need to transform payment models away from fee-for-service to reimbursement for whole person primary care. Our nation’s health and the viability of our health care system depend on it.
PS: I recommend reading Dr. Jonas’ book, How Healing Works, which provides a scientific rationale for the application of whole-person care to healing.
1. Theoi Greek Mythology Web site. https://www.theoi.com/Ouranios/Asklepios.html. Accessed November 30, 2020.
1. Theoi Greek Mythology Web site. https://www.theoi.com/Ouranios/Asklepios.html. Accessed November 30, 2020.
Peripheral neuropathy tied to mortality in adults without diabetes
researchers reported in Annals of Internal Medicine.

The findings do not necessarily mean that doctors should implement broader screening for peripheral neuropathy at this time, however, the investigators said.
“Doctors don’t typically screen for peripheral neuropathy in persons without diabetes,” senior author Elizabeth Selvin, PhD, MPH, professor of epidemiology at the Johns Hopkins Bloomberg School of Public Health, Baltimore, said in an interview.
“Our study shows that peripheral neuropathy – as assessed by decreased sensation in the feet – is common, even in people without diabetes,” Dr. Selvin explained. “It is not yet clear whether we should be screening people without diabetes since we don’t have clear treatments, but our study does suggest that this condition is an underrecognized condition that is associated with poor outcomes.”
Patients with diabetes typically undergo annual foot examinations that include screening for peripheral neuropathy, but that’s not the case for most adults in the absence of diabetes.
“I don’t know if we can make the jump that we should be screening people without diabetes,” said first author Caitlin W. Hicks, MD, assistant professor of surgery, division of vascular surgery and endovascular therapy, Johns Hopkins University, Baltimore. “Right now, we do not exactly know what it means in the people without diabetes, and we definitely do not know how to treat it. So, screening for it will tell us that this person has this and is at higher risk of mortality than someone who doesn’t, but we do not know what to do with that information yet.”
Nevertheless, the study raises the question of whether physicians should pay more attention to peripheral neuropathy in people without diabetes, said Dr. Hicks, director of research at the university’s diabetic foot and wound service.
Heightened risk
To examine associations between peripheral neuropathy and all-cause and cardiovascular mortality in U.S. adults, Dr. Hicks and colleagues analyzed data from 7,116 adults aged 40 years or older who participated in the National Health and Nutrition Examination Survey (NHANES) between 1999 and 2004.
The study included participants who underwent monofilament testing for peripheral neuropathy. During testing, technicians used a standard 5.07 Semmes-Weinstein nylon monofilament to apply slight pressure to the bottom of each foot at three sites. If participants could not correctly identify where pressure was applied, the test was repeated. After participants gave two incorrect or undeterminable responses for a site, the site was defined as insensate. The researchers defined peripheral neuropathy as at least one insensate site on either foot.
The researchers determined deaths and causes of death using death certificate records from the National Death Index through 2015.
In all, 13.5% of the participants had peripheral neuropathy, including 27% of adults with diabetes and 11.6% of adults without diabetes. Those with peripheral neuropathy were older, were more likely to be male, and had lower levels of education, compared with participants without peripheral neuropathy. They also had higher body mass index, were more often former or current smokers, and had a higher prevalence of hypertension, hypercholesterolemia, and cardiovascular disease.
During a median follow-up of 13 years, 2,128 participants died, including 488 who died of cardiovascular causes.
The incidence rate of all-cause mortality per 1,000 person-years was 57.6 in adults with diabetes and peripheral neuropathy, 34.3 in adults with peripheral neuropathy but no diabetes, 27.1 in adults with diabetes but no peripheral neuropathy, and 13.0 in adults without diabetes or peripheral neuropathy.
Among participants with diabetes, the leading cause of death was cardiovascular disease (31% of deaths), whereas among participants without diabetes, the leading cause of death was malignant neoplasms (27% of deaths).
After adjustment for age, sex, race, or ethnicity, and risk factors such as cardiovascular disease, peripheral neuropathy was significantly associated with all-cause mortality (hazard ratio [HR], 1.49) and cardiovascular mortality (HR, 1.66) in participants with diabetes. In participants without diabetes, peripheral neuropathy was significantly associated with all-cause mortality (HR, 1.31), but its association with cardiovascular mortality was not statistically significant.
The association between peripheral neuropathy and all-cause mortality persisted in a sensitivity analysis that focused on adults with normoglycemia.
Related conditions
The study confirms findings from prior studies that examined the prevalence of loss of peripheral sensation in populations of older adults with and without diabetes, said Elsa S. Strotmeyer, PhD, MPH, associate professor of epidemiology at the University of Pittsburgh. “The clinical significance of the loss of peripheral sensation in older adults without diabetes is not fully appreciated,” she said.
A limitation of the study is that peripheral neuropathy was not a clinical diagnosis. “Monofilament testing at the foot is a quick clinical screen for decreased lower-extremity sensation that likely is a result of sensory peripheral nerve decline,” Dr. Strotmeyer said.
Another limitation is that death certificates are less accurate than medical records for determining cause of death.
“Past studies have indicated that peripheral nerve decline is related to common conditions in aging such as the metabolic syndrome and cardiovascular disease, cancer treatment, and physical function loss,” Dr. Strotmeyer said. “Therefore it is not surprising that is related to mortality as these conditions in aging are associated with increased mortality. Loss of peripheral sensation at the foot may also be related to fall injuries, and mortality from fall injuries has increased dramatically in older adults over the past several decades.”
Prior research has suggested that monofilament testing may play a role in screening for fall risk in older adults without diabetes, Dr. Strotmeyer added.
“For older adults both with and without diabetes, past studies have recommended monofilament testing be incorporated in geriatric screening for fall risk. Therefore, this article expands implications of clinical importance to understanding the pathology and consequences of loss of sensation at the foot in older patients,” she said.
The study was funded by the National Institute of Diabetes and Digestive and Kidney Diseases and the National Heart, Lung, and Blood Institute. Dr. Hicks, Dr. Selvin, and a coauthor, Kunihiro Matsushita, MD, PhD, disclosed NIH grants. In addition, Dr. Selvin disclosed personal fees from Novo Nordisk and grants from the Foundation for the National Institutes of Health outside the submitted work, and Dr. Matsushita disclosed grants and personal fees from Fukuda Denshi outside the submitted work. Dr. Strotmeyer receives funding from the National Institute on Aging and the National Institute of Arthritis and Musculoskeletal and Skin Diseases and is chair of the health sciences section of the Gerontological Society of America.
A version of this article originally appeared on Medscape.com.
researchers reported in Annals of Internal Medicine.
The findings do not necessarily mean that doctors should implement broader screening for peripheral neuropathy at this time, however, the investigators said.
“Doctors don’t typically screen for peripheral neuropathy in persons without diabetes,” senior author Elizabeth Selvin, PhD, MPH, professor of epidemiology at the Johns Hopkins Bloomberg School of Public Health, Baltimore, said in an interview.
“Our study shows that peripheral neuropathy – as assessed by decreased sensation in the feet – is common, even in people without diabetes,” Dr. Selvin explained. “It is not yet clear whether we should be screening people without diabetes since we don’t have clear treatments, but our study does suggest that this condition is an underrecognized condition that is associated with poor outcomes.”
Patients with diabetes typically undergo annual foot examinations that include screening for peripheral neuropathy, but that’s not the case for most adults in the absence of diabetes.
“I don’t know if we can make the jump that we should be screening people without diabetes,” said first author Caitlin W. Hicks, MD, assistant professor of surgery, division of vascular surgery and endovascular therapy, Johns Hopkins University, Baltimore. “Right now, we do not exactly know what it means in the people without diabetes, and we definitely do not know how to treat it. So, screening for it will tell us that this person has this and is at higher risk of mortality than someone who doesn’t, but we do not know what to do with that information yet.”
Nevertheless, the study raises the question of whether physicians should pay more attention to peripheral neuropathy in people without diabetes, said Dr. Hicks, director of research at the university’s diabetic foot and wound service.
Heightened risk
To examine associations between peripheral neuropathy and all-cause and cardiovascular mortality in U.S. adults, Dr. Hicks and colleagues analyzed data from 7,116 adults aged 40 years or older who participated in the National Health and Nutrition Examination Survey (NHANES) between 1999 and 2004.
The study included participants who underwent monofilament testing for peripheral neuropathy. During testing, technicians used a standard 5.07 Semmes-Weinstein nylon monofilament to apply slight pressure to the bottom of each foot at three sites. If participants could not correctly identify where pressure was applied, the test was repeated. After participants gave two incorrect or undeterminable responses for a site, the site was defined as insensate. The researchers defined peripheral neuropathy as at least one insensate site on either foot.
The researchers determined deaths and causes of death using death certificate records from the National Death Index through 2015.
In all, 13.5% of the participants had peripheral neuropathy, including 27% of adults with diabetes and 11.6% of adults without diabetes. Those with peripheral neuropathy were older, were more likely to be male, and had lower levels of education, compared with participants without peripheral neuropathy. They also had higher body mass index, were more often former or current smokers, and had a higher prevalence of hypertension, hypercholesterolemia, and cardiovascular disease.
During a median follow-up of 13 years, 2,128 participants died, including 488 who died of cardiovascular causes.
The incidence rate of all-cause mortality per 1,000 person-years was 57.6 in adults with diabetes and peripheral neuropathy, 34.3 in adults with peripheral neuropathy but no diabetes, 27.1 in adults with diabetes but no peripheral neuropathy, and 13.0 in adults without diabetes or peripheral neuropathy.
Among participants with diabetes, the leading cause of death was cardiovascular disease (31% of deaths), whereas among participants without diabetes, the leading cause of death was malignant neoplasms (27% of deaths).
After adjustment for age, sex, race, or ethnicity, and risk factors such as cardiovascular disease, peripheral neuropathy was significantly associated with all-cause mortality (hazard ratio [HR], 1.49) and cardiovascular mortality (HR, 1.66) in participants with diabetes. In participants without diabetes, peripheral neuropathy was significantly associated with all-cause mortality (HR, 1.31), but its association with cardiovascular mortality was not statistically significant.
The association between peripheral neuropathy and all-cause mortality persisted in a sensitivity analysis that focused on adults with normoglycemia.
Related conditions
The study confirms findings from prior studies that examined the prevalence of loss of peripheral sensation in populations of older adults with and without diabetes, said Elsa S. Strotmeyer, PhD, MPH, associate professor of epidemiology at the University of Pittsburgh. “The clinical significance of the loss of peripheral sensation in older adults without diabetes is not fully appreciated,” she said.
A limitation of the study is that peripheral neuropathy was not a clinical diagnosis. “Monofilament testing at the foot is a quick clinical screen for decreased lower-extremity sensation that likely is a result of sensory peripheral nerve decline,” Dr. Strotmeyer said.
Another limitation is that death certificates are less accurate than medical records for determining cause of death.
“Past studies have indicated that peripheral nerve decline is related to common conditions in aging such as the metabolic syndrome and cardiovascular disease, cancer treatment, and physical function loss,” Dr. Strotmeyer said. “Therefore it is not surprising that is related to mortality as these conditions in aging are associated with increased mortality. Loss of peripheral sensation at the foot may also be related to fall injuries, and mortality from fall injuries has increased dramatically in older adults over the past several decades.”
Prior research has suggested that monofilament testing may play a role in screening for fall risk in older adults without diabetes, Dr. Strotmeyer added.
“For older adults both with and without diabetes, past studies have recommended monofilament testing be incorporated in geriatric screening for fall risk. Therefore, this article expands implications of clinical importance to understanding the pathology and consequences of loss of sensation at the foot in older patients,” she said.
The study was funded by the National Institute of Diabetes and Digestive and Kidney Diseases and the National Heart, Lung, and Blood Institute. Dr. Hicks, Dr. Selvin, and a coauthor, Kunihiro Matsushita, MD, PhD, disclosed NIH grants. In addition, Dr. Selvin disclosed personal fees from Novo Nordisk and grants from the Foundation for the National Institutes of Health outside the submitted work, and Dr. Matsushita disclosed grants and personal fees from Fukuda Denshi outside the submitted work. Dr. Strotmeyer receives funding from the National Institute on Aging and the National Institute of Arthritis and Musculoskeletal and Skin Diseases and is chair of the health sciences section of the Gerontological Society of America.
A version of this article originally appeared on Medscape.com.
Prioritize COVID-19 vaccination in both types of diabetes, say docs
The risk for increased COVID-19 severity in people with type 1 diabetes appears similar to that of type 2 diabetes, contrary to some official advice from the Centers for Disease Control and Prevention. The new finding indicates that people with both types should be priority for receiving a vaccine, investigators say.
The study is the first to prospectively evaluate both inpatients and outpatients and to examine COVID-19 severity factors in addition to death in people with type 1 and type 2 diabetes separately, and was published online Dec. 2 in Diabetes Care.
Among the patients, who were seen at Vanderbilt University Medical Center in Nashville, Tenn., between March and August of 2020, those with both type 1 and type 2 diabetes had between a three- and fourfold greater risk for COVID-19 hospitalization and greater illness severity compared with people without diabetes after adjustments for age, race, and a number of other risk factors.
This finding is important since as of Dec. 1, 2020, the CDC has classified the diabetes types differently in terms of underlying medical conditions that increase the risk for severe COVID-19.
Adults of any age with type 2 diabetes are considered “at increased risk of severe illness” from the virus that causes COVID-19 whereas the CDC says those with type 1 “might be at an increased risk.”
Lead author of the new paper Justin M. Gregory, MD, said in an interview: “I think this needs revision based on the current evidence. I think the data presented in our study and that of Barron et al. in Lancet Endocrinology 2020 indicate the need to place type 1 diabetes at parity with type 2 diabetes.
“These studies indicate both conditions carry an adjusted odds ratio of three to four when compared with people without diabetes for hospitalization, illness severity, and mortality,” he stressed.
Vaccines look promising for patients with diabetes
There were no phase 3 vaccine data available for the vaccine at the time that Dr. Gregory, of the Ian M. Burr Division of Pediatric Endocrinology and Diabetes, Vanderbilt University, Nashville, Tenn., and colleagues were writing their manuscript in late summer, so the article does not mention this.
But now, Dr. Gregory said, “Based on the initial press releases from Pfizer and Moderna, I am now optimistic that these vaccines might mitigate the excess morbidity and mortality from COVID-19 experienced by patients with diabetes.
“I am eager to see what we learn on December 10 and 17 [the scheduled dates for the meetings of the Food and Drug Administration’s Vaccines and Related Biological Products Advisory Committee to review the Pfizer and Moderna vaccines, respectively].”
But with the winter pandemic surge in the meantime, “Our investigation suggests that as COVID-19 hospitalizations rise, patients with both type 1 and 2 diabetes will comprise a disproportionately higher number of those admissions and, once hospitalized, demonstrate a greater degree of illness severity,” he and his colleagues said.
“In light of these data, we call on our colleagues to emphasize the importance of social distancing measures and hand hygiene, with particular emphasis on patients with diabetes, including those in the most vulnerable communities whom our study affirms will face the most severe impact.”
After adjustments, excess severity risk similar for both diabetes types
The new study data came from electronic health records at Vanderbilt University Medical Center, comprising 137 primary care, urgent care, and hospital facilities where patients were tested for SARS-CoV-2 regardless of the reason for their visit.
Between March 17 and August 7, 2020, 6,451 patients tested positive for COVID-19. Of those, 273 had type 2 diabetes and 40 had type 1 diabetes.
Children younger than 18 years accounted for 20% of those with type 1 diabetes and 9.4% of those without diabetes, but none of the type 2 group. The group with type 2 diabetes was considerably older than the type 1 diabetes and no-diabetes groups, 58 years versus 37 and 33 years, respectively.
Before adjustment for baseline characteristics that differed between groups, patients with type 1 diabetes appeared to have a risk for hospitalization and greater illness severity that was intermediate between the group with no diabetes and the group with type 2 diabetes, the researchers said.
But after adjustment for age, race, sex, hypertension, smoking, and body mass index, people with type 1 diabetes had odds ratios of 3.90 for hospitalization and 3.35 for greater illness severity, which was similar to risk in type 2 diabetes (3.36 and 3.42, respectively), compared to those without diabetes.
Deep dive explores COVID-19 severity risk factors in type 1 diabetes
The investigators then conducted a detailed chart review for 37 of the 40 patients with type 1 diabetes and phone surveys with 15 of them.
The majority (28) had not been hospitalized, and only one was hospitalized for diabetic ketoacidosis (DKA) within 14 days of positive SARS-CoV-2 testing.
This contrasts with a report from the T1D Exchange, in which nearly half of 33 patients with type 1 diabetes and COVID-19 had been hospitalized with DKA. The reason for the discrepancy may be that more severe patients would more likely be referred to the T1D Exchange Registry, Dr. Gregory and colleagues hypothesized.
Clinical factors associated with COVID-19 severity (P < .05) in their study included a prior hypertension diagnosis, higher hemoglobin A1c, at least one prior DKA admission in the past year, and not using a continuous glucose monitor (CGM).
Hospitalizations were twice as likely and illness severity nearly twice as great among those with type 1 diabetes who were Black versus White. Just 8% of those with private insurance were hospitalized, compared with 60% of those with public insurance and 67% with no insurance (P = .001).
“Whereas previous reports have indicated proportionally higher rates of hospitalizations from COVID-19 among Black patients and those with public insurance, this study is the first to show a similar finding in the population with type 1 diabetes,” Dr. Gregory and colleagues wrote.
Only 9% of patients using a CGM were hospitalized versus 47% who used blood glucose meters (P < .016). Similarly, hospitalizations occurred in 6% using an insulin pump versus 33% using multiple daily injections (P < .085).
“Our analysis cannot exclude the possibility that greater amounts of diabetes technology use are a surrogate for higher socioeconomic status,” they noted.
This research was supported by the National Institute of Diabetes and Digestive and Kidney Diseases, JDRF, and the Appleby Foundation. The authors have reported no relevant financial relationships.
A version of this article originally appeared on Medscape.com.
Burnt Out ? The Phenomenon of Type 2 Diabetes Mellitus in End-Stage Renal Disease
In patients with T2DM and ESRD, insulin is the antidiabetic medication of choice with a hemoglobin A1c target of 6 to 8%, using fructosamine levels or other measures for better assessment of glycemic control.
More than 34 million adults in the US have type 2 diabetes mellitus (T2DM), a chronic progressive disease identified by worsening hyperglycemia and micro- and macrovascular complications.1 Consequently, 12.2% of the US adult population is currently at risk for macrovascular diseases, such as stroke and coronary artery disease (CAD) and microvascular diseases, such as neuropathy and diabetic nephropathy.1
T2DM is the most common comorbid risk factor for chronic kidney disease (CKD) and the leading cause of end-stage renal disease (ESRD). As of 2017, about 750,000 Americans have CKD stage 5 requiring dialysis, and 50% of these patients have preexisting diabetic nephropathy.2 Rates of mortality and morbidity are observed to be higher in patients with both CKD and T2DM compared with patients with CKD without T2DM.2 Previous clinical trials, including the United Kingdom Prospective Diabetes Study of 1998, have proven that optimal glycemic control decreases the risk of complications of T2DM (ie, nephropathy) in the general population.3 Conversely, tight glycemic control that targets hemoglobin A1c (HbA1c) < 7%, in patients with T2DM with ESRD has not shown the same benefits and may lead to worse outcomes. It is postulated that this may be due to the increased incidence of hypoglycemia in this patient population.4
Dialysis has varying effects on patients both with and without T2DM. While patients with ESRD without T2DM have the potential to develop impaired glucose tolerance and T2DM, about 33% of patients with T2DM on dialysis actually have HbA1c < 6%.5 In these patients, glycemic control improves spontaneously as their disease progresses, leading to a decrease or cessation of insulin or other antidiabetic medications. This phenomenon, known as burnt-out diabetes, is characterized by (1) alterations in glucose homeostasis and normoglycemia without antidiabetic treatment; (2) HbA1c levels < 6% despite having established T2DM; (3) decline in insulin requirements or cessation of insulin altogether; and (4) spontaneous hypoglycemia.
There is a misconception that burnt-out diabetes is a favorable condition due to the alteration of the natural course of T2DM. Although this may be true, patients with this condition are prone to develop hypoglycemic episodes and may be linked to poor survival outcomes due to low HbA1c.6,7
Since Kalantar-Zadeh and colleagues presented a 2009 case study, there has been a lack of research regarding this unique condition.8 The purpose of this case study is to shed further light on burnt-out diabetes and present a patient case pertaining to the challenges of glycemic control in ESRD.
Case Presentation
Mr. A is a 49-year-old Hispanic male veteran with a history of ESRD on hemodialysis (HD) for 6 years, anemia of CKD, and T2DM for 22 years. The patient also has an extensive cardiovascular disease history, including hypertension, hyperlipidemia, and CAD status post-4-vessel coronary artery bypass graft in December 2014. The patient receives in-home HD Monday, Wednesday, and Friday and is on the wait list for kidney transplantation. The patient’s T2DM is managed by a primary care clinical pharmacy specialist (CPS) at the
Mr. A’s antidiabetic regimen is 45 units of subcutaneous insulin glargine every morning; insulin aspart sliding scale (about 15-27 units) subcutaneous 3 times daily with meals; and saxagliptin 2.5 mg by mouth once daily.
At a follow-up visit with the CPS, Mr. A stated, “I feel fine except for the occasional low blood sugar episode.” The patient’s most recent HbA1c was 6.1%, and he reported medication adherence and no signs or symptoms of hyperglycemia (ie, polydipsia, polyphagia, nocturia, visual disturbances). Mr. A reported no use of alcohol, tobacco, or illicit drugs. He walks 1 mile every other day and participates in self-monitoring blood glucose (SMBG) about 2 to 3 times daily (Table 1).
![]()
Although Mr. A’s most recent HbA1c was well controlled, his estimated fasting blood glucose at the same laboratory draw was 224 mg/dL. His SMBG readings in the past month also were elevated with higher readings in the evening. Mr. A attributed the elevated readings to dietary excursions and a high carbohydrate intake. At this visit, the CPS increased his insulin glargine dose to 50 units subcutaneous every morning and educated him on lifestyle modifications. Follow-up with the CPS was scheduled for 2 months from the day of the visit.
Analysis
Few articles on potential contributors to burnt-out diabetes have been published.6,7 These articles discuss decreased renal and hepatic clearance of insulin (which increases its half-life) hypoglycemia during HD, and low HbA1c due to preexisting anemia. Inappropriately low HbA1c levels may be secondary to, but not limited to, hemolysis, recent blood transfusion, acute blood loss, and medications, such as erythropoietin-stimulating agents (ESAs).9 The conditions that affect red blood cell turnover are common in patients with advanced CKD and may result in discrepancies in HbA1c levels.
Glycated hemoglobin is a series of minor hemoglobin components formed by the adduction of various carbohydrate molecules to hemoglobin. HbA1c is the largest fraction formed and the most consistent index of the concentration of glucose in the blood.10 Hence, HbA1c is the traditional indicator of overall glycemic control. The current HbA1c goals recommended by the American Diabetes Association are derived from landmark trials conducted with patients in the general adult diabetic non-CKD population. However, hemoglobin measurements can be confounded by conditions present in ESRD and tend to underestimate glucose measurements in patients with T2DM on HD. Despite this, HbA1c is still regarded as a reasonable measure of glycemic control even in patients with ESRD; however, alternative markers of glycemia may be preferable.11
Although HbA1c is the gold standard, there are other laboratory measures of average glycemic control available. Fructosamine is a ketoamine formed when glucose binds to serum proteins. When these proteins are exposed to high concentrations of glucose, they experience increased glycation. Fructosamine assays measure the total glycated serum proteins, of which albumin accounts for about 90%.11 Because the half-life of serum proteins is about 20 days, fructosamine levels can reflect glycemic control over a 2- to 3-week period. This is advantageous in conditions that affect the average age of red blood cells, in pregnancy where frequent monitoring and measures of short-term glucose control are especially important, and in the evaluation of a medication adjustment in the management of T2DM. However, this test is not without its limitations. It is less reliable in settings of decreased protein levels (eg, liver disease), there is a lack of availability in routine practice, and reference levels have not been established.11
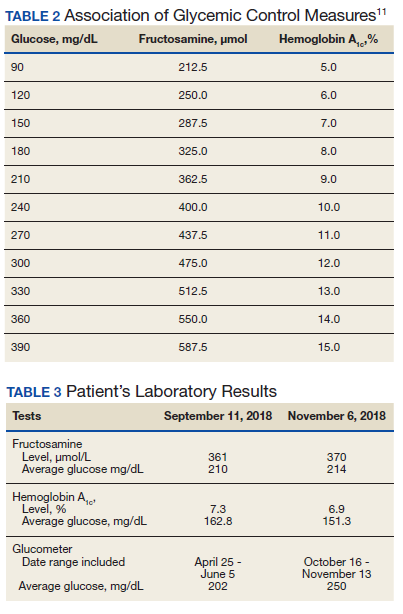
Fructosamine has been shown to be strongly associated with mean blood glucose and HbA1c (Table 2). In 2010, Mittman and colleagues published a study that compared HbA1c with fructosamine and their correlation to glycemic control and morbidity, defined as rates of hospitalization and infection.12 The study included 100 patients with T2DM on HD with a mean age of 63 years, 54% were women, mean HbA1c of 7.2%, and mean dialysis duration of 3 years. Average follow-up was 3 years. At the end of follow-up, Mittman and colleagues found that HbA1c and fructosamine were highly correlated and associated with serum glucose (P < .01). However, fructosamine was found to be more highly correlated with mean glucose levels when those levels were below 150 mg/dL (P = .01). A higher fructosamine level, not HbA1c was a more significant predictor of hospitalization (P = .007) and infection (P = .001). Mittman and colleagues presented evidence for the use of fructosamine over HbA1c in patients with T2DM on HD.12
Hypoglycemic Episodes
At the 2-month follow-up visit with the CPS, Mr. A reported having 5 hypoglycemic episodes in the past 30 days. He also stated he would forget to take his insulin aspart dose before dinner about 3 to 4 times a week but would take it 30 to 60 minutes after the meal. Mr. A did not bring his glucometer or SMBG readings to the visit, but he indicated that his blood glucose levels continued to fluctuate and were elevated when consuming carbohydrates.
Laboratory tests 1 month prior to the 2-month follow-up visit showed HbA1c of 7.3%, which had increased from his previous level of 6.1%. He was counseled on the proper administration of insulin aspart and lifestyle modifications. A fructosamine level was ordered at this visit to further assess his glycemic control. A follow-up appointment and laboratory workup (fructosamine and HbA1c) were scheduled for 2 months from the visit (Table 3).
Mr. A was educated on the unreliability of his HbA1c levels secondary to his condition of ESRD on HD. He was counseled on the purpose of fructosamine and how it may be a better predictor of his glycemic control and morbidity. Mr. A continued to be followed closely by the primary care CPS for T2DM management.
Discussion
Management of T2DM in patients with ESRD presents challenges for clinicians in determining HbA1c goals and selecting appropriate medication options. The 2012 Kidney Disease Outcomes Quality Initiative (KDOQI) diabetes guideline does not recommend treatment for patients with substantially reduced kidney function to a target HbA1c < 7% due to risk of hypoglycemia.13 Although a target HbA1c > 7% is suggested for these patients, little is known about appropriate glycemic control in these patients as there is a paucity of prospective, randomized clinical trials that include patients with advanced CKD.13
Moreover, many oral antidiabetic medications and their metabolites are cleared by the kidneys and, therefore, pose with potential harm for patients with CKD. Because of this, insulin is the medication of choice for patients with ESRD.7 Although insulin requirements may diminish with worsening kidney function, insulin provides the safest method of glycemic control. Insulin dosing can be individualized according to a patient’s renal status as there is no uniformity in renal dose adjustments. There are some noninsulin antidiabetic agents that can be used in ESRD, but use of these agents requires close monitoring and evaluation of the medication’s pharmacokinetics (Table 4). Overall, medication management can be a difficult task for patients with T2DM and ESRD, but antidiabetic regimens may be reduced or discontinued altogether in burnt-out diabetes.
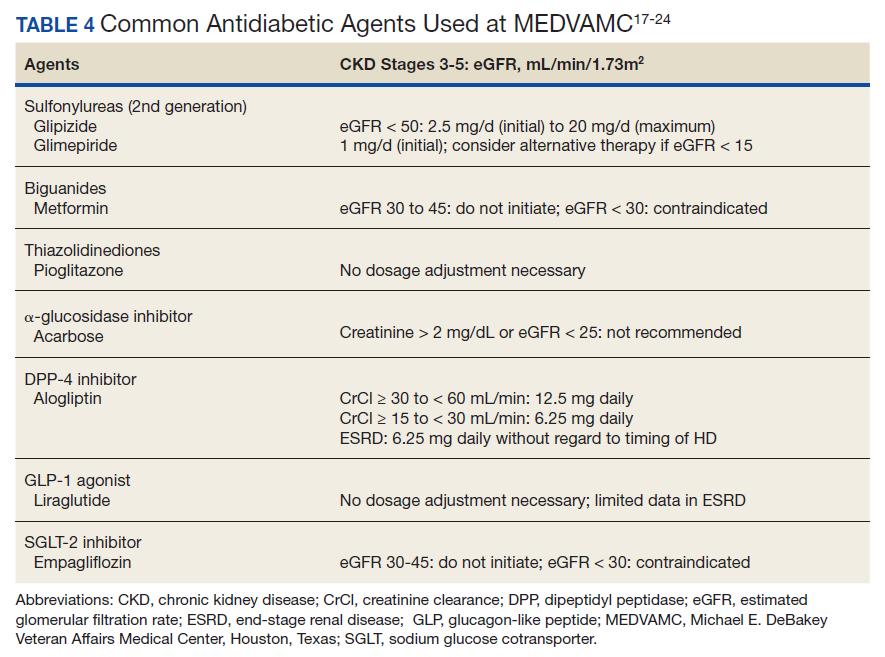
One of 3 patients with T2DM and ESRD on dialysis has burnt-out diabetes, defined as a phenomenon in which glucose homeostasis is altered to cause normoglycemia, spontaneous hypoglycemia, and decreased insulin requirements in established patients with T2DM.5 Although Mr. A had a normal-to-low HbA1c, he did not meet these criteria. Due to his elevated SMBG readings, he did not have normoglycemia and did require an increase in his basal insulin dose. Therefore, our patient did not have burnt-out diabetes.
Mr. A represents the relevant issue of inappropriately and unreliably low HbA1c levels due to various factors in ESRD. Our patient did not receive a blood transfusion in the past 2 years and was not on ESA therapy; nevertheless, Mr. A was a patient with ESRD on HD with a diagnosis of anemia. These diagnoses are confounders for low HbA1c values. When fructosamine levels were drawn for Mr. A on September 11, 2018 and November 6, 2018, they correlated well with his serum glucose and SMBG readings. This indicated to the CPS that the patient’s glycemic control was poor despite a promising HbA1c level.
This patient’s case and supporting evidence suggests that other measures of glycemic control (eg, fructosamine) can be used to supplement HbA1c, serum glucose, and glucometer readings to provide an accurate assessment of glycemic control in T2DM. Fructosamine also can assist HbA1c with predicting morbidity and potentially mortality, which are of great importance in this patient population.
Kalantar-Zadeh and colleagues conducted a study of 23,618 patients with T2DM on dialysis to observe mortality in association with HbA1c.5 This analysis showed that patients with HbA1c levels < 5% or > 8% had a higher risk of mortality; higher values of HbA1c (> 10%) were associated with increased death risk vs all other values. In the unadjusted analysis, HbA1c levels between 6 and 8% had the lowest death risk (hazard ratios [HR] 0.8 - 0.9, 95% CI) compared with those of higher and lower HbA1c ranges.5 In nonanemic patients, HbA1c > 6% was associated with increased death risk, whereas anemic patients did not show this trend.
Other studies made similar observations. In 2001, Morioka and colleagues published an observational study of 150 patients with DM on intermittent hemodialysis. The study analyzed survival and HbA1c levels at 1, 3, and 5 years. The study found that at 1, 3, and 5 years, patients with HbA1c < 7.5% had better survival than did patients with HbA1c > 7.5% (3.6 years vs 2.0 years, P = .008). Morioka and colleagues also found that there was a 13% increase in death per 1% increase in HbA1c.14 Oomichi and colleagues conducted an observational study of 114 patients with T2DM and ESRD on intermittent hemodialysis. Patients with fair control (HbA1c 6.5 - 8%) and good control (HbA1c < 6.5%) were compared with patients with poor control (HbA1c > 8%); it was found that the poor control group had nearly triple the mortality when compared with the good and fair control groups (HR = 2.89, P = .01).15 Park and colleagues also saw a similar observation in a study of 1,239 patients with ESRD and DM; 70% of these patients were on intermittent hemodialysis. Patients with poor control (HbA1c ≥ 8%) had worse survival outcomes than those with HbA1c < 8% (HR 2.2, P < .001).16
Our patient case forced us to ask the question, “What should our patient’s HbA1c goals be?” In the study by Oomichi and colleagues, a HbA1c level of 8% has usefulness as a “signpost for management of glycemic control.”15 All patients’ goals should be individualized based on various factors (eg, age, comorbidities), but based on the survival studies above, a HbA1c goal range of 6 to 8% may be optimal.
Conclusions
Patients with T2DM and ESRD on dialysis may have higher morbidity and mortality rates than the rates of those without T2DM. It has been shown in various studies that very low HbA1c (< 5%) and high HbA1c (> 8%) are associated with poor survival. Some patients with T2DM on dialysis may experience burnt-out diabetes in which they may have normoglycemia and a HbA1c below goal; despite these facts, this condition is not positive and can be linked to bad outcomes. In patients with T2DM and ESRD, insulin is the antidiabetic medication of choice, and we recommend a HbA1c target of 6 to 8%. In this patient population, consider using fructosamine levels or other measures of glycemic control to supplement HbA1c and glucose values to provide a better assessment of glycemic control, morbidity, and mortality. Larger clinical trials are needed to assist in answering questions regarding mortality and optimal HbA1c targets in burnt-out diabetes.
1. Centers for Disease Control and Prevention. National Diabetes Statistics Report, 2020. https://www.cdc.gov/diabetes/data/statistics-report/index.html. Updated August 28, 2020. Accessed November 17, 2020.
2. Saran R, Robinson B, et al. US renal data system 2019 annual data report: epidemiology of klidney disease in the United States. Am J Kidney Dis. 2020 Jan;75(1 suppl 1):A6-A7. doi:10.1053/j.ajkd.2019.09.003. Epub 2019 Nov 5.
3. UK Prospective Diabetes Study Group. Effect of intensive blood-glucose control with metformin on complications in overweight patients with type 2 diabetes (UKPDS 34). Lancet. 1998;352(9131):854-865.
4. Gerstein HC, Miller ME, Byington RP, et al. Effects of intensive glucose lowering in type 2 diabetes. N Engl J Med. 2008;358(24):2545-2559. doi:10.1056/NEJMoa0802743
5. Kalantar-Zadeh K, Kopple JD, Regidor DL, et al. A1c and survival in maintenance hemodialysis patients. Diabetes Care. 2007;30(5):1049-10.55. doi:10.2337/dc06-2127
6. Park J, Lertdumrongluk P, Molnar MZ, Kovesdy CP, Kalantar-Zadeh K. Glycemic control in diabetic dialysis patients and the burnt-out diabetes phenomenon. Curr Diab Rep. 2012;12(4):432-439. doi:10.1007/s11892-012-0286-3
7. Rhee CM, Leung AM, Kovesdy CP, Lynch KE, Brent GA, Kalantar-Zadeh K. Updates on the management of diabetes in dialysis patients. Semin Dial. 2014;27(2):135-145. doi:10.1111/sdi.12198
8. Kalantar-Zadeh K, Derose SF, Nicholas S, Benner D, Sharma K, Kovesdy CP. Burnt-out diabetes: impact of chronic kidney disease progression on the natural course of diabetes mellitus. J Ren Nutr. 2009;19(1):33-37. doi:10.1053/j.jrn.2008.11.012
9. Unnikrishnan R, Anjana RM, Mohan V. Drugs affecting HbA1c levels. Indian J Endocrinol Metab. 2012;16(4):528-531. doi:10.4103/2230-8210.98004
10. Makris K, Spanou L. Is there a relationship between mean blood glucose and glycated hemoglobin? J Diabetes Sci Technol. 2011;5(6):1572-1583. doi:10.1177/193229681100500634
11. Wright LAC, Hirsch IB. The challenge of the use of glycemic biomarkers in diabetes: reflecting on hemoglobin A1c, 1,5-anhydroglucitol, and the glycated proteins fructosamine and glycated albumin. Diabetes Spectr. 2012;25(3):141-148. doi:10.2337/diaspect.25.3.141
12. Mittman N, Desiraju B, Fazil I, et al. Serum fructosamine versus glycosylated hemoglobin as an index of glycemic control, hospitalization, and infection in diabetic hemodialysis patients. Kidney Int. 2010;78 (suppl 117):S41-S45. doi:10.1038/ki.2010.193
13. National Kidney Foundation. KDOQI clinical practice guideline for diabetes and CKD: 2012 update. Am J Kidney Dis. 2012;60(5):850-886. doi:10.1053/j.ajkd.2012.07.005
14. Morioka T, Emoto M, Tabata T, et al. Glycemic control is a predictor of survival for diabetic patients on hemodialysis. Diabetes Care. 2001;24(5):909-913. doi.10.2337/diacare.24.5.909
15. Oomichi T, Emoto M, Tabata T, et al. Impact of glycemic control on survival of diabetic patients on chronic regular hemodialysis: a 7-year observational study. Diabetes Care. 2006;29(7):1496-1500. doi:10.2337/dc05-1887
16. Park JI, Bae E, Kim YL, et al. Glycemic control and mortality in diabetic patients undergoing dialysis focusing on the effects of age and dialysis type: a prospective cohort study in Korea. PLoS ONE. 2015;10(8):e0136085. doi:10.1371/journal.pone.0136085
17. Glucotrol tablets [
18. Amaryl [package insert]. Bridgewater, NJ: Sanofi-Aventis; December 2018.
19. Glucophage [package insert]. Princeton, NJ: Bristol-Myers Squibb; May 2018.
20. Actos [package insert]. Deerfield, IL: Takeda Pharmaceuticals America Inc; December 2017.
21. Precose [package insert]. Whippany, NJ: Bayer HealthCare Pharmaceuticals; March 2015.
22. Nesina [package insert]. Deerfield, IL: Takeda Pharmaceuticals America Inc; June 2019.
23. Victoza [package insert]. Plainsboro, NJ: Novo Nordisk Inc; June 2019.
24. Jardiance [package insert]. Ridgefield, CT: Boehringer Ingelheim Pharmaceuticals Inc; October 2018.
In patients with T2DM and ESRD, insulin is the antidiabetic medication of choice with a hemoglobin A1c target of 6 to 8%, using fructosamine levels or other measures for better assessment of glycemic control.
In patients with T2DM and ESRD, insulin is the antidiabetic medication of choice with a hemoglobin A1c target of 6 to 8%, using fructosamine levels or other measures for better assessment of glycemic control.
More than 34 million adults in the US have type 2 diabetes mellitus (T2DM), a chronic progressive disease identified by worsening hyperglycemia and micro- and macrovascular complications.1 Consequently, 12.2% of the US adult population is currently at risk for macrovascular diseases, such as stroke and coronary artery disease (CAD) and microvascular diseases, such as neuropathy and diabetic nephropathy.1
T2DM is the most common comorbid risk factor for chronic kidney disease (CKD) and the leading cause of end-stage renal disease (ESRD). As of 2017, about 750,000 Americans have CKD stage 5 requiring dialysis, and 50% of these patients have preexisting diabetic nephropathy.2 Rates of mortality and morbidity are observed to be higher in patients with both CKD and T2DM compared with patients with CKD without T2DM.2 Previous clinical trials, including the United Kingdom Prospective Diabetes Study of 1998, have proven that optimal glycemic control decreases the risk of complications of T2DM (ie, nephropathy) in the general population.3 Conversely, tight glycemic control that targets hemoglobin A1c (HbA1c) < 7%, in patients with T2DM with ESRD has not shown the same benefits and may lead to worse outcomes. It is postulated that this may be due to the increased incidence of hypoglycemia in this patient population.4
Dialysis has varying effects on patients both with and without T2DM. While patients with ESRD without T2DM have the potential to develop impaired glucose tolerance and T2DM, about 33% of patients with T2DM on dialysis actually have HbA1c < 6%.5 In these patients, glycemic control improves spontaneously as their disease progresses, leading to a decrease or cessation of insulin or other antidiabetic medications. This phenomenon, known as burnt-out diabetes, is characterized by (1) alterations in glucose homeostasis and normoglycemia without antidiabetic treatment; (2) HbA1c levels < 6% despite having established T2DM; (3) decline in insulin requirements or cessation of insulin altogether; and (4) spontaneous hypoglycemia.
There is a misconception that burnt-out diabetes is a favorable condition due to the alteration of the natural course of T2DM. Although this may be true, patients with this condition are prone to develop hypoglycemic episodes and may be linked to poor survival outcomes due to low HbA1c.6,7
Since Kalantar-Zadeh and colleagues presented a 2009 case study, there has been a lack of research regarding this unique condition.8 The purpose of this case study is to shed further light on burnt-out diabetes and present a patient case pertaining to the challenges of glycemic control in ESRD.
Case Presentation
Mr. A is a 49-year-old Hispanic male veteran with a history of ESRD on hemodialysis (HD) for 6 years, anemia of CKD, and T2DM for 22 years. The patient also has an extensive cardiovascular disease history, including hypertension, hyperlipidemia, and CAD status post-4-vessel coronary artery bypass graft in December 2014. The patient receives in-home HD Monday, Wednesday, and Friday and is on the wait list for kidney transplantation. The patient’s T2DM is managed by a primary care clinical pharmacy specialist (CPS) at the
Mr. A’s antidiabetic regimen is 45 units of subcutaneous insulin glargine every morning; insulin aspart sliding scale (about 15-27 units) subcutaneous 3 times daily with meals; and saxagliptin 2.5 mg by mouth once daily.
At a follow-up visit with the CPS, Mr. A stated, “I feel fine except for the occasional low blood sugar episode.” The patient’s most recent HbA1c was 6.1%, and he reported medication adherence and no signs or symptoms of hyperglycemia (ie, polydipsia, polyphagia, nocturia, visual disturbances). Mr. A reported no use of alcohol, tobacco, or illicit drugs. He walks 1 mile every other day and participates in self-monitoring blood glucose (SMBG) about 2 to 3 times daily (Table 1).
![]()
Although Mr. A’s most recent HbA1c was well controlled, his estimated fasting blood glucose at the same laboratory draw was 224 mg/dL. His SMBG readings in the past month also were elevated with higher readings in the evening. Mr. A attributed the elevated readings to dietary excursions and a high carbohydrate intake. At this visit, the CPS increased his insulin glargine dose to 50 units subcutaneous every morning and educated him on lifestyle modifications. Follow-up with the CPS was scheduled for 2 months from the day of the visit.
Analysis
Few articles on potential contributors to burnt-out diabetes have been published.6,7 These articles discuss decreased renal and hepatic clearance of insulin (which increases its half-life) hypoglycemia during HD, and low HbA1c due to preexisting anemia. Inappropriately low HbA1c levels may be secondary to, but not limited to, hemolysis, recent blood transfusion, acute blood loss, and medications, such as erythropoietin-stimulating agents (ESAs).9 The conditions that affect red blood cell turnover are common in patients with advanced CKD and may result in discrepancies in HbA1c levels.
Glycated hemoglobin is a series of minor hemoglobin components formed by the adduction of various carbohydrate molecules to hemoglobin. HbA1c is the largest fraction formed and the most consistent index of the concentration of glucose in the blood.10 Hence, HbA1c is the traditional indicator of overall glycemic control. The current HbA1c goals recommended by the American Diabetes Association are derived from landmark trials conducted with patients in the general adult diabetic non-CKD population. However, hemoglobin measurements can be confounded by conditions present in ESRD and tend to underestimate glucose measurements in patients with T2DM on HD. Despite this, HbA1c is still regarded as a reasonable measure of glycemic control even in patients with ESRD; however, alternative markers of glycemia may be preferable.11
Although HbA1c is the gold standard, there are other laboratory measures of average glycemic control available. Fructosamine is a ketoamine formed when glucose binds to serum proteins. When these proteins are exposed to high concentrations of glucose, they experience increased glycation. Fructosamine assays measure the total glycated serum proteins, of which albumin accounts for about 90%.11 Because the half-life of serum proteins is about 20 days, fructosamine levels can reflect glycemic control over a 2- to 3-week period. This is advantageous in conditions that affect the average age of red blood cells, in pregnancy where frequent monitoring and measures of short-term glucose control are especially important, and in the evaluation of a medication adjustment in the management of T2DM. However, this test is not without its limitations. It is less reliable in settings of decreased protein levels (eg, liver disease), there is a lack of availability in routine practice, and reference levels have not been established.11
Fructosamine has been shown to be strongly associated with mean blood glucose and HbA1c (Table 2). In 2010, Mittman and colleagues published a study that compared HbA1c with fructosamine and their correlation to glycemic control and morbidity, defined as rates of hospitalization and infection.12 The study included 100 patients with T2DM on HD with a mean age of 63 years, 54% were women, mean HbA1c of 7.2%, and mean dialysis duration of 3 years. Average follow-up was 3 years. At the end of follow-up, Mittman and colleagues found that HbA1c and fructosamine were highly correlated and associated with serum glucose (P < .01). However, fructosamine was found to be more highly correlated with mean glucose levels when those levels were below 150 mg/dL (P = .01). A higher fructosamine level, not HbA1c was a more significant predictor of hospitalization (P = .007) and infection (P = .001). Mittman and colleagues presented evidence for the use of fructosamine over HbA1c in patients with T2DM on HD.12
Hypoglycemic Episodes
At the 2-month follow-up visit with the CPS, Mr. A reported having 5 hypoglycemic episodes in the past 30 days. He also stated he would forget to take his insulin aspart dose before dinner about 3 to 4 times a week but would take it 30 to 60 minutes after the meal. Mr. A did not bring his glucometer or SMBG readings to the visit, but he indicated that his blood glucose levels continued to fluctuate and were elevated when consuming carbohydrates.
Laboratory tests 1 month prior to the 2-month follow-up visit showed HbA1c of 7.3%, which had increased from his previous level of 6.1%. He was counseled on the proper administration of insulin aspart and lifestyle modifications. A fructosamine level was ordered at this visit to further assess his glycemic control. A follow-up appointment and laboratory workup (fructosamine and HbA1c) were scheduled for 2 months from the visit (Table 3).
Mr. A was educated on the unreliability of his HbA1c levels secondary to his condition of ESRD on HD. He was counseled on the purpose of fructosamine and how it may be a better predictor of his glycemic control and morbidity. Mr. A continued to be followed closely by the primary care CPS for T2DM management.
Discussion
Management of T2DM in patients with ESRD presents challenges for clinicians in determining HbA1c goals and selecting appropriate medication options. The 2012 Kidney Disease Outcomes Quality Initiative (KDOQI) diabetes guideline does not recommend treatment for patients with substantially reduced kidney function to a target HbA1c < 7% due to risk of hypoglycemia.13 Although a target HbA1c > 7% is suggested for these patients, little is known about appropriate glycemic control in these patients as there is a paucity of prospective, randomized clinical trials that include patients with advanced CKD.13
Moreover, many oral antidiabetic medications and their metabolites are cleared by the kidneys and, therefore, pose with potential harm for patients with CKD. Because of this, insulin is the medication of choice for patients with ESRD.7 Although insulin requirements may diminish with worsening kidney function, insulin provides the safest method of glycemic control. Insulin dosing can be individualized according to a patient’s renal status as there is no uniformity in renal dose adjustments. There are some noninsulin antidiabetic agents that can be used in ESRD, but use of these agents requires close monitoring and evaluation of the medication’s pharmacokinetics (Table 4). Overall, medication management can be a difficult task for patients with T2DM and ESRD, but antidiabetic regimens may be reduced or discontinued altogether in burnt-out diabetes.
One of 3 patients with T2DM and ESRD on dialysis has burnt-out diabetes, defined as a phenomenon in which glucose homeostasis is altered to cause normoglycemia, spontaneous hypoglycemia, and decreased insulin requirements in established patients with T2DM.5 Although Mr. A had a normal-to-low HbA1c, he did not meet these criteria. Due to his elevated SMBG readings, he did not have normoglycemia and did require an increase in his basal insulin dose. Therefore, our patient did not have burnt-out diabetes.
Mr. A represents the relevant issue of inappropriately and unreliably low HbA1c levels due to various factors in ESRD. Our patient did not receive a blood transfusion in the past 2 years and was not on ESA therapy; nevertheless, Mr. A was a patient with ESRD on HD with a diagnosis of anemia. These diagnoses are confounders for low HbA1c values. When fructosamine levels were drawn for Mr. A on September 11, 2018 and November 6, 2018, they correlated well with his serum glucose and SMBG readings. This indicated to the CPS that the patient’s glycemic control was poor despite a promising HbA1c level.
This patient’s case and supporting evidence suggests that other measures of glycemic control (eg, fructosamine) can be used to supplement HbA1c, serum glucose, and glucometer readings to provide an accurate assessment of glycemic control in T2DM. Fructosamine also can assist HbA1c with predicting morbidity and potentially mortality, which are of great importance in this patient population.
Kalantar-Zadeh and colleagues conducted a study of 23,618 patients with T2DM on dialysis to observe mortality in association with HbA1c.5 This analysis showed that patients with HbA1c levels < 5% or > 8% had a higher risk of mortality; higher values of HbA1c (> 10%) were associated with increased death risk vs all other values. In the unadjusted analysis, HbA1c levels between 6 and 8% had the lowest death risk (hazard ratios [HR] 0.8 - 0.9, 95% CI) compared with those of higher and lower HbA1c ranges.5 In nonanemic patients, HbA1c > 6% was associated with increased death risk, whereas anemic patients did not show this trend.
Other studies made similar observations. In 2001, Morioka and colleagues published an observational study of 150 patients with DM on intermittent hemodialysis. The study analyzed survival and HbA1c levels at 1, 3, and 5 years. The study found that at 1, 3, and 5 years, patients with HbA1c < 7.5% had better survival than did patients with HbA1c > 7.5% (3.6 years vs 2.0 years, P = .008). Morioka and colleagues also found that there was a 13% increase in death per 1% increase in HbA1c.14 Oomichi and colleagues conducted an observational study of 114 patients with T2DM and ESRD on intermittent hemodialysis. Patients with fair control (HbA1c 6.5 - 8%) and good control (HbA1c < 6.5%) were compared with patients with poor control (HbA1c > 8%); it was found that the poor control group had nearly triple the mortality when compared with the good and fair control groups (HR = 2.89, P = .01).15 Park and colleagues also saw a similar observation in a study of 1,239 patients with ESRD and DM; 70% of these patients were on intermittent hemodialysis. Patients with poor control (HbA1c ≥ 8%) had worse survival outcomes than those with HbA1c < 8% (HR 2.2, P < .001).16
Our patient case forced us to ask the question, “What should our patient’s HbA1c goals be?” In the study by Oomichi and colleagues, a HbA1c level of 8% has usefulness as a “signpost for management of glycemic control.”15 All patients’ goals should be individualized based on various factors (eg, age, comorbidities), but based on the survival studies above, a HbA1c goal range of 6 to 8% may be optimal.
Conclusions
Patients with T2DM and ESRD on dialysis may have higher morbidity and mortality rates than the rates of those without T2DM. It has been shown in various studies that very low HbA1c (< 5%) and high HbA1c (> 8%) are associated with poor survival. Some patients with T2DM on dialysis may experience burnt-out diabetes in which they may have normoglycemia and a HbA1c below goal; despite these facts, this condition is not positive and can be linked to bad outcomes. In patients with T2DM and ESRD, insulin is the antidiabetic medication of choice, and we recommend a HbA1c target of 6 to 8%. In this patient population, consider using fructosamine levels or other measures of glycemic control to supplement HbA1c and glucose values to provide a better assessment of glycemic control, morbidity, and mortality. Larger clinical trials are needed to assist in answering questions regarding mortality and optimal HbA1c targets in burnt-out diabetes.
1. Centers for Disease Control and Prevention. National Diabetes Statistics Report, 2020. https://www.cdc.gov/diabetes/data/statistics-report/index.html. Updated August 28, 2020. Accessed November 17, 2020.
2. Saran R, Robinson B, et al. US renal data system 2019 annual data report: epidemiology of klidney disease in the United States. Am J Kidney Dis. 2020 Jan;75(1 suppl 1):A6-A7. doi:10.1053/j.ajkd.2019.09.003. Epub 2019 Nov 5.
3. UK Prospective Diabetes Study Group. Effect of intensive blood-glucose control with metformin on complications in overweight patients with type 2 diabetes (UKPDS 34). Lancet. 1998;352(9131):854-865.
4. Gerstein HC, Miller ME, Byington RP, et al. Effects of intensive glucose lowering in type 2 diabetes. N Engl J Med. 2008;358(24):2545-2559. doi:10.1056/NEJMoa0802743
5. Kalantar-Zadeh K, Kopple JD, Regidor DL, et al. A1c and survival in maintenance hemodialysis patients. Diabetes Care. 2007;30(5):1049-10.55. doi:10.2337/dc06-2127
6. Park J, Lertdumrongluk P, Molnar MZ, Kovesdy CP, Kalantar-Zadeh K. Glycemic control in diabetic dialysis patients and the burnt-out diabetes phenomenon. Curr Diab Rep. 2012;12(4):432-439. doi:10.1007/s11892-012-0286-3
7. Rhee CM, Leung AM, Kovesdy CP, Lynch KE, Brent GA, Kalantar-Zadeh K. Updates on the management of diabetes in dialysis patients. Semin Dial. 2014;27(2):135-145. doi:10.1111/sdi.12198
8. Kalantar-Zadeh K, Derose SF, Nicholas S, Benner D, Sharma K, Kovesdy CP. Burnt-out diabetes: impact of chronic kidney disease progression on the natural course of diabetes mellitus. J Ren Nutr. 2009;19(1):33-37. doi:10.1053/j.jrn.2008.11.012
9. Unnikrishnan R, Anjana RM, Mohan V. Drugs affecting HbA1c levels. Indian J Endocrinol Metab. 2012;16(4):528-531. doi:10.4103/2230-8210.98004
10. Makris K, Spanou L. Is there a relationship between mean blood glucose and glycated hemoglobin? J Diabetes Sci Technol. 2011;5(6):1572-1583. doi:10.1177/193229681100500634
11. Wright LAC, Hirsch IB. The challenge of the use of glycemic biomarkers in diabetes: reflecting on hemoglobin A1c, 1,5-anhydroglucitol, and the glycated proteins fructosamine and glycated albumin. Diabetes Spectr. 2012;25(3):141-148. doi:10.2337/diaspect.25.3.141
12. Mittman N, Desiraju B, Fazil I, et al. Serum fructosamine versus glycosylated hemoglobin as an index of glycemic control, hospitalization, and infection in diabetic hemodialysis patients. Kidney Int. 2010;78 (suppl 117):S41-S45. doi:10.1038/ki.2010.193
13. National Kidney Foundation. KDOQI clinical practice guideline for diabetes and CKD: 2012 update. Am J Kidney Dis. 2012;60(5):850-886. doi:10.1053/j.ajkd.2012.07.005
14. Morioka T, Emoto M, Tabata T, et al. Glycemic control is a predictor of survival for diabetic patients on hemodialysis. Diabetes Care. 2001;24(5):909-913. doi.10.2337/diacare.24.5.909
15. Oomichi T, Emoto M, Tabata T, et al. Impact of glycemic control on survival of diabetic patients on chronic regular hemodialysis: a 7-year observational study. Diabetes Care. 2006;29(7):1496-1500. doi:10.2337/dc05-1887
16. Park JI, Bae E, Kim YL, et al. Glycemic control and mortality in diabetic patients undergoing dialysis focusing on the effects of age and dialysis type: a prospective cohort study in Korea. PLoS ONE. 2015;10(8):e0136085. doi:10.1371/journal.pone.0136085
17. Glucotrol tablets [
18. Amaryl [package insert]. Bridgewater, NJ: Sanofi-Aventis; December 2018.
19. Glucophage [package insert]. Princeton, NJ: Bristol-Myers Squibb; May 2018.
20. Actos [package insert]. Deerfield, IL: Takeda Pharmaceuticals America Inc; December 2017.
21. Precose [package insert]. Whippany, NJ: Bayer HealthCare Pharmaceuticals; March 2015.
22. Nesina [package insert]. Deerfield, IL: Takeda Pharmaceuticals America Inc; June 2019.
23. Victoza [package insert]. Plainsboro, NJ: Novo Nordisk Inc; June 2019.
24. Jardiance [package insert]. Ridgefield, CT: Boehringer Ingelheim Pharmaceuticals Inc; October 2018.