User login
The professional advancement of drug and device innovation

I often say that there are both “guardrail” days and very good days when it comes to the ins and outs of health care builds and product launches. The process is much like starting down the path of a country road in the middle of a blizzard—unless you have dependable wipers and a good defrost system, that path can get murky very quickly. With this article I hope to offer my counsel to inventors, featuring a few of my prior launches as well as case studies of health care launches I was not involved with, and sharing the lessons learned and hurdles that were overcome. I encourage all entrepreneurs to act on their ideas because, in the world of health care startups, the only failure is not acting on an invention.
Case study 1: Cerezyme
Today, Cerezyme is indicated for patients with Gaucher, which is a lysosomal storage disorder. Cerezyme’s first-generation product, called Ceredase, was a human tissue-derived protein that we extracted from human placentas. At the time, the concept of moving this program forward was denied by the Board of Directors because they said that even if you could collect enough placentas to make the enzyme, it would be too expensive to manufacture. In fact, early scale-up modeling for manufacturing the protein demonstrated that Genzyme would need 4 tons of placentas per Gaucher patient per year.
Gaucher is a severe, early-onset disease that has a significant negative outcome for patients. Patients with Gaucher are in dire need of treatment. Genzyme went forward with the Ceredase program by financing it through the families of patients with the disease, by starting an LLC separate from the business and funding the initial clinical trial and the development of the protein through the families of Gaucher patients. That approach was a successful endeavor. A great example of a creative capital structure to advance a program.
This was in the late 1980s/early 1990s, and at the height of the AIDS challenge. Genzyme based the manufacturing in Lille, France, and we cryopreserved placentas in the United States and Europe and shipped them to Lille to be processed into therapy. Genzyme eventually received approval for Ceredase from the US Food and Drug Administration (FDA) and the European Medicines Agency. At the height of the placenta collection, we were gathering about 10% to 15% of the placentas in the United States and 30% to 40% of the placentas in Europe. Resources supply became an issue until we developed a recombinant form of the protein, accomplished by using a manufacturing system called a CHO cell line.
This is a very good success story: If this invention was not pursued, Gaucher patients would not benefit from the treatment today. In addition, there are a plethora of patients with different lysosomal storage disorders treated with additional proteins that have been aided by us going through the entire development, manufacturing, and global commercialization process. We figured out how to manufacture and deliver the treatment, working through multiple countries’ political systems, and today the therapy is paid for by insurance and government systems on a worldwide basis.
Continue to: Case study 2...
Case study 2: ThinPrep
I like to use the approval of ThinPrep as an example of avoiding a false negative—a stoppage in the development of the product or drug for the wrong reasons. False negatives, in my mind, occur when you are developing a technology and you run into issues during the clinical phase and/or with FDA approval, or with a technical failure or you run out of capital prior to knowing whether or not the innovation actually works. In the case of ThinPrep, a poorly run clinical trial almost resulted in a false negative.
The company at the time was Cytyc, and an initial clinical study presented to the FDA yielded a neutral-negative outcome. The FDA said that there were not enough data to show the differentiation from the current Pap smear standard of care.
The founders of the company at that time had inherited the study protocol from a prior leadership team, so they had to finish the trial with the initial protocol. Given the FDA’s advisement, they developed a new trial. It took the persistence of these two founders, who mortgaged their homes and spent their personal dollars to take this through the next wave of clinical development. In the end it was successful. The revised clinical trial yielded an approval for ThinPrep, which is now considered a standard of care.
The use of ThinPrep reduced cervical cancer deaths by 40% from preapproval. The challenging path from clinical development to eventual commercial launch and physician leadership in advancing patient care makes the story of ThinPrep a great example of not allowing an early false negative of a poorly designed and run clinical trial stop important innovation.
Case study 3: Cologuard
The development of Cologuard is a case study demonstrating that, sometimes, when your first attempt does not work, you need to have the persistence to raise additional capital and/or use a slightly different technical approach. The approval story of Cologuard is important to share because it is an important cancer screening diagnostic, using DNA from stool samples to test for colon cancer, giving access to important colon cancer screening to many patients. Currently, caregivers are only scraping the surface with Cologuard’s ability to screen the population. There are many more patients that need access to the test, and I believe they will get it in the years ahead.
Cologuard went through a first- and second-generational technical failure. They could not get the test’s specificity and sensitivity to be at the level of a screening tool; there were too many false-positive results. With the third iteration came the technical breakthrough, and a very large, expensive study was conducted—one the leadership team was criticized for. However, that study yielded the data that achieved a New England Journal of Medicine article, and reimbursement support across the country. The combination of the right technical team and the right leadership team, who planned a proper commercial launch, with a CEO that supported the extensive clinical study, has resulted in the fourth generation of Cologuard—an important breakthrough offering a very useful new standard of care in colon cancer detection and screening.
Continue to: Pearls for moving your innovations forward...
Pearls for moving your innovations forward
Because of my experience in undergoing health care start-ups, and contributing to several of those advancements of innovation, many inventors approach me for advice on their paths from idea to full-concept company. Here are a few of my lessons learned.
Consider purpose, not financial gain, first and foremost. Financial gain is typically the by-product or outcome of a standard-of-care breakthrough for inventors, but it’s a very hard road. Pursue your invention for advancing patient care and moving a new standard of care forward in health care versus financial gain at the end.
Determine whether your invention is a product or a company, or potentially, not capitalizable at all. Figure this out early. Analyze your idea to make sure it is sound and truly novel. Analyze the competition and to make sure it is sound and truly novel. Analyze the competition and the market dynamics to support a new product. Can the development path be defined very clearly to raise capital? Is your innovation a big enough breakthrough in the market with several current products to actually make a difference in patient outcomes (and eventually achieve product reimbursement)? The creation of a company may be the right strategy if the innovation can support a differentiated enough breakthrough where you can actually support all the infrastructure to build the business. If you find that the market is not there to support and develop your idea to eventual success, backing off early is important to preserve invested capital.
Protect early. Is your invention patentable, or has someone else already thought of the idea? What kind of patent(s) are appropriate? Where, geographically, do you want to protect your invention? Find a good patent attorney in your local area, early in the process, to help you answer all of these critical questions. Patents are expensive to file and maintain, but it is not expensive to do a literature search to find out if your idea is novel. A provisional patent, which would be your first step, is an important cost-effective step.
Capital is out there. If your invention or idea deserves capital, it is available. I will address raising capital in more detail in the next section.
Consider regulatory and manufacturing as achievable hurdles. Inventors often get tripped up here, considering the regulatory hurdles and manufacturing too challenging and abandoning their ideas because the risk is too great. Regulatory and manufacturing are very important aspects of health care standard-of-care builds. Cutting corners is not an option. That said, regulatory and manufacturing should not stop you. Challenges often can be worked through as long as the clinical need is there, and the clinical data support bringing that technology forward.
Consider corporate partnerships. I am a fan of corporate partners. But which ones should you target, and when and why? Corporate partnerships can bring significant capital, which is great, but there is enough investor capital out there that you should not pursue a corporate partner just for capital. The main benefit of a corporate partner is enterprise intellect. They typically know more about the field that you are entering than the investors or a small company leadership team.
Establish and listen to advisors. When thinking about who to trust, research their track record. Advisors who have gone through this process before, and specifically in your product area, are important to have access to.
Persistence is key. I have observed a tremendous “compression of innovation” in the health care areas that I have been involved with—human tissue-derived proteins, robotic surgery, stem cell therapy, and digital health (which is still in its infancy). For each of these breakthrough categories, early on, it appeared that it couldn’t be done. However, after the first 2 or 3 major breakthroughs in each one of these areas, a compression of innovation occurred. For instance, after approximately 15 years of protein development, we came out with the recombinant manufacturing systems for proteins. Very quickly, within 10 years, there were more than 70 proteins on the market. The persistence of the inventors to overcome early obstacles in each of these health care areas was critical to future success in each area.
Continue to: Raising capital...
Raising capital
There are different investors who specialize in different types of investment opportunities. The first phase of raising capital is the seed round—where there is typically early data, or even no data and just a concept. From this seed round forward, there is less risk as you develop your technology; thus, there are different investors that support different stages of development and that specialize in different types of investing. It is important to target the right investors and raise enough capital to be able to go achieve multiple operational milestones. Otherwise, when you go through your first round of capital, or the Series A or B financing rounds, there may not be a set of investors out there to fund the company moving forward. Health care investors will make it known that they invest in certain rounds of capital. You can determine who those investors are by doing a search online.
A mistake health care inventors can make is not taking enough capital from investors, because they are concerned about dilution. I advise investors not to focus on dilution but rather on, how big can you make “the pie” (value of the company) worth? The entire process is about bringing a true product through to a new standard-of-care curve.
Trust is the most important thing to earn with investors, and there is zero tolerance for a lack of trust. Share your vision as the inventor with investors, who want to know where this category could be in the next 5 or 10 years. Clinical data will always win, and health care investors and industry leaders should be focused on executing the most robust clinical data to demonstrate the clearest potential clinical outcome. Investors will follow a good plan that has been developed to achieve FDA approval, successful commercialization or “go to market” launch, and eventual reimbursement to support a true standard-of-care change.
Failure is defined by inaction
The 3 case studies that I have shared were success stories because the ideas and inventions were acted upon. When I was at Genzyme, we built the company up to more than $1 billion in revenue. We commercialized proteins in over 50 countries. Most importantly, many patients benefited from the innovation. If you have an invention and an idea, act on it—and surround yourself with great people in every discipline. Having the right people and team is extremely important. ●

How ObGyns can best work with radiologists to optimize screening for patients with dense breasts
If your ObGyn practices are anything like ours, every time there is news coverage of a study regarding mammography or about efforts to pass a breast density inform law, your phone rings with patient calls. In fact, every density inform law enacted in the United States, except for in Illinois, directs patients to their referring provider—generally their ObGyn—to discuss the screening and risk implications of dense breast tissue.
The steady increased awareness of breast density means that we, as ObGyns and other primary care providers (PCPs), have additional responsibilities in managing the breast health of our patients. This includes guiding discussions with patients about what breast density means and whether supplemental screening beyond mammography might be beneficial.
As members of the Medical Advisory Board for DenseBreast-info.org (an online educational resource dedicated to providing breast density information to patients and health care professionals), we are aware of the growing body of evidence demonstrating improved detection of early breast cancer using supplemental screening in dense breasts. However, we know that there is confusion among clinicians about how and when to facilitate tailored screening for women with dense breasts or other breast cancer risk factors. Here we answer 6 questions focusing on how to navigate patient discussions around the topic and the best way to collaborate with radiologists to improve breast care for patients.
Play an active role
1. What role should ObGyns and PCPs play in women’s breast health?
Elizabeth Etkin-Kramer, MD: I am a firm believer that ObGyns and all women’s health providers should be able to assess their patients’ risk of breast cancer and explain the process for managing this risk with their patients. This explanation includes the clinical implications of breast density and when supplemental screening should be employed. It is also important for providers to know when to offer genetic testing and when a patient’s personal or family history indicates supplemental screening with breast magnetic resonance imaging (MRI).
DaCarla M. Albright, MD: I absolutely agree that PCPs, ObGyns, and family practitioners should spend the time to be educated about breast density and supplemental screening options. While the exact role providers play in managing patients’ breast health may vary depending on the practice type or location, the need for knowledge and comfort when talking with patients to help them make informed decisions is critical. Breast health and screening, including the importance of breast density, happen to be a particular interest of mine. I have participated in educational webinars, invited lectures, and breast cancer awareness media events on this topic in the past.
Continue to: Join forces with imaging centers...
Join forces with imaging centers
2. How can ObGyns and radiologists collaborate most effectively to use screening results to personalize breast care for patients?
Dr. Etkin-Kramer: It is important to have a close relationship with the radiologists that read our patients’ mammograms. We need to be able to easily contact the radiologist and quickly get clarification on a patient’s report or discuss next steps. Imaging centers should consider running outreach programs to educate their referring providers on how to risk assess, with this assessment inclusive of breast density. Dinner lectures or grand round meetings are effective to facilitate communication between the radiology community and the ObGyn community. Finally, as we all know, supplemental screening is often subject to copays and deductibles per insurance coverage. If advocacy groups, who are working to eliminate these types of costs, cannot get insurers to waive these payments, we need a less expensive self-pay option.
Dr. Albright: I definitely have and encourage an open line of communication between my practice and breast radiology, as well as our breast surgeons and cancer center to set up consultations as needed. We also invite our radiologists as guests to monthly practice meetings or grand rounds within our department to further improve access and open communication, as this environment is one in which greater provider education on density and adjunctive screening can be achieved.
Know when to refer a high-risk patient
3. Most ObGyns routinely collect family history and perform formal risk assessment. What do you need to know about referring patients to a high-risk program?
Dr. Etkin-Kramer: It is important as ObGyns to be knowledgeable about breast and ovarian cancer risk assessment and genetic testing for cancer susceptibility genes. Our patients expect that of us. I am comfortable doing risk assessment in my office, but I sometimes refer to other specialists in the community if the patient needs additional counseling. For risk assessment, I look at family and personal history, breast density, and other factors that might lead me to believe the patient might carry a hereditary cancer susceptibility gene, including Ashkenazi Jewish ancestry.1 When indicated, I check lifetime as well as short-term (5- to 10-year) risk, usually using Breast Cancer Surveillance Consortium (BCSC) or Tyrer-Cuzick/International Breast Cancer Intervention Study (IBIS) models, as these include breast density.
I discuss risk-reducing medications. The US Preventive Services Task Force recommends these agents if my patient’s 5-year risk of breast cancer is 1.67% or greater, and I strongly recommend chemoprevention when the patient’s 5-year BCSC risk exceeds 3%, provided likely benefits exceed risks.2,3 I discuss adding screening breast MRI if lifetime risk by Tyrer-Cuzick exceeds 20%. (Note that Gail and BCSC models are not recommended to be used to determine risk for purposes of supplemental screening with MRI as they do not consider paternal family history nor age of relatives at diagnosis.)
Dr. Albright: ObGyns should be able to ascertain a pertinent history and identify patients at risk for breast cancer based on their personal history, family history, and breast imaging/biopsy history, if relevant. We also need to improve our discussions of supplemental screening for patients who have heterogeneously dense or extremely dense breast tissue. I sense that some ObGyns may rely heavily on the radiologist to suggest supplemental screening, but patients actually look to ObGyns as their providers to have this knowledge and give them direction.
Since I practice at a large academic medical center, I have the opportunity to refer patients to our Breast Cancer Genetics Program because I may be limited on time for counseling in the office and do not want to miss salient details. With all of the information I have ascertained about the patient, I am able to determine and encourage appropriate screening and assure insurance coverage for adjunctive breast MRI when appropriate.
Continue to: Consider how you order patients’ screening to reduce barriers and cost...
Consider how you order patients’ screening to reduce barriers and cost
4. How would you suggest reducing barriers when referring patients for supplemental screening, such as MRI for high-risk women or ultrasound for those with dense breasts? Would you prefer it if such screening could be performed without additional script/referral? How does insurance coverage factor in?
Dr. Etkin-Kramer: I would love for a screening mammogram with possible ultrasound, on one script, to be the norm. One of the centers that I work with accepts a script written this way. Further, when a patient receives screening at a freestanding facility as opposed to a hospital, the fee for the supplemental screening may be lower because they do not add on a facility fee.
Dr. Albright: We have an order in our electronic health record that allows for screening mammography but adds on diagnostic mammography/bilateral ultrasonography, if indicated by imaging. I am mostly ordering that option now for all of my screening patients; rarely have I had issues with insurance accepting that script. As for when ordering an MRI, I always try to ensure that I have done the patient’s personal risk assessment and included that lifetime breast cancer risk on the order. If the risk is 20% or higher, I typically do not have any insurance coverage issues. If I am ordering MRI as supplemental screening, I typically order the “Fast MRI” protocol that our center offers. This order incurs a $299 out-of-pocket cost for the patient. Any patient with heterogeneously or extremely dense breasts on mammography should have this option, but it requires patient education, discussion with the provider, and an additional cost. I definitely think that insurers need to consider covering supplemental screening, since breast density is reportable in a majority of the US states and will soon be the national standard.
Pearls for guiding patients
5. How do you discuss breast density and the need for supplemental screening with your patients?
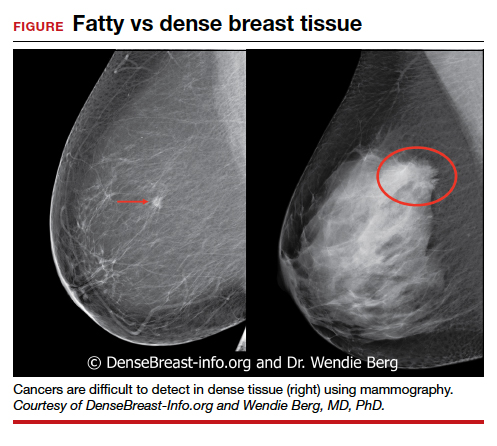
Dr. Etkin-Kramer: I strongly feel that my patients need to know when a screening test has limited ability to do its job. This is the case with dense breasts. Visuals help; when discussing breast density, I like the images supplied by DenseBreast-info.org (FIGURE). I explain the two implications of dense tissue:
- First, dense tissue makes it harder to visualize cancers in the breast—the denser the breasts, the less likely the radiologist can pick up a cancer, so mammographic sensitivity for extremely dense breasts can be as low as 25% to 50%.
- Second, high breast density adds to the risk of developing breast cancer. I explain that supplemental screening will pick up additional cancers in women with dense breasts. For example, breast ultrasound will pick up about 2-3/1000 additional breast cancers per year and MRI or molecular breast imaging (MBI) will pick up much more, perhaps 10/1000.
MRI is more invasive than an ultrasound and uses gadolinium, and MBI has more radiation. Supplemental screening is not endorsed by ACOG’s most recent Committee Opinion from 2017; 4 however, patients may choose to have it done. This is where shared-decision making is important.
I strongly recommend that all women’s health care providers complete the CME course on the DenseBreast-info.org website. “ Breast Density: Why It Matters ” is a certified educational program for referring physicians that helps health care professionals learn about breast density, its associated risks, and how best to guide patients regarding breast cancer screening.
Continue to: Dr. Albright...
Dr. Albright: When I discuss breast density, I make sure that patients understand that their mammogram determines the density of their breast tissue. I review that in the higher density categories (heterogeneously dense or extremely dense), there is a higher risk of missing cancer, and that these categories are also associated with a higher risk of breast cancer. I also discuss the potential need for supplemental screening, for which my institution primarily offers Fast MRI. However, we can offer breast ultrasonography instead as an option, especially for those concerned about gadolinium exposure. Our center offers either of these supplemental screenings at a cost of $299. I also review the lack of coverage for supplemental screening by some insurance carriers, as both providers and patients may need to advocate for insurer coverage of adjunct studies.
Educational resources
6. What reference materials, illustrations, or other tools do you use to educate your patients?
Dr. Etkin-Kramer: I frequently use handouts printed from the DenseBreast-info.org website, and there is now a brand new patient fact sheet that I have just started using. I also have an example of breast density categories from fatty replaced to extremely dense on my computer, and I am putting it on a new smart board.
Dr. Albright: The extensive resources available at DenseBreast-info.org can improve both patient and provider knowledge of these important issues, so I suggest patients visit that website, and I use many of the images and visuals to help explain breast density. I even use the materials from the website for educating my resident trainees on breast health and screening. ●
Nearly 16,000 children (up to age 19 years) face cancer-related treatment every year.1 For girls and young women, undergoing chest radiotherapy puts them at higher risk for secondary breast cancer. In fact, they have a 30% chance of developing such cancer by age 50—a risk that is similar to women with a BRCA1 mutation.2 Therefore, current recommendations for breast cancer screening among those who have undergone childhood chest radiation (≥20 Gy) are to begin annual mammography, with adjunct magnetic resonance imaging (MRI), at age 25 years (or 8 years after chest radiotherapy).3
To determine the benefits and risks of these recommendations, as well as of similar strategies, Yeh and colleagues performed simulation modeling using data from the Childhood Cancer Survivor Study and two CISNET (Cancer Intervention and Surveillance Modeling Network) models.4 For their study they targeted a cohort of female childhood cancer survivors having undergone chest radiotherapy and evaluated breast cancer screening with the following strategies:
- mammography plus MRI, starting at ages 25, 30, or 35 years and continuing to age 74
- MRI alone, starting at ages 25, 30, or 35 years and continuing to age 74.
They found that both strategies reduced the risk of breast cancer in the targeted cohort but that screening beginning at the earliest ages prevented most deaths. No screening at all was associated with a 10% to 11% lifetime risk of breast cancer, but mammography plus MRI beginning at age 25 reduced that risk by 56% to 71% depending on the model. Screening with MRI alone reduced mortality risk by 56% to 62%. When considering cost per quality adjusted life-year gained, the researchers found that screening beginning at age 30 to be the most cost-effective.4
Yeh and colleagues addressed concerns with mammography and radiation. Although they said the associated amount of radiation exposure is small, the use of mammography in women younger than age 30 is controversial—and not recommended by the American Cancer Society or the National Comprehensive Cancer Network.5,6
Bottom line. Yeh and colleagues conclude that MRI screening, with or without mammography, beginning between the ages of 25 and 30 should be emphasized in screening guidelines. They note the importance of insurance coverage for MRI in those at risk for breast cancer due to childhood radiation exposure.4
References
- National Cancer Institute. How common is cancer in children? https://www.cancer.gov/types/childhood-cancers/child-adolescentcancers-fact-sheet#how-common-is-cancer-in-children. Accessed September 25, 2020.
- Moskowitz CS, Chou JF, Wolden SL, et al. Breast cancer after chest radiation therapy for childhood cancer. J Clin Oncol. 2014;32:2217- 2223.
- Children’s Oncology Group. Long-term follow-up guidelines for survivors of childhood, adolescent, and young adult cancers. http:// www.survivorshipguidelines.org/pdf/2018/COG_LTFU_Guidelines_v5.pdf. Accessed September 25, 2020.
- Yeh JM, Lowry KP, Schechter CB, et al. Clinical benefits, harms, and cost-effectiveness of breast cancer screening for survivors of childhood cancer treated with chest radiation. Ann Intern Med. 2020;173:331-341.
- Saslow D, Boetes C, Burke W, et al; American Cancer Society Breast Cancer Advisory Group. American Cancer Society guidelines for breast screening with MRI as an adjunct to mammography. CA Cancer J Clin. 2007;57:75-89.
- National Comprehensive Cancer Network. NCCN Clinical Practice Guidelines in Oncology. Breast cancer screening and diagnosis version 1.2019. https://www.nccn.org/professionals/physician_gls/default.aspx. Accessed September 25, 2020.
- Bharucha PP, Chiu KE, Francois FM, et al. Genetic testing and screening recommendations for patients with hereditary breast cancer. RadioGraphics. 2020;40:913-936.
- Freedman AN, Yu B, Gail MH, et al. Benefit/risk assessment for breast cancer chemoprevention with raloxifene or tamoxifen for women age 50 years or older. J Clin Oncol. 2011;29:2327-2333.
- Pruthi S, Heisey RE, Bevers TB. Chemoprevention for breast cancer. Ann Surg Oncol. 2015;22:3230-3235.
- American College of Obstetricians and Gynecologists. Committee opinion no. 625: management of women with dense breasts diagnosed by mammography [published correction appears in Obstet Gynecol. 2016;127:166]. Obstet Gynecol. 2015;125(3):750-751.
If your ObGyn practices are anything like ours, every time there is news coverage of a study regarding mammography or about efforts to pass a breast density inform law, your phone rings with patient calls. In fact, every density inform law enacted in the United States, except for in Illinois, directs patients to their referring provider—generally their ObGyn—to discuss the screening and risk implications of dense breast tissue.
The steady increased awareness of breast density means that we, as ObGyns and other primary care providers (PCPs), have additional responsibilities in managing the breast health of our patients. This includes guiding discussions with patients about what breast density means and whether supplemental screening beyond mammography might be beneficial.
As members of the Medical Advisory Board for DenseBreast-info.org (an online educational resource dedicated to providing breast density information to patients and health care professionals), we are aware of the growing body of evidence demonstrating improved detection of early breast cancer using supplemental screening in dense breasts. However, we know that there is confusion among clinicians about how and when to facilitate tailored screening for women with dense breasts or other breast cancer risk factors. Here we answer 6 questions focusing on how to navigate patient discussions around the topic and the best way to collaborate with radiologists to improve breast care for patients.
Play an active role
1. What role should ObGyns and PCPs play in women’s breast health?
Elizabeth Etkin-Kramer, MD: I am a firm believer that ObGyns and all women’s health providers should be able to assess their patients’ risk of breast cancer and explain the process for managing this risk with their patients. This explanation includes the clinical implications of breast density and when supplemental screening should be employed. It is also important for providers to know when to offer genetic testing and when a patient’s personal or family history indicates supplemental screening with breast magnetic resonance imaging (MRI).
DaCarla M. Albright, MD: I absolutely agree that PCPs, ObGyns, and family practitioners should spend the time to be educated about breast density and supplemental screening options. While the exact role providers play in managing patients’ breast health may vary depending on the practice type or location, the need for knowledge and comfort when talking with patients to help them make informed decisions is critical. Breast health and screening, including the importance of breast density, happen to be a particular interest of mine. I have participated in educational webinars, invited lectures, and breast cancer awareness media events on this topic in the past.
Continue to: Join forces with imaging centers...
Join forces with imaging centers
2. How can ObGyns and radiologists collaborate most effectively to use screening results to personalize breast care for patients?
Dr. Etkin-Kramer: It is important to have a close relationship with the radiologists that read our patients’ mammograms. We need to be able to easily contact the radiologist and quickly get clarification on a patient’s report or discuss next steps. Imaging centers should consider running outreach programs to educate their referring providers on how to risk assess, with this assessment inclusive of breast density. Dinner lectures or grand round meetings are effective to facilitate communication between the radiology community and the ObGyn community. Finally, as we all know, supplemental screening is often subject to copays and deductibles per insurance coverage. If advocacy groups, who are working to eliminate these types of costs, cannot get insurers to waive these payments, we need a less expensive self-pay option.
Dr. Albright: I definitely have and encourage an open line of communication between my practice and breast radiology, as well as our breast surgeons and cancer center to set up consultations as needed. We also invite our radiologists as guests to monthly practice meetings or grand rounds within our department to further improve access and open communication, as this environment is one in which greater provider education on density and adjunctive screening can be achieved.
Know when to refer a high-risk patient
3. Most ObGyns routinely collect family history and perform formal risk assessment. What do you need to know about referring patients to a high-risk program?
Dr. Etkin-Kramer: It is important as ObGyns to be knowledgeable about breast and ovarian cancer risk assessment and genetic testing for cancer susceptibility genes. Our patients expect that of us. I am comfortable doing risk assessment in my office, but I sometimes refer to other specialists in the community if the patient needs additional counseling. For risk assessment, I look at family and personal history, breast density, and other factors that might lead me to believe the patient might carry a hereditary cancer susceptibility gene, including Ashkenazi Jewish ancestry.1 When indicated, I check lifetime as well as short-term (5- to 10-year) risk, usually using Breast Cancer Surveillance Consortium (BCSC) or Tyrer-Cuzick/International Breast Cancer Intervention Study (IBIS) models, as these include breast density.
I discuss risk-reducing medications. The US Preventive Services Task Force recommends these agents if my patient’s 5-year risk of breast cancer is 1.67% or greater, and I strongly recommend chemoprevention when the patient’s 5-year BCSC risk exceeds 3%, provided likely benefits exceed risks.2,3 I discuss adding screening breast MRI if lifetime risk by Tyrer-Cuzick exceeds 20%. (Note that Gail and BCSC models are not recommended to be used to determine risk for purposes of supplemental screening with MRI as they do not consider paternal family history nor age of relatives at diagnosis.)
Dr. Albright: ObGyns should be able to ascertain a pertinent history and identify patients at risk for breast cancer based on their personal history, family history, and breast imaging/biopsy history, if relevant. We also need to improve our discussions of supplemental screening for patients who have heterogeneously dense or extremely dense breast tissue. I sense that some ObGyns may rely heavily on the radiologist to suggest supplemental screening, but patients actually look to ObGyns as their providers to have this knowledge and give them direction.
Since I practice at a large academic medical center, I have the opportunity to refer patients to our Breast Cancer Genetics Program because I may be limited on time for counseling in the office and do not want to miss salient details. With all of the information I have ascertained about the patient, I am able to determine and encourage appropriate screening and assure insurance coverage for adjunctive breast MRI when appropriate.
Continue to: Consider how you order patients’ screening to reduce barriers and cost...
Consider how you order patients’ screening to reduce barriers and cost
4. How would you suggest reducing barriers when referring patients for supplemental screening, such as MRI for high-risk women or ultrasound for those with dense breasts? Would you prefer it if such screening could be performed without additional script/referral? How does insurance coverage factor in?
Dr. Etkin-Kramer: I would love for a screening mammogram with possible ultrasound, on one script, to be the norm. One of the centers that I work with accepts a script written this way. Further, when a patient receives screening at a freestanding facility as opposed to a hospital, the fee for the supplemental screening may be lower because they do not add on a facility fee.
Dr. Albright: We have an order in our electronic health record that allows for screening mammography but adds on diagnostic mammography/bilateral ultrasonography, if indicated by imaging. I am mostly ordering that option now for all of my screening patients; rarely have I had issues with insurance accepting that script. As for when ordering an MRI, I always try to ensure that I have done the patient’s personal risk assessment and included that lifetime breast cancer risk on the order. If the risk is 20% or higher, I typically do not have any insurance coverage issues. If I am ordering MRI as supplemental screening, I typically order the “Fast MRI” protocol that our center offers. This order incurs a $299 out-of-pocket cost for the patient. Any patient with heterogeneously or extremely dense breasts on mammography should have this option, but it requires patient education, discussion with the provider, and an additional cost. I definitely think that insurers need to consider covering supplemental screening, since breast density is reportable in a majority of the US states and will soon be the national standard.
Pearls for guiding patients
5. How do you discuss breast density and the need for supplemental screening with your patients?
Dr. Etkin-Kramer: I strongly feel that my patients need to know when a screening test has limited ability to do its job. This is the case with dense breasts. Visuals help; when discussing breast density, I like the images supplied by DenseBreast-info.org (FIGURE). I explain the two implications of dense tissue:
- First, dense tissue makes it harder to visualize cancers in the breast—the denser the breasts, the less likely the radiologist can pick up a cancer, so mammographic sensitivity for extremely dense breasts can be as low as 25% to 50%.
- Second, high breast density adds to the risk of developing breast cancer. I explain that supplemental screening will pick up additional cancers in women with dense breasts. For example, breast ultrasound will pick up about 2-3/1000 additional breast cancers per year and MRI or molecular breast imaging (MBI) will pick up much more, perhaps 10/1000.
MRI is more invasive than an ultrasound and uses gadolinium, and MBI has more radiation. Supplemental screening is not endorsed by ACOG’s most recent Committee Opinion from 2017; 4 however, patients may choose to have it done. This is where shared-decision making is important.
I strongly recommend that all women’s health care providers complete the CME course on the DenseBreast-info.org website. “ Breast Density: Why It Matters ” is a certified educational program for referring physicians that helps health care professionals learn about breast density, its associated risks, and how best to guide patients regarding breast cancer screening.
Continue to: Dr. Albright...
Dr. Albright: When I discuss breast density, I make sure that patients understand that their mammogram determines the density of their breast tissue. I review that in the higher density categories (heterogeneously dense or extremely dense), there is a higher risk of missing cancer, and that these categories are also associated with a higher risk of breast cancer. I also discuss the potential need for supplemental screening, for which my institution primarily offers Fast MRI. However, we can offer breast ultrasonography instead as an option, especially for those concerned about gadolinium exposure. Our center offers either of these supplemental screenings at a cost of $299. I also review the lack of coverage for supplemental screening by some insurance carriers, as both providers and patients may need to advocate for insurer coverage of adjunct studies.
Educational resources
6. What reference materials, illustrations, or other tools do you use to educate your patients?
Dr. Etkin-Kramer: I frequently use handouts printed from the DenseBreast-info.org website, and there is now a brand new patient fact sheet that I have just started using. I also have an example of breast density categories from fatty replaced to extremely dense on my computer, and I am putting it on a new smart board.
Dr. Albright: The extensive resources available at DenseBreast-info.org can improve both patient and provider knowledge of these important issues, so I suggest patients visit that website, and I use many of the images and visuals to help explain breast density. I even use the materials from the website for educating my resident trainees on breast health and screening. ●
Nearly 16,000 children (up to age 19 years) face cancer-related treatment every year.1 For girls and young women, undergoing chest radiotherapy puts them at higher risk for secondary breast cancer. In fact, they have a 30% chance of developing such cancer by age 50—a risk that is similar to women with a BRCA1 mutation.2 Therefore, current recommendations for breast cancer screening among those who have undergone childhood chest radiation (≥20 Gy) are to begin annual mammography, with adjunct magnetic resonance imaging (MRI), at age 25 years (or 8 years after chest radiotherapy).3
To determine the benefits and risks of these recommendations, as well as of similar strategies, Yeh and colleagues performed simulation modeling using data from the Childhood Cancer Survivor Study and two CISNET (Cancer Intervention and Surveillance Modeling Network) models.4 For their study they targeted a cohort of female childhood cancer survivors having undergone chest radiotherapy and evaluated breast cancer screening with the following strategies:
- mammography plus MRI, starting at ages 25, 30, or 35 years and continuing to age 74
- MRI alone, starting at ages 25, 30, or 35 years and continuing to age 74.
They found that both strategies reduced the risk of breast cancer in the targeted cohort but that screening beginning at the earliest ages prevented most deaths. No screening at all was associated with a 10% to 11% lifetime risk of breast cancer, but mammography plus MRI beginning at age 25 reduced that risk by 56% to 71% depending on the model. Screening with MRI alone reduced mortality risk by 56% to 62%. When considering cost per quality adjusted life-year gained, the researchers found that screening beginning at age 30 to be the most cost-effective.4
Yeh and colleagues addressed concerns with mammography and radiation. Although they said the associated amount of radiation exposure is small, the use of mammography in women younger than age 30 is controversial—and not recommended by the American Cancer Society or the National Comprehensive Cancer Network.5,6
Bottom line. Yeh and colleagues conclude that MRI screening, with or without mammography, beginning between the ages of 25 and 30 should be emphasized in screening guidelines. They note the importance of insurance coverage for MRI in those at risk for breast cancer due to childhood radiation exposure.4
References
- National Cancer Institute. How common is cancer in children? https://www.cancer.gov/types/childhood-cancers/child-adolescentcancers-fact-sheet#how-common-is-cancer-in-children. Accessed September 25, 2020.
- Moskowitz CS, Chou JF, Wolden SL, et al. Breast cancer after chest radiation therapy for childhood cancer. J Clin Oncol. 2014;32:2217- 2223.
- Children’s Oncology Group. Long-term follow-up guidelines for survivors of childhood, adolescent, and young adult cancers. http:// www.survivorshipguidelines.org/pdf/2018/COG_LTFU_Guidelines_v5.pdf. Accessed September 25, 2020.
- Yeh JM, Lowry KP, Schechter CB, et al. Clinical benefits, harms, and cost-effectiveness of breast cancer screening for survivors of childhood cancer treated with chest radiation. Ann Intern Med. 2020;173:331-341.
- Saslow D, Boetes C, Burke W, et al; American Cancer Society Breast Cancer Advisory Group. American Cancer Society guidelines for breast screening with MRI as an adjunct to mammography. CA Cancer J Clin. 2007;57:75-89.
- National Comprehensive Cancer Network. NCCN Clinical Practice Guidelines in Oncology. Breast cancer screening and diagnosis version 1.2019. https://www.nccn.org/professionals/physician_gls/default.aspx. Accessed September 25, 2020.
- Bharucha PP, Chiu KE, Francois FM, et al. Genetic testing and screening recommendations for patients with hereditary breast cancer. RadioGraphics. 2020;40:913-936.
- Freedman AN, Yu B, Gail MH, et al. Benefit/risk assessment for breast cancer chemoprevention with raloxifene or tamoxifen for women age 50 years or older. J Clin Oncol. 2011;29:2327-2333.
- Pruthi S, Heisey RE, Bevers TB. Chemoprevention for breast cancer. Ann Surg Oncol. 2015;22:3230-3235.
- American College of Obstetricians and Gynecologists. Committee opinion no. 625: management of women with dense breasts diagnosed by mammography [published correction appears in Obstet Gynecol. 2016;127:166]. Obstet Gynecol. 2015;125(3):750-751.

Please stop using the adjective “elective” to describe the important health services ObGyns provide
During the April 2020 peak of patient admissions to our hospital caused by coronavirus disease 2019 (COVID-19), we severely limited the number of surgical procedures performed to conserve health system resources. During this stressful time, some administrators and physicians began categorizing operations for cancer as "elective" procedures that could be postponed for months. Personally, I think the use of elective to describe cancer surgery is not optimal, even during a pandemic. In reality, the surgeries for patients with cancer were being postponed to ensure that services were available for patients with severe and critical COVID-19 disease, not because the surgeries were "elective." The health system leaders were making the rational decision to prioritize the needs of patients with COVID-19 infections over the needs of patients with cancer. However, they were using an inappropriate description of the rationale for postponing the surgery for patients with cancer—an intellectual short-cut.
This experience prompted me to explore all the medical interventions commonly described as elective. Surprisingly, among medical specialists, obstetricians excel in using the adjective elective to describe our important work. For example, in the medical record we commonly use terms such as “elective induction of labor,” “elective cesarean delivery” (CD) and “elective termination of pregnancy.” I believe it would advance our field if obstetricians stopped using the term elective to describe the important health services we provide.
Stop using the term “elective induction of labor”
Ghartey and Macones recently advocated for all obstetricians to stop using the term elective when describing induction of labor.1 The ARRIVE trial (A Randomized Trial of Induction vs Expectant Management)2 demonstrated that, among nulliparous women at 39 weeks’ gestation, induction of labor resulted in a lower CD rate than expectant management (18.6% vs 22.2%, respectively; relative risk, 0.84; 95% confidence interval [CI], 0.76-0.93). These findings indicate that induction of labor is not elective because it provides a clear health benefit over the alternative of expectant management. Given current expert guidance, induction of labor prior to 39 weeks’ gestation must be based on an accepted medical indication and provide a health benefit; hence, these inductions are medically indicated. Similarly, since induction of labor at 39 weeks’ gestation also provides a clear health benefit it is also medically indicated and not “elective.” Ghartey and Macones conclude1:
"The words we choose to
describe medical interventions
matter. They send a message
to patients, physicians, nurses,
and hospital administrators.
When the term 'elective' is applied to a medical intervention,
it implies that it is not really
necessary. That is certainly not
the case when it comes to 39-
week nulliparous induction. The
ARRIVE trial provides grade A
(good and consistent) evidence
that labor induction provided
benefit with no harm to women
and their infants. These inductions are not 'elective'."
An alternative descriptor is “medically indicated” induction.
Continue to: Stop using the term “elective cesarean delivery”...
Stop using the term “elective cesarean delivery”
I recently searched PubMed for publications using the key words, “elective cesarean delivery,” and more than 7,000 publications were identified by the National Library of Medicine. “Elective cesarean delivery” is clearly an important term used by obstetrical authorities. What do we mean by elective CD?
At 39 weeks’ gestation, a low-risk nulliparous pregnant woman has a limited number of options:
- induction of labor
- expectant management awaiting the onset of labor
- scheduled CD before the onset of labor.
For a low-risk pregnant woman at 39 weeks’ gestation, the American College of Obstetricians and Gynecologists recommends vaginal delivery because it best balances the risks and benefits for the woman and newborn.3 When a low-risk nulliparous pregnant woman asks a clinician about a scheduled CD, we are trained to thoroughly explore the reasons for the woman’s request, including her intellectual, fact-based, concerns about labor and vaginal birth and her emotional reaction to the thought of a vaginal or cesarean birth. In this situation the clinician will provide information about the risks and benefits of vaginal versus CD. In the vast majority of situations, the pregnant woman will agree to attempting vaginal delivery. In one study of 458,767 births, only 0.2% of women choose a “maternal request cesarean delivery.”4
After thorough counseling, if a woman and her clinician jointly agree to schedule a primary CD it will be the result of hours of intensive discussion, not an imprudent and hasty decision. In this case, the delivery is best characterized as a “maternal request cesarean delivery,” not an “elective” CD.
Stop using the terms “elective termination of pregnancy” and “elective abortion”
Janiak and Goldberg have advocated for the elimination of the phrase elective abortion.5 They write5:
"Support for abortion varies
depending on the reason for
the abortion—whether it is
'elective' or 'indicated.' In the
case of abortion, these terms
generally differentiate between
women seeking abortion for
reasons of maternal or fetal
health (an 'indicated abortion')
defined in contrast to women
seeking abortion for other
reasons (an 'elective abortion').
We argue that such a distinction is impossible to operationalize in a just manner. The use
of the phrase 'elective abortion'
promotes the institutionalization of a false hierarchy of need
among abortion patients."
My experience is that pregnant women never seek an abortion based on whimsy. Most pregnant women who consider an abortion struggle greatly with the choice, using reason and judgment to arrive at their final decision. The choice to seek an abortion is always a difficult one, influenced by a constellation of hard facts that impact the woman’s life. Using the term elective to describe an abortion implies a moral judgment and stigmatizes the choice to have an abortion. Janiak and Goldberg conclude by recommending the elimination of the phrase 'elective abortion' in favor of the phrase “induced abortion.”5
Continue to: Time for change...
Time for change
Shockingly, in searching the International Statistical Classification of Diseases and Related Health Problems, 10th revision (ICD10), the word elective is most commonly used in the context of health services provided to pregnant women, including: elective induction of labor (Z34.90), elective cesarean delivery (O82), elective termination of pregnancy (Z33.2), and elective fetal reduction (Z031.30X0). In ICD10, other specialties do not describe the scope of their health services with the adjective elective.
There are many definitions and interpretations of elective. The most benign use of the word in the context of surgery is to contrast procedures that can be scheduled in the future with those that need to be performed urgently. In this context elective only refers to the timing, not the medical necessity, of the procedure. By contrast, describing a procedure as elective may signal that it is not medically necessary and is being performed based on the capricious preference of the patient or physician. Given the confusion and misunderstanding that may be caused by describing our important health services as “elective,” I hope that we can permanently sunset use of the term. ●
- Ghartey J, Macones GA. 39-week nulliparous inductions are not elective. Am J Obstet Gynecol. 2020;222:519-520.
- Grobman WA, Rice MM, Reddy UM, et al. Labor induction versus expectant management in low-risk nulliparous women. N Engl J Med. 2018;379:513-523.
- ACOG Committee Opinion No 761: cesarean delivery on maternal request. Obstet Gynecol. 2019;133.e73-e77.
- Gossman GL, Joesch JM, Tanfer K. Trends in maternal request cesarean delivery from 1991 to 2004. Obstet Gynecol. 2006;108:1506-1516.
- Janiak E, Goldberg AB. Eliminating the phrase “elective abortion”: why language matters. Contraception. 2016;93:89-92.

Robert L. Barbieri, MD
Editor in Chief, OBG Management
Chair Emeritus, Obstetrics and Gynecology
Brigham and Women’s Hospital
Boston, Massachusetts
Kate Macy Ladd Professor of Obstetrics,
Gynecology and Reproductive Biology
Harvard Medical School
Dr. Barbieri reports no financial relationships relevant to this article.
During the April 2020 peak of patient admissions to our hospital caused by coronavirus disease 2019 (COVID-19), we severely limited the number of surgical procedures performed to conserve health system resources. During this stressful time, some administrators and physicians began categorizing operations for cancer as "elective" procedures that could be postponed for months. Personally, I think the use of elective to describe cancer surgery is not optimal, even during a pandemic. In reality, the surgeries for patients with cancer were being postponed to ensure that services were available for patients with severe and critical COVID-19 disease, not because the surgeries were "elective." The health system leaders were making the rational decision to prioritize the needs of patients with COVID-19 infections over the needs of patients with cancer. However, they were using an inappropriate description of the rationale for postponing the surgery for patients with cancer—an intellectual short-cut.
This experience prompted me to explore all the medical interventions commonly described as elective. Surprisingly, among medical specialists, obstetricians excel in using the adjective elective to describe our important work. For example, in the medical record we commonly use terms such as “elective induction of labor,” “elective cesarean delivery” (CD) and “elective termination of pregnancy.” I believe it would advance our field if obstetricians stopped using the term elective to describe the important health services we provide.
Stop using the term “elective induction of labor”
Ghartey and Macones recently advocated for all obstetricians to stop using the term elective when describing induction of labor.1 The ARRIVE trial (A Randomized Trial of Induction vs Expectant Management)2 demonstrated that, among nulliparous women at 39 weeks’ gestation, induction of labor resulted in a lower CD rate than expectant management (18.6% vs 22.2%, respectively; relative risk, 0.84; 95% confidence interval [CI], 0.76-0.93). These findings indicate that induction of labor is not elective because it provides a clear health benefit over the alternative of expectant management. Given current expert guidance, induction of labor prior to 39 weeks’ gestation must be based on an accepted medical indication and provide a health benefit; hence, these inductions are medically indicated. Similarly, since induction of labor at 39 weeks’ gestation also provides a clear health benefit it is also medically indicated and not “elective.” Ghartey and Macones conclude1:
"The words we choose to
describe medical interventions
matter. They send a message
to patients, physicians, nurses,
and hospital administrators.
When the term 'elective' is applied to a medical intervention,
it implies that it is not really
necessary. That is certainly not
the case when it comes to 39-
week nulliparous induction. The
ARRIVE trial provides grade A
(good and consistent) evidence
that labor induction provided
benefit with no harm to women
and their infants. These inductions are not 'elective'."
An alternative descriptor is “medically indicated” induction.
Continue to: Stop using the term “elective cesarean delivery”...
Stop using the term “elective cesarean delivery”
I recently searched PubMed for publications using the key words, “elective cesarean delivery,” and more than 7,000 publications were identified by the National Library of Medicine. “Elective cesarean delivery” is clearly an important term used by obstetrical authorities. What do we mean by elective CD?
At 39 weeks’ gestation, a low-risk nulliparous pregnant woman has a limited number of options:
- induction of labor
- expectant management awaiting the onset of labor
- scheduled CD before the onset of labor.
For a low-risk pregnant woman at 39 weeks’ gestation, the American College of Obstetricians and Gynecologists recommends vaginal delivery because it best balances the risks and benefits for the woman and newborn.3 When a low-risk nulliparous pregnant woman asks a clinician about a scheduled CD, we are trained to thoroughly explore the reasons for the woman’s request, including her intellectual, fact-based, concerns about labor and vaginal birth and her emotional reaction to the thought of a vaginal or cesarean birth. In this situation the clinician will provide information about the risks and benefits of vaginal versus CD. In the vast majority of situations, the pregnant woman will agree to attempting vaginal delivery. In one study of 458,767 births, only 0.2% of women choose a “maternal request cesarean delivery.”4
After thorough counseling, if a woman and her clinician jointly agree to schedule a primary CD it will be the result of hours of intensive discussion, not an imprudent and hasty decision. In this case, the delivery is best characterized as a “maternal request cesarean delivery,” not an “elective” CD.
Stop using the terms “elective termination of pregnancy” and “elective abortion”
Janiak and Goldberg have advocated for the elimination of the phrase elective abortion.5 They write5:
"Support for abortion varies
depending on the reason for
the abortion—whether it is
'elective' or 'indicated.' In the
case of abortion, these terms
generally differentiate between
women seeking abortion for
reasons of maternal or fetal
health (an 'indicated abortion')
defined in contrast to women
seeking abortion for other
reasons (an 'elective abortion').
We argue that such a distinction is impossible to operationalize in a just manner. The use
of the phrase 'elective abortion'
promotes the institutionalization of a false hierarchy of need
among abortion patients."
My experience is that pregnant women never seek an abortion based on whimsy. Most pregnant women who consider an abortion struggle greatly with the choice, using reason and judgment to arrive at their final decision. The choice to seek an abortion is always a difficult one, influenced by a constellation of hard facts that impact the woman’s life. Using the term elective to describe an abortion implies a moral judgment and stigmatizes the choice to have an abortion. Janiak and Goldberg conclude by recommending the elimination of the phrase 'elective abortion' in favor of the phrase “induced abortion.”5
Continue to: Time for change...
Time for change
Shockingly, in searching the International Statistical Classification of Diseases and Related Health Problems, 10th revision (ICD10), the word elective is most commonly used in the context of health services provided to pregnant women, including: elective induction of labor (Z34.90), elective cesarean delivery (O82), elective termination of pregnancy (Z33.2), and elective fetal reduction (Z031.30X0). In ICD10, other specialties do not describe the scope of their health services with the adjective elective.
There are many definitions and interpretations of elective. The most benign use of the word in the context of surgery is to contrast procedures that can be scheduled in the future with those that need to be performed urgently. In this context elective only refers to the timing, not the medical necessity, of the procedure. By contrast, describing a procedure as elective may signal that it is not medically necessary and is being performed based on the capricious preference of the patient or physician. Given the confusion and misunderstanding that may be caused by describing our important health services as “elective,” I hope that we can permanently sunset use of the term. ●
- Ghartey J, Macones GA. 39-week nulliparous inductions are not elective. Am J Obstet Gynecol. 2020;222:519-520.
- Grobman WA, Rice MM, Reddy UM, et al. Labor induction versus expectant management in low-risk nulliparous women. N Engl J Med. 2018;379:513-523.
- ACOG Committee Opinion No 761: cesarean delivery on maternal request. Obstet Gynecol. 2019;133.e73-e77.
- Gossman GL, Joesch JM, Tanfer K. Trends in maternal request cesarean delivery from 1991 to 2004. Obstet Gynecol. 2006;108:1506-1516.
- Janiak E, Goldberg AB. Eliminating the phrase “elective abortion”: why language matters. Contraception. 2016;93:89-92.
Chronic, preventive care fell as telemedicine soared during COVID-19
As the COVID-19 pandemic drove down the number of primary care visits and altered the method – moving many to telehealth appointments instead of in-person visits – the content of those appointments also changed, researchers reported in JAMA Network Open.
For the study, G. Caleb Alexander, MD, from the Center for Drug Safety and Effectiveness, Johns Hopkins University, Baltimore, and colleagues analyzed data from the IQVIA National Disease and Therapeutic Index, a nationally representative audit of outpatient care in the United States, from the first quarter of 2018 through the second quarter of 2020.
Most primary care visits in 2018 and 2019 were office based, the authors noted. In the second quarter (Q2, April-May) of 2020, as the COVID-19 pandemic spread across the country, the total number of primary care encounters decreased by 21.4%, and the number of office visits dropped by 50.2%, compared with the average of visits during Q2 in 2018 and 2019.
At the same time, telemedicine visits increased from just 1.1% of total visits in Q2 of 2018 and 2019 to 4.1% of visits in the first quarter (January through March) of 2020 and to 35.3% of visits in Q2 of 2020.
The authors also found that the use of telemedicine in the first half of 2020 varied by geographical region and was not associated with the regional COVID-19 burden. In the Pacific region (Washington, Oregon, and California), 26.8% of encounters were virtual. By contrast, the proportion of telemedicine encounters accounted for only 15.1% of visits in the East North Central states (Wisconsin, Michigan, Illinois, Indiana, and Ohio).
Adults between the ages of 19 and 55 years were more likely to attend telemedicine visits than were those younger or older. Additionally, adults who were commercially insured were more likely to adopt telemedicine versus those with public or no insurance. The study did not find substantial differences in telemedicine use by payer type, nor evidence of a racial disparity between Black and White people in their use of telemedicine.
Drop-off in preventive and chronic care
During the second quarter of this year, the authors reported, the number of visits that included blood pressure assessments dropped by 50.1% and the number of visits in which cholesterol levels were assessed fell by 36.9%, compared with the Q2 of 2018 and 2019.
Visits in which providers prescribed new antihypertensive or cholesterol-lowering medications decreased by 26% in Q2 of 2020 versus the same periods in the previous 2 years. The number of visits in which such prescriptions were renewed dropped by 8.9%.
New treatments also decreased significantly in Q2 of 2020 for patients with chronic conditions, including hypertension, diabetes, high cholesterol, asthma, depression, and insomnia.
When the authors compared the content of telemedicine versus in-person visits in Q2 of 2020, they found a substantial difference. Blood pressure was assessed in 69.7% of office visits, compared with 9.6% of telemedicine. Similarly, cholesterol levels were evaluated in 21.6% of office visits versus 13.5% of telemedicine encounters. New medications were ordered in similar proportions of office-based and telemedicine visits.
The authors concluded that “the COVID-19 pandemic has been associated with changes in the structure of primary care delivery, with the content of telemedicine visits differing from that of office-based encounters.”
While limited in scope, the authors noted, their study is one of the first to evaluate the changes in the content of primary care visits during the pandemic. They attributed the decline in evaluations of cardiovascular risk factors such as blood pressure and cholesterol to “fewer total visits and less frequent assessments during telemedicine encounters.”
While pointing to the inherent limitations of telemedicine, the study did not mention the availability of digital home blood pressure cuffs or home cholesterol test kits. Both kinds of devices are available at consumer-friendly price points and can help people track their indicators, but they’re not considered a substitute for sphygmomanometers used in offices or conventional lab tests. It’s not known how many consumers with cardiovascular risk factors have this kind of home monitoring equipment or how many doctors look at this kind of data.
Dr. Alexander reported serving as a paid adviser to IQVIA; that he is a cofounding principal and equity holder in Monument Analytics, a health care consultancy whose clients include the life sciences industry as well as plaintiffs in opioid litigation; and that he is a member of OptumRx’s National P&T Committee. One coauthor reported serving as an unpaid adviser to IQVIA and receiving personal fees from the states of California, Washington, and Alaska outside the submitted work. No other disclosures were reported.
A version of this article originally appeared on Medscape.com.
Primary care isn’t bouncing back
published by the Primary Care Collaborative (PCC) and Larry A. Green Center.
Since mid-March these organizations have issued short weekly and biweekly surveys to U.S. primary care physicians in an attempt to find the pulse of the county’s first line of care. “There is not a federal office for primary care, and it’s been anemically funded for decades,” Rebecca Etz, PhD, said in an interview. Yet these clinics represent the front lines of U.S. health care, and it’s where most Americans go for care and COVID-19 care, said Dr. Etz, director of the Virginia-based Larry A. Green Center, which is devoted to primary care research, development, and advocacy.
The latest survey responses, collected between Sept. 4 and 6, confirm what researchers had suspected: Primary care isn’t on solid footing. Eighty-one percent of respondents disagreed emphatically that primary care has bounced back, and another 13% said things were better than earlier this year but not normal.
Meanwhile, 35% of respondents said that revenue and pay are significantly lower than they were before the pandemic and net losses threaten their practices’ viability. Almost half (49%) said their mental exhaustion from work was at an all-time high.
“Because of how our system is set up – it’s a fee-for-service model – the more patients you see, the more money you get,” said Yalda Jabbarpour, MD, medical director at the Graham Center, a leading think tank on family medicine and health care policy. But the stay-at-home order, aversion to telehealth, and fear of in-person visits have been keeping patients away – and driving primary care revenue down. Even when practices transition to and expand their telehealth, payer reimbursement is not yet on parity with in-person visits.
Right now, primary care physicians are doing fewer procedures and spending more time on video visits. “So you may have the same overhead and time investment but you’re getting paid a fraction,” Dr. Etz said. In August, 50% of primary care physicians reported they were working the same or more hours per week as they did before the pandemic but for less money, according to an earlier survey from the Green Center and the PCC. That loss of revenue is compounded by the need for expensive personal protective equipment and preparation for the upcoming flu season, Dr. Etz said.
Ongoing surveys reveal stress
Over the last 20 weeks or so, the Green Center and PCC together have disseminated weekly (through June) or biweekly surveys to 100 professional organizations. Because there isn’t an entity that represents all of primary care and claims data take years to process, these surveys are intended to get real-time feedback from clinicians who are providing a lot of patient care during the pandemic.
The sample sizes are admittedly small, with the most recent survey including 489 clinicians. Dr. Jabbarpour noted, “489 – it’s a good number, but you would want more.” Generally, for a great survey response you’d want 20%-30% of the physician population because then you could assume you’re getting a good mix of geographies, practice sizes, and settings, she said.
Respondents to the most recent survey were from 49 different states; 70% identified their practice as family medicine. One-third had between one and three physicians in their practice and 40% had 10 or more clinicians. “It’s not perfect, but it sounds pretty representative of the primary care workforce,” Dr. Jabbarpour continued.
The latest Green Center-PCC survey, published last week, also found that one in five physicians surveyed said at least one clinician in their practice had opted for early retirement or left practice as a direct result of the pandemic. These declines in clinician staffing come as school reopenings threaten to cause a resurgence of COVID-19 cases and the 2021 flu season could complicate COVID-19 care and testing.
Shortfall could cascade to other specialties
News that primary care is both struggling and shrinking doesn’t come as a surprise to those who research this area, according to Dr. Jabbarpour. Yet it matters “because primary care is where the majority of Americans get their health care.” According to the Centers for Disease Control and Prevention, primary care accounts for 50% of all office visits. But the sector only encompasses 30% of the clinician workforce, according to a 2019 study of physician supply, and accounts for just 7% of national health expenditures, according to a separate 2019 study that measured primary care investment.
If primary care doesn’t bounce back, the shortfall could overwhelm the rest of the health care system, Dr. Jabbarpour said. “If primary care shortages increase, then urgent cares, ERs, and hospitals will become overwhelmed.”
Or public health could suffer as people don’t seek care at all. A study published earlier this summer found that up to 35% of excess deaths during the pandemic were not caused by COVID-19. Instead, they can be attributed to treatable causes, like heart disease, diabetes, and Alzheimers, the researchers concluded. In Dr. Etz’s estimation, this high cost is a glimpse of what happens when there isn’t adequate access to primary care.
When asked about the frequency of the PCC/Green Center surveys, Bianca Frogner, PhD, a health economist and deputy director at the University of Washington Primary Care Innovation Lab in Seattle, said it’s unusual to have this regularity. Also, it’s unique in that it offers a constant mix of physicians. “It’s a small sample, but it still gives a voice where there isn’t one.”
Smaller weekly surveys and secondary analysis projects from the Graham Center, an American Academy of Family Physicians affiliated research center, reinforce findings of the Green Center. The Graham Center surveys also found primary care is taking a financial hit, staff is being furloughed, and patient volume is down, according to Dr. Jabbarpour, who has been involved in most of the Graham Center’s work on COVID.
Dr. Frogner, Dr. Etz, and Dr. Jabbarpour agree that, as a nation, the United States has chronically underinvested in primary care, and now the system is in crisis. The hope is that the survey data gives policymakers, state leaders, and the federal government a better idea of what’s happening on the ground.
It’s also important for researchers “keeping an eye out for the available supply of primary care for certain populations,” Dr. Frogner said. The current conditions are especially a threat to rural and underserved areas, she added.
If primary health care isn’t near recovery that’s a problem for the entire population, Dr. Etz said. And what happens if there’s another surge of COVID-19 or even a second pandemic in our lifetime? Her recommendation: Treat it like disaster recovery. Step one is “Stop the hemorrhaging – they need immediate cash flow.”
A version of this article originally appeared on Medscape.com.
Gastroenterologists among the most likely to adopt telemedicine
It’s no secret that the COVID-19 pandemic has disrupted medical practice and led to a surge in telemedicine visits. A new report issued by the health care social network Doximity in September predicts that these changes will be permanent, and that the telehealth industry will more than triple from $29 billion at the end of this year to about $106 billion by 2023.
The report, titled “2020 State of Telemedicine,” follows a similar 2019 publication and captures the changes created by the pandemic. “Obviously, telemedicine has been around for many years, but the pandemic around COVID-19 has really changed the game. Something that had been getting gradual adoption really rocketed to the forefront,” said Peter Alparin, MD, who is an internist in San Francisco and vice president of product at Doximity, in an interview. The report predicts that 20% of medical visits will be conducted through telemedicine by the end of 2020.
Gastroenterology is one of the top specialties to adopt telemedicine, ranking third behind endocrinology and rheumatology, and that should come as no surprise. “Chronic disease patients lend themselves well to telemedicine because they have ongoing relationships with their physicians, so they can be seen more often and it’s more convenient for them. The specialties that take care of patients with those sorts of illnesses were the ones that adopted it the most readily,” said Dr. Alparin.
That’s probably in part because specialists dealing with chronic conditions have been triaging patients with telephone calls for years, making it easier to tell when a patient needs to come in for a physical visit. “It’s a skill you learn, to tell when something is just a little bit different for a patient. It’s really a clinical judgment that has been honed over years of experience,” said Dr. Alparin. The report backs up that idea, as it found that the physician age groups that most often adopted telemedicine were those in their 40s, 50s, and 60s.
Telemedicine is popular with patients once they try it, and it can greatly expand a physician’s reach, according to Dr. Alparin. “If you’re a specialist, you can perhaps see patients in areas where that specialty is underrepresented, whether that’s the inner city or a very rural area,” he said. The most important barrier is high-speed Internet access, which remains a problem in many areas.
Doximity researchers surveyed more than 2,000 U.S. adults to get their opinions on telemedicine, and analyzed telemedicine adoption data from the platform’s own set of telemedicine tools, and compared it to data from the 2019 report. They also reviewed studies looking at disparities in medicine and patient access to telemedicine.
Telemedicine use among patients grew from 14% before the pandemic, to 35% who reported at least one telemedicine visit after COVID-19. A total of 23% said they planned to continue use of telemedicine after the pandemic ends, and 27% said they had become more comfortable using telemedicine. Among patients, 28% said telemedicine provides the same or better benefit as an in-person visit, and this rose to 53% among those with chronic illnesses.
Among physicians, telemedicine adoption rose by 20% between 2015 and 2018, but increased by 38% between 2019 and 2020. The highest percentage of physician telemedicine adopters were in large metro areas and East Coast states, led by Massachusetts, North Carolina, and New Jersey. None of the top 10 adopter states were west of Illinois.
Equity concerns remain: 64.3% of households with annual incomes of $25,000 or lower have access to broadband internet, compared with 93.5% of those with incomes of $50,000 or lower. In nonmetropolitan areas, 78.1% of households have access, compared with 86.7% of metropolitan households. The good news is that many patients prefer cell phone use for telemedicine, and nearly as many Black and Hispanic Americans own cell phones as White Americans. “That has really democratized access,” said Dr. Alperin.
A key to successful telemedicine appointments is to make sure that the patient is prepared, according to Dr. Alparin. Make sure the patient is in a relatively quiet, well-lit place, and that they have thought about the questions they want to ask. It’s possible to replicate some aspects of a physical appointment with the right conditions. “You can visualize how they move their arms and legs; you can see how they’re breathing. You can gain a lot of information by just watching somebody,” said Dr. Alparin. A physician might also spot clues in the patient’s surroundings. “If a patient is asthmatic and you see cats walking all over the place, or a patient is allergic to gluten and they have loaves of bread everywhere,” he added.
A big concern for telemedicine has been reimbursement. In response to the pandemic, the Centers for Medicare & Medicaid Services created a number of waivers to requirements for billing for telemedicine services, and private insurers followed suit. In August, the agency announced it would make some of those waivers permanent, though others such as removal of restrictions on the site of care, eligible providers, and nonrural areas will likely require an act of Congress to enshrine, CMS administrator Seema Verma told reporters at an August press conference.
SOURCE: 2020 State of Telemedicine Report.

Yuval A. Patel MD, MHS, is assistant professor of medicine, division of gastroenterology, Duke University School of Medicine, Durham, N.C. He has no conflicts of interest.
Yuval A. Patel MD, MHS, is assistant professor of medicine, division of gastroenterology, Duke University School of Medicine, Durham, N.C. He has no conflicts of interest.
Yuval A. Patel MD, MHS, is assistant professor of medicine, division of gastroenterology, Duke University School of Medicine, Durham, N.C. He has no conflicts of interest.
It’s no secret that the COVID-19 pandemic has disrupted medical practice and led to a surge in telemedicine visits. A new report issued by the health care social network Doximity in September predicts that these changes will be permanent, and that the telehealth industry will more than triple from $29 billion at the end of this year to about $106 billion by 2023.
The report, titled “2020 State of Telemedicine,” follows a similar 2019 publication and captures the changes created by the pandemic. “Obviously, telemedicine has been around for many years, but the pandemic around COVID-19 has really changed the game. Something that had been getting gradual adoption really rocketed to the forefront,” said Peter Alparin, MD, who is an internist in San Francisco and vice president of product at Doximity, in an interview. The report predicts that 20% of medical visits will be conducted through telemedicine by the end of 2020.
Gastroenterology is one of the top specialties to adopt telemedicine, ranking third behind endocrinology and rheumatology, and that should come as no surprise. “Chronic disease patients lend themselves well to telemedicine because they have ongoing relationships with their physicians, so they can be seen more often and it’s more convenient for them. The specialties that take care of patients with those sorts of illnesses were the ones that adopted it the most readily,” said Dr. Alparin.
That’s probably in part because specialists dealing with chronic conditions have been triaging patients with telephone calls for years, making it easier to tell when a patient needs to come in for a physical visit. “It’s a skill you learn, to tell when something is just a little bit different for a patient. It’s really a clinical judgment that has been honed over years of experience,” said Dr. Alparin. The report backs up that idea, as it found that the physician age groups that most often adopted telemedicine were those in their 40s, 50s, and 60s.
Telemedicine is popular with patients once they try it, and it can greatly expand a physician’s reach, according to Dr. Alparin. “If you’re a specialist, you can perhaps see patients in areas where that specialty is underrepresented, whether that’s the inner city or a very rural area,” he said. The most important barrier is high-speed Internet access, which remains a problem in many areas.
Doximity researchers surveyed more than 2,000 U.S. adults to get their opinions on telemedicine, and analyzed telemedicine adoption data from the platform’s own set of telemedicine tools, and compared it to data from the 2019 report. They also reviewed studies looking at disparities in medicine and patient access to telemedicine.
Telemedicine use among patients grew from 14% before the pandemic, to 35% who reported at least one telemedicine visit after COVID-19. A total of 23% said they planned to continue use of telemedicine after the pandemic ends, and 27% said they had become more comfortable using telemedicine. Among patients, 28% said telemedicine provides the same or better benefit as an in-person visit, and this rose to 53% among those with chronic illnesses.
Among physicians, telemedicine adoption rose by 20% between 2015 and 2018, but increased by 38% between 2019 and 2020. The highest percentage of physician telemedicine adopters were in large metro areas and East Coast states, led by Massachusetts, North Carolina, and New Jersey. None of the top 10 adopter states were west of Illinois.
Equity concerns remain: 64.3% of households with annual incomes of $25,000 or lower have access to broadband internet, compared with 93.5% of those with incomes of $50,000 or lower. In nonmetropolitan areas, 78.1% of households have access, compared with 86.7% of metropolitan households. The good news is that many patients prefer cell phone use for telemedicine, and nearly as many Black and Hispanic Americans own cell phones as White Americans. “That has really democratized access,” said Dr. Alperin.
A key to successful telemedicine appointments is to make sure that the patient is prepared, according to Dr. Alparin. Make sure the patient is in a relatively quiet, well-lit place, and that they have thought about the questions they want to ask. It’s possible to replicate some aspects of a physical appointment with the right conditions. “You can visualize how they move their arms and legs; you can see how they’re breathing. You can gain a lot of information by just watching somebody,” said Dr. Alparin. A physician might also spot clues in the patient’s surroundings. “If a patient is asthmatic and you see cats walking all over the place, or a patient is allergic to gluten and they have loaves of bread everywhere,” he added.
A big concern for telemedicine has been reimbursement. In response to the pandemic, the Centers for Medicare & Medicaid Services created a number of waivers to requirements for billing for telemedicine services, and private insurers followed suit. In August, the agency announced it would make some of those waivers permanent, though others such as removal of restrictions on the site of care, eligible providers, and nonrural areas will likely require an act of Congress to enshrine, CMS administrator Seema Verma told reporters at an August press conference.
SOURCE: 2020 State of Telemedicine Report.
Trump signs Medicare loan relief bill delaying repayments
President Trump on Oct. 1 signed a bill to keep the federal government running through December 11. This “continuing resolution” (CR), which was approved by the Senate Wednesday on an 84-10 vote, according to The New York Times, includes provisions to delay repayment by physicians of pandemic-related Medicare loans and to reduce the loans’ interest rate.
In an earlier news release, the American Medical Association reported that Congress and the White House had agreed to include the provisions on Medicare loans in the CR.
Under the Medicare Accelerated and Advance Payments (AAP) program, the Centers for Medicare & Medicaid Services advanced money to physicians who were financially impacted by the pandemic. The program, created in March, was suspended in late April.
Physicians who received the Medicare loans were supposed to start paying them back 120 days after they were made. CMS planned to recoup the advances by offsetting them against Medicare claims payments due to physicians. Practices had up to 210 days (7 months) to repay the loans through this process before being asked to repay them directly with interest of 10.25%.
For the practices that received these advances, that meant their Medicare cash flow was scheduled to dry up, starting in August. However, CMS quietly abstained from collecting these payments when they came due, according to Modern Healthcare.
New terms
The amount to be recouped from each claim is reduced from 100% to 25% of the claim for the first 11 months and to 50% of claims withheld for an additional 6 months. If the loan is not repaid in full by then, the provider must pay the balance with interest of 4%.
More than 80% of the $100 billion that CMS loaned to healthcare providers through May 2 went to hospitals, Modern Healthcare calculated. Of the remainder, specialty or multispecialty practices received $3.5 billion, internal medicine specialists got $24 million, family physicians were loaned $15 million, and federally qualified health centers received $20 million.
In the AMA’s news release, AMA President Susan Bailey, MD, who assumed the post in June, called the original loan repayment plan an “economic sword hanging over physician practices.”
This article first appeared on Medscape.com.
The scope of under- and overtreatment in older adults with cancer
Because of physiological changes with aging and differences in cancer biology, caring for older adults (OAs) with cancer requires careful assessment and planning.
Clark Dumontier, MD, of Brigham and Women’s Hospital in Boston, and colleagues sought to define the meaning of the terms “undertreatment” and “overtreatment” for OAs with cancer in a scoping literature review published in the Journal of Clinical Oncology.
Though OAs are typically defined as adults aged 65 years and older, in this review, the authors defined OAs as patients aged 60 years and older.
The authors theorized that a scoping review of papers about this patient population could provide clues about limitations in the oncology literature and guidance about patient management and future research. Despite comprising the majority of cancer patients, OAs are underrepresented in clinical trials.
About scoping reviews
Scoping reviews are used to identify existing evidence in a field, clarify concepts or definitions in the literature, survey how research on a topic is conducted, and identify knowledge gaps. In addition, scoping reviews summarize available evidence without answering a discrete research question.
Industry standards for scoping reviews have been established by the Johanna Briggs Institute and Preferred Reporting Items for Systematic Reviews and Meta-analyses extension for scoping reviews. According to these standards, scoping reviews should:
- Establish eligibility criteria with a rationale for each criterion clearly explained
- Search multiple databases in multiple languages
- Include “gray literature,” defined as studies that are unpublished or difficult to locate
- Have several independent reviewers screen titles and abstracts
- Ask multiple independent reviewers to review full text articles
- Present results with charts or diagrams that align with the review’s objective
- Graphically depict the decision process for including/excluding sources
- Identify implications for further research.
In their review, Dr. DuMontier and colleagues fulfilled many of the aforementioned criteria. The team searched three English-language databases for titles and abstracts that included the terms undertreatment and/or overtreatment, and were related to OAs with cancer, inclusive of all types of articles, cancer types, and treatments.
Definitions of undertreatment and overtreatment were extracted, and categories underlying these definitions were derived. Within a random subset of articles, two coauthors independently determined final categories of definitions and independently assigned those categories.
Findings and implications
To define OA, Dr. DuMontier and colleagues used a cutoff of 60 years or older. Articles mentioning undertreatment (n = 236), overtreatment (n = 71), or both (n = 51) met criteria for inclusion (n = 256), but only 14 articles (5.5%) explicitly provided formal definitions.
For most of the reviewed articles, the authors judged definitions from the surrounding context. In a random subset of 50 articles, there was a high level of agreement (87.1%; κ = 0.81) between two coauthors in independently assigning categories of definitions.
Undertreatment was applied to therapy that was less than recommended (148 articles; 62.7%) or less than recommended with worse outcomes (88 articles; 37.3%).
Overtreatment most commonly denoted intensive treatment of an OA in whom harms outweighed the benefits of treatment (38 articles; 53.5%) or intensive treatment of a cancer not expected to affect the OA during the patient’s remaining life (33 articles; 46.5%).
Overall, the authors found that undertreatment and overtreatment of OAs with cancer are imprecisely defined concepts. Formal geriatric assessment was recommended in just over half of articles, and only 26.2% recommended formal assessments of age-related vulnerabilities for management. The authors proposed definitions that accounted for both oncologic factors and geriatric domains.
Care of individual patients and clinical research
National Comprehensive Cancer Network (NCCN) guidelines for OAs with cancer recommend initial consideration of overall life expectancy. If a patient is a candidate for cancer treatment on that basis, the next recommended assessment is that of the patient’s capacity to understand the relevant information, appreciate the underlying values and overall medical situation, reason through decisions, and communicate a choice that is consistent with the patient’s articulated goals.
In the pretreatment evaluation of OAs in whom there are no concerns about tolerance to antineoplastic therapy, NCCN guidelines suggest geriatric screening with standardized tools and, if abnormal, comprehensive geriatric screening. The guidelines recommend considering alternative treatment options if nonmodifiable abnormalities are identified.
Referral to a geriatric clinical specialist, use of the Cancer and Aging Research Group’s Chemo Toxicity Calculator, and calculation of Chemotherapy Risk Assessment Scale for High-Age Patients score are specifically suggested if high-risk procedures (such as chemotherapy, radiation, or complex surgery, which most oncologists would consider to be “another day in the office”) are contemplated.
The American Society of Clinical Oncology (ASCO) guidelines for geriatric oncology are similarly detailed and endorse similar evaluations and management.
Employing disease-centric and geriatric domains
Dr. DuMontier and colleagues noted that, for OAs with comorbidity or psychosocial challenges, surrogate survival endpoints are unrelated to quality of life (QOL) outcomes. Nonetheless, QOL is valued by OAs at least as much as survival improvement.
Through no fault of their own, the authors’ conclusion that undertreatment and overtreatment are imperfectly defined concepts has a certain neutrality to it. However, the terms undertreatment and overtreatment are commonly used to signify that inappropriate treatment decisions were made. Therefore, the terms are inherently negative and pejorative.
As with most emotionally charged issues in oncology, it is ideal for professionals in our field to take charge when deficiencies exist. ASCO, NCCN, and the authors of this scoping review have provided a conceptual basis for doing so.
An integrated oncologist-geriatrician approach was shown to be effective in the randomized INTEGERATE trial, showing improved QOL, reduced hospital admissions, and reduced early treatment discontinuation from adverse events (ASCO 2020, Abstract 12011).
Therefore, those clinicians who have not formally, systematically, and routinely supplemented the traditional disease-centric endpoints with patient-centered criteria need to do so.
Similarly, a retrospective study published in JAMA Network Open demonstrated that geriatric and surgical comanagement of OAs with cancer was associated with significantly lower 90-day postoperative mortality and receipt of more supportive care services (physical therapy, occupational therapy, speech and swallow rehabilitation, and nutrition services), in comparison with management from the surgical service only.
These clinical and administrative changes will not only enhance patient management but also facilitate the clinical trials required to clarify optimal treatment intensity. As that occurs, we will be able to apply as much precision to the care of OAs with cancer as we do in other areas of cancer treatment.
Dr. Lyss was a community-based medical oncologist and clinical researcher for more than 35 years before his recent retirement. His clinical and research interests were focused on breast and lung cancers, as well as expanding clinical trial access to medically underserved populations. He is based in St. Louis. He has no conflicts of interest.
SOURCE: Dumontier C et al. J Clin Oncol. 2020 Aug 1;38(22):2558-2569.
Cancer disparities: One of the most pressing public health issues
“The burden of cancer is not shouldered equally by all segments of the U.S. population,” the AACR adds. “The adverse differences in cancer burden that exist among certain population groups are one of the most pressing public health challenges that we face in the United States.”
AACR president Antoni Ribas, MD, PhD, gave some examples of these disparities at a September 16 Congressional briefing that focused on the inaugural AACR Cancer Disparities Progress Report 2020.
He noted that:
- Black men have more than double the rate of death from prostate cancer compared with men of other racial and ethnic groups.
- Hispanic children are 24% more likely to develop leukemia than non-Hispanic children.
- Non-Hispanic Black children and adolescents with cancer are more than 50% more likely to die from the cancer than non-Hispanic white children and adolescents with cancer.
- Women of low socioeconomic status with early stage ovarian cancer are 50% less likely to receive recommended care than are women of high socioeconomic status.
- In addition to racial and ethnic minority groups, other populations that bear a disproportionate burden when it comes to cancer include individuals lacking adequate health insurance coverage, immigrants, those with disabilities, residents in rural areas, and members of the lesbian, gay, bisexual, and transgender communities.
“It is absolutely unacceptable that advances in cancer care and treatment are not benefiting everyone equally,” Ribas commented.
Making progress against cancer
Progress being made against cancer was highlighted in another publication, the annual AACR Cancer Progress Report 2020.
U.S. cancer deaths declined by 29% between 1991 and 2017, translating to nearly 3 million cancer deaths avoided, the report notes. In addition, 5-year survival rates for all cancers combined increased from 49% in the mid-1970s to 70% for patients diagnosed from 2010-2016.
Between August 2019 and July 31 of this year, the U.S. Food and Drug Administration approved 20 new anticancer drugs for various cancer types and 15 new indications for previously approved cancer drugs, marking the highest number of approvals in one 12-month period since AACR started producing these reports 10 years ago.
A continuing reduction in the cigarette smoking rate among US adults, which is now below 14%, is contributing greatly to declines in lung cancer rates, which have largely driven the improvements in cancer survival, the AACR noted.
This report also notes that progress has been made toward reducing cancer disparities. Overall disparities in cancer death rates among racial and ethnic groups are less pronounced now than they have been in the past two decades. For example, the overall cancer death rate for African American patients was 33% higher than for White patients in 1990 but just 14% higher in 2016.
However, both reports agree that more must be done to reduce cancer disparities even further.
They highlight initiatives that are underway, including:
- The draft guidance issued by the FDA to promote diversification of clinical trial populations.
- The National Institutes of Health’s (NIH’s) Continuing Umbrella of Research Experiences (CURE) program supporting underrepresented students and scientists along their academic and research career pathway.
- The Centers for Disease Control and Prevention’s Racial and Ethnic Approaches to Community Health (REACH) program, a grant-making program focused on encouraging preventive behaviors in underserved communities.
- The NIH’s All of Us program, which is gathering information from the genomes of 1 million healthy individuals with a focus on recruitment from historically underrepresented populations.
Ribas also announced that AACR has established a task force to focus on racial inequalities in cancer research.
Eliminating disparities would save money, argued John D. Carpten, PhD, from the University of Southern California, Los Angeles, who chaired the steering committee that developed the AACR Cancer Disparities Progress Report.
Carpten noted research showing that eliminating disparities for racial and ethnic minorities between 2003 and 2006 would have reduced health care costs by more than $1 trillion in the United States. This underscores the potentially far-reaching impact of efforts to eliminate disparities, he said.
“Without a doubt, socioeconomics and inequities in access to quality care represent major factors influencing cancer health disparities, and these disparities will persist until we address these issues” he said.
Both progress reports culminate in a call to action, largely focused on the need for “unwavering, bipartisan support from Congress, in the form of robust and sustained annual increases in funding for the NIH, NCI [National Cancer Institute], and FDA,” which is vital for accelerating the pace of progress.
The challenge is now compounded by the ongoing COVID-19 pandemic: Both progress reports note that racial and ethnic minorities, including African Americans, are not only affected disproportionately by cancer, but also by COVID-19, further highlighting the “stark inequities in health care.”
Ribas further called for action from national leadership and the scientific community.
“During this unprecedented time in our nation’s history, there is also a need for our nation’s leaders to take on a much bigger role in confronting and combating the structural and systemic racism that contributes to health disparities,” he said. The “pervasive racism and social injustices” that have contributed to disparities in both COVID-19 and cancer underscore the need for “the scientific community to step up and partner with Congress to assess and address this issue within the research community.”
This article first appeared on Medscape.com.
The 2021 proposed Medicare fee schedule: Can the payment cuts be avoided?
Payment cuts to nearly all of medicine, including gastroenterology, could be in store beginning Jan. 1, 2021. Physicians may also face elimination of some services the Centers for Medicare & Medicaid Services granted temporary access to during the coronavirus (COVID-19) pandemic according to CMS’s recently released policy and payment recommendations. These proposals could be implemented as physician practices are still recovering financially from states’ temporary ban on elective surgeries from March through May 2020 in response to the public health emergency (PHE) and continuing to deal with the clinical and financial challenges of the pandemic.
In early August, CMS proposed a number of changes for 2021 that affect physicians. There’s plenty of good, bad, and ugly in this proposed rule.
Let’s start with two positives (The good):
Medicare proposes to maintain the current values for colonoscopy with biopsy (45385) and esophagogastroduodenoscopy (EGD) with biopsy (43239). Despite a recent reevaluation of these codes in 2016 and 2014, respectively, Medicare conceded to Anthem’s suggestion that the procedures were not overvalued and needed another evaluation. The AGA and our sister societies’ data affirmed the current values and Medicare proposed to maintain them in 2021.

Medicare proposes to increase the price for scope video system equipment (ES031) from $36,306 to $70,673.38 and the suction machine (Gomco) (EQ235) from $1,981.66 to $3,195.85, phased in over 2 years. This will provide a small increase in the practice expense value for all GI endoscopy procedures. Since CMS began conducting a review of scope systems in 2017, the AGA and our sister societies have successfully worked to convince the Agency to increase its payment for GI endoscopes and associated equipment by providing invoices. We are pleased Medicare is updating these items to reflect more accurate costs.
Now onto items that could negatively affect the practice of gastroenterology.
The bad
Medicare proposes to stop covering and paying for telephone evaluation and management (E/M) visits as soon as the COVID-19 PHE expires. After originally denying that Medicare beneficiaries had trouble accessing video E/M visits and refusing to cover existing telephone (audio only) E/M codes 99441-99443, the agency responded to enormous pressure from AGA and other specialties and added the codes to its covered telehealth services list, setting the payment equal to office/outpatient established patient E/M codes 99212-99214 during the PHE. Telephone E/M has been a vital lifeline, allowing Medicare beneficiaries who don’t have a smart phone or reliable internet connection to access needed E/M services, while allowing them to stay safe at home during the PHE. There is evidence that our most vulnerable patients have the greatest need for telephone visits to advance their care.1

Medicare’s proposal to stop covering and paying for telephone E/M visits as soon as the COVID-19 PHE expires, while disappointing, is not surprising because of the agency’s reluctance to admit they were needed in the first place. The agency believes that creating a new code for audio-only patient interactions similar to the virtual check-in code G2012 but for a longer unit of time and with an accordingly higher value will suffice. Physicians appreciate that E/M delivered via telephone is not the same as a check-in call to a patient, and the care provided requires similar time, effort, and cognitive load as video visits. The AGA and our sister societies plan to object to Medicare’s proposal to treat these services as “check-ins” with slightly higher payment and will continue to advocate for permanent coverage of the telephone E/M CPT codes and payment parity with in-person E/M visits.
The ugly
The Medicare Physician Fee Schedule (MPFS) conversion factor, the basis of Medicare payments, is proposed to be cut almost 11% percent from $36.09 in 2020 to $32.26 in 2021.
How it happened
Medicare agreed to implement coding and valuation changes to office and outpatient E/M codes (99202-99205, 99211-99215) in 2021 as recommended by the American Medical Association and widely supported by specialty societies. E/M services account for about 40% of all Medicare spending annually, which magnifies the impact of any changes to their relative value units (RVUs). By law, payment increases that occur from new work RVUs must be offset by a reduction, referred to as a budget-neutral adjustment, applied to offset the increase in total spending on the MPFS.2
CMS explained in the 2021 MPFS proposed rule, “If revisions to the RVUs cause expenditures for the year to change by more than $20 million, we make adjustments to ensure that expenditures do not increase or decrease by more than $20 million.” Medicare calculated that the corresponding adjustment to the conversion factor for 2021 needed to fall by nearly 11% to achieve budget neutrality. Because gastroenterologists report a significant portion of E/M in addition to performing procedures, the overall estimated impact is –5% of all reimbursement from Medicare.
What you can do
Visit the AGA Advocacy Action Center at https://gastro.quorum.us/AGAactioncenter/ and select “Fight back against CMS’s cuts to specialty care payments” to tell your lawmakers to stop these cuts and preserve care for patients by waiving Medicare’s budget neutrality requirements for E/M adjustments.
You can also use the AGA’s Medicare Physician Fee Schedule Calculator tool to determine the effect of the proposed cuts.3 By contacting AGA staff, Leslie Narramore, at [email protected] with the overall effect on your practice, you can help AGA use these data as we work with the physician community to urge Congress to prevent these payment cuts.
What AGA is doing
The AGA and our sister societies have joined the AMA and others in urging Congress and CMS to waive budget-neutrality rules for the implementation of the changes in E/M services effective 2021. We also joined with AMA and over 100 specialty societies in a letter asking Secretary of Health & Human Services Alex Azar that the agency use its authority under the public health emergency declaration to waive budget neutrality for the changes, given these difficult times for practices across the country.
What next steps to take
The AGA and our sister societies are developing comment letters in response to the proposals in the 2021 MPFS proposed rule. Medicare plans to publish its final decisions for 2021 in December. Please do your part by visiting the AGA Advocacy Action Center at https://gastro.quorum.us/AGAactioncenter/ to tell your lawmakers to stop the proposed 2021 payment cuts and preserve care for patients by waiving Medicare’s budget-neutrality requirements for E/M adjustments.
References
1. Serper M et al. Positive early patient and clinician experience with telemedicine in an academic gastroenterology practice during the COVID-19 pandemic [published online ahead of print, 2020 Jun 18]. Gastroenterology. 2020;S0016-5085(20)34834-4. doi: 10.1053/j.gastro.2020.06.034.
2. https://www.cms.gov/Medicare/Quality-Initiatives-Patient-Assessment-Instruments/Value-Based-Programs/MACRA-MIPS-and-APMs/MACRA-MIPS-and-APMs.
3. https://gastro.org/news/prepare-for-and-help-prevent-2021-medicare-cuts-to-gi/.
Dr. Gangarosa is professor of medicine, division of gastroenterology and hepatology, University of North Carolina at Chapel Hill School of Medicine, and chair of the AGA Government Affairs Committee; Dr. Mehta is associate chief innovation officer at Penn Medicine, Philadelphia, a gastroenterologist, assistant professor of medicine at the Perelman School of Medicine, senior fellow at the Leonard Davis Institute of Health Economics, affiliated faculty member at the Center for Health Incentives and Behavioral Economics, and AGA RUC Adviser. They have no conflicts of interest.
Payment cuts to nearly all of medicine, including gastroenterology, could be in store beginning Jan. 1, 2021. Physicians may also face elimination of some services the Centers for Medicare & Medicaid Services granted temporary access to during the coronavirus (COVID-19) pandemic according to CMS’s recently released policy and payment recommendations. These proposals could be implemented as physician practices are still recovering financially from states’ temporary ban on elective surgeries from March through May 2020 in response to the public health emergency (PHE) and continuing to deal with the clinical and financial challenges of the pandemic.
In early August, CMS proposed a number of changes for 2021 that affect physicians. There’s plenty of good, bad, and ugly in this proposed rule.
Let’s start with two positives (The good):
Medicare proposes to maintain the current values for colonoscopy with biopsy (45385) and esophagogastroduodenoscopy (EGD) with biopsy (43239). Despite a recent reevaluation of these codes in 2016 and 2014, respectively, Medicare conceded to Anthem’s suggestion that the procedures were not overvalued and needed another evaluation. The AGA and our sister societies’ data affirmed the current values and Medicare proposed to maintain them in 2021.
Medicare proposes to increase the price for scope video system equipment (ES031) from $36,306 to $70,673.38 and the suction machine (Gomco) (EQ235) from $1,981.66 to $3,195.85, phased in over 2 years. This will provide a small increase in the practice expense value for all GI endoscopy procedures. Since CMS began conducting a review of scope systems in 2017, the AGA and our sister societies have successfully worked to convince the Agency to increase its payment for GI endoscopes and associated equipment by providing invoices. We are pleased Medicare is updating these items to reflect more accurate costs.
Now onto items that could negatively affect the practice of gastroenterology.
The bad
Medicare proposes to stop covering and paying for telephone evaluation and management (E/M) visits as soon as the COVID-19 PHE expires. After originally denying that Medicare beneficiaries had trouble accessing video E/M visits and refusing to cover existing telephone (audio only) E/M codes 99441-99443, the agency responded to enormous pressure from AGA and other specialties and added the codes to its covered telehealth services list, setting the payment equal to office/outpatient established patient E/M codes 99212-99214 during the PHE. Telephone E/M has been a vital lifeline, allowing Medicare beneficiaries who don’t have a smart phone or reliable internet connection to access needed E/M services, while allowing them to stay safe at home during the PHE. There is evidence that our most vulnerable patients have the greatest need for telephone visits to advance their care.1
Medicare’s proposal to stop covering and paying for telephone E/M visits as soon as the COVID-19 PHE expires, while disappointing, is not surprising because of the agency’s reluctance to admit they were needed in the first place. The agency believes that creating a new code for audio-only patient interactions similar to the virtual check-in code G2012 but for a longer unit of time and with an accordingly higher value will suffice. Physicians appreciate that E/M delivered via telephone is not the same as a check-in call to a patient, and the care provided requires similar time, effort, and cognitive load as video visits. The AGA and our sister societies plan to object to Medicare’s proposal to treat these services as “check-ins” with slightly higher payment and will continue to advocate for permanent coverage of the telephone E/M CPT codes and payment parity with in-person E/M visits.
The ugly
The Medicare Physician Fee Schedule (MPFS) conversion factor, the basis of Medicare payments, is proposed to be cut almost 11% percent from $36.09 in 2020 to $32.26 in 2021.
How it happened
Medicare agreed to implement coding and valuation changes to office and outpatient E/M codes (99202-99205, 99211-99215) in 2021 as recommended by the American Medical Association and widely supported by specialty societies. E/M services account for about 40% of all Medicare spending annually, which magnifies the impact of any changes to their relative value units (RVUs). By law, payment increases that occur from new work RVUs must be offset by a reduction, referred to as a budget-neutral adjustment, applied to offset the increase in total spending on the MPFS.2
CMS explained in the 2021 MPFS proposed rule, “If revisions to the RVUs cause expenditures for the year to change by more than $20 million, we make adjustments to ensure that expenditures do not increase or decrease by more than $20 million.” Medicare calculated that the corresponding adjustment to the conversion factor for 2021 needed to fall by nearly 11% to achieve budget neutrality. Because gastroenterologists report a significant portion of E/M in addition to performing procedures, the overall estimated impact is –5% of all reimbursement from Medicare.
What you can do
Visit the AGA Advocacy Action Center at https://gastro.quorum.us/AGAactioncenter/ and select “Fight back against CMS’s cuts to specialty care payments” to tell your lawmakers to stop these cuts and preserve care for patients by waiving Medicare’s budget neutrality requirements for E/M adjustments.
You can also use the AGA’s Medicare Physician Fee Schedule Calculator tool to determine the effect of the proposed cuts.3 By contacting AGA staff, Leslie Narramore, at [email protected] with the overall effect on your practice, you can help AGA use these data as we work with the physician community to urge Congress to prevent these payment cuts.
What AGA is doing
The AGA and our sister societies have joined the AMA and others in urging Congress and CMS to waive budget-neutrality rules for the implementation of the changes in E/M services effective 2021. We also joined with AMA and over 100 specialty societies in a letter asking Secretary of Health & Human Services Alex Azar that the agency use its authority under the public health emergency declaration to waive budget neutrality for the changes, given these difficult times for practices across the country.
What next steps to take
The AGA and our sister societies are developing comment letters in response to the proposals in the 2021 MPFS proposed rule. Medicare plans to publish its final decisions for 2021 in December. Please do your part by visiting the AGA Advocacy Action Center at https://gastro.quorum.us/AGAactioncenter/ to tell your lawmakers to stop the proposed 2021 payment cuts and preserve care for patients by waiving Medicare’s budget-neutrality requirements for E/M adjustments.
References
1. Serper M et al. Positive early patient and clinician experience with telemedicine in an academic gastroenterology practice during the COVID-19 pandemic [published online ahead of print, 2020 Jun 18]. Gastroenterology. 2020;S0016-5085(20)34834-4. doi: 10.1053/j.gastro.2020.06.034.
2. https://www.cms.gov/Medicare/Quality-Initiatives-Patient-Assessment-Instruments/Value-Based-Programs/MACRA-MIPS-and-APMs/MACRA-MIPS-and-APMs.
3. https://gastro.org/news/prepare-for-and-help-prevent-2021-medicare-cuts-to-gi/.
Dr. Gangarosa is professor of medicine, division of gastroenterology and hepatology, University of North Carolina at Chapel Hill School of Medicine, and chair of the AGA Government Affairs Committee; Dr. Mehta is associate chief innovation officer at Penn Medicine, Philadelphia, a gastroenterologist, assistant professor of medicine at the Perelman School of Medicine, senior fellow at the Leonard Davis Institute of Health Economics, affiliated faculty member at the Center for Health Incentives and Behavioral Economics, and AGA RUC Adviser. They have no conflicts of interest.