User login
Developing an HCV vaccine faces significant challenges
The development of a prophylactic hepatitis C vaccine faces significant challenges, according to a Justin R. Bailey, MD, of Johns Hopkins University, Baltimore, and his colleagues.
Barriers to developing a prophylactic HCV vaccine include the great diversity of the virus, the limited models that are available for vaccine testing, and the currently incomplete understanding of protective immune responses, according to their review published in Gastroenterology.
Functionally, the inability to culture HCV, until recently, and continuing limitations of HCV culture systems pose challenges to standard production of a live-attenuated or inactivated whole HCV vaccine. In addition, there is the risk of causing HCV infection with live-attenuated vaccines.
On a practical level for all forms of vaccine development, a principal challenge “is the extraordinary genetic diversity of the virus. With 7 known genotypes and more than 80 subtypes, the genetic diversity of HCV exceeds that of human immunodeficiency virus-1,” according to the authors (Gastroenterology 2019;156[2]:418-30).
With regard to vaccine testing, there are also significant difficulties: There is a lack of in vitro systems and immunocompetent small-animal models useful for determining whether vaccination induces protective immunity. Although a use of an HCV-like virus, the rat Hepacivirus, provides a new small-animal model for vaccine testing, this virus has limited sequence analogy to HCV.
The development of immunity to HCV in humans is complex and under broad investigation. However, decades of research have revealed that HCV-specific CD4+ helper T cells, CD8+ cytotoxic T cells, and antibodies all play a role in protection against persistent HCV infection, according to the authors, and vaccine strategies to induce all three adaptive immune responses are in development.
“A prophylactic HCV vaccine is an important part of a successful strategy for global control. Although development is not easy, the quest is a worthy challenge,” the authors concluded.
Dr. Bailey and his colleagues reported that they had no conflicts.
SOURCE: Bailey JR et al. Gastroenterology 2019(2);156:418-30.
FROM GASTROENTEROLOGY
Possible biomarkers found for progression to liver cancer in chronic HCV infection
according to the results of a biochemical analysis of human blood samples performed by PhD student Paywast J. Jalal of the University of Sulaimani (Iraq) and colleagues.
Archived HCV-positive serum samples, including those from 31 patients who had developed HCC, were retrieved from the Trent HCV clinical cohort. They were compared with each other over time and against samples from HCV-infected individuals in the cohort who did not develop HCC. In addition, HCV-negative serum samples were obtained commercially and assessed identically. Circulating liver-expressed lectins, ficolin-2, ficolin-3, and MBL were all examined as potential biomarkers for the development of HCC, the authors wrote in Virology.
Binding of ficolin-3 to reference ligands was greater in chronic HCV infection, while ficolin-2 and MBL were significantly elevated in individuals who develop HCC, compared with HCV-infected individuals without HCC. Ficolin-2 and MBL were found to be elevated at 1 and 3 years prior to HCC diagnosis, respectively, suggesting they could be used as prognostic serum markers for the development of HCC.
“The strong evidence for an association between elevated MBL binding activity and the development of HCC is supportive for a larger prospective study of these biomarkers in HCV-induced liver cancer,” the researchers concluded.
This study was funded by a split-site PhD scholarship between the University of Sulaimani and the University of Nottingham (England). The authors reported they had no conflicts.
SOURCE: Jalal PJ et al. Virology. 2019;530:99-106.
FROM VIROLOGY
Take stronger steps to prevent staph infections and sepsis
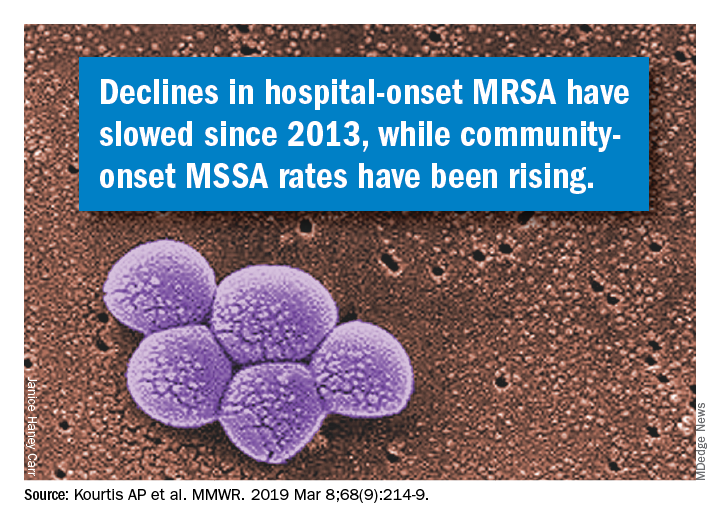
according to data from a Vital Signs report issued by the Centers for Disease Control and Prevention. The data include both methicillin-resistant S. aureus (MRSA) and methicillin-susceptible S. aureus (MSSA).
![]()
Although MRSA infections in health care settings declined by approximately 17% during 2005-2012, rates plateaued during 2012-2017, Anne Schuchat, MD, principal deputy director of the CDC, said in a teleconference March 5 to present the findings. The report emphasizes the potential for serious illness and death with any staph infection and the need for ongoing vigilance on the part of clinicians, she said.
In addition, community-onset MSSA infections increased by 3.9%/year during 2012-2017. Data from previous studies suggest that this increase may be connected to the opioid epidemic, said Dr. Schuchat.
“People who inject drugs are 16% more likely to develop a staph infection” than are those who don’t inject drugs, she said.
Community-onset MRSA declined by 6.9% during 2001-2016, attributed to declines in health care–associated infections, according to Vital Signs author Athena P. Kourtis, MD, of the CDC’s National Center for Emerging and Zoonotic Infectious Diseases, and her colleagues. Rates of hospital-associated MSSA infection remained essentially unchanged (P = .11). The overall unadjusted in-hospital mortality among patients with S. aureus bloodstream infections over the study period was 18%.
The data for the report were collected from electronic health records at more than 400 acute care hospitals, as well as population-based surveillance data from the CDC’s Emerging Infections Program.
Most people carry staph on their skin with no ill effects, but the bacteria become dangerous when they enter the bloodstream, Dr. Schuchat emphasized. “We hope the new data today will refocus the nation’s efforts to protect patients from staph infections,” she said.
Dr. Schuchat advised clinicians and hospital administrators to review their data and step up their safety protocols to prevent staph infections. Precautions include wearing gowns and gloves, following proper hand washing protocols, cautious use of antibiotics, and treating infections rapidly when they occur, she said. Dr. Schuchat noted that lack of adherence to these recommendations may have declined in recent years if clinicians and hospital administrators were wondering whether their protocols have an effect and have value. However, “this is a very serious infection, and we think it is very much worth preventing,” she emphasized.
Other strategies to prevent staph infections in health care settings include reviewing infection data regularly, exploring new approaches to prevent infections, and educating patients about when they may be at increased risk for infection, such as when invasive devices are in place or during surgical procedures. Also, clinicians should be aware of the increased risk for patients who inject drugs, Dr. Schuchat said.
Dr. Schuchat commended the Department of Veterans Affairs Medical Centers (VAMC), which overall reduced their rate of staph infections by 43% during the period from 2005 through 2017 in contrast to the national trend. These findings also appeared in the MMWR on March 5. The VAMC implemented additional interventions and increased their adherence to CDC recommendations during this period, she noted.
The Vital Signs data were published March 5 in the CDC’s Morbidity and Mortality Weekly Report; read the full report here.
The CDC researchers had no financial conflicts to disclose.
SOURCE: Kourtis AP et al. MMWR. 2019 Mar 5; 68:1-6.
FROM THE MORBIDITY AND MORTALITY WEEKLY REPORT
Don’t overlook this step in combatting the rise in STIs
Resources
1. Kuehn BM. A proactive approach needed to combat rising STIs. JAMA. 2019;321:330-332.
2. Screening Recommendations and Considerations Referenced in Treatment Guidelines and Original Sources. Centers for Disease Control and Prevention. https://www.cdc.gov/std/tg2015/screening-recommendations.htm. Updated June 4, 2015. Accessed February 27, 2019.
3. STD Clinical Consultation Network. National STD Curriculum. https://www.std.uw.edu/page/site/clinical-consultation. Accessed February 27, 2019.
4. National STD Curriculum. https://www.std.uw.edu/. Accessed February 27, 2019.
5. Sexually Transmitted Disease Surveillance 2017. Syphilis. Centers for Disease Control and Prevention. https://www.cdc.gov/std/stats17/syphilis.htm. Reviewed July 24, 2018. Accessed February 27, 2019.

Measles cases jumped 30% last week
according to the Centers for Disease Control and Prevention.

Those new cases represent a 30% increase in measles cases for the year, bringing the total to 206 reported to the CDC through Feb. 28. After just 2 months, 2019 has had more cases than all but 3 other years over the last decade, CDC data show.
The 11th state to report a case of measles this year is New Jersey, which joins California, Colorado, Connecticut, Georgia, Illinois (one outbreak), Kentucky, New York (three outbreaks), Oregon, Texas (one outbreak), and Washington (one outbreak), the CDC said.
The outbreak in Washington (4 new cases/70 for the year) had been the largest, but the majority of the new cases over the last 2 weeks have occurred in New York City, specifically Brooklyn, which reported 30 cases last week and 17 of the 32 new U.S. cases the week before.
Most of the 120 cases reported in the borough since the beginning of its outbreak in October of 2018 “have involved members of the Jewish Orthodox community. The initial child with measles was unvaccinated and acquired measles on a visit to Israel, where a large outbreak of the disease is occurring. Since then, there have been additional people from Brooklyn and Queens who were unvaccinated and acquired measles while in Israel. People who did not travel were also infected in Brooklyn or Rockland County,” the CDC said.
according to the Centers for Disease Control and Prevention.
Those new cases represent a 30% increase in measles cases for the year, bringing the total to 206 reported to the CDC through Feb. 28. After just 2 months, 2019 has had more cases than all but 3 other years over the last decade, CDC data show.
The 11th state to report a case of measles this year is New Jersey, which joins California, Colorado, Connecticut, Georgia, Illinois (one outbreak), Kentucky, New York (three outbreaks), Oregon, Texas (one outbreak), and Washington (one outbreak), the CDC said.
The outbreak in Washington (4 new cases/70 for the year) had been the largest, but the majority of the new cases over the last 2 weeks have occurred in New York City, specifically Brooklyn, which reported 30 cases last week and 17 of the 32 new U.S. cases the week before.
Most of the 120 cases reported in the borough since the beginning of its outbreak in October of 2018 “have involved members of the Jewish Orthodox community. The initial child with measles was unvaccinated and acquired measles on a visit to Israel, where a large outbreak of the disease is occurring. Since then, there have been additional people from Brooklyn and Queens who were unvaccinated and acquired measles while in Israel. People who did not travel were also infected in Brooklyn or Rockland County,” the CDC said.
Point-of-care VL testing improves HIV suppression
SEATTLE – Point-of-care viral load testing improves HIV viral suppression and retention in care, according to a randomized trial of 390 subjects in South Africa.

Point-of-care (POC) testing delivers viral load results in about 2-3 hours, as opposed to the month or so patients wait to get results from a laboratory. The nearly instant turnaround gives clinicians the ability to identify patients who aren’t doing well – as indicated by high viral loads despite antiretroviral therapy (ART) – before they walk out the door, so immediate steps can be taken to address adherence or resistance problems.
However, POC viral load testing hasn’t really caught on in the United States, at least not yet, according to study leader Paul Drain, MD, assistant professor of global health at the University of Washington, Seattle.
To see if it would help, the team turned to a large public clinic in the city of Durban, and focused on adults who had been on ART for 6 months following HIV diagnosis. They randomized 195 to standard laboratory testing at study entrance, with a repeat at 6 months, at which point subjects had been on ART for 12 months; 195 others were randomized to POC testing with the Xpert HIV-1 Viral Load machine, from Cepheid, on the same schedule and with same-day counseling for those with high loads.
Treatment was otherwise similar between the groups, with clinic visits every 2 months and other measures as per South African HIV treatment guidelines.
POC testing made a difference. At study month 12,175 participants (89.7%) in the POC arm, but only 148 (75.9%) in the laboratory testing group, had reached the study’s primary endpoint: viral suppression with less than 200 copies/mL plus retention in care, meaning that subjects were still picking up their ART prescriptions.
Overall, POC testing increased viral load suppression by 10.3%, from 83.1% to 93.3% (P = .003) and retention by 7.7% from 84.6% to 92.3% (P = .03).
The investigators would like to evaluate the approach in the United States. Potentially, “POC testing will have a very important role in U.S. health care,” Dr. Drain said at the Conference on Retroviruses and Opportunistic Infections.
It “helps us identify those who are having problems right away, before they leave the clinic, because whether it’s in South Africa or Seattle, as soon as they leave, it’s very hard to get them back. The more you can do POC testing, the better we can intervene and help these people,” he said.
“You don’t need POC testing for everybody; a lot of people do just fine. They take their medications reliably. They don’t need to get their results back right away ... But there are people who have challenges and would benefit from additional adherence counseling” or who might need help overcoming drug resistance. “We want to identify” them quickly; POC testing may be the answer, he said.
The mean age in the study was 33 years, and 60% of the subjects were women. The median CD4 count at baseline was 468 cells/mm3. POC was $22 per test, versus $25 for lab testing.
The National Institutes of Health funded the work. Dr. Drain had no disclosures. Cepheid donated the POC testing machines.
SOURCE: Drain PK et al. CROI 2019, Abstract 53LB.
SEATTLE – Point-of-care viral load testing improves HIV viral suppression and retention in care, according to a randomized trial of 390 subjects in South Africa.
Point-of-care (POC) testing delivers viral load results in about 2-3 hours, as opposed to the month or so patients wait to get results from a laboratory. The nearly instant turnaround gives clinicians the ability to identify patients who aren’t doing well – as indicated by high viral loads despite antiretroviral therapy (ART) – before they walk out the door, so immediate steps can be taken to address adherence or resistance problems.
However, POC viral load testing hasn’t really caught on in the United States, at least not yet, according to study leader Paul Drain, MD, assistant professor of global health at the University of Washington, Seattle.
To see if it would help, the team turned to a large public clinic in the city of Durban, and focused on adults who had been on ART for 6 months following HIV diagnosis. They randomized 195 to standard laboratory testing at study entrance, with a repeat at 6 months, at which point subjects had been on ART for 12 months; 195 others were randomized to POC testing with the Xpert HIV-1 Viral Load machine, from Cepheid, on the same schedule and with same-day counseling for those with high loads.
Treatment was otherwise similar between the groups, with clinic visits every 2 months and other measures as per South African HIV treatment guidelines.
POC testing made a difference. At study month 12,175 participants (89.7%) in the POC arm, but only 148 (75.9%) in the laboratory testing group, had reached the study’s primary endpoint: viral suppression with less than 200 copies/mL plus retention in care, meaning that subjects were still picking up their ART prescriptions.
Overall, POC testing increased viral load suppression by 10.3%, from 83.1% to 93.3% (P = .003) and retention by 7.7% from 84.6% to 92.3% (P = .03).
The investigators would like to evaluate the approach in the United States. Potentially, “POC testing will have a very important role in U.S. health care,” Dr. Drain said at the Conference on Retroviruses and Opportunistic Infections.
It “helps us identify those who are having problems right away, before they leave the clinic, because whether it’s in South Africa or Seattle, as soon as they leave, it’s very hard to get them back. The more you can do POC testing, the better we can intervene and help these people,” he said.
“You don’t need POC testing for everybody; a lot of people do just fine. They take their medications reliably. They don’t need to get their results back right away ... But there are people who have challenges and would benefit from additional adherence counseling” or who might need help overcoming drug resistance. “We want to identify” them quickly; POC testing may be the answer, he said.
The mean age in the study was 33 years, and 60% of the subjects were women. The median CD4 count at baseline was 468 cells/mm3. POC was $22 per test, versus $25 for lab testing.
The National Institutes of Health funded the work. Dr. Drain had no disclosures. Cepheid donated the POC testing machines.
SOURCE: Drain PK et al. CROI 2019, Abstract 53LB.
REPORTING FROM CROI 2019
Aquatic Antagonists: Stingray Injury Update
Incidence and Characteristics
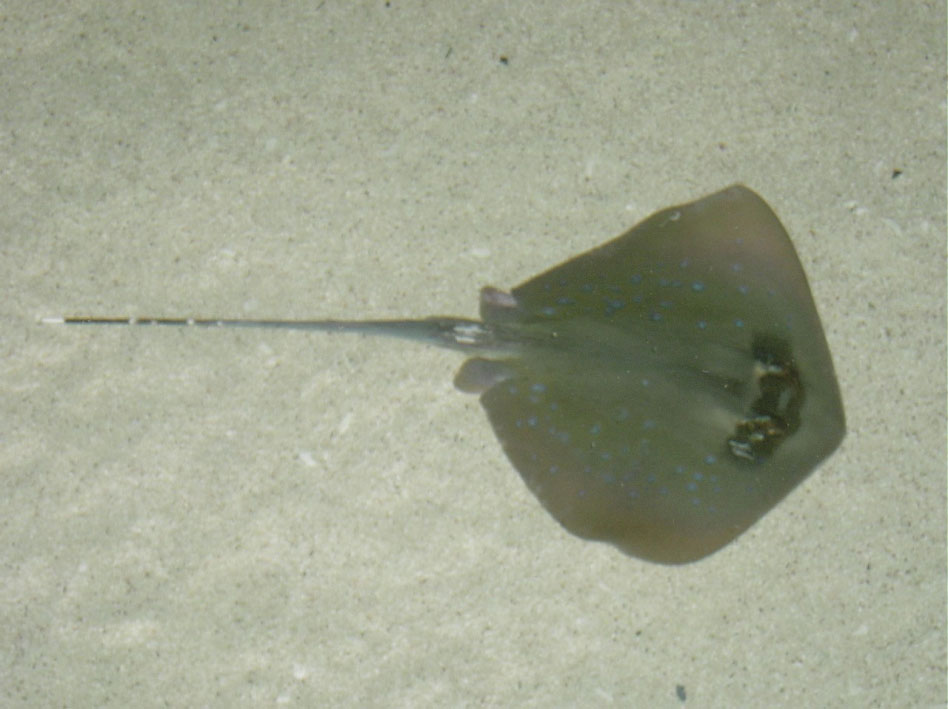

Stingrays are dorsoventrally flattened, diamond-shaped fish with light-colored ventral and dark-colored dorsal surfaces. They have strong pectoral wings that allow them to swim forward and backward and even launch off waves.3 Stingrays range in size from the palm of a human hand to 6.5 ft in width. They possess 1 or more spines (2.5 to >30 cm in length) that are disguised by much longer tails.6,7 They often are encountered accidentally because they bury themselves in the sand or mud of shallow coastal waters or rivers with only their eyes and tails exposed to fool prey and avoid predators.
Injury Clinical Presentation
Stingray injuries typically involve the lower legs, ankles, or feet after stepping on a stingray.8 Fishermen can present with injuries of the upper extremities after handling fish with their hands.9 Other rarer injuries occur when individuals are swimming alongside stingrays or when stingrays catapult off waves into moving boats.10,11 Stingrays impale victims by using their tails to direct a retroserrate barb composed of a strong cartilaginous material called vasodentin. The barb releases venom by breaking through the venom-containing integumentary sheath that encapsulates it. Stingray venom contains phosphodiesterase, serotonin, and 5′-nucleotidase. It causes severe pain, vasoconstriction, ischemia, and poor wound healing, along with systemic effects such as disorientation, syncope, seizures, salivation, nausea, vomiting, abdominal pain, diarrhea, muscle cramps or fasciculations, pruritus, allergic reaction, hypotension, cardiac arrhythmias, dyspnea, paralysis, and possibly death.1,8,12,13
Management
Pain Relief
As with many marine envenomations, immersion in hot but not scalding water can inactivate venom and reduce symptoms.8,9 In one retrospective review, 52 of 75 (69%) patients reporting to a California poison center with stingray injuries had improvement in pain within 1 hour of hot water immersion before any analgesics were instituted.8 In another review, 65 of 74 (88%) patients presenting to a California emergency department within 24 hours of sustaining a stingray injury had complete relief of pain within 30 minutes of hot water immersion. Patients who received analgesics in addition to hot water immersion did not require a second dose.9 In concordance with these studies, we suggest immersing areas affected by stingray injuries in hot water (temperature, 43.3°C to 46.1°C [110°F–115°F]; or as close to this range as tolerated) until pain subsides.8,9,14 Ice packs are an alternative to hot water immersion that may be more readily available to patients. If pain does not resolve following hot water immersion or application of an ice pack, additional analgesics and xylocaine without epinephrine may be helpful.9,15
Infection
One major complication of stingray injuries is infection.8,9 Many bacterial species reside in stingray mucus, the marine environment, or on human skin that may be introduced during a single injury. Marine envenomations can involve organisms such as Vibrio, Aeromonas, and Mycobacterium species, which often are resistant to antibiotic prophylaxis covering common causes of soft-tissue infection such as Staphylococcus and Streptococcus species.8,9,16,17 Additionally, physicians should cover for Clostridium species and ensure patients are up-to-date on vaccinations because severe cases of tetanus following stingray injuries have been reported.18 Lastly, fungal infections including fusariosis have been reported following stingray injuries and should be considered if a patient develops an infection.19
Several authors support the use of prophylactic broad-spectrum antibiotics in all but mild stingray injuries.8,9,20,21 Although no standardized definition exists, mild injuries generally represent patients with superficial lacerations or less, while deeper lacerations and puncture wounds require prophylaxis. Several authors agree on the use of fluoroquinolone antibiotics (eg, ciprofloxacin 500 mg twice daily) for 5 to 7 days following severe stingray injuries.1,9,13,22 Other proposed antibiotic regimens include trimethoprim-sulfamethoxazole (160/800 mg twice daily) or tetracycline (500 mg 4 times daily) for 7 days.13 Failure of ciprofloxacin therapy after 7 days has been reported, with resolution of infection after treatment with an intravenous cephalosporin for 7 days.20 Failure of trimethoprim-sulfamethoxazole therapy also has been reported, with one case requiring levofloxacin for a much longer course.21 Clinical follow-up remains essential after prescribing prophylactic antibiotics, as resistance is common.
Foreign Bodies
Stingray injuries also are often complicated by foreign bodies or retained spines.3,8 Although these complications are less severe than infection, all wounds should be explored for material under local anesthesia. Furthermore, there has been support for thorough debridement of necrotic tissue with referral to a hand specialist for deeper injuries to the hands as well as referral to a foot and ankle specialist for deeper injuries of the lower extremities.23,24 More serious injuries with penetration of vital structures, such as through the chest or abdomen, require immediate exploration in an operating room.1,24
Imaging
Routine imaging of stingray injuries remains controversial. In a case series of 119 patients presenting to a California emergency department with stingray injuries, Clark et al9 found that radiographs were not helpful. This finding likely is due in part to an inability to detect hypodense material such as integumentary or glandular tissue via radiography.3 However, radiographs have been used to identify retained stingray barbs in select cases in which retained barbs are suspected.2,25 Lastly, ultrasonography potentially may offer a better first choice when a barb is not readily apparent; magnetic resonance imaging may be indicated for more involved areas and for further visualization of suspected hypodense material, though at a higher expense.2,9
Biopsy
Biopsies of stingray injuries are rarely performed, and the findings are not well characterized. One case biopsied 2 months after injury showed a large zone of paucicellular necrosis with superficial ulceration and granulomatous inflammation. The stingray venom was most likely responsible for the pattern of necrosis noted in the biopsy.21
Avoidance and Prevention
Patients traveling to areas of the world inhabited by stingrays should receive counseling on how to avoid injury. Prior to entry, individuals can throw stones or use a long stick to clear their walking or swimming areas of venomous fish.26 Polarized sunglasses may help spot stingrays in shallow water. Furthermore, wading through water with a shuffling gait can help individuals avoid stepping directly on a stingray and also warns stingrays that someone is in the area. Individuals who spend more time in coastal waters or river systems inhabited by stingrays may invest in protective stingray gear such as leg guards or specialized wading boots.26 Lastly, fishermen should be advised to avoid handling stingrays with their hands and instead cut their fishing line to release the fish.
- Aurbach PS. Envenomations by aquatic vertebrates. In: Auerbach PS. Wilderness Medicine. 5th ed. St. Louis, MO: Mosby; 2007:1730-1749.
- Robins CR, Ray GC. A Field Guide to Atlantic Coast Fishes. New York, NY: Houghton Mifflin Company; 1986.
- Diaz JH. The evaluation, management, and prevention of stingray injuries in travelers. J Travel Med. 2008;15:102-109.
- Haddad V Jr, Neto DG, de Paula Neto JB, et al. Freshwater stingrays: study of epidemiologic, clinical and therapeutic aspects based on 84 envenomings in humans and some enzymatic activities of the venom. Toxicon. 2004;43:287-294.
- Marinkelle CJ. Accidents by venomous animals in Colombia. Ind Med Surg. 1966;35:988-992.
- Last PR, White WT, Caire JN, et al. Sharks and Rays of Borneo. Collingwood VIC, Australia: CSIRO Publishing; 2010.
- Mebs D. Venomous and Poisonous Animals: A Handbook for Biologists, Toxicologists and Toxinologists, Physicians and Pharmacists. Boca Raton, FL: CRC Press; 2002.
- Clark AT, Clark RF, Cantrell FL. A retrospective review of the presentation and treatment of stingray stings reported to a poison control system. Am J Ther. 2017;24:E177-E180.
- Clark RF, Girard RH, Rao D, et al. Stingray envenomation: a retrospective review of clinical presentation and treatment in 119 cases. J Emerg Med. 2007;33:33-37.
- Mahjoubi L, Joyeux A, Delambre JF, et al. Near-death thoracic trauma caused by a stingray in the Indian Ocean. Semin Thorac Cardiovasc Surg. 2017;29:262-263.
- Parra MW, Constantini EN, Rodas EB. Surviving a transfixing cardiac injury caused by a stingray barb. J Thorac Cardiovasc Surg. 2010;139:E115-E116.
- Dos Santos JC, Grund LZ, Seibert CS, et al. Stingray venom activates IL-33 producing cardiomyocytes, but not mast cell, to promote acute neutrophil-mediated injury. Sci Rep. 2017;7:7912.
- Auerbach PS, Norris RL. Marine envenomation. In: Longo DL, Kasper SL, Jameson JL, et al, eds. Harrison’s Principles of Internal Medicine. 18th ed. New York, NY: McGraw-Hill; 2012:144-148.
- Cook MD, Matteucci MJ, Lall R, et al. Stingray envenomation. J Emerg Med. 2006;30:345-347.
- Bowers RC, Mustain MV. Disorders due to physical & environmental agents. In: Humphries RL, Stone C, eds. CURRENT Diagnosis & Treatment Emergency Medicine. 7th ed. New York, NY: McGraw-Hill; 2011:835-861.
- Domingos MO, Franzolin MR, dos Anjos MT, et al. The influence of environmental bacteria in freshwater stingray wound-healing. Toxicon. 2011;58:147-153.
- Auerbach PS, Yajko DM, Nassos PS, et al. Bacteriology of the marine environment: implications for clinical therapy. Ann Emerg Med. 1987;16:643-649.
- Torrez PP, Quiroga MM, Said R, et al. Tetanus after envenomations caused by freshwater stingrays. Toxicon. 2015;97:32-35.
- Hiemenz JW, Kennedy B, Kwon-Chung KJ. Invasive fusariosis associated with an injury by a stingray barb. J Med Vet Mycol. 1990;28:209-213.
- da Silva NJ Jr, Ferreira KR, Pinto RN, et al. A severe accident caused by an ocellate river stingray (Potamotrygon motoro) in central Brazil: how well do we really understand stingray venom chemistry, envenomation, and therapeutics? Toxins (Basel). 2015;7:2272-2288.
- Tartar D, Limova M, North J. Clinical and histopathologic findings in cutaneous sting ray wounds: a case report. Dermatol Online J. 2013;19:19261.
- Jarvis HC, Matheny LM, Clanton TO. Stingray injury to the webspace of the foot. Orthopedics. 2012;35:E762-E765.
- Trickett R, Whitaker IS, Boyce DE. Sting-ray injuries to the hand: case report, literature review and a suggested algorithm for management. J Plast Reconstruct Aesthet Surg. 2009;62:E270-E273.
- Fernandez I, Valladolid G, Varon J, et al. Encounters with venomous sea-life. J Emerg Med. 2011;40:103-112.
- O’Malley GF, O’Malley RN, Pham O, et al. Retained stingray barb and the importance of imaging. Wilderness Environ Med. 2015;26:375-379.
- How to protect yourself from stingrays. Howcast website. https://www.howcast.com/videos/228034-how-to-protect-yourself-from-stingrays/. Accessed July 12, 2018.
Incidence and Characteristics
Stingrays are dorsoventrally flattened, diamond-shaped fish with light-colored ventral and dark-colored dorsal surfaces. They have strong pectoral wings that allow them to swim forward and backward and even launch off waves.3 Stingrays range in size from the palm of a human hand to 6.5 ft in width. They possess 1 or more spines (2.5 to >30 cm in length) that are disguised by much longer tails.6,7 They often are encountered accidentally because they bury themselves in the sand or mud of shallow coastal waters or rivers with only their eyes and tails exposed to fool prey and avoid predators.
Injury Clinical Presentation
Stingray injuries typically involve the lower legs, ankles, or feet after stepping on a stingray.8 Fishermen can present with injuries of the upper extremities after handling fish with their hands.9 Other rarer injuries occur when individuals are swimming alongside stingrays or when stingrays catapult off waves into moving boats.10,11 Stingrays impale victims by using their tails to direct a retroserrate barb composed of a strong cartilaginous material called vasodentin. The barb releases venom by breaking through the venom-containing integumentary sheath that encapsulates it. Stingray venom contains phosphodiesterase, serotonin, and 5′-nucleotidase. It causes severe pain, vasoconstriction, ischemia, and poor wound healing, along with systemic effects such as disorientation, syncope, seizures, salivation, nausea, vomiting, abdominal pain, diarrhea, muscle cramps or fasciculations, pruritus, allergic reaction, hypotension, cardiac arrhythmias, dyspnea, paralysis, and possibly death.1,8,12,13
Management
Pain Relief
As with many marine envenomations, immersion in hot but not scalding water can inactivate venom and reduce symptoms.8,9 In one retrospective review, 52 of 75 (69%) patients reporting to a California poison center with stingray injuries had improvement in pain within 1 hour of hot water immersion before any analgesics were instituted.8 In another review, 65 of 74 (88%) patients presenting to a California emergency department within 24 hours of sustaining a stingray injury had complete relief of pain within 30 minutes of hot water immersion. Patients who received analgesics in addition to hot water immersion did not require a second dose.9 In concordance with these studies, we suggest immersing areas affected by stingray injuries in hot water (temperature, 43.3°C to 46.1°C [110°F–115°F]; or as close to this range as tolerated) until pain subsides.8,9,14 Ice packs are an alternative to hot water immersion that may be more readily available to patients. If pain does not resolve following hot water immersion or application of an ice pack, additional analgesics and xylocaine without epinephrine may be helpful.9,15
Infection
One major complication of stingray injuries is infection.8,9 Many bacterial species reside in stingray mucus, the marine environment, or on human skin that may be introduced during a single injury. Marine envenomations can involve organisms such as Vibrio, Aeromonas, and Mycobacterium species, which often are resistant to antibiotic prophylaxis covering common causes of soft-tissue infection such as Staphylococcus and Streptococcus species.8,9,16,17 Additionally, physicians should cover for Clostridium species and ensure patients are up-to-date on vaccinations because severe cases of tetanus following stingray injuries have been reported.18 Lastly, fungal infections including fusariosis have been reported following stingray injuries and should be considered if a patient develops an infection.19
Several authors support the use of prophylactic broad-spectrum antibiotics in all but mild stingray injuries.8,9,20,21 Although no standardized definition exists, mild injuries generally represent patients with superficial lacerations or less, while deeper lacerations and puncture wounds require prophylaxis. Several authors agree on the use of fluoroquinolone antibiotics (eg, ciprofloxacin 500 mg twice daily) for 5 to 7 days following severe stingray injuries.1,9,13,22 Other proposed antibiotic regimens include trimethoprim-sulfamethoxazole (160/800 mg twice daily) or tetracycline (500 mg 4 times daily) for 7 days.13 Failure of ciprofloxacin therapy after 7 days has been reported, with resolution of infection after treatment with an intravenous cephalosporin for 7 days.20 Failure of trimethoprim-sulfamethoxazole therapy also has been reported, with one case requiring levofloxacin for a much longer course.21 Clinical follow-up remains essential after prescribing prophylactic antibiotics, as resistance is common.
Foreign Bodies
Stingray injuries also are often complicated by foreign bodies or retained spines.3,8 Although these complications are less severe than infection, all wounds should be explored for material under local anesthesia. Furthermore, there has been support for thorough debridement of necrotic tissue with referral to a hand specialist for deeper injuries to the hands as well as referral to a foot and ankle specialist for deeper injuries of the lower extremities.23,24 More serious injuries with penetration of vital structures, such as through the chest or abdomen, require immediate exploration in an operating room.1,24
Imaging
Routine imaging of stingray injuries remains controversial. In a case series of 119 patients presenting to a California emergency department with stingray injuries, Clark et al9 found that radiographs were not helpful. This finding likely is due in part to an inability to detect hypodense material such as integumentary or glandular tissue via radiography.3 However, radiographs have been used to identify retained stingray barbs in select cases in which retained barbs are suspected.2,25 Lastly, ultrasonography potentially may offer a better first choice when a barb is not readily apparent; magnetic resonance imaging may be indicated for more involved areas and for further visualization of suspected hypodense material, though at a higher expense.2,9
Biopsy
Biopsies of stingray injuries are rarely performed, and the findings are not well characterized. One case biopsied 2 months after injury showed a large zone of paucicellular necrosis with superficial ulceration and granulomatous inflammation. The stingray venom was most likely responsible for the pattern of necrosis noted in the biopsy.21
Avoidance and Prevention
Patients traveling to areas of the world inhabited by stingrays should receive counseling on how to avoid injury. Prior to entry, individuals can throw stones or use a long stick to clear their walking or swimming areas of venomous fish.26 Polarized sunglasses may help spot stingrays in shallow water. Furthermore, wading through water with a shuffling gait can help individuals avoid stepping directly on a stingray and also warns stingrays that someone is in the area. Individuals who spend more time in coastal waters or river systems inhabited by stingrays may invest in protective stingray gear such as leg guards or specialized wading boots.26 Lastly, fishermen should be advised to avoid handling stingrays with their hands and instead cut their fishing line to release the fish.
- Aurbach PS. Envenomations by aquatic vertebrates. In: Auerbach PS. Wilderness Medicine. 5th ed. St. Louis, MO: Mosby; 2007:1730-1749.
- Robins CR, Ray GC. A Field Guide to Atlantic Coast Fishes. New York, NY: Houghton Mifflin Company; 1986.
- Diaz JH. The evaluation, management, and prevention of stingray injuries in travelers. J Travel Med. 2008;15:102-109.
- Haddad V Jr, Neto DG, de Paula Neto JB, et al. Freshwater stingrays: study of epidemiologic, clinical and therapeutic aspects based on 84 envenomings in humans and some enzymatic activities of the venom. Toxicon. 2004;43:287-294.
- Marinkelle CJ. Accidents by venomous animals in Colombia. Ind Med Surg. 1966;35:988-992.
- Last PR, White WT, Caire JN, et al. Sharks and Rays of Borneo. Collingwood VIC, Australia: CSIRO Publishing; 2010.
- Mebs D. Venomous and Poisonous Animals: A Handbook for Biologists, Toxicologists and Toxinologists, Physicians and Pharmacists. Boca Raton, FL: CRC Press; 2002.
- Clark AT, Clark RF, Cantrell FL. A retrospective review of the presentation and treatment of stingray stings reported to a poison control system. Am J Ther. 2017;24:E177-E180.
- Clark RF, Girard RH, Rao D, et al. Stingray envenomation: a retrospective review of clinical presentation and treatment in 119 cases. J Emerg Med. 2007;33:33-37.
- Mahjoubi L, Joyeux A, Delambre JF, et al. Near-death thoracic trauma caused by a stingray in the Indian Ocean. Semin Thorac Cardiovasc Surg. 2017;29:262-263.
- Parra MW, Constantini EN, Rodas EB. Surviving a transfixing cardiac injury caused by a stingray barb. J Thorac Cardiovasc Surg. 2010;139:E115-E116.
- Dos Santos JC, Grund LZ, Seibert CS, et al. Stingray venom activates IL-33 producing cardiomyocytes, but not mast cell, to promote acute neutrophil-mediated injury. Sci Rep. 2017;7:7912.
- Auerbach PS, Norris RL. Marine envenomation. In: Longo DL, Kasper SL, Jameson JL, et al, eds. Harrison’s Principles of Internal Medicine. 18th ed. New York, NY: McGraw-Hill; 2012:144-148.
- Cook MD, Matteucci MJ, Lall R, et al. Stingray envenomation. J Emerg Med. 2006;30:345-347.
- Bowers RC, Mustain MV. Disorders due to physical & environmental agents. In: Humphries RL, Stone C, eds. CURRENT Diagnosis & Treatment Emergency Medicine. 7th ed. New York, NY: McGraw-Hill; 2011:835-861.
- Domingos MO, Franzolin MR, dos Anjos MT, et al. The influence of environmental bacteria in freshwater stingray wound-healing. Toxicon. 2011;58:147-153.
- Auerbach PS, Yajko DM, Nassos PS, et al. Bacteriology of the marine environment: implications for clinical therapy. Ann Emerg Med. 1987;16:643-649.
- Torrez PP, Quiroga MM, Said R, et al. Tetanus after envenomations caused by freshwater stingrays. Toxicon. 2015;97:32-35.
- Hiemenz JW, Kennedy B, Kwon-Chung KJ. Invasive fusariosis associated with an injury by a stingray barb. J Med Vet Mycol. 1990;28:209-213.
- da Silva NJ Jr, Ferreira KR, Pinto RN, et al. A severe accident caused by an ocellate river stingray (Potamotrygon motoro) in central Brazil: how well do we really understand stingray venom chemistry, envenomation, and therapeutics? Toxins (Basel). 2015;7:2272-2288.
- Tartar D, Limova M, North J. Clinical and histopathologic findings in cutaneous sting ray wounds: a case report. Dermatol Online J. 2013;19:19261.
- Jarvis HC, Matheny LM, Clanton TO. Stingray injury to the webspace of the foot. Orthopedics. 2012;35:E762-E765.
- Trickett R, Whitaker IS, Boyce DE. Sting-ray injuries to the hand: case report, literature review and a suggested algorithm for management. J Plast Reconstruct Aesthet Surg. 2009;62:E270-E273.
- Fernandez I, Valladolid G, Varon J, et al. Encounters with venomous sea-life. J Emerg Med. 2011;40:103-112.
- O’Malley GF, O’Malley RN, Pham O, et al. Retained stingray barb and the importance of imaging. Wilderness Environ Med. 2015;26:375-379.
- How to protect yourself from stingrays. Howcast website. https://www.howcast.com/videos/228034-how-to-protect-yourself-from-stingrays/. Accessed July 12, 2018.
Practice Points
- Acute pain associated with stingray injuries can be treated with hot water immersion.
- Stingray injuries are prone to secondary infection and poor wound healing.
Flu season shows signs of peaking
The 2018-2019 flu season may have peaked as the major nationwide measure of influenza activity held steady for the week ending Feb. 23, according to the Centers for Disease Control and Prevention. The proportion of outpatient visits for influenza-like illness (ILI) was 5.0% for the most recent reporting week, the CDC’s influenza division said in its March 1 report. The previous week’s outpatient visit rate, originally reported as 5.1%, was revised this week to 5.0% as well, suggesting that flu activity is no longer increasing.
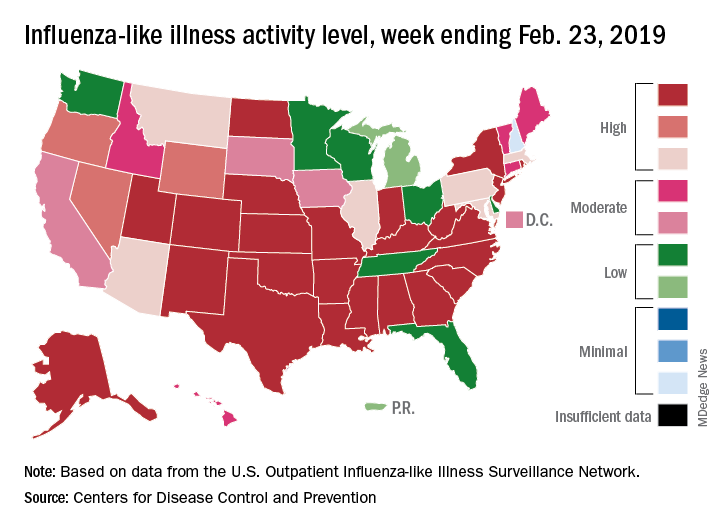
Activity at the state level was more mixed. The number of states at level 10 on the CDC’s 1-10 scale of ILI activity stayed at 24 as Indiana and North Dakota replaced Tennessee and Wyoming, but the number of states in the high range (8-10) of the activity scale increased from 30 to 33, CDC data show.
The signs of plateauing ILI activity did not, however, extend to flu-related deaths, with 15 reported among children – the highest weekly number for the 2018-2019 season, although 11 actually occurred in previous weeks – during the week ending Feb. 23 and 289 deaths among all ages for the week ending Feb. 16, which is already more than the 268 listed the week before despite less complete reporting (82% vs. 97%), the CDC reported. Total flu-related deaths in children are now up to 56, compared with 138 at the corresponding point in the 2017-2018 season.
The 2018-2019 flu season may have peaked as the major nationwide measure of influenza activity held steady for the week ending Feb. 23, according to the Centers for Disease Control and Prevention. The proportion of outpatient visits for influenza-like illness (ILI) was 5.0% for the most recent reporting week, the CDC’s influenza division said in its March 1 report. The previous week’s outpatient visit rate, originally reported as 5.1%, was revised this week to 5.0% as well, suggesting that flu activity is no longer increasing.
Activity at the state level was more mixed. The number of states at level 10 on the CDC’s 1-10 scale of ILI activity stayed at 24 as Indiana and North Dakota replaced Tennessee and Wyoming, but the number of states in the high range (8-10) of the activity scale increased from 30 to 33, CDC data show.
The signs of plateauing ILI activity did not, however, extend to flu-related deaths, with 15 reported among children – the highest weekly number for the 2018-2019 season, although 11 actually occurred in previous weeks – during the week ending Feb. 23 and 289 deaths among all ages for the week ending Feb. 16, which is already more than the 268 listed the week before despite less complete reporting (82% vs. 97%), the CDC reported. Total flu-related deaths in children are now up to 56, compared with 138 at the corresponding point in the 2017-2018 season.
Human papillomavirus in 2019: An update on cervical cancer prevention and screening guidelines
About 12% of women worldwide are infected with human papillomavirus (HPV).1 Persistent HPV infection with high-risk strains such as HPV 6, 11, 16, and 18 cause nearly all cases of cervical cancer and some anal, vaginal, penile, and oropharyngeal cancers.2 An estimated 13,000 cases of invasive cervical cancer will be diagnosed this year in the United States alone.3
Up to 70% of HPV-related cervical cancer cases can be prevented with vaccination. A number of changes have been made to the vaccination schedule within the past few years—patients younger than 15 need only 2 rather than 3 doses, and the vaccine itself can be used in adults up to age 45.
Vaccination and routine cervical cancer screening are both necessary to prevent this disease3 along with effective family and patient counseling. Here, we discuss the most up-to-date HPV vaccination recommendations, current cervical cancer screening guidelines, counseling techniques that increase vaccination acceptance rates, and follow-up protocols for abnormal cervical cancer screening results.
TYPES OF HPV VACCINES
HPV immunization can prevent up to 70% of cases of cervical cancer due to HPV as well as 90% of genital warts.4 The US Food and Drug Administration (FDA) has approved 3 HPV vaccines:
- Gardasil 9 targets HPV types 6, 11, 16, and 18 along with 31, 33, 45, 52, 58—these cause 90% of cervical cancer cases and most cases of genital warts5—making it the most effective vaccine available; Gardasil 9 is the only HPV vaccine currently available in the United States
- The bivalent vaccine (Cervarix) targeted HPV 16 and 18 only, and was discontinued in the United States in 2016
- The quadrivalent HPV vaccine (Gardasil) targeted HPV 16 and 18 as well as 6 and 11, which cause most cases of genital warts; the last available doses in the United States expired in May 2017; it has been replaced by Gardasil 9.
The incidence of cervical cancer in the United States dropped 29% among 15- to 24-year-olds from 2003–2006 when HPV vaccination first started to 2011–2014.6
VACCINE DOSING RECOMMENDATIONS FOR PRIMARY PREVENTION

The Advisory Committee on Immunization Practices (ACIP) revised its HPV vaccine schedule in 2016, when it decreased the necessary doses from 3 to 2 for patients under age 15 and addressed the needs of special patient populations.7 In late 2018, the FDA approved the use of the vaccine in men and women up to age 45. However, no change in guidelines have yet been made (Table 1).
In females, the ACIP recommends starting HPV vaccination at age 11 or 12, but it can be given as early as age 9. A 2-dose schedule is recommended for the 9-valent vaccine before the patient’s 15th birthday (the second dose 6 to 12 months after the first).7 For females who initiate HPV vaccination between ages 15 and 45, a 3-dose schedule is necessary (at 0, 1 to 2, and 6 months).7,8
The change to a 2-dose schedule was prompted by an evaluation of girls ages 9 to 13 randomized to receive either a 2- or 3-dose schedule. Antibody responses with a 2-dose schedule were not inferior to those of young women (ages 16 to 26) who received all 3 doses.9 The geometric mean titer ratios remained noninferior throughout the study period of 36 months.
However, a loss of noninferiority was noted for HPV-18 by 24 months and for HPV-6 by 36 months.9 Thus, further studies are needed to understand the duration of protection with a 2-dose schedule. Nevertheless, decreasing the number of doses makes it a more convenient and cost-effective option for many families.
The recommendations are the same for males except for one notable difference: in males ages 21 to 26, vaccination is not routinely recommended by the ACIP, but rather it is considered a “permissive use” recommendation: ie, the vaccine should be offered and final decisions on administration be made after individualized discussion with the patient.10 Permissive-use status also means the vaccine may not be covered by health insurance. Even though the vaccine is now available to men and women until age 45, many insurance plans do not cover it after age 26.
Children of either sex with a history of sexual abuse should receive their first vaccine dose beginning at age 9.7
Immunocompromised patients should follow the 3-dose schedule regardless of their sex or the age when vaccination was initiated.10
For transgender patients and for men not previously vaccinated who have sex with men, the 3-dose schedule vaccine should be given by the age of 26 (this is a routine recommendation, not a permissive one).8
CHALLENGES OF VACCINATION
Effective patient and family counseling is important. Even though the first HPV vaccine was approved in 2006, only 34.9% of US adolescents were fully vaccinated by 2015. This was in part because providers did not recommend it, were unfamiliar with it, or had concerns about its safety,11,12 and in part because some parents refused it.
The physician must address any myths regarding HPV vaccination and ensure that parents and patients understand that HPV vaccine is safe and effective. Studies have shown that with high-quality recommendations (ie, the care provider strongly endorses the HPV vaccine, encourages same-day vaccination, and discusses cancer prevention), patients are 9 times more likely to start the HPV vaccination schedule and 3 times more likely to follow through with subsequent doses.13
Providing good family and patient education does not necessarily require spending more counseling time. A recent study showed that spending less time discussing the HPV vaccine can lead to better vaccine coverage.14 The study compared parent HPV vaccine counseling techniques and found that simply informing patients and their families that the HPV vaccine was due was associated with a higher vaccine acceptance rate than inviting conversations about it.14 When providers announced that the vaccine was due, assuming the parents were ready to vaccinate, there was a 5.4% increase in HPV vaccination coverage.14
 vaccine")
Conversely, physicians who engaged parents in open-ended discussions about the HPV vaccine did not improve HPV vaccination coverage.14 The authors suggested that providers approach HPV vaccination as if they were counseling patients and families about the need to avoid second-hand smoke or the need to use car seats. If parents or patients resist the presumptive announcement approach, expanded counseling and shared decision-making are appropriate. This includes addressing misconceptions that parents and patients may have about the HPV vaccine. The American Cancer Society lists 8 facts to reference (Table 2).15
SECONDARY PREVENTION: CERVICAL CANCER SCREENING
Since the introduction of the Papanicolaou (Pap) test, US cervical cancer incidence rates have decreased by more than 60%.16 Because almost all cervical cancer is preventable with proper screening, all women ages 21 to 65 should be screened.

Currently, there are 3 options available for cervical cancer screening: the Pap-only test, the Pap-HPV cotest, and the high-risk HPV-only test (Table 3). The latter 2 options detect high-risk HPV genotypes.
Several organizations have screening algorithms that recommend when to use these tests, but the 3 that shape today’s standard of care in cervical cancer screening come from the American College of Obstetricians and Gynecologists (ACOG), the American Society for Colposcopy and Cervical Pathology (ASCCP), and US Preventive Services Task Force (USPSTF).17–19
Pap-only testing is performed every 3 years to screen for cervical neoplasia that might indicate premalignancy.
Pap-HPV cotesting is performed every 5 years in women older than 30 with past normal screening. Until 2018, all 3 organizations recommended cotesting as the preferred screening algorithm for women ages 30 to 65.17–19 Patients with a history of abnormal test results require more frequent testing as recommended by the ASCCP.18
The high-risk HPV-only test utilizes real-time polymerase chain reaction to detect HPV 16, HPV 18, and 12 other HPV genotypes. Only 2 tests are approved by the FDA as stand-alone cervical cancer screening tests—the Roche Cobas HPV test approved in 2014 and the Becton Dickinson Onclarity HPV assay approved in 2018. Other HPV tests that are used in a cotesting strategy should not be used for high-risk HPV-only testing because their performance characteristics may differ.
In 2015, the Addressing the Need for Advanced HPV Diagnostics (ATHENA) study showed that 1 round of high-risk HPV-only screening for women older than 25 was more sensitive than Pap-only or cotesting for stage 3 cervical intraepithelial neoplasia or more severe disease (after 3 years of follow-up).20 Current guidelines from ASCCP18 and ACOG17 state that the high-risk HPV test can be repeated every 3 years (when used to screen by itself) if the woman is older than 25 and has had a normal test result.
 genotypes")
If the HPV test result is positive for high-risk HPV 16 or 18 genotypes, then immediate colposcopy is indicated; women who test positive for one of the other 12 high-risk subtypes will need to undergo a Pap test to determine the appropriate follow-up (Figure 1).18,21
In 2018, the USPSTF updated its recommendations, noting that for women age 30 to 65, Pap-only testing every 3 years, cotesting every 5 years, or high-risk HPV-only testing every 5 years are all appropriate screening strategies, with the Pap-only or high-risk HPV-only screenings being preferred.19 This is in contrast to ACOG and ASCCP recommendations for cotesting every 5 years, with alternative options of Pap-only or HPV-only testing being done every 3 years.17,18
Is there a best screening protocol?
The USPSTF reviewed large randomized and observational studies to summarize the effectiveness of the 3 screening strategies and commissioned a decision analysis model to compare the risks, benefits, and costs of the 3 screening algorithms. The guideline statement notes both cotesting and high-risk HPV testing offer similar cancer detection rates: each prevents 1 additional cancer per 1,000 women screened as opposed to Pap-only testing.19
Also, tests that incorporate high-risk HPV screening may offer better detection of cervical adenocarcinoma (which has a worse prognosis than the more common squamous cell carcinoma type). However, both HPV-based screening strategies are more likely to require additional colposcopies for follow-up than Pap-only screening (1,630 colposcopies required for each cancer prevented with high-risk HPV alone, 1,635 with cotesting). Colposcopy is a simple office procedure that causes minimal discomfort to the patient.
The USPSTF guideline also differs in the recommended frequency of high-risk HPV-only testing; a high-risk HPV result should be repeated every 5 years if normal (as opposed to every 3 years as recommended by ACOG and ASCCP).19 The 5-year recommendation is based on analysis modeling, which suggests that performing high-risk HPV-only testing more frequently is unlikely to improve detection rates but will increase the number of screening tests and colposcopies.19
No trial has directly compared cotesting with high-risk HPV testing for more than 2 rounds of screening. The updated USPSTF recommendations are based on modeling estimates and expert opinion, which assesses cost and benefit vs harm in the long term. Also, no high-risk HPV test is currently FDA-approved for every-5-year screening when used by itself.
All 3 cervical cancer screening methods provide highly effective cancer prevention, so it is important for providers to choose the strategy that best fits their practice. The most critical aspect of screening is getting all women screened, no matter which method is used.
It is critical to remember that the screening intervals are intended for patients without symptoms. Those who have new concerns such as bleeding should have a diagnostic Pap done to evaluate their symptoms.
Follow-up of abnormal results
Regardless of the pathway chosen, appropriate follow-up of any abnormal test result is critical to the early detection of cancer. Established follow-up guidelines exist,22,23 but accessing this information can be difficult for the busy clinician. The ASCCP has a mobile phone application that outlines the action steps corresponding to the patient’s age and results of any combination of Pap or HPV testing. The app also includes the best screening algorithms for a particular patient.24
All guidelines agree that cervical cancer screening should start at age 21, regardless of HPV vaccination status or age of sexual initiation.17,18,25 Screening can be discontinued at age 65 for women with normal screening results in the prior decade (3 consecutive negative Pap results or 2 consecutive negative cotest results).23
For women who have had a total hysterectomy and no history of cervical neoplasia, screening should be stopped immediately after the procedure. However, several high-risk groups of women will need continued screening past the age of 65, or after a hysterectomy.
For a woman with a history of stage 2 cervical intraepithelial neoplasia or higher grade lesions, routine screening is continued for an additional 20 years, even if she is over age 65. Pap-only testing every 3 years is acceptable, because the role of HPV testing is unclear after hysterectomy.23 Prior guidelines suggested annual screening in these patients, so the change to every 3 years is notable. Many gynecologic oncologists will recommend that women with a history of cervical cancer continue annual screening indefinitely.
Within the first 2 to 3 years after treatment for high-grade dysplastic changes, annual follow-up is done by the gynecologic oncology team. Providers who offer follow-up during this time frame should keep in communication with the oncology team to ensure appropriate, individualized care. These recommendations are based on expert opinion, so variations in clinical practice may be seen.
Women infected with the human immunodeficiency virus can have Pap-only testing every 3 years, after a series of 3 normal annual Pap results.26 But screening does not stop at age 65.23,26 For patients who are immunosuppressed or have a history of diethylstilbestrol exposure, screening should be done annually indefinitely.23
- Bruni L, Diaz M, Castellsagué X, Ferrer E, Bosch FX, de Sanjosé S. Cervical human papillomavirus prevalence in 5 continents: meta-analysis of 1 million women with normal cytological findings. J Infect Dis 2010; 202(12):1789–1799. doi:10.1086/657321
- de Martel C, Ferlay J, Franceschi S, et al. Global burden of cancer attributable to infections in 2008: a review and synthetic analysis. Lancet Oncol 2012; 13(6):607–615. doi:10.1016/S1470-2045(12)70137-7
- American Cancer Society. Key statistics for cervical cancer. www.cancer.org/cancer/cervical-cancer/about/key-statistics.html. Accessed February 14, 2019.
- Thaxton L, Waxman AG. Cervical cancer prevention: immunization and screening 2015. Med Clin North Am 2015; 99(3):469–477. doi:10.1016/j.mcna.2015.01.003
- McNamara M, Batur P, Walsh JME, Johnson KM. HPV update: vaccination, screening, and associated disease. J Gen Intern Med 2016; 31(11):1360–1366. doi:10.1007/s11606-016-3725-z
- Guo F, Cofie LE, Berenson AB. Cervical cancer incidence in young US females after human papillomavirus vaccine introduction. Am J Prev Med 2018; 55(2):197–204. doi:10.1016/j.amepre.2018.03.013
- Meites E, Kempe A, Markowitz LE. Use of a 2-dose schedule for human papillomavirus vaccination—updated recommendations of the Advisory Committee on Immunization Practices. MMWR Morb Mortal Wkly Rep 2016; 65(49):1405–1408. doi:10.15585/mmwr.mm6549a5
- Centers for Disease Control and Prevention (CDC). Supplemental information and guidance for vaccination providers regarding use of 9-valent HPV vaccine Information for persons who started an HPV vaccination series with quadrivalent or bivalent HPV vaccine. www.cdc.gov/hpv/downloads/9vhpv-guidance.pdf. Accessed February 14, 2019.
- Dobson SR, McNeil S, Dionne M, et al. Immunogenicity of 2 doses of HPV vaccine in younger adolescents vs 3 doses in young women: a randomized clinical trial. JAMA 2013; 309(17):1793–1802. doi:10.1001/jama.2013.1625
- Markowitz LE, Dunne EF, Saraiya M, et al; Centers for Disease Control and Prevention (CDC). Human papillomavirus vaccination: recommendations of the Advisory Committee on Immunization Practices (ACIP). MMWR Recomm Rep 2014; 63(RR-05):1–30. pmid:25167164
- Thompson EL, Rosen BL, Vamos CA, Kadono M, Daley EM. Human papillomavirus vaccination: what are the reasons for nonvaccination among US adolescents? J Adolesc Health 2017; 61(3):288–293. doi:10.1016/j.jadohealth.2017.05.015
- Reagan-Steiner S, Yankey D, Jeyarajah J, et al. National, regional, state, and selected local area vaccination coverage among adolescents aged 13-17 years—United States, 2015. MMWR Morb Mortal Wkly Rep 2016; 65(33):850–858. doi:10.15585/mmwr.mm6533a4
- Gilkey MB, Calo WA, Moss JL, Shah PD, Marciniak MW, Brewer NT. Provider communication and HPV vaccination: The impact of recommendation quality. Vaccine 2016; 34(9):1187–1192. doi:10.1016/j.vaccine.2016.01.023
- Brewer NT, Hall ME, Malo TL, Gilkey MB, Quinn B, Lathren C. Announcements versus conversations to improve HPV vaccination coverage: a randomized trial. Pediatrics 2017; 139(1):e20161764. doi:10.1542/peds.2016-1764
- American Cancer Society. HPV vaccine facts. www.cancer.org/cancer/cancer-causes/infectious-agents/hpv/hpv-vaccine-facts-and-fears.html. Accessed February 14, 2019.
- National Cancer Institute; Chasan R, Manrow R. Cervical cancer. https://report.nih.gov/nihfactsheets/viewfactsheet.aspx?csid=76. Accessed February 14, 2019.
- The American College of Obstetricians and Gynecologists (ACOG). Frequently asked questions. Cervical cancer screening. www.acog.org/Patients/FAQs/Cervical-Cancer-Screening. Accessed February 14, 2019.
- Saslow D, Solomon D, Lawson HW, et al; American Cancer Society; American Society for Colposcopy and Cervical Pathology; American Society for Clinical Pathology. American Cancer Society, American Society for Colposcopy and Cervical Pathology, and American Society for Clinical Pathology screening guidelines for the prevention and early detection of cervical cancer. Am J Clin Pathol 2012; 137(4):516–542. doi:10.1309/AJCPTGD94EVRSJCG
- US Preventive Services Task Force; Curry SJ, Krist AH, Owens DK, et al. Screening for cervical cancer: US Preventive Services Task Force Recommendation Statement. JAMA 2018; 320(7):674–686. doi:10.1001/jama.2018.10897
- Wright TC, Stoler MH, Behrens CM, Sharma A, Zhang G, Wright TL. Primary cervical cancer screening with human papillomavirus: end of study results from the ATHENA study using HPV as the first-line screening test. Gynecol Oncol 2015; 136(2):189–197. doi:10.1016/j.ygyno.2014.11.076
- Huh WK, Ault KA, Chelmow D, et al. Use of primary high-risk human papillomavirus testing for cervical cancer screening: interim clinical guidance. Obstet Gynecol 2015; 125(2):330–337. doi:10.1097/AOG.0000000000000669
- Massad LS, Einstein MH, Huh WK, et al; 2012 ASCCP Consensus Guidelines Conference. 2012 updated consensus guidelines for the management of abnormal cervical cancer screening tests and cancer precursors. Obstet Gynecol 2013; 121(4):829–846. doi:10.1097/AOG.0b013e3182883a34
- Committee on Practice Bulletins—Gynecology. Practice Bulletin No. 168: cervical cancer screening and prevention. Obstet Gynecol 2016; 128(4):e111–e130. doi:10.1097/AOG.0000000000001708
- ASCCP. Mobile app. http://www.asccp.org/store-detail2/asccp-mobile-app. Accessed February 14, 2019.
- USPSTF. Draft recommendation: cervical cancer: screening. www.uspreventiveservicestaskforce.org/Page/Document/draft-recommendation-statement/cervical-cancer-screening2. Accessed February 14, 2019.
- Masur H, Brooks JT, Benson CA, Holmes KK, Pau AK, Kaplan JE; National Institutes of Health; Centers for Disease Control and Prevention; HIV Medicine Association of the Infectious Diseases Society of America. Prevention and treatment of opportunistic infections in HIV-infected adults and adolescents: Updated guidelines from the Centers for Disease Control and Prevention, National Institutes of Health, and HIV Medicine Association of the Infectious Diseases Society of America. Clin Infect Dis 2014; 58(9):1308–1311. doi:10.1093/cid/ciu094
About 12% of women worldwide are infected with human papillomavirus (HPV).1 Persistent HPV infection with high-risk strains such as HPV 6, 11, 16, and 18 cause nearly all cases of cervical cancer and some anal, vaginal, penile, and oropharyngeal cancers.2 An estimated 13,000 cases of invasive cervical cancer will be diagnosed this year in the United States alone.3
Up to 70% of HPV-related cervical cancer cases can be prevented with vaccination. A number of changes have been made to the vaccination schedule within the past few years—patients younger than 15 need only 2 rather than 3 doses, and the vaccine itself can be used in adults up to age 45.
Vaccination and routine cervical cancer screening are both necessary to prevent this disease3 along with effective family and patient counseling. Here, we discuss the most up-to-date HPV vaccination recommendations, current cervical cancer screening guidelines, counseling techniques that increase vaccination acceptance rates, and follow-up protocols for abnormal cervical cancer screening results.
TYPES OF HPV VACCINES
HPV immunization can prevent up to 70% of cases of cervical cancer due to HPV as well as 90% of genital warts.4 The US Food and Drug Administration (FDA) has approved 3 HPV vaccines:
- Gardasil 9 targets HPV types 6, 11, 16, and 18 along with 31, 33, 45, 52, 58—these cause 90% of cervical cancer cases and most cases of genital warts5—making it the most effective vaccine available; Gardasil 9 is the only HPV vaccine currently available in the United States
- The bivalent vaccine (Cervarix) targeted HPV 16 and 18 only, and was discontinued in the United States in 2016
- The quadrivalent HPV vaccine (Gardasil) targeted HPV 16 and 18 as well as 6 and 11, which cause most cases of genital warts; the last available doses in the United States expired in May 2017; it has been replaced by Gardasil 9.
The incidence of cervical cancer in the United States dropped 29% among 15- to 24-year-olds from 2003–2006 when HPV vaccination first started to 2011–2014.6
VACCINE DOSING RECOMMENDATIONS FOR PRIMARY PREVENTION
The Advisory Committee on Immunization Practices (ACIP) revised its HPV vaccine schedule in 2016, when it decreased the necessary doses from 3 to 2 for patients under age 15 and addressed the needs of special patient populations.7 In late 2018, the FDA approved the use of the vaccine in men and women up to age 45. However, no change in guidelines have yet been made (Table 1).
In females, the ACIP recommends starting HPV vaccination at age 11 or 12, but it can be given as early as age 9. A 2-dose schedule is recommended for the 9-valent vaccine before the patient’s 15th birthday (the second dose 6 to 12 months after the first).7 For females who initiate HPV vaccination between ages 15 and 45, a 3-dose schedule is necessary (at 0, 1 to 2, and 6 months).7,8
The change to a 2-dose schedule was prompted by an evaluation of girls ages 9 to 13 randomized to receive either a 2- or 3-dose schedule. Antibody responses with a 2-dose schedule were not inferior to those of young women (ages 16 to 26) who received all 3 doses.9 The geometric mean titer ratios remained noninferior throughout the study period of 36 months.
However, a loss of noninferiority was noted for HPV-18 by 24 months and for HPV-6 by 36 months.9 Thus, further studies are needed to understand the duration of protection with a 2-dose schedule. Nevertheless, decreasing the number of doses makes it a more convenient and cost-effective option for many families.
The recommendations are the same for males except for one notable difference: in males ages 21 to 26, vaccination is not routinely recommended by the ACIP, but rather it is considered a “permissive use” recommendation: ie, the vaccine should be offered and final decisions on administration be made after individualized discussion with the patient.10 Permissive-use status also means the vaccine may not be covered by health insurance. Even though the vaccine is now available to men and women until age 45, many insurance plans do not cover it after age 26.
Children of either sex with a history of sexual abuse should receive their first vaccine dose beginning at age 9.7
Immunocompromised patients should follow the 3-dose schedule regardless of their sex or the age when vaccination was initiated.10
For transgender patients and for men not previously vaccinated who have sex with men, the 3-dose schedule vaccine should be given by the age of 26 (this is a routine recommendation, not a permissive one).8
CHALLENGES OF VACCINATION
Effective patient and family counseling is important. Even though the first HPV vaccine was approved in 2006, only 34.9% of US adolescents were fully vaccinated by 2015. This was in part because providers did not recommend it, were unfamiliar with it, or had concerns about its safety,11,12 and in part because some parents refused it.
The physician must address any myths regarding HPV vaccination and ensure that parents and patients understand that HPV vaccine is safe and effective. Studies have shown that with high-quality recommendations (ie, the care provider strongly endorses the HPV vaccine, encourages same-day vaccination, and discusses cancer prevention), patients are 9 times more likely to start the HPV vaccination schedule and 3 times more likely to follow through with subsequent doses.13
Providing good family and patient education does not necessarily require spending more counseling time. A recent study showed that spending less time discussing the HPV vaccine can lead to better vaccine coverage.14 The study compared parent HPV vaccine counseling techniques and found that simply informing patients and their families that the HPV vaccine was due was associated with a higher vaccine acceptance rate than inviting conversations about it.14 When providers announced that the vaccine was due, assuming the parents were ready to vaccinate, there was a 5.4% increase in HPV vaccination coverage.14
Conversely, physicians who engaged parents in open-ended discussions about the HPV vaccine did not improve HPV vaccination coverage.14 The authors suggested that providers approach HPV vaccination as if they were counseling patients and families about the need to avoid second-hand smoke or the need to use car seats. If parents or patients resist the presumptive announcement approach, expanded counseling and shared decision-making are appropriate. This includes addressing misconceptions that parents and patients may have about the HPV vaccine. The American Cancer Society lists 8 facts to reference (Table 2).15
SECONDARY PREVENTION: CERVICAL CANCER SCREENING
Since the introduction of the Papanicolaou (Pap) test, US cervical cancer incidence rates have decreased by more than 60%.16 Because almost all cervical cancer is preventable with proper screening, all women ages 21 to 65 should be screened.
Currently, there are 3 options available for cervical cancer screening: the Pap-only test, the Pap-HPV cotest, and the high-risk HPV-only test (Table 3). The latter 2 options detect high-risk HPV genotypes.
Several organizations have screening algorithms that recommend when to use these tests, but the 3 that shape today’s standard of care in cervical cancer screening come from the American College of Obstetricians and Gynecologists (ACOG), the American Society for Colposcopy and Cervical Pathology (ASCCP), and US Preventive Services Task Force (USPSTF).17–19
Pap-only testing is performed every 3 years to screen for cervical neoplasia that might indicate premalignancy.
Pap-HPV cotesting is performed every 5 years in women older than 30 with past normal screening. Until 2018, all 3 organizations recommended cotesting as the preferred screening algorithm for women ages 30 to 65.17–19 Patients with a history of abnormal test results require more frequent testing as recommended by the ASCCP.18
The high-risk HPV-only test utilizes real-time polymerase chain reaction to detect HPV 16, HPV 18, and 12 other HPV genotypes. Only 2 tests are approved by the FDA as stand-alone cervical cancer screening tests—the Roche Cobas HPV test approved in 2014 and the Becton Dickinson Onclarity HPV assay approved in 2018. Other HPV tests that are used in a cotesting strategy should not be used for high-risk HPV-only testing because their performance characteristics may differ.
In 2015, the Addressing the Need for Advanced HPV Diagnostics (ATHENA) study showed that 1 round of high-risk HPV-only screening for women older than 25 was more sensitive than Pap-only or cotesting for stage 3 cervical intraepithelial neoplasia or more severe disease (after 3 years of follow-up).20 Current guidelines from ASCCP18 and ACOG17 state that the high-risk HPV test can be repeated every 3 years (when used to screen by itself) if the woman is older than 25 and has had a normal test result.
If the HPV test result is positive for high-risk HPV 16 or 18 genotypes, then immediate colposcopy is indicated; women who test positive for one of the other 12 high-risk subtypes will need to undergo a Pap test to determine the appropriate follow-up (Figure 1).18,21
In 2018, the USPSTF updated its recommendations, noting that for women age 30 to 65, Pap-only testing every 3 years, cotesting every 5 years, or high-risk HPV-only testing every 5 years are all appropriate screening strategies, with the Pap-only or high-risk HPV-only screenings being preferred.19 This is in contrast to ACOG and ASCCP recommendations for cotesting every 5 years, with alternative options of Pap-only or HPV-only testing being done every 3 years.17,18
Is there a best screening protocol?
The USPSTF reviewed large randomized and observational studies to summarize the effectiveness of the 3 screening strategies and commissioned a decision analysis model to compare the risks, benefits, and costs of the 3 screening algorithms. The guideline statement notes both cotesting and high-risk HPV testing offer similar cancer detection rates: each prevents 1 additional cancer per 1,000 women screened as opposed to Pap-only testing.19
Also, tests that incorporate high-risk HPV screening may offer better detection of cervical adenocarcinoma (which has a worse prognosis than the more common squamous cell carcinoma type). However, both HPV-based screening strategies are more likely to require additional colposcopies for follow-up than Pap-only screening (1,630 colposcopies required for each cancer prevented with high-risk HPV alone, 1,635 with cotesting). Colposcopy is a simple office procedure that causes minimal discomfort to the patient.
The USPSTF guideline also differs in the recommended frequency of high-risk HPV-only testing; a high-risk HPV result should be repeated every 5 years if normal (as opposed to every 3 years as recommended by ACOG and ASCCP).19 The 5-year recommendation is based on analysis modeling, which suggests that performing high-risk HPV-only testing more frequently is unlikely to improve detection rates but will increase the number of screening tests and colposcopies.19
No trial has directly compared cotesting with high-risk HPV testing for more than 2 rounds of screening. The updated USPSTF recommendations are based on modeling estimates and expert opinion, which assesses cost and benefit vs harm in the long term. Also, no high-risk HPV test is currently FDA-approved for every-5-year screening when used by itself.
All 3 cervical cancer screening methods provide highly effective cancer prevention, so it is important for providers to choose the strategy that best fits their practice. The most critical aspect of screening is getting all women screened, no matter which method is used.
It is critical to remember that the screening intervals are intended for patients without symptoms. Those who have new concerns such as bleeding should have a diagnostic Pap done to evaluate their symptoms.
Follow-up of abnormal results
Regardless of the pathway chosen, appropriate follow-up of any abnormal test result is critical to the early detection of cancer. Established follow-up guidelines exist,22,23 but accessing this information can be difficult for the busy clinician. The ASCCP has a mobile phone application that outlines the action steps corresponding to the patient’s age and results of any combination of Pap or HPV testing. The app also includes the best screening algorithms for a particular patient.24
All guidelines agree that cervical cancer screening should start at age 21, regardless of HPV vaccination status or age of sexual initiation.17,18,25 Screening can be discontinued at age 65 for women with normal screening results in the prior decade (3 consecutive negative Pap results or 2 consecutive negative cotest results).23
For women who have had a total hysterectomy and no history of cervical neoplasia, screening should be stopped immediately after the procedure. However, several high-risk groups of women will need continued screening past the age of 65, or after a hysterectomy.
For a woman with a history of stage 2 cervical intraepithelial neoplasia or higher grade lesions, routine screening is continued for an additional 20 years, even if she is over age 65. Pap-only testing every 3 years is acceptable, because the role of HPV testing is unclear after hysterectomy.23 Prior guidelines suggested annual screening in these patients, so the change to every 3 years is notable. Many gynecologic oncologists will recommend that women with a history of cervical cancer continue annual screening indefinitely.
Within the first 2 to 3 years after treatment for high-grade dysplastic changes, annual follow-up is done by the gynecologic oncology team. Providers who offer follow-up during this time frame should keep in communication with the oncology team to ensure appropriate, individualized care. These recommendations are based on expert opinion, so variations in clinical practice may be seen.
Women infected with the human immunodeficiency virus can have Pap-only testing every 3 years, after a series of 3 normal annual Pap results.26 But screening does not stop at age 65.23,26 For patients who are immunosuppressed or have a history of diethylstilbestrol exposure, screening should be done annually indefinitely.23
- Bruni L, Diaz M, Castellsagué X, Ferrer E, Bosch FX, de Sanjosé S. Cervical human papillomavirus prevalence in 5 continents: meta-analysis of 1 million women with normal cytological findings. J Infect Dis 2010; 202(12):1789–1799. doi:10.1086/657321
- de Martel C, Ferlay J, Franceschi S, et al. Global burden of cancer attributable to infections in 2008: a review and synthetic analysis. Lancet Oncol 2012; 13(6):607–615. doi:10.1016/S1470-2045(12)70137-7
- American Cancer Society. Key statistics for cervical cancer. www.cancer.org/cancer/cervical-cancer/about/key-statistics.html. Accessed February 14, 2019.
- Thaxton L, Waxman AG. Cervical cancer prevention: immunization and screening 2015. Med Clin North Am 2015; 99(3):469–477. doi:10.1016/j.mcna.2015.01.003
- McNamara M, Batur P, Walsh JME, Johnson KM. HPV update: vaccination, screening, and associated disease. J Gen Intern Med 2016; 31(11):1360–1366. doi:10.1007/s11606-016-3725-z
- Guo F, Cofie LE, Berenson AB. Cervical cancer incidence in young US females after human papillomavirus vaccine introduction. Am J Prev Med 2018; 55(2):197–204. doi:10.1016/j.amepre.2018.03.013
- Meites E, Kempe A, Markowitz LE. Use of a 2-dose schedule for human papillomavirus vaccination—updated recommendations of the Advisory Committee on Immunization Practices. MMWR Morb Mortal Wkly Rep 2016; 65(49):1405–1408. doi:10.15585/mmwr.mm6549a5
- Centers for Disease Control and Prevention (CDC). Supplemental information and guidance for vaccination providers regarding use of 9-valent HPV vaccine Information for persons who started an HPV vaccination series with quadrivalent or bivalent HPV vaccine. www.cdc.gov/hpv/downloads/9vhpv-guidance.pdf. Accessed February 14, 2019.
- Dobson SR, McNeil S, Dionne M, et al. Immunogenicity of 2 doses of HPV vaccine in younger adolescents vs 3 doses in young women: a randomized clinical trial. JAMA 2013; 309(17):1793–1802. doi:10.1001/jama.2013.1625
- Markowitz LE, Dunne EF, Saraiya M, et al; Centers for Disease Control and Prevention (CDC). Human papillomavirus vaccination: recommendations of the Advisory Committee on Immunization Practices (ACIP). MMWR Recomm Rep 2014; 63(RR-05):1–30. pmid:25167164
- Thompson EL, Rosen BL, Vamos CA, Kadono M, Daley EM. Human papillomavirus vaccination: what are the reasons for nonvaccination among US adolescents? J Adolesc Health 2017; 61(3):288–293. doi:10.1016/j.jadohealth.2017.05.015
- Reagan-Steiner S, Yankey D, Jeyarajah J, et al. National, regional, state, and selected local area vaccination coverage among adolescents aged 13-17 years—United States, 2015. MMWR Morb Mortal Wkly Rep 2016; 65(33):850–858. doi:10.15585/mmwr.mm6533a4
- Gilkey MB, Calo WA, Moss JL, Shah PD, Marciniak MW, Brewer NT. Provider communication and HPV vaccination: The impact of recommendation quality. Vaccine 2016; 34(9):1187–1192. doi:10.1016/j.vaccine.2016.01.023
- Brewer NT, Hall ME, Malo TL, Gilkey MB, Quinn B, Lathren C. Announcements versus conversations to improve HPV vaccination coverage: a randomized trial. Pediatrics 2017; 139(1):e20161764. doi:10.1542/peds.2016-1764
- American Cancer Society. HPV vaccine facts. www.cancer.org/cancer/cancer-causes/infectious-agents/hpv/hpv-vaccine-facts-and-fears.html. Accessed February 14, 2019.
- National Cancer Institute; Chasan R, Manrow R. Cervical cancer. https://report.nih.gov/nihfactsheets/viewfactsheet.aspx?csid=76. Accessed February 14, 2019.
- The American College of Obstetricians and Gynecologists (ACOG). Frequently asked questions. Cervical cancer screening. www.acog.org/Patients/FAQs/Cervical-Cancer-Screening. Accessed February 14, 2019.
- Saslow D, Solomon D, Lawson HW, et al; American Cancer Society; American Society for Colposcopy and Cervical Pathology; American Society for Clinical Pathology. American Cancer Society, American Society for Colposcopy and Cervical Pathology, and American Society for Clinical Pathology screening guidelines for the prevention and early detection of cervical cancer. Am J Clin Pathol 2012; 137(4):516–542. doi:10.1309/AJCPTGD94EVRSJCG
- US Preventive Services Task Force; Curry SJ, Krist AH, Owens DK, et al. Screening for cervical cancer: US Preventive Services Task Force Recommendation Statement. JAMA 2018; 320(7):674–686. doi:10.1001/jama.2018.10897
- Wright TC, Stoler MH, Behrens CM, Sharma A, Zhang G, Wright TL. Primary cervical cancer screening with human papillomavirus: end of study results from the ATHENA study using HPV as the first-line screening test. Gynecol Oncol 2015; 136(2):189–197. doi:10.1016/j.ygyno.2014.11.076
- Huh WK, Ault KA, Chelmow D, et al. Use of primary high-risk human papillomavirus testing for cervical cancer screening: interim clinical guidance. Obstet Gynecol 2015; 125(2):330–337. doi:10.1097/AOG.0000000000000669
- Massad LS, Einstein MH, Huh WK, et al; 2012 ASCCP Consensus Guidelines Conference. 2012 updated consensus guidelines for the management of abnormal cervical cancer screening tests and cancer precursors. Obstet Gynecol 2013; 121(4):829–846. doi:10.1097/AOG.0b013e3182883a34
- Committee on Practice Bulletins—Gynecology. Practice Bulletin No. 168: cervical cancer screening and prevention. Obstet Gynecol 2016; 128(4):e111–e130. doi:10.1097/AOG.0000000000001708
- ASCCP. Mobile app. http://www.asccp.org/store-detail2/asccp-mobile-app. Accessed February 14, 2019.
- USPSTF. Draft recommendation: cervical cancer: screening. www.uspreventiveservicestaskforce.org/Page/Document/draft-recommendation-statement/cervical-cancer-screening2. Accessed February 14, 2019.
- Masur H, Brooks JT, Benson CA, Holmes KK, Pau AK, Kaplan JE; National Institutes of Health; Centers for Disease Control and Prevention; HIV Medicine Association of the Infectious Diseases Society of America. Prevention and treatment of opportunistic infections in HIV-infected adults and adolescents: Updated guidelines from the Centers for Disease Control and Prevention, National Institutes of Health, and HIV Medicine Association of the Infectious Diseases Society of America. Clin Infect Dis 2014; 58(9):1308–1311. doi:10.1093/cid/ciu094
KEY POINTS
- Immunization against HPV can prevent up to 70% of HPV-related cervical cancer cases.
- Gardasil 9 is the only HPV vaccine currently available in the United States and is now approved for use in males and females between the ages of 9 and 45.
- In girls and boys younger than 15, a 2-dose schedule is recommended; patients ages 15 through 45 require 3 doses.
- Vaccine acceptance rates are highest when primary care providers announce that the vaccine is due rather than invite open-ended discussions.
- Regular cervical cancer screening is an important preventive tool and should be performed using the Papanicolaou (Pap) test, the high-risk HPV-only test, or the Pap-HPV cotest.
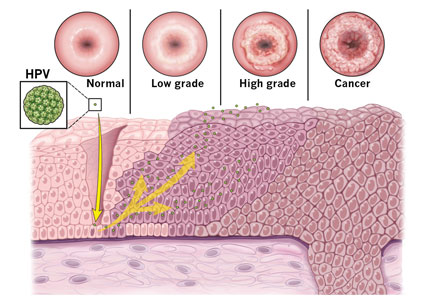
Assessing liver fibrosis without biopsy in patients with HCV or NAFLD
Staging of liver fibrosis, important for determining prognosis in patients with chronic liver disease and for the need to start screening for complications of cirrhosis, was traditionally done only by liver biopsy. While biopsy is still the gold standard method to stage fibrosis, noninvasive methods have been developed that can also assess disease severity.
This article briefly reviews the epidemiology and physiology of chronic liver disease and the traditional role of liver biopsy. Pros and cons of alternative fibrosis assessment methods are discussed, with a focus on their utility for patients with nonalcoholic fatty liver disease (NAFLD) and hepatitis C virus (HCV) infection.
CHRONIC LIVER DISEASE: A HUGE HEALTH BURDEN
Chronic liver disease is associated with enormous health and financial costs in the United States. Its prevalence is about 15%,1 and it is the 12th leading cause of death.2 Hospital costs are estimated at about $4 billion annually.3
The most common causes of chronic liver disease are NAFLD (which may be present in up to one-third of the US population and is increasing with the epidemic of obesity), its aggressive variant, nonalcoholic steatohepatitis (NASH) (present in about 3% of the population), and HCV infection (1%).4,5
Since direct-acting antiviral agents were introduced, HCV infection dropped from being the leading cause of liver transplant to third place.6 But at the same time, the number of patients on the transplant waiting list who have NASH has risen faster than for any other cause of chronic liver disease.7
FIBROSIS: A KEY INDICATOR OF DISEASE SEVERITY


In HCV infection, advanced fibrosis is defined as either stage 4 to 6 using the Ishak system10 or stage 3 to 4 using the Meta-analysis of Histological Data in Viral Hepatitis (METAVIR) system.11
In NAFLD, advanced fibrosis is defined as stage 3 to 4 using the NASH Clinical Research Network system.12
Staging fibrosis is also important so that patients with cirrhosis can be identified early to begin screening for hepatocellular carcinoma and esophageal varices to reduce the risks of illness and death. In addition, insurance companies often require documentation of fibrosis stage before treating HCV with the new direct-acting antiviral agents.
LIVER BIOPSY IS STILL THE GOLD STANDARD
Although invasive, liver biopsy remains the gold standard for determining fibrosis stage. Liver biopsies were performed “blindly” (without imaging) until the 1990s, but imaging-guided biopsy using ultrasonography was then developed, which entailed less pain and lower complication and hospitalization rates. Slightly more hepatic tissue is obtained with guided liver biopsy, but the difference was deemed clinically insignificant.13 Concern initially arose about the added cost involved with imaging, but imaging-guided biopsy was actually found to be more cost-effective.14
In the 2000s, transjugular liver biopsy via the right internal jugular vein became available. This method was originally used primarily in patients with ascites or significant coagulopathy. At first, there were concerns about the adequacy of specimens obtained to make an accurate diagnosis or establish fibrosis stage, but this limitation was overcome with improved techniques.15,16 Transjugular liver biopsy has the additional advantage of enabling one to measure the hepatic venous pressure gradient, which also has prognostic significance; a gradient greater than 10 mm Hg is associated with worse prognosis.17
Disadvantages of biopsy: Complications, sampling errors
Liver biopsy has disadvantages. Reported rates of complications necessitating hospitalization using the blind method were as high as 6% in the 1970s,18 dropping to 3.2% in a 1993 study.19 Bleeding remains the most worrisome complication. With the transjugular method, major and minor complication rates are less than 1% and 7%, respectively.15,16 Complication rates with imaging-guided biopsy are also low.
Liver biopsy is also prone to sampling error. The number of portal tracts obtained in the biopsy correlates with the accuracy of fibrosis staging, and smaller samples may lead to underestimating fibrosis stage. In patients with HCV, samples more than 15 mm long led to accurate staging diagnosis in 65% of patients, and those longer than 25 mm conferred 75% accuracy.20 Also, different stages can be diagnosed from samples obtained from separate locations in the liver, although rarely is the difference more than a single stage.21
Histologic evaluation of liver biopsies is operator-dependent. Although significant interobserver variation has been reported for degree of inflammation, there tends to be good concordance for fibrosis staging.22,23
STAGING BASED ON DEMOGRAPHIC AND LABORATORY VARIABLES
Several scores based on patient characteristics and laboratory values have been developed for assessing liver fibrosis and have been specifically validated for HCV infection, NAFLD, or both. They can serve as inexpensive initial screening tests for the presence or absence of advanced fibrosis.
FIB-4 index for HCV, NAFLD
The FIB-4 index predicts the presence of advanced fibrosis using, as its name indicates, a combination of 4 factors in fibrosis: age, platelet count, and the levels of aspartate aminotransferase (AST) and alanine aminotransferase (ALT), according to the formula:
FIB-4 index = (age × AST [U/L]) /
(platelet count [× 109/L] × √ALT [U/L]).
The index was derived from data from 832 patients co-infected with HCV and human immunodeficiency virus.24 The Ishak staging system10 for fibrosis on liver biopsy was used for confirmation, with stage 4 to 6 defined as advanced fibrosis. A cutoff value of more than 3.25 had a positive predictive value of 65% for advanced fibrosis, and to exclude advanced fibrosis, a cutoff value of less than 1.45 had a negative predictive value of 90%.
The FIB-4 index has since been validated in patients with HCV infection25 and NAFLD.26 In a subsequent study in 142 patients with NAFLD, the FIB-4 index was more accurate in diagnosing advanced fibrosis than the other noninvasive prediction models discussed below.27
NAFLD fibrosis score
The NAFLD fibrosis score, constructed and validated only in patients with biopsy-confirmed NAFLD, incorporates age, body mass index, presence of diabetes or prediabetes, albumin level, platelet count, and AST and ALT levels.
A group of 480 patients was used to construct the score, and 253 patients were used to validate it. Using the high cutoff value of 0.676, the presence of advanced fibrosis was diagnosed with a positive predictive value of 90% in the group used to construct the model (82% in the validation group). Using the low cutoff score of –1.455, advanced fibrosis could be excluded with a negative predictive value of 93% in the construction group and 88% in the validation group.28 A score between the cutoff values merits liver biopsy to determine fibrosis stage. The score is more accurate in patients with diabetes.29 When used by primary care physicians, the NAFLD fibrosis score is more cost-effective than transient elastography and liver biopsy for accurately predicting advanced fibrosis.30
AST-to-platelet ratio index score for HCV, NAFLD
The AST-to-platelet ratio index (APRI) score was developed in 2003 using a cohort of 270 patients with HCV and liver biopsy as the standard. A cutoff value of less than or equal to 0.5 had a negative predictive value of 86% for the absence of significant fibrosis, while a score of more than 1.5 detected the presence of significant fibrosis with a positive predictive value of 88%.31 The APRI score was subsequently validated for NAFLD.27,32
FibroSure uses a patented formula
FibroSure (LabCorp; labcorp.com) uses a patented mathematical formula that takes into account age, sex, and levels of gamma-glutamyl transferase, total bilirubin, haptoglobin, apolipoprotein-A, and alpha-2 macroglobulin to assess fibrosis. Developed in 2001 for use in patients with HCV infection, it was reported to have a positive predictive value of greater than 90% and a negative predictive value of 100% for clinically significant fibrosis, defined as stage 2 to 4 based on the METAVIR staging system in the prediction model.33 The use of FibroSure in patients with HCV was subsequently validated in various meta-analyses and systematic reviews.34,35 It is less accurate in patients with normal ALT levels.36
FibroSure also has good accuracy for predicting fibrosis stage in chronic liver disease due to other causes, including NAFLD.37
The prediction models discussed above use routine laboratory tests for chronic liver disease and thus are inexpensive. The high cost of additional testing needed for FibroSure, coupled with the risk of misdiagnosis, makes its cost-effectiveness questionable.38
IMAGING TO PREDICT FIBROSIS STAGE
Conventional ultrasonography (with or without vascular imaging) and computed tomography can detect cirrhosis on the basis of certain imaging characteristics,39,40 including the nodular contour of the liver, caudate lobe hypertrophy, ascites, reversal of blood flow in the portal vein, and splenomegaly. However, they cannot detect fibrosis in its early stages.
The 3 methods discussed below provide more accurate fibrosis staging by measuring the velocity of shear waves sent across hepatic tissue. Because shear-wave velocity increases with liver stiffness, the fibrosis stage can be estimated from this information.41
Transient elastography
Transient elastography uses a special ultrasound transducer. It is highly accurate for predicting advanced fibrosis for almost all causes of chronic liver disease, including HCV infection42,43 and NAFLD.44 The cutoff values of wave velocity to estimate fibrosis stage differ by liver disease etiology.
Transient elastography should not be used to evaluate fibrosis in patients with acute hepatitis, which transiently increases liver stiffness, resulting in a falsely high fibrosis stage diagnosis.45 It is also not a good method for evaluating fibrosis in patients with biliary obstruction or extrahepatic venous congestion. Because liver stiffness can increase after eating,46 the test should be done under fasting conditions.
A significant limitation of transient elastography has been its poor accuracy in patients with obesity.47 This has been largely overcome with the use of a more powerful (XL) probe but is still a limitation for those with morbid obesity.48 Because many patients with NAFLD are obese, this limitation can be significant.
Transient elastography has gained popularity for evaluating fibrosis in patients with chronic liver disease for multiple reasons: it is cost-effective and results are highly reproducible, with low variation in results among different observers and in individual observers.49 Combined with a platelet count, it can also be used to detect the development of clinically significant portal hypertension in patients with cirrhosis, thus determining the need to screen for esophageal varices using endoscopy.50 Screening endoscopy can be avoided in patients whose liver stiffness remains below 20 kPa or whose platelet count is above 150 × 109/L.
Acoustic radiation force imaging
Unlike transient elastography, which requires a separate transducer probe to assess shear- wave velocity, acoustic radiation force imaging uses the same transducer for both this function and imaging. Different image modes are available when testing for liver stiffness, so a region of interest that is optimal for avoiding vascular structures or masses can be selected, increasing accuracy.51
Acoustic radiation force imaging has been tested in different causes of chronic liver disease, including HCV and NAFLD,52 with accuracy similar to that of transient elastography.53 For overweight and obese patients, acoustic radiation force imaging is more accurate than transient elastography using the XL probe.54 However, this method is still new, and we need more data to support using one method over the other.
Magnetic resonance elastography
Magnetic resonance elastography uses a special transducer placed under the rib cage to transmit shear waves concurrently with magnetic resonance imaging. It has been tested in patients with HCV and NAFLD and has been found to have better diagnostic accuracy than transient elastography and acoustic radiation force imaging.55,56 Patients must be fasting for better diagnostic accuracy57 and must hold their breath while elastography is performed. The need for breath-holding and the high cost limit the use of this method for assessing fibrosis.
BOTTOM LINE FOR ASSESSING FIBROSIS

- Younossi ZM, Stepanova M, Afendy M, et al. Changes in the prevalence of the most common causes of chronic liver diseases in the United States from 1988 to 2008. Clin Gastroenterol Hepatol 2011; 9(6):524–530.e1. doi:10.1016/j.cgh.2011.03.020
- Kochanek KD, Xu J, Murphy SL, Miniño AM, Kung H-C. Deaths: final data for 2009. Natl Vital Stat Rep 2011; 60(3):1–116. pmid:24974587
- Volk ML, Tocco RS, Bazick J, Rakoski MO, Lok AS. Hospital readmissions among patients with decompensated cirrhosis. Am J Gastroenterol 2012; 107(2):247–252. doi:10.1038/ajg.2011.314
- Vernon G, Baranova A, Younossi ZM. Systematic review: the epidemiology and natural history of non-alcoholic fatty liver disease and non-alcoholic steatohepatitis in adults. Aliment Pharmacol Ther 2011; 34(3):274–285. doi:10.1111/j.1365-2036.2011.04724.x
- Udompap P, Kim D, Kim WR. Current and future burden of chronic nonmalignant liver disease. Clin Gastroenterol Hepatol 2015; 13(12):2031–2041. doi:10.1016/j.cgh.2015.08.015
- Kim WR, Lake JR, Smith JM, et al. OPTN/SRTR 2016 annual data report: liver. Am J Transplant 2018; 18(suppl 1):172–253. doi:10.1111/ajt.14559
- Wong RJ, Aguilar M, Cheung R, et al. Nonalcoholic steatohepatitis is the second leading etiology of liver disease among adults awaiting liver transplantation in the United States. Gastroenterology 2015; 148(3):547–555. doi:10.1053/j.gastro.2014.11.039
- Ishak K, Baptista A, Bianchi L, et al. Histological grading and staging of chronic hepatitis. J Hepatol 1995; 22(6):696–699. pmid:7560864
- Bedossa P, Poynard T. An algorithm for the grading of activity in chronic hepatitis C. Hepatology 1996; 24(2):289–293. doi:10.1002/hep.510240201
- Kleiner DE, Brunt EM, Van Natta M, et al; Nonalcoholic Steatohepatitis Clinical Research Network. Design and validation of a histological scoring system for nonalcoholic fatty liver disease. Hepatology 2005; 41(6):1313–1321. doi:10.1002/hep.20701
- Everhart JE, Wright EC, Goodman ZD, et al; HALT-C Trial Group. Prognostic value of Ishak fibrosis stage: findings from the hepatitis C antiviral long-term treatment against cirrhosis trial. Hepatology 2010; 51(2):585–594. doi:10.1002/hep.23315
- Angulo P, Kleiner DE, Dam-Larsen S, et al. Liver fibrosis, but no other histologic features, is associated with long-term outcomes of patients with nonalcoholic fatty liver disease. Gastroenterology 2015; 149(2):389–397.e10. doi:10.1053/j.gastro.2015.04.043
- Lindor KD, Bru C, Jorgensen RA, et al. The role of ultrasonography and automatic-needle biopsy in outpatient percutaneous liver biopsy. Hepatology 1996; 23(5):1079–1083. doi:10.1002/hep.510230522
- Pasha T, Gabriel S, Therneau T, Dickson ER, Lindor KD. Cost-effectiveness of ultrasound-guided liver biopsy. Hepatology 1998; 27(5):1220–1226. doi:10.1002/hep.510270506
- Alessandria C, Debernardi-Venon W, Rizzetto M, Marzano A. Transjugular liver biopsy: a relatively simple procedure with an indefinite past and an expected brilliant future. J Hepatol 2008; 48(1):171–173. doi:10.1016/j.jhep.2007.10.001
- Kalambokis G, Manousou P, Vibhakorn S, et al. Transjugular liver biopsy—indications, adequacy, quality of specimens, and complications—a systematic review. J Hepatol 2007; 47(2):284–294. doi:10.1016/j.jhep.2007.05.001
- Ripoll C, Groszmann R, Garcia-Tsao G, et al; Portal Hypertension Collaborative Group. Hepatic venous pressure gradient predicts clinical decompensation in patients with compensated cirrhosis. Gastroenterology 2007; 133(2):481–488. doi:10.1053/j.gastro.2007.05.024
- Perrault J, McGill DB, Ott BJ, Taylor WF. Liver biopsy: complications in 1000 inpatients and outpatients. Gastroenterology 1978; 74(1):103–106. pmid:618417
- Janes CH, Lindor KD. Outcome of patients hospitalized for complications after outpatient liver biopsy. Ann Intern Med 1993; 118(2):96–98. pmid:8416324
- Bedossa P, Dargere D, Paradis V. Sampling variability of liver fibrosis in chronic hepatitis C. Hepatology 2003; 38(6):1449–1457. doi:10.1016/j.hep.2003.09.022
- Regev A, Berho M, Jeffers LJ, et al. Sampling error and intraobserver variation in liver biopsy in patients with chronic HCV infection. Am J Gastroenterol 2002; 97(10):2614–2618. doi:10.1111/j.1572-0241.2002.06038.x
- Goldin RD, Goldin JG, Burt AD, et al. Intra-observer and inter-observer variation in the histopathological assessment of chronic viral hepatitis. J Hepatol 1996; 25(5):649–654. pmid:8938541
- Intraobserver and interobserver variations in liver biopsy interpretation in patients with chronic hepatitis C. The French METAVIR Cooperative Study Group. Hepatology 1994; 20(1 Pt 1):15–20. pmid:8020885
- Sterling RK, Lissen E, Clumeck N, et al; APRICOT Clinical Investigators. Development of a simple noninvasive index to predict significant fibrosis in patients with HIV/HCV coinfection. Hepatology 2006; 43(6):1317–1325. doi:10.1002/hep.21178
- Vallet-Pichard A, Mallet V, Nalpas B, et al. FIB-4: an inexpensive and accurate marker of fibrosis in HCV infection. comparison with liver biopsy and fibrotest. Hepatology 2007; 46(1):32–36. doi:10.1002/hep.21669
- Shah AG, Lydecker A, Murray K, Tetri BN, Contos MJ, Sanyal AJ; Nash Clinical Research Network. Comparison of noninvasive markers of fibrosis in patients with nonalcoholic fatty liver disease. Clin Gastroenterol Hepatol 2009; 7(10):1104–1112. doi:10.1016/j.cgh.2009.05.033
- McPherson S, Stewart SF, Henderson E, Burt AD, Day CP. Simple non-invasive fibrosis scoring systems can reliably exclude advanced fibrosis in patients with non-alcoholic fatty liver disease. Gut 2010; 59(9):1265–1269. doi:10.1136/gut.2010.216077
- Angulo P, Hui JM, Marchesini G, et al. The NAFLD fibrosis score: A noninvasive system that identifies liver fibrosis in patients with NAFLD. Hepatology 2007; 45(4):846–854. doi:10.1002/hep.21496
- Goh GB, Pagadala MR, Dasarathy J, et al. Clinical spectrum of non-alcoholic fatty liver disease in diabetic and non-diabetic patients. BBA Clin 2015; 3:141–145. doi:10.1016/j.bbacli.2014.09.001
- Tapper EB, Hunink MG, Afdhal NH, Lai M, Sengupta N. Cost-effectiveness analysis: risk stratification of nonalcoholic fatty liver disease (NAFLD) by the primary care physician using the NAFLD fibrosis score. PLoS One 2016; 11(2):e0147237. doi:10.1371/journal.pone.0147237
- Wai CT, Greenson JK, Fontana RJ, et al. A simple noninvasive index can predict both significant fibrosis and cirrhosis in patients with chronic hepatitis C. Hepatology 2003; 38(2):518–526. doi:10.1053/jhep.2003.50346
- Calès P, Lainé F, Boursier J, et al. Comparison of blood tests for liver fibrosis specific or not to NAFLD. J Hepatol 2009; 50(1):165–173. doi:10.1016/j.jhep.2008.07.035
- Imbert-Bismut F, Ratziu V, Pieroni L, Charlotte F, Benhamou Y, Poynard T; MULTIVIRC Group. Biochemical markers of liver fibrosis in patients with hepatitis C virus infection: a prospective study. Lancet 2001; 357(9262):1069–1075. doi:10.1016/S0140-6736(00)04258-6
- Shaheen AA, Wan AF, Myers RP. FibroTest and FibroScan for the prediction of hepatitis C-related fibrosis: a systematic review of diagnostic test accuracy. Am J Gastroenterol 2007; 102(11):2589–2600. doi:10.1111/j.1572-0241.2007.01466.x
- Smith JO, Sterling RK. Systematic review: non-invasive methods of fibrosis analysis in chronic hepatitis C. Aliment Pharmacol Ther 2009; 30(6):557–576. doi:10.1111/j.1365-2036.2009.04062.x
- Sebastiani G, Vario A, Guido M, Alberti A. Performance of noninvasive markers for liver fibrosis is reduced in chronic hepatitis C with normal transaminases. J Viral Hepat 2007; 15(3):212–218. doi:10.1111/j.1365-2893.2007.00932.x
- Poynard T, Morra R, Halfon P, et al. Meta-analyses of FibroTest diagnostic value in chronic liver disease. BMC Gastroenterol 2007; 7:40. doi:10.1186/1471-230X-7-40
- Carlson JJ, Kowdley KV, Sullivan SD, Ramsey SD, Veenstra DL. An evaluation of the potential cost-effectiveness of non-invasive testing strategies in the diagnosis of significant liver fibrosis. J Gastroenterol Hepatol 2009; 24(5):786–791. doi:10.1111/j.1440-1746.2009.05778.x
- Aubé C, Oberti F, Korali N, et al. Ultrasonographic diagnosis of hepatic fibrosis or cirrhosis. J Hepatol 1999; 30(3):472–478. pmid:10190731
- Di Lelio A, Cestari C, Lomazzi A, Beretta L. Cirrhosis: diagnosis with sonographic study of the liver surface. Radiology 1989; 172(2):389–392. doi:10.1148/radiology.172.2.2526349
- Wong VW, Chan HL. Transient elastography. J Gastroenterol Hepatol 2010; 25(11):1726–1731. doi:10.1111/j.1440-1746.2010.06437.x
- Arena U, Vizzutti F, Abraldes JG, et al. Reliability of transient elastography for the diagnosis of advanced fibrosis in chronic hepatitis C. Gut 2008; 57(9):1288–1293. doi:10.1136/gut.2008.149708
- Ziol M, Handra-Luca A, Kettaneh A, et al. Noninvasive assessment of liver fibrosis by measurement of stiffness in patients with chronic hepatitis C. Hepatology 2005; 41(1):48–54. doi:10.1002/hep.20506
- Wong VW, Vergniol J, Wong GL, et al. Diagnosis of fibrosis and cirrhosis using liver stiffness measurement in nonalcoholic fatty liver disease. Hepatology 2010; 51(2):454–462. doi:10.1002/hep.23312
- Sagir A, Erhardt A, Schmitt M, Häussinger D. Transient elastography is unreliable for detection of cirrhosis in patients with acute liver damage. Hepatology 2007; 48(2):592–595. doi:10.1002/hep.22056
- Mederacke I, Wursthorn K, Kirschner J, et al. Food intake increases liver stiffness in patients with chronic or resolved hepatitis C virus infection. Liver Int 2009; 29(10):1500–1506. doi:10.1111/j.1478-3231.2009.02100.x
- Castéra L, Foucher J, Bernard PH, et al. Pitfalls of liver stiffness measurement: a 5-year prospective study of 13,369 examinations. Hepatology 2010; 51(3):828–835. doi:10.1002/hep.23425
- Wong VW, Vergniol J, Wong GL, et al. Liver stiffness measurement using XL probe in patients with nonalcoholic fatty liver disease. Am J Gastroenterol 2012; 107(12):1862–1871. doi:10.1038/ajg.2012.331
- Fraquelli M, Rigamonti C, Casazza G, et al. Reproducibility of transient elastography in the evaluation of liver fibrosis in patients with chronic liver disease. Gut 2007; 56(7):968–973. doi:10.1136/gut.2006.111302
- de Franchis R; Baveno VI Faculty. Expanding consensus in portal hypertension: report of the Baveno VI Consensus Workshop: stratifying risk and individualizing care for portal hypertension. J Hepatol 2015; 63(3):743–752. doi:10.1016/j.jhep.2015.05.022
- Friedrich-Rust M, Wunder K, Kriener S, et al. Liver fibrosis in viral hepatitis: noninvasive assessment with acoustic radiation force impulse imaging versus transient elastography. Radiology 2009; 252(2):595–604. doi:10.1148/radiol.2523081928
- Yoneda M, Suzuki K, Kato S, et al. Nonalcoholic fatty liver disease: US-based acoustic radiation force impulse elastography. Radiology 2010; 256(2):640–647. doi:10.1148/radiol.10091662
- Bota S, Herkner H, Sporea I, et al. Meta-analysis: ARFI elastography versus transient elastography for the evaluation of liver fibrosis. Liver Int 2013; 33(8):1138–1147. doi:10.1111/liv.12240
- Attia D, Bantel H, Lenzen H, Manns MP, Gebel MJ, Potthoff A. Liver stiffness measurement using acoustic radiation force impulse elastography in overweight and obese patients. Aliment Pharmacol Ther 2016; 44(4):366–379. doi:10.1111/apt.13710
- Cui J, Heba E, Hernandez C, et al. Magnetic resonance elastography is superior to acoustic radiation force impulse for the diagnosis of fibrosis in patients with biopsy-proven nonalcoholic fatty liver disease: a prospective study. Hepatology 2016; 63(2):453–461. doi:10.1002/hep.28337
- Huwart L, Sempoux C, Vicaut E, et al. Magnetic resonance elastography for the noninvasive staging of liver fibrosis. Gastroenterology 2008; 135(1):32–40. doi:10.1053/j.gastro.2008.03.076
- Jajamovich GH, Dyvorne H, Donnerhack C, Taouli B. Quantitative liver MRI combining phase contrast imaging, elastography, and DWI: assessment of reproducibility and postprandial effect at 3.0 T. PLoS One 2014; 9(5):e97355. doi:10.1371/journal.pone.0097355
- Lim JK, Flamm SL, Singh S, Falck-Ytter YT; Clinical Guidelines Committee of the American Gastroenterological Association. American Gastroenterological Association Institute guideline on the role of elastography in the evaluation of liver fibrosis. Gastroenterology 2017; 152(6):1536–1543. doi:10.1053/j.gastro.2017.03.017
- N, Feldstein AE. Noninvasive diagnosis of nonalcoholic fatty liver disease: are we there yet? Metabolism 2016; 65(8):1087–1095. doi:10.1016/j.metabol.2016.01.013
Staging of liver fibrosis, important for determining prognosis in patients with chronic liver disease and for the need to start screening for complications of cirrhosis, was traditionally done only by liver biopsy. While biopsy is still the gold standard method to stage fibrosis, noninvasive methods have been developed that can also assess disease severity.
This article briefly reviews the epidemiology and physiology of chronic liver disease and the traditional role of liver biopsy. Pros and cons of alternative fibrosis assessment methods are discussed, with a focus on their utility for patients with nonalcoholic fatty liver disease (NAFLD) and hepatitis C virus (HCV) infection.
CHRONIC LIVER DISEASE: A HUGE HEALTH BURDEN
Chronic liver disease is associated with enormous health and financial costs in the United States. Its prevalence is about 15%,1 and it is the 12th leading cause of death.2 Hospital costs are estimated at about $4 billion annually.3
The most common causes of chronic liver disease are NAFLD (which may be present in up to one-third of the US population and is increasing with the epidemic of obesity), its aggressive variant, nonalcoholic steatohepatitis (NASH) (present in about 3% of the population), and HCV infection (1%).4,5
Since direct-acting antiviral agents were introduced, HCV infection dropped from being the leading cause of liver transplant to third place.6 But at the same time, the number of patients on the transplant waiting list who have NASH has risen faster than for any other cause of chronic liver disease.7
FIBROSIS: A KEY INDICATOR OF DISEASE SEVERITY
In HCV infection, advanced fibrosis is defined as either stage 4 to 6 using the Ishak system10 or stage 3 to 4 using the Meta-analysis of Histological Data in Viral Hepatitis (METAVIR) system.11
In NAFLD, advanced fibrosis is defined as stage 3 to 4 using the NASH Clinical Research Network system.12
Staging fibrosis is also important so that patients with cirrhosis can be identified early to begin screening for hepatocellular carcinoma and esophageal varices to reduce the risks of illness and death. In addition, insurance companies often require documentation of fibrosis stage before treating HCV with the new direct-acting antiviral agents.
LIVER BIOPSY IS STILL THE GOLD STANDARD
Although invasive, liver biopsy remains the gold standard for determining fibrosis stage. Liver biopsies were performed “blindly” (without imaging) until the 1990s, but imaging-guided biopsy using ultrasonography was then developed, which entailed less pain and lower complication and hospitalization rates. Slightly more hepatic tissue is obtained with guided liver biopsy, but the difference was deemed clinically insignificant.13 Concern initially arose about the added cost involved with imaging, but imaging-guided biopsy was actually found to be more cost-effective.14
In the 2000s, transjugular liver biopsy via the right internal jugular vein became available. This method was originally used primarily in patients with ascites or significant coagulopathy. At first, there were concerns about the adequacy of specimens obtained to make an accurate diagnosis or establish fibrosis stage, but this limitation was overcome with improved techniques.15,16 Transjugular liver biopsy has the additional advantage of enabling one to measure the hepatic venous pressure gradient, which also has prognostic significance; a gradient greater than 10 mm Hg is associated with worse prognosis.17
Disadvantages of biopsy: Complications, sampling errors
Liver biopsy has disadvantages. Reported rates of complications necessitating hospitalization using the blind method were as high as 6% in the 1970s,18 dropping to 3.2% in a 1993 study.19 Bleeding remains the most worrisome complication. With the transjugular method, major and minor complication rates are less than 1% and 7%, respectively.15,16 Complication rates with imaging-guided biopsy are also low.
Liver biopsy is also prone to sampling error. The number of portal tracts obtained in the biopsy correlates with the accuracy of fibrosis staging, and smaller samples may lead to underestimating fibrosis stage. In patients with HCV, samples more than 15 mm long led to accurate staging diagnosis in 65% of patients, and those longer than 25 mm conferred 75% accuracy.20 Also, different stages can be diagnosed from samples obtained from separate locations in the liver, although rarely is the difference more than a single stage.21
Histologic evaluation of liver biopsies is operator-dependent. Although significant interobserver variation has been reported for degree of inflammation, there tends to be good concordance for fibrosis staging.22,23
STAGING BASED ON DEMOGRAPHIC AND LABORATORY VARIABLES
Several scores based on patient characteristics and laboratory values have been developed for assessing liver fibrosis and have been specifically validated for HCV infection, NAFLD, or both. They can serve as inexpensive initial screening tests for the presence or absence of advanced fibrosis.
FIB-4 index for HCV, NAFLD
The FIB-4 index predicts the presence of advanced fibrosis using, as its name indicates, a combination of 4 factors in fibrosis: age, platelet count, and the levels of aspartate aminotransferase (AST) and alanine aminotransferase (ALT), according to the formula:
FIB-4 index = (age × AST [U/L]) /
(platelet count [× 109/L] × √ALT [U/L]).
The index was derived from data from 832 patients co-infected with HCV and human immunodeficiency virus.24 The Ishak staging system10 for fibrosis on liver biopsy was used for confirmation, with stage 4 to 6 defined as advanced fibrosis. A cutoff value of more than 3.25 had a positive predictive value of 65% for advanced fibrosis, and to exclude advanced fibrosis, a cutoff value of less than 1.45 had a negative predictive value of 90%.
The FIB-4 index has since been validated in patients with HCV infection25 and NAFLD.26 In a subsequent study in 142 patients with NAFLD, the FIB-4 index was more accurate in diagnosing advanced fibrosis than the other noninvasive prediction models discussed below.27
NAFLD fibrosis score
The NAFLD fibrosis score, constructed and validated only in patients with biopsy-confirmed NAFLD, incorporates age, body mass index, presence of diabetes or prediabetes, albumin level, platelet count, and AST and ALT levels.
A group of 480 patients was used to construct the score, and 253 patients were used to validate it. Using the high cutoff value of 0.676, the presence of advanced fibrosis was diagnosed with a positive predictive value of 90% in the group used to construct the model (82% in the validation group). Using the low cutoff score of –1.455, advanced fibrosis could be excluded with a negative predictive value of 93% in the construction group and 88% in the validation group.28 A score between the cutoff values merits liver biopsy to determine fibrosis stage. The score is more accurate in patients with diabetes.29 When used by primary care physicians, the NAFLD fibrosis score is more cost-effective than transient elastography and liver biopsy for accurately predicting advanced fibrosis.30
AST-to-platelet ratio index score for HCV, NAFLD
The AST-to-platelet ratio index (APRI) score was developed in 2003 using a cohort of 270 patients with HCV and liver biopsy as the standard. A cutoff value of less than or equal to 0.5 had a negative predictive value of 86% for the absence of significant fibrosis, while a score of more than 1.5 detected the presence of significant fibrosis with a positive predictive value of 88%.31 The APRI score was subsequently validated for NAFLD.27,32
FibroSure uses a patented formula
FibroSure (LabCorp; labcorp.com) uses a patented mathematical formula that takes into account age, sex, and levels of gamma-glutamyl transferase, total bilirubin, haptoglobin, apolipoprotein-A, and alpha-2 macroglobulin to assess fibrosis. Developed in 2001 for use in patients with HCV infection, it was reported to have a positive predictive value of greater than 90% and a negative predictive value of 100% for clinically significant fibrosis, defined as stage 2 to 4 based on the METAVIR staging system in the prediction model.33 The use of FibroSure in patients with HCV was subsequently validated in various meta-analyses and systematic reviews.34,35 It is less accurate in patients with normal ALT levels.36
FibroSure also has good accuracy for predicting fibrosis stage in chronic liver disease due to other causes, including NAFLD.37
The prediction models discussed above use routine laboratory tests for chronic liver disease and thus are inexpensive. The high cost of additional testing needed for FibroSure, coupled with the risk of misdiagnosis, makes its cost-effectiveness questionable.38
IMAGING TO PREDICT FIBROSIS STAGE
Conventional ultrasonography (with or without vascular imaging) and computed tomography can detect cirrhosis on the basis of certain imaging characteristics,39,40 including the nodular contour of the liver, caudate lobe hypertrophy, ascites, reversal of blood flow in the portal vein, and splenomegaly. However, they cannot detect fibrosis in its early stages.
The 3 methods discussed below provide more accurate fibrosis staging by measuring the velocity of shear waves sent across hepatic tissue. Because shear-wave velocity increases with liver stiffness, the fibrosis stage can be estimated from this information.41
Transient elastography
Transient elastography uses a special ultrasound transducer. It is highly accurate for predicting advanced fibrosis for almost all causes of chronic liver disease, including HCV infection42,43 and NAFLD.44 The cutoff values of wave velocity to estimate fibrosis stage differ by liver disease etiology.
Transient elastography should not be used to evaluate fibrosis in patients with acute hepatitis, which transiently increases liver stiffness, resulting in a falsely high fibrosis stage diagnosis.45 It is also not a good method for evaluating fibrosis in patients with biliary obstruction or extrahepatic venous congestion. Because liver stiffness can increase after eating,46 the test should be done under fasting conditions.
A significant limitation of transient elastography has been its poor accuracy in patients with obesity.47 This has been largely overcome with the use of a more powerful (XL) probe but is still a limitation for those with morbid obesity.48 Because many patients with NAFLD are obese, this limitation can be significant.
Transient elastography has gained popularity for evaluating fibrosis in patients with chronic liver disease for multiple reasons: it is cost-effective and results are highly reproducible, with low variation in results among different observers and in individual observers.49 Combined with a platelet count, it can also be used to detect the development of clinically significant portal hypertension in patients with cirrhosis, thus determining the need to screen for esophageal varices using endoscopy.50 Screening endoscopy can be avoided in patients whose liver stiffness remains below 20 kPa or whose platelet count is above 150 × 109/L.
Acoustic radiation force imaging
Unlike transient elastography, which requires a separate transducer probe to assess shear- wave velocity, acoustic radiation force imaging uses the same transducer for both this function and imaging. Different image modes are available when testing for liver stiffness, so a region of interest that is optimal for avoiding vascular structures or masses can be selected, increasing accuracy.51
Acoustic radiation force imaging has been tested in different causes of chronic liver disease, including HCV and NAFLD,52 with accuracy similar to that of transient elastography.53 For overweight and obese patients, acoustic radiation force imaging is more accurate than transient elastography using the XL probe.54 However, this method is still new, and we need more data to support using one method over the other.
Magnetic resonance elastography
Magnetic resonance elastography uses a special transducer placed under the rib cage to transmit shear waves concurrently with magnetic resonance imaging. It has been tested in patients with HCV and NAFLD and has been found to have better diagnostic accuracy than transient elastography and acoustic radiation force imaging.55,56 Patients must be fasting for better diagnostic accuracy57 and must hold their breath while elastography is performed. The need for breath-holding and the high cost limit the use of this method for assessing fibrosis.
BOTTOM LINE FOR ASSESSING FIBROSIS
- Younossi ZM, Stepanova M, Afendy M, et al. Changes in the prevalence of the most common causes of chronic liver diseases in the United States from 1988 to 2008. Clin Gastroenterol Hepatol 2011; 9(6):524–530.e1. doi:10.1016/j.cgh.2011.03.020
- Kochanek KD, Xu J, Murphy SL, Miniño AM, Kung H-C. Deaths: final data for 2009. Natl Vital Stat Rep 2011; 60(3):1–116. pmid:24974587
- Volk ML, Tocco RS, Bazick J, Rakoski MO, Lok AS. Hospital readmissions among patients with decompensated cirrhosis. Am J Gastroenterol 2012; 107(2):247–252. doi:10.1038/ajg.2011.314
- Vernon G, Baranova A, Younossi ZM. Systematic review: the epidemiology and natural history of non-alcoholic fatty liver disease and non-alcoholic steatohepatitis in adults. Aliment Pharmacol Ther 2011; 34(3):274–285. doi:10.1111/j.1365-2036.2011.04724.x
- Udompap P, Kim D, Kim WR. Current and future burden of chronic nonmalignant liver disease. Clin Gastroenterol Hepatol 2015; 13(12):2031–2041. doi:10.1016/j.cgh.2015.08.015
- Kim WR, Lake JR, Smith JM, et al. OPTN/SRTR 2016 annual data report: liver. Am J Transplant 2018; 18(suppl 1):172–253. doi:10.1111/ajt.14559
- Wong RJ, Aguilar M, Cheung R, et al. Nonalcoholic steatohepatitis is the second leading etiology of liver disease among adults awaiting liver transplantation in the United States. Gastroenterology 2015; 148(3):547–555. doi:10.1053/j.gastro.2014.11.039
- Ishak K, Baptista A, Bianchi L, et al. Histological grading and staging of chronic hepatitis. J Hepatol 1995; 22(6):696–699. pmid:7560864
- Bedossa P, Poynard T. An algorithm for the grading of activity in chronic hepatitis C. Hepatology 1996; 24(2):289–293. doi:10.1002/hep.510240201
- Kleiner DE, Brunt EM, Van Natta M, et al; Nonalcoholic Steatohepatitis Clinical Research Network. Design and validation of a histological scoring system for nonalcoholic fatty liver disease. Hepatology 2005; 41(6):1313–1321. doi:10.1002/hep.20701
- Everhart JE, Wright EC, Goodman ZD, et al; HALT-C Trial Group. Prognostic value of Ishak fibrosis stage: findings from the hepatitis C antiviral long-term treatment against cirrhosis trial. Hepatology 2010; 51(2):585–594. doi:10.1002/hep.23315
- Angulo P, Kleiner DE, Dam-Larsen S, et al. Liver fibrosis, but no other histologic features, is associated with long-term outcomes of patients with nonalcoholic fatty liver disease. Gastroenterology 2015; 149(2):389–397.e10. doi:10.1053/j.gastro.2015.04.043
- Lindor KD, Bru C, Jorgensen RA, et al. The role of ultrasonography and automatic-needle biopsy in outpatient percutaneous liver biopsy. Hepatology 1996; 23(5):1079–1083. doi:10.1002/hep.510230522
- Pasha T, Gabriel S, Therneau T, Dickson ER, Lindor KD. Cost-effectiveness of ultrasound-guided liver biopsy. Hepatology 1998; 27(5):1220–1226. doi:10.1002/hep.510270506
- Alessandria C, Debernardi-Venon W, Rizzetto M, Marzano A. Transjugular liver biopsy: a relatively simple procedure with an indefinite past and an expected brilliant future. J Hepatol 2008; 48(1):171–173. doi:10.1016/j.jhep.2007.10.001
- Kalambokis G, Manousou P, Vibhakorn S, et al. Transjugular liver biopsy—indications, adequacy, quality of specimens, and complications—a systematic review. J Hepatol 2007; 47(2):284–294. doi:10.1016/j.jhep.2007.05.001
- Ripoll C, Groszmann R, Garcia-Tsao G, et al; Portal Hypertension Collaborative Group. Hepatic venous pressure gradient predicts clinical decompensation in patients with compensated cirrhosis. Gastroenterology 2007; 133(2):481–488. doi:10.1053/j.gastro.2007.05.024
- Perrault J, McGill DB, Ott BJ, Taylor WF. Liver biopsy: complications in 1000 inpatients and outpatients. Gastroenterology 1978; 74(1):103–106. pmid:618417
- Janes CH, Lindor KD. Outcome of patients hospitalized for complications after outpatient liver biopsy. Ann Intern Med 1993; 118(2):96–98. pmid:8416324
- Bedossa P, Dargere D, Paradis V. Sampling variability of liver fibrosis in chronic hepatitis C. Hepatology 2003; 38(6):1449–1457. doi:10.1016/j.hep.2003.09.022
- Regev A, Berho M, Jeffers LJ, et al. Sampling error and intraobserver variation in liver biopsy in patients with chronic HCV infection. Am J Gastroenterol 2002; 97(10):2614–2618. doi:10.1111/j.1572-0241.2002.06038.x
- Goldin RD, Goldin JG, Burt AD, et al. Intra-observer and inter-observer variation in the histopathological assessment of chronic viral hepatitis. J Hepatol 1996; 25(5):649–654. pmid:8938541
- Intraobserver and interobserver variations in liver biopsy interpretation in patients with chronic hepatitis C. The French METAVIR Cooperative Study Group. Hepatology 1994; 20(1 Pt 1):15–20. pmid:8020885
- Sterling RK, Lissen E, Clumeck N, et al; APRICOT Clinical Investigators. Development of a simple noninvasive index to predict significant fibrosis in patients with HIV/HCV coinfection. Hepatology 2006; 43(6):1317–1325. doi:10.1002/hep.21178
- Vallet-Pichard A, Mallet V, Nalpas B, et al. FIB-4: an inexpensive and accurate marker of fibrosis in HCV infection. comparison with liver biopsy and fibrotest. Hepatology 2007; 46(1):32–36. doi:10.1002/hep.21669
- Shah AG, Lydecker A, Murray K, Tetri BN, Contos MJ, Sanyal AJ; Nash Clinical Research Network. Comparison of noninvasive markers of fibrosis in patients with nonalcoholic fatty liver disease. Clin Gastroenterol Hepatol 2009; 7(10):1104–1112. doi:10.1016/j.cgh.2009.05.033
- McPherson S, Stewart SF, Henderson E, Burt AD, Day CP. Simple non-invasive fibrosis scoring systems can reliably exclude advanced fibrosis in patients with non-alcoholic fatty liver disease. Gut 2010; 59(9):1265–1269. doi:10.1136/gut.2010.216077
- Angulo P, Hui JM, Marchesini G, et al. The NAFLD fibrosis score: A noninvasive system that identifies liver fibrosis in patients with NAFLD. Hepatology 2007; 45(4):846–854. doi:10.1002/hep.21496
- Goh GB, Pagadala MR, Dasarathy J, et al. Clinical spectrum of non-alcoholic fatty liver disease in diabetic and non-diabetic patients. BBA Clin 2015; 3:141–145. doi:10.1016/j.bbacli.2014.09.001
- Tapper EB, Hunink MG, Afdhal NH, Lai M, Sengupta N. Cost-effectiveness analysis: risk stratification of nonalcoholic fatty liver disease (NAFLD) by the primary care physician using the NAFLD fibrosis score. PLoS One 2016; 11(2):e0147237. doi:10.1371/journal.pone.0147237
- Wai CT, Greenson JK, Fontana RJ, et al. A simple noninvasive index can predict both significant fibrosis and cirrhosis in patients with chronic hepatitis C. Hepatology 2003; 38(2):518–526. doi:10.1053/jhep.2003.50346
- Calès P, Lainé F, Boursier J, et al. Comparison of blood tests for liver fibrosis specific or not to NAFLD. J Hepatol 2009; 50(1):165–173. doi:10.1016/j.jhep.2008.07.035
- Imbert-Bismut F, Ratziu V, Pieroni L, Charlotte F, Benhamou Y, Poynard T; MULTIVIRC Group. Biochemical markers of liver fibrosis in patients with hepatitis C virus infection: a prospective study. Lancet 2001; 357(9262):1069–1075. doi:10.1016/S0140-6736(00)04258-6
- Shaheen AA, Wan AF, Myers RP. FibroTest and FibroScan for the prediction of hepatitis C-related fibrosis: a systematic review of diagnostic test accuracy. Am J Gastroenterol 2007; 102(11):2589–2600. doi:10.1111/j.1572-0241.2007.01466.x
- Smith JO, Sterling RK. Systematic review: non-invasive methods of fibrosis analysis in chronic hepatitis C. Aliment Pharmacol Ther 2009; 30(6):557–576. doi:10.1111/j.1365-2036.2009.04062.x
- Sebastiani G, Vario A, Guido M, Alberti A. Performance of noninvasive markers for liver fibrosis is reduced in chronic hepatitis C with normal transaminases. J Viral Hepat 2007; 15(3):212–218. doi:10.1111/j.1365-2893.2007.00932.x
- Poynard T, Morra R, Halfon P, et al. Meta-analyses of FibroTest diagnostic value in chronic liver disease. BMC Gastroenterol 2007; 7:40. doi:10.1186/1471-230X-7-40
- Carlson JJ, Kowdley KV, Sullivan SD, Ramsey SD, Veenstra DL. An evaluation of the potential cost-effectiveness of non-invasive testing strategies in the diagnosis of significant liver fibrosis. J Gastroenterol Hepatol 2009; 24(5):786–791. doi:10.1111/j.1440-1746.2009.05778.x
- Aubé C, Oberti F, Korali N, et al. Ultrasonographic diagnosis of hepatic fibrosis or cirrhosis. J Hepatol 1999; 30(3):472–478. pmid:10190731
- Di Lelio A, Cestari C, Lomazzi A, Beretta L. Cirrhosis: diagnosis with sonographic study of the liver surface. Radiology 1989; 172(2):389–392. doi:10.1148/radiology.172.2.2526349
- Wong VW, Chan HL. Transient elastography. J Gastroenterol Hepatol 2010; 25(11):1726–1731. doi:10.1111/j.1440-1746.2010.06437.x
- Arena U, Vizzutti F, Abraldes JG, et al. Reliability of transient elastography for the diagnosis of advanced fibrosis in chronic hepatitis C. Gut 2008; 57(9):1288–1293. doi:10.1136/gut.2008.149708
- Ziol M, Handra-Luca A, Kettaneh A, et al. Noninvasive assessment of liver fibrosis by measurement of stiffness in patients with chronic hepatitis C. Hepatology 2005; 41(1):48–54. doi:10.1002/hep.20506
- Wong VW, Vergniol J, Wong GL, et al. Diagnosis of fibrosis and cirrhosis using liver stiffness measurement in nonalcoholic fatty liver disease. Hepatology 2010; 51(2):454–462. doi:10.1002/hep.23312
- Sagir A, Erhardt A, Schmitt M, Häussinger D. Transient elastography is unreliable for detection of cirrhosis in patients with acute liver damage. Hepatology 2007; 48(2):592–595. doi:10.1002/hep.22056
- Mederacke I, Wursthorn K, Kirschner J, et al. Food intake increases liver stiffness in patients with chronic or resolved hepatitis C virus infection. Liver Int 2009; 29(10):1500–1506. doi:10.1111/j.1478-3231.2009.02100.x
- Castéra L, Foucher J, Bernard PH, et al. Pitfalls of liver stiffness measurement: a 5-year prospective study of 13,369 examinations. Hepatology 2010; 51(3):828–835. doi:10.1002/hep.23425
- Wong VW, Vergniol J, Wong GL, et al. Liver stiffness measurement using XL probe in patients with nonalcoholic fatty liver disease. Am J Gastroenterol 2012; 107(12):1862–1871. doi:10.1038/ajg.2012.331
- Fraquelli M, Rigamonti C, Casazza G, et al. Reproducibility of transient elastography in the evaluation of liver fibrosis in patients with chronic liver disease. Gut 2007; 56(7):968–973. doi:10.1136/gut.2006.111302
- de Franchis R; Baveno VI Faculty. Expanding consensus in portal hypertension: report of the Baveno VI Consensus Workshop: stratifying risk and individualizing care for portal hypertension. J Hepatol 2015; 63(3):743–752. doi:10.1016/j.jhep.2015.05.022
- Friedrich-Rust M, Wunder K, Kriener S, et al. Liver fibrosis in viral hepatitis: noninvasive assessment with acoustic radiation force impulse imaging versus transient elastography. Radiology 2009; 252(2):595–604. doi:10.1148/radiol.2523081928
- Yoneda M, Suzuki K, Kato S, et al. Nonalcoholic fatty liver disease: US-based acoustic radiation force impulse elastography. Radiology 2010; 256(2):640–647. doi:10.1148/radiol.10091662
- Bota S, Herkner H, Sporea I, et al. Meta-analysis: ARFI elastography versus transient elastography for the evaluation of liver fibrosis. Liver Int 2013; 33(8):1138–1147. doi:10.1111/liv.12240
- Attia D, Bantel H, Lenzen H, Manns MP, Gebel MJ, Potthoff A. Liver stiffness measurement using acoustic radiation force impulse elastography in overweight and obese patients. Aliment Pharmacol Ther 2016; 44(4):366–379. doi:10.1111/apt.13710
- Cui J, Heba E, Hernandez C, et al. Magnetic resonance elastography is superior to acoustic radiation force impulse for the diagnosis of fibrosis in patients with biopsy-proven nonalcoholic fatty liver disease: a prospective study. Hepatology 2016; 63(2):453–461. doi:10.1002/hep.28337
- Huwart L, Sempoux C, Vicaut E, et al. Magnetic resonance elastography for the noninvasive staging of liver fibrosis. Gastroenterology 2008; 135(1):32–40. doi:10.1053/j.gastro.2008.03.076
- Jajamovich GH, Dyvorne H, Donnerhack C, Taouli B. Quantitative liver MRI combining phase contrast imaging, elastography, and DWI: assessment of reproducibility and postprandial effect at 3.0 T. PLoS One 2014; 9(5):e97355. doi:10.1371/journal.pone.0097355
- Lim JK, Flamm SL, Singh S, Falck-Ytter YT; Clinical Guidelines Committee of the American Gastroenterological Association. American Gastroenterological Association Institute guideline on the role of elastography in the evaluation of liver fibrosis. Gastroenterology 2017; 152(6):1536–1543. doi:10.1053/j.gastro.2017.03.017
- N, Feldstein AE. Noninvasive diagnosis of nonalcoholic fatty liver disease: are we there yet? Metabolism 2016; 65(8):1087–1095. doi:10.1016/j.metabol.2016.01.013
KEY POINTS
- Liver biopsy remains the gold standard for determining fibrosis stage but is expensive and entails risk of complications.
- For patients infected with HCV, fibrosis stage should be determined with transient elastography, a transthoracic ultrasonographic technique that measures shear-wave velocity.
- For patients with cirrhosis, transient elastography combined with a platelet count can detect developing portal hypertension and determine whether to screen for esophageal varices.
- For NAFLD, combined elastography and NAFLD fibrosis score—which incorporates patient characteristics and laboratory test results—should be used to determine the need for liver biopsy.