User login
Long COVID seen in patients with severe and mild disease
Findings from the cohort, composed of 113 COVID-19 survivors who developed ARDS after admission to a single center before to April 16, 2020, were presented online at the 31st European Congress of Clinical Microbiology & Infectious Diseases by Judit Aranda, MD, from Complex Hospitalari Moisés Broggi in Barcelona.
Median age of the participants was 64 years, and 70% were male. At least one persistent symptom was experienced during follow-up by 81% of the cohort, with 45% reporting shortness of breath, 50% reporting muscle pain, 43% reporting memory impairment, and 46% reporting physical weakness of at least 5 on a 10-point scale.
Of the 104 participants who completed a 6-minute walk test, 30% had a decrease in oxygen saturation level of at least 4%, and 5% had an initial or final level below 88%. Of the 46 participants who underwent a pulmonary function test, 15% had a forced expiratory volume in 1 second below 70%.
And of the 49% of participants with pathologic findings on chest x-ray, most were bilateral interstitial infiltrates (88%).
In addition, more than 90% of participants developed depression, anxiety, or PTSD, Dr. Aranda reported.
Not the whole picture
This study shows that sicker people – “those in intensive care units with acute respiratory distress syndrome” – are “more likely to be struggling with more severe symptoms,” said Christopher Terndrup, MD, from the division of general internal medicine and geriatrics at Oregon Health & Science University, Portland.
But a Swiss study, also presented at the meeting, “shows how even mild COVID cases can lead to debilitating symptoms,” Dr. Terndrup said in an interview.
The investigation of long-term COVID symptoms in outpatients was presented online by Florian Desgranges, MD, from Lausanne (Switzerland) University Hospital. He and his colleagues found that more than half of those with a mild to moderate disease had persistent symptoms at least 3 months after diagnosis.
The prevalence of long COVID has varied in previous research, from 15% in a study of health care workers, to 46% in a study of patients with mild COVID, 52% in a study of young COVID outpatients, and 76% in a study of patients hospitalized with COVID.
Dr. Desgranges and colleagues evaluated patients seen in an ED or outpatient clinic from February to April 2020.
The 418 patients with a confirmed COVID-19 diagnosis were compared with a control group of 89 patients who presented to the same centers during the same time frame with similar symptoms – cough, shortness of breath, or fever – but had a negative SARS-CoV-2 test.
The number of patients with comorbidities was similar in the COVID and control groups (34% vs. 36%), as was median age (41 vs. 36 years) and the prevalence of women (62% vs 64%), but the proportion of health care workers was lower in the COVID group (64% vs 82%; P =.006).
Symptoms that persisted for at least 3 months were more common in the COVID than in the control group (53% vs. 37%). And patients in the COVID group reported more symptoms than those in the control group after adjustment for age, gender, smoking status, comorbidities, and timing of the survey phone call.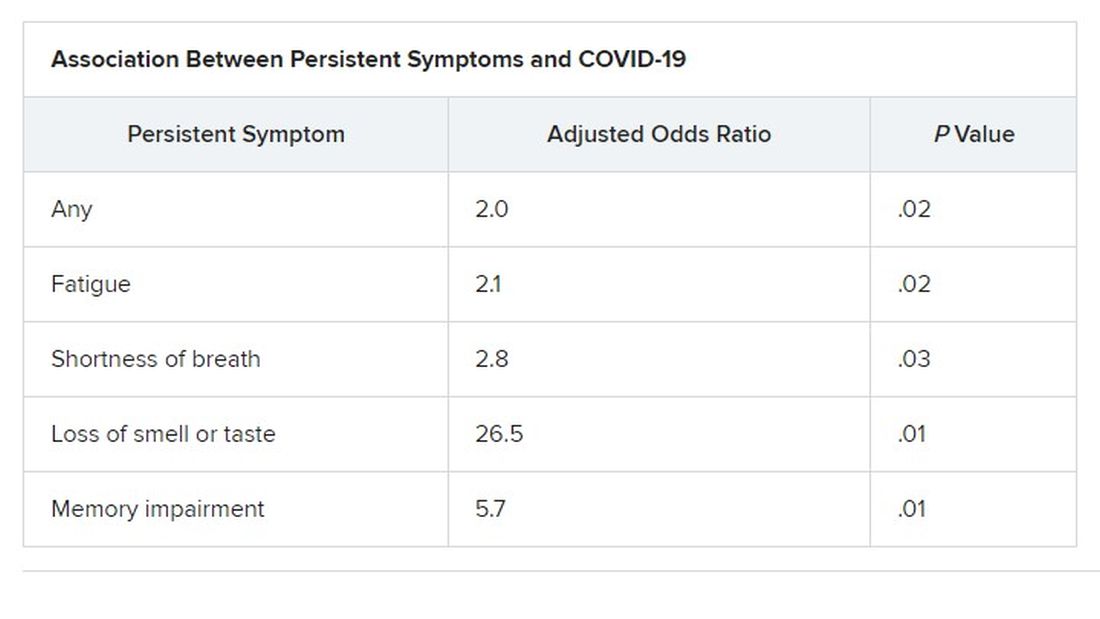
Levels of sleeping problems and headache were similar in the two groups.
“We have to remember that with COVID-19 came the psychosocial changes of the pandemic situation” Dr. Desgranges said.
This study suggests that some long-COVID symptoms – such as the fatigue, headache, and sleep disorders reported in the control group – could be related to the pandemic itself, which has caused psychosocial distress, Dr. Terndrup said.
Another study that looked at outpatients “has some fantastic long-term follow-up data, and shows that many patients are still engaging in rehabilitation programs nearly a year after their diagnosis,” he explained.
The COVID HOME study
That prospective longitudinal COVID HOME study, which assessed long-term symptoms in people who were never hospitalized for COVID, was presented online by Adriana Tami, MD, PhD, from the University Medical Center Groningen (the Netherlands).
The researchers visited the homes of patients to collect data, blood samples, and perform polymerase chain reaction (PCR) testing 1, 2, and 3 weeks after a diagnosis of COVID-19. If their PCR test was still positive, testing continued until week 6 or a negative test. In addition, participants completed questionnaires at week 2 and at months 3, 6 and 12 to assess fatigue, quality of life, and symptoms of depression and anxiety.
Three-month follow-up data were available for 134 of the 276 people initially enrolled in the study. Questionnaires were completed by 85 participants at 3 months, 62 participants at 6 months, and 10 participants at 12 months.
At least 40% of participants reported long-lasting symptoms at some point during follow-up, and at least 30% said they didn’t feel fully recovered at 12 months. The most common symptom was persistent fatigue, reported at 3, 6, and 12 months by at least 44% of participants. Other common symptoms – reported by at least 20% of respondents at 3, 6, and 12 months – were headache, mental or neurologic symptoms, and sleep disorders, shortness of breath, lack of smell or taste, and severe fatigue.
“We have a high proportion of nonhospitalized individuals who suffer from long COVID after more than 12 months,” Dr. Tami concluded, adding that the study is ongoing. “We have other variables that we want to look at, including duration viral shedding and serological results and variants.”
“These cohort studies are very helpful, but they can lead to inaccurate conclusions,” Dr. Terndrup cautioned.
They only provide pieces of the big picture, but they “do add to a growing body of knowledge about a significant portion of COVID patients still struggling with symptoms long after their initial infection. The symptoms can be quite variable but are dominated by both physical and mental fatigue, and tend to be worse in patients who were sicker at initial infection,” he said in an interview.
As a whole, these studies reinforce the need for treatment programs to help patients who suffer from long COVID, he added, but “I advise caution to folks suffering out there who seek ‘miracle cures’; across the world, we are collaborating to find solutions that are safe and effective.”
We are in desperate need of an equity lens in these studies.
“There is still a great deal to learn about long COVID,” said Dr. Terndrup. Data on underrepresented populations – such as Black, Indigenous, and people of color – are lacking from these and others studies, he explained. “We are in desperate need of an equity lens in these studies,” particularly in the United States, where there are “significant disparities” in the treatment of different populations.
However, “I do hope that this work can lead to a better understanding of how other viral infections can cause long-lasting symptoms,” said Dr. Terndrup.
“We have long proposed that after acute presentation, some microbes can cause chronic symptoms, like fatigue and widespread pain. Perhaps we can learn how to better care for these patients after learning from COVID’s significant impact on our societies across the globe.”
Dr. Aranda and Dr. Desgranges have disclosed no relevant financial relationships or study funding. The study by Dr. Tami’s team was funded by the University Medical Center Groningen Organization for Health Research and Development, and Connecting European Cohorts to Increase Common and Effective Response to SARS-CoV-2 Pandemic. Dr. Terndrup disclosed no relevant financial relationships.
A version of this article first appeared on Medscape.com.
FROM EUROPEAN CONGRESS OF CLINICAL MICROBIOLOGY & INFECTIOUS DISEASES
Resistant TB: Adjustments to BPaL regimen reduce AEs, not efficacy
Lower doses of linezolid in the BPaL drug regimen (bedaquiline, pretomanid, and linezolid) significantly reduce the adverse events associated with the treatment for patients with highly drug-resistant tuberculosis (TB) without compromising its high efficacy, new research shows.
“The ZeNix trial shows that reduced doses and/or shorter durations of linezolid appear to have high efficacy and improved safety,” said first author Francesca Conradie, MB, BCh, of the clinical HIV research unit, faculty of health sciences, University of Witwatersrand, Johannesburg, South Africa, in presenting the findings at the virtual meeting of the International AIDS Society conference.
As recently reported in the pivotal Nix-TB trial, the BPaL regimen yielded a 90% treatment success rate among people with highly drug-resistant forms of TB.
However, a 6-month regimen that included linezolid 1,200 mg resulted in toxic effects: 81% of patients in the study experienced peripheral neuropathy, and myelosuppression occurred in 48%. These effects often led to dose reductions or treatment interruption.
Adjustments in the dose of linezolid in the new ZeNix trial substantially reduced peripheral neuropathy to 13% and myelosuppression to 7%, with no significant reduction in the treatment response.
Importantly, the results were similar among patients with and those without HIV. This is of note because TB is the leading cause of death among patients with HIV.
“In the ZeNix trial, only 20% of patients were HIV infected, but in the [previous] Nix-TB trial, 30% were infected, so we have experience now in about 70 patients who were infected, and the outcomes were no different,” Dr. Conradie said in an interview.
Experts say the findings represent an important turn in the steep challenge of tackling highly resistant TB.
“In our opinion, these are exciting results that could change treatment guidelines for highly drug-resistant tuberculosis, with real benefits for the patients,” said Hendrik Streeck, MD, International AIDS Society cochair and director of the Institute of Virology and the Institute for HIV Research at the University Bonn (Germany), in a press conference.
Payam Nahid, MD, MPH, director of the Center for Tuberculosis at theUniversity of California, San Francisco, agreed.
“The results of this trial will impact global practices in treating drug-resistant TB as well as the design and conduct of future TB clinical trials,” Dr. Nahid said in an interview.
ZeNix trial
The phase 3 ZeNix trial included 181 patients with highly resistant TB in South Africa, Russia, Georgia, and Moldova. The mean age of the patients was 37 years; 67.4% were men, 63.5% were White, and 19.9% were HIV positive.
All patients were treated for 6 months with bedaquiline 200 mg daily for 8 weeks followed by 100 mg daily for 18 weeks, as well as pretomanid 200 mg daily.
The patients were randomly assigned to receive one of four daily doses of linezolid: 1,200 mg for 6 months (the original dose from the Nix-TB trial; n = 45) or 2 months (n = 46), or 600 mg for 6 or 2 months (45 patients each).
Percentages of patients with HIV were equal among the four groups, at about 20% each.
The primary outcomes – resolution of clinical disease and a negative culture status after 6 months – were observed across all linezolid dose groups. The success rate was 93% for those receiving 1,200 mg for 6 months, 89% for those receiving 1,200 mg for 2 months, 91% for those receiving 600 mg for 6 months, and 84% for those receiving 600 mg for 2 months.
With regard to the key adverse events of peripheral neuropathy and myelosuppression, manifested as anemia, the highest rates were among those who received linezolid 1,200 mg for 6 month, at 38% and 22%, respectively, compared with 24% and 17.4% among those who received 1,200 mg for 2 months, 24% and 2% among those who received 600 mg for 6 months, and 13% and 6.7% among those who received 600 mg for 2 months.
Four cases of optic neuropathy occurred among those who received 1,200 mg for 6 months; all cases resolved.
Patients who received 1,200 mg for 6 months required the highest number of linezolid dose modifications; 51% required changes that included reduction, interruption, or discontinuation, compared with 28% among those who received 1,200 mg for 2 months and 13% each in the other two groups.
On the basis of these results, “my personal opinion is that 600 mg at 6 months [of linezolid] is most likely the best strategy for the treatment of this highly resistant treatment population group,” Dr. Conradie told this news organization.
Findings represent ‘great news’ in addressing concerns
Dr. Nahid further commented that the results are highly encouraging in light of the ongoing concerns about the effects of linezolid in the BPaL regimen.
“This is great news,” he said. “The ZeNix trial addresses a key concern that providers and patients have had regarding the safety and tolerability of taking 6 months of linezolid at 1200 mg/d as part of the BPaL regimen.
“The findings that doses lower and durations shorter than the current 1,200 mg linezolid daily for 6 months will significantly expand the usability of the BPaL regimen worldwide.”
The inclusion of patients with HIV was essential in the trial, he noted.
“There are drug-drug interactions to be considered, among other factors that impact drug exposure,” Dr. Nahid said.
“Inclusion of patients living with HIV in this study means that any modifications to the BPaL regimen considered by the WHO [World Health Organization] and other policy decision makers will include data from this key population,” he said. “Of course, more data are needed on safety, tolerability, and efficacy on BPaL in general, and there are international cohorts and demonstration projects underway that will enhance our understanding of the regimen in HIV and in other special populations.”
The authors, Dr. Streeck, and Dr. Nahid have disclosed no relevant financial relationships.
This article was updated 7/21/21.
FROM IAS 2021
Fungemia, other fungal infections associated with s. Boulardii probiotics
Life-threatening fungal bloodstream infections associated with probiotic supplements have been reported in the journal Emerging Infectious Diseases by a group of researchers in Finland. While individuals consume these mixtures of bacteria and yeast in the hopes of “balancing” their microbiome or preventing diarrhea from antibiotic use, some died or developed yeast infections requiring prolonged antifungal treatment.
In a retrospective registry study at five university hospitals in Finland, the researchers found 46 patients between 2009 and 2018 with Saccharomyces sp. of yeast in their blood associated with ingesting probiotics. At least 20 (43%) had been using S. cerevisiae var. boulardii as a probiotic, with the organism then causing a bloodstream infection. Overall, 37% of the fungemic patients died.
Juha Rannikko, MD, lead author and infectious disease faculty member at Tampere University Hospital, Finland, said in an interview that there were an additional 1,153 nonblood isolates of Saccharomyces. He expressed surprise at the large number of nonblood isolates, saying: “If extrapolated ... it is about 10 nonblood Saccharomyces boulardii–associated findings for each Saccharomyces boulardii–associated fungemia.”
Most of the yeast infections (59%) occurred in patients with underlying gastrointestinal disease. Prior studies suggested that patients receiving enteral nutrition might become ill from translocation of the yeast from the inflamed GI tract.
If there were positive cultures for yeast from sites other than blood, physicians changed the antibiotics in 38% of patients.
Conventional wisdom has been that patients receiving broad-spectrum antibiotics should also receive an S. cerevisiae var. boulardii probiotic to prevent Clostridioides difficile infections. Dr. Rannikko and coauthors questioned this, noting results of such studies of prophylaxis were equivocal. “There is not enough evidence that clinicians should use Saccharomyces (probiotics) alongside antibiotics,” Dr. Rannikko concluded.
Laila Woc-Colburn, MD, associate professor at the Emory University School of Medicine, Atlanta, told this news organization that although the study was well done and was published in Emerging Infectious Diseases, the findings do not represent an “emerging” infectious disease. “We have known this for a while – since the 1990s,” she said. Warnings about probiotics are part of the standard advice Dr. Woc-Colburn gives transplant, chemotherapy, or immunosuppressed patients. “Don’t do these probiotics, because this is what’s going to happen,” she tells them. And she told this news organization, “If I see this in the blood, the first question I’m going to ask my patients is ... what probiotic were you drinking?”
Dr. Woc-Colburn said the Finnish researchers “did their due diligence” when conducting the study. “They were clear on their limitations. And they came out to the same conclusion as the 2005 Muñoz paper: That if we have some GI disruption, we should not be taking probiotics.”
She acknowledged that the Emerging Infectious Diseases study adds a substantial number of cases to those previously reported in the literature and confirms previous findings and recommendations to avoid probiotics if immunosuppressed or acutely ill.
Dr. Rannikko and Dr. Woc-Coburn have reported no relevant financial relationships. Dr. Rannikko has received a lecture fee from Novo Nordisk and a virtual congress attendance fee from Roche.
A version of this article first appeared on Medscape.com.
Synthetic snake venom to the rescue? Potential uses in skin health and rejuvenation
1 This column discusses some of the emerging data in this novel area of medical and dermatologic research. For more detailed information, a review on the therapeutic potential of peptides in animal venom was published in 2003 (Nat Rev Drug Discov. 2003 Oct;2[10]:790-802).
The potential of peptides found in snake venom
Snake venom is known to contain carbohydrates, nucleosides, amino acids, and lipids, as well as enzymatic and nonenzymatic proteins and peptides, with proteins and peptides comprising the primary components.2
There are many different types of peptides in snake venom. The peptides and the small proteins found in snake venoms are known to confer a wide range of biologic activities, including antimicrobial, antihypertensive, analgesic, antitumor, and analgesic, in addition to several others. These peptides have been included in antiaging skin care products.3Pennington et al. have observed that venom-derived peptides appear to have potential as effective therapeutic agents in cosmetic formulations.4 In particular, Waglerin peptides appear to act with a Botox-like paralyzing effect and purportedly diminish skin wrinkles.5
Issues with efficacy of snake venom in skin care products
As with many skin care ingredients, what is seen in cell cultures or a laboratory setting may not translate to real life use. Shelf life, issues during manufacturing, interaction with other ingredients in the product, interactions with other products in the regimen, exposure to air and light, and difficulty of penetration can all affect efficacy. With snake venom in particular, stability and penetration make the efficacy in skin care products questionable.
The problem with many peptides in skin care products is that they are usually larger than 500 Dalton and, therefore, cannot penetrate into the skin. Bos et al. described the “500 Dalton rule” in 2000.6 Regardless of these issues, there are several publications looking at snake venom that will be discussed here.
Antimicrobial and wound healing activity
In 2011, Samy et al. found that phospholipase A2 purified from crotalid snake venom expressed antibacterial activity in vitro against various clinical human pathogens. The investigators synthesized peptides based on the sequence homology and ascertained that the synthetic peptides exhibited potent microbicidal properties against Gram-negative and Gram-positive (Staphylococcus aureus) bacteria with diminished toxicity against normal human cells. Subsequently, the investigators used a BALB/c mouse model to show that peptide-treated animals displayed accelerated healing of full-thickness skin wounds, with increased re-epithelialization, collagen production, and angiogenesis. They concluded that the protein/peptide complex developed from snake venoms was effective at fostering wound healing.7
In that same year, Samy et al. showed in vivo that the snake venom phospholipase A₂ (svPLA₂) proteins from Viperidae and Elapidae snakes activated innate immunity in the animals tested, providing protection against skin infection caused by S. aureus. In vitro experiments also revealed that svPLA₂ proteins dose dependently exerted bacteriostatic and bactericidal effects on S. aureus.8 In 2015, Al-Asmari et al. comparatively assessed the venoms of two cobras, four vipers, a standard antibiotic, and an antimycotic as antimicrobial agents. The methicillin resistant Staphylococcus aureus bacterium was the most susceptible, followed by Gram-positive S. aureus, Escherichia coli, Enterococcus faecalis, and Pseudomonas aeruginosa. While the antibiotic vancomycin was more effective against P. aeruginosa, the venoms more efficiently suppressed the resistant bacteria. The snake venoms had minimal effect on the fungus Candida albicans. The investigators concluded that the snake venoms exhibited antibacterial activity comparable to antibiotics and were more efficient in tackling resistant bacteria.9 In a review of animal venoms in 2017, Samy et al. reported that snake venom–derived synthetic peptide/snake cathelicidin exhibits robust antimicrobial and wound healing capacity, despite its instability and risk, and presents as a possible new treatment for S. aureus infections. They indicated that antimicrobial peptides derived from various animal venoms, including snakes, spiders, and scorpions, are in early experimental and preclinical development stages, and these cysteine-rich substances share hydrophobic alpha-helices or beta-sheets that yield lethal pores and membrane-impairing results on bacteria.10
New drugs and emerging indications
An ingredient that is said to mimic waglerin-1, a snake venom–derived peptide, is the main active ingredient in the Hanskin Syn-Ake Peptide Renewal Mask, a Korean product, which reportedly promotes facial muscle relaxation and wrinkle reduction, as the waglerin-1 provokes neuromuscular blockade via reversible antagonism of nicotinic acetylcholine receptors.2,4,5
Waheed et al. reported in 2017 that recent innovations in molecular research have led to scientific harnessing of the various proteins and peptides found in snake venoms to render them salutary, rather than toxic. Most of the drug development focuses on coagulopathy, hemostasis, and anticancer functions, but research continues in other areas.11 According to An et al., several studies have also been performed on the use of snake venom to treat atopic dermatitis.12
Conclusion
Snake venom is a substance known primarily for its extreme toxicity, but it seems to offer promise for having beneficial effects in medicine. Due to its size and instability, it is doubtful that snake venom will have utility as a topical application in the dermatologic arsenal. In spite of the lack of convincing evidence, a search on Amazon.com brings up dozens of various skin care products containing snake venom. Much more research is necessary, of course, to see if there are methods to facilitate entry of snake venom into the dermis and if this is even desirable.
Snake venom is, in fact, my favorite example of a skin care ingredient that is a waste of money in skin care products. Do you have any favorite “charlatan skincare ingredients”? If so, feel free to contact me, and I will write a column. As dermatologists, we have a responsibility to debunk skin care marketing claims not supported by scientific evidence. I am here to help.
Dr. Baumann is a private practice dermatologist, researcher, author, and entrepreneur who practices in Miami. She founded the Cosmetic Dermatology Center at the University of Miami in 1997. Dr. Baumann has written two textbooks and a New York Times Best Sellers book for consumers. Dr. Baumann has received funding for advisory boards and/or clinical research trials from Allergan, Galderma, Revance, Evolus, and Burt’s Bees. She is the CEO of Skin Type Solutions Inc., a company that independently tests skin care products and makes recommendations to physicians on which skin care technologies are best. Write to her at [email protected].
References
1. Nguyen JK et al. J Cosmet Dermatol. 2020 Jul;19(7):1555-69.
2. Munawar A et al. Snake venom peptides: tools of biodiscovery. Toxins (Basel). 2018 Nov 14;10(11):474.
3. Almeida JR et al. Curr Med Chem. 2017;24(30):3254-82.
4. Pennington MW et al. Bioorg Med Chem. 2018 Jun 1;26(10):2738-58.
5. Debono J et al. J Mol Evol. 2017 Jan;84(1):8-11.
6. Bos JD, Meinardi MM. Exp Dermatol. 2000 Jun;9(3):165-9.
7. Samy RP et al. Methods Mol Biol. 2011;716:245-65.
8. Samy RP et al. Curr Med Chem. 2011;18(33):5104-13.
9. Al-Asmari AK et al. Open Microbiol J. 2015 Jul;9:18-25.
10. Perumal Samy R et al. Biochem Pharmacol. 2017 Jun 15;134:127-38.
11. Waheed H et al. Curr Med Chem. 2017;24(17):1874-91.
12. An HJ et al. Br J Pharmacol. 2018 Dec;175(23):4310-24.
The febrile infant: New AAP guidance for the first 2 months of life
Sixteen years in the making, the American Academy of Pediatrics just released a new clinical practice guideline (CPG), “Evaluation and Management of Well-Appearing Febrile Infants 8-60 Days Old”. The recommendations were derived from interpretations of sequential studies in young, febrile, but well-appearing infants that covered invasive bacterial infection (IBI) incidence, diagnostic modalities, and treatment during the first 2 months of life, further refining approaches to evaluation and empirical treatment.
Pediatricians have long had solid information to help assess the risk for IBI among febrile infants aged 0-3 months, but there has been an ongoing desire to further refine the suggested evaluation of these very young infants. A study of febrile infants from the Pediatric Research in Office Settings network along with subsequent evidence has identified the first 3 weeks of life as the period of highest risk for IBI, with risk declining in a graded fashion aged between 22 and 56 days.
Critical caveats
First, some caveats. Infants 0-7 days are not addressed in the CPG, and all should be treated as high risk and receive full IBI evaluation according to newborn protocols. Second, the recommendations apply only to “well-appearing” infants. Any ill-appearing infant should be treated as high risk and receive full IBI evaluation and begun on empirical antimicrobials. Third, even though the CPG deals with infants as young as 8-21 days old, the recommendations are to treat all infants in this age group as high risk, even if well-appearing, and complete full IBI evaluation and empirical therapy while awaiting results. Fourth, these guidelines apply only to infants born at 37 weeks’ gestation or more. Finally, the new CPG action statements are meant to be recommendations rather than a standard of medical care, leaving some leeway for clinician interpretation of individual patient scenarios. Where appropriate, parents’ values and preferences should be incorporated as part of shared decision-making.
The CPG divides young, febrile infants into three cohorts based on age:
- 8-21 days old
- 22-28 days old
- 29-60 days old
Age 8-21 days
For well-appearing febrile infants 8-21 days old, the CPG recommends a complete IBI evaluation that includes urine, blood, and cerebrospinal fluid (CSF) for culture, approaching all infants in this cohort as high risk. Inflammatory markers may be obtained, but the evidence is not comprehensive enough to evaluate their role in decision-making for this age group. A two-step urine evaluation method (urine analysis followed by culture if the urine analysis looks concerning) is not recommended for infants aged 8-21 days. Urine samples for culture from these young infants should be obtained by catheterization or suprapubic aspiration.
The CPG recommends drawing blood cultures and CSF by lumbar puncture from this cohort. These infants should be admitted to the hospital, treated empirically with antimicrobials, and actively monitored. However, if the cultures are negative at 24-36 hours, the clinician should discontinue antimicrobials and discharge the infant if there is no other reason for continued hospitalization.
Age 22-28 days
Well-appearing, febrile infants 22-28 days old are in an intermediate-risk zone. The recommendation for infants in this cohort is to obtain a urine specimen by catheterization or suprapubic aspiration for both urine analysis and culture. Clinicians may consider obtaining urine samples for analysis noninvasively (e.g., urine bag) in this cohort, but this is not the preferred method.
Blood culture should be obtained from all infants in this group. Inflammatory markers can help clinicians identify infants at greater risk for IBI, including meningitis. Previous data suggested that inflammatory markers such as serum white blood cell counts greater than 11,000/mcL, a serum absolute neutrophil count of greater than 4,000/mcL, and elevated C-reactive protein and procalcitonin levels could help providers identify febrile infants with true IBI. A 2008 study demonstrated that procalcitonin had the best receiver operating characteristic curve in regard to predicting IBI in young febrile infants. Other research backed up that finding and identified cutoff values for procalcitonin levels greater than 1.0 ng/mL. The CPG recommends considering a procalcitonin value of 0.5 ng/mL or higher as positive, indicating that the infant is at greater risk for IBI and potentially should undergo an expanded IBI workup. Therefore, in infants aged 22-28 days, inflammatory markers can play a role in deciding whether to perform a lumbar puncture.
Many more nuanced recommendations for whether to and how to empirically treat with antimicrobials in this cohort can be found in the CPG, including whether to manage in the hospital or at home. Treatment recommendations vary greatly for this cohort on the basis of the tests obtained and whether tests were positive or negative at the initial evaluation.
Age 29-60 days
The CPG will be most helpful when clinicians are faced with well-appearing, febrile infants in the 29- to 60-day age group. As with the other groups, a urine evaluation is recommended; however, the CPG suggests that the two-step approach – obtaining a urine analysis by a noninvasive method and only obtaining culture if the urine analysis is positive – is reasonable. This means that a bag or free-flowing urine specimen would be appropriate for urinalysis, followed by catheterization/suprapubic aspiration if a culture is necessary. This would save approximately 90% of infants from invasive urine collection. Regardless, only catheter or suprapubic specimens are appropriate for urine culture.
The CPG also recommends that clinicians obtain blood culture on all of these infants. Inflammatory markers should be assessed in this cohort because avoiding lumbar puncture for CSF culture would be appropriate in this cohort if the inflammatory markers are negative. If CSF is obtained in this age cohort, enterovirus testing should be added to the testing regimen. Again, for any infant considered at higher risk for IBI on the basis of screening tests, the CPG recommends a 24- to 36-hour rule-out period with empirical antimicrobial treatment and active monitoring in the hospital.
Summary
The recommended approach for febrile infants 8-21 days old is relatively aggressive, with urine, blood, and CSF evaluation for IBI. Clinicians gain some leeway for infants age 22-28 days, but the guidelines recommend a more flexible approach to evaluating well-appearing, febrile infants age 29-60 days, when a two-step urine evaluation and inflammatory marker assessment can help clinicians and parents have a better discussion about the risk-benefit trade-offs of more aggressive testing and empirical treatment.
The author would like to thank Ken Roberts, MD, for his review and helpful comments on this summary of the CPG highlights. Summary points of the CPG were presented by the writing group at the 2021 Pediatric Academic Societies meeting.
William T. Basco, Jr, MD, MS, is a professor of pediatrics at the Medical University of South Carolina, Charleston, and director of the division of general pediatrics. He is an active health services researcher and has published more than 60 manuscripts in the peer-reviewed literature.
A version of this article first appeared on Medscape.com.
Why Size (of Your Differential) Matters
ANSWER
The correct answer is all of the above (choice “f”).
DISCUSSION
The most likely diagnostic explanation for this patient’s presentation is erythema annulare centrifugum (EAC; choice “c”). However, this diagnosis is often difficult to establish, in part because of the broad differential and also because the very existence of EAC is far from well established.
The overwhelming consensus is that EAC represents a hypersensitivity reaction to an unknown antigen. It can be triggered by a wide variety of micro-organisms, stress, or even pregnancy.
In this case, there was no clinical or historical reason to suspect an underlying cancer, Lyme disease, or lupus, nor did the biopsy results suggest any of these.
The key takeaway here is to urge providers to avoid jumping onto a diagnostic bandwagon before considering a wider differential. Indeed, size matters when it relates to the length of one’s differential diagnosis list. If you don’t consider it, you can’t diagnose it.
TREATMENT
Fortunately, EAC nearly always resolves, with or without treatment. This patient received reassurance as such but was scheduled to return for a check of his lesions in 2 months. At that point, they had resolved.

A 50-year-old man is astonished when his “fungal infection” fails to respond to an unknown OTC topical cream a friend advised him to use.
For several weeks, he’s been plagued by the slightly itchy lesions that appeared on his leg without known cause. His friend assured him that the shape and configuration of the lesions could only represent one thing: “ringworm,” that is, fungal infection.
However, in clinic, the patient denies any contact with animals or children and reports that his job is inside only, never involving the great outdoors. He has felt fine throughout the lesions’ tenure, going so far as to say he is “in perfect health.” He has been in a mutually monogamous relationship for many years.
The lesions (4 in total) are located on the medial aspect of the left leg, extending into the popliteal area. At first glance, they appear to be peripherally scaly, pink, and annular. Close inspection reveals that most of the scaling is not on the outer edge; it is confined to the inside of the border, a phenomenon termed trailing or centripetal scaling. The lesions all show an arciform morphology in the shape of a “C.”
KOH examination of the scale shows no fungal elements. Shave biopsy reveals a dense perivascular lymphocytic infiltrate, moderate parakeratosis, and perhaps most importantly, no fungal elements in the stratum corneum.
There are no palpable lymph nodes in the groin on the affected side.

Syphilis prevalence in MSM 15 times higher than in general population
Worldwide, nearly 8% of men who have sex with men (MSM) may have syphilis, a new systematic review and meta-analysis suggests. This estimate, generated from 275 studies across 77 countries, is 15 times greater than the most recent estimates of syphilis prevalence in men in a general population.
“That disparity is absolutely unacceptable,” Matthew Chico, PhD, associate professor at the London School of Hygiene and Tropical Medicine, and senior author of the review, said in an interview.
Although the World Health Organization (WHO) aims to reduce the global prevalence of syphilis by 90% by 2030, an ambitious goal set in 2016, recent research suggests syphilis numbers are moving in the opposite direction. Cases in the United States rose 74% between 2015 and 2019, and other nations, such as Australia, South Korea, and the United Kingdom, are seeing similar trends.
Syphilis prevalence is generally higher in MSM, largely in subpopulations of men who have multiple sexual partners, Kenneth Mayer, MD, said in an interview. Dr. Mayer is medical research director at the Fenway Institute, Boston, and was not involved with the study.
Health literacy, lack of access to care, and medical mistrust can all be challenges to screening, identifying, and treating the infection in this population.
Reducing syphilis cases will require focusing interventions on higher-risk groups such as MSM, said Dr. Chico; however, there was “a real dearth in knowledge about the most likely prevalence of syphilis among MSM on a global level,” he said.
To help fill in the gaps, Dr. Chico and his research team collected studies that included syphilis prevalence data for MSM published between Jan. 1, 2000, and Feb. 1, 2020. Researchers excluded studies that included only MSM living with HIV, injection drug users, patients who routinely visit sexually transmitted infection (STI) clinics, and people seeking care only for STIs or other genital symptoms, because these studies would have skewed global syphilis prevalence estimates higher.
Their review, published July 8 in The Lancet Global Health, found that the pooled global prevalence of syphilis from 2000-2020 in MSM was 7.5%. It ranged from 1.9% in Australia and New Zealand to 10.6% in Latin America and the Caribbean. In comparison, the WHO estimates that globally, 0.5% of men in a general population have syphilis, a 15-fold difference.
This elevated estimate is not surprising, and the review provides a more international view of syphilis. Earlier attempts to estimate the prevalence of syphilis among MSM were generally conducted in higher-income countries such as the United States, Dr. Mayer said. “It’s important that clinicians recognize that this is a global health issue, so they can do the appropriate screening.”
The review found that regions in which the prevalence of HIV was above 5% had higher rates of syphilis (8.7%) compared to regions in which the prevalence of HIV was below 5% (6.6%). Pooled syphilis prevalence estimates were also higher for lower-middle-income and upper-middle-income countries (8.7% and 8.6%, respectively).
Global syphilis prevalence dipped from 8.9% in studies from 2000 to 2009 to 6.6% in studies from 2010 to 2020. In Europe, Northern America, Latin America, the Caribbean, and Oceania (excluding Australia and New Zealand), syphilis prevalence estimates for 2015-2020 were higher compared with 2010-2014.
The authors acknowledged that there were some limitations to the study, particularly that regions of Eastern and Southeastern Asia contributed more than half (54.5%) of the global data points used in the study and accounted for more than 82% of the study’s participants. This highlights the lack of data from other regions around the world, Dr. Chico said.
Dr. Chico said these findings “serve as a clarion call to action” to focus interventions on groups at higher risk for syphilis, such as MSM, in the effort to drastically reduce syphilis cases around the world. Dr. Mayer agrees. “[Syphilis] is a readily diagnosable and treatable infection,” he said. “It definitely is something that we should be able to get a handle on, but that requires paying attention to the different subgroups who have particularly high rates of the infection.”
A version of this article first appeared on Medscape.com.
A healthy family who had been living in Brazil presented with crusted plaques on their extremities
Trypanosomatidae
Leishmaniasis is caused by protozoa of the family Trypanosomatidae, called Leishmania. The vector is a sandfly infected with the protozoa.1
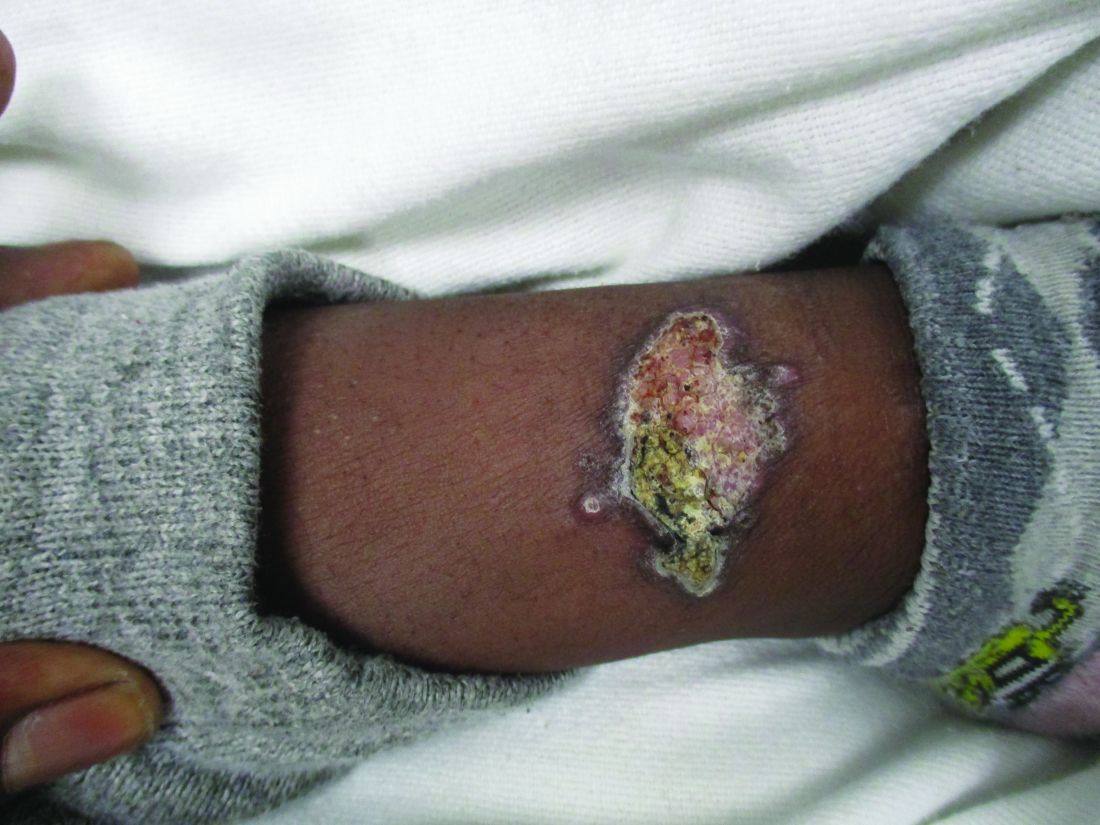
The three main forms of leishmaniasis – cutaneous, mucocutaneous, or visceral – varies with the species of organism involved, the geographic distribution, and the immune response of the patient. A majority of the cases seen in the United States are from patients who contracted the disease elsewhere, particularly from Peru and Brazil.2
Lesions can vary from asymptomatic to severe. The initial lesion typically develops within weeks or months, and presents as an erythematous papule that is seen at the bite site.3 The papule evolves into a nodule or plaque that may ulcerate and crust.3 The ulcer can be distinguished by a raised and distinct border. In older stages, atrophic scarring may be seen. In some cases, the lesions may present years after exposure, because of immunosuppression or trauma.
Histology of CL reveals tuberculoid granulomas with parasitized histiocytes present. Amastigotes with distinct nuclei and kinetoplasts characterize Leishmania.2 In addition to histology, the biopsy may be sent for the press-imprint-smear method (PIS). In a study of 75 patients, the PIS method showed a higher sensitivity, as well as being a less costly and more rapid option for diagnosis.5
The treatment depends on the severity of the lesion and the species of the Leishmania genus. Mild lesions may resolve spontaneously. Topical imiquimod, cryotherapy, photodynamic therapy, and heat therapy may aid in the healing process.5 Systemic azole antifungal medications, miltefosine, and amphotericin B, and pentamidine may be used for more persistent lesions. In very severe cases, pentavalent antimonials (sodium stibogluconate, Pentostam) may be administered intravenously, although there is a high occurrence of recorded side effects.2

This case and the photos were submitted by Sabrina Liao, BS, University of California, San Diego; and Brooke Resh Sateesh, MD, San Diego Family Dermatology The case was edited by Donna Bilu Martin, MD.
References
1. Leishmaniasis – Resources for Health Professionals. Centers for Disease Control and Prevention. 2021 Jun 3.
2. Stark CG. Leishmaniasis. Medscape. 2020 Feb 18.
3. Markle WH and Makhoul K. Am Fam Physician. 2004 Mar 15;69(6):1455-604.
4. Ngan V. Leishmaniasis. DermNet NZ. 2017 Jan. 7.
5. Sousa AQ et al. Am J Trop Med Hyg. 2014 Nov;91(5):905-7.
Trypanosomatidae
Leishmaniasis is caused by protozoa of the family Trypanosomatidae, called Leishmania. The vector is a sandfly infected with the protozoa.1
The three main forms of leishmaniasis – cutaneous, mucocutaneous, or visceral – varies with the species of organism involved, the geographic distribution, and the immune response of the patient. A majority of the cases seen in the United States are from patients who contracted the disease elsewhere, particularly from Peru and Brazil.2
Lesions can vary from asymptomatic to severe. The initial lesion typically develops within weeks or months, and presents as an erythematous papule that is seen at the bite site.3 The papule evolves into a nodule or plaque that may ulcerate and crust.3 The ulcer can be distinguished by a raised and distinct border. In older stages, atrophic scarring may be seen. In some cases, the lesions may present years after exposure, because of immunosuppression or trauma.
Histology of CL reveals tuberculoid granulomas with parasitized histiocytes present. Amastigotes with distinct nuclei and kinetoplasts characterize Leishmania.2 In addition to histology, the biopsy may be sent for the press-imprint-smear method (PIS). In a study of 75 patients, the PIS method showed a higher sensitivity, as well as being a less costly and more rapid option for diagnosis.5
The treatment depends on the severity of the lesion and the species of the Leishmania genus. Mild lesions may resolve spontaneously. Topical imiquimod, cryotherapy, photodynamic therapy, and heat therapy may aid in the healing process.5 Systemic azole antifungal medications, miltefosine, and amphotericin B, and pentamidine may be used for more persistent lesions. In very severe cases, pentavalent antimonials (sodium stibogluconate, Pentostam) may be administered intravenously, although there is a high occurrence of recorded side effects.2
This case and the photos were submitted by Sabrina Liao, BS, University of California, San Diego; and Brooke Resh Sateesh, MD, San Diego Family Dermatology The case was edited by Donna Bilu Martin, MD.
References
1. Leishmaniasis – Resources for Health Professionals. Centers for Disease Control and Prevention. 2021 Jun 3.
2. Stark CG. Leishmaniasis. Medscape. 2020 Feb 18.
3. Markle WH and Makhoul K. Am Fam Physician. 2004 Mar 15;69(6):1455-604.
4. Ngan V. Leishmaniasis. DermNet NZ. 2017 Jan. 7.
5. Sousa AQ et al. Am J Trop Med Hyg. 2014 Nov;91(5):905-7.
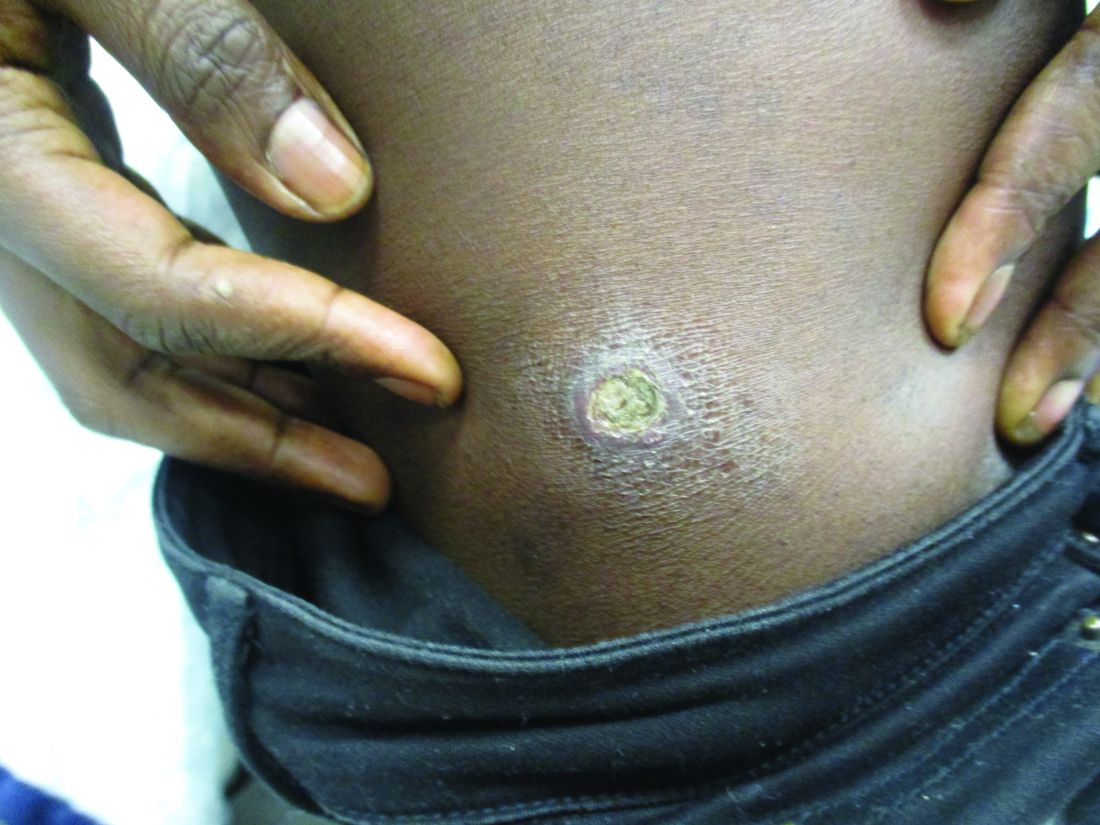
Children and COVID: New vaccinations drop as the case count rises
With only a quarter of all children aged 12-15 years fully vaccinated against COVID-19, first vaccinations continued to drop and new cases for all children rose for the second consecutive week.
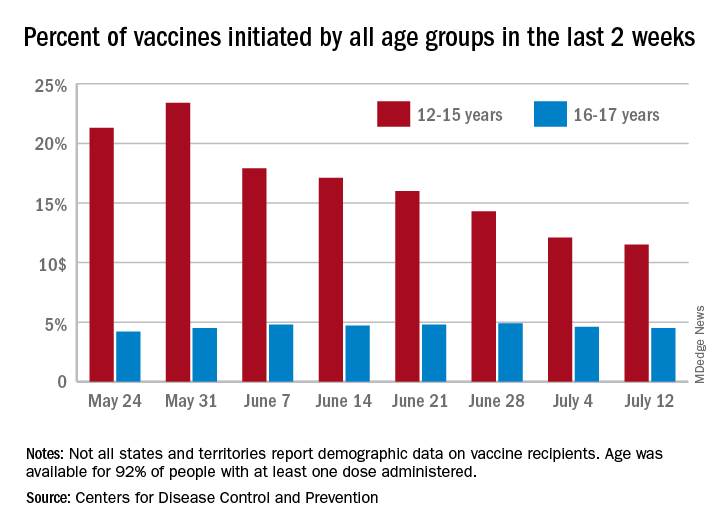
Just under 25% of children aged 12-15 had completed the vaccine regimen as of July 12, and just over one-third (33.5%) had received at least one dose. Meanwhile, that age group represented 11.5% of people who initiated vaccination during the 2 weeks ending July 12, down from 12.1% a week earlier, the Centers for Disease Control and Prevention said. The total number of new vaccinations for the week ending July 12 was just over 201,000, compared with 307,000 for the previous week.
New cases of COVID-19, however, were on the rise in children. The 19,000 new cases reported for the week ending July 8 were up from 12,000 a week earlier and 8,000 the week before that, according to a report from the American Academy of Pediatrics and the Children’s Hospital Association.
That report also shows that children made up 22.3% of all new cases during the week of July 2-8, compared with 16.8% the previous week, and that there were nine deaths in children that same week, the most since March. COVID-related deaths among children total 344 in the 46 jurisdictions (43 states, New York City, Puerto Rico, and Guam) that are reporting such data by age. “It is not possible to standardize more detailed age ranges for children based on what is publicly available from the states,” the two groups noted.
Such data are available from the CDC’s COVID Data Tracker, however, and they show that children aged 16-17 years, who became eligible for COVID vaccination before the younger age group, are further ahead in the process. Among the older children, almost 46% had gotten at least one dose and 37% were fully vaccinated by July 12.
With only a quarter of all children aged 12-15 years fully vaccinated against COVID-19, first vaccinations continued to drop and new cases for all children rose for the second consecutive week.
Just under 25% of children aged 12-15 had completed the vaccine regimen as of July 12, and just over one-third (33.5%) had received at least one dose. Meanwhile, that age group represented 11.5% of people who initiated vaccination during the 2 weeks ending July 12, down from 12.1% a week earlier, the Centers for Disease Control and Prevention said. The total number of new vaccinations for the week ending July 12 was just over 201,000, compared with 307,000 for the previous week.
New cases of COVID-19, however, were on the rise in children. The 19,000 new cases reported for the week ending July 8 were up from 12,000 a week earlier and 8,000 the week before that, according to a report from the American Academy of Pediatrics and the Children’s Hospital Association.
That report also shows that children made up 22.3% of all new cases during the week of July 2-8, compared with 16.8% the previous week, and that there were nine deaths in children that same week, the most since March. COVID-related deaths among children total 344 in the 46 jurisdictions (43 states, New York City, Puerto Rico, and Guam) that are reporting such data by age. “It is not possible to standardize more detailed age ranges for children based on what is publicly available from the states,” the two groups noted.
Such data are available from the CDC’s COVID Data Tracker, however, and they show that children aged 16-17 years, who became eligible for COVID vaccination before the younger age group, are further ahead in the process. Among the older children, almost 46% had gotten at least one dose and 37% were fully vaccinated by July 12.
Standard medical mask can protect wearer from aerosols
A standard medical face mask is more effective at preventing the wearer from inhaling aerosols without causing substantial breathing resistance than various cloth, medical, or respirator masks, new research shows.
“Medical face masks with good filtration efficacies can provide even better protective effects than KN95 respirators,” Christian Sterr, MD, from Philipps University of Marburg (Germany), and colleagues wrote. “FFP2 respirators, on the other hand, could be useful in high-risk situations but require greater breathing effort and therefore physical stress for users.”
Extensive evidence has shown that face masks are an excellent form of source control, preventing infectious people from spreading the SARS-CoV-2 virus into the environment. But evidence has been less clear about how well masks protect the wearer from inhaling particles containing the virus.
The researchers conducted three experiments to test 32 different face masks. The findings were presented at the 31st European Congress of Clinical Microbiology & Infectious Diseases and published online in PLOS One .
First they tested pressure drop, which “relates to how easily air can pass through the material,” said Chris Cappa, PhD, professor of civil and environmental engineering at the University of California, Davis, who was not involved with the study.
“Higher pressure drops mean that there is greater resistance to the air passing through. A higher pressure drop will typically mean breathing through the material will be slightly more challenging, compared to a low pressure drop. There is no relationship between pressure drop and the mask effectiveness,” he said in an interview.
Pressure drop was lowest with type II medical face masks, the typical three-ply surgical masks designed to stop large particles expelled by the wearer from entering the environment, was highest with respirators, including KN95 and FFP2 masks, and varied with the different cloth masks tested.
Next the researchers compared filtration efficacy, which “refers to how well the material removes particles from the air that passes through the mask material,” Dr. Cappa explained. They did this by placing each mask over the opening to an air collector that measured how many particles got through. “A mask that has 100% filtration efficacy will remove all particles from the air that passes through it and 0% means that no particles are removed.”
Cloth masks had the lowest filtration efficacy, at 28%. Certified face masks that met European Standards had a relatively high efficacy, at 70%; for uncertified face masks, filtration efficacy was 63%. As expected, KN95 and FFP2 masks had the highest filtration efficacy, at 94% and 98%, respectively.Finally, the researchers tested as-worn filtration efficacies. They placed each mask on a dummy head with an artificial airway that collected airborne particles. They then pumped a mixture of aerosol particles – ranging in size from 0.3 to 2.0 mcm – and particle-free pressurized air into the air-proof acrylic chamber in which the head was placed.
In this experiment, cloth masks and noncertified face masks were least effective, filtering less than 20% of aerosols. Interestingly, the cloth face mask with the highest filtration on its own (84%) had the lowest filtration efficacy (9%), apparently because of its very high pressure drop (breathing resistance). When more effort is required to breathe through a mask, more air can bypass the filtration system.
Type II medical face masks, however, filtered 47% of aerosols, KN95 masks filtered 41%, and FFP2 masks filtered 65%. Face shields did not prevent the inhalation of any aerosols.
“We know that face shields will only be effective in stopping very large droplets, essentially visible spittle,” Dr. Cappa explained. “Most of the particles that we exhale will travel right around a face shield.”
The “optimal mask effect is a combination of high filter performance and low filter resistance,” which applies to most of the FFP2 and medical type II face masks tested, Dr. Sterr and colleagues wrote. “The type II medical masks in our random sample showed very good as-worn filtration performances with a low additional work of breathing at the same time.”
Although this study showed how well different masks filtered out particles, it could not assess how well different masks prevent actual infection.
“Like any virus, SARS-CoV-2 can only infect people as long as it is viable,” the researchers wrote. “Moreover, a certain number of viable virus particles need to be inhaled to trigger an infection. Thus, the assessed filtration efficacy may differ from the provided protection rate against SARS-CoV-2.”
In addition, particles containing the virus could dry out while going through the mask and become less infectious. “Even a small reduction in inhaled particles might prevent infection or at least lead to a less severe infection,” they noted.
In fact, filtration efficacy does not necessarily indicate how well the mask filters out particles while being worn. “This might be due to the combined effects of mask fit and pressure drop of the mask material and therefore tendency for mask leakage,” the team wrote. “High pressure drop results in higher breathing resistance and therefore supports leakage, especially if combined to a loosely fitting mask.”
These findings are “in line with what we already knew,” Dr. Cappa explained. “Even if the mask material filters out nearly all particles that pass through it, as is the case for high-efficiency masks such as N95 and FFP2, if the mask does not fit well, then it will only provide moderate protection for the wearer.”
Although the findings reaffirm the different levels of filtration provided by various cloth masks, they do not “provide any guidance on which types of cloth masks are better or worse,” he said. But they do show that “medical face masks will generally provide more protection to the wearer.”
It’s not surprising that face shields offer little protection from aerosols, Dr. Cappa said, but they can provide added protection when worn with a mask.
“A face shield could prevent large droplets that might shoot out when a person coughs or sneezes from depositing on a person’s eye,” he pointed out. And it can help “redirect the plume of particles that an infected person exhales, which could be useful in close quarters. However, even then those particles will keep moving around and could be inhaled. A mask can really help to decrease the amount inhaled.”
The study did not use external funding. The authors and Dr. Cappa disclosed no relevant financial relationships.
A version of this article first appeared on Medscape.com.