User login
Right upper-abdominal pain in a 97-year-old
A 97-year-old man has had right upper-abdominal pain intermittently for 2 weeks. He has hypertension, stage IV chronic kidney disease, chronic obstructive pulmonary disease, and constipation. He has never had abdominal surgery.
He describes his pain as mild and dull. It does not radiate to the right lower quadrant or the back and is not aggravated by eating. He reports no fever or changes in appetite or bowel habits during the last 2 weeks. His body temperature is 36.8°C, blood pressure 114/68 mm Hg, heart rate 86 beats per minute, and respiratory rate 16 times per minute.
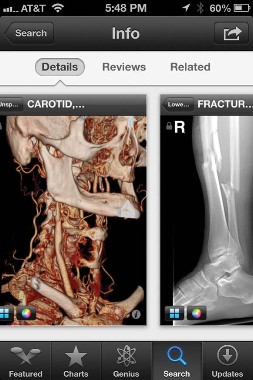
On physical examination, his abdomen is soft with no guarding and with hypoactive bowel sounds. No Murphy sign is noted. Hemography shows a normal white blood cell count of 7.8 × 10⁹/L) (reference range 4.5–11.0). Serum biochemistry studies show an alanine transaminase level of 23 U/L (5–50) and a lipase level of 40 U/L (12–70); the C-reactive protein level is 0.5 mg/dL (0.0–1.0). A sitting chest radiograph shows a focal gas collection over the right subdiaphragmatic area (Figure 1).
Q: Based on the information above, which is most likely the cause of this man’s upper-abdominal pain?
- Perforated viscera
- Diverticulitis
- Chilaiditi syndrome
- Subdiaphragmatic abscess
- Emphysematous cholecystitis
A: The workup of this patient did not indicate active disease, so the subphrenic gas on the radiograph most likely is the Chilaiditi sign. This is a benign finding that, in a patient with gastrointestinal symptoms (nausea, vomiting, constipation, upper-abdominal pain), is labeled Chilaiditi syndrome.
CHILAIDITI SIGN AND SYNDROME
The Chilaiditi sign1 describes a benign, incidental radiologic finding of subphrenic gas caused by interposition of colonic segments (or small intestine in rare cases) between the liver and the diaphragm. The radiologic finding is called the Chilaiditi sign if the patient is asymptomatic or Chilaiditi syndrome if the patient has gastrointestinal symptoms, as our patient did. The Chilaiditi sign is reportedly found in 0.02% to 0.2% of all chest and abdominal films.
Chilaiditi syndrome has a male predominance.2 Predisposing factors include an atrophic liver, laxity of the hepatic or the transverse colon suspension ligament, abnormal fixation of the mesointestine, and diaphragmatic weakness. Other factors include advanced age; a history of abdominal surgery, adhesion, or intestinal obstruction3; chronic lung disease; and cirrhosis.4
Management is usually conservative, with a prokinetic agent or enema for constipation, and bed-rest or bowel decompression as needed, unless complications occur. Our patient’s extreme age, underlying chronic pulmonary disease, and constipation predisposed him to this rare gastrointestinal disorder.
In this patient, pain in the right upper quadrant initially suggested an inflammatory disorder involving the liver, gallbladder, and transverse or ascending colon. Right upper-quadrant pain with radiologic evidence of subphrenic air collection further raises suspicion of pneumoperitoneum from diverticulitis, bowel perforation, or gas-forming abscess. However, this patient’s normal transaminase level, low C-reactive protein value, and prolonged symptom course made hepatitis, cholecystitis, diverticulitis, and subdiaphragmatic abscess less likely. Nonetheless, severe intra-abdominal pathology can sometimes manifest with only minor symptoms in very elderly patients. Consequently, the main concern in this scenario was whether he had minor and undetected perforated viscera causing pneumoperitoneum with an indolent course, or rather a benign condition such as Chilaiditi syndrome causing pain and subphrenic air.
IS IT CHILAIDITI SYNDROME OR PNEUMOPERITONEUM?
Chilaiditi syndrome and perforated viscera both involve subphrenic air, but they differ radiologically and clinically. Radiologically, identification of haustra or plicae circulares within the gas collection or fixed subphrenic air upon postural change indicates the Chilaiditi sign and favors Chilaiditi syndrome as the origin of the symptoms. Pneumoperitoneum from perforated viscera is more likely if the abnormal gas collection changes its position upon postural change. Abdominal ultrasonography can also assist in diagnosis by showing a fixed air collection around the hepatic surface in the Chilaiditi sign. Definite radiologic diagnosis can be reached through abdominal computed tomography. Clinically, these two disorders may manifest different severity, as perforated viscera often mandate surgical attention, whereas Chilaiditi syndrome seldom requires surgical treatment (25% of cases).2
Patients with the Chilaiditi sign also may develop abdominal pathology other than Chilaiditi syndrome per se. In our patient, the subphrenic air displayed a faint contour of bowel segments. His symptom course, benign physical examination, and the lack of laboratory evidence of other intra-abdominal pathology led us to suspect Chilaiditi syndrome as the cause of his abdominal pain. A normal leukocyte count and stable vital signs made the diagnosis of a major life-threatening condition extremely unlikely. Subsequently, abdominal sonography done at the bedside disclosed fixed colonic segments between the liver and the diaphragm. No hepatic or gallbladder lesions were detected. Chilaiditi syndrome was confirmed.
TAKE-HOME MESSAGE
As seen in this case, the accurate diagnosis rests on a careful physical examination and laboratory evaluation but, most importantly, on sound clinical judgment. Right upper-quadrant pain is often encountered in primary care practice and has many diagnostic possibilities, including benign, self-limited conditions such as Chilaiditi syndrome. It is vital to distinguish between benign conditions and severe life-threatening disorders such as hollow organ perforation so as not to operate on patients who can be managed conservatively.
- Chilaiditi D. Zur Frage der Hepatoptose und Ptose in allegemeinen in Anschluss an drei Fälle von temporärer, partieller Lebersverlagerung. Fortschr Geb Röntgenstr Nuklearmed Erganzungsband 1910; 16:173–208.
- Saber AA, Boros MJ. Chilaiditi’s syndrome: what should every surgeon know? Am Surg 2005; 71:261–263.
- Lo BM. Radiographic look-alikes: distinguishing between pneumoperitoneum and pseudopneumoperitoneum. J Emerg Med 2010; 38:36–39.
- Fisher AA, Davis MW. An elderly man with chest pain, shortness of breath, and constipation. Postgrad Med J 2003; 79:180,183–184.
A 97-year-old man has had right upper-abdominal pain intermittently for 2 weeks. He has hypertension, stage IV chronic kidney disease, chronic obstructive pulmonary disease, and constipation. He has never had abdominal surgery.
He describes his pain as mild and dull. It does not radiate to the right lower quadrant or the back and is not aggravated by eating. He reports no fever or changes in appetite or bowel habits during the last 2 weeks. His body temperature is 36.8°C, blood pressure 114/68 mm Hg, heart rate 86 beats per minute, and respiratory rate 16 times per minute.
On physical examination, his abdomen is soft with no guarding and with hypoactive bowel sounds. No Murphy sign is noted. Hemography shows a normal white blood cell count of 7.8 × 10⁹/L) (reference range 4.5–11.0). Serum biochemistry studies show an alanine transaminase level of 23 U/L (5–50) and a lipase level of 40 U/L (12–70); the C-reactive protein level is 0.5 mg/dL (0.0–1.0). A sitting chest radiograph shows a focal gas collection over the right subdiaphragmatic area (Figure 1).
Q: Based on the information above, which is most likely the cause of this man’s upper-abdominal pain?
- Perforated viscera
- Diverticulitis
- Chilaiditi syndrome
- Subdiaphragmatic abscess
- Emphysematous cholecystitis
A: The workup of this patient did not indicate active disease, so the subphrenic gas on the radiograph most likely is the Chilaiditi sign. This is a benign finding that, in a patient with gastrointestinal symptoms (nausea, vomiting, constipation, upper-abdominal pain), is labeled Chilaiditi syndrome.
CHILAIDITI SIGN AND SYNDROME
The Chilaiditi sign1 describes a benign, incidental radiologic finding of subphrenic gas caused by interposition of colonic segments (or small intestine in rare cases) between the liver and the diaphragm. The radiologic finding is called the Chilaiditi sign if the patient is asymptomatic or Chilaiditi syndrome if the patient has gastrointestinal symptoms, as our patient did. The Chilaiditi sign is reportedly found in 0.02% to 0.2% of all chest and abdominal films.
Chilaiditi syndrome has a male predominance.2 Predisposing factors include an atrophic liver, laxity of the hepatic or the transverse colon suspension ligament, abnormal fixation of the mesointestine, and diaphragmatic weakness. Other factors include advanced age; a history of abdominal surgery, adhesion, or intestinal obstruction3; chronic lung disease; and cirrhosis.4
Management is usually conservative, with a prokinetic agent or enema for constipation, and bed-rest or bowel decompression as needed, unless complications occur. Our patient’s extreme age, underlying chronic pulmonary disease, and constipation predisposed him to this rare gastrointestinal disorder.
In this patient, pain in the right upper quadrant initially suggested an inflammatory disorder involving the liver, gallbladder, and transverse or ascending colon. Right upper-quadrant pain with radiologic evidence of subphrenic air collection further raises suspicion of pneumoperitoneum from diverticulitis, bowel perforation, or gas-forming abscess. However, this patient’s normal transaminase level, low C-reactive protein value, and prolonged symptom course made hepatitis, cholecystitis, diverticulitis, and subdiaphragmatic abscess less likely. Nonetheless, severe intra-abdominal pathology can sometimes manifest with only minor symptoms in very elderly patients. Consequently, the main concern in this scenario was whether he had minor and undetected perforated viscera causing pneumoperitoneum with an indolent course, or rather a benign condition such as Chilaiditi syndrome causing pain and subphrenic air.
IS IT CHILAIDITI SYNDROME OR PNEUMOPERITONEUM?
Chilaiditi syndrome and perforated viscera both involve subphrenic air, but they differ radiologically and clinically. Radiologically, identification of haustra or plicae circulares within the gas collection or fixed subphrenic air upon postural change indicates the Chilaiditi sign and favors Chilaiditi syndrome as the origin of the symptoms. Pneumoperitoneum from perforated viscera is more likely if the abnormal gas collection changes its position upon postural change. Abdominal ultrasonography can also assist in diagnosis by showing a fixed air collection around the hepatic surface in the Chilaiditi sign. Definite radiologic diagnosis can be reached through abdominal computed tomography. Clinically, these two disorders may manifest different severity, as perforated viscera often mandate surgical attention, whereas Chilaiditi syndrome seldom requires surgical treatment (25% of cases).2
Patients with the Chilaiditi sign also may develop abdominal pathology other than Chilaiditi syndrome per se. In our patient, the subphrenic air displayed a faint contour of bowel segments. His symptom course, benign physical examination, and the lack of laboratory evidence of other intra-abdominal pathology led us to suspect Chilaiditi syndrome as the cause of his abdominal pain. A normal leukocyte count and stable vital signs made the diagnosis of a major life-threatening condition extremely unlikely. Subsequently, abdominal sonography done at the bedside disclosed fixed colonic segments between the liver and the diaphragm. No hepatic or gallbladder lesions were detected. Chilaiditi syndrome was confirmed.
TAKE-HOME MESSAGE
As seen in this case, the accurate diagnosis rests on a careful physical examination and laboratory evaluation but, most importantly, on sound clinical judgment. Right upper-quadrant pain is often encountered in primary care practice and has many diagnostic possibilities, including benign, self-limited conditions such as Chilaiditi syndrome. It is vital to distinguish between benign conditions and severe life-threatening disorders such as hollow organ perforation so as not to operate on patients who can be managed conservatively.
- Chilaiditi D. Zur Frage der Hepatoptose und Ptose in allegemeinen in Anschluss an drei Fälle von temporärer, partieller Lebersverlagerung. Fortschr Geb Röntgenstr Nuklearmed Erganzungsband 1910; 16:173–208.
- Saber AA, Boros MJ. Chilaiditi’s syndrome: what should every surgeon know? Am Surg 2005; 71:261–263.
- Lo BM. Radiographic look-alikes: distinguishing between pneumoperitoneum and pseudopneumoperitoneum. J Emerg Med 2010; 38:36–39.
- Fisher AA, Davis MW. An elderly man with chest pain, shortness of breath, and constipation. Postgrad Med J 2003; 79:180,183–184.
Abdominal Pain in a Preschooler
Prefemoral Fat Pad Impingement Syndrome: Identification and Diagnosis
Two-Step Rule Sizes Up CT Pleural Effusions
CHICAGO – Researchers have developed and validated a simple two-step rule to quantify pleural effusion size on computed tomography – something currently not standardized.
Use of the rule significantly improved interobserver agreement, from a kappa coefficient of 0.56 to 0.79 (P less than .0001), among nine physicians ranging in skill from cardiothoracic radiologists and pulmonologists to radiology residents.
"It’s practical for any physician with access to the images and the referent tool, and conveys relevant information in terms of comparing effusion size and possibly guiding therapy," Dr. Matthew Moy said at the annual meeting of the Radiological Society of North America.
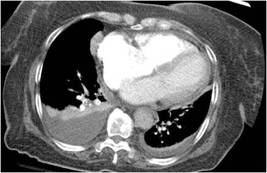
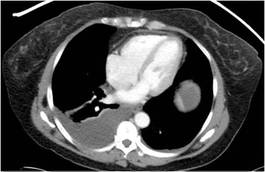
Computed tomography (CT) is highly sensitive for detecting small effusions, and differentiating pleural and parenchymal disease. The problem lies in the subjective grading of pleural effusion size and the wide variation in terminology between radiologists. These issues lead to confusion among physicians when reading CT reports or comparing effusions based on different reports, he said.
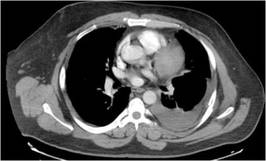
To illustrate his point, Dr. Moy showed three CT images of pleural effusions reported as being "small-moderate" to "moderate" to "large," although all three were similar in size.
In an effort to improve this communication, investigators at the Albert Einstein College of Medicine, New York, selected 34 adult CT scans, representing a wide range of pleural effusion sizes, and measured the volume of each effusion and ipsilateral hemithorax using a morphometric segmentation tool. The effusion and ipsilateral hemithorax were then manually traced on each axial slice, and the effusion volume calculated as a percent of the volume of the hemithorax to account for differences in body habitus, explained Dr. Moy.
The mean effusion volume was 37.42% of the hemithorax (range, 5.59%-89.05%). The patients’ mean age was 64 years, and 74% had undergone noncontrast CT.
Two cardiothoracic fellowship–trained radiologists then reviewed the CTs to identify qualitative and quantitative features that correlated with effusion volume. Several features emerged, but only anteroposterior (AP) quartile, maximum AP depth, and degree of atelectasis remained significant in multivariate analysis. The last was dropped, however, because it was not found to be useful for differentiating large effusions, said Dr. Moy, now with Massachusetts General Hospital in Boston.
AP quartile is calculated using the axial image where the effusion appears largest cephalad to the dome of the hemidiaphragm. The hemithorax is divided into four quartiles, and the AP quartile is then measured as the anterior-most quartile in which the effusion is seen, he explained. Maximum AP depth is measured in centimeters at the midclavicular line.
A classification rule was then developed in which first AP quartile (0%-25%) effusions are small, second quartile (25%-50%) effusions are moderate, and third or fourth AP quartile (50%-75% or 75%-100%) effusions are large. In borderline cases where it’s not easy to assess the quartile, AP depth can be measured using cutoffs of less than 3 cm (small), 3-10 cm (moderate), and more than 10 cm (large), Dr. Moy suggested.
To validate the rule, the 34 CT scans were then assessed by the nine physicians, who were not involved in the initial CT analysis. Interobserver agreement improved from a kappa of 0.59 to a kappa of 0.73 for radiology residents, 0.54 to 0.76 for pulmonologists, and 0.74 to 0.85 for cardiothoracic radiologists.

"This rule can elevate the level of agreement and consistency of both the novice radiologist and clinician to the level of cardiothoracic radiologists," Dr. Moy observed.
Session comoderator Dr. Reginald Munden, a professor of diagnostic radiology at the University of Texas M.D. Anderson Cancer Center in Houston, said in an interview, "I like anything we can do to standardize our reports, because we’re all over the place. This is particularly important, because a lot of smalls are insignificant and we don’t need to do anything with them.
"In our setting, with patients on chemotherapy, we see pleural effusions all the time," he added. "So it’s important when an effusion becomes large enough that it needs to be drained or it might be symptomatic for some other issue."
Dr. Munden went on to say that the grading scale needs to be validated in a larger population and should include a fourth subcategory, "present, but normal," to distinguish small effusions from those that are normal, but may be only 15 cc.
All effusions characterized as small in the analysis were less than 328 mL in absolute volume, Dr. Moy said in an interview. This is significant because malignant pleural effusions less than 1 cm in thickness on a lateral decubitus radiograph are a relative contraindication to thoracentesis, per American Thoracic Society guidelines (Am. J. Respir. Crit. Care Med. 2000;162:1987-2001). Pleural effusions greater than 1 cm on a lateral decubitus view have been shown to measure more than 300 mL in volume (Radiology 1994;191:681-4), he noted.
The new two-step rule is currently in use at Albert Einstein, and has been published online (Chest 2012 Nov. 8 [doi: 10.1378/chest.12-1292]).
Dr. Moy reported no conflicts of interest. A coauthor reported investments in Ortho Space and Kryon Systems.
CHICAGO – Researchers have developed and validated a simple two-step rule to quantify pleural effusion size on computed tomography – something currently not standardized.
Use of the rule significantly improved interobserver agreement, from a kappa coefficient of 0.56 to 0.79 (P less than .0001), among nine physicians ranging in skill from cardiothoracic radiologists and pulmonologists to radiology residents.
"It’s practical for any physician with access to the images and the referent tool, and conveys relevant information in terms of comparing effusion size and possibly guiding therapy," Dr. Matthew Moy said at the annual meeting of the Radiological Society of North America.
Computed tomography (CT) is highly sensitive for detecting small effusions, and differentiating pleural and parenchymal disease. The problem lies in the subjective grading of pleural effusion size and the wide variation in terminology between radiologists. These issues lead to confusion among physicians when reading CT reports or comparing effusions based on different reports, he said.
To illustrate his point, Dr. Moy showed three CT images of pleural effusions reported as being "small-moderate" to "moderate" to "large," although all three were similar in size.
In an effort to improve this communication, investigators at the Albert Einstein College of Medicine, New York, selected 34 adult CT scans, representing a wide range of pleural effusion sizes, and measured the volume of each effusion and ipsilateral hemithorax using a morphometric segmentation tool. The effusion and ipsilateral hemithorax were then manually traced on each axial slice, and the effusion volume calculated as a percent of the volume of the hemithorax to account for differences in body habitus, explained Dr. Moy.
The mean effusion volume was 37.42% of the hemithorax (range, 5.59%-89.05%). The patients’ mean age was 64 years, and 74% had undergone noncontrast CT.
Two cardiothoracic fellowship–trained radiologists then reviewed the CTs to identify qualitative and quantitative features that correlated with effusion volume. Several features emerged, but only anteroposterior (AP) quartile, maximum AP depth, and degree of atelectasis remained significant in multivariate analysis. The last was dropped, however, because it was not found to be useful for differentiating large effusions, said Dr. Moy, now with Massachusetts General Hospital in Boston.
AP quartile is calculated using the axial image where the effusion appears largest cephalad to the dome of the hemidiaphragm. The hemithorax is divided into four quartiles, and the AP quartile is then measured as the anterior-most quartile in which the effusion is seen, he explained. Maximum AP depth is measured in centimeters at the midclavicular line.
A classification rule was then developed in which first AP quartile (0%-25%) effusions are small, second quartile (25%-50%) effusions are moderate, and third or fourth AP quartile (50%-75% or 75%-100%) effusions are large. In borderline cases where it’s not easy to assess the quartile, AP depth can be measured using cutoffs of less than 3 cm (small), 3-10 cm (moderate), and more than 10 cm (large), Dr. Moy suggested.
To validate the rule, the 34 CT scans were then assessed by the nine physicians, who were not involved in the initial CT analysis. Interobserver agreement improved from a kappa of 0.59 to a kappa of 0.73 for radiology residents, 0.54 to 0.76 for pulmonologists, and 0.74 to 0.85 for cardiothoracic radiologists.
"This rule can elevate the level of agreement and consistency of both the novice radiologist and clinician to the level of cardiothoracic radiologists," Dr. Moy observed.
Session comoderator Dr. Reginald Munden, a professor of diagnostic radiology at the University of Texas M.D. Anderson Cancer Center in Houston, said in an interview, "I like anything we can do to standardize our reports, because we’re all over the place. This is particularly important, because a lot of smalls are insignificant and we don’t need to do anything with them.
"In our setting, with patients on chemotherapy, we see pleural effusions all the time," he added. "So it’s important when an effusion becomes large enough that it needs to be drained or it might be symptomatic for some other issue."
Dr. Munden went on to say that the grading scale needs to be validated in a larger population and should include a fourth subcategory, "present, but normal," to distinguish small effusions from those that are normal, but may be only 15 cc.
All effusions characterized as small in the analysis were less than 328 mL in absolute volume, Dr. Moy said in an interview. This is significant because malignant pleural effusions less than 1 cm in thickness on a lateral decubitus radiograph are a relative contraindication to thoracentesis, per American Thoracic Society guidelines (Am. J. Respir. Crit. Care Med. 2000;162:1987-2001). Pleural effusions greater than 1 cm on a lateral decubitus view have been shown to measure more than 300 mL in volume (Radiology 1994;191:681-4), he noted.
The new two-step rule is currently in use at Albert Einstein, and has been published online (Chest 2012 Nov. 8 [doi: 10.1378/chest.12-1292]).
Dr. Moy reported no conflicts of interest. A coauthor reported investments in Ortho Space and Kryon Systems.
AT THE ANNUAL MEETING OF THE RADIOLOGICAL SOCIETY OF NORTH AMERICA
Major Finding: Use of the rule significantly improved interobserver agreement from a kappa coefficient of 0.56 to 0.79 among nine cardiothoracic radiologists, pulmonologists, and radiology residents (P less than .0001).
Data Source: Analysis of 34 adult chest CT scans.
Disclosures: Dr. Moy reported no conflicts of interest. A coauthor reported investments in Ortho Space and Kryon Systems.

Right Foot Pain in a 25-Year-Old Man
Medicare Imaging Payments Fell 21% Since 2006
CHICAGO – After a meteoric rise that peaked in 2006, Medicare reimbursements for noninvasive diagnostic imaging fell by 21% in 2010, a new analysis shows.
But Medicare's total payments in 2010 were still 60% greater than what it paid a decade earlier.

"I think we in radiology can hope that this big cut in payments will convince the feds and payers that enough has been taken out of imaging and hopefully no more cuts will occur in the future year," Dr. David C. Levin said at the annual meeting of the Radiological Society of North America. "Unfortunately, I don’t think we can hang our hats on that hope."
Even without the so-called "fiscal cliff" around the corner, federal policy makers began cutting reimbursement for imaging services starting with the Deficit Reduction Act in 2006. Imaging has been identified in recent years as the most rapidly growing of all physician services, and it is well known that radiologists are highly compensated, he said.
As a result, efforts have been made by the Centers for Medicare and Medicaid Services to rein in reimbursements for imaging. This trend continues in the recently released final rules for the Hospital Outpatient Prospective Payment System (HOPPS).
To track these trends, the investigators used the Medicare Part B Physician/Supplier Procedure Summary Master Files for 2000-2010. These files provide data on volume and allowed reimbursements for every procedure code. All noninvasive diagnostic imaging codes, covering all specialties and all places of service, were selected and aggregated.
From 2000 to 2006, Medicare Part B payments to physicians for noninvasive diagnostic imaging rose from $5.9 billion to $11.9 billion – a 101% increase over those years.
There was a sharp reversal in 2007 when the Deficit Reduction Act first took effect, followed by a slight rise in 2008 and progressive declines to $9.45 billion in 2010, representing a 21% decrease from 2006, said Dr. David Levin, founder of the Center for Research on Utilization of Imaging Services (CRUISE) at Thomas Jefferson University Hospital in Philadelphia.
"That’s obviously a huge hit," he said.
When looked at by specialty, radiologists’ payments from Medicare rose 81% from $2.93 billion in 2000 to $5.3 billion in 2006, before dropping 11% to $4.7 billion in 2010.
Cardiologists, the second-largest group of imaging providers, suffered more than radiologists, Dr. Levin said. Their payments fell 33% to $1.9 billion in 2010, after rising 126% from $1.3 billion in 2000 to $2.9 billion in 2006.
Medicare spent $2.3 billion on imaging services to all other physicians in 2006, a 115% increase from $1.1 billion in 2000, before throttling back 17% to $1.9 billion in 2010.
Medicare payments to independent testing facilities increased 124% from 2000 to 2006, before declining 37% from 2006 to 2010.
The Deficit Reduction Act was the biggest reason for the drop in Part B payments for noninvasive diagnostic imaging – but other factors played a role, particularly in the progressive declines seen after 2007, Dr. Levin said.
Those factors include the Multiple Payment Procedure Reduction, the Centers for Medicare and Medicaid Services’ practice expense revaluation that cut the hourly rate for noninvasive diagnostic imaging from $204 to $135, an increase in the assumed equipment utilization rate from 50% to 75%, and a decrease in the volume of advanced imaging.
Finally, there was the bundling of codes for transthoracic echocardiogram, radionuclide myocardial infusion imaging, abdominal and pelvic computed tomography, and coronary CT angiography. "These had tremendous impacts," he added.
Dr. Levin reported serving as a consultant for HealthHelp and as a director for Outpatient Imaging Affiliates. CRUISE is funded in part by the American College of Radiology.
CHICAGO – After a meteoric rise that peaked in 2006, Medicare reimbursements for noninvasive diagnostic imaging fell by 21% in 2010, a new analysis shows.
But Medicare's total payments in 2010 were still 60% greater than what it paid a decade earlier.
"I think we in radiology can hope that this big cut in payments will convince the feds and payers that enough has been taken out of imaging and hopefully no more cuts will occur in the future year," Dr. David C. Levin said at the annual meeting of the Radiological Society of North America. "Unfortunately, I don’t think we can hang our hats on that hope."
Even without the so-called "fiscal cliff" around the corner, federal policy makers began cutting reimbursement for imaging services starting with the Deficit Reduction Act in 2006. Imaging has been identified in recent years as the most rapidly growing of all physician services, and it is well known that radiologists are highly compensated, he said.
As a result, efforts have been made by the Centers for Medicare and Medicaid Services to rein in reimbursements for imaging. This trend continues in the recently released final rules for the Hospital Outpatient Prospective Payment System (HOPPS).
To track these trends, the investigators used the Medicare Part B Physician/Supplier Procedure Summary Master Files for 2000-2010. These files provide data on volume and allowed reimbursements for every procedure code. All noninvasive diagnostic imaging codes, covering all specialties and all places of service, were selected and aggregated.
From 2000 to 2006, Medicare Part B payments to physicians for noninvasive diagnostic imaging rose from $5.9 billion to $11.9 billion – a 101% increase over those years.
There was a sharp reversal in 2007 when the Deficit Reduction Act first took effect, followed by a slight rise in 2008 and progressive declines to $9.45 billion in 2010, representing a 21% decrease from 2006, said Dr. David Levin, founder of the Center for Research on Utilization of Imaging Services (CRUISE) at Thomas Jefferson University Hospital in Philadelphia.
"That’s obviously a huge hit," he said.
When looked at by specialty, radiologists’ payments from Medicare rose 81% from $2.93 billion in 2000 to $5.3 billion in 2006, before dropping 11% to $4.7 billion in 2010.
Cardiologists, the second-largest group of imaging providers, suffered more than radiologists, Dr. Levin said. Their payments fell 33% to $1.9 billion in 2010, after rising 126% from $1.3 billion in 2000 to $2.9 billion in 2006.
Medicare spent $2.3 billion on imaging services to all other physicians in 2006, a 115% increase from $1.1 billion in 2000, before throttling back 17% to $1.9 billion in 2010.
Medicare payments to independent testing facilities increased 124% from 2000 to 2006, before declining 37% from 2006 to 2010.
The Deficit Reduction Act was the biggest reason for the drop in Part B payments for noninvasive diagnostic imaging – but other factors played a role, particularly in the progressive declines seen after 2007, Dr. Levin said.
Those factors include the Multiple Payment Procedure Reduction, the Centers for Medicare and Medicaid Services’ practice expense revaluation that cut the hourly rate for noninvasive diagnostic imaging from $204 to $135, an increase in the assumed equipment utilization rate from 50% to 75%, and a decrease in the volume of advanced imaging.
Finally, there was the bundling of codes for transthoracic echocardiogram, radionuclide myocardial infusion imaging, abdominal and pelvic computed tomography, and coronary CT angiography. "These had tremendous impacts," he added.
Dr. Levin reported serving as a consultant for HealthHelp and as a director for Outpatient Imaging Affiliates. CRUISE is funded in part by the American College of Radiology.
AT THE ANNUAL MEETING OF THE RADIOLOGICAL SOCIETY OF NORTH AMERICA
Major Finding: Medicare Part B payments for noninvasive diagnostic imaging rose 101% from $5.9 million in 2000 to $11.9 billion in 2006, before falling 21% to $9.45 billion in 2010.
Data Source: Analysis of the Medicare Part B Physician/Supplier Procedure Summary Master Files for 2000-2010.
Disclosures: Dr. Levin reported serving as a consultant for HealthHelp and as a director for Outpatient Imaging Affiliates. CRUISE is funded in part by the American College of Radiology.
Recent Evidence Challenges Four Inpatient Management Habits
Why did you order that test? Dr. Leonard S. Feldman wants you to turn off the autopilot and consider the evidence from the medical literature on the following four practices:
• Is the best target hematocrit for a cardiac patient 30% (or a hemoglobin level of 10 g/dL)?
• Should nasogastric lavage be routine in patients with suspected GI bleeds?
• Is it helpful to measure the fractional excretion of sodium or fractional excretion of urea nitrogen when evaluating acute kidney injury?
• Are daily chest x-rays a good idea in patients on mechanical ventilation in an ICU or step-down unit?
"Many of us do all of these things regularly on a reflexive basis," said Dr. Feldman, director of the general medicine comprehensive consult service at Johns Hopkins University, Baltimore.

Yet recent studies challenge the value of these approaches:
Transfusions
Three studies influenced the AABB (formerly the American Association of Blood Banks) to publish a clinical practice guideline this year recommending a restrictive strategy when considering blood transfusions in hospitalized patients with preexisting cardiovascular disease. The AABB says not to transfuse if the hemoglobin level is above 7-8 g/dL and to consider transfusing patients who are symptomatic or who have a hemoglobin level of less than 8 g/dL, the AABB says (Ann. Intern. Med. 2012;157:49-58).
One recent study randomized 502 patients undergoing coronary artery bypass grafting (CABG) or valve replacement who were on cardiac bypass support to either a liberal strategy aiming to maintain a hematocrit of at or above 30% from the start of surgery until discharge from the ICU or a restrictive strategy that aimed to keep the hematocrit at or above 24%.
Both groups were able to meet these goals. The two groups did not differ significantly, however, in a composite end point of 30-day all-cause mortality and severe morbidity occurring during hospitalization (JAMA 2011;304:1559-67).
There was a trend toward higher risk of death with the restrictive strategy, with a hazard ratio of 1.28, but the ratio ranged from 0.6 to 2.7, so the risk was not statistically significant. Analysis of a slew of secondary outcomes also found no significant differences between groups.
Another study randomized 2,016 patients aged 50 years or older who either had a history of cardiovascular disease or cardiac risk factors and who had a hemoglobin level below 10 g/dL after surgery for hip fracture. The liberal strategy triggered transfusion in all patients with a hemoglobin below 10 g/dL. The restrictive strategy transfused only if the patient showed symptoms of anemia or at the physician’s discretion in patients with a hemoglobin level less than 8 g/dL.
Patients received a lot more blood under the liberal strategy compared with the restrictive strategy – 1,866 vs. 652 units of blood, respectively – but the groups did not differ significantly in death rates or the ability to walk across a room without human assistance at 30 and 60 days after surgery (N. Engl. J. Med. 2011;365:2453-62). Sixty days after surgery, 35% of patients in each group had died or were unable to walk across a room unaided.
"This is a trial that you should be showing all of your orthopedists," Dr. Feldman said. "When the orthopedist says that we need to give a patient blood so the patient will be able to do better in rehab" after hip surgery, point to the data showing that this isn’t necessarily true, he suggested.
An earlier trial of 838 critically ill patients who had hemoglobin levels below 9 g/dL within 72 hours of admission to the ICU found 30-day mortality rates of 19% in those randomized to a restrictive transfusion strategy and 23% in patients randomized to a liberal transfusion strategy, a difference that was not statistically significant (N. Engl. J. Med. 1999;340:409-17).
The liberal strategy transfused when hemoglobin levels fell below 10 g/dL and maintained the hemoglobin at 10-12 g/dL. The restrictive strategy waited until hemoglobin levels fell below 7 g/dL before transfusing and maintained hemoglobin at 7-9 g/dL.
"So, we have three different studies here that really seem to indicate that for transfusion of those patients who are at highest risk – cardiac patients – it did not seem to make a difference in their outcomes, particularly in mortality, if you were restrictive or liberal" in setting thresholds for transfusion, Dr. Feldman said. "This is not the same, though, for patients who are having an acute coronary syndrome. We don’t have any good data for them," and the AABB doesn’t recommend for or against liberal or restrictive transfusion thresholds, he added.
The evidence behind the AABB recommendation is only of moderate quality because there are only the three studies. Although the literature generally favors a restrictive versus a liberal approach, there’s no robust evidence for any particular transfusion threshold, said Dr. Daniel S. VanderEnde, a hospitalist and member of the joint transfusion committee at Emory University, Atlanta.
Pointing to the limited amount of research, the AABB itself calls the recommendation’s quality of evidence "very low" and the strength of the recommendation "uncertain."
"Subpar" evidence is one reason that Dr. VanderEnde’s institution leaves transfusion decisions to individual clinicians, he said in an interview. One ICU may transfuse at a hemoglobin threshold "in the mid-7s, and another ICU will have a transfusion threshold in the mid-8s."
Emory is starting a computer order entry protocol requiring physicians to tell why they’re transfusing blood, compared with no previous oversight. "It doesn’t stop them from transfusing for any reason. It is just trying to collect data, in the hopes that maybe they will be more restrictive in their use rather than liberal," he said.
Anecdotally, transfusion practices do seem to be shifting, at least among newly-trained physicians, Dr. VanderEnde added. Five years ago when he would ask medical students about transfusion thresholds, many hewed to "the old 10/30 rule," but far fewer do so today, he said. "The younger orthopedists tend to not transfuse as much as the older orthopedists."
Nasogastric Lavage
Few procedures performed in emergency departments are more painful for patients than nasogastric intubation, and there’s a study to prove that (Ann. Emerg. Med. 1999;33:652-8).
"Patients think nasogastric lavage and nasogastric intubation really stink, so we need to have a good reason to do it," Dr. Feldman said.

And, like all invasive procedures, there are risks involved, Dr. Chad T. Whelan said in an interview. There are only modestly convincing data suggesting that nasogastric lavage can provide some prognostic or "localizing" information (such as differentiating upper vs. lower bleed). "Therefore, the risk/benefit ratio of routinely performing them for all patients has shifted with our increasing understanding of their risks and benefits," said Dr. Whelan, a hospitalist at the University of Chicago.
International consensus recommendations on the management of patients with nonvariceal upper GI bleeding suggest that physicians consider placing a nasogastric tube in selected patients because the findings may have prognostic value – not very helpful advice in decision making, Dr. Feldman said. (Ann. Intern. Med. 2010;152:101-13).
The rationale until now has been that patients with bloody aspirate on nasogastric lavage are significantly more likely to have high-risk GI lesions on endoscopy, compared with patients with clear or bilious aspirates on lavage. But does knowing this improve outcomes?
One review of the literature on how to determine if a patient has a severe upper GI bleed confirmed that a bloody aspirate on nasogastric lavage increases the likelihood of an upper GI bleed but there’s only a mildly increased likelihood of a severe bleed, "and the negative likelihood ratio is not unimpressive," Dr. Feldman said (JAMA 2012;307:1072-19).
Results of a separate propensity-matched retrospective analysis of data on 632 patients admitted with GI bleeding are "as good as we’re going to get on this topic," he said. The study found that getting or not getting nasogastric lavage did not change 30-day mortality, mean length of stay, transfusion requirements, or emergency surgery rates (Gastrointest. Endosc. 2011;74:971-80).
The only things that nasogastric lavage did change were an increase in the rate of patients undergoing endoscopy, a shorter interval to endoscopy, and a shorter length of stay among patients who had endoscopy.
That suggests that there was an individual-provider confounder that the study could not measure. Perhaps emergency physicians or gastroenterologists who order nasogastric lavage are simply more aggressive, Dr. Feldman said. "This is information that you might want to take to your emergency department," he said.
In a joint editorial accompanying the study, an emergency physician and an endoscopist concluded that the practice of nasogastric lavage in patients with acute upper GI bleeding is "antiquated."
Dr. Whelan said the role of nasogastric lavage "is in transition rather than antiquated." As upper GI bleeding epidemiology evolves and endoscopic interventions improve, "the widespread use of nasogastric lavage as a universal piece of the upper GI bleed protocol should decrease. Whether nasogastric lavage ultimately becomes a completely unnecessary procedure remains to be seen," he said.
Physicians at his institution no longer routinely perform nasogastric lavage when evaluating suspected upper GI bleeding, but "it has not completely disappeared from practice, either," he said. That’s less a factor of "aggressive" physicians and more a result of how practice changes and environmental factors, Dr. Whelan added. "Not all emergency rooms have access to full-service endoscopy on site, so emergency room physicians may have a different set of risk/benefit tradeoffs to consider."
Acute Kidney Injury
Can the fractional excretion of sodium (FENa) or fractional excretion of urea nitrogen (FEUN) help narrow the differential diagnosis in acute kidney disease? Widespread use of these measures began after a 17-person study in 1976 suggested that patients with prerenal azotemia had a FENa of less than 1 and patients with acute tubular necrosis had a FENa greater than 3 (JAMA 1976;236:579-81).
The FENa is not perfect, because many intrinsic kidney disorders can cause low FENa and the FENa can be elevated when diuretic use contributes to prerenal states, so a few studies looked at adding the FEUN to the diagnostic tools. Their results were contradictory.
One study of 102 patients in the ICU found that incorporating FEUN was 85% sensitive and 92% specific in detecting prerenal injury, but the study excluded patients with acute glomerulonephritis and obstructive nephropathy, "so you have to make sure that you exclude those patients if you’re going to use FEUN," Dr. Feldman said (Kidney Int. 2002;62:2223-9).
In a separate study of 99 patients, however, the FENa and FEUN were much less impressive in patients with or without diuretics. In patients on diuretics, FEUN had a sensitivity for distinguishing transient from persistent acute kidney injury of 79% and a specificity of 33%, and in patients not on diuretics the sensitivity was 48% and the specificity was 75% (Am. J. Kidney Dis. 2007;50:568-73).
A recent analysis reviewed the literature to provide some guidance for clinicians, but the end result is confusing, Dr. Feldman said. Under best-case scenarios, these two measures would be likely to make a difference in diagnosing the cause of acute kidney injury, but under worst-case scenarios, "they really stink," he said (Cleve. Clin. J. Med. 2012;79:121-6).
The authors cautioned that a single index calculated at a specific time often is insufficient to properly characterize the pathogenesis of acute kidney injury. "In the end, probably FENa and FEUN really don’t help you very much to decide" the reason behind acute kidney injury, Dr. Feldman said.
Chest X-Rays
Routine chest x-rays in mechanically ventilated patients in ICUs provide, well, too many unneeded x-rays, recent data show.
A crossover study that randomized 21 French ICUs to either routine daily chest x-rays for these patients or x-rays on demand found that the on-demand strategy reduced the number of x-rays by 32% without affecting the number of days on ventilation, length of ICU stay, or mortality. With the daily x-ray strategy, 424 patients got 4,607 x-rays, compared with 3,148 x-rays in 425 patients under the on-demand strategy (Lancet 2009;374:1687-93).
Patients had their ventilators changed more often under the on-demand strategy, probably as clinicians were troubleshooting potential problems, but the number of interventions did not differ significantly by x-ray strategy, Dr. Feldman noted.
A meta-analysis this year of eight trials including 7,078 adult ICU patients concluded that routine daily x-rays can be eliminated without increasing adverse outcomes (Radiology 2012;255:386-95).
Dr. Feldman suggested specific goals for these four scenarios, which he presented at the annual meeting of the Society of Hospitalist Medicine.
"Do not reflexively transfuse cardiac patients to hematocrits of 30%. Do not do routine daily chest x-rays. Do not reflexively NG [nasogastric] lavage our patients. And spend more time doing a really great history and physical and thinking about why your patient has acute renal failure than trying to use indices that don’t actually help us very much," he said.
He added a personal goal: "If I can make the residents at Johns Hopkins change, that will be a real feat, because they love to order tests on everybody."
Dr. Feldman, Dr. Whelan, and Dr. VanderEnde reported having no financial disclosures.
Why did you order that test? Dr. Leonard S. Feldman wants you to turn off the autopilot and consider the evidence from the medical literature on the following four practices:
• Is the best target hematocrit for a cardiac patient 30% (or a hemoglobin level of 10 g/dL)?
• Should nasogastric lavage be routine in patients with suspected GI bleeds?
• Is it helpful to measure the fractional excretion of sodium or fractional excretion of urea nitrogen when evaluating acute kidney injury?
• Are daily chest x-rays a good idea in patients on mechanical ventilation in an ICU or step-down unit?
"Many of us do all of these things regularly on a reflexive basis," said Dr. Feldman, director of the general medicine comprehensive consult service at Johns Hopkins University, Baltimore.
Yet recent studies challenge the value of these approaches:
Transfusions
Three studies influenced the AABB (formerly the American Association of Blood Banks) to publish a clinical practice guideline this year recommending a restrictive strategy when considering blood transfusions in hospitalized patients with preexisting cardiovascular disease. The AABB says not to transfuse if the hemoglobin level is above 7-8 g/dL and to consider transfusing patients who are symptomatic or who have a hemoglobin level of less than 8 g/dL, the AABB says (Ann. Intern. Med. 2012;157:49-58).
One recent study randomized 502 patients undergoing coronary artery bypass grafting (CABG) or valve replacement who were on cardiac bypass support to either a liberal strategy aiming to maintain a hematocrit of at or above 30% from the start of surgery until discharge from the ICU or a restrictive strategy that aimed to keep the hematocrit at or above 24%.
Both groups were able to meet these goals. The two groups did not differ significantly, however, in a composite end point of 30-day all-cause mortality and severe morbidity occurring during hospitalization (JAMA 2011;304:1559-67).
There was a trend toward higher risk of death with the restrictive strategy, with a hazard ratio of 1.28, but the ratio ranged from 0.6 to 2.7, so the risk was not statistically significant. Analysis of a slew of secondary outcomes also found no significant differences between groups.
Another study randomized 2,016 patients aged 50 years or older who either had a history of cardiovascular disease or cardiac risk factors and who had a hemoglobin level below 10 g/dL after surgery for hip fracture. The liberal strategy triggered transfusion in all patients with a hemoglobin below 10 g/dL. The restrictive strategy transfused only if the patient showed symptoms of anemia or at the physician’s discretion in patients with a hemoglobin level less than 8 g/dL.
Patients received a lot more blood under the liberal strategy compared with the restrictive strategy – 1,866 vs. 652 units of blood, respectively – but the groups did not differ significantly in death rates or the ability to walk across a room without human assistance at 30 and 60 days after surgery (N. Engl. J. Med. 2011;365:2453-62). Sixty days after surgery, 35% of patients in each group had died or were unable to walk across a room unaided.
"This is a trial that you should be showing all of your orthopedists," Dr. Feldman said. "When the orthopedist says that we need to give a patient blood so the patient will be able to do better in rehab" after hip surgery, point to the data showing that this isn’t necessarily true, he suggested.
An earlier trial of 838 critically ill patients who had hemoglobin levels below 9 g/dL within 72 hours of admission to the ICU found 30-day mortality rates of 19% in those randomized to a restrictive transfusion strategy and 23% in patients randomized to a liberal transfusion strategy, a difference that was not statistically significant (N. Engl. J. Med. 1999;340:409-17).
The liberal strategy transfused when hemoglobin levels fell below 10 g/dL and maintained the hemoglobin at 10-12 g/dL. The restrictive strategy waited until hemoglobin levels fell below 7 g/dL before transfusing and maintained hemoglobin at 7-9 g/dL.
"So, we have three different studies here that really seem to indicate that for transfusion of those patients who are at highest risk – cardiac patients – it did not seem to make a difference in their outcomes, particularly in mortality, if you were restrictive or liberal" in setting thresholds for transfusion, Dr. Feldman said. "This is not the same, though, for patients who are having an acute coronary syndrome. We don’t have any good data for them," and the AABB doesn’t recommend for or against liberal or restrictive transfusion thresholds, he added.
The evidence behind the AABB recommendation is only of moderate quality because there are only the three studies. Although the literature generally favors a restrictive versus a liberal approach, there’s no robust evidence for any particular transfusion threshold, said Dr. Daniel S. VanderEnde, a hospitalist and member of the joint transfusion committee at Emory University, Atlanta.
Pointing to the limited amount of research, the AABB itself calls the recommendation’s quality of evidence "very low" and the strength of the recommendation "uncertain."
"Subpar" evidence is one reason that Dr. VanderEnde’s institution leaves transfusion decisions to individual clinicians, he said in an interview. One ICU may transfuse at a hemoglobin threshold "in the mid-7s, and another ICU will have a transfusion threshold in the mid-8s."
Emory is starting a computer order entry protocol requiring physicians to tell why they’re transfusing blood, compared with no previous oversight. "It doesn’t stop them from transfusing for any reason. It is just trying to collect data, in the hopes that maybe they will be more restrictive in their use rather than liberal," he said.
Anecdotally, transfusion practices do seem to be shifting, at least among newly-trained physicians, Dr. VanderEnde added. Five years ago when he would ask medical students about transfusion thresholds, many hewed to "the old 10/30 rule," but far fewer do so today, he said. "The younger orthopedists tend to not transfuse as much as the older orthopedists."
Nasogastric Lavage
Few procedures performed in emergency departments are more painful for patients than nasogastric intubation, and there’s a study to prove that (Ann. Emerg. Med. 1999;33:652-8).
"Patients think nasogastric lavage and nasogastric intubation really stink, so we need to have a good reason to do it," Dr. Feldman said.
And, like all invasive procedures, there are risks involved, Dr. Chad T. Whelan said in an interview. There are only modestly convincing data suggesting that nasogastric lavage can provide some prognostic or "localizing" information (such as differentiating upper vs. lower bleed). "Therefore, the risk/benefit ratio of routinely performing them for all patients has shifted with our increasing understanding of their risks and benefits," said Dr. Whelan, a hospitalist at the University of Chicago.
International consensus recommendations on the management of patients with nonvariceal upper GI bleeding suggest that physicians consider placing a nasogastric tube in selected patients because the findings may have prognostic value – not very helpful advice in decision making, Dr. Feldman said. (Ann. Intern. Med. 2010;152:101-13).
The rationale until now has been that patients with bloody aspirate on nasogastric lavage are significantly more likely to have high-risk GI lesions on endoscopy, compared with patients with clear or bilious aspirates on lavage. But does knowing this improve outcomes?
One review of the literature on how to determine if a patient has a severe upper GI bleed confirmed that a bloody aspirate on nasogastric lavage increases the likelihood of an upper GI bleed but there’s only a mildly increased likelihood of a severe bleed, "and the negative likelihood ratio is not unimpressive," Dr. Feldman said (JAMA 2012;307:1072-19).
Results of a separate propensity-matched retrospective analysis of data on 632 patients admitted with GI bleeding are "as good as we’re going to get on this topic," he said. The study found that getting or not getting nasogastric lavage did not change 30-day mortality, mean length of stay, transfusion requirements, or emergency surgery rates (Gastrointest. Endosc. 2011;74:971-80).
The only things that nasogastric lavage did change were an increase in the rate of patients undergoing endoscopy, a shorter interval to endoscopy, and a shorter length of stay among patients who had endoscopy.
That suggests that there was an individual-provider confounder that the study could not measure. Perhaps emergency physicians or gastroenterologists who order nasogastric lavage are simply more aggressive, Dr. Feldman said. "This is information that you might want to take to your emergency department," he said.
In a joint editorial accompanying the study, an emergency physician and an endoscopist concluded that the practice of nasogastric lavage in patients with acute upper GI bleeding is "antiquated."
Dr. Whelan said the role of nasogastric lavage "is in transition rather than antiquated." As upper GI bleeding epidemiology evolves and endoscopic interventions improve, "the widespread use of nasogastric lavage as a universal piece of the upper GI bleed protocol should decrease. Whether nasogastric lavage ultimately becomes a completely unnecessary procedure remains to be seen," he said.
Physicians at his institution no longer routinely perform nasogastric lavage when evaluating suspected upper GI bleeding, but "it has not completely disappeared from practice, either," he said. That’s less a factor of "aggressive" physicians and more a result of how practice changes and environmental factors, Dr. Whelan added. "Not all emergency rooms have access to full-service endoscopy on site, so emergency room physicians may have a different set of risk/benefit tradeoffs to consider."
Acute Kidney Injury
Can the fractional excretion of sodium (FENa) or fractional excretion of urea nitrogen (FEUN) help narrow the differential diagnosis in acute kidney disease? Widespread use of these measures began after a 17-person study in 1976 suggested that patients with prerenal azotemia had a FENa of less than 1 and patients with acute tubular necrosis had a FENa greater than 3 (JAMA 1976;236:579-81).
The FENa is not perfect, because many intrinsic kidney disorders can cause low FENa and the FENa can be elevated when diuretic use contributes to prerenal states, so a few studies looked at adding the FEUN to the diagnostic tools. Their results were contradictory.
One study of 102 patients in the ICU found that incorporating FEUN was 85% sensitive and 92% specific in detecting prerenal injury, but the study excluded patients with acute glomerulonephritis and obstructive nephropathy, "so you have to make sure that you exclude those patients if you’re going to use FEUN," Dr. Feldman said (Kidney Int. 2002;62:2223-9).
In a separate study of 99 patients, however, the FENa and FEUN were much less impressive in patients with or without diuretics. In patients on diuretics, FEUN had a sensitivity for distinguishing transient from persistent acute kidney injury of 79% and a specificity of 33%, and in patients not on diuretics the sensitivity was 48% and the specificity was 75% (Am. J. Kidney Dis. 2007;50:568-73).
A recent analysis reviewed the literature to provide some guidance for clinicians, but the end result is confusing, Dr. Feldman said. Under best-case scenarios, these two measures would be likely to make a difference in diagnosing the cause of acute kidney injury, but under worst-case scenarios, "they really stink," he said (Cleve. Clin. J. Med. 2012;79:121-6).
The authors cautioned that a single index calculated at a specific time often is insufficient to properly characterize the pathogenesis of acute kidney injury. "In the end, probably FENa and FEUN really don’t help you very much to decide" the reason behind acute kidney injury, Dr. Feldman said.
Chest X-Rays
Routine chest x-rays in mechanically ventilated patients in ICUs provide, well, too many unneeded x-rays, recent data show.
A crossover study that randomized 21 French ICUs to either routine daily chest x-rays for these patients or x-rays on demand found that the on-demand strategy reduced the number of x-rays by 32% without affecting the number of days on ventilation, length of ICU stay, or mortality. With the daily x-ray strategy, 424 patients got 4,607 x-rays, compared with 3,148 x-rays in 425 patients under the on-demand strategy (Lancet 2009;374:1687-93).
Patients had their ventilators changed more often under the on-demand strategy, probably as clinicians were troubleshooting potential problems, but the number of interventions did not differ significantly by x-ray strategy, Dr. Feldman noted.
A meta-analysis this year of eight trials including 7,078 adult ICU patients concluded that routine daily x-rays can be eliminated without increasing adverse outcomes (Radiology 2012;255:386-95).
Dr. Feldman suggested specific goals for these four scenarios, which he presented at the annual meeting of the Society of Hospitalist Medicine.
"Do not reflexively transfuse cardiac patients to hematocrits of 30%. Do not do routine daily chest x-rays. Do not reflexively NG [nasogastric] lavage our patients. And spend more time doing a really great history and physical and thinking about why your patient has acute renal failure than trying to use indices that don’t actually help us very much," he said.
He added a personal goal: "If I can make the residents at Johns Hopkins change, that will be a real feat, because they love to order tests on everybody."
Dr. Feldman, Dr. Whelan, and Dr. VanderEnde reported having no financial disclosures.

Should N-acetylcysteine be used routinely to prevent contrast-induced acute kidney injury?
No. Using N-acetylcysteine (NAC) routinely to prevent contrast-induced acute kidney injury is not supported by the evidence at this time.1,2 However, there is evidence to suggest using it for patients at high risk, ie, those with significant baseline renal dysfunction.3,4
INCIDENCE AND IMPACT OF ACUTE KIDNEY INJURY
Intraarterial use of contrast is associated with a higher risk of acute kidney injury than intravenous use. Most studies of NAC for the prevention of contrast-induced acute kidney injury have focused on patients receiving contrast intraarterially. The reported rates of contrast-induced acute kidney injury also vary depending on how acute kidney injury was defined.
Although the incidence is low (1% to 2%) in patients with normal renal function, it can be as high as 25% in patients with renal impairment or a chronic condition such as diabetes or congestive heart failure, or in elderly patients.5
The development of acute kidney injury after percutaneous coronary intervention is associated with a longer hospital stay, a higher cost of care, and higher rates of morbidity and death.6
RATIONALE FOR USING N-ACETYLCYSTEINE
Contrast-induced acute kidney injury is thought to involve vasoconstriction and medullary ischemia mediated by reactive oxygen species.5 As an antioxidant and a scavenger of free radicals, NAC showed early promise in reducing the risk of this complication, but subsequent trials raised doubts about its efficacy. 1,2 In clinical practice, the drug is often used to prevent acute kidney injury because it is easy to give, cheap, and has few side effects. Recently, however, there have been suggestions that giving it intravenously may be associated with adverse effects that include anaphylactoid reactions.7
THE POSITIVE TRIALS
Tepel et al3 performed one of the earliest trials that found that NAC prevented contrast-induced acute kidney injury. The trial included 83 patients with stable chronic kidney disease (mean serum creatinine 2.4 mg/dL) who underwent computed tomography with about 75 mL of a nonionic, low-osmolality contrast agent. Participants were randomized to receive either NAC (600 mg orally twice daily) and 0.45% saline intravenously or placebo and saline. Acute kidney injury was defined as an increase of at least 0.5 mg/dL in the serum creatinine level 48 hours after the contrast dye was given.
The rate of acute kidney injury was significantly lower in the treatment group (2% vs 21%, P = .01). None of the patients who developed acute kidney injury needed hemodialysis.
Shyu et al4 studied 121 patients with chronic kidney disease (mean serum creatinine 2.8 mg/dL) who underwent a coronary procedure. Patients were randomized to receive NAC 400 mg orally twice daily or placebo in addition to 0.45% saline in both groups. Two (3.3%) of the 60 patients in the treated group and 15 (24.6%) of the 61 patients in the control group had an increase in creatinine concentration greater than 0.5 mg/dL at 48 hours (P < .001).
Both of these single-center studies were limited by small sample sizes and very short follow-up. Further, the impact of the drug on important clinical outcomes such as death and progression of chronic kidney disease was not reported.
Marenzi et al8 randomized 354 patients undergoing coronary angioplasty as the primary treatment for acute myocardial infarction to one of three treatment groups:
- NAC in a standard dosage (a 600-mg intravenous bolus before the procedure and then 600 mg orally twice daily for 48 hours afterward)
- NAC in a high dosage (a 1,200-mg intravenous bolus and then 1,200 mg orally twice daily for 48 hours)
- Placebo.
The two treatment groups had significantly lower rates of acute kidney injury than the placebo group. In addition, the hospital mortality rate and the rate of a composite end point of death, need for renal replacement therapy, or need for mechanical ventilation were significantly lower in the treated groups. However, the number of events was small, and a beneficial effect on the death rate has not been confirmed by other studies.5
THE NEGATIVE TRIALS
Several studies found that NAC did not prevent contrast-induced acute kidney injury.1,2,9
The Acetylcysteine for Contrast-induced Nephropathy Trial (ACT), published in 2011,1 was the largest of these trials. It included 2,308 patients undergoing an angiographic procedure who had at least one risk factor for contrast-induced acute kidney injury (age > 70, renal failure, diabetes mellitus, heart failure, or hypotension). Patients were randomly assigned to receive the drug (1,200 mg by mouth) or placebo.
The incidence of contrast-induced acute kidney injury was 12.7% in the treated group and 12.7% in the control group (relative risk 1.00; 95% confidence interval 0.81–1.25; P = .97). The rate of a combined end point of death or need for dialysis at 30 days was also similar in both groups (2.2% with treatment vs 2.3% with placebo).
Importantly, only about 15% of patients had a baseline serum creatinine greater than 1.5 mg/dL. Of these, most had an estimated glomerular filtration rate between 45 and 60 mL/min. Indeed, most patients in the ACT were at low risk of contrast-induced acute kidney injury. As a result, there were low event rates and, not surprisingly, no differences between the control and treatment groups.
Subgroup analysis did not suggest a benefit of treatment in those with a baseline serum creatinine greater than 1.5 mg/dL. However, as the authors pointed out, this subgroup was small, so definitive statistically powered conclusions cannot be drawn. There was no significant difference in the primary end point among several other predefined subgroups (age > 70, female sex, diabetes).1
The ACT differed from the “positive” study by Marenzi et al8 in several ways. The ACT patients were at lower risk, the coronary catheterizations were being done mainly for diagnosis rather than intervention, a lower volume of contrast dye was used (100 mL in the ACT vs 250 mL in the Marenzi study), and patients with ST-elevation myocardial infarction were excluded. Other weaknesses of the ACT include use of a baseline serum creatinine within 3 months of study entry, variations in the hydration protocol, and the use of a high-osmolar contrast agent in some patients.
Webb et al2 found, in a large, randomized trial, that intravenous NAC did not prevent contrast-induced acute kidney injury. Patients with renal dysfunction (mean serum creatinine around 1.6 mg/dL) undergoing cardiac catheterization were randomly assigned to receive either NAC 500 mg or placebo immediately before the procedure. All patients first received isotonic saline 200 mL, then 1.5 mL/kg per hour for 6 hours, unless contraindicated. The study was terminated early because of a determination of futility.
Gurm et al9 found that a database of 90,578 consecutive patients undergoing nonemergency coronary angiography from 2006 to 2009 did not show differences in the rate of contrast-induced acute kidney injury between patients who received NAC and those who did not (5.5% vs 5.5%, P = .99). There was also no difference in the rate of death or the need for dialysis. These negative findings were consistent across many prespecified subgroups.
MIXED RESULTS IN META-ANALYSES
Results from meta-analyses have been mixed,10,11 mainly because of study heterogeneity (eg, baseline risk, end points, dose of the drug) and publication bias. None of the previous meta-analyses included the recent negative results from the ACT.
CURRENT GUIDELINES
After the publication of the ACT, the joint guidelines of the American College of Cardiology and the American Heart Association were updated, designating NAC as class III (no benefit) and level of evidence A.12
However, recently published guidelines from the Kidney Disease: Improving Global Outcomes Acute Kidney Injury Working Group recommend using the drug together with intravenous isotonic crystalloids in patients at high risk of contrast-induced acute kidney injury, although the level of evidence is 2D (2 = suggestion, D = quality of evidence very low).5
WHAT WE RECOMMEND
The routine use of NAC to prevent contrast-induced acute kidney injury is not supported by the current evidence. However, clarification of its efficacy in high-risk patients is needed, especially those with baseline renal dysfunction and diabetes mellitus.
The Prevention of Serious Adverse Events Following Angiography (PRESERVE) study (ClinTrials.gov identifier NCT01467466) may clarify the role of this drug in a high-risk cohort using the important clinical outcomes of death, need for acute dialysis, or persistent decline in kidney function after angiography. This important study was set to begin in July 2012, with an anticipated enrollment of more than 8,000 patients who have glomerular filtration rates of 15 to 59 mL/min/1.73 m2.
In the meantime, we recommend the following in patients at high risk of contrast-induced acute kidney injury:
- Clarify whether contrast is truly needed
- When possible, limit the volume of contrast, avoid repeated doses over a short time frame, and use an iso-osmolar or low-osmolar contrast agent
- Discontinue nephrotoxic agents
- Provide an evidence-based intravenous crystalloid regimen with isotonic sodium bicarbonate or saline
- Although it is not strictly evidence-based, use NAC in patients with significant baseline renal dysfunction (glomerular filtration rate < 45 mL/min/1.73 m2), multiple concurrent risk factors such as hypotension, diabetes, preexisting kidney injury, or congestive heart failure that limits the use of intravenous fluids, or who need a high volume of contrast dye
- Avoid using intravenous NAC, given its lack of benefit and risk of anaphylactoid reactions.7,13
We do not yet have clear evidence on the optimal dosing regimen. But based on the limited data, we recommend 600 to 1,200 mg twice a day for 1 day before and 1 day after the dye is given.
- ACT Investigators. Acetylcysteine for prevention of renal outcomes in patients undergoing coronary and peripheral vascular angiography: main results from the randomized Acetylcysteine for Contrast-induced nephropathy Trial (ACT). Circulation 2011; 124:1250–1259.
- Webb JG, Pate GE, Humphries KH, et al. A randomized controlled trial of intravenous N-acetylcysteine for the prevention of contrast-induced nephropathy after cardiac catheterization: lack of effect. Am Heart J 2004; 148:422–429.
- Tepel M, van der Giet M, Schwarzfeld C, Laufer U, Liermann D, Zidek W. Prevention of radiographic-contrast-agent-induced reductions in renal function by acetylcysteine. N Engl J Med 2000; 343:180–184.
- Shyu KG, Cheng JJ, Kuan P. Acetylcysteine protects against acute renal damage in patients with abnormal renal function undergoing a coronary procedure. J Am Coll Cardiol 2002; 40:1383–1388.
- Kidney Disease: Improving Global Outcomes (KDIGO) Acute Kidney Injury Work Group. KDIGO clinical practice guideline for acute kidney injury. Kidney Int 2012; 2(suppl 1):1–138.
- Rihal CS, Textor SC, Grill DE, et al. Incidence and prognostic importance of acute renal failure after percutaneous coronary intervention. Circulation 2002; 105:2259–2264.
- Baker CS, Wragg A, Kumar S, De Palma R, Baker LR, Knight CJ. A rapid protocol for the prevention of contrast-induced renal dysfunction: the RAPPID study. J Am Coll Cardiol 2003; 41:2114–2118.
- Marenzi G, Assanelli E, Marana I, et al. N-acetylcysteine and contrast-induced nephropathy in primary angioplasty. N Engl J Med 2006; 354:2773–2782.
- Gurm HS, Smith DE, Berwanger O, et al; BMC2 (Blue Cross Blue Shield of Michigan Cardiovascular Consortium). Contemporary use and effectiveness of N-acetylcysteine in preventing contrast-induced nephropathy among patients undergoing percutaneous coronary intervention. JACC Cardiovasc Interv 2012; 5:98–104.
- Duong MH, MacKenzie TA, Malenka DJ. N-acetylcysteine prophylaxis significantly reduces the risk of radiocontrast-induced nephropathy: comprehensive meta-analysis. Catheter Cardiovasc Interv 2005; 64:471–479.
- Gonzales DA, Norsworthy KJ, Kern SJ, et al. A meta-analysis of N-acetylcysteine in contrast-induced nephrotoxicity: unsupervised clustering to resolve heterogeneity. BMC Med 2007; 5:32.
- Levine GN, Bates ER, Blankenship JC, et al. 2011 ACCF/AHA/SCAI Guideline for Percutaneous Coronary Intervention: a report of the American College of Cardiology Foundation/American Heart Association Task Force on Practice Guidelines and the Society for Cardiovascular Angiography and Interventions. Circulation 2011; 124:e574–e651.
- Kanter MZ. Comparison of oral and i.v. acetylcysteine in the treatment of acetaminophen poisoning. Am J Health Syst Pharm 2006; 63:1821–1827.
No. Using N-acetylcysteine (NAC) routinely to prevent contrast-induced acute kidney injury is not supported by the evidence at this time.1,2 However, there is evidence to suggest using it for patients at high risk, ie, those with significant baseline renal dysfunction.3,4
INCIDENCE AND IMPACT OF ACUTE KIDNEY INJURY
Intraarterial use of contrast is associated with a higher risk of acute kidney injury than intravenous use. Most studies of NAC for the prevention of contrast-induced acute kidney injury have focused on patients receiving contrast intraarterially. The reported rates of contrast-induced acute kidney injury also vary depending on how acute kidney injury was defined.
Although the incidence is low (1% to 2%) in patients with normal renal function, it can be as high as 25% in patients with renal impairment or a chronic condition such as diabetes or congestive heart failure, or in elderly patients.5
The development of acute kidney injury after percutaneous coronary intervention is associated with a longer hospital stay, a higher cost of care, and higher rates of morbidity and death.6
RATIONALE FOR USING N-ACETYLCYSTEINE
Contrast-induced acute kidney injury is thought to involve vasoconstriction and medullary ischemia mediated by reactive oxygen species.5 As an antioxidant and a scavenger of free radicals, NAC showed early promise in reducing the risk of this complication, but subsequent trials raised doubts about its efficacy. 1,2 In clinical practice, the drug is often used to prevent acute kidney injury because it is easy to give, cheap, and has few side effects. Recently, however, there have been suggestions that giving it intravenously may be associated with adverse effects that include anaphylactoid reactions.7
THE POSITIVE TRIALS
Tepel et al3 performed one of the earliest trials that found that NAC prevented contrast-induced acute kidney injury. The trial included 83 patients with stable chronic kidney disease (mean serum creatinine 2.4 mg/dL) who underwent computed tomography with about 75 mL of a nonionic, low-osmolality contrast agent. Participants were randomized to receive either NAC (600 mg orally twice daily) and 0.45% saline intravenously or placebo and saline. Acute kidney injury was defined as an increase of at least 0.5 mg/dL in the serum creatinine level 48 hours after the contrast dye was given.
The rate of acute kidney injury was significantly lower in the treatment group (2% vs 21%, P = .01). None of the patients who developed acute kidney injury needed hemodialysis.
Shyu et al4 studied 121 patients with chronic kidney disease (mean serum creatinine 2.8 mg/dL) who underwent a coronary procedure. Patients were randomized to receive NAC 400 mg orally twice daily or placebo in addition to 0.45% saline in both groups. Two (3.3%) of the 60 patients in the treated group and 15 (24.6%) of the 61 patients in the control group had an increase in creatinine concentration greater than 0.5 mg/dL at 48 hours (P < .001).
Both of these single-center studies were limited by small sample sizes and very short follow-up. Further, the impact of the drug on important clinical outcomes such as death and progression of chronic kidney disease was not reported.
Marenzi et al8 randomized 354 patients undergoing coronary angioplasty as the primary treatment for acute myocardial infarction to one of three treatment groups:
- NAC in a standard dosage (a 600-mg intravenous bolus before the procedure and then 600 mg orally twice daily for 48 hours afterward)
- NAC in a high dosage (a 1,200-mg intravenous bolus and then 1,200 mg orally twice daily for 48 hours)
- Placebo.
The two treatment groups had significantly lower rates of acute kidney injury than the placebo group. In addition, the hospital mortality rate and the rate of a composite end point of death, need for renal replacement therapy, or need for mechanical ventilation were significantly lower in the treated groups. However, the number of events was small, and a beneficial effect on the death rate has not been confirmed by other studies.5
THE NEGATIVE TRIALS
Several studies found that NAC did not prevent contrast-induced acute kidney injury.1,2,9
The Acetylcysteine for Contrast-induced Nephropathy Trial (ACT), published in 2011,1 was the largest of these trials. It included 2,308 patients undergoing an angiographic procedure who had at least one risk factor for contrast-induced acute kidney injury (age > 70, renal failure, diabetes mellitus, heart failure, or hypotension). Patients were randomly assigned to receive the drug (1,200 mg by mouth) or placebo.
The incidence of contrast-induced acute kidney injury was 12.7% in the treated group and 12.7% in the control group (relative risk 1.00; 95% confidence interval 0.81–1.25; P = .97). The rate of a combined end point of death or need for dialysis at 30 days was also similar in both groups (2.2% with treatment vs 2.3% with placebo).
Importantly, only about 15% of patients had a baseline serum creatinine greater than 1.5 mg/dL. Of these, most had an estimated glomerular filtration rate between 45 and 60 mL/min. Indeed, most patients in the ACT were at low risk of contrast-induced acute kidney injury. As a result, there were low event rates and, not surprisingly, no differences between the control and treatment groups.
Subgroup analysis did not suggest a benefit of treatment in those with a baseline serum creatinine greater than 1.5 mg/dL. However, as the authors pointed out, this subgroup was small, so definitive statistically powered conclusions cannot be drawn. There was no significant difference in the primary end point among several other predefined subgroups (age > 70, female sex, diabetes).1
The ACT differed from the “positive” study by Marenzi et al8 in several ways. The ACT patients were at lower risk, the coronary catheterizations were being done mainly for diagnosis rather than intervention, a lower volume of contrast dye was used (100 mL in the ACT vs 250 mL in the Marenzi study), and patients with ST-elevation myocardial infarction were excluded. Other weaknesses of the ACT include use of a baseline serum creatinine within 3 months of study entry, variations in the hydration protocol, and the use of a high-osmolar contrast agent in some patients.
Webb et al2 found, in a large, randomized trial, that intravenous NAC did not prevent contrast-induced acute kidney injury. Patients with renal dysfunction (mean serum creatinine around 1.6 mg/dL) undergoing cardiac catheterization were randomly assigned to receive either NAC 500 mg or placebo immediately before the procedure. All patients first received isotonic saline 200 mL, then 1.5 mL/kg per hour for 6 hours, unless contraindicated. The study was terminated early because of a determination of futility.
Gurm et al9 found that a database of 90,578 consecutive patients undergoing nonemergency coronary angiography from 2006 to 2009 did not show differences in the rate of contrast-induced acute kidney injury between patients who received NAC and those who did not (5.5% vs 5.5%, P = .99). There was also no difference in the rate of death or the need for dialysis. These negative findings were consistent across many prespecified subgroups.
MIXED RESULTS IN META-ANALYSES
Results from meta-analyses have been mixed,10,11 mainly because of study heterogeneity (eg, baseline risk, end points, dose of the drug) and publication bias. None of the previous meta-analyses included the recent negative results from the ACT.
CURRENT GUIDELINES
After the publication of the ACT, the joint guidelines of the American College of Cardiology and the American Heart Association were updated, designating NAC as class III (no benefit) and level of evidence A.12
However, recently published guidelines from the Kidney Disease: Improving Global Outcomes Acute Kidney Injury Working Group recommend using the drug together with intravenous isotonic crystalloids in patients at high risk of contrast-induced acute kidney injury, although the level of evidence is 2D (2 = suggestion, D = quality of evidence very low).5
WHAT WE RECOMMEND
The routine use of NAC to prevent contrast-induced acute kidney injury is not supported by the current evidence. However, clarification of its efficacy in high-risk patients is needed, especially those with baseline renal dysfunction and diabetes mellitus.
The Prevention of Serious Adverse Events Following Angiography (PRESERVE) study (ClinTrials.gov identifier NCT01467466) may clarify the role of this drug in a high-risk cohort using the important clinical outcomes of death, need for acute dialysis, or persistent decline in kidney function after angiography. This important study was set to begin in July 2012, with an anticipated enrollment of more than 8,000 patients who have glomerular filtration rates of 15 to 59 mL/min/1.73 m2.
In the meantime, we recommend the following in patients at high risk of contrast-induced acute kidney injury:
- Clarify whether contrast is truly needed
- When possible, limit the volume of contrast, avoid repeated doses over a short time frame, and use an iso-osmolar or low-osmolar contrast agent
- Discontinue nephrotoxic agents
- Provide an evidence-based intravenous crystalloid regimen with isotonic sodium bicarbonate or saline
- Although it is not strictly evidence-based, use NAC in patients with significant baseline renal dysfunction (glomerular filtration rate < 45 mL/min/1.73 m2), multiple concurrent risk factors such as hypotension, diabetes, preexisting kidney injury, or congestive heart failure that limits the use of intravenous fluids, or who need a high volume of contrast dye
- Avoid using intravenous NAC, given its lack of benefit and risk of anaphylactoid reactions.7,13
We do not yet have clear evidence on the optimal dosing regimen. But based on the limited data, we recommend 600 to 1,200 mg twice a day for 1 day before and 1 day after the dye is given.
- ACT Investigators. Acetylcysteine for prevention of renal outcomes in patients undergoing coronary and peripheral vascular angiography: main results from the randomized Acetylcysteine for Contrast-induced nephropathy Trial (ACT). Circulation 2011; 124:1250–1259.
- Webb JG, Pate GE, Humphries KH, et al. A randomized controlled trial of intravenous N-acetylcysteine for the prevention of contrast-induced nephropathy after cardiac catheterization: lack of effect. Am Heart J 2004; 148:422–429.
- Tepel M, van der Giet M, Schwarzfeld C, Laufer U, Liermann D, Zidek W. Prevention of radiographic-contrast-agent-induced reductions in renal function by acetylcysteine. N Engl J Med 2000; 343:180–184.
- Shyu KG, Cheng JJ, Kuan P. Acetylcysteine protects against acute renal damage in patients with abnormal renal function undergoing a coronary procedure. J Am Coll Cardiol 2002; 40:1383–1388.
- Kidney Disease: Improving Global Outcomes (KDIGO) Acute Kidney Injury Work Group. KDIGO clinical practice guideline for acute kidney injury. Kidney Int 2012; 2(suppl 1):1–138.
- Rihal CS, Textor SC, Grill DE, et al. Incidence and prognostic importance of acute renal failure after percutaneous coronary intervention. Circulation 2002; 105:2259–2264.
- Baker CS, Wragg A, Kumar S, De Palma R, Baker LR, Knight CJ. A rapid protocol for the prevention of contrast-induced renal dysfunction: the RAPPID study. J Am Coll Cardiol 2003; 41:2114–2118.
- Marenzi G, Assanelli E, Marana I, et al. N-acetylcysteine and contrast-induced nephropathy in primary angioplasty. N Engl J Med 2006; 354:2773–2782.
- Gurm HS, Smith DE, Berwanger O, et al; BMC2 (Blue Cross Blue Shield of Michigan Cardiovascular Consortium). Contemporary use and effectiveness of N-acetylcysteine in preventing contrast-induced nephropathy among patients undergoing percutaneous coronary intervention. JACC Cardiovasc Interv 2012; 5:98–104.
- Duong MH, MacKenzie TA, Malenka DJ. N-acetylcysteine prophylaxis significantly reduces the risk of radiocontrast-induced nephropathy: comprehensive meta-analysis. Catheter Cardiovasc Interv 2005; 64:471–479.
- Gonzales DA, Norsworthy KJ, Kern SJ, et al. A meta-analysis of N-acetylcysteine in contrast-induced nephrotoxicity: unsupervised clustering to resolve heterogeneity. BMC Med 2007; 5:32.
- Levine GN, Bates ER, Blankenship JC, et al. 2011 ACCF/AHA/SCAI Guideline for Percutaneous Coronary Intervention: a report of the American College of Cardiology Foundation/American Heart Association Task Force on Practice Guidelines and the Society for Cardiovascular Angiography and Interventions. Circulation 2011; 124:e574–e651.
- Kanter MZ. Comparison of oral and i.v. acetylcysteine in the treatment of acetaminophen poisoning. Am J Health Syst Pharm 2006; 63:1821–1827.
Abdominal Distention in an 85-Year-Old Woman
Apps Proliferate Amid Concerns About Medical Use
DENVER – Do you need a stethoscope, a blood pressure monitor, or a tool to assess cardiac rhythms? There are apps for that. In fact, by recent count there are more than 200,000 applications of technology – or "apps" – available for smartphones or tablet devices, and they’re being used more and more for medical purposes.
Need a convenient way to look up drug interactions, pediatric dosing, or clinical decision rules from guidelines? Or how about a translator, a light to examine a finicky infant’s throat, or a "white board" to draw a picture for your patient? Yup – they’re all in apps, and chances are you already may be using some of these.
Dr. Joshua S. Broder expects an exponential increase in the use of apps in medicine as smartphones and tablets continue to proliferate, but their accuracy needs to be verified and potential problems need to be addressed, he said at the annual meeting of the American College of Emergency Physicians.
Apps will be used increasingly for bedside diagnosis and measurement of hemoglobin or other physiologic parameters. "Some of these tests may be taken over by smartphones in the near future," according to Dr. Broder of Duke University, Durham, N.C.
On the other hand, he cautioned, how do you sterilize a smartphone as you move from one hospital room or patient to another, so that you avoid transmitting infection? There are few independent studies so far testing the accuracy and reliability of medical apps, most of which were designed for lay consumers, not physicians.
The Food and Drug Administration is "very interested" in regulating any apps that might substitute for proven technologies such as stethoscopes or that physicians use as accessories to medical devices that already are regulated, he said. The FDA described its approach to deciding which mobile technology to regulate in a draft report in July 2012.
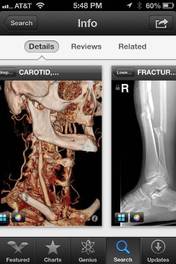
Even the basic functions of smartphones can be convenient in clinical practice, such as taking photos or videos and transmitting information by text or e-mail, but make sure you protect patient privacy and autonomy in ways that maintain trust and comply with HIPAA, Dr. Broder said.
The Duke University Health System has resolved any issues with HIPAA so that it’s safe for physicians to transmit images and video as long as they’re not sent outside the system. Talk to the HIPAA compliance officer at your medical center to establish the ground rules, he said. You can refresh your memory about which parts of data are considered by HIPAA to be protected information via a University of Miami site.
Dr. Broder reviewed some smartphone functions and apps that may be helpful and others that are not yet ready for medical prime time. Many are available for no cost or for as nominal fee. One study of health and fitness apps suggests that apps costing $0.99 or more tend to be higher quality and more trustworthy than less-expensive ones, he noted (J. Med. Internet Res. 2012;14:e72).
• Sleep: One of his residents swears by "smart alarm clock" apps that claim to use a smartphone’s accelerometer to assess where you are in your sleep cycle (based on your movements in bed) to wake you at a time that will leave you feeling less fatigued. You may set for 6 a.m., but the alarm may wake you at 5:45 a.m. Apps like Sleep Cycle ($0.99) and Sleep as Android have some underlying sleep science behind them, but no independent studies have verified their claims.
• CPR: The accelerometer also is used in the free app PocketCPR to give real-time feedback during CPR on the rate and depth of compression. Its has not been cleared by the FDA for use in humans, however, so the app warns that it’s meant for practice only. One prospective, randomized trial in 1,586 cardiac arrests that happened outside of hospitals found that use by emergency services personnel did not significantly change the likelihood of return of spontaneous circulation or other outcomes (BMJ 2011;342:d512).
• Chest: If you’re trying to teach students and residents about heart and lung sounds, or if you still get confused between mitral regurgitation and aortic stenosis, you might want to have a digital stethoscope app handy. These apps interpret heart and lung sounds heard typically through your smartphone’s microphone, which may not be good enough for clinical use. The Thinklabs Stethoscope app at $70 is pricey, compared with others, but it records sounds directly via the smartphone or through an attached electronic stethoscope.
A case that turns an iPhone into an ECG device has been submitted to the FDA for approval. The AliveCor iPhone ECG is expected to sell for between $100 and $200, compared with the usual price tag of thousands of dollars for conventional ECG machines, according to PC Magazine.
One small prospective study of experimental software that programs an iPhone to detect atrial fibrillation by placing a patient’s finger over the camera lens showed it was 98% sensitive and nearly 100% specific in detecting atrial fibrillation (IEEE Trans. Biomed. Eng. 2012 [doi:10.1109/TBME.2012.2208112]).
• Translation: When your hospital’s interpreter isn’t available, a free app like Google Translate can help. You can write or speak in one language and your device will write and say the message in a wide selection of language. You’ll need a wireless Internet connection for some translation apps.
Pull up an app like the free EyeChart on your smartphone or tablet.
• Light: You want to inspect a patient’s sore throat, but the light in the exam room is broken. Use the flash on your smartphone camera, or use one of many free "flashlight" apps that turn the smartphone screen into a light source. Be sure to turn it off when you’re done, though, or your battery will run down quickly.
• Ultrasound: The miniaturization of ultrasound devices continues, with systems like the Mobisante MoblUS that attaches a probe to show images on your smartphone screen.
• Skin: For better evaluation of skin lesions, turn your iPhone into a dermatoscope by using the DermScope app ($4.99) and attaching the phone to the DermScope hardware (sold separately).
• Decision support: The PediStat app ($2.99 and up) makes it easy to determine the right pediatric drug dosing, among other features. The free Calculate (Medical Calculator) by QxMD app provides quick intuitive guides to common decision rules and can be customized by medical specialty.
• Drugs: Look up drug dosing, side effects, interactions and other information on free apps from Micromedex and others.
• Photos/videos: These apps are handy for documenting and sharing the appearance of a wound, a patient’s range of motion, or performance on a neurologic exam. Anyone who thinks they see uvula deviation in the throat of a struggling 3-year-old can snap a photo or video for review with other health care providers, medical students, or parents and avoid having to repeat the exam. Images of a wound problem after surgery can be sent to the surgeon when he or she is out of town.
Dr. Broder particularly finds the video useful for children having "pseudoseizures" whose parents demand a neurologic consult, even though the seizure event probably won’t be happening when the neurologist arrives. A video shows the neurologist exactly what Dr. Broder saw. (See the Dos and Don’ts for using photos and videos on the next page.)
Once you’ve got an image or data you want to transmit, avoid texting as first-line means of communication because texts typically are not encrypted. Be careful when e-mailing to make sure it’s going to the correct address and only that address. Use e-mail options such as "confirm delivery" or "request read receipt," and add a sentence to the e-mail saying, "Please delete once no longer necessary for patient care," he advised.
Always document in the patient’s chart that you obtained patient consent and describe what was sent and who received it. Describe any images you send.
Don’t leave images on your portable devices. They’re easily lost, and most have inadequate encryption. Make images part of the medical record by uploading to the patient’s record, printing and scanning, or describing them clearly in the medical record. Then delete them from your device.
Store images and data in "cloud" computing sites with caution, Dr. Broder said. Services such as Google Drive or Dropbox allow sharing of very large files but provide no assurances about the quality of encryption or security. Cloud sites may be best used for giving patients access to instructions, instructional videos, reference papers, anatomic diagrams, etc.
The FDA approved the free Centricity Radiology Mobile Access app, which lets you view CT and MRI images on your iPhone if the images are stored in a GE Centricity PACS (picture archiving and communication system) platform – which may include 20% of U.S. radiology images, according to the company.
The free CloudOn app lets you use MS Office software (including Word, Excel, and Powerpoint) on an iPad.
Various screen replicators that allow you to remotely access your computer desktop from your mobile device (such as ones by Citrix, or Splashtop Remote Desktop) all have the same problem, Dr. Broder said – they’re too clunky and not "touchscreen friendly."
And one final word on an underappreciated perk of medical apps on smartphones: When your medical director stops by, wanting to talk about your productivity, pull out your smartphone to show the data you’ve entered about patient encounters in your free iRVU app, which calculates total RVUs, charges, and average charge per encounter, among other features.
This list only begins to scratch the surface of app use in medicine. Other apps are available for immunization schedules, dictation, infectious disease guides, and teaching aids. Journals provide content to portable devices through apps, and some medical societies offer multifaceted apps such as ACEP Mobile.
Apps on smartphones and tablets will become part of daily medical practice, Dr. Broder predicted, but physicians need to be conscious about their limitations and potential problems as well as their assets.
Dos and Don’ts for Medical Images on Smartphones
Do:
Obtain consent to acquire images or transmit them for the patient’s medical benefit.
Explain to the patient and get consent for any other intended use, such as education or publication.
Tell the patient what you will do with images when their use is completed – delete them or upload them to the medical record.
Confirm receipt if you send to other health care providers.
Specify in your message what that provider should do with the image.
Document in the patient’s chart that consent was obtained, what was sent, who received it, and content of the images.
Don’t:
Obtain images covertly.
Send to any unnecessary recipients.
Show images to anyone for fun.
Post to social media sites.
Blog about "funny" patient encounters.
Dr. Broder owns stock in Apple.
* The photo credits in this story were updated on 10/26/2012.
DENVER – Do you need a stethoscope, a blood pressure monitor, or a tool to assess cardiac rhythms? There are apps for that. In fact, by recent count there are more than 200,000 applications of technology – or "apps" – available for smartphones or tablet devices, and they’re being used more and more for medical purposes.
Need a convenient way to look up drug interactions, pediatric dosing, or clinical decision rules from guidelines? Or how about a translator, a light to examine a finicky infant’s throat, or a "white board" to draw a picture for your patient? Yup – they’re all in apps, and chances are you already may be using some of these.
Dr. Joshua S. Broder expects an exponential increase in the use of apps in medicine as smartphones and tablets continue to proliferate, but their accuracy needs to be verified and potential problems need to be addressed, he said at the annual meeting of the American College of Emergency Physicians.
Apps will be used increasingly for bedside diagnosis and measurement of hemoglobin or other physiologic parameters. "Some of these tests may be taken over by smartphones in the near future," according to Dr. Broder of Duke University, Durham, N.C.
On the other hand, he cautioned, how do you sterilize a smartphone as you move from one hospital room or patient to another, so that you avoid transmitting infection? There are few independent studies so far testing the accuracy and reliability of medical apps, most of which were designed for lay consumers, not physicians.
The Food and Drug Administration is "very interested" in regulating any apps that might substitute for proven technologies such as stethoscopes or that physicians use as accessories to medical devices that already are regulated, he said. The FDA described its approach to deciding which mobile technology to regulate in a draft report in July 2012.
Even the basic functions of smartphones can be convenient in clinical practice, such as taking photos or videos and transmitting information by text or e-mail, but make sure you protect patient privacy and autonomy in ways that maintain trust and comply with HIPAA, Dr. Broder said.
The Duke University Health System has resolved any issues with HIPAA so that it’s safe for physicians to transmit images and video as long as they’re not sent outside the system. Talk to the HIPAA compliance officer at your medical center to establish the ground rules, he said. You can refresh your memory about which parts of data are considered by HIPAA to be protected information via a University of Miami site.
Dr. Broder reviewed some smartphone functions and apps that may be helpful and others that are not yet ready for medical prime time. Many are available for no cost or for as nominal fee. One study of health and fitness apps suggests that apps costing $0.99 or more tend to be higher quality and more trustworthy than less-expensive ones, he noted (J. Med. Internet Res. 2012;14:e72).
• Sleep: One of his residents swears by "smart alarm clock" apps that claim to use a smartphone’s accelerometer to assess where you are in your sleep cycle (based on your movements in bed) to wake you at a time that will leave you feeling less fatigued. You may set for 6 a.m., but the alarm may wake you at 5:45 a.m. Apps like Sleep Cycle ($0.99) and Sleep as Android have some underlying sleep science behind them, but no independent studies have verified their claims.
• CPR: The accelerometer also is used in the free app PocketCPR to give real-time feedback during CPR on the rate and depth of compression. Its has not been cleared by the FDA for use in humans, however, so the app warns that it’s meant for practice only. One prospective, randomized trial in 1,586 cardiac arrests that happened outside of hospitals found that use by emergency services personnel did not significantly change the likelihood of return of spontaneous circulation or other outcomes (BMJ 2011;342:d512).
• Chest: If you’re trying to teach students and residents about heart and lung sounds, or if you still get confused between mitral regurgitation and aortic stenosis, you might want to have a digital stethoscope app handy. These apps interpret heart and lung sounds heard typically through your smartphone’s microphone, which may not be good enough for clinical use. The Thinklabs Stethoscope app at $70 is pricey, compared with others, but it records sounds directly via the smartphone or through an attached electronic stethoscope.
A case that turns an iPhone into an ECG device has been submitted to the FDA for approval. The AliveCor iPhone ECG is expected to sell for between $100 and $200, compared with the usual price tag of thousands of dollars for conventional ECG machines, according to PC Magazine.
One small prospective study of experimental software that programs an iPhone to detect atrial fibrillation by placing a patient’s finger over the camera lens showed it was 98% sensitive and nearly 100% specific in detecting atrial fibrillation (IEEE Trans. Biomed. Eng. 2012 [doi:10.1109/TBME.2012.2208112]).
• Translation: When your hospital’s interpreter isn’t available, a free app like Google Translate can help. You can write or speak in one language and your device will write and say the message in a wide selection of language. You’ll need a wireless Internet connection for some translation apps.
Pull up an app like the free EyeChart on your smartphone or tablet.
• Light: You want to inspect a patient’s sore throat, but the light in the exam room is broken. Use the flash on your smartphone camera, or use one of many free "flashlight" apps that turn the smartphone screen into a light source. Be sure to turn it off when you’re done, though, or your battery will run down quickly.
• Ultrasound: The miniaturization of ultrasound devices continues, with systems like the Mobisante MoblUS that attaches a probe to show images on your smartphone screen.
• Skin: For better evaluation of skin lesions, turn your iPhone into a dermatoscope by using the DermScope app ($4.99) and attaching the phone to the DermScope hardware (sold separately).
• Decision support: The PediStat app ($2.99 and up) makes it easy to determine the right pediatric drug dosing, among other features. The free Calculate (Medical Calculator) by QxMD app provides quick intuitive guides to common decision rules and can be customized by medical specialty.
• Drugs: Look up drug dosing, side effects, interactions and other information on free apps from Micromedex and others.
• Photos/videos: These apps are handy for documenting and sharing the appearance of a wound, a patient’s range of motion, or performance on a neurologic exam. Anyone who thinks they see uvula deviation in the throat of a struggling 3-year-old can snap a photo or video for review with other health care providers, medical students, or parents and avoid having to repeat the exam. Images of a wound problem after surgery can be sent to the surgeon when he or she is out of town.
Dr. Broder particularly finds the video useful for children having "pseudoseizures" whose parents demand a neurologic consult, even though the seizure event probably won’t be happening when the neurologist arrives. A video shows the neurologist exactly what Dr. Broder saw. (See the Dos and Don’ts for using photos and videos on the next page.)
Once you’ve got an image or data you want to transmit, avoid texting as first-line means of communication because texts typically are not encrypted. Be careful when e-mailing to make sure it’s going to the correct address and only that address. Use e-mail options such as "confirm delivery" or "request read receipt," and add a sentence to the e-mail saying, "Please delete once no longer necessary for patient care," he advised.
Always document in the patient’s chart that you obtained patient consent and describe what was sent and who received it. Describe any images you send.
Don’t leave images on your portable devices. They’re easily lost, and most have inadequate encryption. Make images part of the medical record by uploading to the patient’s record, printing and scanning, or describing them clearly in the medical record. Then delete them from your device.
Store images and data in "cloud" computing sites with caution, Dr. Broder said. Services such as Google Drive or Dropbox allow sharing of very large files but provide no assurances about the quality of encryption or security. Cloud sites may be best used for giving patients access to instructions, instructional videos, reference papers, anatomic diagrams, etc.
The FDA approved the free Centricity Radiology Mobile Access app, which lets you view CT and MRI images on your iPhone if the images are stored in a GE Centricity PACS (picture archiving and communication system) platform – which may include 20% of U.S. radiology images, according to the company.
The free CloudOn app lets you use MS Office software (including Word, Excel, and Powerpoint) on an iPad.
Various screen replicators that allow you to remotely access your computer desktop from your mobile device (such as ones by Citrix, or Splashtop Remote Desktop) all have the same problem, Dr. Broder said – they’re too clunky and not "touchscreen friendly."
And one final word on an underappreciated perk of medical apps on smartphones: When your medical director stops by, wanting to talk about your productivity, pull out your smartphone to show the data you’ve entered about patient encounters in your free iRVU app, which calculates total RVUs, charges, and average charge per encounter, among other features.
This list only begins to scratch the surface of app use in medicine. Other apps are available for immunization schedules, dictation, infectious disease guides, and teaching aids. Journals provide content to portable devices through apps, and some medical societies offer multifaceted apps such as ACEP Mobile.
Apps on smartphones and tablets will become part of daily medical practice, Dr. Broder predicted, but physicians need to be conscious about their limitations and potential problems as well as their assets.
Dos and Don’ts for Medical Images on Smartphones
Do:
Obtain consent to acquire images or transmit them for the patient’s medical benefit.
Explain to the patient and get consent for any other intended use, such as education or publication.
Tell the patient what you will do with images when their use is completed – delete them or upload them to the medical record.
Confirm receipt if you send to other health care providers.
Specify in your message what that provider should do with the image.
Document in the patient’s chart that consent was obtained, what was sent, who received it, and content of the images.
Don’t:
Obtain images covertly.
Send to any unnecessary recipients.
Show images to anyone for fun.
Post to social media sites.
Blog about "funny" patient encounters.
Dr. Broder owns stock in Apple.
* The photo credits in this story were updated on 10/26/2012.
EXPERT ANALYSIS FROM THE ANNUAL MEETING OF THE AMERICAN COLLEGE OF EMERGENCY PHYSICIANS