User login
Use OB or GYN code if fetal pole is absent?
If the purpose of the ultrasound is only to check for fetal heart tones, then the correct code is 76815 (ultrasound, pregnant uterus, real time with image documentation limited [eg, fetal heart beat, placental location, fetal position and/or qualitative amniotic fluid volume], one or more fetuses).
While this scan could be performed transvaginally, the amount of work in checking only for fetal heart tones is significantly less than that involved in the OB transvaginal procedure.
Therefore, I recommend that you use the limited ultrasound code even if a vaginal probe was used.
Ms. Witt, former program manager in the Department of Coding and Nomenclature at the American College of Obstetricians and Gynecologists, is an independent coding and documentation consultant. Reimbursement Adviser reflects the most commonly accepted interpretations of CPT-4 and ICD-9-CM coding. When in doubt on a coding or billing matter, check with your individual payer.
If the purpose of the ultrasound is only to check for fetal heart tones, then the correct code is 76815 (ultrasound, pregnant uterus, real time with image documentation limited [eg, fetal heart beat, placental location, fetal position and/or qualitative amniotic fluid volume], one or more fetuses).
While this scan could be performed transvaginally, the amount of work in checking only for fetal heart tones is significantly less than that involved in the OB transvaginal procedure.
Therefore, I recommend that you use the limited ultrasound code even if a vaginal probe was used.
Ms. Witt, former program manager in the Department of Coding and Nomenclature at the American College of Obstetricians and Gynecologists, is an independent coding and documentation consultant. Reimbursement Adviser reflects the most commonly accepted interpretations of CPT-4 and ICD-9-CM coding. When in doubt on a coding or billing matter, check with your individual payer.
If the purpose of the ultrasound is only to check for fetal heart tones, then the correct code is 76815 (ultrasound, pregnant uterus, real time with image documentation limited [eg, fetal heart beat, placental location, fetal position and/or qualitative amniotic fluid volume], one or more fetuses).
While this scan could be performed transvaginally, the amount of work in checking only for fetal heart tones is significantly less than that involved in the OB transvaginal procedure.
Therefore, I recommend that you use the limited ultrasound code even if a vaginal probe was used.
Ms. Witt, former program manager in the Department of Coding and Nomenclature at the American College of Obstetricians and Gynecologists, is an independent coding and documentation consultant. Reimbursement Adviser reflects the most commonly accepted interpretations of CPT-4 and ICD-9-CM coding. When in doubt on a coding or billing matter, check with your individual payer.
How do we code for new HPV vaccine?
- 90649 is the vaccine product code (human papilloma virus [HPV] vaccine, types 6, 11, 16, 18 [quadrivalent], 3-dose schedule, for intramuscular use). A 3-dose schedule means you will be billing for the procedure 3 times during a 6-month period.
- 90471 can also be reported for the administration of the vaccine. (Immunization administration [includes percutaneous, intradermal, subcutaneous, or intramuscular injections]; one vaccine [single or combination vaccine/toxoid])
Adding modifiers. CPT guidelines state that a modifier -51 (multiple procedure) would not be added to either of these codes, and of course if you provide a significant and separate evaluation and management (E/M) service at the time the vaccine is given, you may also bill an E/M code with a modifier -25 added to let the payer know that the E/M service was separate.
Note that almost no payers will pay separately for the E/M code 99211 plus an injection procedure because it represents a minimal, not a significant E/M service.
Insurance coverage unlikely, for now
Until such time as the CDC comes out with a recommendation for the vaccine, coverage is going to be a problem. Insurance plans can be expected to cover the cost of the vaccine only if the CDC Advisory Committee on Immunization Practices recommends HPV vaccination as standard.
Tell patients! Until then, you may want to advise your patients who are candidates for the vaccine that this vaccine may be an out-of-pocket expense for them. Merck, the company that produces the quadrivalent vaccine, has stated that the price will be $120 per injection. The company has indicated that they have created a new program to provide free vaccines including HPV vaccine, for uninsured adults unable to pay.
Ms. Witt, former program manager in the Department of Coding and Nomenclature at the American College of Obstetricians and Gynecologists, is an independent coding and documentation consultant. Reimbursement Adviser reflects the most commonly accepted interpretations of CPT-4 and ICD-9-CM coding. When in doubt on a coding or billing matter, check with your individual payer.
- 90649 is the vaccine product code (human papilloma virus [HPV] vaccine, types 6, 11, 16, 18 [quadrivalent], 3-dose schedule, for intramuscular use). A 3-dose schedule means you will be billing for the procedure 3 times during a 6-month period.
- 90471 can also be reported for the administration of the vaccine. (Immunization administration [includes percutaneous, intradermal, subcutaneous, or intramuscular injections]; one vaccine [single or combination vaccine/toxoid])
Adding modifiers. CPT guidelines state that a modifier -51 (multiple procedure) would not be added to either of these codes, and of course if you provide a significant and separate evaluation and management (E/M) service at the time the vaccine is given, you may also bill an E/M code with a modifier -25 added to let the payer know that the E/M service was separate.
Note that almost no payers will pay separately for the E/M code 99211 plus an injection procedure because it represents a minimal, not a significant E/M service.
Insurance coverage unlikely, for now
Until such time as the CDC comes out with a recommendation for the vaccine, coverage is going to be a problem. Insurance plans can be expected to cover the cost of the vaccine only if the CDC Advisory Committee on Immunization Practices recommends HPV vaccination as standard.
Tell patients! Until then, you may want to advise your patients who are candidates for the vaccine that this vaccine may be an out-of-pocket expense for them. Merck, the company that produces the quadrivalent vaccine, has stated that the price will be $120 per injection. The company has indicated that they have created a new program to provide free vaccines including HPV vaccine, for uninsured adults unable to pay.
Ms. Witt, former program manager in the Department of Coding and Nomenclature at the American College of Obstetricians and Gynecologists, is an independent coding and documentation consultant. Reimbursement Adviser reflects the most commonly accepted interpretations of CPT-4 and ICD-9-CM coding. When in doubt on a coding or billing matter, check with your individual payer.
- 90649 is the vaccine product code (human papilloma virus [HPV] vaccine, types 6, 11, 16, 18 [quadrivalent], 3-dose schedule, for intramuscular use). A 3-dose schedule means you will be billing for the procedure 3 times during a 6-month period.
- 90471 can also be reported for the administration of the vaccine. (Immunization administration [includes percutaneous, intradermal, subcutaneous, or intramuscular injections]; one vaccine [single or combination vaccine/toxoid])
Adding modifiers. CPT guidelines state that a modifier -51 (multiple procedure) would not be added to either of these codes, and of course if you provide a significant and separate evaluation and management (E/M) service at the time the vaccine is given, you may also bill an E/M code with a modifier -25 added to let the payer know that the E/M service was separate.
Note that almost no payers will pay separately for the E/M code 99211 plus an injection procedure because it represents a minimal, not a significant E/M service.
Insurance coverage unlikely, for now
Until such time as the CDC comes out with a recommendation for the vaccine, coverage is going to be a problem. Insurance plans can be expected to cover the cost of the vaccine only if the CDC Advisory Committee on Immunization Practices recommends HPV vaccination as standard.
Tell patients! Until then, you may want to advise your patients who are candidates for the vaccine that this vaccine may be an out-of-pocket expense for them. Merck, the company that produces the quadrivalent vaccine, has stated that the price will be $120 per injection. The company has indicated that they have created a new program to provide free vaccines including HPV vaccine, for uninsured adults unable to pay.
Ms. Witt, former program manager in the Department of Coding and Nomenclature at the American College of Obstetricians and Gynecologists, is an independent coding and documentation consultant. Reimbursement Adviser reflects the most commonly accepted interpretations of CPT-4 and ICD-9-CM coding. When in doubt on a coding or billing matter, check with your individual payer.
What best prevents exercise-induced bronchoconstriction for a child with asthma?
Inhaled short-acting beta-agonists (SABAs) are most effective in preventing exercise-induced bronchoconstriction, followed by inhaled mast cell stabilizers and anticholinergic agents (strength of recommendation [SOR]: A, multiple randomized control trials [RCTs]). Less evidence supports the use of leukotriene antagonists and inhaled corticosteroids, either individually or in combination (SOR: B). Underlying asthma, which commonly contributes to exercise-induced bronchoconstriction, should be diagnosed and controlled first (SOR: C).
Control the asthma and the need for pre-treatment often becomes unnecessary
Because truly isolated exercise-induced bronchoconstriction is uncommon in a nonasthmatic child, and because bronchospasm in a child during exercise more commonly indicates undiagnosed asthma, search for treatable asthma when a child wheezes with exercise. These children have sputum eosinophilia reflecting inflammation, and they are best served by addressing the underlying asthma with inhaled corticosteroids. Once the asthma is under control, their need for “the best pre-treatment” (a SABA) often becomes irrelevant. Ask the child whether he or she is having more shortness of breath and difficulty breathing after exercise than during exercise; this reveals those most likely to benefit from treatment.
Evidence summary
It is difficult to interpret studies on exercise-induced bronchoconstriction (the rather uncommon presence of exercise-induced bronchospasm in a nonasthmatic) and exercise-induced asthma (the more common situation of asthma worsened by exercise). Many studies include both types of patients.
A systematic review of 24 RCTs (of which 13 evaluated children) showed that SABAs, mast cell stabilizers, and anticholinergics provide a significant protective effect against exercise-induced bronchoconstriction with few adverse effects (the child subgroup analyses did not differ significantly from pooled results). Mast cell stabilizers were found less effective at attenuating bronchoconstriction than SABAs, with an average maximum decrease in the forced expiratory volume in 1 second (FEV1) of 11.9% compared with 4.6% for beta-agonists (child subgroup: weighted mean difference=7.3%; 95% confidence interval [CI], 3.9–10.7). Complete protection (defined in this study as maximum % decrease in FEV1 <15% post-exercise) and clinical protection (50% improvement over placebo) measures were included. Fewer children had complete protection (pooled: 66% vs 85%, odds ratio [OR]=0.3; 95% CI, 0.2–0.5) or clinical protection (pooled: 55% vs 77%, OR=0.4; 95% CI, 0.2–0.8).
Mast cell stabilizers were more effective than anticholinergic agents, with average maximum FEV1 decrease of 9.4% compared with 16.0% on anticholinergics (child subgroup: weighted mean difference=6.6%; 95% CI, 1.0–12.2). They also provided more individuals with complete protection (pooled: 73% vs 56%, OR=2.2; 95% CI, 1.3–3.7) and clinical protection (pooled: 73% vs 52%, OR=2.7; 95% CI, 1.1–6.4). Combining mast cell stabilizers with SABAs did not produce significant advantages in pulmonary function over SABAs alone. No significant subgroup differences were seen based on age, severity, or study quality.1
Another systematic review of 20 RCTs (15 studying children and 5 studying adults) with patients aged >6 years showed that 4 mg of nedocromil (Tilade) inhaled 15 to 60 minutes before exercise significantly reduced the severity and duration of exercise-induced bronchoconstriction compared with placebo. It had a greater effect on patients with severe exercise-induced bronchoconstriction (defined as an exercise-induced fall in lung function >30% from baseline).2
Eight RCTs (5 studying children) were included in a systematic review of patients aged >6 years that found no significant difference between nedocromil and cromoglycate with regards to decrease in FEV1, complete protection, clinical protection, or side effects.3
Leukotriene antagonists have been recommended on a trial basis with follow-up to evaluate the treatment response.4 Although there are several long-term studies of leukotriene antagonists for adults, few have studied children. A recent study assessed the effects of montelukast (Singulair) on 64 children with exercise-induced bronchoconstriction. After 8 weeks of treatment, the montelukast group showed significant improvements (compared with placebo) in asthma symptom scores (24.3±8.2 before vs 17.8±6.8 after 8 weeks of montelukast treatment, P<.05; vs 17.7±6.7 8 weeks after stopping treatment, P<.05), maximum percent fall in FEV1 after exercise (36.5±10.2% before vs 27.6±14.4% after 8 wks of treatment, P<.01; vs 26.7±19.4% 8 weeks after stopping treatment, P<.01), and time to recovery (41.8±8.1 min before vs 25.3±23.3 min after 8 weeks of treatment, P<.01; vs 27.7±26.5 min 8 weeks after stopping, P<.05).5
Therapies awaiting further study include a combination of budesonide (Pulmicort) and formoterol (Foradil), which is similar to the currently available preparation of fluticasone and salmeterol (Advair Diskus) but contains a long-acting beta-agonist with quicker onset. The phosphodiesterase-4 inhibitors roflumilast (Daxas) and cilomilast (Ariflo)—neither of which have been FDA-approved—and inhaled low-molecular-weight heparin have potential efficacy.6 Other options suggested for this problem—including inhaled furosemide, vitamin C, antihistamines, calcium channel blockers, and reduced dietary salt intake—need further study.7
Recommendations from others
Review articles on this topic suggest the following to prevent exercise-induced bronchoconstriction: controlling baseline asthma, avoiding known allergens, choosing appropriate sports with short bursts of activity, and selecting warm, humid environments for the activities.6-8 Some authorities recommend warm-up before athletic events to take advantage of a 30- to 90-minute refractory period. This can help prevent exercise-induced bronchoconstriction; however, effects vary considerably from person to person.7,8
The National Asthma Education and Prevention Program recommends prevention of exercise-induced bronchoconstriction by optimally controlling underlying asthma. If a patient remains symptomatic during exercise, you should review medication usage, understanding of dosage instructions, and administration technique before any changes in the treatment regimen.9
1. Spooner CH, Spooner GR, Rowe BH. Mast-cell stabilising agents to prevent exercise-induced bronchoconstriction. Cochrane Database Syst Rev 2003;(4):CD002307.
2. Spooner CH, Saunders LD, Rowe BH. Nedocromil sodium for preventing exercise-induced bronchoconstriction. Cochrane Database Syst Rev 2002;(1):CD001183.
3. Kelly K, Spooner CH, Rowe BH. Nedocromil sodium versus sodium cromoglycate for preventing exercise-induced bronchoconstriction in asthmatics. Cochrane Database Syst Rev 2000;(4):CD002731.
4. Moraes TJ, Selvadurai H. Management of exercise-induced bronchospasm in children: the role of leukotriene antagonists. Treat Respir Med 2004;3:9-15.
5. Kim JH, Lee SY, Kim HB, et al. Prolonged effect of montelukast in asthmatic children with exercise-induced bronchoconstriction. Pediatr Pulmonol 2005;39(2):162-166.
6. Storms WW. Asthma associated with exercise. Immunol Allergy Clin North Am 2005;25:31-43.
7. Sinha T, David AK. Recognition and management of exercise-induced bronchospasm. Am Fam Physician 2003;67(4):769-774, 675.
8. DYNAMED [database online]. Columbia, Mo: Dynamic Medical Information Systems, LLC;1995, continuous daily updating. Updated December 2, 2004.
9. Williams SG, Schmidt DK, Redd SC, Storms W. Key clinical activities for quality asthma care: recommendations of the National Asthma Education and Prevention Program. MMWR Recomm Rep 2003;52(RR-6):1-8.
Inhaled short-acting beta-agonists (SABAs) are most effective in preventing exercise-induced bronchoconstriction, followed by inhaled mast cell stabilizers and anticholinergic agents (strength of recommendation [SOR]: A, multiple randomized control trials [RCTs]). Less evidence supports the use of leukotriene antagonists and inhaled corticosteroids, either individually or in combination (SOR: B). Underlying asthma, which commonly contributes to exercise-induced bronchoconstriction, should be diagnosed and controlled first (SOR: C).
Control the asthma and the need for pre-treatment often becomes unnecessary
Because truly isolated exercise-induced bronchoconstriction is uncommon in a nonasthmatic child, and because bronchospasm in a child during exercise more commonly indicates undiagnosed asthma, search for treatable asthma when a child wheezes with exercise. These children have sputum eosinophilia reflecting inflammation, and they are best served by addressing the underlying asthma with inhaled corticosteroids. Once the asthma is under control, their need for “the best pre-treatment” (a SABA) often becomes irrelevant. Ask the child whether he or she is having more shortness of breath and difficulty breathing after exercise than during exercise; this reveals those most likely to benefit from treatment.
Evidence summary
It is difficult to interpret studies on exercise-induced bronchoconstriction (the rather uncommon presence of exercise-induced bronchospasm in a nonasthmatic) and exercise-induced asthma (the more common situation of asthma worsened by exercise). Many studies include both types of patients.
A systematic review of 24 RCTs (of which 13 evaluated children) showed that SABAs, mast cell stabilizers, and anticholinergics provide a significant protective effect against exercise-induced bronchoconstriction with few adverse effects (the child subgroup analyses did not differ significantly from pooled results). Mast cell stabilizers were found less effective at attenuating bronchoconstriction than SABAs, with an average maximum decrease in the forced expiratory volume in 1 second (FEV1) of 11.9% compared with 4.6% for beta-agonists (child subgroup: weighted mean difference=7.3%; 95% confidence interval [CI], 3.9–10.7). Complete protection (defined in this study as maximum % decrease in FEV1 <15% post-exercise) and clinical protection (50% improvement over placebo) measures were included. Fewer children had complete protection (pooled: 66% vs 85%, odds ratio [OR]=0.3; 95% CI, 0.2–0.5) or clinical protection (pooled: 55% vs 77%, OR=0.4; 95% CI, 0.2–0.8).
Mast cell stabilizers were more effective than anticholinergic agents, with average maximum FEV1 decrease of 9.4% compared with 16.0% on anticholinergics (child subgroup: weighted mean difference=6.6%; 95% CI, 1.0–12.2). They also provided more individuals with complete protection (pooled: 73% vs 56%, OR=2.2; 95% CI, 1.3–3.7) and clinical protection (pooled: 73% vs 52%, OR=2.7; 95% CI, 1.1–6.4). Combining mast cell stabilizers with SABAs did not produce significant advantages in pulmonary function over SABAs alone. No significant subgroup differences were seen based on age, severity, or study quality.1
Another systematic review of 20 RCTs (15 studying children and 5 studying adults) with patients aged >6 years showed that 4 mg of nedocromil (Tilade) inhaled 15 to 60 minutes before exercise significantly reduced the severity and duration of exercise-induced bronchoconstriction compared with placebo. It had a greater effect on patients with severe exercise-induced bronchoconstriction (defined as an exercise-induced fall in lung function >30% from baseline).2
Eight RCTs (5 studying children) were included in a systematic review of patients aged >6 years that found no significant difference between nedocromil and cromoglycate with regards to decrease in FEV1, complete protection, clinical protection, or side effects.3
Leukotriene antagonists have been recommended on a trial basis with follow-up to evaluate the treatment response.4 Although there are several long-term studies of leukotriene antagonists for adults, few have studied children. A recent study assessed the effects of montelukast (Singulair) on 64 children with exercise-induced bronchoconstriction. After 8 weeks of treatment, the montelukast group showed significant improvements (compared with placebo) in asthma symptom scores (24.3±8.2 before vs 17.8±6.8 after 8 weeks of montelukast treatment, P<.05; vs 17.7±6.7 8 weeks after stopping treatment, P<.05), maximum percent fall in FEV1 after exercise (36.5±10.2% before vs 27.6±14.4% after 8 wks of treatment, P<.01; vs 26.7±19.4% 8 weeks after stopping treatment, P<.01), and time to recovery (41.8±8.1 min before vs 25.3±23.3 min after 8 weeks of treatment, P<.01; vs 27.7±26.5 min 8 weeks after stopping, P<.05).5
Therapies awaiting further study include a combination of budesonide (Pulmicort) and formoterol (Foradil), which is similar to the currently available preparation of fluticasone and salmeterol (Advair Diskus) but contains a long-acting beta-agonist with quicker onset. The phosphodiesterase-4 inhibitors roflumilast (Daxas) and cilomilast (Ariflo)—neither of which have been FDA-approved—and inhaled low-molecular-weight heparin have potential efficacy.6 Other options suggested for this problem—including inhaled furosemide, vitamin C, antihistamines, calcium channel blockers, and reduced dietary salt intake—need further study.7
Recommendations from others
Review articles on this topic suggest the following to prevent exercise-induced bronchoconstriction: controlling baseline asthma, avoiding known allergens, choosing appropriate sports with short bursts of activity, and selecting warm, humid environments for the activities.6-8 Some authorities recommend warm-up before athletic events to take advantage of a 30- to 90-minute refractory period. This can help prevent exercise-induced bronchoconstriction; however, effects vary considerably from person to person.7,8
The National Asthma Education and Prevention Program recommends prevention of exercise-induced bronchoconstriction by optimally controlling underlying asthma. If a patient remains symptomatic during exercise, you should review medication usage, understanding of dosage instructions, and administration technique before any changes in the treatment regimen.9
Inhaled short-acting beta-agonists (SABAs) are most effective in preventing exercise-induced bronchoconstriction, followed by inhaled mast cell stabilizers and anticholinergic agents (strength of recommendation [SOR]: A, multiple randomized control trials [RCTs]). Less evidence supports the use of leukotriene antagonists and inhaled corticosteroids, either individually or in combination (SOR: B). Underlying asthma, which commonly contributes to exercise-induced bronchoconstriction, should be diagnosed and controlled first (SOR: C).
Control the asthma and the need for pre-treatment often becomes unnecessary
Because truly isolated exercise-induced bronchoconstriction is uncommon in a nonasthmatic child, and because bronchospasm in a child during exercise more commonly indicates undiagnosed asthma, search for treatable asthma when a child wheezes with exercise. These children have sputum eosinophilia reflecting inflammation, and they are best served by addressing the underlying asthma with inhaled corticosteroids. Once the asthma is under control, their need for “the best pre-treatment” (a SABA) often becomes irrelevant. Ask the child whether he or she is having more shortness of breath and difficulty breathing after exercise than during exercise; this reveals those most likely to benefit from treatment.
Evidence summary
It is difficult to interpret studies on exercise-induced bronchoconstriction (the rather uncommon presence of exercise-induced bronchospasm in a nonasthmatic) and exercise-induced asthma (the more common situation of asthma worsened by exercise). Many studies include both types of patients.
A systematic review of 24 RCTs (of which 13 evaluated children) showed that SABAs, mast cell stabilizers, and anticholinergics provide a significant protective effect against exercise-induced bronchoconstriction with few adverse effects (the child subgroup analyses did not differ significantly from pooled results). Mast cell stabilizers were found less effective at attenuating bronchoconstriction than SABAs, with an average maximum decrease in the forced expiratory volume in 1 second (FEV1) of 11.9% compared with 4.6% for beta-agonists (child subgroup: weighted mean difference=7.3%; 95% confidence interval [CI], 3.9–10.7). Complete protection (defined in this study as maximum % decrease in FEV1 <15% post-exercise) and clinical protection (50% improvement over placebo) measures were included. Fewer children had complete protection (pooled: 66% vs 85%, odds ratio [OR]=0.3; 95% CI, 0.2–0.5) or clinical protection (pooled: 55% vs 77%, OR=0.4; 95% CI, 0.2–0.8).
Mast cell stabilizers were more effective than anticholinergic agents, with average maximum FEV1 decrease of 9.4% compared with 16.0% on anticholinergics (child subgroup: weighted mean difference=6.6%; 95% CI, 1.0–12.2). They also provided more individuals with complete protection (pooled: 73% vs 56%, OR=2.2; 95% CI, 1.3–3.7) and clinical protection (pooled: 73% vs 52%, OR=2.7; 95% CI, 1.1–6.4). Combining mast cell stabilizers with SABAs did not produce significant advantages in pulmonary function over SABAs alone. No significant subgroup differences were seen based on age, severity, or study quality.1
Another systematic review of 20 RCTs (15 studying children and 5 studying adults) with patients aged >6 years showed that 4 mg of nedocromil (Tilade) inhaled 15 to 60 minutes before exercise significantly reduced the severity and duration of exercise-induced bronchoconstriction compared with placebo. It had a greater effect on patients with severe exercise-induced bronchoconstriction (defined as an exercise-induced fall in lung function >30% from baseline).2
Eight RCTs (5 studying children) were included in a systematic review of patients aged >6 years that found no significant difference between nedocromil and cromoglycate with regards to decrease in FEV1, complete protection, clinical protection, or side effects.3
Leukotriene antagonists have been recommended on a trial basis with follow-up to evaluate the treatment response.4 Although there are several long-term studies of leukotriene antagonists for adults, few have studied children. A recent study assessed the effects of montelukast (Singulair) on 64 children with exercise-induced bronchoconstriction. After 8 weeks of treatment, the montelukast group showed significant improvements (compared with placebo) in asthma symptom scores (24.3±8.2 before vs 17.8±6.8 after 8 weeks of montelukast treatment, P<.05; vs 17.7±6.7 8 weeks after stopping treatment, P<.05), maximum percent fall in FEV1 after exercise (36.5±10.2% before vs 27.6±14.4% after 8 wks of treatment, P<.01; vs 26.7±19.4% 8 weeks after stopping treatment, P<.01), and time to recovery (41.8±8.1 min before vs 25.3±23.3 min after 8 weeks of treatment, P<.01; vs 27.7±26.5 min 8 weeks after stopping, P<.05).5
Therapies awaiting further study include a combination of budesonide (Pulmicort) and formoterol (Foradil), which is similar to the currently available preparation of fluticasone and salmeterol (Advair Diskus) but contains a long-acting beta-agonist with quicker onset. The phosphodiesterase-4 inhibitors roflumilast (Daxas) and cilomilast (Ariflo)—neither of which have been FDA-approved—and inhaled low-molecular-weight heparin have potential efficacy.6 Other options suggested for this problem—including inhaled furosemide, vitamin C, antihistamines, calcium channel blockers, and reduced dietary salt intake—need further study.7
Recommendations from others
Review articles on this topic suggest the following to prevent exercise-induced bronchoconstriction: controlling baseline asthma, avoiding known allergens, choosing appropriate sports with short bursts of activity, and selecting warm, humid environments for the activities.6-8 Some authorities recommend warm-up before athletic events to take advantage of a 30- to 90-minute refractory period. This can help prevent exercise-induced bronchoconstriction; however, effects vary considerably from person to person.7,8
The National Asthma Education and Prevention Program recommends prevention of exercise-induced bronchoconstriction by optimally controlling underlying asthma. If a patient remains symptomatic during exercise, you should review medication usage, understanding of dosage instructions, and administration technique before any changes in the treatment regimen.9
1. Spooner CH, Spooner GR, Rowe BH. Mast-cell stabilising agents to prevent exercise-induced bronchoconstriction. Cochrane Database Syst Rev 2003;(4):CD002307.
2. Spooner CH, Saunders LD, Rowe BH. Nedocromil sodium for preventing exercise-induced bronchoconstriction. Cochrane Database Syst Rev 2002;(1):CD001183.
3. Kelly K, Spooner CH, Rowe BH. Nedocromil sodium versus sodium cromoglycate for preventing exercise-induced bronchoconstriction in asthmatics. Cochrane Database Syst Rev 2000;(4):CD002731.
4. Moraes TJ, Selvadurai H. Management of exercise-induced bronchospasm in children: the role of leukotriene antagonists. Treat Respir Med 2004;3:9-15.
5. Kim JH, Lee SY, Kim HB, et al. Prolonged effect of montelukast in asthmatic children with exercise-induced bronchoconstriction. Pediatr Pulmonol 2005;39(2):162-166.
6. Storms WW. Asthma associated with exercise. Immunol Allergy Clin North Am 2005;25:31-43.
7. Sinha T, David AK. Recognition and management of exercise-induced bronchospasm. Am Fam Physician 2003;67(4):769-774, 675.
8. DYNAMED [database online]. Columbia, Mo: Dynamic Medical Information Systems, LLC;1995, continuous daily updating. Updated December 2, 2004.
9. Williams SG, Schmidt DK, Redd SC, Storms W. Key clinical activities for quality asthma care: recommendations of the National Asthma Education and Prevention Program. MMWR Recomm Rep 2003;52(RR-6):1-8.
1. Spooner CH, Spooner GR, Rowe BH. Mast-cell stabilising agents to prevent exercise-induced bronchoconstriction. Cochrane Database Syst Rev 2003;(4):CD002307.
2. Spooner CH, Saunders LD, Rowe BH. Nedocromil sodium for preventing exercise-induced bronchoconstriction. Cochrane Database Syst Rev 2002;(1):CD001183.
3. Kelly K, Spooner CH, Rowe BH. Nedocromil sodium versus sodium cromoglycate for preventing exercise-induced bronchoconstriction in asthmatics. Cochrane Database Syst Rev 2000;(4):CD002731.
4. Moraes TJ, Selvadurai H. Management of exercise-induced bronchospasm in children: the role of leukotriene antagonists. Treat Respir Med 2004;3:9-15.
5. Kim JH, Lee SY, Kim HB, et al. Prolonged effect of montelukast in asthmatic children with exercise-induced bronchoconstriction. Pediatr Pulmonol 2005;39(2):162-166.
6. Storms WW. Asthma associated with exercise. Immunol Allergy Clin North Am 2005;25:31-43.
7. Sinha T, David AK. Recognition and management of exercise-induced bronchospasm. Am Fam Physician 2003;67(4):769-774, 675.
8. DYNAMED [database online]. Columbia, Mo: Dynamic Medical Information Systems, LLC;1995, continuous daily updating. Updated December 2, 2004.
9. Williams SG, Schmidt DK, Redd SC, Storms W. Key clinical activities for quality asthma care: recommendations of the National Asthma Education and Prevention Program. MMWR Recomm Rep 2003;52(RR-6):1-8.
Evidence-based answers from the Family Physicians Inquiries Network
Of time and wounds
Our last date
It was dusk, and I stared glumly at cold rain falling onto steaming rooftop vents outside the clouded window of my husband's hospital room. I was feeling more than a little sorry for myself. Out there, it was a Friday night full of the promise of weekend diversions. In here, it was much like the night before, and the night before thata waiting game.
Waiting to see if Doug would live or die. Waiting to see if he could overcome the terrible malaise that gripped his body and come home. Waiting to see if he would ever be able to move his arms and legs again.
Turning from the window, I found Doug awake. He had only been off the ventilator for a short time and wasn't able to talk. I had just come from work, having been away from him since late morning. It seemed as though there should be plenty of things to tell him, but patter about the office and traffic did not belong in this room, and he'd already heard endlessly that his family and friends were pulling hard for him.
So I held his hand and leaned on the side rail of his bed, getting my face as close to his as I could. We locked eyes and smiled, and words flowed silently between us, just as they had so many times over our 25 years of marriage. God, how I'd missed that!
The nurses had dimmed the lights in the ICU for the night, and though it was far from dark, the room had a nicer ambience than usual. Straightening up, I searched the channels on Doug's TV for something more suitable than CNN. Suddenly, there were Jake and Elwood sauntering into Aretha Franklin's eatery on their mission from God. Hey, Doug. I said, It's The Blues Brothers. Moments later, Aretha was belting out R‐E‐S‐P‐E‐C‐T, and I was gyrating. Doug was doing the only thing he could, swinging his head from side to side in time to the music.
It was just a tiny moment, a vignette unnoticed by anyone but us two in the life of that ICU. But it is the sweetest memory I have of that time. Just days before his death at age 55, the spark that was us had flamed briefly to life.
It was dusk, and I stared glumly at cold rain falling onto steaming rooftop vents outside the clouded window of my husband's hospital room. I was feeling more than a little sorry for myself. Out there, it was a Friday night full of the promise of weekend diversions. In here, it was much like the night before, and the night before thata waiting game.
Waiting to see if Doug would live or die. Waiting to see if he could overcome the terrible malaise that gripped his body and come home. Waiting to see if he would ever be able to move his arms and legs again.
Turning from the window, I found Doug awake. He had only been off the ventilator for a short time and wasn't able to talk. I had just come from work, having been away from him since late morning. It seemed as though there should be plenty of things to tell him, but patter about the office and traffic did not belong in this room, and he'd already heard endlessly that his family and friends were pulling hard for him.
So I held his hand and leaned on the side rail of his bed, getting my face as close to his as I could. We locked eyes and smiled, and words flowed silently between us, just as they had so many times over our 25 years of marriage. God, how I'd missed that!
The nurses had dimmed the lights in the ICU for the night, and though it was far from dark, the room had a nicer ambience than usual. Straightening up, I searched the channels on Doug's TV for something more suitable than CNN. Suddenly, there were Jake and Elwood sauntering into Aretha Franklin's eatery on their mission from God. Hey, Doug. I said, It's The Blues Brothers. Moments later, Aretha was belting out R‐E‐S‐P‐E‐C‐T, and I was gyrating. Doug was doing the only thing he could, swinging his head from side to side in time to the music.
It was just a tiny moment, a vignette unnoticed by anyone but us two in the life of that ICU. But it is the sweetest memory I have of that time. Just days before his death at age 55, the spark that was us had flamed briefly to life.
It was dusk, and I stared glumly at cold rain falling onto steaming rooftop vents outside the clouded window of my husband's hospital room. I was feeling more than a little sorry for myself. Out there, it was a Friday night full of the promise of weekend diversions. In here, it was much like the night before, and the night before thata waiting game.
Waiting to see if Doug would live or die. Waiting to see if he could overcome the terrible malaise that gripped his body and come home. Waiting to see if he would ever be able to move his arms and legs again.
Turning from the window, I found Doug awake. He had only been off the ventilator for a short time and wasn't able to talk. I had just come from work, having been away from him since late morning. It seemed as though there should be plenty of things to tell him, but patter about the office and traffic did not belong in this room, and he'd already heard endlessly that his family and friends were pulling hard for him.
So I held his hand and leaned on the side rail of his bed, getting my face as close to his as I could. We locked eyes and smiled, and words flowed silently between us, just as they had so many times over our 25 years of marriage. God, how I'd missed that!
The nurses had dimmed the lights in the ICU for the night, and though it was far from dark, the room had a nicer ambience than usual. Straightening up, I searched the channels on Doug's TV for something more suitable than CNN. Suddenly, there were Jake and Elwood sauntering into Aretha Franklin's eatery on their mission from God. Hey, Doug. I said, It's The Blues Brothers. Moments later, Aretha was belting out R‐E‐S‐P‐E‐C‐T, and I was gyrating. Doug was doing the only thing he could, swinging his head from side to side in time to the music.
It was just a tiny moment, a vignette unnoticed by anyone but us two in the life of that ICU. But it is the sweetest memory I have of that time. Just days before his death at age 55, the spark that was us had flamed briefly to life.
Handoffs
My dad was a hero. I suppose it's natural that I feel that way, growing up as I did in a small rural town where my father was the only doctor. Once, he was called to attend to a farmer who had climbed down from his combine, stating flatly that he was going to die. After this pronouncement, the farmer sat on the ground, where over the next hour he proceeded to do just that.
With the benefit of my own 30‐year career in medicine, it's easy to opine that this farmer probably had a pulmonary embolism from a lower extremity deep vein thrombosis (hours spent on the seat of a tractor are the rural equivalent of a long plane ride). I'm sure he was experiencing the feeling of impending doom that can signal such an event. What's harder to conjecture is how my father was able to quickly assess the situation, know his limitations, and still have the guts to carry on. There was no dialing 911, no starting of IVs, and no CPR once the chain of events started. Even if the doomed patient had been taken to the hospital, he would likely have died en route. If not, the personnel, equipment, and therapeutics there would not have been much more than those available in the wheat field. My father had all the tools he needed right there at the scene to bring comfort to that poor individual in the final moments of his life. He also had the courage to use them. What a hero!
Other events and memories of my father flash through my mind as I remember those times. Dozens of antibiotics rendered for cold virusesbut what a placebo effect from that big shot in the butt! Tonsillectomies performed right in the office, with a nurse‐anesthetist coming in once a week to render sedation. (That is until one of a set of twins transiently quit breathing, after which all surgeries were moved to the hospital!) A shot of adrenaline, given unsuccessfully, via the intracardiac route to a high school football player who suddenly collapsed on the 30‐yard line while the usually boisterous Friday‐night crowd watched in stunned horror. Countless hours waiting in the car for my dad to make house calls or finish rounds at the local hospital.
There, in that place and at that time, my dad was it. He embodied medical science, such as it was, in our little community. His black bag and bow tie helped complete the image. He did what he could, limited as it may have been, and he loved every minute of it. Sure, he sometimes complained. It was tough when a patient showed up at the back door and interrupted dinner. He didn't much like it when then‐president LBJ tried to socialize medicine with the Medicare Act. Most of all, he hated it when my mother insisted he take a job with regular hours at a VA hospital after he had two heart attacks and a bout with colon cancer. Mostly though, I remember a happy, self‐actualized guy, especially when he was at work.
My dad died when I was a freshman in medical school, so exactly what he thought about those times I really don't know. I do know, however, how much I loved him and how much I wanted to be just like him.
In medical school and later during my residency, I had other heroes. Appropriately, for someone who ended up an internist and hospitalist, most were master diagnosticians. There was J. Willis Hurst, the renowned cardiologist, who I once saw diagnose cardiac sarcoid solely on the basis of a 12‐lead electrocardiogram. And there was Jay Sanford, author of that little book on antibiotics known as the bugs and drugs book, tucked to this day into my lab coat pocket, who I once heard tell of going to war‐torn Vietnam to collect water samples in order to make the diagnosis of babesiosis. Finally, there was Walter McDonald, then chief of medicine at the Portland VA hospital, later executive vice‐president of the American College of Physicians, who, to a third‐year medical student like I was then, seemed omniscient about each case relayed to him at morning report. They all seemed so confident and clever; so dedicated, diligent, and proud. I wanted to be just like them.
Now, as a vice‐president for medical affairs, given the task of improving quality at a large teaching hospital, I herd cats. I recite from memory the embarrassing statistics on medical errors revealed by the Institute of Medicine in 1999. I plead for standardization and strive to eliminate variability in hospital practice. From the evidence, I extract guidelines and implement them via standard order sets. But frequently I look back and wonder.
Would the practice of medicine, where the goal is standardization and lack of variability, appeal to my older heroes? How would the practices of exceeding benchmarks, following pathways, and complying with indicators play to the icons of my past? Would they be satisfied to practice in today's health care environment? Or would they perish the thought if asked to standardize their orders and comply with best‐practice norms? After all, there was nothing normal about these guys! Sure they knew the literature and would be the first to insist that practice be evidenced based, but for them, that was never enough. What made them so attractive was their ability to go beyond what any of us able to read the journals could achieve. These men (and, sadly, most, but not all, were men) treasured autonomy, yearned for diagnostic brilliance, and doggedly pursued therapeutic breakthroughs. They set the standards that mere mortals like me aspired to achieve. They were heroes.
So we must be careful not to stifle genius while promoting compliance. We must not push the standardization of health care to a point where an individual's ability to rise above the pack is limited. We should remember that with decreased variability comes the risk of denying innovation. For keep in mind that improved methods like those of hospital medicine exist because those before us sought a better way. They were able to try, and sometimes fail, to use their intuition and individual street smarts and to take risks for the greater good. To use a tired phrase, they were able to think outside the box. In the name of quality, we must not further limit the confines of that box. We must assure that however much we strive to elevate the norm, we do not restrict those few who set the curve. We must allow for heroes.
I believe our profession can produce those who will carry the banner forward. I already have some new heroesDon Berwick, Peter Pronovost, and Bob Wachter. These individuals have demonstrated the ability to combine the patient‐centered care practiced by my father with the evidenced‐based knowledge and intuitive genius of my academic mentors. They are then able to apply this admixture of competencies to the problems facing health care today such as the deficiencies in patient safety and the inefficiencies of delivery.
New heroes will attract another generation of the best and the brightest, and the cycle will repeat. With careful foresight we can assure that this will happen. To do otherwise is unthinkable. We must have heroes.
My dad was a hero. I suppose it's natural that I feel that way, growing up as I did in a small rural town where my father was the only doctor. Once, he was called to attend to a farmer who had climbed down from his combine, stating flatly that he was going to die. After this pronouncement, the farmer sat on the ground, where over the next hour he proceeded to do just that.
With the benefit of my own 30‐year career in medicine, it's easy to opine that this farmer probably had a pulmonary embolism from a lower extremity deep vein thrombosis (hours spent on the seat of a tractor are the rural equivalent of a long plane ride). I'm sure he was experiencing the feeling of impending doom that can signal such an event. What's harder to conjecture is how my father was able to quickly assess the situation, know his limitations, and still have the guts to carry on. There was no dialing 911, no starting of IVs, and no CPR once the chain of events started. Even if the doomed patient had been taken to the hospital, he would likely have died en route. If not, the personnel, equipment, and therapeutics there would not have been much more than those available in the wheat field. My father had all the tools he needed right there at the scene to bring comfort to that poor individual in the final moments of his life. He also had the courage to use them. What a hero!
Other events and memories of my father flash through my mind as I remember those times. Dozens of antibiotics rendered for cold virusesbut what a placebo effect from that big shot in the butt! Tonsillectomies performed right in the office, with a nurse‐anesthetist coming in once a week to render sedation. (That is until one of a set of twins transiently quit breathing, after which all surgeries were moved to the hospital!) A shot of adrenaline, given unsuccessfully, via the intracardiac route to a high school football player who suddenly collapsed on the 30‐yard line while the usually boisterous Friday‐night crowd watched in stunned horror. Countless hours waiting in the car for my dad to make house calls or finish rounds at the local hospital.
There, in that place and at that time, my dad was it. He embodied medical science, such as it was, in our little community. His black bag and bow tie helped complete the image. He did what he could, limited as it may have been, and he loved every minute of it. Sure, he sometimes complained. It was tough when a patient showed up at the back door and interrupted dinner. He didn't much like it when then‐president LBJ tried to socialize medicine with the Medicare Act. Most of all, he hated it when my mother insisted he take a job with regular hours at a VA hospital after he had two heart attacks and a bout with colon cancer. Mostly though, I remember a happy, self‐actualized guy, especially when he was at work.
My dad died when I was a freshman in medical school, so exactly what he thought about those times I really don't know. I do know, however, how much I loved him and how much I wanted to be just like him.
In medical school and later during my residency, I had other heroes. Appropriately, for someone who ended up an internist and hospitalist, most were master diagnosticians. There was J. Willis Hurst, the renowned cardiologist, who I once saw diagnose cardiac sarcoid solely on the basis of a 12‐lead electrocardiogram. And there was Jay Sanford, author of that little book on antibiotics known as the bugs and drugs book, tucked to this day into my lab coat pocket, who I once heard tell of going to war‐torn Vietnam to collect water samples in order to make the diagnosis of babesiosis. Finally, there was Walter McDonald, then chief of medicine at the Portland VA hospital, later executive vice‐president of the American College of Physicians, who, to a third‐year medical student like I was then, seemed omniscient about each case relayed to him at morning report. They all seemed so confident and clever; so dedicated, diligent, and proud. I wanted to be just like them.
Now, as a vice‐president for medical affairs, given the task of improving quality at a large teaching hospital, I herd cats. I recite from memory the embarrassing statistics on medical errors revealed by the Institute of Medicine in 1999. I plead for standardization and strive to eliminate variability in hospital practice. From the evidence, I extract guidelines and implement them via standard order sets. But frequently I look back and wonder.
Would the practice of medicine, where the goal is standardization and lack of variability, appeal to my older heroes? How would the practices of exceeding benchmarks, following pathways, and complying with indicators play to the icons of my past? Would they be satisfied to practice in today's health care environment? Or would they perish the thought if asked to standardize their orders and comply with best‐practice norms? After all, there was nothing normal about these guys! Sure they knew the literature and would be the first to insist that practice be evidenced based, but for them, that was never enough. What made them so attractive was their ability to go beyond what any of us able to read the journals could achieve. These men (and, sadly, most, but not all, were men) treasured autonomy, yearned for diagnostic brilliance, and doggedly pursued therapeutic breakthroughs. They set the standards that mere mortals like me aspired to achieve. They were heroes.
So we must be careful not to stifle genius while promoting compliance. We must not push the standardization of health care to a point where an individual's ability to rise above the pack is limited. We should remember that with decreased variability comes the risk of denying innovation. For keep in mind that improved methods like those of hospital medicine exist because those before us sought a better way. They were able to try, and sometimes fail, to use their intuition and individual street smarts and to take risks for the greater good. To use a tired phrase, they were able to think outside the box. In the name of quality, we must not further limit the confines of that box. We must assure that however much we strive to elevate the norm, we do not restrict those few who set the curve. We must allow for heroes.
I believe our profession can produce those who will carry the banner forward. I already have some new heroesDon Berwick, Peter Pronovost, and Bob Wachter. These individuals have demonstrated the ability to combine the patient‐centered care practiced by my father with the evidenced‐based knowledge and intuitive genius of my academic mentors. They are then able to apply this admixture of competencies to the problems facing health care today such as the deficiencies in patient safety and the inefficiencies of delivery.
New heroes will attract another generation of the best and the brightest, and the cycle will repeat. With careful foresight we can assure that this will happen. To do otherwise is unthinkable. We must have heroes.
My dad was a hero. I suppose it's natural that I feel that way, growing up as I did in a small rural town where my father was the only doctor. Once, he was called to attend to a farmer who had climbed down from his combine, stating flatly that he was going to die. After this pronouncement, the farmer sat on the ground, where over the next hour he proceeded to do just that.
With the benefit of my own 30‐year career in medicine, it's easy to opine that this farmer probably had a pulmonary embolism from a lower extremity deep vein thrombosis (hours spent on the seat of a tractor are the rural equivalent of a long plane ride). I'm sure he was experiencing the feeling of impending doom that can signal such an event. What's harder to conjecture is how my father was able to quickly assess the situation, know his limitations, and still have the guts to carry on. There was no dialing 911, no starting of IVs, and no CPR once the chain of events started. Even if the doomed patient had been taken to the hospital, he would likely have died en route. If not, the personnel, equipment, and therapeutics there would not have been much more than those available in the wheat field. My father had all the tools he needed right there at the scene to bring comfort to that poor individual in the final moments of his life. He also had the courage to use them. What a hero!
Other events and memories of my father flash through my mind as I remember those times. Dozens of antibiotics rendered for cold virusesbut what a placebo effect from that big shot in the butt! Tonsillectomies performed right in the office, with a nurse‐anesthetist coming in once a week to render sedation. (That is until one of a set of twins transiently quit breathing, after which all surgeries were moved to the hospital!) A shot of adrenaline, given unsuccessfully, via the intracardiac route to a high school football player who suddenly collapsed on the 30‐yard line while the usually boisterous Friday‐night crowd watched in stunned horror. Countless hours waiting in the car for my dad to make house calls or finish rounds at the local hospital.
There, in that place and at that time, my dad was it. He embodied medical science, such as it was, in our little community. His black bag and bow tie helped complete the image. He did what he could, limited as it may have been, and he loved every minute of it. Sure, he sometimes complained. It was tough when a patient showed up at the back door and interrupted dinner. He didn't much like it when then‐president LBJ tried to socialize medicine with the Medicare Act. Most of all, he hated it when my mother insisted he take a job with regular hours at a VA hospital after he had two heart attacks and a bout with colon cancer. Mostly though, I remember a happy, self‐actualized guy, especially when he was at work.
My dad died when I was a freshman in medical school, so exactly what he thought about those times I really don't know. I do know, however, how much I loved him and how much I wanted to be just like him.
In medical school and later during my residency, I had other heroes. Appropriately, for someone who ended up an internist and hospitalist, most were master diagnosticians. There was J. Willis Hurst, the renowned cardiologist, who I once saw diagnose cardiac sarcoid solely on the basis of a 12‐lead electrocardiogram. And there was Jay Sanford, author of that little book on antibiotics known as the bugs and drugs book, tucked to this day into my lab coat pocket, who I once heard tell of going to war‐torn Vietnam to collect water samples in order to make the diagnosis of babesiosis. Finally, there was Walter McDonald, then chief of medicine at the Portland VA hospital, later executive vice‐president of the American College of Physicians, who, to a third‐year medical student like I was then, seemed omniscient about each case relayed to him at morning report. They all seemed so confident and clever; so dedicated, diligent, and proud. I wanted to be just like them.
Now, as a vice‐president for medical affairs, given the task of improving quality at a large teaching hospital, I herd cats. I recite from memory the embarrassing statistics on medical errors revealed by the Institute of Medicine in 1999. I plead for standardization and strive to eliminate variability in hospital practice. From the evidence, I extract guidelines and implement them via standard order sets. But frequently I look back and wonder.
Would the practice of medicine, where the goal is standardization and lack of variability, appeal to my older heroes? How would the practices of exceeding benchmarks, following pathways, and complying with indicators play to the icons of my past? Would they be satisfied to practice in today's health care environment? Or would they perish the thought if asked to standardize their orders and comply with best‐practice norms? After all, there was nothing normal about these guys! Sure they knew the literature and would be the first to insist that practice be evidenced based, but for them, that was never enough. What made them so attractive was their ability to go beyond what any of us able to read the journals could achieve. These men (and, sadly, most, but not all, were men) treasured autonomy, yearned for diagnostic brilliance, and doggedly pursued therapeutic breakthroughs. They set the standards that mere mortals like me aspired to achieve. They were heroes.
So we must be careful not to stifle genius while promoting compliance. We must not push the standardization of health care to a point where an individual's ability to rise above the pack is limited. We should remember that with decreased variability comes the risk of denying innovation. For keep in mind that improved methods like those of hospital medicine exist because those before us sought a better way. They were able to try, and sometimes fail, to use their intuition and individual street smarts and to take risks for the greater good. To use a tired phrase, they were able to think outside the box. In the name of quality, we must not further limit the confines of that box. We must assure that however much we strive to elevate the norm, we do not restrict those few who set the curve. We must allow for heroes.
I believe our profession can produce those who will carry the banner forward. I already have some new heroesDon Berwick, Peter Pronovost, and Bob Wachter. These individuals have demonstrated the ability to combine the patient‐centered care practiced by my father with the evidenced‐based knowledge and intuitive genius of my academic mentors. They are then able to apply this admixture of competencies to the problems facing health care today such as the deficiencies in patient safety and the inefficiencies of delivery.
New heroes will attract another generation of the best and the brightest, and the cycle will repeat. With careful foresight we can assure that this will happen. To do otherwise is unthinkable. We must have heroes.
Clinical Conundrum
A 47‐year‐old woman was brought to the emergency department by her family because of 1 week of abdominal pain. The pain had begun in the epigastrium but had spread across the abdomen. She described it as constant and 10 of 10 in intensity but could not identify aggravating or alleviating factors. She also complained of nausea and vomiting, beginning 4 days prior to presentation, occurring 25 times per day. She noted poor oral intake and mild diarrhea. She denied melena or hematochezia. She reported no recent fever, dysuria, chills, or night sweats; however, she reported upper respiratory symptoms 2 weeks prior to presentation. On the day of presentation, her family felt she was becoming increasingly lethargic.
Epigastric pain in a middle‐aged woman suggests several possible diagnoses. Conditions such as acute cholecystitis begin abruptly, whereas small bowel obstruction, appendicitis, and diverticulitis start gradually. Nausea and vomiting are common concomitants of abdominal pain and are nonspecific. The absence of fever and chills is reassuring. Of greatest concern is the mental status. Initially, I think of enterohemorrhagic E. coli syndromes with associated glomerulonephritis. With a more systemic metabolic abnormality such as this, the rapid development of the disease tends to exaggerate symptoms.
The patient had a history of nephrolithiasis and underwent total abdominal hysterectomy and bilateral salpingo‐oopherectomy secondary to uterine fibroids in the past. She took occasional acetaminophen, smoked two cigarettes per day, and rarely consumed alcohol. Temperature was 38.5C, heart rate was 160 beats/minute, respiratory rate was 28/minute, and blood pressure was 92/52 mm Hg; oxygen saturation was 100% breathing 2 L of oxygen by nasal cannula. She was a moderately obese African American woman in moderate distress, lying in bed moaning. Mucous membranes were dry. There was no lymphadenopathy or thyromegaly. Heart rate was regular without appreciable murmur, rub, or gallop. Lungs were clear. Abdomen was soft and nondistended, with diffuse tenderness to palpation; bowel sounds were present; there was no rebound or guarding. She had normal rectal tone with brown, guaiac‐negative stool. There was no costovertebral angle tenderness. She was oriented to person, place, and time but lethargic; deep tendon reflexes were 3+ bilaterally, and no focal signs were elicited.
Renal stones certainly produce abdominal pain, and the rare patient undergoes laparotomy for this reason. The hysterectomy tells us that small bowel obstruction could be a reason for her symptoms, although abnormal mental status would not be expected without additional problems such as infection. The tachycardia seems out of proportion to her temperature. Hyperpnea and absent respiratory symptoms, along with hypotension and tachycardia, suggest a sepsis syndrome. Her physical exam confirms dehydration. Examination of the abdomen makes me speculate about whether she has a nonsurgical cause of acute abdomen. The lethargy remains unexplained. Sepsis syndrome, possibly from a perinephric abscess, is my leading diagnosis.
White blood cell count was 15.9/mm3 with 78% neutrophils, a hemoglobin of 14.3 g/dL with a MCV of 76 and a platelet count of 320/mm3. Sodium was 159 mmol/L, chloride 128 mmol/L, bicarbonate 19 mmol/L, blood urea nitrogen 120 mmol/L, creatinine 3.1 mg/dL, calcium 11.7 mg/dL, albumin 3.3 g/dL, serum aspartate aminotransferase 65 U/L, serum alanine aminotransferase 72 U/L, total bilirubin 0.7 mg/dL, amylase 137 U/L (normal 30100), and lipase 92 IU/dL (normal 424). Urine obtained from a Foley catheter revealed negative nitrite and leukocyte esterase, 5075 red blood cells, and 1025 white blood cells per high‐powered field.
The elevated serum sodium is likely contributing to her abnormal mental status. It is unusual for a previously healthy and conscious woman to become this hypernatremic because persons with a normal mental status will defend their sodium balance strenuously, assuming regulatory mechanisms are intact. Generally, this level of hypernatremia indicates 2 things. One, a patient was not allowed, or did not seek access to, free water. The other is the presence of diabetes insipidus. It is unlikely she became this dehydrated from the initial gastrointestinal episode as described. The low MCV suggests she may be a thalassemia carrier, as microcytosis with iron deficiency typically does not occur until the patient is anemic, although she may be when rehydrated. Serum calcium, while elevated, also will likely return to the normal range with hydration. The metabolic abnormalities strongly suggest a problem in the central nervous system. The hematuria in the urinalysis continues to raise the possibility of nephrolithiasis as a cause of abdominal pain, though it does not fit well with the rest of the patient's clinical picture. The hematuria and pyuria both could still indicate a urinary tract infection such as pyelonephritis or perinephric abscess causing a sepsis syndrome.
An acute abdominal series and chest radiograph revealed a paucity of gas in the abdomen but no free air under the diaphragm or active cardiopulmonary disease. Abdominal ultrasound showed cholelithiasis without biliary dilation. There was no evidence of hydronephrosis, hydroureter, or perinephric abscess. A noncontrast abdominal‐pelvic computed tomography (CT) scan demonstrated no peripancreatic stranding or fluid collection and no nephrolithiasis or fluid collection suggestive of abscess. The admission electrocardiogram, read as sinus tachycardia with a rate of 160, is displayed in Figure 1.
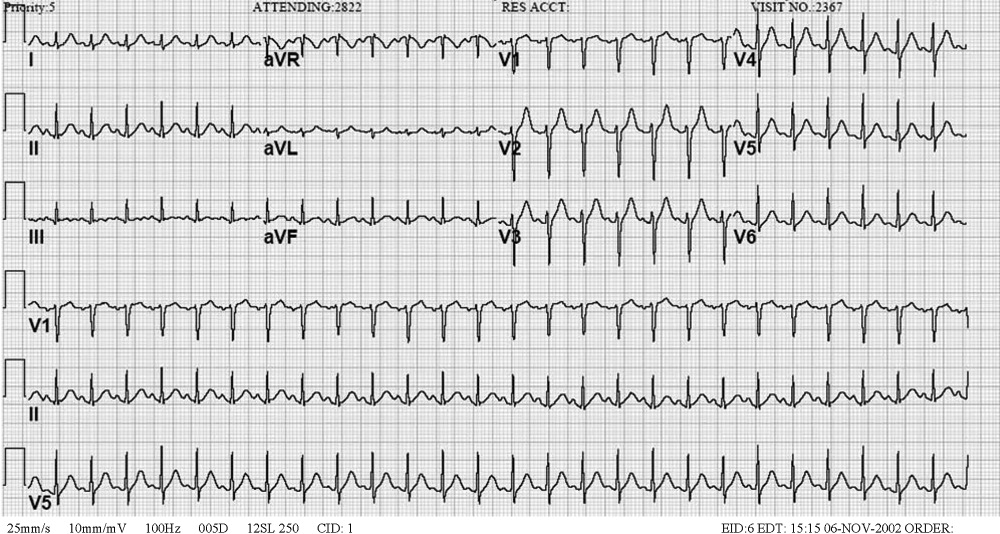
I have long believed that unexplained sinus tachycardia is one of the most ominous rhythms in clinical medicine; it is expected after vigorous exercise, among other situations, but not in the condition in which this woman finds herself. The nature of the tracing does not indicate the likelihood of a supraventricular arrhythmia, particularly atrial flutter, which should be considered given the rate. The absence of free air under the diaphragm on chest radiography is reassuring. Though the pancreatic enzymes are mildly elevated, they are usually far more striking in gallstone pancreatitis. Hypercalcemia may result in abdominal pain by several mechanisms. I remain concerned about her central nervous system.
The patient was admitted to the intensive care unit (ICU), where she received intravenous antibiotics and aggressive rehydration. The following morning, she continued to complain of abdominal pain. Her systolic blood pressure was 115 mmHg, and her heart rate ranged between 140 and 150 beats/minute. The remainder of her physical exam was unchanged. Repeat laboratory tests revealed a white blood cell count of 14.7/mm3, a blood urea nitrogen of 66 mg/dL, a creatinine of 1.3 mg.dL, amylase of 67 IU/L, and lipase of 70 IU/dL. A contrast‐enhanced abdominal‐pelvic CT scan did not reveal intra‐abdominal pathology. Blood and urine cultures obtained at admission were negative for any growth.
The patient was appropriately admitted to the ICU. When caring for a critically ill patient, establishing a diagnosis is less important initially than addressing treatable conditions with dispatch. The negative CT scans rule out previously entertained diagnoses like nephrolithiasis and perinephric abscess. It is possible that the initially positive urinalysis was a result of urinary catheter placement trauma. Given the course to date, I believe this patient likely has a nonsurgical cause of abdominal pain. I am considering entities such as lead intoxication, hypercalcemia, a tear of the rectus abdominus caused by vomiting, systemic vasculitis, or a hypercoagulable state leading to intra‐abdominal venous thrombosis.
By hospital day 3 her sodium decreased to 149 mmol/L and her creatinine was 1.0 mg/dL. Abdominal pain persisted, unchanged from admission. Her systolic blood pressure had stabilized at 120 mmHg, but the heart rate remained near 150 beats/minute. Her abdomen remained soft and nondistended on exam but diffusely tender to palpation. Her amylase and lipase continued to decrease, and her repeat electrocardiogram demonstrated tachycardia with a rate of 144.
We are gratified to see that her serum sodium has waned but not with the persistence of the tachycardia. It must be assumed that this patient has an infectious disease that we are not clever enough to diagnose at this time. I am also considering an autoimmune process, such as systemic lupus erythematosus. It is difficult to envision a neoplastic disorder causing these problems. The differential remains broad, however, because we have not ruled out metabolic or endocrine causes. It is difficult to imagine she could have Addison's diseasea common cause of severe abdominal pain, tachycardia, and hypotensiongiven her serum sodium level. Hyperthyroidism has been known to produce mild hypercalcemia and abdominal complaints and is an intriguing possibility. The striking elevation of her serum sodium makes me consider the possibility of a problem in the posterior pituitary gland such as sarcoidosis. I cannot explain how sarcoidosis would cause her abdominal pain, unless the hypercalcemia were related. The tachycardia remains of concern, especially if she is otherwise improving. Thus, I would likely administer a small dose of adenosine to ascertain that this is not a different supraventricular tachycardia. In sinus tachycardia, the rate is usually attendant to the clinical picture and thus begs explanation given her clinical improvement.
After receiving 6 mg of intravenous adenosine, the patient's heart rate declined; atrial flutter waves were observed.
This case nicely demonstrates a key teaching point: a fast regular heart rate of about 150, irrespective of the electrocardiogram, suggests atrial flutter. Who gets atrial flutter? Patients with chronic lung disease, myocardial ischemia (albeit rarely), alcohol‐induced cardiomyopathy, and infiltrative cardiac disorders do. Additionally, we also have to consider thyroid dysfunction.
If forced to come up with a single unifying diagnosis at this point, I would have to say this patient most likely has sarcoidosis because this entity would account for modest hypercalcemia, the myocardial conduction disturbance, and hypernatremia because of diabetes insipidus; furthermore, it would fit the patient's demographic profile. However, I am also concerned about hyperthyroidism and would not proceed until thyroid function studies were obtained.
Thyroid studies revealed thyroid stimulating hormone of less than 0.01 mU/L (normal range, 0.305.50), free thyroxine (T4) of 5.81 ng.dL (normal range, 0.731.79), free triiodothyronine (T3) of 15.7 pg/mL (normal range, 2.85.3), and total triiodothyronine (T3) of 218 ng/dL (normal range, 95170). The patient was diagnosed with thyroid crisis and was started on propranolol, propylthiouracil, hydrocortisone, and a saturated solution of potassium iodine. Thyroid stimulating immunoglobulins were obtained and found to be markedly elevated (3.4 TSI index; normal 1.3), suggestive of Grave's disease. Over the next several days, the patient's abdominal pain and tachycardia resolved. Her mental status returned to normal. A workup for her microcytic anemia revealed beta thalassemia trait. The patient was discharged home on hospital day 9 and has done well as an outpatient.
COMMENTARY
As Sir Zachary Cope stated in his classic text Cope's Early Diagnosis of the Acute Abdomen, [I]t is only by thorough history taking and physical examination that one can propound a diagnosis.1 When first presented with a patient whose chief complaint is abdominal pain, physicians tend to focus on the disorders of both the hollow and solid organs of the abdomen as potential sources of the pain. The differential diagnosis traditionally includes disorders such as cholecystitis, peptic ulcer disease, pancreatitis, small bowel obstruction, bowel ischemia or perforation, splenic abscess and infarct, nephrolithiasis, diverticulitis, and appendicitis, all of which were initially considered by the clinicians involved in this case. But as our discussant pointed out, in this case the differential needed to be broadened to include less common disorders, particularly given the patient's altered mental status, numerous electrolyte abnormalities, and lethargy and the lack of explanation provided by the physical examination and sophisticated imaging studies.
Specifically, a myriad of systemic diseases and metabolic derangements can cause abdominal complaints and mimic surgical abdominal disease, including hypercalcemia, acute intermittent porphyria, diabetic ketoacidosis, lead intoxication, familial Mediterranean fever, vasculopathies, adrenal insufficiency, and hyperthyroidism. Unfortunately, the frequency with which abdominal pain occurs in many of these less common disease processes and the pathophysiology that underlies its occurrence are not well defined. For example, abdominal pain is well described as a typical manifestation of both diabetic ketoacidosis and lead poisoning, but the pathophysiology behind its occurrence is poorly understood in both. Further, as a manifestation of thyrotoxicosis and as one of the diagnostic criteria for thyroid storm, the reported prevalence of abdominal pain in this condition is variable, ranging from rare to 20%47%.24 Also, although other gastrointestinal manifestations of hyperthyroidism (such as nausea, vomiting, and hyperdefecation) are thought to be the result of the effect of excess thyroid hormone on gastrointestinal motility, it is unclear whether this similar mechanism is responsible for the perception of abdominal pain.4
An important clue to the underlying diagnosis in this case was the patient's marked tachycardia. Classically, a persistent heart rate of 150 should raise suspicion of atrial flutter with a 2:1 conduction block, as was eventually discovered in this case. Adenosine, in addition to other vagal maneuvers such as carotid massage or Valsalva that also block atrioventricular (AV) node conduction, has been recognized as a safe and effective means of establishing a diagnosis in tachyarrhythmias.5 In AV nodal‐dependent tachycardias, such as AV node reentrant tachycardia or AV reentrant tachycardia, adenosine will often terminate the tachyarrhythmia by blocking the anterograde limb of the reentrant circuit. In AV nodeindependent tachyarrhythmias, such as atrial flutter or atrial fibrillation, adenosine will not terminate the rhythm. However, in the case of flutter, blocking the AV node will usually transiently unmask the underlying P waves, thereby facilitating the diagnosis.5, 6
In this patient, the discovery of atrial flutter was the main clue that thyrotoxicosis may provide the unifying diagnosis. Thyroid hormone has a direct positive cardiac chronotropic effect, resulting in the increased resting heart characteristic of thyrotoxicosis. Specifically, this hormone increases sinoatrial‐node firing, shortens the refractory period of conduction tissue within the heart, and decreases the electrical threshold for atrial excitation. In addition to predisposing to sinus tachycardia (the most common rhythm associated with this disorder), thyrotoxicosis is also associated with atrial tachycardias such as atrial flutter and, more classically, atrial fibrillation.7, 8 Though no studies have specifically evaluated the incidence of atrial flutter in thyrotoxicosis, atrial fibrillation has been found in 9%22% of these patients.7
Finally, several of the patient's electrolyte derangements could explain some of her clinical findings and are clues to the underlying diagnosis. She initially presented with a mild hypercalcemia that persisted even after hydration. Potential explanations include her severe dehydration or her underlying thyrotoxicosis because hypercalcemia is present in up to 20% of patients with hyperthyroidism.9, 10 However, the presence of significant hypercalcemia in the setting of thyrotoxicosis may actually make the diagnosis of thyrotoxicosis more difficult, masking the hypermetabolic signs and symptoms of the hyperthyroid state.11 Interestingly, coexistent primary hyperparathyroidism does occur in a few of these patients, but it likely was not an underlying cause in our patient given that her calcium normalized after receipt of propylthiouracil therapy.12
The patient's marked hypernatremia is more difficult to explain. She may have developed nephrogenic diabetes insipidus secondary to hypercalcemia, explained by a renal concentrating defect that can become evident once the calcium is persistently above 11 mg/dL.13 Combined with her altered mental status, which likely limited her ability to access free water, this may be enough to explain her marked hypernatremia. Her rapid improvement with rehydration is also consistent with this explanation, mediated through the improvement of her serum free calcium.
This case highlights the importance of using all the clinical clues provided by the history, physical exam, and laboratory and imaging studies when generating an initial differential diagnosis, as well as the importance of being willing to appropriately broaden and narrow the list of possibilities as a case evolves. When this patient was initially evaluated by physicians in the emergency department, they believed her symptoms were most consistent with generalized peritonitis that was likely secondary to an infectious or inflammatory intra‐abdominal process such as pancreatitis (especially in light of her mildly elevated lipase and amylase), appendicitis, or diverticulitis. When the medical team in the intensive care unit assumed care of this patient, members of the team failed to recognize several of the early clues, including the patient's markedly abnormal mental status, electrolyte derangements, and persistent tachycardia despite aggressive rehydration, which suggested the possibility of alternative, and less common, etiologies of her abdominal pain. Instead, they continued to aggressively pursue the possibility of the initial differential diagnosis, even repeating some of the previously negative studies from the emergency department. This case illustrates the importance of constantly reevaluating the available information from physical examination and laboratory and imaging studies and not falling victim to intellectual blind spots created by suggested diagnoses by other care providers. Fortunately for this patient, her thyroid crisis was diagnosed, albeit with some delay, before any long‐term complications occurred.
- Silen W, ed.Cope's Early Diagnosis of the Acute Abdomen.19th ed.New York:Oxford University Press;1995:4.
- ,.An unusual cause of abdominal pain in young woman.Ann Emerg Med.1991;20:574–582.
- .Vomiting, nausea and abdominal pain: unrecognized symptoms of thyrotoxicosis.J Fam Prac.1989;24:382–386.
- Powell DW,Alpers DH,Yamada,Owyang C,Laine L, eds.Textbook of Gastroenterology.3rd ed.Philadelphia, Pa:Lippincott Williams 783,2516.
- ,,.Usefulness of adenosine in diagnosis of tachyarrhythmias.Am J Cardiol.1995;75:952–955.
- ,,,,.Supraventricular tachycardia.Med Clin North Am.2001;85:193–223.
- .Thyrotoxicosis and the heart.N Engl J Med.1992;327:94–8.
- ,.Thyrotoxicosis and the heart.Endocrinol Metab Clin North Am.1998;27:51–62.
- ,,,.Treatment of thyrotoxic hypercalcemia with propranolol.N Engl J Med.1976;294:431.
- ,,,.Ionized and total plasma calcium and parathyroid hormone in hyperthyroidism.Ann Intern Med.1976;84:668.
- ,.Hypercalcemic crisis.Med Clin North Am.1995;79:79–92.
- ,,.Thyrotoxicosis, hypercalcemia, and secondary hyperparathyroidism.Arch Intern Med.1979;139:661–663.
- ,.Clinical Physiology of Acid‐Base and Electrolyte Disorders.5th ed.New York:McGraw‐Hill;2001:754–758.
A 47‐year‐old woman was brought to the emergency department by her family because of 1 week of abdominal pain. The pain had begun in the epigastrium but had spread across the abdomen. She described it as constant and 10 of 10 in intensity but could not identify aggravating or alleviating factors. She also complained of nausea and vomiting, beginning 4 days prior to presentation, occurring 25 times per day. She noted poor oral intake and mild diarrhea. She denied melena or hematochezia. She reported no recent fever, dysuria, chills, or night sweats; however, she reported upper respiratory symptoms 2 weeks prior to presentation. On the day of presentation, her family felt she was becoming increasingly lethargic.
Epigastric pain in a middle‐aged woman suggests several possible diagnoses. Conditions such as acute cholecystitis begin abruptly, whereas small bowel obstruction, appendicitis, and diverticulitis start gradually. Nausea and vomiting are common concomitants of abdominal pain and are nonspecific. The absence of fever and chills is reassuring. Of greatest concern is the mental status. Initially, I think of enterohemorrhagic E. coli syndromes with associated glomerulonephritis. With a more systemic metabolic abnormality such as this, the rapid development of the disease tends to exaggerate symptoms.
The patient had a history of nephrolithiasis and underwent total abdominal hysterectomy and bilateral salpingo‐oopherectomy secondary to uterine fibroids in the past. She took occasional acetaminophen, smoked two cigarettes per day, and rarely consumed alcohol. Temperature was 38.5C, heart rate was 160 beats/minute, respiratory rate was 28/minute, and blood pressure was 92/52 mm Hg; oxygen saturation was 100% breathing 2 L of oxygen by nasal cannula. She was a moderately obese African American woman in moderate distress, lying in bed moaning. Mucous membranes were dry. There was no lymphadenopathy or thyromegaly. Heart rate was regular without appreciable murmur, rub, or gallop. Lungs were clear. Abdomen was soft and nondistended, with diffuse tenderness to palpation; bowel sounds were present; there was no rebound or guarding. She had normal rectal tone with brown, guaiac‐negative stool. There was no costovertebral angle tenderness. She was oriented to person, place, and time but lethargic; deep tendon reflexes were 3+ bilaterally, and no focal signs were elicited.
Renal stones certainly produce abdominal pain, and the rare patient undergoes laparotomy for this reason. The hysterectomy tells us that small bowel obstruction could be a reason for her symptoms, although abnormal mental status would not be expected without additional problems such as infection. The tachycardia seems out of proportion to her temperature. Hyperpnea and absent respiratory symptoms, along with hypotension and tachycardia, suggest a sepsis syndrome. Her physical exam confirms dehydration. Examination of the abdomen makes me speculate about whether she has a nonsurgical cause of acute abdomen. The lethargy remains unexplained. Sepsis syndrome, possibly from a perinephric abscess, is my leading diagnosis.
White blood cell count was 15.9/mm3 with 78% neutrophils, a hemoglobin of 14.3 g/dL with a MCV of 76 and a platelet count of 320/mm3. Sodium was 159 mmol/L, chloride 128 mmol/L, bicarbonate 19 mmol/L, blood urea nitrogen 120 mmol/L, creatinine 3.1 mg/dL, calcium 11.7 mg/dL, albumin 3.3 g/dL, serum aspartate aminotransferase 65 U/L, serum alanine aminotransferase 72 U/L, total bilirubin 0.7 mg/dL, amylase 137 U/L (normal 30100), and lipase 92 IU/dL (normal 424). Urine obtained from a Foley catheter revealed negative nitrite and leukocyte esterase, 5075 red blood cells, and 1025 white blood cells per high‐powered field.
The elevated serum sodium is likely contributing to her abnormal mental status. It is unusual for a previously healthy and conscious woman to become this hypernatremic because persons with a normal mental status will defend their sodium balance strenuously, assuming regulatory mechanisms are intact. Generally, this level of hypernatremia indicates 2 things. One, a patient was not allowed, or did not seek access to, free water. The other is the presence of diabetes insipidus. It is unlikely she became this dehydrated from the initial gastrointestinal episode as described. The low MCV suggests she may be a thalassemia carrier, as microcytosis with iron deficiency typically does not occur until the patient is anemic, although she may be when rehydrated. Serum calcium, while elevated, also will likely return to the normal range with hydration. The metabolic abnormalities strongly suggest a problem in the central nervous system. The hematuria in the urinalysis continues to raise the possibility of nephrolithiasis as a cause of abdominal pain, though it does not fit well with the rest of the patient's clinical picture. The hematuria and pyuria both could still indicate a urinary tract infection such as pyelonephritis or perinephric abscess causing a sepsis syndrome.
An acute abdominal series and chest radiograph revealed a paucity of gas in the abdomen but no free air under the diaphragm or active cardiopulmonary disease. Abdominal ultrasound showed cholelithiasis without biliary dilation. There was no evidence of hydronephrosis, hydroureter, or perinephric abscess. A noncontrast abdominal‐pelvic computed tomography (CT) scan demonstrated no peripancreatic stranding or fluid collection and no nephrolithiasis or fluid collection suggestive of abscess. The admission electrocardiogram, read as sinus tachycardia with a rate of 160, is displayed in Figure 1.
I have long believed that unexplained sinus tachycardia is one of the most ominous rhythms in clinical medicine; it is expected after vigorous exercise, among other situations, but not in the condition in which this woman finds herself. The nature of the tracing does not indicate the likelihood of a supraventricular arrhythmia, particularly atrial flutter, which should be considered given the rate. The absence of free air under the diaphragm on chest radiography is reassuring. Though the pancreatic enzymes are mildly elevated, they are usually far more striking in gallstone pancreatitis. Hypercalcemia may result in abdominal pain by several mechanisms. I remain concerned about her central nervous system.
The patient was admitted to the intensive care unit (ICU), where she received intravenous antibiotics and aggressive rehydration. The following morning, she continued to complain of abdominal pain. Her systolic blood pressure was 115 mmHg, and her heart rate ranged between 140 and 150 beats/minute. The remainder of her physical exam was unchanged. Repeat laboratory tests revealed a white blood cell count of 14.7/mm3, a blood urea nitrogen of 66 mg/dL, a creatinine of 1.3 mg.dL, amylase of 67 IU/L, and lipase of 70 IU/dL. A contrast‐enhanced abdominal‐pelvic CT scan did not reveal intra‐abdominal pathology. Blood and urine cultures obtained at admission were negative for any growth.
The patient was appropriately admitted to the ICU. When caring for a critically ill patient, establishing a diagnosis is less important initially than addressing treatable conditions with dispatch. The negative CT scans rule out previously entertained diagnoses like nephrolithiasis and perinephric abscess. It is possible that the initially positive urinalysis was a result of urinary catheter placement trauma. Given the course to date, I believe this patient likely has a nonsurgical cause of abdominal pain. I am considering entities such as lead intoxication, hypercalcemia, a tear of the rectus abdominus caused by vomiting, systemic vasculitis, or a hypercoagulable state leading to intra‐abdominal venous thrombosis.
By hospital day 3 her sodium decreased to 149 mmol/L and her creatinine was 1.0 mg/dL. Abdominal pain persisted, unchanged from admission. Her systolic blood pressure had stabilized at 120 mmHg, but the heart rate remained near 150 beats/minute. Her abdomen remained soft and nondistended on exam but diffusely tender to palpation. Her amylase and lipase continued to decrease, and her repeat electrocardiogram demonstrated tachycardia with a rate of 144.
We are gratified to see that her serum sodium has waned but not with the persistence of the tachycardia. It must be assumed that this patient has an infectious disease that we are not clever enough to diagnose at this time. I am also considering an autoimmune process, such as systemic lupus erythematosus. It is difficult to envision a neoplastic disorder causing these problems. The differential remains broad, however, because we have not ruled out metabolic or endocrine causes. It is difficult to imagine she could have Addison's diseasea common cause of severe abdominal pain, tachycardia, and hypotensiongiven her serum sodium level. Hyperthyroidism has been known to produce mild hypercalcemia and abdominal complaints and is an intriguing possibility. The striking elevation of her serum sodium makes me consider the possibility of a problem in the posterior pituitary gland such as sarcoidosis. I cannot explain how sarcoidosis would cause her abdominal pain, unless the hypercalcemia were related. The tachycardia remains of concern, especially if she is otherwise improving. Thus, I would likely administer a small dose of adenosine to ascertain that this is not a different supraventricular tachycardia. In sinus tachycardia, the rate is usually attendant to the clinical picture and thus begs explanation given her clinical improvement.
After receiving 6 mg of intravenous adenosine, the patient's heart rate declined; atrial flutter waves were observed.
This case nicely demonstrates a key teaching point: a fast regular heart rate of about 150, irrespective of the electrocardiogram, suggests atrial flutter. Who gets atrial flutter? Patients with chronic lung disease, myocardial ischemia (albeit rarely), alcohol‐induced cardiomyopathy, and infiltrative cardiac disorders do. Additionally, we also have to consider thyroid dysfunction.
If forced to come up with a single unifying diagnosis at this point, I would have to say this patient most likely has sarcoidosis because this entity would account for modest hypercalcemia, the myocardial conduction disturbance, and hypernatremia because of diabetes insipidus; furthermore, it would fit the patient's demographic profile. However, I am also concerned about hyperthyroidism and would not proceed until thyroid function studies were obtained.
Thyroid studies revealed thyroid stimulating hormone of less than 0.01 mU/L (normal range, 0.305.50), free thyroxine (T4) of 5.81 ng.dL (normal range, 0.731.79), free triiodothyronine (T3) of 15.7 pg/mL (normal range, 2.85.3), and total triiodothyronine (T3) of 218 ng/dL (normal range, 95170). The patient was diagnosed with thyroid crisis and was started on propranolol, propylthiouracil, hydrocortisone, and a saturated solution of potassium iodine. Thyroid stimulating immunoglobulins were obtained and found to be markedly elevated (3.4 TSI index; normal 1.3), suggestive of Grave's disease. Over the next several days, the patient's abdominal pain and tachycardia resolved. Her mental status returned to normal. A workup for her microcytic anemia revealed beta thalassemia trait. The patient was discharged home on hospital day 9 and has done well as an outpatient.
COMMENTARY
As Sir Zachary Cope stated in his classic text Cope's Early Diagnosis of the Acute Abdomen, [I]t is only by thorough history taking and physical examination that one can propound a diagnosis.1 When first presented with a patient whose chief complaint is abdominal pain, physicians tend to focus on the disorders of both the hollow and solid organs of the abdomen as potential sources of the pain. The differential diagnosis traditionally includes disorders such as cholecystitis, peptic ulcer disease, pancreatitis, small bowel obstruction, bowel ischemia or perforation, splenic abscess and infarct, nephrolithiasis, diverticulitis, and appendicitis, all of which were initially considered by the clinicians involved in this case. But as our discussant pointed out, in this case the differential needed to be broadened to include less common disorders, particularly given the patient's altered mental status, numerous electrolyte abnormalities, and lethargy and the lack of explanation provided by the physical examination and sophisticated imaging studies.
Specifically, a myriad of systemic diseases and metabolic derangements can cause abdominal complaints and mimic surgical abdominal disease, including hypercalcemia, acute intermittent porphyria, diabetic ketoacidosis, lead intoxication, familial Mediterranean fever, vasculopathies, adrenal insufficiency, and hyperthyroidism. Unfortunately, the frequency with which abdominal pain occurs in many of these less common disease processes and the pathophysiology that underlies its occurrence are not well defined. For example, abdominal pain is well described as a typical manifestation of both diabetic ketoacidosis and lead poisoning, but the pathophysiology behind its occurrence is poorly understood in both. Further, as a manifestation of thyrotoxicosis and as one of the diagnostic criteria for thyroid storm, the reported prevalence of abdominal pain in this condition is variable, ranging from rare to 20%47%.24 Also, although other gastrointestinal manifestations of hyperthyroidism (such as nausea, vomiting, and hyperdefecation) are thought to be the result of the effect of excess thyroid hormone on gastrointestinal motility, it is unclear whether this similar mechanism is responsible for the perception of abdominal pain.4
An important clue to the underlying diagnosis in this case was the patient's marked tachycardia. Classically, a persistent heart rate of 150 should raise suspicion of atrial flutter with a 2:1 conduction block, as was eventually discovered in this case. Adenosine, in addition to other vagal maneuvers such as carotid massage or Valsalva that also block atrioventricular (AV) node conduction, has been recognized as a safe and effective means of establishing a diagnosis in tachyarrhythmias.5 In AV nodal‐dependent tachycardias, such as AV node reentrant tachycardia or AV reentrant tachycardia, adenosine will often terminate the tachyarrhythmia by blocking the anterograde limb of the reentrant circuit. In AV nodeindependent tachyarrhythmias, such as atrial flutter or atrial fibrillation, adenosine will not terminate the rhythm. However, in the case of flutter, blocking the AV node will usually transiently unmask the underlying P waves, thereby facilitating the diagnosis.5, 6
In this patient, the discovery of atrial flutter was the main clue that thyrotoxicosis may provide the unifying diagnosis. Thyroid hormone has a direct positive cardiac chronotropic effect, resulting in the increased resting heart characteristic of thyrotoxicosis. Specifically, this hormone increases sinoatrial‐node firing, shortens the refractory period of conduction tissue within the heart, and decreases the electrical threshold for atrial excitation. In addition to predisposing to sinus tachycardia (the most common rhythm associated with this disorder), thyrotoxicosis is also associated with atrial tachycardias such as atrial flutter and, more classically, atrial fibrillation.7, 8 Though no studies have specifically evaluated the incidence of atrial flutter in thyrotoxicosis, atrial fibrillation has been found in 9%22% of these patients.7
Finally, several of the patient's electrolyte derangements could explain some of her clinical findings and are clues to the underlying diagnosis. She initially presented with a mild hypercalcemia that persisted even after hydration. Potential explanations include her severe dehydration or her underlying thyrotoxicosis because hypercalcemia is present in up to 20% of patients with hyperthyroidism.9, 10 However, the presence of significant hypercalcemia in the setting of thyrotoxicosis may actually make the diagnosis of thyrotoxicosis more difficult, masking the hypermetabolic signs and symptoms of the hyperthyroid state.11 Interestingly, coexistent primary hyperparathyroidism does occur in a few of these patients, but it likely was not an underlying cause in our patient given that her calcium normalized after receipt of propylthiouracil therapy.12
The patient's marked hypernatremia is more difficult to explain. She may have developed nephrogenic diabetes insipidus secondary to hypercalcemia, explained by a renal concentrating defect that can become evident once the calcium is persistently above 11 mg/dL.13 Combined with her altered mental status, which likely limited her ability to access free water, this may be enough to explain her marked hypernatremia. Her rapid improvement with rehydration is also consistent with this explanation, mediated through the improvement of her serum free calcium.
This case highlights the importance of using all the clinical clues provided by the history, physical exam, and laboratory and imaging studies when generating an initial differential diagnosis, as well as the importance of being willing to appropriately broaden and narrow the list of possibilities as a case evolves. When this patient was initially evaluated by physicians in the emergency department, they believed her symptoms were most consistent with generalized peritonitis that was likely secondary to an infectious or inflammatory intra‐abdominal process such as pancreatitis (especially in light of her mildly elevated lipase and amylase), appendicitis, or diverticulitis. When the medical team in the intensive care unit assumed care of this patient, members of the team failed to recognize several of the early clues, including the patient's markedly abnormal mental status, electrolyte derangements, and persistent tachycardia despite aggressive rehydration, which suggested the possibility of alternative, and less common, etiologies of her abdominal pain. Instead, they continued to aggressively pursue the possibility of the initial differential diagnosis, even repeating some of the previously negative studies from the emergency department. This case illustrates the importance of constantly reevaluating the available information from physical examination and laboratory and imaging studies and not falling victim to intellectual blind spots created by suggested diagnoses by other care providers. Fortunately for this patient, her thyroid crisis was diagnosed, albeit with some delay, before any long‐term complications occurred.
A 47‐year‐old woman was brought to the emergency department by her family because of 1 week of abdominal pain. The pain had begun in the epigastrium but had spread across the abdomen. She described it as constant and 10 of 10 in intensity but could not identify aggravating or alleviating factors. She also complained of nausea and vomiting, beginning 4 days prior to presentation, occurring 25 times per day. She noted poor oral intake and mild diarrhea. She denied melena or hematochezia. She reported no recent fever, dysuria, chills, or night sweats; however, she reported upper respiratory symptoms 2 weeks prior to presentation. On the day of presentation, her family felt she was becoming increasingly lethargic.
Epigastric pain in a middle‐aged woman suggests several possible diagnoses. Conditions such as acute cholecystitis begin abruptly, whereas small bowel obstruction, appendicitis, and diverticulitis start gradually. Nausea and vomiting are common concomitants of abdominal pain and are nonspecific. The absence of fever and chills is reassuring. Of greatest concern is the mental status. Initially, I think of enterohemorrhagic E. coli syndromes with associated glomerulonephritis. With a more systemic metabolic abnormality such as this, the rapid development of the disease tends to exaggerate symptoms.
The patient had a history of nephrolithiasis and underwent total abdominal hysterectomy and bilateral salpingo‐oopherectomy secondary to uterine fibroids in the past. She took occasional acetaminophen, smoked two cigarettes per day, and rarely consumed alcohol. Temperature was 38.5C, heart rate was 160 beats/minute, respiratory rate was 28/minute, and blood pressure was 92/52 mm Hg; oxygen saturation was 100% breathing 2 L of oxygen by nasal cannula. She was a moderately obese African American woman in moderate distress, lying in bed moaning. Mucous membranes were dry. There was no lymphadenopathy or thyromegaly. Heart rate was regular without appreciable murmur, rub, or gallop. Lungs were clear. Abdomen was soft and nondistended, with diffuse tenderness to palpation; bowel sounds were present; there was no rebound or guarding. She had normal rectal tone with brown, guaiac‐negative stool. There was no costovertebral angle tenderness. She was oriented to person, place, and time but lethargic; deep tendon reflexes were 3+ bilaterally, and no focal signs were elicited.
Renal stones certainly produce abdominal pain, and the rare patient undergoes laparotomy for this reason. The hysterectomy tells us that small bowel obstruction could be a reason for her symptoms, although abnormal mental status would not be expected without additional problems such as infection. The tachycardia seems out of proportion to her temperature. Hyperpnea and absent respiratory symptoms, along with hypotension and tachycardia, suggest a sepsis syndrome. Her physical exam confirms dehydration. Examination of the abdomen makes me speculate about whether she has a nonsurgical cause of acute abdomen. The lethargy remains unexplained. Sepsis syndrome, possibly from a perinephric abscess, is my leading diagnosis.
White blood cell count was 15.9/mm3 with 78% neutrophils, a hemoglobin of 14.3 g/dL with a MCV of 76 and a platelet count of 320/mm3. Sodium was 159 mmol/L, chloride 128 mmol/L, bicarbonate 19 mmol/L, blood urea nitrogen 120 mmol/L, creatinine 3.1 mg/dL, calcium 11.7 mg/dL, albumin 3.3 g/dL, serum aspartate aminotransferase 65 U/L, serum alanine aminotransferase 72 U/L, total bilirubin 0.7 mg/dL, amylase 137 U/L (normal 30100), and lipase 92 IU/dL (normal 424). Urine obtained from a Foley catheter revealed negative nitrite and leukocyte esterase, 5075 red blood cells, and 1025 white blood cells per high‐powered field.
The elevated serum sodium is likely contributing to her abnormal mental status. It is unusual for a previously healthy and conscious woman to become this hypernatremic because persons with a normal mental status will defend their sodium balance strenuously, assuming regulatory mechanisms are intact. Generally, this level of hypernatremia indicates 2 things. One, a patient was not allowed, or did not seek access to, free water. The other is the presence of diabetes insipidus. It is unlikely she became this dehydrated from the initial gastrointestinal episode as described. The low MCV suggests she may be a thalassemia carrier, as microcytosis with iron deficiency typically does not occur until the patient is anemic, although she may be when rehydrated. Serum calcium, while elevated, also will likely return to the normal range with hydration. The metabolic abnormalities strongly suggest a problem in the central nervous system. The hematuria in the urinalysis continues to raise the possibility of nephrolithiasis as a cause of abdominal pain, though it does not fit well with the rest of the patient's clinical picture. The hematuria and pyuria both could still indicate a urinary tract infection such as pyelonephritis or perinephric abscess causing a sepsis syndrome.
An acute abdominal series and chest radiograph revealed a paucity of gas in the abdomen but no free air under the diaphragm or active cardiopulmonary disease. Abdominal ultrasound showed cholelithiasis without biliary dilation. There was no evidence of hydronephrosis, hydroureter, or perinephric abscess. A noncontrast abdominal‐pelvic computed tomography (CT) scan demonstrated no peripancreatic stranding or fluid collection and no nephrolithiasis or fluid collection suggestive of abscess. The admission electrocardiogram, read as sinus tachycardia with a rate of 160, is displayed in Figure 1.
I have long believed that unexplained sinus tachycardia is one of the most ominous rhythms in clinical medicine; it is expected after vigorous exercise, among other situations, but not in the condition in which this woman finds herself. The nature of the tracing does not indicate the likelihood of a supraventricular arrhythmia, particularly atrial flutter, which should be considered given the rate. The absence of free air under the diaphragm on chest radiography is reassuring. Though the pancreatic enzymes are mildly elevated, they are usually far more striking in gallstone pancreatitis. Hypercalcemia may result in abdominal pain by several mechanisms. I remain concerned about her central nervous system.
The patient was admitted to the intensive care unit (ICU), where she received intravenous antibiotics and aggressive rehydration. The following morning, she continued to complain of abdominal pain. Her systolic blood pressure was 115 mmHg, and her heart rate ranged between 140 and 150 beats/minute. The remainder of her physical exam was unchanged. Repeat laboratory tests revealed a white blood cell count of 14.7/mm3, a blood urea nitrogen of 66 mg/dL, a creatinine of 1.3 mg.dL, amylase of 67 IU/L, and lipase of 70 IU/dL. A contrast‐enhanced abdominal‐pelvic CT scan did not reveal intra‐abdominal pathology. Blood and urine cultures obtained at admission were negative for any growth.
The patient was appropriately admitted to the ICU. When caring for a critically ill patient, establishing a diagnosis is less important initially than addressing treatable conditions with dispatch. The negative CT scans rule out previously entertained diagnoses like nephrolithiasis and perinephric abscess. It is possible that the initially positive urinalysis was a result of urinary catheter placement trauma. Given the course to date, I believe this patient likely has a nonsurgical cause of abdominal pain. I am considering entities such as lead intoxication, hypercalcemia, a tear of the rectus abdominus caused by vomiting, systemic vasculitis, or a hypercoagulable state leading to intra‐abdominal venous thrombosis.
By hospital day 3 her sodium decreased to 149 mmol/L and her creatinine was 1.0 mg/dL. Abdominal pain persisted, unchanged from admission. Her systolic blood pressure had stabilized at 120 mmHg, but the heart rate remained near 150 beats/minute. Her abdomen remained soft and nondistended on exam but diffusely tender to palpation. Her amylase and lipase continued to decrease, and her repeat electrocardiogram demonstrated tachycardia with a rate of 144.
We are gratified to see that her serum sodium has waned but not with the persistence of the tachycardia. It must be assumed that this patient has an infectious disease that we are not clever enough to diagnose at this time. I am also considering an autoimmune process, such as systemic lupus erythematosus. It is difficult to envision a neoplastic disorder causing these problems. The differential remains broad, however, because we have not ruled out metabolic or endocrine causes. It is difficult to imagine she could have Addison's diseasea common cause of severe abdominal pain, tachycardia, and hypotensiongiven her serum sodium level. Hyperthyroidism has been known to produce mild hypercalcemia and abdominal complaints and is an intriguing possibility. The striking elevation of her serum sodium makes me consider the possibility of a problem in the posterior pituitary gland such as sarcoidosis. I cannot explain how sarcoidosis would cause her abdominal pain, unless the hypercalcemia were related. The tachycardia remains of concern, especially if she is otherwise improving. Thus, I would likely administer a small dose of adenosine to ascertain that this is not a different supraventricular tachycardia. In sinus tachycardia, the rate is usually attendant to the clinical picture and thus begs explanation given her clinical improvement.
After receiving 6 mg of intravenous adenosine, the patient's heart rate declined; atrial flutter waves were observed.
This case nicely demonstrates a key teaching point: a fast regular heart rate of about 150, irrespective of the electrocardiogram, suggests atrial flutter. Who gets atrial flutter? Patients with chronic lung disease, myocardial ischemia (albeit rarely), alcohol‐induced cardiomyopathy, and infiltrative cardiac disorders do. Additionally, we also have to consider thyroid dysfunction.
If forced to come up with a single unifying diagnosis at this point, I would have to say this patient most likely has sarcoidosis because this entity would account for modest hypercalcemia, the myocardial conduction disturbance, and hypernatremia because of diabetes insipidus; furthermore, it would fit the patient's demographic profile. However, I am also concerned about hyperthyroidism and would not proceed until thyroid function studies were obtained.
Thyroid studies revealed thyroid stimulating hormone of less than 0.01 mU/L (normal range, 0.305.50), free thyroxine (T4) of 5.81 ng.dL (normal range, 0.731.79), free triiodothyronine (T3) of 15.7 pg/mL (normal range, 2.85.3), and total triiodothyronine (T3) of 218 ng/dL (normal range, 95170). The patient was diagnosed with thyroid crisis and was started on propranolol, propylthiouracil, hydrocortisone, and a saturated solution of potassium iodine. Thyroid stimulating immunoglobulins were obtained and found to be markedly elevated (3.4 TSI index; normal 1.3), suggestive of Grave's disease. Over the next several days, the patient's abdominal pain and tachycardia resolved. Her mental status returned to normal. A workup for her microcytic anemia revealed beta thalassemia trait. The patient was discharged home on hospital day 9 and has done well as an outpatient.
COMMENTARY
As Sir Zachary Cope stated in his classic text Cope's Early Diagnosis of the Acute Abdomen, [I]t is only by thorough history taking and physical examination that one can propound a diagnosis.1 When first presented with a patient whose chief complaint is abdominal pain, physicians tend to focus on the disorders of both the hollow and solid organs of the abdomen as potential sources of the pain. The differential diagnosis traditionally includes disorders such as cholecystitis, peptic ulcer disease, pancreatitis, small bowel obstruction, bowel ischemia or perforation, splenic abscess and infarct, nephrolithiasis, diverticulitis, and appendicitis, all of which were initially considered by the clinicians involved in this case. But as our discussant pointed out, in this case the differential needed to be broadened to include less common disorders, particularly given the patient's altered mental status, numerous electrolyte abnormalities, and lethargy and the lack of explanation provided by the physical examination and sophisticated imaging studies.
Specifically, a myriad of systemic diseases and metabolic derangements can cause abdominal complaints and mimic surgical abdominal disease, including hypercalcemia, acute intermittent porphyria, diabetic ketoacidosis, lead intoxication, familial Mediterranean fever, vasculopathies, adrenal insufficiency, and hyperthyroidism. Unfortunately, the frequency with which abdominal pain occurs in many of these less common disease processes and the pathophysiology that underlies its occurrence are not well defined. For example, abdominal pain is well described as a typical manifestation of both diabetic ketoacidosis and lead poisoning, but the pathophysiology behind its occurrence is poorly understood in both. Further, as a manifestation of thyrotoxicosis and as one of the diagnostic criteria for thyroid storm, the reported prevalence of abdominal pain in this condition is variable, ranging from rare to 20%47%.24 Also, although other gastrointestinal manifestations of hyperthyroidism (such as nausea, vomiting, and hyperdefecation) are thought to be the result of the effect of excess thyroid hormone on gastrointestinal motility, it is unclear whether this similar mechanism is responsible for the perception of abdominal pain.4
An important clue to the underlying diagnosis in this case was the patient's marked tachycardia. Classically, a persistent heart rate of 150 should raise suspicion of atrial flutter with a 2:1 conduction block, as was eventually discovered in this case. Adenosine, in addition to other vagal maneuvers such as carotid massage or Valsalva that also block atrioventricular (AV) node conduction, has been recognized as a safe and effective means of establishing a diagnosis in tachyarrhythmias.5 In AV nodal‐dependent tachycardias, such as AV node reentrant tachycardia or AV reentrant tachycardia, adenosine will often terminate the tachyarrhythmia by blocking the anterograde limb of the reentrant circuit. In AV nodeindependent tachyarrhythmias, such as atrial flutter or atrial fibrillation, adenosine will not terminate the rhythm. However, in the case of flutter, blocking the AV node will usually transiently unmask the underlying P waves, thereby facilitating the diagnosis.5, 6
In this patient, the discovery of atrial flutter was the main clue that thyrotoxicosis may provide the unifying diagnosis. Thyroid hormone has a direct positive cardiac chronotropic effect, resulting in the increased resting heart characteristic of thyrotoxicosis. Specifically, this hormone increases sinoatrial‐node firing, shortens the refractory period of conduction tissue within the heart, and decreases the electrical threshold for atrial excitation. In addition to predisposing to sinus tachycardia (the most common rhythm associated with this disorder), thyrotoxicosis is also associated with atrial tachycardias such as atrial flutter and, more classically, atrial fibrillation.7, 8 Though no studies have specifically evaluated the incidence of atrial flutter in thyrotoxicosis, atrial fibrillation has been found in 9%22% of these patients.7
Finally, several of the patient's electrolyte derangements could explain some of her clinical findings and are clues to the underlying diagnosis. She initially presented with a mild hypercalcemia that persisted even after hydration. Potential explanations include her severe dehydration or her underlying thyrotoxicosis because hypercalcemia is present in up to 20% of patients with hyperthyroidism.9, 10 However, the presence of significant hypercalcemia in the setting of thyrotoxicosis may actually make the diagnosis of thyrotoxicosis more difficult, masking the hypermetabolic signs and symptoms of the hyperthyroid state.11 Interestingly, coexistent primary hyperparathyroidism does occur in a few of these patients, but it likely was not an underlying cause in our patient given that her calcium normalized after receipt of propylthiouracil therapy.12
The patient's marked hypernatremia is more difficult to explain. She may have developed nephrogenic diabetes insipidus secondary to hypercalcemia, explained by a renal concentrating defect that can become evident once the calcium is persistently above 11 mg/dL.13 Combined with her altered mental status, which likely limited her ability to access free water, this may be enough to explain her marked hypernatremia. Her rapid improvement with rehydration is also consistent with this explanation, mediated through the improvement of her serum free calcium.
This case highlights the importance of using all the clinical clues provided by the history, physical exam, and laboratory and imaging studies when generating an initial differential diagnosis, as well as the importance of being willing to appropriately broaden and narrow the list of possibilities as a case evolves. When this patient was initially evaluated by physicians in the emergency department, they believed her symptoms were most consistent with generalized peritonitis that was likely secondary to an infectious or inflammatory intra‐abdominal process such as pancreatitis (especially in light of her mildly elevated lipase and amylase), appendicitis, or diverticulitis. When the medical team in the intensive care unit assumed care of this patient, members of the team failed to recognize several of the early clues, including the patient's markedly abnormal mental status, electrolyte derangements, and persistent tachycardia despite aggressive rehydration, which suggested the possibility of alternative, and less common, etiologies of her abdominal pain. Instead, they continued to aggressively pursue the possibility of the initial differential diagnosis, even repeating some of the previously negative studies from the emergency department. This case illustrates the importance of constantly reevaluating the available information from physical examination and laboratory and imaging studies and not falling victim to intellectual blind spots created by suggested diagnoses by other care providers. Fortunately for this patient, her thyroid crisis was diagnosed, albeit with some delay, before any long‐term complications occurred.
- Silen W, ed.Cope's Early Diagnosis of the Acute Abdomen.19th ed.New York:Oxford University Press;1995:4.
- ,.An unusual cause of abdominal pain in young woman.Ann Emerg Med.1991;20:574–582.
- .Vomiting, nausea and abdominal pain: unrecognized symptoms of thyrotoxicosis.J Fam Prac.1989;24:382–386.
- Powell DW,Alpers DH,Yamada,Owyang C,Laine L, eds.Textbook of Gastroenterology.3rd ed.Philadelphia, Pa:Lippincott Williams 783,2516.
- ,,.Usefulness of adenosine in diagnosis of tachyarrhythmias.Am J Cardiol.1995;75:952–955.
- ,,,,.Supraventricular tachycardia.Med Clin North Am.2001;85:193–223.
- .Thyrotoxicosis and the heart.N Engl J Med.1992;327:94–8.
- ,.Thyrotoxicosis and the heart.Endocrinol Metab Clin North Am.1998;27:51–62.
- ,,,.Treatment of thyrotoxic hypercalcemia with propranolol.N Engl J Med.1976;294:431.
- ,,,.Ionized and total plasma calcium and parathyroid hormone in hyperthyroidism.Ann Intern Med.1976;84:668.
- ,.Hypercalcemic crisis.Med Clin North Am.1995;79:79–92.
- ,,.Thyrotoxicosis, hypercalcemia, and secondary hyperparathyroidism.Arch Intern Med.1979;139:661–663.
- ,.Clinical Physiology of Acid‐Base and Electrolyte Disorders.5th ed.New York:McGraw‐Hill;2001:754–758.
- Silen W, ed.Cope's Early Diagnosis of the Acute Abdomen.19th ed.New York:Oxford University Press;1995:4.
- ,.An unusual cause of abdominal pain in young woman.Ann Emerg Med.1991;20:574–582.
- .Vomiting, nausea and abdominal pain: unrecognized symptoms of thyrotoxicosis.J Fam Prac.1989;24:382–386.
- Powell DW,Alpers DH,Yamada,Owyang C,Laine L, eds.Textbook of Gastroenterology.3rd ed.Philadelphia, Pa:Lippincott Williams 783,2516.
- ,,.Usefulness of adenosine in diagnosis of tachyarrhythmias.Am J Cardiol.1995;75:952–955.
- ,,,,.Supraventricular tachycardia.Med Clin North Am.2001;85:193–223.
- .Thyrotoxicosis and the heart.N Engl J Med.1992;327:94–8.
- ,.Thyrotoxicosis and the heart.Endocrinol Metab Clin North Am.1998;27:51–62.
- ,,,.Treatment of thyrotoxic hypercalcemia with propranolol.N Engl J Med.1976;294:431.
- ,,,.Ionized and total plasma calcium and parathyroid hormone in hyperthyroidism.Ann Intern Med.1976;84:668.
- ,.Hypercalcemic crisis.Med Clin North Am.1995;79:79–92.
- ,,.Thyrotoxicosis, hypercalcemia, and secondary hyperparathyroidism.Arch Intern Med.1979;139:661–663.
- ,.Clinical Physiology of Acid‐Base and Electrolyte Disorders.5th ed.New York:McGraw‐Hill;2001:754–758.
Community‐Acquired Pneumonia
Pneumonia may well be called the friend of the aged. Taken off by it in an acute, short, not often painful illness, the old man escapes those cold gradations of decay so distressing of himself and to his friends.
William Osler, MD, 1898
Community‐acquired pneumonia (CAP) is commonly defined as an infection of the pulmonary parenchyma that is associated with at least some symptoms and signs of acute infection, accompanied by the presence of an acute infiltrate on chest radiograph, in a patient not hospitalized or residing in a long‐term‐care facility for 14 days prior to the onset of symptoms.1 CAP continues to be a common and serious illness, causing substantial morbidity and mortality in the adult population. There are an estimated 56 million cases a year in the United States, with greater than 1 million hospitalizations. Community‐acquired pneumonia is one of the most common admitting diagnoses among adults, and with a 30‐day mortality between 10% and 14% for patients admitted to the hospital, it is the leading cause of infectious death in the United States.2 In elderly patients, hospitalization for CAP portends a poor long‐term prognosis. In a Medicare database, the 1‐year mortality for patients with CAP was nearly 40%, compared to 29% in patients with other diagnoses.3 Community‐acquired pneumonia is a model illness in hospital medicineit is a common disease that allows for evidence‐based and cost‐effective management. In addition, many national organizations have proposed multiple quality indicators for community‐acquired pneumonia, thus providing an opportunity for institutional quality improvement. This review article outlines the assessment and management of patients admitted to the hospital with community‐acquired pneumonia.
Etiology
Although many pathogens can cause community‐acquired pneumonia, the clinical syndromes and microbiology of CAP have traditionally been characterized as either typical or atypical. The typical organisms include Streptococcus pneumoniae, Haemophilus influenzae, and Moraxella catarrhalis, and the atypical organisms include Chlamydia spp., Mycoplasma pneumoniae, Legionella spp., and viruses. This historical distinction has recently come into question. It is now clear that the presenting symptoms, signs, and basic laboratory findings (including the chest radiograph) cannot be reliably used to predict the etiologic pathogen or to distinguish typical from atypical organisms.4 Rather, the specific causative agent of CAP depends more on the degree of patient illness. Table 1 shows what prospective studies with comprehensive diagnostic strategies determined to be the most common pathogens in patients hospitalized for CAP in ICU and non‐ICU settings.5 Streptococcus pneumoniae remains the most common cause of CAP in hospitalized patients and is the most common cause of fatal pneumonia, whereas Legionella spp. is a common cause of severe CAP, more often found in patients requiring admission to the intensive care unit. Gram‐negative bacilli can cause CAP in elderly patients and those recently treated with broad‐spectrum antibiotics or with underlying lung disease. Notably, though, despite improved diagnostic testing, only one quarter of all admitted patients with CAP have the etiologic agent defined, and therefore empiric therapy should be directed broadly at the most likely organisms.6
| Non‐ICU inpatients | ICU inpatients (severe) |
|---|---|
| S. pneumoniae | S. pneumoniae |
| M. pneumoniae | Legionella spp |
| C. pneumoniae | H. influenzae |
| H. influenzae | Gram‐negative bacilli |
| Legionella spp | S. aureus |
| Aspiration | |
| Respiratory viruses |
Clinical Presentation
Patients admitted to the hospital with CAP typically present with a brief history of respiratory complaints, including cough (greater than 90%), dyspnea (66%), sputum production (66%), and pleuritic chest pain (50%); see Table 2.7, 8 In 10%30% of patients, nonrespiratory complaints predominate, including headache, myalgias, fatigue, and gastrointestinal symptoms.6 Elderly patients, an increasing percentage of hospitalized patients, are less likely to present with typical CAP symptoms (such as cough) and more likely to have altered mental status as a presenting symptom.9
| Symptoms | Signs (exam) |
|---|---|
| Cough 90% | Fever 80% |
| Dyspnea 66% | Tachypnea 70% |
| Sputum 66% | Tachycardia 50% |
| Pleuritic chest pain 50% | Focal lung exam >90% |
On physical examination, patients with CAP usually have signs of fever (80%), tachypnea (70%), and tachycardia (50%); see Table 2. Most will have a focal lung exam (>90%) with findings ranging from crackles to bronchial breath sounds.10 No exam finding is specific for the diagnosis of pneumonia, but the absence of fever, tachycardia, and tachypnea significantly reduces the probability of CAP in patients with suspected pneumonia.10 Furthermore, similar to the clinical history, the physical examination of elderly patients with community‐acquired pneumonia is not specific or sensitive for the diagnosis of CAP. For example, up to 40% of elderly patients subsequently determined to have CAP may not have fever.11
Leukocytosis is common in patients with CAP; however, its absence does not rule out disease.12 A number of guidelines recommend laboratory evaluation of electrolytes, urea nitrogen, creatinine, liver enzymes, and bilirubin, although these are used primarily for prognostication and are not specifically useful in the diagnosis of CAP.
DIAGNOSIS
Differential Diagnosis
Given the nonspecific nature of the symptoms and signs associated with CAP, there is no single clinical feature or combination of clinical features that adequately rules in or out the diagnosis of CAP. Consequently, the differential diagnosis to be considered in patients with suspected CAP is broad. Noninfectious diseases can often present with similar clinical syndromes; these include congestive heart failure, exacerbation of chronic obstructive pulmonary disease (COPD), asthma, pulmonary embolism, and hypersensitivity pneumonitis. These diseases can often be distinguished with a thorough history and physical examination.
In addition, other upper‐ and lower‐airway infectious diseases can have similar nonspecific signs and symptoms. In particular, pneumonia must often be differentiated from acute bronchitis, which as a diagnosis accounts for up to 40% of patients evaluated for cough (versus 5% for pneumonia).10 Patients with acute bronchitis frequently do not present with high fevers or hypoxia and in general will not benefit from antibiotic therapy.13 Patients believed to have community‐acquired pneumonia might also be suffering from other pneumonia syndromes including aspiration pneumonia, postobstructive pneumonia, and pneumonia in immunocompromised patients (eg, those with HIV, on steroids, receiving chemotherapy). Determining the correct diagnosis can have implications for therapy and prognosis.
Diagnostic Studies
The diagnosis of community‐acquired pneumonia requires that a patient have both signs and symptoms consistent with pulmonary infection and evidence of a new radiographic infiltrate. Therefore, most guidelines recommend that all patients with a possible diagnosis of CAP be evaluated with chest radiography.1, 14, 15
The specific radiographic findings in community‐acquired pneumonia range from lobar consolidation to hazy focal infiltrate to diffuse bilateral interstitial opacities (see Figure 1). Although chest radiography has traditionally been considered the gold standard for the diagnosis of CAP, its exact performance characteristics are unknown, and it is clearly not 100% sensitive or 100% specific. The utility of the chest radiograph can be limited by patient body habitus, underlying lung disease, or dehydration. Computed tomography (CT) scanning, although not recommended for routine use, can identify pulmonary consolidation in up to 30% of patients with a normal or equivocal chest radiograph in whom pneumonia is suspected and can also identify complications of pneumonia including an empyema or pulmonary abscess.16
Limitations in the performance of the chest radiograph have resulted in an interest in the diagnostic performance of serologic markers of infection such as C‐reactive protein (CRP), procalcitonin, and soluble triggering receptor expressed on myeloid cells (s‐TREM).1719 Preliminary evidence suggests these inflammatory markers may ultimately prove useful in differentiating infectious from noninfectious pulmonary processes, but regular use of these new tests cannot currently be recommended.
Most expert guidelines state that 2 sets of blood cultures should be taken and analyzed prior to antibiotic administration in all patients admitted to the hospital with suspected community‐acquired pneumonia.1, 14, 15 Isolation of bacteria from blood cultures in CAP is a very specific way to identify a causative organism in order to subsequently narrow therapy and also identifies a high‐risk group of patients because bacteremia is associated with increased mortality. Obtaining blood cultures within 24 hours of admission has been associated with 10% lower odds of 30‐day mortality in patients with CAP,20 and as a result, drawing blood cultures prior to antibiotic administration is a national quality indicator for CAP.
There are, however, a number of problems with the routine acquisition of blood cultures in all patients admitted with CAP. Practically, the cultures can be difficult to obtain, can potentially delay the initiation of antibiotics, and are often contaminated, which has been shown to increase both cost and length of stay.21, 22 The yield is generally low: the true‐positive bacteremia rate for admitted patients with CAP ranges from 6% to 9%, and the culture results rarely change management or outcomes.23, 24 Given these limitations, many have argued that blood cultures should be obtained with a more targeted approach. A recent study used a Medicare database to create a decision‐support tool to help maximize the value of blood cultures in CAP.25 The predictors of a positive blood culture are shown in Table 3. Not obtaining cultures on patients who had received prior antibiotics or had no risk factors resulted in about 40% fewer overall cultures while identifying approximately 90% of bacteremias. In their guidelines, the British Thoracic Society (BTS) advocates a similar strategy, recommending blood cultures be omitted in nonsevere pneumonia and in patients without comorbidities.15, 26 Although recommendations vary for non‐severe CAP in hospitalized patients, all professional society guidelines agree that blood cultures should be obtained in critically ill patients, and if cultures are obtained, they should be drawn prior to antibiotics.1, 14, 15, 26
| Comorbidities |
| Liver disease |
| Vital signs |
| Systolic blood pressure 90 mm Hg |
| Temperature 35C or 40C |
| Pulse 125 beats/min |
| Laboratory and radiographic data |
| Blood urea nitrogen (BUN) 30 mg/dL |
| Sodium 130 mmol/L |
| White blood cells 5000/mm3 or > 20,000/mm3 |
| Prior use of antibiotics (negative predictor) |
Substantial controversy surrounds the utility of routine sputum gram stains and cultures for patients admitted to the hospital with CAP. The Infectious Disease Society of America (IDSA) and the British Thoracic Society (BTS) both recommend that all patients admitted to the hospital with community‐acquired pneumonia should have a gram stain and culture of expectorated sputum.1, 15, 26 Both organizations argue sputum collection is a simple and inexpensive procedure that can potentially identify pathogenic organisms and can affect both initial and long‐term antibiotic therapy. Most notably, they highlight gram stain specificity of greater than 80% for pneumococcal pneumonia. Conversely, the American Thoracic Society (ATS) argues that sputum gram stains and cultures generally have low sensitivity, specificity, and positive predictive value.14 Furthermore, they argue the utility of sputum testing is also limited practically; in one study 30% of patients could not produce an adequate sputum specimen and up to 30% had received prior antibiotic therapy, substantially reducing the yield.27 In another study, good‐quality sputum with a predominant morphotype could be obtained in only 14% of patients admitted with CAP.28 However, targeting sputum analysis to patients who have not received prior antibiotics and are able to produce an adequate sample improved the yield significantly.29 In addition, with increasing rates of antibiotic resistance among common community isolates (ie, S. Pneumoniae) and the increasing prevalence of infecting organisms not targeted by routine empiric therapy (methicillin‐resistant Staphylococcus Aureus [MRSA]), isolation of potential causative pathogens is increasingly important. We believe that severely ill patients with CAP (such as patients admitted to the ICU), as well as patients with identifiable risk factors for uncommon or drug‐resistant pathogens (eg, Pseudomonas aeruginosa, enteric gram‐negative rods, MRSA, etc.) should have sputum sent for gram stain and culture. Ideally, sputum obtained for gram stain and culture should be:
-
Prior to antibiotic therapy,
-
A deep‐cough, expectorated specimen,
-
A purulent specimen (>25 polymorphonucleacytes and less than 10 squamous cells per high‐powered field), and
-
Rapidly transported to the laboratory.
Subsequent gram stain and culture results should be interpreted in the specific clinical context and antibiotic choices targeted appropriately.
Alternative Diagnostic Tests
In recent years, there has been growth in additional diagnostic tests targeting specific organisms. The pneumococcal urinary antigen assay is a relatively sensitive (50%80%) and highly specific (90%) test for the detection of pneumococcal pneumonia, when compared with conventional diagnostic methods.27 The test is simple, convenient, rapid ( 15 min), and, with its high specificity, may allow for more focused antimicrobial therapy early in management. Current limitations include the possibility of false‐positive tests in patients colonized with S. pneumoniae or infected with other streptococcal species, as well as the inability to determine antibiotic sensitivity from positive tests. Updated IDSA and BTS guidelines state pneumococcal urinary antigen testing is an acceptable adjunct to other diagnostic tests, but blood and sputum analyses should still be performed.26, 27 For patients with suspected Legionella pneumonia (primarily critically ill and immunocompromised patients or in association with regional outbreaks), the urinary Legionella antigen assay is the test of choice, which detects 80%95% of community‐acquired cases of Legionnaires' disease with a specificity of 90%.27
During the winter months (typically from October to March), rapid antigen testing for influenza is generally recommended for patients with signs or symptoms consistent with influenza.27 The sensitivity of these tests is approximately 50%70%, so negative test results do not exclude the diagnosis, but results can be important epidemiologically and therapeutically (differentiating influenza A and B strains).27 Diagnostic tests targeting other common CAP pathogens, such as serologic tests for Mycoplasma pneumoniae or Chlamydia spp, should not be routinely performed. Testing for less common causative pathogens such as Mycobacterium tuberculosis should only be employed in the appropriate clinical setting.
ADMISSION DECISION
Once the diagnosis of CAP has been made, the initial site where treatment will occur, whether the hospital or the home, must be determined. The decision to hospitalize should be based on 3 factors: 1) evaluation of the safety of home treatment, 2) calculation of the Pneumonia Severity Index (PSI), and 3) clinical judgment of the physician.27 The PSI, or PORT (Pneumonia Outcomes Research Team) score, is a validated prediction rule that quantifies mortality and allows for risk stratification of patients with community‐acquired pneumonia.2 The PSI combines clinical history, physical examination, and laboratory data at the time of admission to divide patients into 5 risk classes and to estimate 30‐day mortality (Figure 2), which ranges from 0.1% of patients in risk class I to 27.0% in risk class V.2
On the basis of the estimated prognosis and in the absence of concerns about home safety or comorbidities, patients in risk classes I, II, and III should be managed at home. Many prospective trials have shown that implementation of PSI significantly increases the number of low‐risk patients managed outside the hospital, with no differences in quality of life, complications, readmissions, or short‐term mortality.30, 31 Most recently, a trial randomizing patients in risk classes II and III to treatment in the hospital or at home found no significant differences in clinical outcomes but did find that patients were more satisfied with care at home.32 Because the number of patients with CAP being treated at home is increasing, the American College of Chest Physicians recently published a consensus statement on the management of community‐acquired pneumonia in the home.33 All national guidelines for the management of community‐acquired pneumonia recommend using the PSI to help determine the initial location of treatment, with the caveat that using the prediction rule should never supersede clinical judgment in the decision about whether to admit.1, 14, 15, 26, 27 A practical decision tree for the use of the PSI is shown in Figure 3.
There are no reliable prediction rules for deciding on whether admission to the intensive care unit is necessary. Hemodynamic instability requiring resuscitation and monitoring or respiratory failure requiring ventilatory support are clear indications for ICU admission. Additional variables such as tachypnea (respiratory rate 30), altered mental status, multilobar disease, and azotemia are associated with severe CAP and should prompt consideration of ICU admission, especially when 2 or more variables coexist.14
TREATMENT
Initial Treatment
Once the admission decision is made and the initial diagnostic tests are completed (including blood and sputum cultures), patients with presumed community‐acquired pneumonia should receive necessary supportive care (O2, intravenous fluids, etc.) and prompt antimicrobial therapy. Antibiotics should be administered within 4 hours of arrival to patients with suspected CAP, as such prompt administration may be associated with shorter in‐hospital stays and decreased 30‐day mortality.34, 35 Regulatory organizations such as the Joint Commission on Accreditation of Healthcare Organizations (JCAHO) and the Center for Medicare Services (CMS) have made delivery of antibiotics in less than 4 hours a hospital quality measure.
Despite diagnostic testing, the specific etiologic agent causing the pneumonia of a patient remains unknown in up to 75% of those admitted to the hospital.14 Most expert guidelines therefore recommend broad‐spectrum empiric therapy targeting both the typical and the atypical organisms that commonly cause CAP (Table 1).
Recommendations for empiric antibiotics are driven by 2 key factors: antibiotic resistance by S. pneumoniae and the results of studies of CAP treatment outcomes. Historically, patients with suspected community‐acquired pneumonia were treated with penicillin with generally good outcomes. Recently, the rate of S. pneumoniae isolates resistant to penicillin has risen dramatically in the United States, ranging between 20% and 30%, with high‐level resistance (MIC 4 mg/L) as high as 5.7%.36, 37 Concurrently, the rates of resistance of S. pneumoniae to many other antibiotics commonly used to treat CAP have also risen.37 Despite increasing resistance overall, most U.S. pneumococcal isolates have low resistance to third‐generation cephalosporins and fluoroquinolones with enhanced activity against S. pneumoniae.3638 In addition, despite increasing resistance by pneumococcal isolates to penicillin, several observational studies have shown that regardless of initial therapy, resistance to penicillin as well as third‐generation cephalosporins is not associated with higher mortality or worse outcomes when controlled for other risk factors for drug resistance.39, 40 An exception to that rule is pneumococcal isolates that are very highly resistant to PCN (MIC 4 mg/dL). At least one study has shown that patients with such isolates may be at higher risk for adverse outcomes and should probably not be treated with penicillins.1, 14, 15, 41 However, nationally, fewer than 6% of pneumococcal isolates have this level of resistance.37
The rationale for empiric broad‐spectrum coverage against both typical and atypical organisms has arisen from many retrospective and observational studies that have suggested that there is clinical benefit and improved outcomes with such regimens. One large retrospective study showed that in elderly patients with CAP, fluoroquinolone monotherapy was associated with lower 30‐day mortality when compared to monotherapy with a third‐generation cephalosporin.34 Adding an extended‐spectrum macrolide (eg, azithromycin) to an extended‐spectrum ‐lactam (eg, ceftriaxone) in the treatment of patients hospitalized with nonsevere CAP also appears to be associated with improved outcomes. Adding a macrolide has resulted in shorter lengths of stay (LOS), less treatment failure, and lower mortality.34, 4244 Similarly, according to unpublished observations, adding doxycycline to a ‐lactam as initial therapy was associated with a benefit of decreased mortality.45 The presumed etiology of the benefit has been the addition of specific coverage of atypical organisms, such as Mycoplasma pneumoniae and Chlamydia pneumoniae, which are common causes of CAP (Table 1). Others have proposed that the benefit of therapy with macrolides may be derived from the inherent anti‐inflammatory properties of macrolides.46 Because research has shown a benefit of dual versus monotherapy across a spectrum of antibiotics, others have proposed the benefit is simply a result of receiving double antibiotic coverage. In particular, 2 studies found a benefit of reduced mortality from combination therapy over monotherapy in bacteremic pneumococcal pneumonia.47, 48
Yet the accumulated evidence for adding coverage of atypical organisms has been only retrospective and observational. Because of this, the recommendation to routinely add antibiotics active against atypical organisms has been questioned by some. Two recent meta‐analyses and a systematic review examined all the available data on the need for atypical coverage in the treatment of patients with community‐acquired pneumonia.4951 Surprisingly, none showed a benefit in clinical efficacy or survival in patients treated with agents active against both atypical and typical organisms when compared to regimens with only typical coverage. In subset analyses, there was a benefit to providing empiric atypical coverage in patients subsequently shown to have Legionella spp. as a causative pathogen. However, this organism was uncommon in all 3 studies. Unfortunately, most studies included in the meta‐analyses compared fluoroquinolone or macrolide monotherapy with third‐generation cephalosporin monotherapy. There have been no high‐quality randomized, controlled trials of the treatment of hospitalized patients with CAP assessing combination therapy covering both typical and atypical organisms with monotherapy targeting typical organisms alone. High‐quality trials are warranted.
Despite the recent articles questioning the importance of atypical coverage, citing the substantial retrospective data and the general inability to identify causative organisms in most cases of CAP, adding a second agent with atypical coverage to a ‐lactam currently appears to be the most efficacious empiric treatment for CAP. Nearly all expert guidelines for the management of community‐acquired pneumonia recommend this empiric approach.1, 14, 27
Table 4 displays our recommendations for the treatment of community‐acquired pneumonia requiring hospitalization. Before implementation of these guidelines, hospitalists should consult with their infectious disease experts and consider local resistance patterns. In general, a typical adult patient with non‐severe CAP without additional risk factors should receive a parenteral extended‐spectrum ‐lactam plus either doxycycline or an advanced macrolide (see Table 4). Extended‐spectrum ‐lactams include cefotaxime, ceftriaxone, ampicillin‐sulbactam, and ertapenem. A respiratory fluoroquinolone as a single agent can be used for non‐ICU patients with CAP, but some agencies, including the Centers for Disease Control (CDC), discourage routine use of these agents in all patients secondary to concerns about cost and increasing gram‐negative rod fluoroquinolone resistance.52, 53
| Patient group | Empiric antibiotic therapy |
|---|---|
| |
| Inpatient, non‐ICU | ‐Lactama + either doxycycline or an advanced macrolideb |
| Severe ‐lactam allergyc | Respiratory fluoroquinoloned |
| Inpatient, ICU | |
| No risk for Pseudomonas | ‐Lactam + either an advanced macrolide or a respiratory fluoroquinolone |
| Severe ‐lactam allergy | Respiratory fluoroquinolone + clindamycin |
| Pseudomonas risk factorse | Antipseudomonal ‐lactamf + an antipseudomonal fluoroquinoloneg |
| Severe ‐lactam allergy | Aztreonam + a respiratory fluoroquinolone |
| MRSA risk factorsh | Add vancomycin to above regimens |
| From nursing home | Should be treated as nosocomial/health‐care‐associated pneumonia |
| Aspiration pneumonia | ‐Lactam or respiratory fluoroquinolone clindamycini |
Patients hospitalized with severe CAP who require ICU‐level care are at increased risk of Legionella spp. and drug‐resistant S. pneumoniae, which must be reflected in their initial antibiotic therapy.5 Patients with severe pneumonia should receive an intravenous extended‐spectrum ‐lactam plus either an intravenous macrolide or an intravenous respiratory fluoroquinolone.
All patients with severe CAP who are admitted to the intensive care unit should be routinely screened for risk factors for Pseudomonas aeruginosa. The known risk factors for pseudomonal infection are: bronchiectasis, immunosuppression including more than 10 mg/day of prednisone, malnutrition, and treatment with broad‐spectrum antibiotics in the last month.14 Those at risk for Pseudomonas aeruginosa or other resistant gram‐negative rod infection should be treated with an antipseudomonal ‐lactam plus an antipseudomonal fluoroquinolone. Many patients with severe CAP have risk factors for MRSA infection including recent prolonged hospitalization, recent use of broad‐spectrum antibiotics, and significant underlying lung disease, which should be considered in choosing initial antibiotic therapy.54 In addition, there have been reports of patients without underlying risk factors presenting with severe community‐acquired MRSA pneumonia. Many of these patients were younger and the MRSA pneumonia was associated with a necrotizing or cavitary disease requiring prolonged ICU stays.5558 In such cases or if an institution's rate of methicillin resistance in S. aureus community isolates is high (>15%20%), it may be appropriate to add initial empiric MRSA coverage for patients admitted to the ICU with CAP.55
Some patients will have unique risk factors and clinical presentations, which may require modification of these empiric recommendations. Several studies found 5%15% of cases of community‐acquired pneumonia to be aspiration pneumonia.57 Risk factors for aspiration events include, among others, dysphagia, history of stroke, altered level of consciousness, poor dentition, and tube feeding. Aspiration pneumonia traditionally was believed to be secondary to oral anaerobes, but recent research suggests gram‐positive cocci and gram‐negative rods are the predominant organisms.58 Antibiotic therapy in patients with clear aspiration pneumonia should be directed at these microbes with an extended‐spectrum ‐lactam (eg, ceftriaxone) or a respiratory fluoroquinolone (eg, levofloxacin or moxifloxacin). Anaerobic bacterial coverage can be added in patients with severe periodontal disease, alcoholism, concern for empyema, or evidence of aspiration with pulmonary abscess.58
Patients residing in long‐term care facilities are at high risk of contracting pneumonia. The microbiology of infections acquired in nursing facilities is similar to that in hospital‐acquired cases.59, 60 As a result, patients who develop pneumonia in institutional settings such as nursing homes should be treated with broad‐spectrum antibiotics, including coverage for MRSA.
Subsequent Treatment
Initial empiric antibiotic treatment should be modified based on the results of diagnostic testing. Although the specific etiologic agent is determined in only 25% of cases of CAP,35 when an organism is isolated, antibiotic coverage should be narrowed to cover that particular organism with an antibiotic with adequate lung penetration. Evidence suggests clinicians often do not adjust or narrow antibiotics based on sensitivity results, potentially breeding resistant organisms.61
Patients hospitalized with CAP usually improve quickly if they receive early, appropriate antibiotic therapy and supportive care. Excluding patients with severe CAP requiring intensive care unit admission, most patients resolve their tachycardia, tachypnea, and fever by day 2 or 3.62 Recent practice experience, evidence, and published guidelines14, 27 all indicate that patients can safely be transitioned to oral antibiotic therapy earlier in their hospital course. Table 5 outlines criteria that can be used to identify patients who have had an adequate response to parenteral therapy and can be considered for a switch to oral antibiotics. If these criteria are met, patients have less than a 1% chance of clinical deterioration necessitating admission to an ICU or transitional care unit.62 When an etiologic organism is not identified, oral therapy should reflect a spectrum of coverage to that of the initial intravenous therapy. In some cases, this may require use of more than one oral agent. We have had success, however, transitioning non‐ICU patients initially treated with intravenous ceftriaxone plus oral doxycycline, typically for 4872 hours, to oral doxycycline monotherapy at discharge.45
| Stable vital signs and clinical criteria for 24 hours |
| Temperature 37.8C (100F) |
| Heart rate 100 beats per minute |
| Respiratory rate 24 breaths per minute |
| Systolic blood pressure 90 mm Hg |
| Oxygen saturation (on room air) 90% |
| Ability to take oral medications |
There have been a limited number of high‐quality randomized trials examining the optimal duration of treatment for community‐acquired pneumonia. Most practice guidelines recommend 710 days for patients with CAP requiring hospitalization, with 14 days for documented Mycoplasma pneumoniae or Chlamydia pneumoniae. One recent randomized trial of patients with mild to severe CAP showed a short course of high‐dose levofloxacin (750 mg daily 5 days) was at least as effective as normal dosing (500 mg daily 10 days).63 Clinical experience with high‐dose levofloxacin is limited, but this regimen can be considered because it may reduce costs and exposure to antibiotics. When diagnosed, Legionella is usually treated for 1021 days, but 14 days is adequate with macrolides because of their long half‐life.27 Patients with more virulent pathogens like Staphylococcus aureus or Pseudomonas aeruginosa or other suppurative complications should be treated for at least 14 days.1, 14, 15, 27 In determining length of therapy, clinicians should use these durations of treatment as guides, and to individualize therapy, they should always consider patient age and frailty, comorbid conditions, severity of illness, and hospital course.
Failure to Respond
Although most patients hospitalized for CAP will improve rapidly and reach clinical stability in 23 days, some patients fail to respond. Some studies have estimated that failure to improve or clinical deterioration occurs in 5%10% of patients in the first 23 days.64 The common reasons for clinical decline or nonresponse to treatment, highlighted in Table 6, are:
-
Incorrect diagnosis: Illnesses such as congestive heart failure, pulmonary embolism, neoplasms, and hypersensitivity pneumonitis can mimick CAP.
-
Inadequate antibiotic selection: The etiologic agent may be resistant to empiric antibiotic selections. Examples would include methicillin‐resistant Staphylococcus aureus (MRSA) or multiresistant gram‐negative bacilli.
-
Unusual pathogen: CAP syndromes can be caused by myriad unusual organisms including Pneumocystis jirovecii, mycobacterium tuberculosis, endemic fungal infections (eg, coccidioidomycosis), and nocardiosis.
-
Complications of pneumonia: Specific complications of CAP include empyema, pulmonary abscess, extrapulmonary spread including meningitis or endocarditis, or other organ dysfunctions such as renal failure or myocardial infarction.
-
Inadequate host response: Despite appropriate antibiotic and supportive therapy, patients with CAP often fail to respond.
| Incorrect diagnosis of CAP. |
| Inadequate or inappropriate antibiotic selection for CAP. |
| Unusual pathogen causing CAP. |
| Pulmonary or extrapulmonary complication of CAP. |
| Inadequate or poor host response. |
Progressive pneumonia despite appropriate therapy and empyema were the most common causes of failure to respond in the first 72 hours in a recent study.64 Risk factors for early failure were older age (>65 years), Pneumonia Severity Index > 90, Legionella pneumonia, gram‐negative pneumonia, and initial antimicrobial therapy discordant with final culture and susceptibility results. The initial evaluation of the nonresponding patient should address these common causes and is likely to include additional imaging (CT), sampling of potential extrapulmonary infection (thoracentesis), and, in some cases, bronchoscopy.
DISCHARGE/FOLLOW‐UP PLANS
Patients hospitalized for community‐acquired pneumonia can be safely discharged when they have reached clinical stability, are able to tolerate oral medications, have no other active comorbid conditions, and have safe, close, appropriate outpatient follow‐up (see Table 7). Clinical pathways employing these discharge criteria have been found to be safe and effective in reducing the length of stay for CAP. Most important, patients should have met most if not all of the vital sign and clinical criteria noted in Table 5 in the criteria for switching to oral therapy. Patients with 2 or more abnormal vital signs (instabilities) within 24 hours prior to discharge are at high risk of readmission and mortality, but those with one or no abnormal vital signs generally have good outcomes.65 Absent other clinical factors or extenuating circumstances (persistent hypoxia, poor functional status, etc.), most patients with CAP should reach clinical stability by day 3 or 4, be considered for a switch to oral therapy, and, if stable, be discharged shortly thereafter.
| Patients should: |
|
Meet clinical criteria in Table V. |
| Be able to tolerate oral medications (no need to observe for 24 hours on oral therapy). |
| Have no evidence of active comorbid conditions (myocardial ischemia, pulmonary edema, etc.). |
| Have a normal mental status (or have returned to their baseline). |
| Have safe, appropriate outpatient follow‐up. |
When patients with CAP are discharged from the hospital, they should be counseled about the expected course of recovery. Most important, patients and families must be informed that many symptoms of CAP may persist well after hospitalization. In one study, up to 80% of patients reported persistent cough and fatigue 1 week after discharge, and up to 50% still had dyspnea and sputum production. In some, the cough can last for 46 weeks.8
All patients discharged after treatment of community‐acquired pneumonia should have follow‐up with their outpatient provider. The physician responsible for their inpatient care should communicate directly with the provider and outline the hospital course, the discharge medications, and the duration of antibiotic therapy. There is no specific time frame within which patients must be seen, but follow‐up should be dictated by patient age, comorbidities, clinical stability at discharge, and degree of illness. The American Thoracic Society guidelines do recommend patients with a substantial smoking history who are hospitalized with CAP have a follow‐up chest radiograph 46 weeks after discharge to establish a radiographic baseline and exclude the possibility of underlying malignancy.14 However, several studies have suggested that radiographic resolution may take 3 or more months in some patients, especially the elderly and those with multilobar disease.66
PREVENTION
Prevention of community‐acquired pneumonia and pneumonic syndromes has traditionally relied on vaccination with the polysaccharide pneumococcal pneumonia vaccine and the seasonal influenza vaccine. The vaccine for S. pneumoniae used in adults is composed of the 23 serotypes that cause 85%90% of the invasive pneumococcal infections in the United States. Although in randomized trials the vaccine has not consistently prevented community‐acquired pneumonia or death in elderly patients or those with comorbidities, it likely prevents invasive pneumococcal infection.67 National guidelines and the CDC recommend the pneumococcal vaccine be given to all patients older than 65 years and those with chronic medical conditions.1, 14, 15
The seasonal influenza vaccine has clearly been shown to decrease influenza‐related illness in elderly and high‐risk patient populations. As well, in a meta‐analysis and a large observational study of patients older than 65 years, vaccination against influenza prevented pneumonia, hospitalization, and death.68, 69 Vaccination of health care workers may also confer a benefit to elderly patients of reduced mortality. The CDC recommends the influenza vaccine for all patients more than 50 years old, those with comorbidities, those at high risk for influenza, and health care workers in both inpatient and outpatient settings.
Pneumococcal and influenza vaccination have traditionally been relegated to the outpatient setting. National guidelines and the CDC recommend vaccination of all eligible hospitalized patients. Vaccination is safe and effective with almost any medical illness, and both vaccines can be given simultaneously at discharge.69 Both JCAHO and CMS have defined administration of the pneumococcal and influenza vaccines to patients hospitalized with CAP as a quality measure. Using standing orders is the most effective means of ensuring vaccination.
Some evidence suggests that tobacco smokers are at increased risk of invasive pneumococcal disease or pneumonia.70 Patients hospitalized (for all illnesses, but for CAP in particular) should be counseled about smoking cessation and offered pharmacotherapy and outpatient follow‐up. And, finally, recent observational data suggests that use of acid suppressive therapy, including proton pump inhibitors and H‐2 receptor antagonists, may be associated with an increased risk of developing CAP.71 Patients using these agents who are admitted with CAP should have their indications for treatment reviewed, especially when the pneumonia has been recurrent and there is no clear indication for continued use of acid suppressive therapy, in which case they should be discontinued in the hospital.
CONCLUSIONS
Community‐acquired pneumonia remains a common cause for hospitalization of adult patients, with significant associated morbidity and mortality. Although there are multiple expert guidelines for the management of community‐acquired pneumonia, further research is urgently needed. Clinicians need improved diagnostic tests that enable an earlier and more accurate diagnosis of CAP. In addition, the etiologic agent causing CAP is rarely discovered; improved microbiologic studies might enable antibiotic therapy to be targeted to the organisms responsible. High‐quality randomized, controlled trials examining empiric antibiotic therapy in CAP are needed, especially related to the addition of agents covering atypical organisms. Last, the general management of patients hospitalized with CAP is marked by significant heterogeneity, and research and initiatives focusing on improving the quality and process of care of patients with CAP are needed.
- ,,,,,.Guidelines from the Infectious Disease Society of America. Practice guidelines for the management of community‐acquired pneumonia.Clin Infect Dis.2000;31:347–382.
- ,,, et al.A prediction rule to identify low‐risk patients with community‐acquired pneumonia.N Engl J Med.1997;336:243–250.
- ,,, et al.Pneumonia: still the old man's friend?Arch Intern Med.2003;163:317–323.
- ,,, et al.New and emerging etiologies for community‐acquired pneumonia with implications for therapy. A prospective multicenter study of 359 cases.Medicine.1990;69:307–316.
- .Community‐acquired pneumonia.Lancet.2003;362:1991–2001.
- ,,, et al.Processes and outcomes of care for patients with community‐acquired pneumonia: results from the Pneumonia Patient Outcomes Research Team (PORT) cohort study.Arch Intern Med.1999;159:970–980.
- ,.Management of community‐acquired pneumonia.N Engl J Med.2002;347:2039–2045.
- ,,, et al.Measuring symptomatic and functional recovery in patients with community‐acquired pneumonia.J Gen Intern Med.1997;12:423–430.
- ,,, et al.Influence of age on symptoms at presentation with patients with community‐acquired pneumonia.Arch Intern Med.1997;157:1453–1459.
- ,,.Does this patient have community‐acquired pneumonia? Diagnosing pneumonia by history and physical examination.JAMA.1997;278:1440–1445.
- ,,, et al.Community‐acquired pneumonia in very elderly patients: causative organisms, clinical characteristics, and outcomes.Medicine.2003;82:159–169.
- ,.Testing strategies in the initial management of patients with community‐acquired pneumonia.Ann Intern Med.2003;138:109–118.
- ,.Uncomplicated acute bronchitis.Ann Intern Med.2000;133:981–991.
- ,,, et al.American Thoracic Society: Guidelines for the management of community‐acquired pneumonia: diagnosis, assessment of severity, antimicrobial therapy, and prevention.Am J Respir Crit Care Med.2001;163:1730–1754.
- ,,, et al.British Thoracic Society guidelines for the management of community acquired pneumonia in adults.Thorax.2001;56:Suppl. 4,IV1–IV64.
- ,,,,.High‐resolution computed tomography for the diagnosis of community‐acquired pneumonia.Clin Infect Dis.1998;27:358–363.
- ,,, et al.Performance of a bedside C‐reactive protein test in the diagnosis of community‐acquired pneumonia in adults with acute cough.Am J Med.2004;116:529–535.
- ,,, et al.Effect of procalcitonin‐guided treatment on antibiotic use and outcome in lower respiratory tract infections: cluster‐randomised, single‐blinded intervention trial.Lancet.2004;363:600–607.
- ,,, et al.Soluble triggering receptor expressed on myeloid cells and the diagnosis of pneumonia.N Engl J Med.2004:350:451–458.
- ,,, et al.Quality of care, process, and outcomes in elderly patients with pneumonia.JAMA.1997;278:2080–2084.
- ,,,.Limited usefulness of initial blood cultures in community acquired pneumonia.Emerg Med J.2004;21:446–448.
- ,,.Contaminant blood cultures and resource utilization. The true consequences of false‐positive results.JAMA.1991;265:365–369.
- ,,, et al.The contribution of blood cultures to the clinical management of adult patients admitted to the hospital with community‐acquired pneumonia: a prospective observational study.Chest.2003;123:1142–1150.
- ,,, et al.Clinical utility of blood cultures in adult patients with community‐acquired pneumonia without defined underlying risks.Chest.1995;108:932–936.
- ,,,.Predicting bacteremia in patients with community‐acquired pneumonia.Am J Respir Crit Care Med.2004;169:342–347.
- British Thoracic Society. BTS Guidelines for the management of community acquired pneumonia in adults—2004 update. Available at: www.brit‐thoracic.org/guidelines.
- ,,,,,.Guidelines from the Infectious Disease Society of America. Update of guidelines for the management of community‐acquired pneumonia in immunocompetent adults.Clin Infect Dis.2003;37:1405–1433.
- ,,, et al.Assessment of the usefulness of sputum culture for diagnosis of community‐acquired pneumonia using the PORT predictive scoring system.Arch Intern Med.2004;164:1807–1811.
- ,,.Diagnostic value of microscopic examination of gram‐stained sputum and sputum cultures in patients with bacteremic pneumococcal pneumonia.Clin Infect Dis.2004;39(2):165–169.
- ,,, et al.Safely increasing the proportion of patients with community‐acquired pneumonia treated as outpatients: an interventional trial.Arch Intern Med.1998;158:1350–1356.
- ,,, et al.A critical pathway for treatment of community‐acquired pneumonia.JAMA.2000;283:2654–2655.
- ,,, et al.Outpatient care compared with hospitalization for community‐acquired pneumonia. A randomized control trial in low‐risk patients.Ann Intern Med.2005;142:165–172.
- ,,.Management of community‐acquired pneumonia in the home.Chest.2005;127:1752–1763.
- ,,,,.Associations between initial antimicrobial therapy and medical outcomes for hospitalized elderly patients with pneumonia.Arch Intern Med.1999;159:2562–2572.
- ,,,,.Timing of antibiotic administration and outcomes for Medicare patients hospitalized with community‐acquired pneumonia.Arch Intern Med.2004;164:637–644.
- ,,, et al.Increasing prevalence of multidrug‐resistant Streptococcus pneumoniae in the United States.N Engl J Med.2000;343:1917–1924.
- ,,, et al.Susceptibility patterns of Streptococcus pneumoniae isolates in North America (2002–2003): contemporary in vitro activities of amoxicillin/clavulanate and 15 other antimicrobial agents.Int J Antimicrob Agents.2005;25(4):282–289.
- ,,, et al.Antimicrobial resistance among Streptococcus pneumoniae in the United States: have we begun to turn the corner on resistance to certain antimicrobial classes?Clin Infect Dis.2005;41(2):139–148.
- ,,, et al.Pneumonia acquired in the community through drug‐resistant Streptococcus pneumoniae.Am J Respir Crit Care.1999;159:1835–1842.
- ,,, et al.Drug‐resistant pneumococcal pneumonia: clinical relevance and related factors.Clin Infect Dis.2004;38:787–798.
- ,,, et al.Mortality from invasive pneumococcal pneumonia in the era of antibiotic resistance, 1995–1997.Am J Public Health.2000;90(2):223–9.
- ,,, et al.Lower mortality among patients with community‐acquired pneumonia treated with a macrolide plus a beta‐lactam agent versus a beta‐lactam alone.Eur J Clin Microbiol Infect Dis2005;24:190–195.
- ,,,.Impact of initial antibiotic choice on clinical outcomes in community‐acquired pneumonia: analysis of a hospital claims‐made database.Chest.2003;123:1503–1511.
- ,,,.Antimicrobial selection for hospitalized patients with presumed community‐acquired pneumonia: a survey of nonteaching US community hospitals.Ann Pharmacother2000;34:446–452.
- ,,,,.J Hosp Med.2006;1:7–12.
- .Anti‐inflammatory effects of macrolides—an underappreciated benefit in the treatment of community‐acquired respiratory tract infections and chronic inflammatory pulmonary conditions?J Antimicrob Chemother.2005;55:10–21.
- ,,, et al.Addition of a macrolide to a beta‐lactam based empirical antibiotic regimen is associated with lover in‐hospital mortality for patients with bacteremic pneumococcal pneumonia.Clin Infect Dis.2003;36:389–395.
- ,,, et al.Combination antibiotic therapy lowers mortality among severely ill patients with pneumococcal bacteremia.Am J Respir Crit Care Med.2004;170:440–444.
- ,,,.Empiric antibiotic coverage of atypical pathogens for community‐acquired pneumonia in hospitalized adults.Cochrane Database Syst Rev.2005;2:CD004418.pub2.
- ,,.Effectiveness of β lactam antibiotics compared with antibiotics active against atypical pathogens in non‐severe community‐acquired pneumonia: meta‐analysis.Br Med J.2005;330:456.
- ,,,.Empirical atypical coverage for inpatients with community‐acquired pneumonia.Arch Intern Med.2005;165:1992–2000.
- ,,, et al.Antibiotic resistance among gram‐negative bacilli in US intensive care units: implications for fluoroquinolone use.JAMA.2003;289:885–888.
- ,,, et al.First‐generation fluoroquinolone use and subsequent emergence of multiple drug‐resistant bacteria in the intensive care unit.Crit Care Med.2005;33(2):283–289.
- ,.Etiology of community‐acquired pneumonia.Clin Chest Med.2005;26:47–55.
- .Community‐associated methicillin‐resistant Staphylococcus aureus: not only a cause of skin infections, also a new cause of pneumonia.Curr Opin Infect Dis.2005;18:123–124.
- ,,, et al.Severe community‐onset pneumonia in healthy adults caused by methicillin‐resistant Staphylococcus aureus carrying the Panton‐Valentine leukocidin genes.Clin Infect Dis.2005;40(1):100–107.
- ,,,.Fatal community‐associated methicillin‐resistant Staphylococcus aureus pneumonia in an immunocompetent young adult.Ann Emerg Med.2005;46:401–404.
- .Aspiration pneumonitis and aspiration pneumonia.N Engl J Med.2001;344:665–671.
- ,,, et al.Health care‐associated bloodstream infections in adults: a reason to change the accepted definition of community‐acquired infections.Ann Intern Med.2002;137:791–797.
- American Thoracic Society and theInfectious Diseases Society of America.Guidelines for the management of adults with hospital‐acquired, ventilator‐acquired, and healthcare‐associated pneumonia.Am J Respir Crit Care Med.2005;171:388–416.
- ,,, et al.Blood culture and susceptibility results and allergy history do not influence fluoroquinolone use in the treatment of community‐acquired pneumonia.Pharmacotherapy.2005;25(1):59–66.
- ,,, et al.Time to clinical stability in patients hospitalized with community‐acquired pneumonia: implications for practice guidelines.JAMA.1998;279:1452–1457.
- ,,, et al.High‐dose, short‐course levofloxacin for community‐acquired pneumonia: a new treatment paradigm.Clin Infect Dis.2003;37:752–760.
- ,,, et al.Causes and factors associated with early failure in hospitalized patients with community‐acquired pneumonia.Arch Intern Med.2004;164:502–508.
- ,,, et al.Instability on hospital discharge and the risk of adverse outcomes in patients with pneumonia.Arch Intern Med.2002;162:1278–1284.
- ,,,.Radiographic resolution of community‐acquired bacterial pneumonia in the elderly.J Am Geriatr Soc.2004;52(2):224–229.
- ,,,.Vaccines for preventing pneumococcal infection in adults.Cochrane Database Syst Rev.2003;4:CD000422.
- ,,,,.The efficacy of influenza vaccine in elderly persons: a meta‐analysis and review of the literature.Ann Intern Med.1995;123:518–527.
- ,,, et al.Influenza vaccination and reduction in hospitalizations for cardiac disease and stroke among the elderly.N Engl J Med.2003;348:1322–1332.
- ,,,.Proportion of community‐acquired pneumonia cases attributable to tobacco smoking.Chest.1999;116:375–379.
- ,,, et al.Risk of community‐acquired pneumonia and use of gastric acid‐suppressive drugs.JAMA.2004;292:1955–1960.
Pneumonia may well be called the friend of the aged. Taken off by it in an acute, short, not often painful illness, the old man escapes those cold gradations of decay so distressing of himself and to his friends.
William Osler, MD, 1898
Community‐acquired pneumonia (CAP) is commonly defined as an infection of the pulmonary parenchyma that is associated with at least some symptoms and signs of acute infection, accompanied by the presence of an acute infiltrate on chest radiograph, in a patient not hospitalized or residing in a long‐term‐care facility for 14 days prior to the onset of symptoms.1 CAP continues to be a common and serious illness, causing substantial morbidity and mortality in the adult population. There are an estimated 56 million cases a year in the United States, with greater than 1 million hospitalizations. Community‐acquired pneumonia is one of the most common admitting diagnoses among adults, and with a 30‐day mortality between 10% and 14% for patients admitted to the hospital, it is the leading cause of infectious death in the United States.2 In elderly patients, hospitalization for CAP portends a poor long‐term prognosis. In a Medicare database, the 1‐year mortality for patients with CAP was nearly 40%, compared to 29% in patients with other diagnoses.3 Community‐acquired pneumonia is a model illness in hospital medicineit is a common disease that allows for evidence‐based and cost‐effective management. In addition, many national organizations have proposed multiple quality indicators for community‐acquired pneumonia, thus providing an opportunity for institutional quality improvement. This review article outlines the assessment and management of patients admitted to the hospital with community‐acquired pneumonia.
Etiology
Although many pathogens can cause community‐acquired pneumonia, the clinical syndromes and microbiology of CAP have traditionally been characterized as either typical or atypical. The typical organisms include Streptococcus pneumoniae, Haemophilus influenzae, and Moraxella catarrhalis, and the atypical organisms include Chlamydia spp., Mycoplasma pneumoniae, Legionella spp., and viruses. This historical distinction has recently come into question. It is now clear that the presenting symptoms, signs, and basic laboratory findings (including the chest radiograph) cannot be reliably used to predict the etiologic pathogen or to distinguish typical from atypical organisms.4 Rather, the specific causative agent of CAP depends more on the degree of patient illness. Table 1 shows what prospective studies with comprehensive diagnostic strategies determined to be the most common pathogens in patients hospitalized for CAP in ICU and non‐ICU settings.5 Streptococcus pneumoniae remains the most common cause of CAP in hospitalized patients and is the most common cause of fatal pneumonia, whereas Legionella spp. is a common cause of severe CAP, more often found in patients requiring admission to the intensive care unit. Gram‐negative bacilli can cause CAP in elderly patients and those recently treated with broad‐spectrum antibiotics or with underlying lung disease. Notably, though, despite improved diagnostic testing, only one quarter of all admitted patients with CAP have the etiologic agent defined, and therefore empiric therapy should be directed broadly at the most likely organisms.6
| Non‐ICU inpatients | ICU inpatients (severe) |
|---|---|
| S. pneumoniae | S. pneumoniae |
| M. pneumoniae | Legionella spp |
| C. pneumoniae | H. influenzae |
| H. influenzae | Gram‐negative bacilli |
| Legionella spp | S. aureus |
| Aspiration | |
| Respiratory viruses |
Clinical Presentation
Patients admitted to the hospital with CAP typically present with a brief history of respiratory complaints, including cough (greater than 90%), dyspnea (66%), sputum production (66%), and pleuritic chest pain (50%); see Table 2.7, 8 In 10%30% of patients, nonrespiratory complaints predominate, including headache, myalgias, fatigue, and gastrointestinal symptoms.6 Elderly patients, an increasing percentage of hospitalized patients, are less likely to present with typical CAP symptoms (such as cough) and more likely to have altered mental status as a presenting symptom.9
| Symptoms | Signs (exam) |
|---|---|
| Cough 90% | Fever 80% |
| Dyspnea 66% | Tachypnea 70% |
| Sputum 66% | Tachycardia 50% |
| Pleuritic chest pain 50% | Focal lung exam >90% |
On physical examination, patients with CAP usually have signs of fever (80%), tachypnea (70%), and tachycardia (50%); see Table 2. Most will have a focal lung exam (>90%) with findings ranging from crackles to bronchial breath sounds.10 No exam finding is specific for the diagnosis of pneumonia, but the absence of fever, tachycardia, and tachypnea significantly reduces the probability of CAP in patients with suspected pneumonia.10 Furthermore, similar to the clinical history, the physical examination of elderly patients with community‐acquired pneumonia is not specific or sensitive for the diagnosis of CAP. For example, up to 40% of elderly patients subsequently determined to have CAP may not have fever.11
Leukocytosis is common in patients with CAP; however, its absence does not rule out disease.12 A number of guidelines recommend laboratory evaluation of electrolytes, urea nitrogen, creatinine, liver enzymes, and bilirubin, although these are used primarily for prognostication and are not specifically useful in the diagnosis of CAP.
DIAGNOSIS
Differential Diagnosis
Given the nonspecific nature of the symptoms and signs associated with CAP, there is no single clinical feature or combination of clinical features that adequately rules in or out the diagnosis of CAP. Consequently, the differential diagnosis to be considered in patients with suspected CAP is broad. Noninfectious diseases can often present with similar clinical syndromes; these include congestive heart failure, exacerbation of chronic obstructive pulmonary disease (COPD), asthma, pulmonary embolism, and hypersensitivity pneumonitis. These diseases can often be distinguished with a thorough history and physical examination.
In addition, other upper‐ and lower‐airway infectious diseases can have similar nonspecific signs and symptoms. In particular, pneumonia must often be differentiated from acute bronchitis, which as a diagnosis accounts for up to 40% of patients evaluated for cough (versus 5% for pneumonia).10 Patients with acute bronchitis frequently do not present with high fevers or hypoxia and in general will not benefit from antibiotic therapy.13 Patients believed to have community‐acquired pneumonia might also be suffering from other pneumonia syndromes including aspiration pneumonia, postobstructive pneumonia, and pneumonia in immunocompromised patients (eg, those with HIV, on steroids, receiving chemotherapy). Determining the correct diagnosis can have implications for therapy and prognosis.
Diagnostic Studies
The diagnosis of community‐acquired pneumonia requires that a patient have both signs and symptoms consistent with pulmonary infection and evidence of a new radiographic infiltrate. Therefore, most guidelines recommend that all patients with a possible diagnosis of CAP be evaluated with chest radiography.1, 14, 15
The specific radiographic findings in community‐acquired pneumonia range from lobar consolidation to hazy focal infiltrate to diffuse bilateral interstitial opacities (see Figure 1). Although chest radiography has traditionally been considered the gold standard for the diagnosis of CAP, its exact performance characteristics are unknown, and it is clearly not 100% sensitive or 100% specific. The utility of the chest radiograph can be limited by patient body habitus, underlying lung disease, or dehydration. Computed tomography (CT) scanning, although not recommended for routine use, can identify pulmonary consolidation in up to 30% of patients with a normal or equivocal chest radiograph in whom pneumonia is suspected and can also identify complications of pneumonia including an empyema or pulmonary abscess.16
Limitations in the performance of the chest radiograph have resulted in an interest in the diagnostic performance of serologic markers of infection such as C‐reactive protein (CRP), procalcitonin, and soluble triggering receptor expressed on myeloid cells (s‐TREM).1719 Preliminary evidence suggests these inflammatory markers may ultimately prove useful in differentiating infectious from noninfectious pulmonary processes, but regular use of these new tests cannot currently be recommended.
Most expert guidelines state that 2 sets of blood cultures should be taken and analyzed prior to antibiotic administration in all patients admitted to the hospital with suspected community‐acquired pneumonia.1, 14, 15 Isolation of bacteria from blood cultures in CAP is a very specific way to identify a causative organism in order to subsequently narrow therapy and also identifies a high‐risk group of patients because bacteremia is associated with increased mortality. Obtaining blood cultures within 24 hours of admission has been associated with 10% lower odds of 30‐day mortality in patients with CAP,20 and as a result, drawing blood cultures prior to antibiotic administration is a national quality indicator for CAP.
There are, however, a number of problems with the routine acquisition of blood cultures in all patients admitted with CAP. Practically, the cultures can be difficult to obtain, can potentially delay the initiation of antibiotics, and are often contaminated, which has been shown to increase both cost and length of stay.21, 22 The yield is generally low: the true‐positive bacteremia rate for admitted patients with CAP ranges from 6% to 9%, and the culture results rarely change management or outcomes.23, 24 Given these limitations, many have argued that blood cultures should be obtained with a more targeted approach. A recent study used a Medicare database to create a decision‐support tool to help maximize the value of blood cultures in CAP.25 The predictors of a positive blood culture are shown in Table 3. Not obtaining cultures on patients who had received prior antibiotics or had no risk factors resulted in about 40% fewer overall cultures while identifying approximately 90% of bacteremias. In their guidelines, the British Thoracic Society (BTS) advocates a similar strategy, recommending blood cultures be omitted in nonsevere pneumonia and in patients without comorbidities.15, 26 Although recommendations vary for non‐severe CAP in hospitalized patients, all professional society guidelines agree that blood cultures should be obtained in critically ill patients, and if cultures are obtained, they should be drawn prior to antibiotics.1, 14, 15, 26
| Comorbidities |
| Liver disease |
| Vital signs |
| Systolic blood pressure 90 mm Hg |
| Temperature 35C or 40C |
| Pulse 125 beats/min |
| Laboratory and radiographic data |
| Blood urea nitrogen (BUN) 30 mg/dL |
| Sodium 130 mmol/L |
| White blood cells 5000/mm3 or > 20,000/mm3 |
| Prior use of antibiotics (negative predictor) |
Substantial controversy surrounds the utility of routine sputum gram stains and cultures for patients admitted to the hospital with CAP. The Infectious Disease Society of America (IDSA) and the British Thoracic Society (BTS) both recommend that all patients admitted to the hospital with community‐acquired pneumonia should have a gram stain and culture of expectorated sputum.1, 15, 26 Both organizations argue sputum collection is a simple and inexpensive procedure that can potentially identify pathogenic organisms and can affect both initial and long‐term antibiotic therapy. Most notably, they highlight gram stain specificity of greater than 80% for pneumococcal pneumonia. Conversely, the American Thoracic Society (ATS) argues that sputum gram stains and cultures generally have low sensitivity, specificity, and positive predictive value.14 Furthermore, they argue the utility of sputum testing is also limited practically; in one study 30% of patients could not produce an adequate sputum specimen and up to 30% had received prior antibiotic therapy, substantially reducing the yield.27 In another study, good‐quality sputum with a predominant morphotype could be obtained in only 14% of patients admitted with CAP.28 However, targeting sputum analysis to patients who have not received prior antibiotics and are able to produce an adequate sample improved the yield significantly.29 In addition, with increasing rates of antibiotic resistance among common community isolates (ie, S. Pneumoniae) and the increasing prevalence of infecting organisms not targeted by routine empiric therapy (methicillin‐resistant Staphylococcus Aureus [MRSA]), isolation of potential causative pathogens is increasingly important. We believe that severely ill patients with CAP (such as patients admitted to the ICU), as well as patients with identifiable risk factors for uncommon or drug‐resistant pathogens (eg, Pseudomonas aeruginosa, enteric gram‐negative rods, MRSA, etc.) should have sputum sent for gram stain and culture. Ideally, sputum obtained for gram stain and culture should be:
-
Prior to antibiotic therapy,
-
A deep‐cough, expectorated specimen,
-
A purulent specimen (>25 polymorphonucleacytes and less than 10 squamous cells per high‐powered field), and
-
Rapidly transported to the laboratory.
Subsequent gram stain and culture results should be interpreted in the specific clinical context and antibiotic choices targeted appropriately.
Alternative Diagnostic Tests
In recent years, there has been growth in additional diagnostic tests targeting specific organisms. The pneumococcal urinary antigen assay is a relatively sensitive (50%80%) and highly specific (90%) test for the detection of pneumococcal pneumonia, when compared with conventional diagnostic methods.27 The test is simple, convenient, rapid ( 15 min), and, with its high specificity, may allow for more focused antimicrobial therapy early in management. Current limitations include the possibility of false‐positive tests in patients colonized with S. pneumoniae or infected with other streptococcal species, as well as the inability to determine antibiotic sensitivity from positive tests. Updated IDSA and BTS guidelines state pneumococcal urinary antigen testing is an acceptable adjunct to other diagnostic tests, but blood and sputum analyses should still be performed.26, 27 For patients with suspected Legionella pneumonia (primarily critically ill and immunocompromised patients or in association with regional outbreaks), the urinary Legionella antigen assay is the test of choice, which detects 80%95% of community‐acquired cases of Legionnaires' disease with a specificity of 90%.27
During the winter months (typically from October to March), rapid antigen testing for influenza is generally recommended for patients with signs or symptoms consistent with influenza.27 The sensitivity of these tests is approximately 50%70%, so negative test results do not exclude the diagnosis, but results can be important epidemiologically and therapeutically (differentiating influenza A and B strains).27 Diagnostic tests targeting other common CAP pathogens, such as serologic tests for Mycoplasma pneumoniae or Chlamydia spp, should not be routinely performed. Testing for less common causative pathogens such as Mycobacterium tuberculosis should only be employed in the appropriate clinical setting.
ADMISSION DECISION
Once the diagnosis of CAP has been made, the initial site where treatment will occur, whether the hospital or the home, must be determined. The decision to hospitalize should be based on 3 factors: 1) evaluation of the safety of home treatment, 2) calculation of the Pneumonia Severity Index (PSI), and 3) clinical judgment of the physician.27 The PSI, or PORT (Pneumonia Outcomes Research Team) score, is a validated prediction rule that quantifies mortality and allows for risk stratification of patients with community‐acquired pneumonia.2 The PSI combines clinical history, physical examination, and laboratory data at the time of admission to divide patients into 5 risk classes and to estimate 30‐day mortality (Figure 2), which ranges from 0.1% of patients in risk class I to 27.0% in risk class V.2
On the basis of the estimated prognosis and in the absence of concerns about home safety or comorbidities, patients in risk classes I, II, and III should be managed at home. Many prospective trials have shown that implementation of PSI significantly increases the number of low‐risk patients managed outside the hospital, with no differences in quality of life, complications, readmissions, or short‐term mortality.30, 31 Most recently, a trial randomizing patients in risk classes II and III to treatment in the hospital or at home found no significant differences in clinical outcomes but did find that patients were more satisfied with care at home.32 Because the number of patients with CAP being treated at home is increasing, the American College of Chest Physicians recently published a consensus statement on the management of community‐acquired pneumonia in the home.33 All national guidelines for the management of community‐acquired pneumonia recommend using the PSI to help determine the initial location of treatment, with the caveat that using the prediction rule should never supersede clinical judgment in the decision about whether to admit.1, 14, 15, 26, 27 A practical decision tree for the use of the PSI is shown in Figure 3.
There are no reliable prediction rules for deciding on whether admission to the intensive care unit is necessary. Hemodynamic instability requiring resuscitation and monitoring or respiratory failure requiring ventilatory support are clear indications for ICU admission. Additional variables such as tachypnea (respiratory rate 30), altered mental status, multilobar disease, and azotemia are associated with severe CAP and should prompt consideration of ICU admission, especially when 2 or more variables coexist.14
TREATMENT
Initial Treatment
Once the admission decision is made and the initial diagnostic tests are completed (including blood and sputum cultures), patients with presumed community‐acquired pneumonia should receive necessary supportive care (O2, intravenous fluids, etc.) and prompt antimicrobial therapy. Antibiotics should be administered within 4 hours of arrival to patients with suspected CAP, as such prompt administration may be associated with shorter in‐hospital stays and decreased 30‐day mortality.34, 35 Regulatory organizations such as the Joint Commission on Accreditation of Healthcare Organizations (JCAHO) and the Center for Medicare Services (CMS) have made delivery of antibiotics in less than 4 hours a hospital quality measure.
Despite diagnostic testing, the specific etiologic agent causing the pneumonia of a patient remains unknown in up to 75% of those admitted to the hospital.14 Most expert guidelines therefore recommend broad‐spectrum empiric therapy targeting both the typical and the atypical organisms that commonly cause CAP (Table 1).
Recommendations for empiric antibiotics are driven by 2 key factors: antibiotic resistance by S. pneumoniae and the results of studies of CAP treatment outcomes. Historically, patients with suspected community‐acquired pneumonia were treated with penicillin with generally good outcomes. Recently, the rate of S. pneumoniae isolates resistant to penicillin has risen dramatically in the United States, ranging between 20% and 30%, with high‐level resistance (MIC 4 mg/L) as high as 5.7%.36, 37 Concurrently, the rates of resistance of S. pneumoniae to many other antibiotics commonly used to treat CAP have also risen.37 Despite increasing resistance overall, most U.S. pneumococcal isolates have low resistance to third‐generation cephalosporins and fluoroquinolones with enhanced activity against S. pneumoniae.3638 In addition, despite increasing resistance by pneumococcal isolates to penicillin, several observational studies have shown that regardless of initial therapy, resistance to penicillin as well as third‐generation cephalosporins is not associated with higher mortality or worse outcomes when controlled for other risk factors for drug resistance.39, 40 An exception to that rule is pneumococcal isolates that are very highly resistant to PCN (MIC 4 mg/dL). At least one study has shown that patients with such isolates may be at higher risk for adverse outcomes and should probably not be treated with penicillins.1, 14, 15, 41 However, nationally, fewer than 6% of pneumococcal isolates have this level of resistance.37
The rationale for empiric broad‐spectrum coverage against both typical and atypical organisms has arisen from many retrospective and observational studies that have suggested that there is clinical benefit and improved outcomes with such regimens. One large retrospective study showed that in elderly patients with CAP, fluoroquinolone monotherapy was associated with lower 30‐day mortality when compared to monotherapy with a third‐generation cephalosporin.34 Adding an extended‐spectrum macrolide (eg, azithromycin) to an extended‐spectrum ‐lactam (eg, ceftriaxone) in the treatment of patients hospitalized with nonsevere CAP also appears to be associated with improved outcomes. Adding a macrolide has resulted in shorter lengths of stay (LOS), less treatment failure, and lower mortality.34, 4244 Similarly, according to unpublished observations, adding doxycycline to a ‐lactam as initial therapy was associated with a benefit of decreased mortality.45 The presumed etiology of the benefit has been the addition of specific coverage of atypical organisms, such as Mycoplasma pneumoniae and Chlamydia pneumoniae, which are common causes of CAP (Table 1). Others have proposed that the benefit of therapy with macrolides may be derived from the inherent anti‐inflammatory properties of macrolides.46 Because research has shown a benefit of dual versus monotherapy across a spectrum of antibiotics, others have proposed the benefit is simply a result of receiving double antibiotic coverage. In particular, 2 studies found a benefit of reduced mortality from combination therapy over monotherapy in bacteremic pneumococcal pneumonia.47, 48
Yet the accumulated evidence for adding coverage of atypical organisms has been only retrospective and observational. Because of this, the recommendation to routinely add antibiotics active against atypical organisms has been questioned by some. Two recent meta‐analyses and a systematic review examined all the available data on the need for atypical coverage in the treatment of patients with community‐acquired pneumonia.4951 Surprisingly, none showed a benefit in clinical efficacy or survival in patients treated with agents active against both atypical and typical organisms when compared to regimens with only typical coverage. In subset analyses, there was a benefit to providing empiric atypical coverage in patients subsequently shown to have Legionella spp. as a causative pathogen. However, this organism was uncommon in all 3 studies. Unfortunately, most studies included in the meta‐analyses compared fluoroquinolone or macrolide monotherapy with third‐generation cephalosporin monotherapy. There have been no high‐quality randomized, controlled trials of the treatment of hospitalized patients with CAP assessing combination therapy covering both typical and atypical organisms with monotherapy targeting typical organisms alone. High‐quality trials are warranted.
Despite the recent articles questioning the importance of atypical coverage, citing the substantial retrospective data and the general inability to identify causative organisms in most cases of CAP, adding a second agent with atypical coverage to a ‐lactam currently appears to be the most efficacious empiric treatment for CAP. Nearly all expert guidelines for the management of community‐acquired pneumonia recommend this empiric approach.1, 14, 27
Table 4 displays our recommendations for the treatment of community‐acquired pneumonia requiring hospitalization. Before implementation of these guidelines, hospitalists should consult with their infectious disease experts and consider local resistance patterns. In general, a typical adult patient with non‐severe CAP without additional risk factors should receive a parenteral extended‐spectrum ‐lactam plus either doxycycline or an advanced macrolide (see Table 4). Extended‐spectrum ‐lactams include cefotaxime, ceftriaxone, ampicillin‐sulbactam, and ertapenem. A respiratory fluoroquinolone as a single agent can be used for non‐ICU patients with CAP, but some agencies, including the Centers for Disease Control (CDC), discourage routine use of these agents in all patients secondary to concerns about cost and increasing gram‐negative rod fluoroquinolone resistance.52, 53
| Patient group | Empiric antibiotic therapy |
|---|---|
| |
| Inpatient, non‐ICU | ‐Lactama + either doxycycline or an advanced macrolideb |
| Severe ‐lactam allergyc | Respiratory fluoroquinoloned |
| Inpatient, ICU | |
| No risk for Pseudomonas | ‐Lactam + either an advanced macrolide or a respiratory fluoroquinolone |
| Severe ‐lactam allergy | Respiratory fluoroquinolone + clindamycin |
| Pseudomonas risk factorse | Antipseudomonal ‐lactamf + an antipseudomonal fluoroquinoloneg |
| Severe ‐lactam allergy | Aztreonam + a respiratory fluoroquinolone |
| MRSA risk factorsh | Add vancomycin to above regimens |
| From nursing home | Should be treated as nosocomial/health‐care‐associated pneumonia |
| Aspiration pneumonia | ‐Lactam or respiratory fluoroquinolone clindamycini |
Patients hospitalized with severe CAP who require ICU‐level care are at increased risk of Legionella spp. and drug‐resistant S. pneumoniae, which must be reflected in their initial antibiotic therapy.5 Patients with severe pneumonia should receive an intravenous extended‐spectrum ‐lactam plus either an intravenous macrolide or an intravenous respiratory fluoroquinolone.
All patients with severe CAP who are admitted to the intensive care unit should be routinely screened for risk factors for Pseudomonas aeruginosa. The known risk factors for pseudomonal infection are: bronchiectasis, immunosuppression including more than 10 mg/day of prednisone, malnutrition, and treatment with broad‐spectrum antibiotics in the last month.14 Those at risk for Pseudomonas aeruginosa or other resistant gram‐negative rod infection should be treated with an antipseudomonal ‐lactam plus an antipseudomonal fluoroquinolone. Many patients with severe CAP have risk factors for MRSA infection including recent prolonged hospitalization, recent use of broad‐spectrum antibiotics, and significant underlying lung disease, which should be considered in choosing initial antibiotic therapy.54 In addition, there have been reports of patients without underlying risk factors presenting with severe community‐acquired MRSA pneumonia. Many of these patients were younger and the MRSA pneumonia was associated with a necrotizing or cavitary disease requiring prolonged ICU stays.5558 In such cases or if an institution's rate of methicillin resistance in S. aureus community isolates is high (>15%20%), it may be appropriate to add initial empiric MRSA coverage for patients admitted to the ICU with CAP.55
Some patients will have unique risk factors and clinical presentations, which may require modification of these empiric recommendations. Several studies found 5%15% of cases of community‐acquired pneumonia to be aspiration pneumonia.57 Risk factors for aspiration events include, among others, dysphagia, history of stroke, altered level of consciousness, poor dentition, and tube feeding. Aspiration pneumonia traditionally was believed to be secondary to oral anaerobes, but recent research suggests gram‐positive cocci and gram‐negative rods are the predominant organisms.58 Antibiotic therapy in patients with clear aspiration pneumonia should be directed at these microbes with an extended‐spectrum ‐lactam (eg, ceftriaxone) or a respiratory fluoroquinolone (eg, levofloxacin or moxifloxacin). Anaerobic bacterial coverage can be added in patients with severe periodontal disease, alcoholism, concern for empyema, or evidence of aspiration with pulmonary abscess.58
Patients residing in long‐term care facilities are at high risk of contracting pneumonia. The microbiology of infections acquired in nursing facilities is similar to that in hospital‐acquired cases.59, 60 As a result, patients who develop pneumonia in institutional settings such as nursing homes should be treated with broad‐spectrum antibiotics, including coverage for MRSA.
Subsequent Treatment
Initial empiric antibiotic treatment should be modified based on the results of diagnostic testing. Although the specific etiologic agent is determined in only 25% of cases of CAP,35 when an organism is isolated, antibiotic coverage should be narrowed to cover that particular organism with an antibiotic with adequate lung penetration. Evidence suggests clinicians often do not adjust or narrow antibiotics based on sensitivity results, potentially breeding resistant organisms.61
Patients hospitalized with CAP usually improve quickly if they receive early, appropriate antibiotic therapy and supportive care. Excluding patients with severe CAP requiring intensive care unit admission, most patients resolve their tachycardia, tachypnea, and fever by day 2 or 3.62 Recent practice experience, evidence, and published guidelines14, 27 all indicate that patients can safely be transitioned to oral antibiotic therapy earlier in their hospital course. Table 5 outlines criteria that can be used to identify patients who have had an adequate response to parenteral therapy and can be considered for a switch to oral antibiotics. If these criteria are met, patients have less than a 1% chance of clinical deterioration necessitating admission to an ICU or transitional care unit.62 When an etiologic organism is not identified, oral therapy should reflect a spectrum of coverage to that of the initial intravenous therapy. In some cases, this may require use of more than one oral agent. We have had success, however, transitioning non‐ICU patients initially treated with intravenous ceftriaxone plus oral doxycycline, typically for 4872 hours, to oral doxycycline monotherapy at discharge.45
| Stable vital signs and clinical criteria for 24 hours |
| Temperature 37.8C (100F) |
| Heart rate 100 beats per minute |
| Respiratory rate 24 breaths per minute |
| Systolic blood pressure 90 mm Hg |
| Oxygen saturation (on room air) 90% |
| Ability to take oral medications |
There have been a limited number of high‐quality randomized trials examining the optimal duration of treatment for community‐acquired pneumonia. Most practice guidelines recommend 710 days for patients with CAP requiring hospitalization, with 14 days for documented Mycoplasma pneumoniae or Chlamydia pneumoniae. One recent randomized trial of patients with mild to severe CAP showed a short course of high‐dose levofloxacin (750 mg daily 5 days) was at least as effective as normal dosing (500 mg daily 10 days).63 Clinical experience with high‐dose levofloxacin is limited, but this regimen can be considered because it may reduce costs and exposure to antibiotics. When diagnosed, Legionella is usually treated for 1021 days, but 14 days is adequate with macrolides because of their long half‐life.27 Patients with more virulent pathogens like Staphylococcus aureus or Pseudomonas aeruginosa or other suppurative complications should be treated for at least 14 days.1, 14, 15, 27 In determining length of therapy, clinicians should use these durations of treatment as guides, and to individualize therapy, they should always consider patient age and frailty, comorbid conditions, severity of illness, and hospital course.
Failure to Respond
Although most patients hospitalized for CAP will improve rapidly and reach clinical stability in 23 days, some patients fail to respond. Some studies have estimated that failure to improve or clinical deterioration occurs in 5%10% of patients in the first 23 days.64 The common reasons for clinical decline or nonresponse to treatment, highlighted in Table 6, are:
-
Incorrect diagnosis: Illnesses such as congestive heart failure, pulmonary embolism, neoplasms, and hypersensitivity pneumonitis can mimick CAP.
-
Inadequate antibiotic selection: The etiologic agent may be resistant to empiric antibiotic selections. Examples would include methicillin‐resistant Staphylococcus aureus (MRSA) or multiresistant gram‐negative bacilli.
-
Unusual pathogen: CAP syndromes can be caused by myriad unusual organisms including Pneumocystis jirovecii, mycobacterium tuberculosis, endemic fungal infections (eg, coccidioidomycosis), and nocardiosis.
-
Complications of pneumonia: Specific complications of CAP include empyema, pulmonary abscess, extrapulmonary spread including meningitis or endocarditis, or other organ dysfunctions such as renal failure or myocardial infarction.
-
Inadequate host response: Despite appropriate antibiotic and supportive therapy, patients with CAP often fail to respond.
| Incorrect diagnosis of CAP. |
| Inadequate or inappropriate antibiotic selection for CAP. |
| Unusual pathogen causing CAP. |
| Pulmonary or extrapulmonary complication of CAP. |
| Inadequate or poor host response. |
Progressive pneumonia despite appropriate therapy and empyema were the most common causes of failure to respond in the first 72 hours in a recent study.64 Risk factors for early failure were older age (>65 years), Pneumonia Severity Index > 90, Legionella pneumonia, gram‐negative pneumonia, and initial antimicrobial therapy discordant with final culture and susceptibility results. The initial evaluation of the nonresponding patient should address these common causes and is likely to include additional imaging (CT), sampling of potential extrapulmonary infection (thoracentesis), and, in some cases, bronchoscopy.
DISCHARGE/FOLLOW‐UP PLANS
Patients hospitalized for community‐acquired pneumonia can be safely discharged when they have reached clinical stability, are able to tolerate oral medications, have no other active comorbid conditions, and have safe, close, appropriate outpatient follow‐up (see Table 7). Clinical pathways employing these discharge criteria have been found to be safe and effective in reducing the length of stay for CAP. Most important, patients should have met most if not all of the vital sign and clinical criteria noted in Table 5 in the criteria for switching to oral therapy. Patients with 2 or more abnormal vital signs (instabilities) within 24 hours prior to discharge are at high risk of readmission and mortality, but those with one or no abnormal vital signs generally have good outcomes.65 Absent other clinical factors or extenuating circumstances (persistent hypoxia, poor functional status, etc.), most patients with CAP should reach clinical stability by day 3 or 4, be considered for a switch to oral therapy, and, if stable, be discharged shortly thereafter.
| Patients should: |
|
Meet clinical criteria in Table V. |
| Be able to tolerate oral medications (no need to observe for 24 hours on oral therapy). |
| Have no evidence of active comorbid conditions (myocardial ischemia, pulmonary edema, etc.). |
| Have a normal mental status (or have returned to their baseline). |
| Have safe, appropriate outpatient follow‐up. |
When patients with CAP are discharged from the hospital, they should be counseled about the expected course of recovery. Most important, patients and families must be informed that many symptoms of CAP may persist well after hospitalization. In one study, up to 80% of patients reported persistent cough and fatigue 1 week after discharge, and up to 50% still had dyspnea and sputum production. In some, the cough can last for 46 weeks.8
All patients discharged after treatment of community‐acquired pneumonia should have follow‐up with their outpatient provider. The physician responsible for their inpatient care should communicate directly with the provider and outline the hospital course, the discharge medications, and the duration of antibiotic therapy. There is no specific time frame within which patients must be seen, but follow‐up should be dictated by patient age, comorbidities, clinical stability at discharge, and degree of illness. The American Thoracic Society guidelines do recommend patients with a substantial smoking history who are hospitalized with CAP have a follow‐up chest radiograph 46 weeks after discharge to establish a radiographic baseline and exclude the possibility of underlying malignancy.14 However, several studies have suggested that radiographic resolution may take 3 or more months in some patients, especially the elderly and those with multilobar disease.66
PREVENTION
Prevention of community‐acquired pneumonia and pneumonic syndromes has traditionally relied on vaccination with the polysaccharide pneumococcal pneumonia vaccine and the seasonal influenza vaccine. The vaccine for S. pneumoniae used in adults is composed of the 23 serotypes that cause 85%90% of the invasive pneumococcal infections in the United States. Although in randomized trials the vaccine has not consistently prevented community‐acquired pneumonia or death in elderly patients or those with comorbidities, it likely prevents invasive pneumococcal infection.67 National guidelines and the CDC recommend the pneumococcal vaccine be given to all patients older than 65 years and those with chronic medical conditions.1, 14, 15
The seasonal influenza vaccine has clearly been shown to decrease influenza‐related illness in elderly and high‐risk patient populations. As well, in a meta‐analysis and a large observational study of patients older than 65 years, vaccination against influenza prevented pneumonia, hospitalization, and death.68, 69 Vaccination of health care workers may also confer a benefit to elderly patients of reduced mortality. The CDC recommends the influenza vaccine for all patients more than 50 years old, those with comorbidities, those at high risk for influenza, and health care workers in both inpatient and outpatient settings.
Pneumococcal and influenza vaccination have traditionally been relegated to the outpatient setting. National guidelines and the CDC recommend vaccination of all eligible hospitalized patients. Vaccination is safe and effective with almost any medical illness, and both vaccines can be given simultaneously at discharge.69 Both JCAHO and CMS have defined administration of the pneumococcal and influenza vaccines to patients hospitalized with CAP as a quality measure. Using standing orders is the most effective means of ensuring vaccination.
Some evidence suggests that tobacco smokers are at increased risk of invasive pneumococcal disease or pneumonia.70 Patients hospitalized (for all illnesses, but for CAP in particular) should be counseled about smoking cessation and offered pharmacotherapy and outpatient follow‐up. And, finally, recent observational data suggests that use of acid suppressive therapy, including proton pump inhibitors and H‐2 receptor antagonists, may be associated with an increased risk of developing CAP.71 Patients using these agents who are admitted with CAP should have their indications for treatment reviewed, especially when the pneumonia has been recurrent and there is no clear indication for continued use of acid suppressive therapy, in which case they should be discontinued in the hospital.
CONCLUSIONS
Community‐acquired pneumonia remains a common cause for hospitalization of adult patients, with significant associated morbidity and mortality. Although there are multiple expert guidelines for the management of community‐acquired pneumonia, further research is urgently needed. Clinicians need improved diagnostic tests that enable an earlier and more accurate diagnosis of CAP. In addition, the etiologic agent causing CAP is rarely discovered; improved microbiologic studies might enable antibiotic therapy to be targeted to the organisms responsible. High‐quality randomized, controlled trials examining empiric antibiotic therapy in CAP are needed, especially related to the addition of agents covering atypical organisms. Last, the general management of patients hospitalized with CAP is marked by significant heterogeneity, and research and initiatives focusing on improving the quality and process of care of patients with CAP are needed.
Pneumonia may well be called the friend of the aged. Taken off by it in an acute, short, not often painful illness, the old man escapes those cold gradations of decay so distressing of himself and to his friends.
William Osler, MD, 1898
Community‐acquired pneumonia (CAP) is commonly defined as an infection of the pulmonary parenchyma that is associated with at least some symptoms and signs of acute infection, accompanied by the presence of an acute infiltrate on chest radiograph, in a patient not hospitalized or residing in a long‐term‐care facility for 14 days prior to the onset of symptoms.1 CAP continues to be a common and serious illness, causing substantial morbidity and mortality in the adult population. There are an estimated 56 million cases a year in the United States, with greater than 1 million hospitalizations. Community‐acquired pneumonia is one of the most common admitting diagnoses among adults, and with a 30‐day mortality between 10% and 14% for patients admitted to the hospital, it is the leading cause of infectious death in the United States.2 In elderly patients, hospitalization for CAP portends a poor long‐term prognosis. In a Medicare database, the 1‐year mortality for patients with CAP was nearly 40%, compared to 29% in patients with other diagnoses.3 Community‐acquired pneumonia is a model illness in hospital medicineit is a common disease that allows for evidence‐based and cost‐effective management. In addition, many national organizations have proposed multiple quality indicators for community‐acquired pneumonia, thus providing an opportunity for institutional quality improvement. This review article outlines the assessment and management of patients admitted to the hospital with community‐acquired pneumonia.
Etiology
Although many pathogens can cause community‐acquired pneumonia, the clinical syndromes and microbiology of CAP have traditionally been characterized as either typical or atypical. The typical organisms include Streptococcus pneumoniae, Haemophilus influenzae, and Moraxella catarrhalis, and the atypical organisms include Chlamydia spp., Mycoplasma pneumoniae, Legionella spp., and viruses. This historical distinction has recently come into question. It is now clear that the presenting symptoms, signs, and basic laboratory findings (including the chest radiograph) cannot be reliably used to predict the etiologic pathogen or to distinguish typical from atypical organisms.4 Rather, the specific causative agent of CAP depends more on the degree of patient illness. Table 1 shows what prospective studies with comprehensive diagnostic strategies determined to be the most common pathogens in patients hospitalized for CAP in ICU and non‐ICU settings.5 Streptococcus pneumoniae remains the most common cause of CAP in hospitalized patients and is the most common cause of fatal pneumonia, whereas Legionella spp. is a common cause of severe CAP, more often found in patients requiring admission to the intensive care unit. Gram‐negative bacilli can cause CAP in elderly patients and those recently treated with broad‐spectrum antibiotics or with underlying lung disease. Notably, though, despite improved diagnostic testing, only one quarter of all admitted patients with CAP have the etiologic agent defined, and therefore empiric therapy should be directed broadly at the most likely organisms.6
| Non‐ICU inpatients | ICU inpatients (severe) |
|---|---|
| S. pneumoniae | S. pneumoniae |
| M. pneumoniae | Legionella spp |
| C. pneumoniae | H. influenzae |
| H. influenzae | Gram‐negative bacilli |
| Legionella spp | S. aureus |
| Aspiration | |
| Respiratory viruses |
Clinical Presentation
Patients admitted to the hospital with CAP typically present with a brief history of respiratory complaints, including cough (greater than 90%), dyspnea (66%), sputum production (66%), and pleuritic chest pain (50%); see Table 2.7, 8 In 10%30% of patients, nonrespiratory complaints predominate, including headache, myalgias, fatigue, and gastrointestinal symptoms.6 Elderly patients, an increasing percentage of hospitalized patients, are less likely to present with typical CAP symptoms (such as cough) and more likely to have altered mental status as a presenting symptom.9
| Symptoms | Signs (exam) |
|---|---|
| Cough 90% | Fever 80% |
| Dyspnea 66% | Tachypnea 70% |
| Sputum 66% | Tachycardia 50% |
| Pleuritic chest pain 50% | Focal lung exam >90% |
On physical examination, patients with CAP usually have signs of fever (80%), tachypnea (70%), and tachycardia (50%); see Table 2. Most will have a focal lung exam (>90%) with findings ranging from crackles to bronchial breath sounds.10 No exam finding is specific for the diagnosis of pneumonia, but the absence of fever, tachycardia, and tachypnea significantly reduces the probability of CAP in patients with suspected pneumonia.10 Furthermore, similar to the clinical history, the physical examination of elderly patients with community‐acquired pneumonia is not specific or sensitive for the diagnosis of CAP. For example, up to 40% of elderly patients subsequently determined to have CAP may not have fever.11
Leukocytosis is common in patients with CAP; however, its absence does not rule out disease.12 A number of guidelines recommend laboratory evaluation of electrolytes, urea nitrogen, creatinine, liver enzymes, and bilirubin, although these are used primarily for prognostication and are not specifically useful in the diagnosis of CAP.
DIAGNOSIS
Differential Diagnosis
Given the nonspecific nature of the symptoms and signs associated with CAP, there is no single clinical feature or combination of clinical features that adequately rules in or out the diagnosis of CAP. Consequently, the differential diagnosis to be considered in patients with suspected CAP is broad. Noninfectious diseases can often present with similar clinical syndromes; these include congestive heart failure, exacerbation of chronic obstructive pulmonary disease (COPD), asthma, pulmonary embolism, and hypersensitivity pneumonitis. These diseases can often be distinguished with a thorough history and physical examination.
In addition, other upper‐ and lower‐airway infectious diseases can have similar nonspecific signs and symptoms. In particular, pneumonia must often be differentiated from acute bronchitis, which as a diagnosis accounts for up to 40% of patients evaluated for cough (versus 5% for pneumonia).10 Patients with acute bronchitis frequently do not present with high fevers or hypoxia and in general will not benefit from antibiotic therapy.13 Patients believed to have community‐acquired pneumonia might also be suffering from other pneumonia syndromes including aspiration pneumonia, postobstructive pneumonia, and pneumonia in immunocompromised patients (eg, those with HIV, on steroids, receiving chemotherapy). Determining the correct diagnosis can have implications for therapy and prognosis.
Diagnostic Studies
The diagnosis of community‐acquired pneumonia requires that a patient have both signs and symptoms consistent with pulmonary infection and evidence of a new radiographic infiltrate. Therefore, most guidelines recommend that all patients with a possible diagnosis of CAP be evaluated with chest radiography.1, 14, 15
The specific radiographic findings in community‐acquired pneumonia range from lobar consolidation to hazy focal infiltrate to diffuse bilateral interstitial opacities (see Figure 1). Although chest radiography has traditionally been considered the gold standard for the diagnosis of CAP, its exact performance characteristics are unknown, and it is clearly not 100% sensitive or 100% specific. The utility of the chest radiograph can be limited by patient body habitus, underlying lung disease, or dehydration. Computed tomography (CT) scanning, although not recommended for routine use, can identify pulmonary consolidation in up to 30% of patients with a normal or equivocal chest radiograph in whom pneumonia is suspected and can also identify complications of pneumonia including an empyema or pulmonary abscess.16
Limitations in the performance of the chest radiograph have resulted in an interest in the diagnostic performance of serologic markers of infection such as C‐reactive protein (CRP), procalcitonin, and soluble triggering receptor expressed on myeloid cells (s‐TREM).1719 Preliminary evidence suggests these inflammatory markers may ultimately prove useful in differentiating infectious from noninfectious pulmonary processes, but regular use of these new tests cannot currently be recommended.
Most expert guidelines state that 2 sets of blood cultures should be taken and analyzed prior to antibiotic administration in all patients admitted to the hospital with suspected community‐acquired pneumonia.1, 14, 15 Isolation of bacteria from blood cultures in CAP is a very specific way to identify a causative organism in order to subsequently narrow therapy and also identifies a high‐risk group of patients because bacteremia is associated with increased mortality. Obtaining blood cultures within 24 hours of admission has been associated with 10% lower odds of 30‐day mortality in patients with CAP,20 and as a result, drawing blood cultures prior to antibiotic administration is a national quality indicator for CAP.
There are, however, a number of problems with the routine acquisition of blood cultures in all patients admitted with CAP. Practically, the cultures can be difficult to obtain, can potentially delay the initiation of antibiotics, and are often contaminated, which has been shown to increase both cost and length of stay.21, 22 The yield is generally low: the true‐positive bacteremia rate for admitted patients with CAP ranges from 6% to 9%, and the culture results rarely change management or outcomes.23, 24 Given these limitations, many have argued that blood cultures should be obtained with a more targeted approach. A recent study used a Medicare database to create a decision‐support tool to help maximize the value of blood cultures in CAP.25 The predictors of a positive blood culture are shown in Table 3. Not obtaining cultures on patients who had received prior antibiotics or had no risk factors resulted in about 40% fewer overall cultures while identifying approximately 90% of bacteremias. In their guidelines, the British Thoracic Society (BTS) advocates a similar strategy, recommending blood cultures be omitted in nonsevere pneumonia and in patients without comorbidities.15, 26 Although recommendations vary for non‐severe CAP in hospitalized patients, all professional society guidelines agree that blood cultures should be obtained in critically ill patients, and if cultures are obtained, they should be drawn prior to antibiotics.1, 14, 15, 26
| Comorbidities |
| Liver disease |
| Vital signs |
| Systolic blood pressure 90 mm Hg |
| Temperature 35C or 40C |
| Pulse 125 beats/min |
| Laboratory and radiographic data |
| Blood urea nitrogen (BUN) 30 mg/dL |
| Sodium 130 mmol/L |
| White blood cells 5000/mm3 or > 20,000/mm3 |
| Prior use of antibiotics (negative predictor) |
Substantial controversy surrounds the utility of routine sputum gram stains and cultures for patients admitted to the hospital with CAP. The Infectious Disease Society of America (IDSA) and the British Thoracic Society (BTS) both recommend that all patients admitted to the hospital with community‐acquired pneumonia should have a gram stain and culture of expectorated sputum.1, 15, 26 Both organizations argue sputum collection is a simple and inexpensive procedure that can potentially identify pathogenic organisms and can affect both initial and long‐term antibiotic therapy. Most notably, they highlight gram stain specificity of greater than 80% for pneumococcal pneumonia. Conversely, the American Thoracic Society (ATS) argues that sputum gram stains and cultures generally have low sensitivity, specificity, and positive predictive value.14 Furthermore, they argue the utility of sputum testing is also limited practically; in one study 30% of patients could not produce an adequate sputum specimen and up to 30% had received prior antibiotic therapy, substantially reducing the yield.27 In another study, good‐quality sputum with a predominant morphotype could be obtained in only 14% of patients admitted with CAP.28 However, targeting sputum analysis to patients who have not received prior antibiotics and are able to produce an adequate sample improved the yield significantly.29 In addition, with increasing rates of antibiotic resistance among common community isolates (ie, S. Pneumoniae) and the increasing prevalence of infecting organisms not targeted by routine empiric therapy (methicillin‐resistant Staphylococcus Aureus [MRSA]), isolation of potential causative pathogens is increasingly important. We believe that severely ill patients with CAP (such as patients admitted to the ICU), as well as patients with identifiable risk factors for uncommon or drug‐resistant pathogens (eg, Pseudomonas aeruginosa, enteric gram‐negative rods, MRSA, etc.) should have sputum sent for gram stain and culture. Ideally, sputum obtained for gram stain and culture should be:
-
Prior to antibiotic therapy,
-
A deep‐cough, expectorated specimen,
-
A purulent specimen (>25 polymorphonucleacytes and less than 10 squamous cells per high‐powered field), and
-
Rapidly transported to the laboratory.
Subsequent gram stain and culture results should be interpreted in the specific clinical context and antibiotic choices targeted appropriately.
Alternative Diagnostic Tests
In recent years, there has been growth in additional diagnostic tests targeting specific organisms. The pneumococcal urinary antigen assay is a relatively sensitive (50%80%) and highly specific (90%) test for the detection of pneumococcal pneumonia, when compared with conventional diagnostic methods.27 The test is simple, convenient, rapid ( 15 min), and, with its high specificity, may allow for more focused antimicrobial therapy early in management. Current limitations include the possibility of false‐positive tests in patients colonized with S. pneumoniae or infected with other streptococcal species, as well as the inability to determine antibiotic sensitivity from positive tests. Updated IDSA and BTS guidelines state pneumococcal urinary antigen testing is an acceptable adjunct to other diagnostic tests, but blood and sputum analyses should still be performed.26, 27 For patients with suspected Legionella pneumonia (primarily critically ill and immunocompromised patients or in association with regional outbreaks), the urinary Legionella antigen assay is the test of choice, which detects 80%95% of community‐acquired cases of Legionnaires' disease with a specificity of 90%.27
During the winter months (typically from October to March), rapid antigen testing for influenza is generally recommended for patients with signs or symptoms consistent with influenza.27 The sensitivity of these tests is approximately 50%70%, so negative test results do not exclude the diagnosis, but results can be important epidemiologically and therapeutically (differentiating influenza A and B strains).27 Diagnostic tests targeting other common CAP pathogens, such as serologic tests for Mycoplasma pneumoniae or Chlamydia spp, should not be routinely performed. Testing for less common causative pathogens such as Mycobacterium tuberculosis should only be employed in the appropriate clinical setting.
ADMISSION DECISION
Once the diagnosis of CAP has been made, the initial site where treatment will occur, whether the hospital or the home, must be determined. The decision to hospitalize should be based on 3 factors: 1) evaluation of the safety of home treatment, 2) calculation of the Pneumonia Severity Index (PSI), and 3) clinical judgment of the physician.27 The PSI, or PORT (Pneumonia Outcomes Research Team) score, is a validated prediction rule that quantifies mortality and allows for risk stratification of patients with community‐acquired pneumonia.2 The PSI combines clinical history, physical examination, and laboratory data at the time of admission to divide patients into 5 risk classes and to estimate 30‐day mortality (Figure 2), which ranges from 0.1% of patients in risk class I to 27.0% in risk class V.2
On the basis of the estimated prognosis and in the absence of concerns about home safety or comorbidities, patients in risk classes I, II, and III should be managed at home. Many prospective trials have shown that implementation of PSI significantly increases the number of low‐risk patients managed outside the hospital, with no differences in quality of life, complications, readmissions, or short‐term mortality.30, 31 Most recently, a trial randomizing patients in risk classes II and III to treatment in the hospital or at home found no significant differences in clinical outcomes but did find that patients were more satisfied with care at home.32 Because the number of patients with CAP being treated at home is increasing, the American College of Chest Physicians recently published a consensus statement on the management of community‐acquired pneumonia in the home.33 All national guidelines for the management of community‐acquired pneumonia recommend using the PSI to help determine the initial location of treatment, with the caveat that using the prediction rule should never supersede clinical judgment in the decision about whether to admit.1, 14, 15, 26, 27 A practical decision tree for the use of the PSI is shown in Figure 3.
There are no reliable prediction rules for deciding on whether admission to the intensive care unit is necessary. Hemodynamic instability requiring resuscitation and monitoring or respiratory failure requiring ventilatory support are clear indications for ICU admission. Additional variables such as tachypnea (respiratory rate 30), altered mental status, multilobar disease, and azotemia are associated with severe CAP and should prompt consideration of ICU admission, especially when 2 or more variables coexist.14
TREATMENT
Initial Treatment
Once the admission decision is made and the initial diagnostic tests are completed (including blood and sputum cultures), patients with presumed community‐acquired pneumonia should receive necessary supportive care (O2, intravenous fluids, etc.) and prompt antimicrobial therapy. Antibiotics should be administered within 4 hours of arrival to patients with suspected CAP, as such prompt administration may be associated with shorter in‐hospital stays and decreased 30‐day mortality.34, 35 Regulatory organizations such as the Joint Commission on Accreditation of Healthcare Organizations (JCAHO) and the Center for Medicare Services (CMS) have made delivery of antibiotics in less than 4 hours a hospital quality measure.
Despite diagnostic testing, the specific etiologic agent causing the pneumonia of a patient remains unknown in up to 75% of those admitted to the hospital.14 Most expert guidelines therefore recommend broad‐spectrum empiric therapy targeting both the typical and the atypical organisms that commonly cause CAP (Table 1).
Recommendations for empiric antibiotics are driven by 2 key factors: antibiotic resistance by S. pneumoniae and the results of studies of CAP treatment outcomes. Historically, patients with suspected community‐acquired pneumonia were treated with penicillin with generally good outcomes. Recently, the rate of S. pneumoniae isolates resistant to penicillin has risen dramatically in the United States, ranging between 20% and 30%, with high‐level resistance (MIC 4 mg/L) as high as 5.7%.36, 37 Concurrently, the rates of resistance of S. pneumoniae to many other antibiotics commonly used to treat CAP have also risen.37 Despite increasing resistance overall, most U.S. pneumococcal isolates have low resistance to third‐generation cephalosporins and fluoroquinolones with enhanced activity against S. pneumoniae.3638 In addition, despite increasing resistance by pneumococcal isolates to penicillin, several observational studies have shown that regardless of initial therapy, resistance to penicillin as well as third‐generation cephalosporins is not associated with higher mortality or worse outcomes when controlled for other risk factors for drug resistance.39, 40 An exception to that rule is pneumococcal isolates that are very highly resistant to PCN (MIC 4 mg/dL). At least one study has shown that patients with such isolates may be at higher risk for adverse outcomes and should probably not be treated with penicillins.1, 14, 15, 41 However, nationally, fewer than 6% of pneumococcal isolates have this level of resistance.37
The rationale for empiric broad‐spectrum coverage against both typical and atypical organisms has arisen from many retrospective and observational studies that have suggested that there is clinical benefit and improved outcomes with such regimens. One large retrospective study showed that in elderly patients with CAP, fluoroquinolone monotherapy was associated with lower 30‐day mortality when compared to monotherapy with a third‐generation cephalosporin.34 Adding an extended‐spectrum macrolide (eg, azithromycin) to an extended‐spectrum ‐lactam (eg, ceftriaxone) in the treatment of patients hospitalized with nonsevere CAP also appears to be associated with improved outcomes. Adding a macrolide has resulted in shorter lengths of stay (LOS), less treatment failure, and lower mortality.34, 4244 Similarly, according to unpublished observations, adding doxycycline to a ‐lactam as initial therapy was associated with a benefit of decreased mortality.45 The presumed etiology of the benefit has been the addition of specific coverage of atypical organisms, such as Mycoplasma pneumoniae and Chlamydia pneumoniae, which are common causes of CAP (Table 1). Others have proposed that the benefit of therapy with macrolides may be derived from the inherent anti‐inflammatory properties of macrolides.46 Because research has shown a benefit of dual versus monotherapy across a spectrum of antibiotics, others have proposed the benefit is simply a result of receiving double antibiotic coverage. In particular, 2 studies found a benefit of reduced mortality from combination therapy over monotherapy in bacteremic pneumococcal pneumonia.47, 48
Yet the accumulated evidence for adding coverage of atypical organisms has been only retrospective and observational. Because of this, the recommendation to routinely add antibiotics active against atypical organisms has been questioned by some. Two recent meta‐analyses and a systematic review examined all the available data on the need for atypical coverage in the treatment of patients with community‐acquired pneumonia.4951 Surprisingly, none showed a benefit in clinical efficacy or survival in patients treated with agents active against both atypical and typical organisms when compared to regimens with only typical coverage. In subset analyses, there was a benefit to providing empiric atypical coverage in patients subsequently shown to have Legionella spp. as a causative pathogen. However, this organism was uncommon in all 3 studies. Unfortunately, most studies included in the meta‐analyses compared fluoroquinolone or macrolide monotherapy with third‐generation cephalosporin monotherapy. There have been no high‐quality randomized, controlled trials of the treatment of hospitalized patients with CAP assessing combination therapy covering both typical and atypical organisms with monotherapy targeting typical organisms alone. High‐quality trials are warranted.
Despite the recent articles questioning the importance of atypical coverage, citing the substantial retrospective data and the general inability to identify causative organisms in most cases of CAP, adding a second agent with atypical coverage to a ‐lactam currently appears to be the most efficacious empiric treatment for CAP. Nearly all expert guidelines for the management of community‐acquired pneumonia recommend this empiric approach.1, 14, 27
Table 4 displays our recommendations for the treatment of community‐acquired pneumonia requiring hospitalization. Before implementation of these guidelines, hospitalists should consult with their infectious disease experts and consider local resistance patterns. In general, a typical adult patient with non‐severe CAP without additional risk factors should receive a parenteral extended‐spectrum ‐lactam plus either doxycycline or an advanced macrolide (see Table 4). Extended‐spectrum ‐lactams include cefotaxime, ceftriaxone, ampicillin‐sulbactam, and ertapenem. A respiratory fluoroquinolone as a single agent can be used for non‐ICU patients with CAP, but some agencies, including the Centers for Disease Control (CDC), discourage routine use of these agents in all patients secondary to concerns about cost and increasing gram‐negative rod fluoroquinolone resistance.52, 53
| Patient group | Empiric antibiotic therapy |
|---|---|
| |
| Inpatient, non‐ICU | ‐Lactama + either doxycycline or an advanced macrolideb |
| Severe ‐lactam allergyc | Respiratory fluoroquinoloned |
| Inpatient, ICU | |
| No risk for Pseudomonas | ‐Lactam + either an advanced macrolide or a respiratory fluoroquinolone |
| Severe ‐lactam allergy | Respiratory fluoroquinolone + clindamycin |
| Pseudomonas risk factorse | Antipseudomonal ‐lactamf + an antipseudomonal fluoroquinoloneg |
| Severe ‐lactam allergy | Aztreonam + a respiratory fluoroquinolone |
| MRSA risk factorsh | Add vancomycin to above regimens |
| From nursing home | Should be treated as nosocomial/health‐care‐associated pneumonia |
| Aspiration pneumonia | ‐Lactam or respiratory fluoroquinolone clindamycini |
Patients hospitalized with severe CAP who require ICU‐level care are at increased risk of Legionella spp. and drug‐resistant S. pneumoniae, which must be reflected in their initial antibiotic therapy.5 Patients with severe pneumonia should receive an intravenous extended‐spectrum ‐lactam plus either an intravenous macrolide or an intravenous respiratory fluoroquinolone.
All patients with severe CAP who are admitted to the intensive care unit should be routinely screened for risk factors for Pseudomonas aeruginosa. The known risk factors for pseudomonal infection are: bronchiectasis, immunosuppression including more than 10 mg/day of prednisone, malnutrition, and treatment with broad‐spectrum antibiotics in the last month.14 Those at risk for Pseudomonas aeruginosa or other resistant gram‐negative rod infection should be treated with an antipseudomonal ‐lactam plus an antipseudomonal fluoroquinolone. Many patients with severe CAP have risk factors for MRSA infection including recent prolonged hospitalization, recent use of broad‐spectrum antibiotics, and significant underlying lung disease, which should be considered in choosing initial antibiotic therapy.54 In addition, there have been reports of patients without underlying risk factors presenting with severe community‐acquired MRSA pneumonia. Many of these patients were younger and the MRSA pneumonia was associated with a necrotizing or cavitary disease requiring prolonged ICU stays.5558 In such cases or if an institution's rate of methicillin resistance in S. aureus community isolates is high (>15%20%), it may be appropriate to add initial empiric MRSA coverage for patients admitted to the ICU with CAP.55
Some patients will have unique risk factors and clinical presentations, which may require modification of these empiric recommendations. Several studies found 5%15% of cases of community‐acquired pneumonia to be aspiration pneumonia.57 Risk factors for aspiration events include, among others, dysphagia, history of stroke, altered level of consciousness, poor dentition, and tube feeding. Aspiration pneumonia traditionally was believed to be secondary to oral anaerobes, but recent research suggests gram‐positive cocci and gram‐negative rods are the predominant organisms.58 Antibiotic therapy in patients with clear aspiration pneumonia should be directed at these microbes with an extended‐spectrum ‐lactam (eg, ceftriaxone) or a respiratory fluoroquinolone (eg, levofloxacin or moxifloxacin). Anaerobic bacterial coverage can be added in patients with severe periodontal disease, alcoholism, concern for empyema, or evidence of aspiration with pulmonary abscess.58
Patients residing in long‐term care facilities are at high risk of contracting pneumonia. The microbiology of infections acquired in nursing facilities is similar to that in hospital‐acquired cases.59, 60 As a result, patients who develop pneumonia in institutional settings such as nursing homes should be treated with broad‐spectrum antibiotics, including coverage for MRSA.
Subsequent Treatment
Initial empiric antibiotic treatment should be modified based on the results of diagnostic testing. Although the specific etiologic agent is determined in only 25% of cases of CAP,35 when an organism is isolated, antibiotic coverage should be narrowed to cover that particular organism with an antibiotic with adequate lung penetration. Evidence suggests clinicians often do not adjust or narrow antibiotics based on sensitivity results, potentially breeding resistant organisms.61
Patients hospitalized with CAP usually improve quickly if they receive early, appropriate antibiotic therapy and supportive care. Excluding patients with severe CAP requiring intensive care unit admission, most patients resolve their tachycardia, tachypnea, and fever by day 2 or 3.62 Recent practice experience, evidence, and published guidelines14, 27 all indicate that patients can safely be transitioned to oral antibiotic therapy earlier in their hospital course. Table 5 outlines criteria that can be used to identify patients who have had an adequate response to parenteral therapy and can be considered for a switch to oral antibiotics. If these criteria are met, patients have less than a 1% chance of clinical deterioration necessitating admission to an ICU or transitional care unit.62 When an etiologic organism is not identified, oral therapy should reflect a spectrum of coverage to that of the initial intravenous therapy. In some cases, this may require use of more than one oral agent. We have had success, however, transitioning non‐ICU patients initially treated with intravenous ceftriaxone plus oral doxycycline, typically for 4872 hours, to oral doxycycline monotherapy at discharge.45
| Stable vital signs and clinical criteria for 24 hours |
| Temperature 37.8C (100F) |
| Heart rate 100 beats per minute |
| Respiratory rate 24 breaths per minute |
| Systolic blood pressure 90 mm Hg |
| Oxygen saturation (on room air) 90% |
| Ability to take oral medications |
There have been a limited number of high‐quality randomized trials examining the optimal duration of treatment for community‐acquired pneumonia. Most practice guidelines recommend 710 days for patients with CAP requiring hospitalization, with 14 days for documented Mycoplasma pneumoniae or Chlamydia pneumoniae. One recent randomized trial of patients with mild to severe CAP showed a short course of high‐dose levofloxacin (750 mg daily 5 days) was at least as effective as normal dosing (500 mg daily 10 days).63 Clinical experience with high‐dose levofloxacin is limited, but this regimen can be considered because it may reduce costs and exposure to antibiotics. When diagnosed, Legionella is usually treated for 1021 days, but 14 days is adequate with macrolides because of their long half‐life.27 Patients with more virulent pathogens like Staphylococcus aureus or Pseudomonas aeruginosa or other suppurative complications should be treated for at least 14 days.1, 14, 15, 27 In determining length of therapy, clinicians should use these durations of treatment as guides, and to individualize therapy, they should always consider patient age and frailty, comorbid conditions, severity of illness, and hospital course.
Failure to Respond
Although most patients hospitalized for CAP will improve rapidly and reach clinical stability in 23 days, some patients fail to respond. Some studies have estimated that failure to improve or clinical deterioration occurs in 5%10% of patients in the first 23 days.64 The common reasons for clinical decline or nonresponse to treatment, highlighted in Table 6, are:
-
Incorrect diagnosis: Illnesses such as congestive heart failure, pulmonary embolism, neoplasms, and hypersensitivity pneumonitis can mimick CAP.
-
Inadequate antibiotic selection: The etiologic agent may be resistant to empiric antibiotic selections. Examples would include methicillin‐resistant Staphylococcus aureus (MRSA) or multiresistant gram‐negative bacilli.
-
Unusual pathogen: CAP syndromes can be caused by myriad unusual organisms including Pneumocystis jirovecii, mycobacterium tuberculosis, endemic fungal infections (eg, coccidioidomycosis), and nocardiosis.
-
Complications of pneumonia: Specific complications of CAP include empyema, pulmonary abscess, extrapulmonary spread including meningitis or endocarditis, or other organ dysfunctions such as renal failure or myocardial infarction.
-
Inadequate host response: Despite appropriate antibiotic and supportive therapy, patients with CAP often fail to respond.
| Incorrect diagnosis of CAP. |
| Inadequate or inappropriate antibiotic selection for CAP. |
| Unusual pathogen causing CAP. |
| Pulmonary or extrapulmonary complication of CAP. |
| Inadequate or poor host response. |
Progressive pneumonia despite appropriate therapy and empyema were the most common causes of failure to respond in the first 72 hours in a recent study.64 Risk factors for early failure were older age (>65 years), Pneumonia Severity Index > 90, Legionella pneumonia, gram‐negative pneumonia, and initial antimicrobial therapy discordant with final culture and susceptibility results. The initial evaluation of the nonresponding patient should address these common causes and is likely to include additional imaging (CT), sampling of potential extrapulmonary infection (thoracentesis), and, in some cases, bronchoscopy.
DISCHARGE/FOLLOW‐UP PLANS
Patients hospitalized for community‐acquired pneumonia can be safely discharged when they have reached clinical stability, are able to tolerate oral medications, have no other active comorbid conditions, and have safe, close, appropriate outpatient follow‐up (see Table 7). Clinical pathways employing these discharge criteria have been found to be safe and effective in reducing the length of stay for CAP. Most important, patients should have met most if not all of the vital sign and clinical criteria noted in Table 5 in the criteria for switching to oral therapy. Patients with 2 or more abnormal vital signs (instabilities) within 24 hours prior to discharge are at high risk of readmission and mortality, but those with one or no abnormal vital signs generally have good outcomes.65 Absent other clinical factors or extenuating circumstances (persistent hypoxia, poor functional status, etc.), most patients with CAP should reach clinical stability by day 3 or 4, be considered for a switch to oral therapy, and, if stable, be discharged shortly thereafter.
| Patients should: |
|
Meet clinical criteria in Table V. |
| Be able to tolerate oral medications (no need to observe for 24 hours on oral therapy). |
| Have no evidence of active comorbid conditions (myocardial ischemia, pulmonary edema, etc.). |
| Have a normal mental status (or have returned to their baseline). |
| Have safe, appropriate outpatient follow‐up. |
When patients with CAP are discharged from the hospital, they should be counseled about the expected course of recovery. Most important, patients and families must be informed that many symptoms of CAP may persist well after hospitalization. In one study, up to 80% of patients reported persistent cough and fatigue 1 week after discharge, and up to 50% still had dyspnea and sputum production. In some, the cough can last for 46 weeks.8
All patients discharged after treatment of community‐acquired pneumonia should have follow‐up with their outpatient provider. The physician responsible for their inpatient care should communicate directly with the provider and outline the hospital course, the discharge medications, and the duration of antibiotic therapy. There is no specific time frame within which patients must be seen, but follow‐up should be dictated by patient age, comorbidities, clinical stability at discharge, and degree of illness. The American Thoracic Society guidelines do recommend patients with a substantial smoking history who are hospitalized with CAP have a follow‐up chest radiograph 46 weeks after discharge to establish a radiographic baseline and exclude the possibility of underlying malignancy.14 However, several studies have suggested that radiographic resolution may take 3 or more months in some patients, especially the elderly and those with multilobar disease.66
PREVENTION
Prevention of community‐acquired pneumonia and pneumonic syndromes has traditionally relied on vaccination with the polysaccharide pneumococcal pneumonia vaccine and the seasonal influenza vaccine. The vaccine for S. pneumoniae used in adults is composed of the 23 serotypes that cause 85%90% of the invasive pneumococcal infections in the United States. Although in randomized trials the vaccine has not consistently prevented community‐acquired pneumonia or death in elderly patients or those with comorbidities, it likely prevents invasive pneumococcal infection.67 National guidelines and the CDC recommend the pneumococcal vaccine be given to all patients older than 65 years and those with chronic medical conditions.1, 14, 15
The seasonal influenza vaccine has clearly been shown to decrease influenza‐related illness in elderly and high‐risk patient populations. As well, in a meta‐analysis and a large observational study of patients older than 65 years, vaccination against influenza prevented pneumonia, hospitalization, and death.68, 69 Vaccination of health care workers may also confer a benefit to elderly patients of reduced mortality. The CDC recommends the influenza vaccine for all patients more than 50 years old, those with comorbidities, those at high risk for influenza, and health care workers in both inpatient and outpatient settings.
Pneumococcal and influenza vaccination have traditionally been relegated to the outpatient setting. National guidelines and the CDC recommend vaccination of all eligible hospitalized patients. Vaccination is safe and effective with almost any medical illness, and both vaccines can be given simultaneously at discharge.69 Both JCAHO and CMS have defined administration of the pneumococcal and influenza vaccines to patients hospitalized with CAP as a quality measure. Using standing orders is the most effective means of ensuring vaccination.
Some evidence suggests that tobacco smokers are at increased risk of invasive pneumococcal disease or pneumonia.70 Patients hospitalized (for all illnesses, but for CAP in particular) should be counseled about smoking cessation and offered pharmacotherapy and outpatient follow‐up. And, finally, recent observational data suggests that use of acid suppressive therapy, including proton pump inhibitors and H‐2 receptor antagonists, may be associated with an increased risk of developing CAP.71 Patients using these agents who are admitted with CAP should have their indications for treatment reviewed, especially when the pneumonia has been recurrent and there is no clear indication for continued use of acid suppressive therapy, in which case they should be discontinued in the hospital.
CONCLUSIONS
Community‐acquired pneumonia remains a common cause for hospitalization of adult patients, with significant associated morbidity and mortality. Although there are multiple expert guidelines for the management of community‐acquired pneumonia, further research is urgently needed. Clinicians need improved diagnostic tests that enable an earlier and more accurate diagnosis of CAP. In addition, the etiologic agent causing CAP is rarely discovered; improved microbiologic studies might enable antibiotic therapy to be targeted to the organisms responsible. High‐quality randomized, controlled trials examining empiric antibiotic therapy in CAP are needed, especially related to the addition of agents covering atypical organisms. Last, the general management of patients hospitalized with CAP is marked by significant heterogeneity, and research and initiatives focusing on improving the quality and process of care of patients with CAP are needed.
- ,,,,,.Guidelines from the Infectious Disease Society of America. Practice guidelines for the management of community‐acquired pneumonia.Clin Infect Dis.2000;31:347–382.
- ,,, et al.A prediction rule to identify low‐risk patients with community‐acquired pneumonia.N Engl J Med.1997;336:243–250.
- ,,, et al.Pneumonia: still the old man's friend?Arch Intern Med.2003;163:317–323.
- ,,, et al.New and emerging etiologies for community‐acquired pneumonia with implications for therapy. A prospective multicenter study of 359 cases.Medicine.1990;69:307–316.
- .Community‐acquired pneumonia.Lancet.2003;362:1991–2001.
- ,,, et al.Processes and outcomes of care for patients with community‐acquired pneumonia: results from the Pneumonia Patient Outcomes Research Team (PORT) cohort study.Arch Intern Med.1999;159:970–980.
- ,.Management of community‐acquired pneumonia.N Engl J Med.2002;347:2039–2045.
- ,,, et al.Measuring symptomatic and functional recovery in patients with community‐acquired pneumonia.J Gen Intern Med.1997;12:423–430.
- ,,, et al.Influence of age on symptoms at presentation with patients with community‐acquired pneumonia.Arch Intern Med.1997;157:1453–1459.
- ,,.Does this patient have community‐acquired pneumonia? Diagnosing pneumonia by history and physical examination.JAMA.1997;278:1440–1445.
- ,,, et al.Community‐acquired pneumonia in very elderly patients: causative organisms, clinical characteristics, and outcomes.Medicine.2003;82:159–169.
- ,.Testing strategies in the initial management of patients with community‐acquired pneumonia.Ann Intern Med.2003;138:109–118.
- ,.Uncomplicated acute bronchitis.Ann Intern Med.2000;133:981–991.
- ,,, et al.American Thoracic Society: Guidelines for the management of community‐acquired pneumonia: diagnosis, assessment of severity, antimicrobial therapy, and prevention.Am J Respir Crit Care Med.2001;163:1730–1754.
- ,,, et al.British Thoracic Society guidelines for the management of community acquired pneumonia in adults.Thorax.2001;56:Suppl. 4,IV1–IV64.
- ,,,,.High‐resolution computed tomography for the diagnosis of community‐acquired pneumonia.Clin Infect Dis.1998;27:358–363.
- ,,, et al.Performance of a bedside C‐reactive protein test in the diagnosis of community‐acquired pneumonia in adults with acute cough.Am J Med.2004;116:529–535.
- ,,, et al.Effect of procalcitonin‐guided treatment on antibiotic use and outcome in lower respiratory tract infections: cluster‐randomised, single‐blinded intervention trial.Lancet.2004;363:600–607.
- ,,, et al.Soluble triggering receptor expressed on myeloid cells and the diagnosis of pneumonia.N Engl J Med.2004:350:451–458.
- ,,, et al.Quality of care, process, and outcomes in elderly patients with pneumonia.JAMA.1997;278:2080–2084.
- ,,,.Limited usefulness of initial blood cultures in community acquired pneumonia.Emerg Med J.2004;21:446–448.
- ,,.Contaminant blood cultures and resource utilization. The true consequences of false‐positive results.JAMA.1991;265:365–369.
- ,,, et al.The contribution of blood cultures to the clinical management of adult patients admitted to the hospital with community‐acquired pneumonia: a prospective observational study.Chest.2003;123:1142–1150.
- ,,, et al.Clinical utility of blood cultures in adult patients with community‐acquired pneumonia without defined underlying risks.Chest.1995;108:932–936.
- ,,,.Predicting bacteremia in patients with community‐acquired pneumonia.Am J Respir Crit Care Med.2004;169:342–347.
- British Thoracic Society. BTS Guidelines for the management of community acquired pneumonia in adults—2004 update. Available at: www.brit‐thoracic.org/guidelines.
- ,,,,,.Guidelines from the Infectious Disease Society of America. Update of guidelines for the management of community‐acquired pneumonia in immunocompetent adults.Clin Infect Dis.2003;37:1405–1433.
- ,,, et al.Assessment of the usefulness of sputum culture for diagnosis of community‐acquired pneumonia using the PORT predictive scoring system.Arch Intern Med.2004;164:1807–1811.
- ,,.Diagnostic value of microscopic examination of gram‐stained sputum and sputum cultures in patients with bacteremic pneumococcal pneumonia.Clin Infect Dis.2004;39(2):165–169.
- ,,, et al.Safely increasing the proportion of patients with community‐acquired pneumonia treated as outpatients: an interventional trial.Arch Intern Med.1998;158:1350–1356.
- ,,, et al.A critical pathway for treatment of community‐acquired pneumonia.JAMA.2000;283:2654–2655.
- ,,, et al.Outpatient care compared with hospitalization for community‐acquired pneumonia. A randomized control trial in low‐risk patients.Ann Intern Med.2005;142:165–172.
- ,,.Management of community‐acquired pneumonia in the home.Chest.2005;127:1752–1763.
- ,,,,.Associations between initial antimicrobial therapy and medical outcomes for hospitalized elderly patients with pneumonia.Arch Intern Med.1999;159:2562–2572.
- ,,,,.Timing of antibiotic administration and outcomes for Medicare patients hospitalized with community‐acquired pneumonia.Arch Intern Med.2004;164:637–644.
- ,,, et al.Increasing prevalence of multidrug‐resistant Streptococcus pneumoniae in the United States.N Engl J Med.2000;343:1917–1924.
- ,,, et al.Susceptibility patterns of Streptococcus pneumoniae isolates in North America (2002–2003): contemporary in vitro activities of amoxicillin/clavulanate and 15 other antimicrobial agents.Int J Antimicrob Agents.2005;25(4):282–289.
- ,,, et al.Antimicrobial resistance among Streptococcus pneumoniae in the United States: have we begun to turn the corner on resistance to certain antimicrobial classes?Clin Infect Dis.2005;41(2):139–148.
- ,,, et al.Pneumonia acquired in the community through drug‐resistant Streptococcus pneumoniae.Am J Respir Crit Care.1999;159:1835–1842.
- ,,, et al.Drug‐resistant pneumococcal pneumonia: clinical relevance and related factors.Clin Infect Dis.2004;38:787–798.
- ,,, et al.Mortality from invasive pneumococcal pneumonia in the era of antibiotic resistance, 1995–1997.Am J Public Health.2000;90(2):223–9.
- ,,, et al.Lower mortality among patients with community‐acquired pneumonia treated with a macrolide plus a beta‐lactam agent versus a beta‐lactam alone.Eur J Clin Microbiol Infect Dis2005;24:190–195.
- ,,,.Impact of initial antibiotic choice on clinical outcomes in community‐acquired pneumonia: analysis of a hospital claims‐made database.Chest.2003;123:1503–1511.
- ,,,.Antimicrobial selection for hospitalized patients with presumed community‐acquired pneumonia: a survey of nonteaching US community hospitals.Ann Pharmacother2000;34:446–452.
- ,,,,.J Hosp Med.2006;1:7–12.
- .Anti‐inflammatory effects of macrolides—an underappreciated benefit in the treatment of community‐acquired respiratory tract infections and chronic inflammatory pulmonary conditions?J Antimicrob Chemother.2005;55:10–21.
- ,,, et al.Addition of a macrolide to a beta‐lactam based empirical antibiotic regimen is associated with lover in‐hospital mortality for patients with bacteremic pneumococcal pneumonia.Clin Infect Dis.2003;36:389–395.
- ,,, et al.Combination antibiotic therapy lowers mortality among severely ill patients with pneumococcal bacteremia.Am J Respir Crit Care Med.2004;170:440–444.
- ,,,.Empiric antibiotic coverage of atypical pathogens for community‐acquired pneumonia in hospitalized adults.Cochrane Database Syst Rev.2005;2:CD004418.pub2.
- ,,.Effectiveness of β lactam antibiotics compared with antibiotics active against atypical pathogens in non‐severe community‐acquired pneumonia: meta‐analysis.Br Med J.2005;330:456.
- ,,,.Empirical atypical coverage for inpatients with community‐acquired pneumonia.Arch Intern Med.2005;165:1992–2000.
- ,,, et al.Antibiotic resistance among gram‐negative bacilli in US intensive care units: implications for fluoroquinolone use.JAMA.2003;289:885–888.
- ,,, et al.First‐generation fluoroquinolone use and subsequent emergence of multiple drug‐resistant bacteria in the intensive care unit.Crit Care Med.2005;33(2):283–289.
- ,.Etiology of community‐acquired pneumonia.Clin Chest Med.2005;26:47–55.
- .Community‐associated methicillin‐resistant Staphylococcus aureus: not only a cause of skin infections, also a new cause of pneumonia.Curr Opin Infect Dis.2005;18:123–124.
- ,,, et al.Severe community‐onset pneumonia in healthy adults caused by methicillin‐resistant Staphylococcus aureus carrying the Panton‐Valentine leukocidin genes.Clin Infect Dis.2005;40(1):100–107.
- ,,,.Fatal community‐associated methicillin‐resistant Staphylococcus aureus pneumonia in an immunocompetent young adult.Ann Emerg Med.2005;46:401–404.
- .Aspiration pneumonitis and aspiration pneumonia.N Engl J Med.2001;344:665–671.
- ,,, et al.Health care‐associated bloodstream infections in adults: a reason to change the accepted definition of community‐acquired infections.Ann Intern Med.2002;137:791–797.
- American Thoracic Society and theInfectious Diseases Society of America.Guidelines for the management of adults with hospital‐acquired, ventilator‐acquired, and healthcare‐associated pneumonia.Am J Respir Crit Care Med.2005;171:388–416.
- ,,, et al.Blood culture and susceptibility results and allergy history do not influence fluoroquinolone use in the treatment of community‐acquired pneumonia.Pharmacotherapy.2005;25(1):59–66.
- ,,, et al.Time to clinical stability in patients hospitalized with community‐acquired pneumonia: implications for practice guidelines.JAMA.1998;279:1452–1457.
- ,,, et al.High‐dose, short‐course levofloxacin for community‐acquired pneumonia: a new treatment paradigm.Clin Infect Dis.2003;37:752–760.
- ,,, et al.Causes and factors associated with early failure in hospitalized patients with community‐acquired pneumonia.Arch Intern Med.2004;164:502–508.
- ,,, et al.Instability on hospital discharge and the risk of adverse outcomes in patients with pneumonia.Arch Intern Med.2002;162:1278–1284.
- ,,,.Radiographic resolution of community‐acquired bacterial pneumonia in the elderly.J Am Geriatr Soc.2004;52(2):224–229.
- ,,,.Vaccines for preventing pneumococcal infection in adults.Cochrane Database Syst Rev.2003;4:CD000422.
- ,,,,.The efficacy of influenza vaccine in elderly persons: a meta‐analysis and review of the literature.Ann Intern Med.1995;123:518–527.
- ,,, et al.Influenza vaccination and reduction in hospitalizations for cardiac disease and stroke among the elderly.N Engl J Med.2003;348:1322–1332.
- ,,,.Proportion of community‐acquired pneumonia cases attributable to tobacco smoking.Chest.1999;116:375–379.
- ,,, et al.Risk of community‐acquired pneumonia and use of gastric acid‐suppressive drugs.JAMA.2004;292:1955–1960.
- ,,,,,.Guidelines from the Infectious Disease Society of America. Practice guidelines for the management of community‐acquired pneumonia.Clin Infect Dis.2000;31:347–382.
- ,,, et al.A prediction rule to identify low‐risk patients with community‐acquired pneumonia.N Engl J Med.1997;336:243–250.
- ,,, et al.Pneumonia: still the old man's friend?Arch Intern Med.2003;163:317–323.
- ,,, et al.New and emerging etiologies for community‐acquired pneumonia with implications for therapy. A prospective multicenter study of 359 cases.Medicine.1990;69:307–316.
- .Community‐acquired pneumonia.Lancet.2003;362:1991–2001.
- ,,, et al.Processes and outcomes of care for patients with community‐acquired pneumonia: results from the Pneumonia Patient Outcomes Research Team (PORT) cohort study.Arch Intern Med.1999;159:970–980.
- ,.Management of community‐acquired pneumonia.N Engl J Med.2002;347:2039–2045.
- ,,, et al.Measuring symptomatic and functional recovery in patients with community‐acquired pneumonia.J Gen Intern Med.1997;12:423–430.
- ,,, et al.Influence of age on symptoms at presentation with patients with community‐acquired pneumonia.Arch Intern Med.1997;157:1453–1459.
- ,,.Does this patient have community‐acquired pneumonia? Diagnosing pneumonia by history and physical examination.JAMA.1997;278:1440–1445.
- ,,, et al.Community‐acquired pneumonia in very elderly patients: causative organisms, clinical characteristics, and outcomes.Medicine.2003;82:159–169.
- ,.Testing strategies in the initial management of patients with community‐acquired pneumonia.Ann Intern Med.2003;138:109–118.
- ,.Uncomplicated acute bronchitis.Ann Intern Med.2000;133:981–991.
- ,,, et al.American Thoracic Society: Guidelines for the management of community‐acquired pneumonia: diagnosis, assessment of severity, antimicrobial therapy, and prevention.Am J Respir Crit Care Med.2001;163:1730–1754.
- ,,, et al.British Thoracic Society guidelines for the management of community acquired pneumonia in adults.Thorax.2001;56:Suppl. 4,IV1–IV64.
- ,,,,.High‐resolution computed tomography for the diagnosis of community‐acquired pneumonia.Clin Infect Dis.1998;27:358–363.
- ,,, et al.Performance of a bedside C‐reactive protein test in the diagnosis of community‐acquired pneumonia in adults with acute cough.Am J Med.2004;116:529–535.
- ,,, et al.Effect of procalcitonin‐guided treatment on antibiotic use and outcome in lower respiratory tract infections: cluster‐randomised, single‐blinded intervention trial.Lancet.2004;363:600–607.
- ,,, et al.Soluble triggering receptor expressed on myeloid cells and the diagnosis of pneumonia.N Engl J Med.2004:350:451–458.
- ,,, et al.Quality of care, process, and outcomes in elderly patients with pneumonia.JAMA.1997;278:2080–2084.
- ,,,.Limited usefulness of initial blood cultures in community acquired pneumonia.Emerg Med J.2004;21:446–448.
- ,,.Contaminant blood cultures and resource utilization. The true consequences of false‐positive results.JAMA.1991;265:365–369.
- ,,, et al.The contribution of blood cultures to the clinical management of adult patients admitted to the hospital with community‐acquired pneumonia: a prospective observational study.Chest.2003;123:1142–1150.
- ,,, et al.Clinical utility of blood cultures in adult patients with community‐acquired pneumonia without defined underlying risks.Chest.1995;108:932–936.
- ,,,.Predicting bacteremia in patients with community‐acquired pneumonia.Am J Respir Crit Care Med.2004;169:342–347.
- British Thoracic Society. BTS Guidelines for the management of community acquired pneumonia in adults—2004 update. Available at: www.brit‐thoracic.org/guidelines.
- ,,,,,.Guidelines from the Infectious Disease Society of America. Update of guidelines for the management of community‐acquired pneumonia in immunocompetent adults.Clin Infect Dis.2003;37:1405–1433.
- ,,, et al.Assessment of the usefulness of sputum culture for diagnosis of community‐acquired pneumonia using the PORT predictive scoring system.Arch Intern Med.2004;164:1807–1811.
- ,,.Diagnostic value of microscopic examination of gram‐stained sputum and sputum cultures in patients with bacteremic pneumococcal pneumonia.Clin Infect Dis.2004;39(2):165–169.
- ,,, et al.Safely increasing the proportion of patients with community‐acquired pneumonia treated as outpatients: an interventional trial.Arch Intern Med.1998;158:1350–1356.
- ,,, et al.A critical pathway for treatment of community‐acquired pneumonia.JAMA.2000;283:2654–2655.
- ,,, et al.Outpatient care compared with hospitalization for community‐acquired pneumonia. A randomized control trial in low‐risk patients.Ann Intern Med.2005;142:165–172.
- ,,.Management of community‐acquired pneumonia in the home.Chest.2005;127:1752–1763.
- ,,,,.Associations between initial antimicrobial therapy and medical outcomes for hospitalized elderly patients with pneumonia.Arch Intern Med.1999;159:2562–2572.
- ,,,,.Timing of antibiotic administration and outcomes for Medicare patients hospitalized with community‐acquired pneumonia.Arch Intern Med.2004;164:637–644.
- ,,, et al.Increasing prevalence of multidrug‐resistant Streptococcus pneumoniae in the United States.N Engl J Med.2000;343:1917–1924.
- ,,, et al.Susceptibility patterns of Streptococcus pneumoniae isolates in North America (2002–2003): contemporary in vitro activities of amoxicillin/clavulanate and 15 other antimicrobial agents.Int J Antimicrob Agents.2005;25(4):282–289.
- ,,, et al.Antimicrobial resistance among Streptococcus pneumoniae in the United States: have we begun to turn the corner on resistance to certain antimicrobial classes?Clin Infect Dis.2005;41(2):139–148.
- ,,, et al.Pneumonia acquired in the community through drug‐resistant Streptococcus pneumoniae.Am J Respir Crit Care.1999;159:1835–1842.
- ,,, et al.Drug‐resistant pneumococcal pneumonia: clinical relevance and related factors.Clin Infect Dis.2004;38:787–798.
- ,,, et al.Mortality from invasive pneumococcal pneumonia in the era of antibiotic resistance, 1995–1997.Am J Public Health.2000;90(2):223–9.
- ,,, et al.Lower mortality among patients with community‐acquired pneumonia treated with a macrolide plus a beta‐lactam agent versus a beta‐lactam alone.Eur J Clin Microbiol Infect Dis2005;24:190–195.
- ,,,.Impact of initial antibiotic choice on clinical outcomes in community‐acquired pneumonia: analysis of a hospital claims‐made database.Chest.2003;123:1503–1511.
- ,,,.Antimicrobial selection for hospitalized patients with presumed community‐acquired pneumonia: a survey of nonteaching US community hospitals.Ann Pharmacother2000;34:446–452.
- ,,,,.J Hosp Med.2006;1:7–12.
- .Anti‐inflammatory effects of macrolides—an underappreciated benefit in the treatment of community‐acquired respiratory tract infections and chronic inflammatory pulmonary conditions?J Antimicrob Chemother.2005;55:10–21.
- ,,, et al.Addition of a macrolide to a beta‐lactam based empirical antibiotic regimen is associated with lover in‐hospital mortality for patients with bacteremic pneumococcal pneumonia.Clin Infect Dis.2003;36:389–395.
- ,,, et al.Combination antibiotic therapy lowers mortality among severely ill patients with pneumococcal bacteremia.Am J Respir Crit Care Med.2004;170:440–444.
- ,,,.Empiric antibiotic coverage of atypical pathogens for community‐acquired pneumonia in hospitalized adults.Cochrane Database Syst Rev.2005;2:CD004418.pub2.
- ,,.Effectiveness of β lactam antibiotics compared with antibiotics active against atypical pathogens in non‐severe community‐acquired pneumonia: meta‐analysis.Br Med J.2005;330:456.
- ,,,.Empirical atypical coverage for inpatients with community‐acquired pneumonia.Arch Intern Med.2005;165:1992–2000.
- ,,, et al.Antibiotic resistance among gram‐negative bacilli in US intensive care units: implications for fluoroquinolone use.JAMA.2003;289:885–888.
- ,,, et al.First‐generation fluoroquinolone use and subsequent emergence of multiple drug‐resistant bacteria in the intensive care unit.Crit Care Med.2005;33(2):283–289.
- ,.Etiology of community‐acquired pneumonia.Clin Chest Med.2005;26:47–55.
- .Community‐associated methicillin‐resistant Staphylococcus aureus: not only a cause of skin infections, also a new cause of pneumonia.Curr Opin Infect Dis.2005;18:123–124.
- ,,, et al.Severe community‐onset pneumonia in healthy adults caused by methicillin‐resistant Staphylococcus aureus carrying the Panton‐Valentine leukocidin genes.Clin Infect Dis.2005;40(1):100–107.
- ,,,.Fatal community‐associated methicillin‐resistant Staphylococcus aureus pneumonia in an immunocompetent young adult.Ann Emerg Med.2005;46:401–404.
- .Aspiration pneumonitis and aspiration pneumonia.N Engl J Med.2001;344:665–671.
- ,,, et al.Health care‐associated bloodstream infections in adults: a reason to change the accepted definition of community‐acquired infections.Ann Intern Med.2002;137:791–797.
- American Thoracic Society and theInfectious Diseases Society of America.Guidelines for the management of adults with hospital‐acquired, ventilator‐acquired, and healthcare‐associated pneumonia.Am J Respir Crit Care Med.2005;171:388–416.
- ,,, et al.Blood culture and susceptibility results and allergy history do not influence fluoroquinolone use in the treatment of community‐acquired pneumonia.Pharmacotherapy.2005;25(1):59–66.
- ,,, et al.Time to clinical stability in patients hospitalized with community‐acquired pneumonia: implications for practice guidelines.JAMA.1998;279:1452–1457.
- ,,, et al.High‐dose, short‐course levofloxacin for community‐acquired pneumonia: a new treatment paradigm.Clin Infect Dis.2003;37:752–760.
- ,,, et al.Causes and factors associated with early failure in hospitalized patients with community‐acquired pneumonia.Arch Intern Med.2004;164:502–508.
- ,,, et al.Instability on hospital discharge and the risk of adverse outcomes in patients with pneumonia.Arch Intern Med.2002;162:1278–1284.
- ,,,.Radiographic resolution of community‐acquired bacterial pneumonia in the elderly.J Am Geriatr Soc.2004;52(2):224–229.
- ,,,.Vaccines for preventing pneumococcal infection in adults.Cochrane Database Syst Rev.2003;4:CD000422.
- ,,,,.The efficacy of influenza vaccine in elderly persons: a meta‐analysis and review of the literature.Ann Intern Med.1995;123:518–527.
- ,,, et al.Influenza vaccination and reduction in hospitalizations for cardiac disease and stroke among the elderly.N Engl J Med.2003;348:1322–1332.
- ,,,.Proportion of community‐acquired pneumonia cases attributable to tobacco smoking.Chest.1999;116:375–379.
- ,,, et al.Risk of community‐acquired pneumonia and use of gastric acid‐suppressive drugs.JAMA.2004;292:1955–1960.
Lean Health Care
Toyota is widely recognized as one of the most successful companies in the world. Its automobiles have consistently placed at or near the top of the quality and customer satisfaction rankings published by J.D. Power and Associates and Consumer Reports. Toyota constantly focuses on the safety and well‐being of its employees and the quality of its cars through its relentless dedication to continuous improvement in everything it does. Toyota has recently become the world's number two auto manufacturer, and the company's net profit margin was more than 8 times that of the industry average. 1
How has Toyota been able to achieve such remarkable results in product quality, market share, and profit margins? Jeffrey Liker, in his book The Toyota Way, described the world‐renowned Toyota production system as supported by 2 pillars: continuous improvement and respect for people. The end result is a learning organization that values employee contributions and continuously strives to produce products of higher quality at lower cost. 1, 2 Lean production is the generic term used to describe the principles and methods of the Toyota Production System. Lean production has been implemented to improve performance in a broad array of industries, from aerospace and aluminum refining to financial services and insurance. The philosophy of lean thinking, which is derived from the Toyota Production System, is rapidly gaining a following among health care leaders, with a number of hospitals and medical groups around the country adopting a version of lean production as their systematic approach to improving quality and efficiency. In the coming years, the application of lean principles and methods could have a transformational effect on how health care is delivered, with the potential for dramatic gains in quality, safety, efficiency, and appropriateness.
LEAN CONCEPTS
To understand how lean production can be applied to improve the delivery of health care, some of the fundamental concepts and practice of lean must first be explained. 3, 4 The first step in a lean improvement initiative is to understand value as defined by our customers. 5 In clinical care delivery, external customers include patients, families, payers, and regulators. Internal customers include physicians, nurses, clerks, and others involved in the care process. What customers value usually includes care that is of high quality, safe, efficient and appropriate. The second step typically is to go to the workplace and observe firsthand how the process now operates. 6 As the flow of the process from beginning to end is seen, the observer learns to see and to understand the multiple areas of delay, inefficiency, and waste that may exist. 7, 8 A representational flowchart called a current‐state value stream map (CS VSM) is created to make the work visible and to depict graphically all the individual steps necessary to complete the process from beginning to end. It is important that the CS VSM be a factual depiction of how an entire process flows created by those who actually work in that process. The CS VSM does not state any exceptions to or provide any explanations for why certain steps are taken. It does include key measures such as process time (the actual time it takes to complete a particular step of the process), lead time (the total time it takes to complete the entire process, including waiting time), and first‐time quality (the percentage of time in which that step of the process is completed without defect); (see Figure 1).
In the hands of an improvement team, the current state map becomes a powerful tool that allows participants to systematically recognize and categorize waste. The CS VSM also allows workers to visualize how much opportunity there is for improving the existing process. Working from the CS VSM, the team members can identify specific areas of waste, delay, causes of error, and inefficiency. The team then brainstorms ideas for improvement, proposing how steps of the process might be combined, eliminated, error‐proofed, or otherwise improved to transform waste into value from the customer's perspective. In the third step, the team seeks to achieve the flow state in which the steps of the process follow one another without stopping. All ideas are welcomed at this stage and are placed on the current state map itself or arrayed elsewhere for consideration. Using the ideas generated by the team, a new and better process is designed and depicted on a flow map called the future‐state value stream map (FS VSM). 9, 10 The FS VSM represents an improved and streamlined or ideal way in which the process could be accomplished, as best the team was able to envision at this point (see Figure 2). Ideally, the process described in the FS VSM also allows customers to pull value when they need goods or services provided by the organization, rather than having to do the usual requesting and waiting seen in health care and other service industries. Creating processes from which customers pull what they need is the fourth step in lean design.
Once a future state map is devised and approved, the critical work of rapid deployment of an implementation plan for reaching the future state begins. An implementation plan explicitly identifies who is responsible for what aspect of implementation. Usually a senior leader or leadership group sponsoring the project is responsible for encouraging team members to think beyond their historical (and often political) limits and to support the team in overcoming barriers outside its control. As the individuals return to work and attempt to implement the new solutions, however, they will likely encounter areas of resistance and ambiguity that require creative solutions. The implementation phase focuses on and encourages the individual worker to experiment and work toward a solution that can be broadly adopted and disseminated for use as a standardized solution by all workers facing similar situations. 11, 12 Through this experimental development and dissemination of solutions, the agreed‐to future‐state map is revised. In this way the old future‐state map plays the role of the new current‐state map. There is an ongoing, continuous loop between the current‐ and future‐state maps through implementation and testing to develop the ideal way in which the process should flow toward the final product or service (see Figure 3). The fifth step, pursuing perfection, requires this continuous loop of all workers improving everything they do, every day. The hardest of all the steps, pursuing perfection requires an organization to commit to process improvement and the elimination of defects and waste on a daily and permanent basis. 5
The steps outlined above provide only the basic foundations of lean concepts, of course. A detailed description of learning about and applying lean within one's own organization requires further study and help. Readers interested in learning more about value stream mapping are referred to a workbook by Mike Rother and John Shook called Learning to See, Value Stream Mapping to Create Value and Eliminate Muda. 4 Further, there are consultants with lean expertise who are available to help hospitals get started on the lean journey.
The management philosophy of lean production methods has ties to other operational and quality‐improvement models such as total quality management (TQM)/continuous quality improvement (CQI), developed by W. E. Deming, and Six Sigma, developed by Motorola and General Electric. Although there are several overlapping points of philosophy and techniques, a feature distinguishing lean from these other models is in its value stream approach to driving change and eliminating waste within the process of providing a product for the customer. Lean is unique in its focus on the specification of value from the customer's perspective and on the identification and categorization of waste and its transformation to value using specific tools. The lean approach encourages individuals within the organization (from top to bottom) to learn to see the flow of their product's process and thus to help to identify areas of waste, with the ultimate goal of creating a product with built‐in quality with the least amount of waste. Both Six Sigma and TQM/CQI focus on the delivery of a high‐quality product. Once a system has been studied and standardized, Six Sigma utilizes rigorous statistical and data measurements to drive quality improvements in product delivery. 13 Total quality management/continuous quality improvement engages the entire organization in delivering a high‐quality product from the customer's standpoint by getting everyone in the organization involved in the continuous improvement effort. 14 Lean thinking builds directly on the plandocheckact cycle of CQI but adds tools to identify and transform waste, supplies metrics of timing and resources, and, most important, focuses intently on the creation of value as defined by the customer. A more detailed comparison of lean philosophy with these other quality‐improvement management philosophies is beyond the scope of this article on the introduction of lean methods for hospitals.
DOES HEALTH CARE NEED LEAN THINKERS?
So, should health care try to emulate the successes of an automobile manufacturing company? Before answering this question, consider the following about the health care system as we know it and the significant challenges it faces.
-
A key take‐home message of the Institute of Medicine's 1999 report, To Err Is Human: Building a Safer Health System, was that errors are caused by poorly designed systems. 15
-
The Centers for Medicare and Medicaid Services (CMS) reported that the cost of health care is rising rapidly and that the rate of growth is not sustainable. 16
-
Studies by the RAND Corporation demonstrated considerable variability in the practice of medicine, raising important questions about the appropriateness and necessity of some medical care and procedures. 17, 18
-
In Crossing the Quality Chasm: a New Health System for the 21st Century, the Institute of Medicine concluded that today's health care system functions at far lower levels than it can and should and recommended 6 aims for improving the health care system: health care should be safe, effective, patient centered, timely, efficient, and equitable. 19 This report is rich in detail about what the ideal health care system should look like and how application of lean philosophy and tools can help hospitals and physicians achieve that vision.
Although these challenges reflect a view of the health care system at a very macro level, the mechanism and process of driving change will need to be initiated at the more local and organizational level. Lean production focuses on the goal of continuously transforming waste into value from the customer's perspective. It provides a rigorous and systematic approach to process improvement, error proofing, and waste reduction. Manufacturing companies such as Toyota and Alcoa and financial service organizations such as Vanguard have enjoyed tremendous success in implementing lean production, reporting gains in both quality and efficiency. 11 It is time for health care leaders and practitioners to evaluate how lean techniques can be adapted and applied to addressing the pressing challenges of safety, quality, efficiency, and appropriateness in order to improve system reliability and timeliness. As hospitalists, we are at the forefront of these challenges and therefore are in a prime position to lead the change in how health care delivery is improved continuously using a rigorous system such as the Toyota production system.
LEAN IN HEALTH CARE: EXAMPLES OF SOME EARLY RESULTS
Lean health care is still a very novel concept to most health care institutions; however, there have been some early adopters of lean health care, and some of their experiences are described here:
-
At Virginia Mason Medical Center (VMMC) in Seattle, Washington, changes implemented using lean production methods have resulted in decreased incidence of ventilator‐associated pneumoniafrom 34 cases with 5 deaths in 2002 to 4 cases with 1 death in 2004. This led to a cost reduction of nearly a half‐million dollars. VMMC has also reported increased profit margins and improvement in space utilization at its cancer center, enabling 57% more patients to be seen in the same allotted space; and it is now taking measures to decrease the number of medication errors by standardizing and mistake‐proofing the process of ordering, delivering, and administering medications, all using lean techniques. 12, 20
-
At Park Nicollet Health Services (PNHS) in Minneapolis, Minnesota, implementation of lean production has enabled improved patient access through flow improvements. Results include increasing the number of CT and MRI scans performed per day by 2 and 1, respectively; creating a capacity for 10 additional chemotherapy and antibiotic infusion patients per day in the cancer center; reducing the waiting time of patients from 122 to 52 minutes at the urgent care clinic; standardizing surgical instrument use by the general surgery group, which resulted in processing more than 40,000 fewer instruments each month. These improvements achieved through applying lean concepts have resulted in Park Nicollet being recognized by the American Medical Group Association (AMGA) with its top‐rated Acclaim Award. 21 In addition, PNHS has been able to achieve a record 3.9% operating margin, which equates to a $7.5 million profit in 2004.
-
In Pittsburgh, Pennsylvania, a group of hospitals participating in the Pittsburgh Regional Healthcare Initiative (PRHI) have implemented lean concepts to minimize the risk of developing central catheterrelated bloodstream infections. Several hospitals have been able to cut the incidence of central line infections by 50%‐90% through implementation of lean production methods. 12
-
At Community Medical Center in Missoula, Montana, a series of pilot projects have been initiated to test lean methods. Some of the early results have demonstrated a reduction in turnaround time for pathology reports from the anatomical pathology lab from 5 to 2 days, a reduction in the number of steps and therefore the time from medication order to treatment initiation from 4 hours to 12 minutes, and a reduction in time for unit clerks to process new physician orders from an average of 43 minutes to 10 minutes during the hospital's busiest hours. 22
Implications for Hospitalists
Clinical practice in the hospital setting is process rich and provides abundant opportunities for improving the delivery of patient care. As hospitalists grow in number and increase their presence in the hospital setting, many are being asked to serve on hospital management committees to develop and implement ideas that will improve operations in the inpatient venue. As they serve in this vital capacity, hospitalists should ask themselves the following question about their practice settings:
-
How often are hospital discharges prolonged because of the inability to obtain or schedule a vital test?
-
How often does a planned discharge get delayed because of poor planning for what the patient may need just prior to or after discharge?
-
How often do errors occur in medications received by or prescribed for patients after discharge?
-
How often do preventable nosocomial infections or medical errors occur in the hospital setting?
-
How often are patients readmitted to the hospital for the same illness or a related illness because of errors in communicating the accurate discharge instructions to the patient?
These are just a few examples of suboptimal care that results from suboptimal processes in many hospital settings and for which a rigorous process improvement methodology, such as lean production, could improve quality, safety, efficiency, and appropriate delivery of care. From quality and safety points of view, prevention of medical errors and nosocomial infections can lead to improved mortality and morbidity rates, as well as to significant cost savings for the health care system.
THE MICHIGAN LEAN EXPERIENCE
In the past year, the University of Michigan has begun to use lean production methods to improve the care of patients across various venues of hospitalization and flow toward discharge. Delays in placement of peripherally inserted central catheters (PICC) were associated with delays in appropriate and timely administration of intravenous medication, as well as in delays in discharges home or to extended‐care facilities (ECF) for continuation of medical care post‐hospitalization. Since the initiation of the lean PICC initiative, when adjusted for increased volume of demand, for 3 consecutive months 90%95% of the PICC lines have been inserted within 24 hours of request. This is a remarkable achievement, given that in the previous 12 months only 50%70% of PICC lines were placed within 24 hours of request. Even without adjusting for volume of demand, the lean PICC initiative has resulted in a 36% decrease in the average time to line placement and in a 50% decrease in the number of PICC referrals to interventional radiology (IR), thus decreasing the workload of a constrained resource.
As with all lean improvement projects, the entire value stream map was assessed in order to identify areas of intervention that would enhance the final product of the process for the patient (in this case, placing a PICC line as timely as possible). As we evaluated this value stream, one step in the process, occurring prior to placement of the line, appeared to be significantly wasteful: when the PICC nurse needed to search for data (such as locating a patient's chart for the order and reviewing labs and medication records) and to ensure that the patient was in his/her room and prepared for line placement. This step appeared to be inefficient use of the time of technically skilled individuals. The future state map of this process implemented the addition of an assisting individual who would ensure that these prework issues were prepared and completed in advance for the PICC nurses, thus making maximum use of the time of these skilled individuals in placing PICC lines, not in performing unskilled work. Another area where an intervention was believed beneficial was streamlining the process of chest x‐ray (CXR) ordering and reading in order to obtain PICC line confirmation. Performance of the previous process was not standardized and led to delays. The future state proposed a standard method of writing an order for a CXR, a standard method for getting that order to the radiology department, and a standard method for reading the films for dictation. This prevented the confusion and rework that had previously occurred. A last example of an intervention is that the PICC nurses began to internally defer to more experienced nurses if a less experienced nurse could not successfully place a PICC line in a patient. Previously, an unsuccessful attempt at bedside PICC placement warranted an IR referral, thus increasing the demand on an already constrained resource. This intervention by the PICC nurses drove down referrals to the IR suite by 50%. Although this may have led to a small increase in rework early in the process, it has led to a significant reduction in work downstream in the process. Thus, we believe that the overall work flow process has been served well by this intervention. As depicted in Figure 3, the lean process improvement method seeks to have continuous improvement, with the old future‐state map taking on the role of the new current‐state map. Since the initial development of these value stream maps, we have been working toward developing and implementing new areas of intervention, which will lead to new future‐state maps and to further improvement of this process, as the demand for PICC lines continues to rise.
Another critical segment in the care of hospitalized patients is the discharge process, including coordination of care to an outpatient or extended care facility (ECF) setting, which has several potential areas of disconnect that could result inpatients having untoward complications requiring rehospitalization, higher morbidity, or prolongation of suffering from their illnesses. The University of Michigan sees a tremendous opportunity to make a significant impact on patient care in this realm and has just initiated a lean project on the coordination of care. Team members on this project will be relevant process stakeholders, including those representing hospitalists, discharge planning, nursing, social work, a related home nursing company, a home infusion service, an ECF, ambulatory care, pharmacy, case management, nutrition, utilization review, patients and their families, and clinic physicians. The overall goal of the project is to optimize patient care from hospitalization to discharge and transfer of care to the outpatient setting.
CHALLENGES
The application of management philosophy and operational concepts from the manufacturing industry to health care may be a conceptual stretch for many in the health care community. Hence, both cultural and practical barriers likely will have to be overcome before lean techniques can enjoy widespread use.
On the cultural front, it will be necessary to overcome the most likely arguments against the applicability of lean manufacturing concepts to the health care sector such as people are not automobiles and each patient is unique. Yet there has been considerable success in applying lean production concepts in other service industries such as insurance and financial services, with exceptionally favorable results reported, 11, 23 and early adopters of the lean concept in health care have credited lean management concepts with their early successes, as described above.
There are also the organizational and professional cultural differences that separate the health care industry from other sectors that have incorporated lean into their practice. Health care professionals, however, are highly dedicated and motivated to providing their patients with the best possible care and are already accustomed to constant experimentation and new data driving change in the way that care is provided. Lean production concepts and tools should not be foreign to health care professionals who already understand systems thinking.
Other challenges may come from those arguing that lean is just cutting and layoffs in disguise. It is often feared that when an organization decides to go lean, the underlying goals are to cut costs and to lay off a segment of the labor force. The term lean is often misunderstood in this respect, and it is important that the phrase be explained accurately in its context and application. Some individuals wonder whether the implementation of lean production efforts means they are working themselves out of employment. A key component of the successful application of lean production methods is assuring that as process flows and operations are improved, job descriptions and duties of individuals may be redirected, but their employment will not be lost
Finally, the multiple segments of health care are often fragmented into individually functioning units operating as autonomous silos. Lean teaches that optimizing the performance of an individual area is insufficient, that the entire process flow, which requires cooperation of multiple operating units, must be improved in order to achieve meaningful and sustained improvement in performance. This is a new way of thinking that requires behavioral change for the many who are used to thinking narrowly about the performance of their own unit. The larger organization must recognize and eliminate disincentives to breaking down the silo mentality. In health care organizations, however, providers and staff across functional departments share the same ultimate goal of delivering the very best care possible to patients within the constraint of available resources. Lean provides a management philosophy, powerful tools, and an accountability structure for working toward this goal. The organization, however, must be committed from the highest levels to making the lean transformation. 1
Ultimately, health care shares with manufacturing companies such as Toyota the challenge of producing the highest‐quality products (clinical outcomes) within an environment of constrained resources, while managing a complex business operation and assuring the safety and satisfaction of workers and customers (patients). Both industries need highly reliable systems that will ultimately lead to higher quality and greater safety, efficiency, and appropriateness.
CONCLUSION
The health care industry should learn about and consider adoption of lean techniques in order to improve its processes. More specifically, hospitals are prime locales for reaping the benefits of implementation of lean production, which can significantly affect how health care is delivered to patients. Toyota and other lean exemplars in the manufacturing industry have achieved a high level of success by utilizing the practice of lean. Early results from health care organizations suggest that utilizing lean production methods can lead to substantial improvements in the quality and efficiency of health care. To determine if the magnitude of success experienced by Toyota and other lean exemplars can also be achieved in the health care sector, it will be necessary to continuously test and evaluate the impact lean health care can have. In the hospital setting, where hospitalists are at the forefront of delivering care, it is incumbent on the hospitalist community to evaluate whether these techniques can make a difference in the quality, efficiency, and safety of the care provided to patients.
Lean thinking is still a novel idea to those in the health care sector, and as early adopters of this promising management model, we are very optimistic about the benefits of applying lean concepts in our hospital. Some of the first published reports and results presented on the benefits of lean in individual organizations are encouraging; however, as health care is a scientific community, we believe that future work should undergo rigorous evaluation on the benefits of lean and that such future works should be shared among the health care community through peer‐reviewed and published works.
Acknowledgements
The authors wish to thank the peripherally inserted central catheter (PICC) team for the use of their current and future state maps on PICC line placements that were created for the lean project.
- . The Toyota Way. Madison, Wisc: McGraw‐Hill; 2004.
- , . Decoding the DNA of the Toyota Production System. Harv Bus Rev. 1999; 77( 5): 97–.
- , . The Complete Lean Enterprise, Value Stream Mapping for Administrative and Office Processes. New York, NY: Productivity Press; 2004.
- , . Learning to See, Value‐Stream Mapping to Create Value and Eliminate Muda. Brookline, Mass: The Lean Enterprise Institute, Inc; 2003.
- , . Lean Thinking, Banish Waste and Create Wealth in Your Corporation. 2nd ed. New York, NY: Free Press; 2003.
- NAM. Getting started on the lean journey: first, take a walk! [NAM.org Web site]. Available at http://www.nam.org/s_nam/doc1.asp?CID=200253sect 15.
- . Fixing health care from the inside, today. Harv Bus Rev. 2005; 83( 9): 78– 91.
- Six Sigma—what is Six Sigma? Available at http://www.isixsigma.com/sixsigma/six_sigma.asp. Accessed 2005.
- Overview of the Continuous Quality Improvement Program. 2005. Available at http://www.med.umich.edu/i/exec/cqi/overview.htm. Accessed 2005.
- Kohn LT , Corrigan J , Donaldson MS , eds. To Err Is human: Building a Safer Health System. Washington, DC: National Academy Press; 2000.
- . Testimony of Mark B. McClellan, MD, PhD, Administrator, before the House Ways and Means Subcommittee on Health on Value‐Based Purchasing for Physicians under Medicare. Washington, DC: Centers for Medicare July 21, 2005.
- , , , et al. Does inappropriate use explain geographic variations in the use of health care services? A study of three procedures.[see comment]. JAMA. 1987; 258: 2533– 2537.
- , , , et al. Variations in the use of medical and surgical services by the Medicare population. N Engl J Med. 1986; 314( 5): 285– 290.
- Committee on Quality Health Care in America, Institute of Medicine. Crossing the Quality Chasm: a New Health System for the 21st Century. Washington, DC: National Academy Press; 2001.
- Institute for Healthcare Improvement. Going Lean in Health Care. White Paper. Boston, MA: Institute for Healthcare Improvement; January and February 2005.
- Lean Production at Park Nicollet. Available at http://www.parknicollet.com/media/leanProduction.cfm. Accessed March, 2005.
- , , . Reducing waste and errors: piloting lean principles at Intermountain Healthcare. Jt Comm J Qual Patient Saf. 2005; 31( 5): 249– 257.
- . The lean service machine. Harv Bus Rev. 2003; 81( 10): 123– 129, 38 .
Toyota is widely recognized as one of the most successful companies in the world. Its automobiles have consistently placed at or near the top of the quality and customer satisfaction rankings published by J.D. Power and Associates and Consumer Reports. Toyota constantly focuses on the safety and well‐being of its employees and the quality of its cars through its relentless dedication to continuous improvement in everything it does. Toyota has recently become the world's number two auto manufacturer, and the company's net profit margin was more than 8 times that of the industry average. 1
How has Toyota been able to achieve such remarkable results in product quality, market share, and profit margins? Jeffrey Liker, in his book The Toyota Way, described the world‐renowned Toyota production system as supported by 2 pillars: continuous improvement and respect for people. The end result is a learning organization that values employee contributions and continuously strives to produce products of higher quality at lower cost. 1, 2 Lean production is the generic term used to describe the principles and methods of the Toyota Production System. Lean production has been implemented to improve performance in a broad array of industries, from aerospace and aluminum refining to financial services and insurance. The philosophy of lean thinking, which is derived from the Toyota Production System, is rapidly gaining a following among health care leaders, with a number of hospitals and medical groups around the country adopting a version of lean production as their systematic approach to improving quality and efficiency. In the coming years, the application of lean principles and methods could have a transformational effect on how health care is delivered, with the potential for dramatic gains in quality, safety, efficiency, and appropriateness.
LEAN CONCEPTS
To understand how lean production can be applied to improve the delivery of health care, some of the fundamental concepts and practice of lean must first be explained. 3, 4 The first step in a lean improvement initiative is to understand value as defined by our customers. 5 In clinical care delivery, external customers include patients, families, payers, and regulators. Internal customers include physicians, nurses, clerks, and others involved in the care process. What customers value usually includes care that is of high quality, safe, efficient and appropriate. The second step typically is to go to the workplace and observe firsthand how the process now operates. 6 As the flow of the process from beginning to end is seen, the observer learns to see and to understand the multiple areas of delay, inefficiency, and waste that may exist. 7, 8 A representational flowchart called a current‐state value stream map (CS VSM) is created to make the work visible and to depict graphically all the individual steps necessary to complete the process from beginning to end. It is important that the CS VSM be a factual depiction of how an entire process flows created by those who actually work in that process. The CS VSM does not state any exceptions to or provide any explanations for why certain steps are taken. It does include key measures such as process time (the actual time it takes to complete a particular step of the process), lead time (the total time it takes to complete the entire process, including waiting time), and first‐time quality (the percentage of time in which that step of the process is completed without defect); (see Figure 1).
In the hands of an improvement team, the current state map becomes a powerful tool that allows participants to systematically recognize and categorize waste. The CS VSM also allows workers to visualize how much opportunity there is for improving the existing process. Working from the CS VSM, the team members can identify specific areas of waste, delay, causes of error, and inefficiency. The team then brainstorms ideas for improvement, proposing how steps of the process might be combined, eliminated, error‐proofed, or otherwise improved to transform waste into value from the customer's perspective. In the third step, the team seeks to achieve the flow state in which the steps of the process follow one another without stopping. All ideas are welcomed at this stage and are placed on the current state map itself or arrayed elsewhere for consideration. Using the ideas generated by the team, a new and better process is designed and depicted on a flow map called the future‐state value stream map (FS VSM). 9, 10 The FS VSM represents an improved and streamlined or ideal way in which the process could be accomplished, as best the team was able to envision at this point (see Figure 2). Ideally, the process described in the FS VSM also allows customers to pull value when they need goods or services provided by the organization, rather than having to do the usual requesting and waiting seen in health care and other service industries. Creating processes from which customers pull what they need is the fourth step in lean design.
Once a future state map is devised and approved, the critical work of rapid deployment of an implementation plan for reaching the future state begins. An implementation plan explicitly identifies who is responsible for what aspect of implementation. Usually a senior leader or leadership group sponsoring the project is responsible for encouraging team members to think beyond their historical (and often political) limits and to support the team in overcoming barriers outside its control. As the individuals return to work and attempt to implement the new solutions, however, they will likely encounter areas of resistance and ambiguity that require creative solutions. The implementation phase focuses on and encourages the individual worker to experiment and work toward a solution that can be broadly adopted and disseminated for use as a standardized solution by all workers facing similar situations. 11, 12 Through this experimental development and dissemination of solutions, the agreed‐to future‐state map is revised. In this way the old future‐state map plays the role of the new current‐state map. There is an ongoing, continuous loop between the current‐ and future‐state maps through implementation and testing to develop the ideal way in which the process should flow toward the final product or service (see Figure 3). The fifth step, pursuing perfection, requires this continuous loop of all workers improving everything they do, every day. The hardest of all the steps, pursuing perfection requires an organization to commit to process improvement and the elimination of defects and waste on a daily and permanent basis. 5
The steps outlined above provide only the basic foundations of lean concepts, of course. A detailed description of learning about and applying lean within one's own organization requires further study and help. Readers interested in learning more about value stream mapping are referred to a workbook by Mike Rother and John Shook called Learning to See, Value Stream Mapping to Create Value and Eliminate Muda. 4 Further, there are consultants with lean expertise who are available to help hospitals get started on the lean journey.
The management philosophy of lean production methods has ties to other operational and quality‐improvement models such as total quality management (TQM)/continuous quality improvement (CQI), developed by W. E. Deming, and Six Sigma, developed by Motorola and General Electric. Although there are several overlapping points of philosophy and techniques, a feature distinguishing lean from these other models is in its value stream approach to driving change and eliminating waste within the process of providing a product for the customer. Lean is unique in its focus on the specification of value from the customer's perspective and on the identification and categorization of waste and its transformation to value using specific tools. The lean approach encourages individuals within the organization (from top to bottom) to learn to see the flow of their product's process and thus to help to identify areas of waste, with the ultimate goal of creating a product with built‐in quality with the least amount of waste. Both Six Sigma and TQM/CQI focus on the delivery of a high‐quality product. Once a system has been studied and standardized, Six Sigma utilizes rigorous statistical and data measurements to drive quality improvements in product delivery. 13 Total quality management/continuous quality improvement engages the entire organization in delivering a high‐quality product from the customer's standpoint by getting everyone in the organization involved in the continuous improvement effort. 14 Lean thinking builds directly on the plandocheckact cycle of CQI but adds tools to identify and transform waste, supplies metrics of timing and resources, and, most important, focuses intently on the creation of value as defined by the customer. A more detailed comparison of lean philosophy with these other quality‐improvement management philosophies is beyond the scope of this article on the introduction of lean methods for hospitals.
DOES HEALTH CARE NEED LEAN THINKERS?
So, should health care try to emulate the successes of an automobile manufacturing company? Before answering this question, consider the following about the health care system as we know it and the significant challenges it faces.
-
A key take‐home message of the Institute of Medicine's 1999 report, To Err Is Human: Building a Safer Health System, was that errors are caused by poorly designed systems. 15
-
The Centers for Medicare and Medicaid Services (CMS) reported that the cost of health care is rising rapidly and that the rate of growth is not sustainable. 16
-
Studies by the RAND Corporation demonstrated considerable variability in the practice of medicine, raising important questions about the appropriateness and necessity of some medical care and procedures. 17, 18
-
In Crossing the Quality Chasm: a New Health System for the 21st Century, the Institute of Medicine concluded that today's health care system functions at far lower levels than it can and should and recommended 6 aims for improving the health care system: health care should be safe, effective, patient centered, timely, efficient, and equitable. 19 This report is rich in detail about what the ideal health care system should look like and how application of lean philosophy and tools can help hospitals and physicians achieve that vision.
Although these challenges reflect a view of the health care system at a very macro level, the mechanism and process of driving change will need to be initiated at the more local and organizational level. Lean production focuses on the goal of continuously transforming waste into value from the customer's perspective. It provides a rigorous and systematic approach to process improvement, error proofing, and waste reduction. Manufacturing companies such as Toyota and Alcoa and financial service organizations such as Vanguard have enjoyed tremendous success in implementing lean production, reporting gains in both quality and efficiency. 11 It is time for health care leaders and practitioners to evaluate how lean techniques can be adapted and applied to addressing the pressing challenges of safety, quality, efficiency, and appropriateness in order to improve system reliability and timeliness. As hospitalists, we are at the forefront of these challenges and therefore are in a prime position to lead the change in how health care delivery is improved continuously using a rigorous system such as the Toyota production system.
LEAN IN HEALTH CARE: EXAMPLES OF SOME EARLY RESULTS
Lean health care is still a very novel concept to most health care institutions; however, there have been some early adopters of lean health care, and some of their experiences are described here:
-
At Virginia Mason Medical Center (VMMC) in Seattle, Washington, changes implemented using lean production methods have resulted in decreased incidence of ventilator‐associated pneumoniafrom 34 cases with 5 deaths in 2002 to 4 cases with 1 death in 2004. This led to a cost reduction of nearly a half‐million dollars. VMMC has also reported increased profit margins and improvement in space utilization at its cancer center, enabling 57% more patients to be seen in the same allotted space; and it is now taking measures to decrease the number of medication errors by standardizing and mistake‐proofing the process of ordering, delivering, and administering medications, all using lean techniques. 12, 20
-
At Park Nicollet Health Services (PNHS) in Minneapolis, Minnesota, implementation of lean production has enabled improved patient access through flow improvements. Results include increasing the number of CT and MRI scans performed per day by 2 and 1, respectively; creating a capacity for 10 additional chemotherapy and antibiotic infusion patients per day in the cancer center; reducing the waiting time of patients from 122 to 52 minutes at the urgent care clinic; standardizing surgical instrument use by the general surgery group, which resulted in processing more than 40,000 fewer instruments each month. These improvements achieved through applying lean concepts have resulted in Park Nicollet being recognized by the American Medical Group Association (AMGA) with its top‐rated Acclaim Award. 21 In addition, PNHS has been able to achieve a record 3.9% operating margin, which equates to a $7.5 million profit in 2004.
-
In Pittsburgh, Pennsylvania, a group of hospitals participating in the Pittsburgh Regional Healthcare Initiative (PRHI) have implemented lean concepts to minimize the risk of developing central catheterrelated bloodstream infections. Several hospitals have been able to cut the incidence of central line infections by 50%‐90% through implementation of lean production methods. 12
-
At Community Medical Center in Missoula, Montana, a series of pilot projects have been initiated to test lean methods. Some of the early results have demonstrated a reduction in turnaround time for pathology reports from the anatomical pathology lab from 5 to 2 days, a reduction in the number of steps and therefore the time from medication order to treatment initiation from 4 hours to 12 minutes, and a reduction in time for unit clerks to process new physician orders from an average of 43 minutes to 10 minutes during the hospital's busiest hours. 22
Implications for Hospitalists
Clinical practice in the hospital setting is process rich and provides abundant opportunities for improving the delivery of patient care. As hospitalists grow in number and increase their presence in the hospital setting, many are being asked to serve on hospital management committees to develop and implement ideas that will improve operations in the inpatient venue. As they serve in this vital capacity, hospitalists should ask themselves the following question about their practice settings:
-
How often are hospital discharges prolonged because of the inability to obtain or schedule a vital test?
-
How often does a planned discharge get delayed because of poor planning for what the patient may need just prior to or after discharge?
-
How often do errors occur in medications received by or prescribed for patients after discharge?
-
How often do preventable nosocomial infections or medical errors occur in the hospital setting?
-
How often are patients readmitted to the hospital for the same illness or a related illness because of errors in communicating the accurate discharge instructions to the patient?
These are just a few examples of suboptimal care that results from suboptimal processes in many hospital settings and for which a rigorous process improvement methodology, such as lean production, could improve quality, safety, efficiency, and appropriate delivery of care. From quality and safety points of view, prevention of medical errors and nosocomial infections can lead to improved mortality and morbidity rates, as well as to significant cost savings for the health care system.
THE MICHIGAN LEAN EXPERIENCE
In the past year, the University of Michigan has begun to use lean production methods to improve the care of patients across various venues of hospitalization and flow toward discharge. Delays in placement of peripherally inserted central catheters (PICC) were associated with delays in appropriate and timely administration of intravenous medication, as well as in delays in discharges home or to extended‐care facilities (ECF) for continuation of medical care post‐hospitalization. Since the initiation of the lean PICC initiative, when adjusted for increased volume of demand, for 3 consecutive months 90%95% of the PICC lines have been inserted within 24 hours of request. This is a remarkable achievement, given that in the previous 12 months only 50%70% of PICC lines were placed within 24 hours of request. Even without adjusting for volume of demand, the lean PICC initiative has resulted in a 36% decrease in the average time to line placement and in a 50% decrease in the number of PICC referrals to interventional radiology (IR), thus decreasing the workload of a constrained resource.
As with all lean improvement projects, the entire value stream map was assessed in order to identify areas of intervention that would enhance the final product of the process for the patient (in this case, placing a PICC line as timely as possible). As we evaluated this value stream, one step in the process, occurring prior to placement of the line, appeared to be significantly wasteful: when the PICC nurse needed to search for data (such as locating a patient's chart for the order and reviewing labs and medication records) and to ensure that the patient was in his/her room and prepared for line placement. This step appeared to be inefficient use of the time of technically skilled individuals. The future state map of this process implemented the addition of an assisting individual who would ensure that these prework issues were prepared and completed in advance for the PICC nurses, thus making maximum use of the time of these skilled individuals in placing PICC lines, not in performing unskilled work. Another area where an intervention was believed beneficial was streamlining the process of chest x‐ray (CXR) ordering and reading in order to obtain PICC line confirmation. Performance of the previous process was not standardized and led to delays. The future state proposed a standard method of writing an order for a CXR, a standard method for getting that order to the radiology department, and a standard method for reading the films for dictation. This prevented the confusion and rework that had previously occurred. A last example of an intervention is that the PICC nurses began to internally defer to more experienced nurses if a less experienced nurse could not successfully place a PICC line in a patient. Previously, an unsuccessful attempt at bedside PICC placement warranted an IR referral, thus increasing the demand on an already constrained resource. This intervention by the PICC nurses drove down referrals to the IR suite by 50%. Although this may have led to a small increase in rework early in the process, it has led to a significant reduction in work downstream in the process. Thus, we believe that the overall work flow process has been served well by this intervention. As depicted in Figure 3, the lean process improvement method seeks to have continuous improvement, with the old future‐state map taking on the role of the new current‐state map. Since the initial development of these value stream maps, we have been working toward developing and implementing new areas of intervention, which will lead to new future‐state maps and to further improvement of this process, as the demand for PICC lines continues to rise.
Another critical segment in the care of hospitalized patients is the discharge process, including coordination of care to an outpatient or extended care facility (ECF) setting, which has several potential areas of disconnect that could result inpatients having untoward complications requiring rehospitalization, higher morbidity, or prolongation of suffering from their illnesses. The University of Michigan sees a tremendous opportunity to make a significant impact on patient care in this realm and has just initiated a lean project on the coordination of care. Team members on this project will be relevant process stakeholders, including those representing hospitalists, discharge planning, nursing, social work, a related home nursing company, a home infusion service, an ECF, ambulatory care, pharmacy, case management, nutrition, utilization review, patients and their families, and clinic physicians. The overall goal of the project is to optimize patient care from hospitalization to discharge and transfer of care to the outpatient setting.
CHALLENGES
The application of management philosophy and operational concepts from the manufacturing industry to health care may be a conceptual stretch for many in the health care community. Hence, both cultural and practical barriers likely will have to be overcome before lean techniques can enjoy widespread use.
On the cultural front, it will be necessary to overcome the most likely arguments against the applicability of lean manufacturing concepts to the health care sector such as people are not automobiles and each patient is unique. Yet there has been considerable success in applying lean production concepts in other service industries such as insurance and financial services, with exceptionally favorable results reported, 11, 23 and early adopters of the lean concept in health care have credited lean management concepts with their early successes, as described above.
There are also the organizational and professional cultural differences that separate the health care industry from other sectors that have incorporated lean into their practice. Health care professionals, however, are highly dedicated and motivated to providing their patients with the best possible care and are already accustomed to constant experimentation and new data driving change in the way that care is provided. Lean production concepts and tools should not be foreign to health care professionals who already understand systems thinking.
Other challenges may come from those arguing that lean is just cutting and layoffs in disguise. It is often feared that when an organization decides to go lean, the underlying goals are to cut costs and to lay off a segment of the labor force. The term lean is often misunderstood in this respect, and it is important that the phrase be explained accurately in its context and application. Some individuals wonder whether the implementation of lean production efforts means they are working themselves out of employment. A key component of the successful application of lean production methods is assuring that as process flows and operations are improved, job descriptions and duties of individuals may be redirected, but their employment will not be lost
Finally, the multiple segments of health care are often fragmented into individually functioning units operating as autonomous silos. Lean teaches that optimizing the performance of an individual area is insufficient, that the entire process flow, which requires cooperation of multiple operating units, must be improved in order to achieve meaningful and sustained improvement in performance. This is a new way of thinking that requires behavioral change for the many who are used to thinking narrowly about the performance of their own unit. The larger organization must recognize and eliminate disincentives to breaking down the silo mentality. In health care organizations, however, providers and staff across functional departments share the same ultimate goal of delivering the very best care possible to patients within the constraint of available resources. Lean provides a management philosophy, powerful tools, and an accountability structure for working toward this goal. The organization, however, must be committed from the highest levels to making the lean transformation. 1
Ultimately, health care shares with manufacturing companies such as Toyota the challenge of producing the highest‐quality products (clinical outcomes) within an environment of constrained resources, while managing a complex business operation and assuring the safety and satisfaction of workers and customers (patients). Both industries need highly reliable systems that will ultimately lead to higher quality and greater safety, efficiency, and appropriateness.
CONCLUSION
The health care industry should learn about and consider adoption of lean techniques in order to improve its processes. More specifically, hospitals are prime locales for reaping the benefits of implementation of lean production, which can significantly affect how health care is delivered to patients. Toyota and other lean exemplars in the manufacturing industry have achieved a high level of success by utilizing the practice of lean. Early results from health care organizations suggest that utilizing lean production methods can lead to substantial improvements in the quality and efficiency of health care. To determine if the magnitude of success experienced by Toyota and other lean exemplars can also be achieved in the health care sector, it will be necessary to continuously test and evaluate the impact lean health care can have. In the hospital setting, where hospitalists are at the forefront of delivering care, it is incumbent on the hospitalist community to evaluate whether these techniques can make a difference in the quality, efficiency, and safety of the care provided to patients.
Lean thinking is still a novel idea to those in the health care sector, and as early adopters of this promising management model, we are very optimistic about the benefits of applying lean concepts in our hospital. Some of the first published reports and results presented on the benefits of lean in individual organizations are encouraging; however, as health care is a scientific community, we believe that future work should undergo rigorous evaluation on the benefits of lean and that such future works should be shared among the health care community through peer‐reviewed and published works.
Acknowledgements
The authors wish to thank the peripherally inserted central catheter (PICC) team for the use of their current and future state maps on PICC line placements that were created for the lean project.
Toyota is widely recognized as one of the most successful companies in the world. Its automobiles have consistently placed at or near the top of the quality and customer satisfaction rankings published by J.D. Power and Associates and Consumer Reports. Toyota constantly focuses on the safety and well‐being of its employees and the quality of its cars through its relentless dedication to continuous improvement in everything it does. Toyota has recently become the world's number two auto manufacturer, and the company's net profit margin was more than 8 times that of the industry average. 1
How has Toyota been able to achieve such remarkable results in product quality, market share, and profit margins? Jeffrey Liker, in his book The Toyota Way, described the world‐renowned Toyota production system as supported by 2 pillars: continuous improvement and respect for people. The end result is a learning organization that values employee contributions and continuously strives to produce products of higher quality at lower cost. 1, 2 Lean production is the generic term used to describe the principles and methods of the Toyota Production System. Lean production has been implemented to improve performance in a broad array of industries, from aerospace and aluminum refining to financial services and insurance. The philosophy of lean thinking, which is derived from the Toyota Production System, is rapidly gaining a following among health care leaders, with a number of hospitals and medical groups around the country adopting a version of lean production as their systematic approach to improving quality and efficiency. In the coming years, the application of lean principles and methods could have a transformational effect on how health care is delivered, with the potential for dramatic gains in quality, safety, efficiency, and appropriateness.
LEAN CONCEPTS
To understand how lean production can be applied to improve the delivery of health care, some of the fundamental concepts and practice of lean must first be explained. 3, 4 The first step in a lean improvement initiative is to understand value as defined by our customers. 5 In clinical care delivery, external customers include patients, families, payers, and regulators. Internal customers include physicians, nurses, clerks, and others involved in the care process. What customers value usually includes care that is of high quality, safe, efficient and appropriate. The second step typically is to go to the workplace and observe firsthand how the process now operates. 6 As the flow of the process from beginning to end is seen, the observer learns to see and to understand the multiple areas of delay, inefficiency, and waste that may exist. 7, 8 A representational flowchart called a current‐state value stream map (CS VSM) is created to make the work visible and to depict graphically all the individual steps necessary to complete the process from beginning to end. It is important that the CS VSM be a factual depiction of how an entire process flows created by those who actually work in that process. The CS VSM does not state any exceptions to or provide any explanations for why certain steps are taken. It does include key measures such as process time (the actual time it takes to complete a particular step of the process), lead time (the total time it takes to complete the entire process, including waiting time), and first‐time quality (the percentage of time in which that step of the process is completed without defect); (see Figure 1).
In the hands of an improvement team, the current state map becomes a powerful tool that allows participants to systematically recognize and categorize waste. The CS VSM also allows workers to visualize how much opportunity there is for improving the existing process. Working from the CS VSM, the team members can identify specific areas of waste, delay, causes of error, and inefficiency. The team then brainstorms ideas for improvement, proposing how steps of the process might be combined, eliminated, error‐proofed, or otherwise improved to transform waste into value from the customer's perspective. In the third step, the team seeks to achieve the flow state in which the steps of the process follow one another without stopping. All ideas are welcomed at this stage and are placed on the current state map itself or arrayed elsewhere for consideration. Using the ideas generated by the team, a new and better process is designed and depicted on a flow map called the future‐state value stream map (FS VSM). 9, 10 The FS VSM represents an improved and streamlined or ideal way in which the process could be accomplished, as best the team was able to envision at this point (see Figure 2). Ideally, the process described in the FS VSM also allows customers to pull value when they need goods or services provided by the organization, rather than having to do the usual requesting and waiting seen in health care and other service industries. Creating processes from which customers pull what they need is the fourth step in lean design.
Once a future state map is devised and approved, the critical work of rapid deployment of an implementation plan for reaching the future state begins. An implementation plan explicitly identifies who is responsible for what aspect of implementation. Usually a senior leader or leadership group sponsoring the project is responsible for encouraging team members to think beyond their historical (and often political) limits and to support the team in overcoming barriers outside its control. As the individuals return to work and attempt to implement the new solutions, however, they will likely encounter areas of resistance and ambiguity that require creative solutions. The implementation phase focuses on and encourages the individual worker to experiment and work toward a solution that can be broadly adopted and disseminated for use as a standardized solution by all workers facing similar situations. 11, 12 Through this experimental development and dissemination of solutions, the agreed‐to future‐state map is revised. In this way the old future‐state map plays the role of the new current‐state map. There is an ongoing, continuous loop between the current‐ and future‐state maps through implementation and testing to develop the ideal way in which the process should flow toward the final product or service (see Figure 3). The fifth step, pursuing perfection, requires this continuous loop of all workers improving everything they do, every day. The hardest of all the steps, pursuing perfection requires an organization to commit to process improvement and the elimination of defects and waste on a daily and permanent basis. 5
The steps outlined above provide only the basic foundations of lean concepts, of course. A detailed description of learning about and applying lean within one's own organization requires further study and help. Readers interested in learning more about value stream mapping are referred to a workbook by Mike Rother and John Shook called Learning to See, Value Stream Mapping to Create Value and Eliminate Muda. 4 Further, there are consultants with lean expertise who are available to help hospitals get started on the lean journey.
The management philosophy of lean production methods has ties to other operational and quality‐improvement models such as total quality management (TQM)/continuous quality improvement (CQI), developed by W. E. Deming, and Six Sigma, developed by Motorola and General Electric. Although there are several overlapping points of philosophy and techniques, a feature distinguishing lean from these other models is in its value stream approach to driving change and eliminating waste within the process of providing a product for the customer. Lean is unique in its focus on the specification of value from the customer's perspective and on the identification and categorization of waste and its transformation to value using specific tools. The lean approach encourages individuals within the organization (from top to bottom) to learn to see the flow of their product's process and thus to help to identify areas of waste, with the ultimate goal of creating a product with built‐in quality with the least amount of waste. Both Six Sigma and TQM/CQI focus on the delivery of a high‐quality product. Once a system has been studied and standardized, Six Sigma utilizes rigorous statistical and data measurements to drive quality improvements in product delivery. 13 Total quality management/continuous quality improvement engages the entire organization in delivering a high‐quality product from the customer's standpoint by getting everyone in the organization involved in the continuous improvement effort. 14 Lean thinking builds directly on the plandocheckact cycle of CQI but adds tools to identify and transform waste, supplies metrics of timing and resources, and, most important, focuses intently on the creation of value as defined by the customer. A more detailed comparison of lean philosophy with these other quality‐improvement management philosophies is beyond the scope of this article on the introduction of lean methods for hospitals.
DOES HEALTH CARE NEED LEAN THINKERS?
So, should health care try to emulate the successes of an automobile manufacturing company? Before answering this question, consider the following about the health care system as we know it and the significant challenges it faces.
-
A key take‐home message of the Institute of Medicine's 1999 report, To Err Is Human: Building a Safer Health System, was that errors are caused by poorly designed systems. 15
-
The Centers for Medicare and Medicaid Services (CMS) reported that the cost of health care is rising rapidly and that the rate of growth is not sustainable. 16
-
Studies by the RAND Corporation demonstrated considerable variability in the practice of medicine, raising important questions about the appropriateness and necessity of some medical care and procedures. 17, 18
-
In Crossing the Quality Chasm: a New Health System for the 21st Century, the Institute of Medicine concluded that today's health care system functions at far lower levels than it can and should and recommended 6 aims for improving the health care system: health care should be safe, effective, patient centered, timely, efficient, and equitable. 19 This report is rich in detail about what the ideal health care system should look like and how application of lean philosophy and tools can help hospitals and physicians achieve that vision.
Although these challenges reflect a view of the health care system at a very macro level, the mechanism and process of driving change will need to be initiated at the more local and organizational level. Lean production focuses on the goal of continuously transforming waste into value from the customer's perspective. It provides a rigorous and systematic approach to process improvement, error proofing, and waste reduction. Manufacturing companies such as Toyota and Alcoa and financial service organizations such as Vanguard have enjoyed tremendous success in implementing lean production, reporting gains in both quality and efficiency. 11 It is time for health care leaders and practitioners to evaluate how lean techniques can be adapted and applied to addressing the pressing challenges of safety, quality, efficiency, and appropriateness in order to improve system reliability and timeliness. As hospitalists, we are at the forefront of these challenges and therefore are in a prime position to lead the change in how health care delivery is improved continuously using a rigorous system such as the Toyota production system.
LEAN IN HEALTH CARE: EXAMPLES OF SOME EARLY RESULTS
Lean health care is still a very novel concept to most health care institutions; however, there have been some early adopters of lean health care, and some of their experiences are described here:
-
At Virginia Mason Medical Center (VMMC) in Seattle, Washington, changes implemented using lean production methods have resulted in decreased incidence of ventilator‐associated pneumoniafrom 34 cases with 5 deaths in 2002 to 4 cases with 1 death in 2004. This led to a cost reduction of nearly a half‐million dollars. VMMC has also reported increased profit margins and improvement in space utilization at its cancer center, enabling 57% more patients to be seen in the same allotted space; and it is now taking measures to decrease the number of medication errors by standardizing and mistake‐proofing the process of ordering, delivering, and administering medications, all using lean techniques. 12, 20
-
At Park Nicollet Health Services (PNHS) in Minneapolis, Minnesota, implementation of lean production has enabled improved patient access through flow improvements. Results include increasing the number of CT and MRI scans performed per day by 2 and 1, respectively; creating a capacity for 10 additional chemotherapy and antibiotic infusion patients per day in the cancer center; reducing the waiting time of patients from 122 to 52 minutes at the urgent care clinic; standardizing surgical instrument use by the general surgery group, which resulted in processing more than 40,000 fewer instruments each month. These improvements achieved through applying lean concepts have resulted in Park Nicollet being recognized by the American Medical Group Association (AMGA) with its top‐rated Acclaim Award. 21 In addition, PNHS has been able to achieve a record 3.9% operating margin, which equates to a $7.5 million profit in 2004.
-
In Pittsburgh, Pennsylvania, a group of hospitals participating in the Pittsburgh Regional Healthcare Initiative (PRHI) have implemented lean concepts to minimize the risk of developing central catheterrelated bloodstream infections. Several hospitals have been able to cut the incidence of central line infections by 50%‐90% through implementation of lean production methods. 12
-
At Community Medical Center in Missoula, Montana, a series of pilot projects have been initiated to test lean methods. Some of the early results have demonstrated a reduction in turnaround time for pathology reports from the anatomical pathology lab from 5 to 2 days, a reduction in the number of steps and therefore the time from medication order to treatment initiation from 4 hours to 12 minutes, and a reduction in time for unit clerks to process new physician orders from an average of 43 minutes to 10 minutes during the hospital's busiest hours. 22
Implications for Hospitalists
Clinical practice in the hospital setting is process rich and provides abundant opportunities for improving the delivery of patient care. As hospitalists grow in number and increase their presence in the hospital setting, many are being asked to serve on hospital management committees to develop and implement ideas that will improve operations in the inpatient venue. As they serve in this vital capacity, hospitalists should ask themselves the following question about their practice settings:
-
How often are hospital discharges prolonged because of the inability to obtain or schedule a vital test?
-
How often does a planned discharge get delayed because of poor planning for what the patient may need just prior to or after discharge?
-
How often do errors occur in medications received by or prescribed for patients after discharge?
-
How often do preventable nosocomial infections or medical errors occur in the hospital setting?
-
How often are patients readmitted to the hospital for the same illness or a related illness because of errors in communicating the accurate discharge instructions to the patient?
These are just a few examples of suboptimal care that results from suboptimal processes in many hospital settings and for which a rigorous process improvement methodology, such as lean production, could improve quality, safety, efficiency, and appropriate delivery of care. From quality and safety points of view, prevention of medical errors and nosocomial infections can lead to improved mortality and morbidity rates, as well as to significant cost savings for the health care system.
THE MICHIGAN LEAN EXPERIENCE
In the past year, the University of Michigan has begun to use lean production methods to improve the care of patients across various venues of hospitalization and flow toward discharge. Delays in placement of peripherally inserted central catheters (PICC) were associated with delays in appropriate and timely administration of intravenous medication, as well as in delays in discharges home or to extended‐care facilities (ECF) for continuation of medical care post‐hospitalization. Since the initiation of the lean PICC initiative, when adjusted for increased volume of demand, for 3 consecutive months 90%95% of the PICC lines have been inserted within 24 hours of request. This is a remarkable achievement, given that in the previous 12 months only 50%70% of PICC lines were placed within 24 hours of request. Even without adjusting for volume of demand, the lean PICC initiative has resulted in a 36% decrease in the average time to line placement and in a 50% decrease in the number of PICC referrals to interventional radiology (IR), thus decreasing the workload of a constrained resource.
As with all lean improvement projects, the entire value stream map was assessed in order to identify areas of intervention that would enhance the final product of the process for the patient (in this case, placing a PICC line as timely as possible). As we evaluated this value stream, one step in the process, occurring prior to placement of the line, appeared to be significantly wasteful: when the PICC nurse needed to search for data (such as locating a patient's chart for the order and reviewing labs and medication records) and to ensure that the patient was in his/her room and prepared for line placement. This step appeared to be inefficient use of the time of technically skilled individuals. The future state map of this process implemented the addition of an assisting individual who would ensure that these prework issues were prepared and completed in advance for the PICC nurses, thus making maximum use of the time of these skilled individuals in placing PICC lines, not in performing unskilled work. Another area where an intervention was believed beneficial was streamlining the process of chest x‐ray (CXR) ordering and reading in order to obtain PICC line confirmation. Performance of the previous process was not standardized and led to delays. The future state proposed a standard method of writing an order for a CXR, a standard method for getting that order to the radiology department, and a standard method for reading the films for dictation. This prevented the confusion and rework that had previously occurred. A last example of an intervention is that the PICC nurses began to internally defer to more experienced nurses if a less experienced nurse could not successfully place a PICC line in a patient. Previously, an unsuccessful attempt at bedside PICC placement warranted an IR referral, thus increasing the demand on an already constrained resource. This intervention by the PICC nurses drove down referrals to the IR suite by 50%. Although this may have led to a small increase in rework early in the process, it has led to a significant reduction in work downstream in the process. Thus, we believe that the overall work flow process has been served well by this intervention. As depicted in Figure 3, the lean process improvement method seeks to have continuous improvement, with the old future‐state map taking on the role of the new current‐state map. Since the initial development of these value stream maps, we have been working toward developing and implementing new areas of intervention, which will lead to new future‐state maps and to further improvement of this process, as the demand for PICC lines continues to rise.
Another critical segment in the care of hospitalized patients is the discharge process, including coordination of care to an outpatient or extended care facility (ECF) setting, which has several potential areas of disconnect that could result inpatients having untoward complications requiring rehospitalization, higher morbidity, or prolongation of suffering from their illnesses. The University of Michigan sees a tremendous opportunity to make a significant impact on patient care in this realm and has just initiated a lean project on the coordination of care. Team members on this project will be relevant process stakeholders, including those representing hospitalists, discharge planning, nursing, social work, a related home nursing company, a home infusion service, an ECF, ambulatory care, pharmacy, case management, nutrition, utilization review, patients and their families, and clinic physicians. The overall goal of the project is to optimize patient care from hospitalization to discharge and transfer of care to the outpatient setting.
CHALLENGES
The application of management philosophy and operational concepts from the manufacturing industry to health care may be a conceptual stretch for many in the health care community. Hence, both cultural and practical barriers likely will have to be overcome before lean techniques can enjoy widespread use.
On the cultural front, it will be necessary to overcome the most likely arguments against the applicability of lean manufacturing concepts to the health care sector such as people are not automobiles and each patient is unique. Yet there has been considerable success in applying lean production concepts in other service industries such as insurance and financial services, with exceptionally favorable results reported, 11, 23 and early adopters of the lean concept in health care have credited lean management concepts with their early successes, as described above.
There are also the organizational and professional cultural differences that separate the health care industry from other sectors that have incorporated lean into their practice. Health care professionals, however, are highly dedicated and motivated to providing their patients with the best possible care and are already accustomed to constant experimentation and new data driving change in the way that care is provided. Lean production concepts and tools should not be foreign to health care professionals who already understand systems thinking.
Other challenges may come from those arguing that lean is just cutting and layoffs in disguise. It is often feared that when an organization decides to go lean, the underlying goals are to cut costs and to lay off a segment of the labor force. The term lean is often misunderstood in this respect, and it is important that the phrase be explained accurately in its context and application. Some individuals wonder whether the implementation of lean production efforts means they are working themselves out of employment. A key component of the successful application of lean production methods is assuring that as process flows and operations are improved, job descriptions and duties of individuals may be redirected, but their employment will not be lost
Finally, the multiple segments of health care are often fragmented into individually functioning units operating as autonomous silos. Lean teaches that optimizing the performance of an individual area is insufficient, that the entire process flow, which requires cooperation of multiple operating units, must be improved in order to achieve meaningful and sustained improvement in performance. This is a new way of thinking that requires behavioral change for the many who are used to thinking narrowly about the performance of their own unit. The larger organization must recognize and eliminate disincentives to breaking down the silo mentality. In health care organizations, however, providers and staff across functional departments share the same ultimate goal of delivering the very best care possible to patients within the constraint of available resources. Lean provides a management philosophy, powerful tools, and an accountability structure for working toward this goal. The organization, however, must be committed from the highest levels to making the lean transformation. 1
Ultimately, health care shares with manufacturing companies such as Toyota the challenge of producing the highest‐quality products (clinical outcomes) within an environment of constrained resources, while managing a complex business operation and assuring the safety and satisfaction of workers and customers (patients). Both industries need highly reliable systems that will ultimately lead to higher quality and greater safety, efficiency, and appropriateness.
CONCLUSION
The health care industry should learn about and consider adoption of lean techniques in order to improve its processes. More specifically, hospitals are prime locales for reaping the benefits of implementation of lean production, which can significantly affect how health care is delivered to patients. Toyota and other lean exemplars in the manufacturing industry have achieved a high level of success by utilizing the practice of lean. Early results from health care organizations suggest that utilizing lean production methods can lead to substantial improvements in the quality and efficiency of health care. To determine if the magnitude of success experienced by Toyota and other lean exemplars can also be achieved in the health care sector, it will be necessary to continuously test and evaluate the impact lean health care can have. In the hospital setting, where hospitalists are at the forefront of delivering care, it is incumbent on the hospitalist community to evaluate whether these techniques can make a difference in the quality, efficiency, and safety of the care provided to patients.
Lean thinking is still a novel idea to those in the health care sector, and as early adopters of this promising management model, we are very optimistic about the benefits of applying lean concepts in our hospital. Some of the first published reports and results presented on the benefits of lean in individual organizations are encouraging; however, as health care is a scientific community, we believe that future work should undergo rigorous evaluation on the benefits of lean and that such future works should be shared among the health care community through peer‐reviewed and published works.
Acknowledgements
The authors wish to thank the peripherally inserted central catheter (PICC) team for the use of their current and future state maps on PICC line placements that were created for the lean project.
- . The Toyota Way. Madison, Wisc: McGraw‐Hill; 2004.
- , . Decoding the DNA of the Toyota Production System. Harv Bus Rev. 1999; 77( 5): 97–.
- , . The Complete Lean Enterprise, Value Stream Mapping for Administrative and Office Processes. New York, NY: Productivity Press; 2004.
- , . Learning to See, Value‐Stream Mapping to Create Value and Eliminate Muda. Brookline, Mass: The Lean Enterprise Institute, Inc; 2003.
- , . Lean Thinking, Banish Waste and Create Wealth in Your Corporation. 2nd ed. New York, NY: Free Press; 2003.
- NAM. Getting started on the lean journey: first, take a walk! [NAM.org Web site]. Available at http://www.nam.org/s_nam/doc1.asp?CID=200253sect 15.
- . Fixing health care from the inside, today. Harv Bus Rev. 2005; 83( 9): 78– 91.
- Six Sigma—what is Six Sigma? Available at http://www.isixsigma.com/sixsigma/six_sigma.asp. Accessed 2005.
- Overview of the Continuous Quality Improvement Program. 2005. Available at http://www.med.umich.edu/i/exec/cqi/overview.htm. Accessed 2005.
- Kohn LT , Corrigan J , Donaldson MS , eds. To Err Is human: Building a Safer Health System. Washington, DC: National Academy Press; 2000.
- . Testimony of Mark B. McClellan, MD, PhD, Administrator, before the House Ways and Means Subcommittee on Health on Value‐Based Purchasing for Physicians under Medicare. Washington, DC: Centers for Medicare July 21, 2005.
- , , , et al. Does inappropriate use explain geographic variations in the use of health care services? A study of three procedures.[see comment]. JAMA. 1987; 258: 2533– 2537.
- , , , et al. Variations in the use of medical and surgical services by the Medicare population. N Engl J Med. 1986; 314( 5): 285– 290.
- Committee on Quality Health Care in America, Institute of Medicine. Crossing the Quality Chasm: a New Health System for the 21st Century. Washington, DC: National Academy Press; 2001.
- Institute for Healthcare Improvement. Going Lean in Health Care. White Paper. Boston, MA: Institute for Healthcare Improvement; January and February 2005.
- Lean Production at Park Nicollet. Available at http://www.parknicollet.com/media/leanProduction.cfm. Accessed March, 2005.
- , , . Reducing waste and errors: piloting lean principles at Intermountain Healthcare. Jt Comm J Qual Patient Saf. 2005; 31( 5): 249– 257.
- . The lean service machine. Harv Bus Rev. 2003; 81( 10): 123– 129, 38 .
- . The Toyota Way. Madison, Wisc: McGraw‐Hill; 2004.
- , . Decoding the DNA of the Toyota Production System. Harv Bus Rev. 1999; 77( 5): 97–.
- , . The Complete Lean Enterprise, Value Stream Mapping for Administrative and Office Processes. New York, NY: Productivity Press; 2004.
- , . Learning to See, Value‐Stream Mapping to Create Value and Eliminate Muda. Brookline, Mass: The Lean Enterprise Institute, Inc; 2003.
- , . Lean Thinking, Banish Waste and Create Wealth in Your Corporation. 2nd ed. New York, NY: Free Press; 2003.
- NAM. Getting started on the lean journey: first, take a walk! [NAM.org Web site]. Available at http://www.nam.org/s_nam/doc1.asp?CID=200253sect 15.
- . Fixing health care from the inside, today. Harv Bus Rev. 2005; 83( 9): 78– 91.
- Six Sigma—what is Six Sigma? Available at http://www.isixsigma.com/sixsigma/six_sigma.asp. Accessed 2005.
- Overview of the Continuous Quality Improvement Program. 2005. Available at http://www.med.umich.edu/i/exec/cqi/overview.htm. Accessed 2005.
- Kohn LT , Corrigan J , Donaldson MS , eds. To Err Is human: Building a Safer Health System. Washington, DC: National Academy Press; 2000.
- . Testimony of Mark B. McClellan, MD, PhD, Administrator, before the House Ways and Means Subcommittee on Health on Value‐Based Purchasing for Physicians under Medicare. Washington, DC: Centers for Medicare July 21, 2005.
- , , , et al. Does inappropriate use explain geographic variations in the use of health care services? A study of three procedures.[see comment]. JAMA. 1987; 258: 2533– 2537.
- , , , et al. Variations in the use of medical and surgical services by the Medicare population. N Engl J Med. 1986; 314( 5): 285– 290.
- Committee on Quality Health Care in America, Institute of Medicine. Crossing the Quality Chasm: a New Health System for the 21st Century. Washington, DC: National Academy Press; 2001.
- Institute for Healthcare Improvement. Going Lean in Health Care. White Paper. Boston, MA: Institute for Healthcare Improvement; January and February 2005.
- Lean Production at Park Nicollet. Available at http://www.parknicollet.com/media/leanProduction.cfm. Accessed March, 2005.
- , , . Reducing waste and errors: piloting lean principles at Intermountain Healthcare. Jt Comm J Qual Patient Saf. 2005; 31( 5): 249– 257.
- . The lean service machine. Harv Bus Rev. 2003; 81( 10): 123– 129, 38 .
Quality of Inpatient Diabetes Management
Diabetes mellitus is a common comorbidity of hospitalization; in 2003 diabetes was a secondary diagnosis in 17.8% of all adult hospital discharges.1 When undiagnosed diabetes is included, the prevalence of inpatient diabetes or hyperglycemia may be as high as 38%.2 Recent studies show that hyperglycemia in hospitalized patients complicates numerous illnesses and is an independent predictor of adverse outcomes.3 Treatment of inpatient hyperglycemia improves outcomes, including mortality, for patients in surgical intensive care units4 and possibly for those admitted for myocardial infarction.5, 6 For these reasons, the American Diabetes Association and the American College of Endocrinology now recommend that glucose levels of all patients admitted to non‐critical‐care units be maintained below 180 mg/dL.3, 7
Evidence‐based recommendations for achieving these goals include effective protocols for subcutaneous insulin therapy for patients who do not require continuous intravenous insulin infusion. Components of these protocols include use of basal insulin and scheduled nutritional insulin, avoiding use of supplemental (sliding‐scale) insulin alone (which has been shown to be ineffective and possibly deleterious in prior studies),8 and adjustment of insulin orders to reflect nutritional intake, insulin sensitivity, and previous response to therapy.7
We conducted this study to evaluate the current state of glycemic control and adherence to current recommendations on a general medicine service run by hospitalists in a busy teaching hospital. We also sought to correlate insulin‐ordering practices with the quality of glycemic control in these patients.
METHODS
Setting and Participants
This prospective cohort study was conducted at Brigham and Women's Hospital (BWH) from August 1 through September 30, 2004. Eligible subjects were patients admitted to 3 General Medicine Service (GMS) teams with either a known diagnosis of diabetes or inpatient hyperglycemia (random glucose > 200 mg/dL). Patients admitted for diabetic ketoacidosis, hyperosmolar hyperglycemic state, or gestational diabetes were excluded. Members of the BWH/Faulkner Hospitalist Service are the teaching attendings on these 3 teams (each consisting of 2 interns and 1 junior or senior resident) and are the attendings of record for approximately 90% of the patients on these teams. A research assistant identified potential subjects each weekday from the daily computerized sign‐out system used by all medical residents by searching for diabetes on the patient summary, a diabetic medication in the automatically abstracted medication list, or a laboratory glucose value greater than 200 mg/dL from automatically abstracted daily laboratory results. Eligibility criteria were confirmed by medical record review, and any question of eligibility was reviewed with the principal investigator. This study was approved by the BWH Institutional Review Board; patient consent was not deemed necessary for this study given the relatively nonsensitive nature of the data (eg, glucose control, insulin orders), the noninvasive means of collecting it (eg, chart review), and the steps taken by research personnel to minimize any breach in patient confidentiality.
Measurements
We abstracted clinical data on each eligible subject for up to 5 days on GMS. Several data sources were used, including physician admission notes, the hospital's computerized clinical data system, nursing notes, vital sign sheets, the medication administration record, and personal communication with nurses about any missing or discrepant data. Up to 4 routine bedside blood glucose measurements were recorded each day: the measurements taken before meals and at bedtime for patients eating discrete meals or the measurements closest to 6 AM, noon, 6 PM, and midnight for patients not eating or receiving continuous nutrition. Additional measurements were not recorded to avoid ascertainment bias caused by follow‐up testing of abnormal glucose values.
Study outcomes included the percentage of glucose readings below 60 mg/dL (hypoglycemia) and greater than 180 mg/dL (hyperglycemia). Use of several types of insulin ordering practices were also recorded: use of basal insulin (ie, long‐acting agents such as NPH and insulin glargine), scheduled prandial insulin (eg, regular insulin, insulin lispro, and insulin aspart given before each meal), daily adjustments to insulin orders, use of different insulin sliding scales for patients with different daily insulin requirements, orders to hold or adjust insulin doses in patients not eating, and the percentage of the total daily insulin dose given as basal insulin.
Other patient variables collected were age, sex, weight; medical comorbidities (using a modified Charlson score)9; severity of illness (using a simplified APACHE III score)8; admission diagnosis; baseline HbA1C (taken at or within 6 months of admission); severe complications of diabetes (blindness, dialysis, renal transplant, amputation due to peripheral vascular disease, vascular bypass surgery); diabetic medications prior to admission (none, oral agents only, or any insulin use); daily inpatient use of oral or intravenous steroids, oral diabetic medications, dextrose‐containing intravenous fluids, tube feeds, inpatient total parenteral nutrition, and general nutritional intake (all, most, some, little, or none for each meal).
Statistical Analysis
Characteristics of the study subjects and process and outcome measures were analyzed descriptively using rates, means with standard deviations, and medians with interquartile ranges as appropriate. We also analyzed outcomes by patient‐day to determine daily trends during the course of hospitalization. In these analyses, we used the Mantel‐Haenszel chi‐square test for the dichotomous variables (eg, daily use of any basal insulin) and univariable linear regression with general linear models clustered by patient, that is, repeated‐measures analysis, for the continuous variables. We used an arcsin(square‐root) transformation for those continuous outcomes that were percentages (eg, percentage of glucose readings > 180 mg/dL) and logarithmic transformation for right‐tailed continuous variables (eg, total number of units of insulin administered).
To determine the effects of various insulin‐ordering practices on glucose control, we also performed multivariable analysis of mean glucose levels per patient‐day. We chose mean glucose rather than rates of specific glucose ranges as the outcome because of the low rate of hypoglycemia and the additional sensitivity of this method. First, univariable analysis was performed using the Student's t test, analysis of variance, or Spearman correlation as appropriate for each predictor. Multiple linear regression models were then constructed, using variables significant in the univariable testing at the P < .10 level. Confounding variables that changed beta coefficients by 10% or more were retained, whereas collinear terms were removed by hand; patient age and sex were also retained in the models as a priori selected confounding variables.
As with the repeated‐measures analysis, we used general linear models, accounting for within‐patient clustering, with an exchangeable correlation structure. In addition, standard regression techniques could not be applied to the basal insulin variable because use of basal insulin is a mediator of subsequently lower glucose levels but often is the result of previously elevated glucose levels. Instead, we used a marginal structural model,10, 11 weighting the usual regression analysis to statistically remove the effect of confounding by indication. The weights for this analysis were based on the inverse probability of use of basal insulin, given previous glucose levels and prior use of basal insulin and were estimated from a separate logistic regression analysis. Results were considered significant at P < .05 except as noted above. SAS version 8.1 (Cary, NC) was used for all analyses.
RESULTS
We prospectively identified 123 patients for the study. Subsequently, 16 patients were excluded, 11 who did not have diabetes or inpatient hyperglycemia (most of whom had been placed on insulin prophylactically to avoid steroid‐induced hyperglycemia), 2 who were admitted for diabetic ketoacidosis, 2 who were not on GMS teams 13, and 1 whose data could not be accessed. Characteristics of the remaining 107 study subjects are shown in Table 1. The mean age of the subjects was 65.2 years; 55% were men. Nine patients had no previous diagnosis of diabetes, 43% were taking insulin prior to admission, 14% had severe diabetic complications, and the median HbA1C was 7.
| Characteristic | |
|---|---|
| |
| Age, mean (SD), y | 65.2 (14.5) |
| Male | 59/107 (55) |
| No diagnosis of diabetes at admission | 9/107 (8) |
| Preadmission diabetes medication regimen: | |
| None | 24/106 (22) |
| Oral medications only | 36/106 (34) |
| Insulin | 46/106 (43) |
| HbA1C, median (IQR) | 7 (6, 8) |
| Diabetic complications | 15/107 (14) |
| Hospital length of stay, median (IQR), d | 5 (3, 7) |
| Charlson score, mean (SD) | 5.3 (3.0) |
| APACHE III score, mean (SD) | 36.9 (15.6) |
Regarding insulin‐ordering practices (Table 2), 47 patients (43%) had basal insulin prescribed, while 4% of patients had an order for scheduled mealtime short‐ or rapid‐acting insulin. Of the 89 patients on sliding‐scale insulin, 80 (90%) had orders written for the default sliding scale built into the computerized physician order entry system at BWH. There was no correlation between intensity of the sliding scale and the patient's total daily insulin dose (data not shown). Of the patients on sliding‐scale insulin, 47% were prescribed basal insulin, 39% were prescribed oral agents, and 23% were prescribed neither.
| Measure | |
|---|---|
| |
| Process | |
| Any basal insulin during hospitalization | 47/107 (43) |
| Separate nutritional insulin order | 4/107 (3.7) |
| Change in dose to any insulin order during hospitalization if any hyper‐ or hypoglycemia | 26/75 (35) |
| Standard sliding scale from hospital computer order set | 80/89 (90) |
| Any oral diabetic agents during hospitalization | 39/107 (36) |
| Outcomes | |
| Any hyperglycemia (glucose > 180 mg/dL) | 74/98 (76) |
| 0%20% of readings | 20/98 (20) |
| 20%40% | 19/98 (19) |
| 40%60% | 19/98 (19) |
| 60%80% | 6/98 (6.1) |
| Greater than 80% | 10/98 (10) |
| Any hypoglycemia (glucose < 60 mg/dL) | 11/98 (11) |
| 0%20% of readings | 9/98 (9.2) |
| 20%40% | 2/98 (2.0) |
Regarding glucose control, 317 of 1022 glucose meter readings (31%) were greater than 180 mg/dL, and the mean rate of glucose readings greater than 180 mg/dL per patient was also 31%. Approximately three quarters of all patients had at least one routine glucose reading greater than 180 mg/dL, and 35% of patients had at least 40% of their routine glucose readings greater than 180 mg/dL (Table 2). Twelve of 1022 readings (1.2%) were less than 60 mg/dL, and 11% of patients had at least one glucose reading less than 60 mg/dL (Table 2).
Despite a relatively constant percentage of glucose readings greater than 180 mg/dL per patient over the first 5 days of hospitalization (25%36% each day), we found no evidence of change in the percentage of patients prescribed basal insulin or the percentage of insulin given as basal insulin, and there was a small but significant increase in the total amount of insulin prescribed (Table 3). Of the 75 patients with at least one episode of hypo‐ or hyperglycemia, 43 (57%) were ever prescribed basal insulin, 29 (39%) were prescribed oral diabetes agents, and only 26 (35%) had any change to their insulin regimen during the first 5 days of their hospitalization on GMS. Of the 47 patients prescribed basal insulin in the hospital, 41 had been taking insulin prior to admission.
| Hospital day | P value for Trend | |||||
|---|---|---|---|---|---|---|
| 1 | 2 | 3 | 4 | 5 | ||
| ||||||
| Number of patients | 107 | 105 | 85 | 66 | 48 | |
| Mean adjusted total daily insulin units* | 17 | 22 | 23 | 20 | 27 | 0.03 |
| Patients prescribed any basal insulin (%) | 29/79 (37) | 41/93 (44) | 33/74 (45) | 27/57 (47) | 20/43 (47) | 0.18 |
| Mean % of total insulin dose consisting of basal insulin | 35 | 42 | 38 | 39 | 33 | 0.80 |
| Mean % glucose readings < 60 mg/dL | 2 | 1 | 1 | 0 | 1 | 0.13 |
| Mean % glucose readings> 180 mg/dL | 36 | 34 | 29 | 25 | 32 | 0.13 |
In a multivariable analysis of the mean glucose reading per patient‐day, we found several predictors of lower glucose readings, including diet‐controlled diabetes prior to admission and prescription of oral hypoglycemic medications in the hospital. We also found several predictors of higher glucose readings, including severe diabetic complications and higher glucose level at admission. Finally, we noted variation both by medical team (each composed of 1 medical attending, 1 resident, and 2 interns) and by floor of the hospital (each staffed by a different cadre of nurses). Adjusting for these factors (as well as for the daily use of dextrose‐containing intravenous fluids and steroids, sex, age, Charlson comorbidity score, APACHE 3 score, prior diagnosis of diabetes, HbA1C level, and length of hospital stay) use of sliding‐scale insulin alone (eg, without scheduled basal or nutritional insulin) was associated with a daily average glucose reading that was 20 mg/dL higher than that for those prescribed scheduled insulin or those not prescribed a sliding scale at all (95% confidence interval, 5.035 mg/dL; Table 4). In a separate analysis, adjusting for the same clinical factors, we could find no relationship between change in daily dose of basal insulin and change in daily average glucose level (data not shown).
| Characteristic | Effect size (95% CI)* | P value |
|---|---|---|
| ||
| Sliding scale insulin alone | 20 (5.035) | 0.01 |
| Oral diabetes regimen during hospitalization | 22 (413.0) | 0.02 |
| Diet‐controlled diabetes prior to admission | 32 (577.6) | 0.01 |
| No prior diagnosis of diabetes | 28 (3.260) | 0.08 |
| Complications of diabetes | 44 (2167) | < 0.001 |
| HbA1C | 6.1 (120.0073) | 0.05 |
| Admission glucose | 0.19 (0.0670.31) | 0.002 |
| Medical Team‖ | 47 (6727) | < 0.001 |
| Hospital Floor | 46 (6824) | < 0.001 |
DISCUSSION
In this observational study, we found several deficiencies in the management of diabetes and hyperglycemia among hospitalized patients on a hospitalist‐run general medical service. These deficiencies were both in processes of care (eg, limited use of basal and especially nutritional insulin) and in outcomes (ie, glycemic control) compared with national guidelines. We also found evidence of clinical inertia when comparing outpatient to inpatient regimens, when evaluating daily changes in management, and when evaluating responses to previous hyperglycemia. Finally, we demonstrated that use of an insulin sliding scale by itself was associated with worse glycemic control after extensive adjustment for a variety of clinical factors.
Of note, other than the use of sliding‐scale insulin by itself, we could not find a relationship between specific daily adjustments to insulin orders and daily glycemic control in this study. However, we did find differences in glycemic control by medical team and by floor (the latter a proxy for nursing staff). This suggests that glycemic control depends on the exact details of how insulin is managed, rather than on crude measures of insulin adjustment such as change in dose in response to hyperglycemia. These findings also suggest that interventions focused on medical and nursing staff may be able to improve inpatient glycemic control.
The association between the use of oral diabetic agents and improved glucose control was notable and could represent an actual benefit of these agents (especially when added to sliding‐scale insulin by itself) and/or the result of uncontrolled confounding (ie, as a marker of well‐controlled diabetes). Further study is needed to distinguish among these possibilities.
Previous studies have shown evidence of poor inpatient glycemic control as well as the deleterious effects of sliding‐scale insulin by itself.8 This study is perhaps most notable for the suggestion that little, if anything, has changed over the previous decade in this area, despite recent well‐done observational and randomized controlled trials demonstrating the hazards of inpatient hyperglycemia and the publication of expert consensus statements on inpatient glucose management. Strategies to improve glucose control have been investigated to a greater extent in intensive care units12, 13 than on general medical wards,14 perhaps because the strength of evidence is strongest in this setting. Without such strong evidence for general medical patients, factors such as clinician fear of hypoglycemia, clinical inertia, and resistance to institutional change may play predominant roles.
Clinical inertia (ie, recognition of the problem but failure to act)15 has been demonstrated previously in the outpatient management of diabetes16, 17; this study provides evidence of the phenomenon in the inpatient setting. Work by Phillips and colleagues15 has shown that clinical inertia results from at least 3 problems: overestimation of care provided; use of soft reasons to avoid intensification of therapy; and lack of education, training, and practice organization aimed at achieving specific goals. All 3 problems likely contribute to clinical inertia in inpatient diabetes management. Revised educational programs; systems for improving care such as reminders, flow sheets, and order sets; and performance feedback can help address clinical inertia and improve care.15
This study should be viewed in light of its limitations, including relatively small sample size, thus limiting our ability to detect other possible significant predictors of glycemic control, and the use of a single institution, thus limiting generalizability. However, recent data from the University HealthSystem Consortium revealed that our institution was typical of the 37 participating academic medical centers in that study.18 In addition, only 9 patients were identified without a prior diagnosis of diabetes, raising the possibility that some patients with undiagnosed diabetes were missed in our study. However, our search strategy included a daily review of automatically abstracted laboratory values, making this possibility less likely. Strengths of this study include its prospective data collection methods with rigorous inclusion criteria, collection of detailed clinical data, and use of a novel statistical technique to more accurately assess the complex relationship between insulin use and glycemic control, appropriately adjusting for confounding by indication caused by prior glucose measurements.
Future research should focus on patient, clinician, and system barriers to improving inpatient glycemic management, using the clinical inertia framework as a starting point, and on the creation of insulin protocols that can be used and proven effective in the non‐ICU inpatient setting. Also needed are improved measures of the quality of glycemic control, insulin orders, and daily insulin adjustment.
In conclusion, inpatient glycemic management was shown to be in need of improvement. Institutionwide quality improvement efforts should probably target both physician and nursing behavior and should focus on increasing use of basal and nutritional insulin, as proposed in recent guidelines, avoiding use of sliding‐scale insulin by itself, and performing daily insulin adjustment in response to previous hypo‐ or hyperglycemia. Hospitalists can play a major role in these institutionwide quality improvement efforts.
Acknowledgements
We thank Paul Szumita, PharmD, and LeRoi Hicks, MD, MPH, for assistance with the conception of this project and E. John Orav, PhD, for statistical assistance.
- Agency for Healthcare Research and Quality. HCUPnet, Healthcare Cost and Utilization Project. 8/17/2005. Available at: http://www.ahrq.gov/HCUPnet/. Accessed November 29,2005.
- ,,,,,.Hyperglycemia: an independent marker of in‐hospital mortality in patients with undiagnosed diabetes.J Clin Endocrinol Metab.2002;87:978–982.
- ,,, et al.Management of diabetes and hyperglycemia in hospitals.Diabetes Care.2004;27:553–597.
- ,,, et al.Intensive insulin therapy in the critically ill patients.N Engl J Med.2001;345:1359–1367.
- .Prospective randomised study of intensive insulin treatment on long term survival after acute myocardial infarction in patients with diabetes mellitus. DIGAMI (Diabetes Mellitus, Insulin Glucose Infusion in Acute Myocardial Infarction) Study Group.Br Med J.1997;314:1512–1515.
- ,,, et al.Intense metabolic control by means of insulin in patients with diabetes mellitus and acute myocardial infarction (DIGAMI 2): effects on mortality and morbidity.Eur Heart J2005;26:650–661.
- ,,, et al.American College of Endocrinology position statement on inpatient diabetes and metabolic control.Endocr Pract.2004;10(Suppl2):4–9.
- ,,.Glycemic control and sliding scale insulin use in medical inpatients with diabetes mellitus.Arch Intern Med.1997;157:545–552.
- ,,,,.Can comorbidity be measured by questionnaire rather than medical record review?Med Care.1996;34:73–84.
- ,,.Marginal structural models to estimate the joint causal effect of nonrandomized treatments.J Am Stat Assoc—App Case Stud.2001;96:440–448.
- .Correction for non‐compliance in equivalence trials.Stat Med.1998;17:269–302; discussion87–89.
- ,,, et al.Implementation of a safe and effective insulin infusion protocol in a medical intensive care unit.Diabetes Care.2004;27:461–7.
- .Effect of an intensive glucose management protocol on the mortality of critically ill adult patients.Mayo Clin Proc.2004;79:992–1000.
- ,,,.Eliminating inpatient sliding‐scale insulin: a reeducation project with medical house staff.Diabetes Care.2005;28:1008–1011.
- ,,, et al.Clinical inertia.Ann Intern Med.2001;135:825–834.
- ,,,,.Diabetes in urban African‐Americans. XV. Identification of barriers to provider adherence to management protocols.Diabetes Care.1999;22:1617–1620.
- ,,, et al.Clinical inertia in the management of type 2 diabetes metabolic risk factors.Diabet Med.2004;21:150–155.
- University HealthSystem Consortium.Glycemic control 2005 findings and conclusions. Paper presented at Glycemic Control 2005 Knowledge Transfer Meeting. August 19,2005, Chicago, IL.
Diabetes mellitus is a common comorbidity of hospitalization; in 2003 diabetes was a secondary diagnosis in 17.8% of all adult hospital discharges.1 When undiagnosed diabetes is included, the prevalence of inpatient diabetes or hyperglycemia may be as high as 38%.2 Recent studies show that hyperglycemia in hospitalized patients complicates numerous illnesses and is an independent predictor of adverse outcomes.3 Treatment of inpatient hyperglycemia improves outcomes, including mortality, for patients in surgical intensive care units4 and possibly for those admitted for myocardial infarction.5, 6 For these reasons, the American Diabetes Association and the American College of Endocrinology now recommend that glucose levels of all patients admitted to non‐critical‐care units be maintained below 180 mg/dL.3, 7
Evidence‐based recommendations for achieving these goals include effective protocols for subcutaneous insulin therapy for patients who do not require continuous intravenous insulin infusion. Components of these protocols include use of basal insulin and scheduled nutritional insulin, avoiding use of supplemental (sliding‐scale) insulin alone (which has been shown to be ineffective and possibly deleterious in prior studies),8 and adjustment of insulin orders to reflect nutritional intake, insulin sensitivity, and previous response to therapy.7
We conducted this study to evaluate the current state of glycemic control and adherence to current recommendations on a general medicine service run by hospitalists in a busy teaching hospital. We also sought to correlate insulin‐ordering practices with the quality of glycemic control in these patients.
METHODS
Setting and Participants
This prospective cohort study was conducted at Brigham and Women's Hospital (BWH) from August 1 through September 30, 2004. Eligible subjects were patients admitted to 3 General Medicine Service (GMS) teams with either a known diagnosis of diabetes or inpatient hyperglycemia (random glucose > 200 mg/dL). Patients admitted for diabetic ketoacidosis, hyperosmolar hyperglycemic state, or gestational diabetes were excluded. Members of the BWH/Faulkner Hospitalist Service are the teaching attendings on these 3 teams (each consisting of 2 interns and 1 junior or senior resident) and are the attendings of record for approximately 90% of the patients on these teams. A research assistant identified potential subjects each weekday from the daily computerized sign‐out system used by all medical residents by searching for diabetes on the patient summary, a diabetic medication in the automatically abstracted medication list, or a laboratory glucose value greater than 200 mg/dL from automatically abstracted daily laboratory results. Eligibility criteria were confirmed by medical record review, and any question of eligibility was reviewed with the principal investigator. This study was approved by the BWH Institutional Review Board; patient consent was not deemed necessary for this study given the relatively nonsensitive nature of the data (eg, glucose control, insulin orders), the noninvasive means of collecting it (eg, chart review), and the steps taken by research personnel to minimize any breach in patient confidentiality.
Measurements
We abstracted clinical data on each eligible subject for up to 5 days on GMS. Several data sources were used, including physician admission notes, the hospital's computerized clinical data system, nursing notes, vital sign sheets, the medication administration record, and personal communication with nurses about any missing or discrepant data. Up to 4 routine bedside blood glucose measurements were recorded each day: the measurements taken before meals and at bedtime for patients eating discrete meals or the measurements closest to 6 AM, noon, 6 PM, and midnight for patients not eating or receiving continuous nutrition. Additional measurements were not recorded to avoid ascertainment bias caused by follow‐up testing of abnormal glucose values.
Study outcomes included the percentage of glucose readings below 60 mg/dL (hypoglycemia) and greater than 180 mg/dL (hyperglycemia). Use of several types of insulin ordering practices were also recorded: use of basal insulin (ie, long‐acting agents such as NPH and insulin glargine), scheduled prandial insulin (eg, regular insulin, insulin lispro, and insulin aspart given before each meal), daily adjustments to insulin orders, use of different insulin sliding scales for patients with different daily insulin requirements, orders to hold or adjust insulin doses in patients not eating, and the percentage of the total daily insulin dose given as basal insulin.
Other patient variables collected were age, sex, weight; medical comorbidities (using a modified Charlson score)9; severity of illness (using a simplified APACHE III score)8; admission diagnosis; baseline HbA1C (taken at or within 6 months of admission); severe complications of diabetes (blindness, dialysis, renal transplant, amputation due to peripheral vascular disease, vascular bypass surgery); diabetic medications prior to admission (none, oral agents only, or any insulin use); daily inpatient use of oral or intravenous steroids, oral diabetic medications, dextrose‐containing intravenous fluids, tube feeds, inpatient total parenteral nutrition, and general nutritional intake (all, most, some, little, or none for each meal).
Statistical Analysis
Characteristics of the study subjects and process and outcome measures were analyzed descriptively using rates, means with standard deviations, and medians with interquartile ranges as appropriate. We also analyzed outcomes by patient‐day to determine daily trends during the course of hospitalization. In these analyses, we used the Mantel‐Haenszel chi‐square test for the dichotomous variables (eg, daily use of any basal insulin) and univariable linear regression with general linear models clustered by patient, that is, repeated‐measures analysis, for the continuous variables. We used an arcsin(square‐root) transformation for those continuous outcomes that were percentages (eg, percentage of glucose readings > 180 mg/dL) and logarithmic transformation for right‐tailed continuous variables (eg, total number of units of insulin administered).
To determine the effects of various insulin‐ordering practices on glucose control, we also performed multivariable analysis of mean glucose levels per patient‐day. We chose mean glucose rather than rates of specific glucose ranges as the outcome because of the low rate of hypoglycemia and the additional sensitivity of this method. First, univariable analysis was performed using the Student's t test, analysis of variance, or Spearman correlation as appropriate for each predictor. Multiple linear regression models were then constructed, using variables significant in the univariable testing at the P < .10 level. Confounding variables that changed beta coefficients by 10% or more were retained, whereas collinear terms were removed by hand; patient age and sex were also retained in the models as a priori selected confounding variables.
As with the repeated‐measures analysis, we used general linear models, accounting for within‐patient clustering, with an exchangeable correlation structure. In addition, standard regression techniques could not be applied to the basal insulin variable because use of basal insulin is a mediator of subsequently lower glucose levels but often is the result of previously elevated glucose levels. Instead, we used a marginal structural model,10, 11 weighting the usual regression analysis to statistically remove the effect of confounding by indication. The weights for this analysis were based on the inverse probability of use of basal insulin, given previous glucose levels and prior use of basal insulin and were estimated from a separate logistic regression analysis. Results were considered significant at P < .05 except as noted above. SAS version 8.1 (Cary, NC) was used for all analyses.
RESULTS
We prospectively identified 123 patients for the study. Subsequently, 16 patients were excluded, 11 who did not have diabetes or inpatient hyperglycemia (most of whom had been placed on insulin prophylactically to avoid steroid‐induced hyperglycemia), 2 who were admitted for diabetic ketoacidosis, 2 who were not on GMS teams 13, and 1 whose data could not be accessed. Characteristics of the remaining 107 study subjects are shown in Table 1. The mean age of the subjects was 65.2 years; 55% were men. Nine patients had no previous diagnosis of diabetes, 43% were taking insulin prior to admission, 14% had severe diabetic complications, and the median HbA1C was 7.
| Characteristic | |
|---|---|
| |
| Age, mean (SD), y | 65.2 (14.5) |
| Male | 59/107 (55) |
| No diagnosis of diabetes at admission | 9/107 (8) |
| Preadmission diabetes medication regimen: | |
| None | 24/106 (22) |
| Oral medications only | 36/106 (34) |
| Insulin | 46/106 (43) |
| HbA1C, median (IQR) | 7 (6, 8) |
| Diabetic complications | 15/107 (14) |
| Hospital length of stay, median (IQR), d | 5 (3, 7) |
| Charlson score, mean (SD) | 5.3 (3.0) |
| APACHE III score, mean (SD) | 36.9 (15.6) |
Regarding insulin‐ordering practices (Table 2), 47 patients (43%) had basal insulin prescribed, while 4% of patients had an order for scheduled mealtime short‐ or rapid‐acting insulin. Of the 89 patients on sliding‐scale insulin, 80 (90%) had orders written for the default sliding scale built into the computerized physician order entry system at BWH. There was no correlation between intensity of the sliding scale and the patient's total daily insulin dose (data not shown). Of the patients on sliding‐scale insulin, 47% were prescribed basal insulin, 39% were prescribed oral agents, and 23% were prescribed neither.
| Measure | |
|---|---|
| |
| Process | |
| Any basal insulin during hospitalization | 47/107 (43) |
| Separate nutritional insulin order | 4/107 (3.7) |
| Change in dose to any insulin order during hospitalization if any hyper‐ or hypoglycemia | 26/75 (35) |
| Standard sliding scale from hospital computer order set | 80/89 (90) |
| Any oral diabetic agents during hospitalization | 39/107 (36) |
| Outcomes | |
| Any hyperglycemia (glucose > 180 mg/dL) | 74/98 (76) |
| 0%20% of readings | 20/98 (20) |
| 20%40% | 19/98 (19) |
| 40%60% | 19/98 (19) |
| 60%80% | 6/98 (6.1) |
| Greater than 80% | 10/98 (10) |
| Any hypoglycemia (glucose < 60 mg/dL) | 11/98 (11) |
| 0%20% of readings | 9/98 (9.2) |
| 20%40% | 2/98 (2.0) |
Regarding glucose control, 317 of 1022 glucose meter readings (31%) were greater than 180 mg/dL, and the mean rate of glucose readings greater than 180 mg/dL per patient was also 31%. Approximately three quarters of all patients had at least one routine glucose reading greater than 180 mg/dL, and 35% of patients had at least 40% of their routine glucose readings greater than 180 mg/dL (Table 2). Twelve of 1022 readings (1.2%) were less than 60 mg/dL, and 11% of patients had at least one glucose reading less than 60 mg/dL (Table 2).
Despite a relatively constant percentage of glucose readings greater than 180 mg/dL per patient over the first 5 days of hospitalization (25%36% each day), we found no evidence of change in the percentage of patients prescribed basal insulin or the percentage of insulin given as basal insulin, and there was a small but significant increase in the total amount of insulin prescribed (Table 3). Of the 75 patients with at least one episode of hypo‐ or hyperglycemia, 43 (57%) were ever prescribed basal insulin, 29 (39%) were prescribed oral diabetes agents, and only 26 (35%) had any change to their insulin regimen during the first 5 days of their hospitalization on GMS. Of the 47 patients prescribed basal insulin in the hospital, 41 had been taking insulin prior to admission.
| Hospital day | P value for Trend | |||||
|---|---|---|---|---|---|---|
| 1 | 2 | 3 | 4 | 5 | ||
| ||||||
| Number of patients | 107 | 105 | 85 | 66 | 48 | |
| Mean adjusted total daily insulin units* | 17 | 22 | 23 | 20 | 27 | 0.03 |
| Patients prescribed any basal insulin (%) | 29/79 (37) | 41/93 (44) | 33/74 (45) | 27/57 (47) | 20/43 (47) | 0.18 |
| Mean % of total insulin dose consisting of basal insulin | 35 | 42 | 38 | 39 | 33 | 0.80 |
| Mean % glucose readings < 60 mg/dL | 2 | 1 | 1 | 0 | 1 | 0.13 |
| Mean % glucose readings> 180 mg/dL | 36 | 34 | 29 | 25 | 32 | 0.13 |
In a multivariable analysis of the mean glucose reading per patient‐day, we found several predictors of lower glucose readings, including diet‐controlled diabetes prior to admission and prescription of oral hypoglycemic medications in the hospital. We also found several predictors of higher glucose readings, including severe diabetic complications and higher glucose level at admission. Finally, we noted variation both by medical team (each composed of 1 medical attending, 1 resident, and 2 interns) and by floor of the hospital (each staffed by a different cadre of nurses). Adjusting for these factors (as well as for the daily use of dextrose‐containing intravenous fluids and steroids, sex, age, Charlson comorbidity score, APACHE 3 score, prior diagnosis of diabetes, HbA1C level, and length of hospital stay) use of sliding‐scale insulin alone (eg, without scheduled basal or nutritional insulin) was associated with a daily average glucose reading that was 20 mg/dL higher than that for those prescribed scheduled insulin or those not prescribed a sliding scale at all (95% confidence interval, 5.035 mg/dL; Table 4). In a separate analysis, adjusting for the same clinical factors, we could find no relationship between change in daily dose of basal insulin and change in daily average glucose level (data not shown).
| Characteristic | Effect size (95% CI)* | P value |
|---|---|---|
| ||
| Sliding scale insulin alone | 20 (5.035) | 0.01 |
| Oral diabetes regimen during hospitalization | 22 (413.0) | 0.02 |
| Diet‐controlled diabetes prior to admission | 32 (577.6) | 0.01 |
| No prior diagnosis of diabetes | 28 (3.260) | 0.08 |
| Complications of diabetes | 44 (2167) | < 0.001 |
| HbA1C | 6.1 (120.0073) | 0.05 |
| Admission glucose | 0.19 (0.0670.31) | 0.002 |
| Medical Team‖ | 47 (6727) | < 0.001 |
| Hospital Floor | 46 (6824) | < 0.001 |
DISCUSSION
In this observational study, we found several deficiencies in the management of diabetes and hyperglycemia among hospitalized patients on a hospitalist‐run general medical service. These deficiencies were both in processes of care (eg, limited use of basal and especially nutritional insulin) and in outcomes (ie, glycemic control) compared with national guidelines. We also found evidence of clinical inertia when comparing outpatient to inpatient regimens, when evaluating daily changes in management, and when evaluating responses to previous hyperglycemia. Finally, we demonstrated that use of an insulin sliding scale by itself was associated with worse glycemic control after extensive adjustment for a variety of clinical factors.
Of note, other than the use of sliding‐scale insulin by itself, we could not find a relationship between specific daily adjustments to insulin orders and daily glycemic control in this study. However, we did find differences in glycemic control by medical team and by floor (the latter a proxy for nursing staff). This suggests that glycemic control depends on the exact details of how insulin is managed, rather than on crude measures of insulin adjustment such as change in dose in response to hyperglycemia. These findings also suggest that interventions focused on medical and nursing staff may be able to improve inpatient glycemic control.
The association between the use of oral diabetic agents and improved glucose control was notable and could represent an actual benefit of these agents (especially when added to sliding‐scale insulin by itself) and/or the result of uncontrolled confounding (ie, as a marker of well‐controlled diabetes). Further study is needed to distinguish among these possibilities.
Previous studies have shown evidence of poor inpatient glycemic control as well as the deleterious effects of sliding‐scale insulin by itself.8 This study is perhaps most notable for the suggestion that little, if anything, has changed over the previous decade in this area, despite recent well‐done observational and randomized controlled trials demonstrating the hazards of inpatient hyperglycemia and the publication of expert consensus statements on inpatient glucose management. Strategies to improve glucose control have been investigated to a greater extent in intensive care units12, 13 than on general medical wards,14 perhaps because the strength of evidence is strongest in this setting. Without such strong evidence for general medical patients, factors such as clinician fear of hypoglycemia, clinical inertia, and resistance to institutional change may play predominant roles.
Clinical inertia (ie, recognition of the problem but failure to act)15 has been demonstrated previously in the outpatient management of diabetes16, 17; this study provides evidence of the phenomenon in the inpatient setting. Work by Phillips and colleagues15 has shown that clinical inertia results from at least 3 problems: overestimation of care provided; use of soft reasons to avoid intensification of therapy; and lack of education, training, and practice organization aimed at achieving specific goals. All 3 problems likely contribute to clinical inertia in inpatient diabetes management. Revised educational programs; systems for improving care such as reminders, flow sheets, and order sets; and performance feedback can help address clinical inertia and improve care.15
This study should be viewed in light of its limitations, including relatively small sample size, thus limiting our ability to detect other possible significant predictors of glycemic control, and the use of a single institution, thus limiting generalizability. However, recent data from the University HealthSystem Consortium revealed that our institution was typical of the 37 participating academic medical centers in that study.18 In addition, only 9 patients were identified without a prior diagnosis of diabetes, raising the possibility that some patients with undiagnosed diabetes were missed in our study. However, our search strategy included a daily review of automatically abstracted laboratory values, making this possibility less likely. Strengths of this study include its prospective data collection methods with rigorous inclusion criteria, collection of detailed clinical data, and use of a novel statistical technique to more accurately assess the complex relationship between insulin use and glycemic control, appropriately adjusting for confounding by indication caused by prior glucose measurements.
Future research should focus on patient, clinician, and system barriers to improving inpatient glycemic management, using the clinical inertia framework as a starting point, and on the creation of insulin protocols that can be used and proven effective in the non‐ICU inpatient setting. Also needed are improved measures of the quality of glycemic control, insulin orders, and daily insulin adjustment.
In conclusion, inpatient glycemic management was shown to be in need of improvement. Institutionwide quality improvement efforts should probably target both physician and nursing behavior and should focus on increasing use of basal and nutritional insulin, as proposed in recent guidelines, avoiding use of sliding‐scale insulin by itself, and performing daily insulin adjustment in response to previous hypo‐ or hyperglycemia. Hospitalists can play a major role in these institutionwide quality improvement efforts.
Acknowledgements
We thank Paul Szumita, PharmD, and LeRoi Hicks, MD, MPH, for assistance with the conception of this project and E. John Orav, PhD, for statistical assistance.
Diabetes mellitus is a common comorbidity of hospitalization; in 2003 diabetes was a secondary diagnosis in 17.8% of all adult hospital discharges.1 When undiagnosed diabetes is included, the prevalence of inpatient diabetes or hyperglycemia may be as high as 38%.2 Recent studies show that hyperglycemia in hospitalized patients complicates numerous illnesses and is an independent predictor of adverse outcomes.3 Treatment of inpatient hyperglycemia improves outcomes, including mortality, for patients in surgical intensive care units4 and possibly for those admitted for myocardial infarction.5, 6 For these reasons, the American Diabetes Association and the American College of Endocrinology now recommend that glucose levels of all patients admitted to non‐critical‐care units be maintained below 180 mg/dL.3, 7
Evidence‐based recommendations for achieving these goals include effective protocols for subcutaneous insulin therapy for patients who do not require continuous intravenous insulin infusion. Components of these protocols include use of basal insulin and scheduled nutritional insulin, avoiding use of supplemental (sliding‐scale) insulin alone (which has been shown to be ineffective and possibly deleterious in prior studies),8 and adjustment of insulin orders to reflect nutritional intake, insulin sensitivity, and previous response to therapy.7
We conducted this study to evaluate the current state of glycemic control and adherence to current recommendations on a general medicine service run by hospitalists in a busy teaching hospital. We also sought to correlate insulin‐ordering practices with the quality of glycemic control in these patients.
METHODS
Setting and Participants
This prospective cohort study was conducted at Brigham and Women's Hospital (BWH) from August 1 through September 30, 2004. Eligible subjects were patients admitted to 3 General Medicine Service (GMS) teams with either a known diagnosis of diabetes or inpatient hyperglycemia (random glucose > 200 mg/dL). Patients admitted for diabetic ketoacidosis, hyperosmolar hyperglycemic state, or gestational diabetes were excluded. Members of the BWH/Faulkner Hospitalist Service are the teaching attendings on these 3 teams (each consisting of 2 interns and 1 junior or senior resident) and are the attendings of record for approximately 90% of the patients on these teams. A research assistant identified potential subjects each weekday from the daily computerized sign‐out system used by all medical residents by searching for diabetes on the patient summary, a diabetic medication in the automatically abstracted medication list, or a laboratory glucose value greater than 200 mg/dL from automatically abstracted daily laboratory results. Eligibility criteria were confirmed by medical record review, and any question of eligibility was reviewed with the principal investigator. This study was approved by the BWH Institutional Review Board; patient consent was not deemed necessary for this study given the relatively nonsensitive nature of the data (eg, glucose control, insulin orders), the noninvasive means of collecting it (eg, chart review), and the steps taken by research personnel to minimize any breach in patient confidentiality.
Measurements
We abstracted clinical data on each eligible subject for up to 5 days on GMS. Several data sources were used, including physician admission notes, the hospital's computerized clinical data system, nursing notes, vital sign sheets, the medication administration record, and personal communication with nurses about any missing or discrepant data. Up to 4 routine bedside blood glucose measurements were recorded each day: the measurements taken before meals and at bedtime for patients eating discrete meals or the measurements closest to 6 AM, noon, 6 PM, and midnight for patients not eating or receiving continuous nutrition. Additional measurements were not recorded to avoid ascertainment bias caused by follow‐up testing of abnormal glucose values.
Study outcomes included the percentage of glucose readings below 60 mg/dL (hypoglycemia) and greater than 180 mg/dL (hyperglycemia). Use of several types of insulin ordering practices were also recorded: use of basal insulin (ie, long‐acting agents such as NPH and insulin glargine), scheduled prandial insulin (eg, regular insulin, insulin lispro, and insulin aspart given before each meal), daily adjustments to insulin orders, use of different insulin sliding scales for patients with different daily insulin requirements, orders to hold or adjust insulin doses in patients not eating, and the percentage of the total daily insulin dose given as basal insulin.
Other patient variables collected were age, sex, weight; medical comorbidities (using a modified Charlson score)9; severity of illness (using a simplified APACHE III score)8; admission diagnosis; baseline HbA1C (taken at or within 6 months of admission); severe complications of diabetes (blindness, dialysis, renal transplant, amputation due to peripheral vascular disease, vascular bypass surgery); diabetic medications prior to admission (none, oral agents only, or any insulin use); daily inpatient use of oral or intravenous steroids, oral diabetic medications, dextrose‐containing intravenous fluids, tube feeds, inpatient total parenteral nutrition, and general nutritional intake (all, most, some, little, or none for each meal).
Statistical Analysis
Characteristics of the study subjects and process and outcome measures were analyzed descriptively using rates, means with standard deviations, and medians with interquartile ranges as appropriate. We also analyzed outcomes by patient‐day to determine daily trends during the course of hospitalization. In these analyses, we used the Mantel‐Haenszel chi‐square test for the dichotomous variables (eg, daily use of any basal insulin) and univariable linear regression with general linear models clustered by patient, that is, repeated‐measures analysis, for the continuous variables. We used an arcsin(square‐root) transformation for those continuous outcomes that were percentages (eg, percentage of glucose readings > 180 mg/dL) and logarithmic transformation for right‐tailed continuous variables (eg, total number of units of insulin administered).
To determine the effects of various insulin‐ordering practices on glucose control, we also performed multivariable analysis of mean glucose levels per patient‐day. We chose mean glucose rather than rates of specific glucose ranges as the outcome because of the low rate of hypoglycemia and the additional sensitivity of this method. First, univariable analysis was performed using the Student's t test, analysis of variance, or Spearman correlation as appropriate for each predictor. Multiple linear regression models were then constructed, using variables significant in the univariable testing at the P < .10 level. Confounding variables that changed beta coefficients by 10% or more were retained, whereas collinear terms were removed by hand; patient age and sex were also retained in the models as a priori selected confounding variables.
As with the repeated‐measures analysis, we used general linear models, accounting for within‐patient clustering, with an exchangeable correlation structure. In addition, standard regression techniques could not be applied to the basal insulin variable because use of basal insulin is a mediator of subsequently lower glucose levels but often is the result of previously elevated glucose levels. Instead, we used a marginal structural model,10, 11 weighting the usual regression analysis to statistically remove the effect of confounding by indication. The weights for this analysis were based on the inverse probability of use of basal insulin, given previous glucose levels and prior use of basal insulin and were estimated from a separate logistic regression analysis. Results were considered significant at P < .05 except as noted above. SAS version 8.1 (Cary, NC) was used for all analyses.
RESULTS
We prospectively identified 123 patients for the study. Subsequently, 16 patients were excluded, 11 who did not have diabetes or inpatient hyperglycemia (most of whom had been placed on insulin prophylactically to avoid steroid‐induced hyperglycemia), 2 who were admitted for diabetic ketoacidosis, 2 who were not on GMS teams 13, and 1 whose data could not be accessed. Characteristics of the remaining 107 study subjects are shown in Table 1. The mean age of the subjects was 65.2 years; 55% were men. Nine patients had no previous diagnosis of diabetes, 43% were taking insulin prior to admission, 14% had severe diabetic complications, and the median HbA1C was 7.
| Characteristic | |
|---|---|
| |
| Age, mean (SD), y | 65.2 (14.5) |
| Male | 59/107 (55) |
| No diagnosis of diabetes at admission | 9/107 (8) |
| Preadmission diabetes medication regimen: | |
| None | 24/106 (22) |
| Oral medications only | 36/106 (34) |
| Insulin | 46/106 (43) |
| HbA1C, median (IQR) | 7 (6, 8) |
| Diabetic complications | 15/107 (14) |
| Hospital length of stay, median (IQR), d | 5 (3, 7) |
| Charlson score, mean (SD) | 5.3 (3.0) |
| APACHE III score, mean (SD) | 36.9 (15.6) |
Regarding insulin‐ordering practices (Table 2), 47 patients (43%) had basal insulin prescribed, while 4% of patients had an order for scheduled mealtime short‐ or rapid‐acting insulin. Of the 89 patients on sliding‐scale insulin, 80 (90%) had orders written for the default sliding scale built into the computerized physician order entry system at BWH. There was no correlation between intensity of the sliding scale and the patient's total daily insulin dose (data not shown). Of the patients on sliding‐scale insulin, 47% were prescribed basal insulin, 39% were prescribed oral agents, and 23% were prescribed neither.
| Measure | |
|---|---|
| |
| Process | |
| Any basal insulin during hospitalization | 47/107 (43) |
| Separate nutritional insulin order | 4/107 (3.7) |
| Change in dose to any insulin order during hospitalization if any hyper‐ or hypoglycemia | 26/75 (35) |
| Standard sliding scale from hospital computer order set | 80/89 (90) |
| Any oral diabetic agents during hospitalization | 39/107 (36) |
| Outcomes | |
| Any hyperglycemia (glucose > 180 mg/dL) | 74/98 (76) |
| 0%20% of readings | 20/98 (20) |
| 20%40% | 19/98 (19) |
| 40%60% | 19/98 (19) |
| 60%80% | 6/98 (6.1) |
| Greater than 80% | 10/98 (10) |
| Any hypoglycemia (glucose < 60 mg/dL) | 11/98 (11) |
| 0%20% of readings | 9/98 (9.2) |
| 20%40% | 2/98 (2.0) |
Regarding glucose control, 317 of 1022 glucose meter readings (31%) were greater than 180 mg/dL, and the mean rate of glucose readings greater than 180 mg/dL per patient was also 31%. Approximately three quarters of all patients had at least one routine glucose reading greater than 180 mg/dL, and 35% of patients had at least 40% of their routine glucose readings greater than 180 mg/dL (Table 2). Twelve of 1022 readings (1.2%) were less than 60 mg/dL, and 11% of patients had at least one glucose reading less than 60 mg/dL (Table 2).
Despite a relatively constant percentage of glucose readings greater than 180 mg/dL per patient over the first 5 days of hospitalization (25%36% each day), we found no evidence of change in the percentage of patients prescribed basal insulin or the percentage of insulin given as basal insulin, and there was a small but significant increase in the total amount of insulin prescribed (Table 3). Of the 75 patients with at least one episode of hypo‐ or hyperglycemia, 43 (57%) were ever prescribed basal insulin, 29 (39%) were prescribed oral diabetes agents, and only 26 (35%) had any change to their insulin regimen during the first 5 days of their hospitalization on GMS. Of the 47 patients prescribed basal insulin in the hospital, 41 had been taking insulin prior to admission.
| Hospital day | P value for Trend | |||||
|---|---|---|---|---|---|---|
| 1 | 2 | 3 | 4 | 5 | ||
| ||||||
| Number of patients | 107 | 105 | 85 | 66 | 48 | |
| Mean adjusted total daily insulin units* | 17 | 22 | 23 | 20 | 27 | 0.03 |
| Patients prescribed any basal insulin (%) | 29/79 (37) | 41/93 (44) | 33/74 (45) | 27/57 (47) | 20/43 (47) | 0.18 |
| Mean % of total insulin dose consisting of basal insulin | 35 | 42 | 38 | 39 | 33 | 0.80 |
| Mean % glucose readings < 60 mg/dL | 2 | 1 | 1 | 0 | 1 | 0.13 |
| Mean % glucose readings> 180 mg/dL | 36 | 34 | 29 | 25 | 32 | 0.13 |
In a multivariable analysis of the mean glucose reading per patient‐day, we found several predictors of lower glucose readings, including diet‐controlled diabetes prior to admission and prescription of oral hypoglycemic medications in the hospital. We also found several predictors of higher glucose readings, including severe diabetic complications and higher glucose level at admission. Finally, we noted variation both by medical team (each composed of 1 medical attending, 1 resident, and 2 interns) and by floor of the hospital (each staffed by a different cadre of nurses). Adjusting for these factors (as well as for the daily use of dextrose‐containing intravenous fluids and steroids, sex, age, Charlson comorbidity score, APACHE 3 score, prior diagnosis of diabetes, HbA1C level, and length of hospital stay) use of sliding‐scale insulin alone (eg, without scheduled basal or nutritional insulin) was associated with a daily average glucose reading that was 20 mg/dL higher than that for those prescribed scheduled insulin or those not prescribed a sliding scale at all (95% confidence interval, 5.035 mg/dL; Table 4). In a separate analysis, adjusting for the same clinical factors, we could find no relationship between change in daily dose of basal insulin and change in daily average glucose level (data not shown).
| Characteristic | Effect size (95% CI)* | P value |
|---|---|---|
| ||
| Sliding scale insulin alone | 20 (5.035) | 0.01 |
| Oral diabetes regimen during hospitalization | 22 (413.0) | 0.02 |
| Diet‐controlled diabetes prior to admission | 32 (577.6) | 0.01 |
| No prior diagnosis of diabetes | 28 (3.260) | 0.08 |
| Complications of diabetes | 44 (2167) | < 0.001 |
| HbA1C | 6.1 (120.0073) | 0.05 |
| Admission glucose | 0.19 (0.0670.31) | 0.002 |
| Medical Team‖ | 47 (6727) | < 0.001 |
| Hospital Floor | 46 (6824) | < 0.001 |
DISCUSSION
In this observational study, we found several deficiencies in the management of diabetes and hyperglycemia among hospitalized patients on a hospitalist‐run general medical service. These deficiencies were both in processes of care (eg, limited use of basal and especially nutritional insulin) and in outcomes (ie, glycemic control) compared with national guidelines. We also found evidence of clinical inertia when comparing outpatient to inpatient regimens, when evaluating daily changes in management, and when evaluating responses to previous hyperglycemia. Finally, we demonstrated that use of an insulin sliding scale by itself was associated with worse glycemic control after extensive adjustment for a variety of clinical factors.
Of note, other than the use of sliding‐scale insulin by itself, we could not find a relationship between specific daily adjustments to insulin orders and daily glycemic control in this study. However, we did find differences in glycemic control by medical team and by floor (the latter a proxy for nursing staff). This suggests that glycemic control depends on the exact details of how insulin is managed, rather than on crude measures of insulin adjustment such as change in dose in response to hyperglycemia. These findings also suggest that interventions focused on medical and nursing staff may be able to improve inpatient glycemic control.
The association between the use of oral diabetic agents and improved glucose control was notable and could represent an actual benefit of these agents (especially when added to sliding‐scale insulin by itself) and/or the result of uncontrolled confounding (ie, as a marker of well‐controlled diabetes). Further study is needed to distinguish among these possibilities.
Previous studies have shown evidence of poor inpatient glycemic control as well as the deleterious effects of sliding‐scale insulin by itself.8 This study is perhaps most notable for the suggestion that little, if anything, has changed over the previous decade in this area, despite recent well‐done observational and randomized controlled trials demonstrating the hazards of inpatient hyperglycemia and the publication of expert consensus statements on inpatient glucose management. Strategies to improve glucose control have been investigated to a greater extent in intensive care units12, 13 than on general medical wards,14 perhaps because the strength of evidence is strongest in this setting. Without such strong evidence for general medical patients, factors such as clinician fear of hypoglycemia, clinical inertia, and resistance to institutional change may play predominant roles.
Clinical inertia (ie, recognition of the problem but failure to act)15 has been demonstrated previously in the outpatient management of diabetes16, 17; this study provides evidence of the phenomenon in the inpatient setting. Work by Phillips and colleagues15 has shown that clinical inertia results from at least 3 problems: overestimation of care provided; use of soft reasons to avoid intensification of therapy; and lack of education, training, and practice organization aimed at achieving specific goals. All 3 problems likely contribute to clinical inertia in inpatient diabetes management. Revised educational programs; systems for improving care such as reminders, flow sheets, and order sets; and performance feedback can help address clinical inertia and improve care.15
This study should be viewed in light of its limitations, including relatively small sample size, thus limiting our ability to detect other possible significant predictors of glycemic control, and the use of a single institution, thus limiting generalizability. However, recent data from the University HealthSystem Consortium revealed that our institution was typical of the 37 participating academic medical centers in that study.18 In addition, only 9 patients were identified without a prior diagnosis of diabetes, raising the possibility that some patients with undiagnosed diabetes were missed in our study. However, our search strategy included a daily review of automatically abstracted laboratory values, making this possibility less likely. Strengths of this study include its prospective data collection methods with rigorous inclusion criteria, collection of detailed clinical data, and use of a novel statistical technique to more accurately assess the complex relationship between insulin use and glycemic control, appropriately adjusting for confounding by indication caused by prior glucose measurements.
Future research should focus on patient, clinician, and system barriers to improving inpatient glycemic management, using the clinical inertia framework as a starting point, and on the creation of insulin protocols that can be used and proven effective in the non‐ICU inpatient setting. Also needed are improved measures of the quality of glycemic control, insulin orders, and daily insulin adjustment.
In conclusion, inpatient glycemic management was shown to be in need of improvement. Institutionwide quality improvement efforts should probably target both physician and nursing behavior and should focus on increasing use of basal and nutritional insulin, as proposed in recent guidelines, avoiding use of sliding‐scale insulin by itself, and performing daily insulin adjustment in response to previous hypo‐ or hyperglycemia. Hospitalists can play a major role in these institutionwide quality improvement efforts.
Acknowledgements
We thank Paul Szumita, PharmD, and LeRoi Hicks, MD, MPH, for assistance with the conception of this project and E. John Orav, PhD, for statistical assistance.
- Agency for Healthcare Research and Quality. HCUPnet, Healthcare Cost and Utilization Project. 8/17/2005. Available at: http://www.ahrq.gov/HCUPnet/. Accessed November 29,2005.
- ,,,,,.Hyperglycemia: an independent marker of in‐hospital mortality in patients with undiagnosed diabetes.J Clin Endocrinol Metab.2002;87:978–982.
- ,,, et al.Management of diabetes and hyperglycemia in hospitals.Diabetes Care.2004;27:553–597.
- ,,, et al.Intensive insulin therapy in the critically ill patients.N Engl J Med.2001;345:1359–1367.
- .Prospective randomised study of intensive insulin treatment on long term survival after acute myocardial infarction in patients with diabetes mellitus. DIGAMI (Diabetes Mellitus, Insulin Glucose Infusion in Acute Myocardial Infarction) Study Group.Br Med J.1997;314:1512–1515.
- ,,, et al.Intense metabolic control by means of insulin in patients with diabetes mellitus and acute myocardial infarction (DIGAMI 2): effects on mortality and morbidity.Eur Heart J2005;26:650–661.
- ,,, et al.American College of Endocrinology position statement on inpatient diabetes and metabolic control.Endocr Pract.2004;10(Suppl2):4–9.
- ,,.Glycemic control and sliding scale insulin use in medical inpatients with diabetes mellitus.Arch Intern Med.1997;157:545–552.
- ,,,,.Can comorbidity be measured by questionnaire rather than medical record review?Med Care.1996;34:73–84.
- ,,.Marginal structural models to estimate the joint causal effect of nonrandomized treatments.J Am Stat Assoc—App Case Stud.2001;96:440–448.
- .Correction for non‐compliance in equivalence trials.Stat Med.1998;17:269–302; discussion87–89.
- ,,, et al.Implementation of a safe and effective insulin infusion protocol in a medical intensive care unit.Diabetes Care.2004;27:461–7.
- .Effect of an intensive glucose management protocol on the mortality of critically ill adult patients.Mayo Clin Proc.2004;79:992–1000.
- ,,,.Eliminating inpatient sliding‐scale insulin: a reeducation project with medical house staff.Diabetes Care.2005;28:1008–1011.
- ,,, et al.Clinical inertia.Ann Intern Med.2001;135:825–834.
- ,,,,.Diabetes in urban African‐Americans. XV. Identification of barriers to provider adherence to management protocols.Diabetes Care.1999;22:1617–1620.
- ,,, et al.Clinical inertia in the management of type 2 diabetes metabolic risk factors.Diabet Med.2004;21:150–155.
- University HealthSystem Consortium.Glycemic control 2005 findings and conclusions. Paper presented at Glycemic Control 2005 Knowledge Transfer Meeting. August 19,2005, Chicago, IL.
- Agency for Healthcare Research and Quality. HCUPnet, Healthcare Cost and Utilization Project. 8/17/2005. Available at: http://www.ahrq.gov/HCUPnet/. Accessed November 29,2005.
- ,,,,,.Hyperglycemia: an independent marker of in‐hospital mortality in patients with undiagnosed diabetes.J Clin Endocrinol Metab.2002;87:978–982.
- ,,, et al.Management of diabetes and hyperglycemia in hospitals.Diabetes Care.2004;27:553–597.
- ,,, et al.Intensive insulin therapy in the critically ill patients.N Engl J Med.2001;345:1359–1367.
- .Prospective randomised study of intensive insulin treatment on long term survival after acute myocardial infarction in patients with diabetes mellitus. DIGAMI (Diabetes Mellitus, Insulin Glucose Infusion in Acute Myocardial Infarction) Study Group.Br Med J.1997;314:1512–1515.
- ,,, et al.Intense metabolic control by means of insulin in patients with diabetes mellitus and acute myocardial infarction (DIGAMI 2): effects on mortality and morbidity.Eur Heart J2005;26:650–661.
- ,,, et al.American College of Endocrinology position statement on inpatient diabetes and metabolic control.Endocr Pract.2004;10(Suppl2):4–9.
- ,,.Glycemic control and sliding scale insulin use in medical inpatients with diabetes mellitus.Arch Intern Med.1997;157:545–552.
- ,,,,.Can comorbidity be measured by questionnaire rather than medical record review?Med Care.1996;34:73–84.
- ,,.Marginal structural models to estimate the joint causal effect of nonrandomized treatments.J Am Stat Assoc—App Case Stud.2001;96:440–448.
- .Correction for non‐compliance in equivalence trials.Stat Med.1998;17:269–302; discussion87–89.
- ,,, et al.Implementation of a safe and effective insulin infusion protocol in a medical intensive care unit.Diabetes Care.2004;27:461–7.
- .Effect of an intensive glucose management protocol on the mortality of critically ill adult patients.Mayo Clin Proc.2004;79:992–1000.
- ,,,.Eliminating inpatient sliding‐scale insulin: a reeducation project with medical house staff.Diabetes Care.2005;28:1008–1011.
- ,,, et al.Clinical inertia.Ann Intern Med.2001;135:825–834.
- ,,,,.Diabetes in urban African‐Americans. XV. Identification of barriers to provider adherence to management protocols.Diabetes Care.1999;22:1617–1620.
- ,,, et al.Clinical inertia in the management of type 2 diabetes metabolic risk factors.Diabet Med.2004;21:150–155.
- University HealthSystem Consortium.Glycemic control 2005 findings and conclusions. Paper presented at Glycemic Control 2005 Knowledge Transfer Meeting. August 19,2005, Chicago, IL.
Copyright © 2006 Society of Hospital Medicine