User login
In the Literature: Research You Need to Know
Clinical question: Does a resident’s ability to make decisions in the management of critically ill patients deteriorate with longer periods of wakefulness?
Background: Residents work long shifts, particularly in the ICU. Their cognitive performance on standardized tests and clinical performance in surgical simulators deteriorates with sleep deprivation. The effect of prolonged wakefulness on resident management of critically ill patients is not known.
Study design: Experimental within-subjects comparison.
Setting: Simulator at the Centre of Excellence for Surgical Education and Innovation, Vancouver General Hospital, Canada.
Synopsis: Twelve internal medicine residents at various levels of training from the University of British Columbia were studied. The residents provided simulated care for critically ill patients at four time points over 26 hours of wakefulness. At each time point, the residents first managed a cardiac dysrhythmia, then a complex patient scenario that would require ICU-level care. They were then scored for errors and given a global score by two of the investigators.
Resident errors in the management of dysrhythmias decreased at the first time point, and remained stable through the next two time points. The mean error rate for the complex patient scenarios increased from 0.92, with a steady rate of rise to 1.58 at the last session. The mean global score for the complex patient scenario showed a trend toward decline as well. Despite this being a small study with relatively subjective outcomes, the results are consistent with previous studies and raise concern for increasing the risk for error in the care of highly vulnerable critically ill patients by residents working long hours.
Bottom line: There is a progressive decrement in resident performance with increasing periods of wakefulness when delivering ICU-level patient-management decisions in a simulator environment.
Citation: Sharpe R, Koval V, Ronco JJ, et al. The impact of prolonged continuous wakefulness on resident clinical performance in the intensive care unit: A patient simulator study. Crit Care Med. 2010;38:766-770.
Reviewed for TH eWire by Dimitriy Levin, MD, Jeffrey Carter, MD, Erin Egan, MD, JD, Jonathan Pell, MD, Laura Rosenthal, MSN, ACNP, Nichole Zehnder, MD, Hospital Medicine Group, University of Colorado Denver
For more physician reviews of HM-related research, visit our website.
Short‐term Femoral Vein Catheterization
Central venous catheters (CVC) are routinely used to deliver medications and monitor intravascular pressures of critically ill patients. Experts and national regulatory bodies have questioned the safety of femoral vein catheterization (FVC), and currently recommend against venous access at this site whenever possible. 13 However, a large prospective nonrandomized study has suggested that rates of FVC infections are not higher than jugular or subclavian sites. 4 Some authors have suggested that increased risk of deep vein thrombosis (DVT) also relatively contraindicates the femoral site. 5 No study has prospectively examined rates of DVT in patients receiving FVC for short durations (72 hours). In this brief report, we prospectively examined the rates of catheter‐related bloodstream infections (CRBI) and DVT in critically ill patients receiving CVC.
Methods
This prospective observational cohort study was conducted in the medical intensive care unit (MICU) of Bridgeport Hospital, a 350‐bed community teaching hospital. The hospital's Institutional Review Board approved the study and waived the informed consent requirement because it has been the practice for the past decade to favor use of the femoral site for initial resuscitations with very low complication rates. All patients admitted to the MICU between September 1, 2008 and March 31, 2009 were eligible. VC were defined as catheters placed in the jugular, subclavian or femoral veins or peripherally inserted and guided to a central intrathoracic vein (PICC). CVC refers to catheters placed directly into central veins. In early 2008, a hospital‐wide initiative was introduced to insert all CVC using the Pronovost check‐list. 1 VC sites were chosen at the discretion of caregivers in the emergency department and MICU. The policy of our intensive care units is to use only saline flushes of VCs.
Demographic data including age, gender, and body mass index, were collected on all patients. In addition the following parameters were monitored for the duration of ICU stay for the purpose of this study: (1) site and duration of installation of all intravascular catheters, (2) level of training of clinician inserting CVC, (3) catheter/blood culture results. For the purposes of this study, bilateral femoral Doppler compression ultrasound studies were expected to be performed by radiology house officers within 24 hours of removing and again 5 to 7 days following removal of FVC. Local VC complications, methods of thromboprophylaxis and risk factors for venous thromboembolism (VTE) were recorded. Patient outcomes and disposition destinations were also recorded.
CRBI were defined using the Centers for Disease Control definitions. 2 CRBI were identified by daily review of all positive blood cultures and review of patients' medical records. In addition, Infection Control Committee data were reviewed to corroborate contemporaneously determined CRBI during the study period and for 1 year prior to the study period. Patients with FVC were examined each day for signs or symptoms of thrombosis (tenderness along the vein, leg swelling, pitting edema or visible collateral superficial veins). Patients were followed up until death or hospital discharge for clinical signs, symptoms or diagnosis of thromboembolic disease.
Bedside Duplex ultrasounds of bilateral common femoral and superficial femoral veins were performed using graded compression and color Doppler techniques. The leg without FVC served as the control. Evaluations were conducted by senior radiology residents (>100 hours training) utilizing a high‐resolution (>7.5 MHz) linear array transducer. Frame capture images were digitally stored and subsequently reviewed by a Board‐certified radiologist, who was blinded to side of insertion and clinical outcomes, and rendered a final interpretation.
Values are listed as means standard deviations. Comparisons of group means were performed using nonpaired Student's t tests. A P value of 0.05 signified statistical significance.
Results
During the study period, 675 patients were admitted to the MICU. VCs were inserted in 238 (35% of) patients. During their MICU stay, 182 (77% of) patients had 1 VC, 48 (20%) had 2 VC, and 8 (3%) had 3 VC. On admission, 38 patients (6%) had preexisting VC (tunneled catheter 58%, PICC 32%, and dialysis catheters 10%). Additional VCs were placed in 10 of these patients (26%).
Of the 302 VC, 85 (28%) were PICCs and 217 were CVC (107, 49% FVC; 82, 38% internal jugular; 28, 13% subclavian). A total of 151 (28%) patients had radial arterial catheters placed around the time of admission. The types of CVC included triple lumen in 164 (75%), dialysis catheters in 29 (13%), single‐lumen large bore catheters in 17 (8%), and tunneled catheters in 4 patients (2%). The average duration (standard deviation [SD]) of CVC was 2.7 2.2 days for FVC, 5.7 9.6 days for internal jugular and 3.6 3.1 days for subclavian vein catheters.
During these seven months, including 1200 catheter‐days, only 1 CRBI was identified in a patient who only had a PICC, yielding an infection rate of 0.83 CRBI per 1000 catheter‐days. No femoral, subclavian or internal jugular catheter infections were detected. Hospital epidemiologic data confirmed this finding, and demonstrated only 1 other CRBI during 3721 line‐days, in the 7 months of this study and 12 months before, yielding an average of 0.40 CRBI/1000 catheter‐days.
Of 107 FVC, 101 were placed during initial resuscitations and 6 as second‐access sites, (2 for dialysis, 4 triple lumen catheters). Thromboprophylaxis was administered to 104 (97% of) patients with FVC. Thromboprophylaxis was pharmacological (heparins) in 63 (59% of) patients and mechanical (pneumatic compression) in 46 (43%). Five patients had both mechanical and pharmacological prophylaxis. Catheters were placed by a critical care or emergency department attending in 11%, critical care fellows in 11%, and residents in 78%. Ultrasound studies of the legs were performed in 57 patients; 56 had studies within 24 hours of removing FVC. Of these 56 patients, 53 studies were interpreted as negative and 3 were considered incomplete. The 3 initially incomplete studies were repeated, and found to be negative. Six patients were discharged from the hospital before the post‐FVC‐removal ultrasound could be performed. Of the 50 patients who had both ultrasounds (initial and follow up 57 days after removal of FVC), none had a DVT on the side of the catheter or in the control leg. Of the 50 patients with no ultrasound follow‐up, no patient developed clinically detected VTE; these patients had FVC for shorter duration (2.4 2.4 vs. 3.4 1.9 days for those with 2 Duplex; P = 0.02) and their ICU length of stay was shorter (3.8 4.6 vs. 6.6 5.6 days for those with 2 Duplex; P = 0.01).
Since no VTE or CRBI were detected further analyses regarding risks for these complications was not possible.
Discussion
Contrary to regulatory guidelines suggesting a poor safety profile, we found that short‐term FVC was associated with no episode of DVT or CRBI. While the incidence of complications is lower in more experienced operators, 6 most FVC in our hospital were placed by resident‐trainees (78%) with or without supervision from an attending physician. There were no immediate or subacute (ie, thrombosis, infection) major complications. There are a number of features that favor short‐term FVC for initial resuscitation of critically ill patients. Subclavian and intrajugular CVC require prolonged Trendelenburg position, which may not be well tolerated by some patients. FVC does not require Trendelenburg position. Major bleeding1.0% to 1.5% for all the CVCis minimized because direct compression of femoral vessels is possible. Compression of subclavian hemorrhage is impossible while compression of the jugular vessels is uncomfortable. Pneumothorax, while uncommon in the subclavian and intrajugular approaches, 7 has serious consequences for an unstable patient, whereas FVC obviates the risk. Some might argue that FVC cannot accurately reflect cardiovascular filling thereby defeating 1 of the important purposes of the catheter. While this is certainly true in patients with raised intraabdominal pressures, a small case series suggests that (longer‐than‐normal) FVC can accurately measure central filling pressures. 8 Another potential shortcoming of FVC is that if used only for short durations during initial resuscitationsas in this studysome patients will require a second CVC or PICC with incumbent risks.
Our study differs from previous studies that have shown infection rates ranging from 1.5/1000 to 20/1000 catheter‐days 4, 9, 10 and thrombosis rates of 6.6% to 25%. 5, 1013 Some previous studies have suggested higher rates of infection of FVC relative to internal jugular or subclavian sites (3.7/1000 vs. 20/1000 catheter‐days) 9 while others found similar infection or colonization rates between femoral and nonfemoral sites. 4, 10 Our 0.83 CRBSI per 1000 catheter‐day rate is similar to that of Pronovost et al. 1 who avoided FVC, whereas it was the preferred site (nearly half of all CVC) in our MICU. The incidence of VTE in critically ill patients ranges from 9% to 33 %, 14, 15 and CVC are a well recognized risk factor of VTE. 5 The reported incidence of DVT in patients with CVC varies widely from 3% to 10% in subclavian catheters 9 to 6.6% to 25% in FVC. 11, 12 We attribute the remarkable difference in our results to the fact that FVC was used for brief durations (mean 2.7 days, range 116 days) for the primary purpose of resuscitating critically ill patients. Also, techniques introduced by Pronovost et al. 1 to reduce CRBI had permeated our institutional practices by the time of this study; our results match his, of very low rates of CRBI when checklists are employed. In previous studies, FVC was used for extended durations similar to other CVC sites (ranging from 4 to 9.6 days). 5, 9, 12, 13, 16 Additionally, almost all of our patients received VTE prophylaxis whereas rates were variable in previous studies.
This study has several limitations. First, catheter insertion sites were not randomly assigned. This can introduce selection bias. For example, often femoral access is used in more unstable patients 4 who are less tolerant of Trendelenberg position whereas it is often avoided in obese patients. Another important limitation is that ultrasound studies were not performed in 47% of patients who had FVC. While these missed cases were not advertent (eg, CVC on weekends when no study personnel available), we cannot exclude the possibility of bias. However, no FVC patients who did not have ultrasounds developed clinically detected VTE. It is also possible that DVT could have appeared >5 to 7 days after our follow‐up ultrasound, though later development might favor spontaneous DVT unrelated to CVC. Finally, this was a relatively small study, but it appears that the rate of DVT from FVC, if placed for short durations and accompanied by thromboprophylaxis, is very low.
In conclusion, short‐term FVC was used safelywith no major complicationsin our MICU. Our data support that short‐term FVC (with thromboprophylaxis) has a reasonable safety profile for initial resuscitation of critically ill patients. Notwithstanding the limitations of our study, we suggest that it may be premature to abandon entirely 3, 17 the use of FVC for resuscitation of critically ill patients. We propose that our data suggest the need for a larger study to examine more definitively the safety profile of short‐term FVC.
- , , , et al. An intervention to decrease catheter related bloodstream infections in the ICU. N Engl J Med. 2006; 355: 2725– 2732.
- , , , et al. Guidelines for the prevention of intravascular catheter‐related infection. MMWR Website. Available at: http://www.cdc.gov/mmwr/preview/mmwrhtml/rr5110a1.htm. Accessed February 2010.
- Joint Commission. National Accreditation: Hospital Patient Safety Goals. Available at: http://www.jointcommission.org/NR/rdonlyres/31666E86‐E7F4‐423E‐9BE8‐F05BD1CB0AA8/0/HAP_NPSG.pdf. Accessed February 2010.
- , , , et al. The incidence of infectious complications of central venous catheters at the subclavian, internal jugular and femoral sites in an intensive care unit population. Crit Care Med. 2005; 33: 13– 20.
- , , , . Femoral deep vein thrombosis associated with central venous catheterization: Results from a prospective, randomized trial. Crit Care Med. 1995; 23: 52– 59.
- , , , , . Central vein catheterization. Failure and complicagtion rates by three percutaneous approaches. Arch Intern Med. 1986; 146: 259– 261.
- , , . Complications of central venous catheters: internal jugular versus subclavian access—a systematic review. Crit Care Med. 2002; 30: 454– 460.
- , , , , , . Comparison of intrathoracic and intra‐abdominal measurements of central venous pressure. Lancet. 1996; 347: 1155– 1157.
- , , , et al. Complications of femoral and subclavian venous catheterization in critically ill patients. A randomized controlled trial. JAMA. 2001; 286: 700– 707.
- , , , et al. Femoral vs jugular venous catheterization and risk of nosocomial events in adults requiring acute renal replacement therapy. A randomized trial. JAMA. 2008; 299: 2413– 2422.
- , , , , , . A prospective evaluation of the use of femoral venous catheters in critically ill adults. Crit Care Med. 1997; 25: 1986– 1989.
- , , , , . Lower extremity deep vein thrombosis: a prospective, randomized, controlled trial in comatose or sedated patients undergoing femoral vein catheterization. Crit Care Med. 1997; 25: 1982– 1985.
- , , , , . Deep venous thrombosis caused by femoral venous catheters in critically ill adult patients. Chest. 2000; 117: 178– 183.
- , , . The incidence of deep venous thrombosis in ICU patients. Chest. 1997; 111: 661– 664.
- , , , et al. Deep venous thrombosis in medical‐surgical critically il patients: prevalence, incidence and risk factors. Crit Care Med. 2005; 33: 1565– 1571.
- , , , et al. Central vein catheter related thrombosis in intensive care patients: incidence, risk factors and relationship with catheter related sepsis. Chest. 1998; 114: 207– 213.
- Institute for Healthcare Improvement. Optimal catheter site selection, with avoidance of the femoral vein for central venous access in adults. Available at: http://www.ihi.org/IHI/Topics/CriticalCare/IntensiveCare/Changes/IndividualChanges/OptimalCatheterSiteSelectionwithAvoidanceofFemoralVeinforCentralVenousAccessinAdultPatients.htm. Accessed February 2010.
Central venous catheters (CVC) are routinely used to deliver medications and monitor intravascular pressures of critically ill patients. Experts and national regulatory bodies have questioned the safety of femoral vein catheterization (FVC), and currently recommend against venous access at this site whenever possible. 13 However, a large prospective nonrandomized study has suggested that rates of FVC infections are not higher than jugular or subclavian sites. 4 Some authors have suggested that increased risk of deep vein thrombosis (DVT) also relatively contraindicates the femoral site. 5 No study has prospectively examined rates of DVT in patients receiving FVC for short durations (72 hours). In this brief report, we prospectively examined the rates of catheter‐related bloodstream infections (CRBI) and DVT in critically ill patients receiving CVC.
Methods
This prospective observational cohort study was conducted in the medical intensive care unit (MICU) of Bridgeport Hospital, a 350‐bed community teaching hospital. The hospital's Institutional Review Board approved the study and waived the informed consent requirement because it has been the practice for the past decade to favor use of the femoral site for initial resuscitations with very low complication rates. All patients admitted to the MICU between September 1, 2008 and March 31, 2009 were eligible. VC were defined as catheters placed in the jugular, subclavian or femoral veins or peripherally inserted and guided to a central intrathoracic vein (PICC). CVC refers to catheters placed directly into central veins. In early 2008, a hospital‐wide initiative was introduced to insert all CVC using the Pronovost check‐list. 1 VC sites were chosen at the discretion of caregivers in the emergency department and MICU. The policy of our intensive care units is to use only saline flushes of VCs.
Demographic data including age, gender, and body mass index, were collected on all patients. In addition the following parameters were monitored for the duration of ICU stay for the purpose of this study: (1) site and duration of installation of all intravascular catheters, (2) level of training of clinician inserting CVC, (3) catheter/blood culture results. For the purposes of this study, bilateral femoral Doppler compression ultrasound studies were expected to be performed by radiology house officers within 24 hours of removing and again 5 to 7 days following removal of FVC. Local VC complications, methods of thromboprophylaxis and risk factors for venous thromboembolism (VTE) were recorded. Patient outcomes and disposition destinations were also recorded.
CRBI were defined using the Centers for Disease Control definitions. 2 CRBI were identified by daily review of all positive blood cultures and review of patients' medical records. In addition, Infection Control Committee data were reviewed to corroborate contemporaneously determined CRBI during the study period and for 1 year prior to the study period. Patients with FVC were examined each day for signs or symptoms of thrombosis (tenderness along the vein, leg swelling, pitting edema or visible collateral superficial veins). Patients were followed up until death or hospital discharge for clinical signs, symptoms or diagnosis of thromboembolic disease.
Bedside Duplex ultrasounds of bilateral common femoral and superficial femoral veins were performed using graded compression and color Doppler techniques. The leg without FVC served as the control. Evaluations were conducted by senior radiology residents (>100 hours training) utilizing a high‐resolution (>7.5 MHz) linear array transducer. Frame capture images were digitally stored and subsequently reviewed by a Board‐certified radiologist, who was blinded to side of insertion and clinical outcomes, and rendered a final interpretation.
Values are listed as means standard deviations. Comparisons of group means were performed using nonpaired Student's t tests. A P value of 0.05 signified statistical significance.
Results
During the study period, 675 patients were admitted to the MICU. VCs were inserted in 238 (35% of) patients. During their MICU stay, 182 (77% of) patients had 1 VC, 48 (20%) had 2 VC, and 8 (3%) had 3 VC. On admission, 38 patients (6%) had preexisting VC (tunneled catheter 58%, PICC 32%, and dialysis catheters 10%). Additional VCs were placed in 10 of these patients (26%).
Of the 302 VC, 85 (28%) were PICCs and 217 were CVC (107, 49% FVC; 82, 38% internal jugular; 28, 13% subclavian). A total of 151 (28%) patients had radial arterial catheters placed around the time of admission. The types of CVC included triple lumen in 164 (75%), dialysis catheters in 29 (13%), single‐lumen large bore catheters in 17 (8%), and tunneled catheters in 4 patients (2%). The average duration (standard deviation [SD]) of CVC was 2.7 2.2 days for FVC, 5.7 9.6 days for internal jugular and 3.6 3.1 days for subclavian vein catheters.
During these seven months, including 1200 catheter‐days, only 1 CRBI was identified in a patient who only had a PICC, yielding an infection rate of 0.83 CRBI per 1000 catheter‐days. No femoral, subclavian or internal jugular catheter infections were detected. Hospital epidemiologic data confirmed this finding, and demonstrated only 1 other CRBI during 3721 line‐days, in the 7 months of this study and 12 months before, yielding an average of 0.40 CRBI/1000 catheter‐days.
Of 107 FVC, 101 were placed during initial resuscitations and 6 as second‐access sites, (2 for dialysis, 4 triple lumen catheters). Thromboprophylaxis was administered to 104 (97% of) patients with FVC. Thromboprophylaxis was pharmacological (heparins) in 63 (59% of) patients and mechanical (pneumatic compression) in 46 (43%). Five patients had both mechanical and pharmacological prophylaxis. Catheters were placed by a critical care or emergency department attending in 11%, critical care fellows in 11%, and residents in 78%. Ultrasound studies of the legs were performed in 57 patients; 56 had studies within 24 hours of removing FVC. Of these 56 patients, 53 studies were interpreted as negative and 3 were considered incomplete. The 3 initially incomplete studies were repeated, and found to be negative. Six patients were discharged from the hospital before the post‐FVC‐removal ultrasound could be performed. Of the 50 patients who had both ultrasounds (initial and follow up 57 days after removal of FVC), none had a DVT on the side of the catheter or in the control leg. Of the 50 patients with no ultrasound follow‐up, no patient developed clinically detected VTE; these patients had FVC for shorter duration (2.4 2.4 vs. 3.4 1.9 days for those with 2 Duplex; P = 0.02) and their ICU length of stay was shorter (3.8 4.6 vs. 6.6 5.6 days for those with 2 Duplex; P = 0.01).
Since no VTE or CRBI were detected further analyses regarding risks for these complications was not possible.
Discussion
Contrary to regulatory guidelines suggesting a poor safety profile, we found that short‐term FVC was associated with no episode of DVT or CRBI. While the incidence of complications is lower in more experienced operators, 6 most FVC in our hospital were placed by resident‐trainees (78%) with or without supervision from an attending physician. There were no immediate or subacute (ie, thrombosis, infection) major complications. There are a number of features that favor short‐term FVC for initial resuscitation of critically ill patients. Subclavian and intrajugular CVC require prolonged Trendelenburg position, which may not be well tolerated by some patients. FVC does not require Trendelenburg position. Major bleeding1.0% to 1.5% for all the CVCis minimized because direct compression of femoral vessels is possible. Compression of subclavian hemorrhage is impossible while compression of the jugular vessels is uncomfortable. Pneumothorax, while uncommon in the subclavian and intrajugular approaches, 7 has serious consequences for an unstable patient, whereas FVC obviates the risk. Some might argue that FVC cannot accurately reflect cardiovascular filling thereby defeating 1 of the important purposes of the catheter. While this is certainly true in patients with raised intraabdominal pressures, a small case series suggests that (longer‐than‐normal) FVC can accurately measure central filling pressures. 8 Another potential shortcoming of FVC is that if used only for short durations during initial resuscitationsas in this studysome patients will require a second CVC or PICC with incumbent risks.
Our study differs from previous studies that have shown infection rates ranging from 1.5/1000 to 20/1000 catheter‐days 4, 9, 10 and thrombosis rates of 6.6% to 25%. 5, 1013 Some previous studies have suggested higher rates of infection of FVC relative to internal jugular or subclavian sites (3.7/1000 vs. 20/1000 catheter‐days) 9 while others found similar infection or colonization rates between femoral and nonfemoral sites. 4, 10 Our 0.83 CRBSI per 1000 catheter‐day rate is similar to that of Pronovost et al. 1 who avoided FVC, whereas it was the preferred site (nearly half of all CVC) in our MICU. The incidence of VTE in critically ill patients ranges from 9% to 33 %, 14, 15 and CVC are a well recognized risk factor of VTE. 5 The reported incidence of DVT in patients with CVC varies widely from 3% to 10% in subclavian catheters 9 to 6.6% to 25% in FVC. 11, 12 We attribute the remarkable difference in our results to the fact that FVC was used for brief durations (mean 2.7 days, range 116 days) for the primary purpose of resuscitating critically ill patients. Also, techniques introduced by Pronovost et al. 1 to reduce CRBI had permeated our institutional practices by the time of this study; our results match his, of very low rates of CRBI when checklists are employed. In previous studies, FVC was used for extended durations similar to other CVC sites (ranging from 4 to 9.6 days). 5, 9, 12, 13, 16 Additionally, almost all of our patients received VTE prophylaxis whereas rates were variable in previous studies.
This study has several limitations. First, catheter insertion sites were not randomly assigned. This can introduce selection bias. For example, often femoral access is used in more unstable patients 4 who are less tolerant of Trendelenberg position whereas it is often avoided in obese patients. Another important limitation is that ultrasound studies were not performed in 47% of patients who had FVC. While these missed cases were not advertent (eg, CVC on weekends when no study personnel available), we cannot exclude the possibility of bias. However, no FVC patients who did not have ultrasounds developed clinically detected VTE. It is also possible that DVT could have appeared >5 to 7 days after our follow‐up ultrasound, though later development might favor spontaneous DVT unrelated to CVC. Finally, this was a relatively small study, but it appears that the rate of DVT from FVC, if placed for short durations and accompanied by thromboprophylaxis, is very low.
In conclusion, short‐term FVC was used safelywith no major complicationsin our MICU. Our data support that short‐term FVC (with thromboprophylaxis) has a reasonable safety profile for initial resuscitation of critically ill patients. Notwithstanding the limitations of our study, we suggest that it may be premature to abandon entirely 3, 17 the use of FVC for resuscitation of critically ill patients. We propose that our data suggest the need for a larger study to examine more definitively the safety profile of short‐term FVC.
- , , , et al. An intervention to decrease catheter related bloodstream infections in the ICU. N Engl J Med. 2006; 355: 2725– 2732.
- , , , et al. Guidelines for the prevention of intravascular catheter‐related infection. MMWR Website. Available at: http://www.cdc.gov/mmwr/preview/mmwrhtml/rr5110a1.htm. Accessed February 2010.
- Joint Commission. National Accreditation: Hospital Patient Safety Goals. Available at: http://www.jointcommission.org/NR/rdonlyres/31666E86‐E7F4‐423E‐9BE8‐F05BD1CB0AA8/0/HAP_NPSG.pdf. Accessed February 2010.
- , , , et al. The incidence of infectious complications of central venous catheters at the subclavian, internal jugular and femoral sites in an intensive care unit population. Crit Care Med. 2005; 33: 13– 20.
- , , , . Femoral deep vein thrombosis associated with central venous catheterization: Results from a prospective, randomized trial. Crit Care Med. 1995; 23: 52– 59.
- , , , , . Central vein catheterization. Failure and complicagtion rates by three percutaneous approaches. Arch Intern Med. 1986; 146: 259– 261.
- , , . Complications of central venous catheters: internal jugular versus subclavian access—a systematic review. Crit Care Med. 2002; 30: 454– 460.
- , , , , , . Comparison of intrathoracic and intra‐abdominal measurements of central venous pressure. Lancet. 1996; 347: 1155– 1157.
- , , , et al. Complications of femoral and subclavian venous catheterization in critically ill patients. A randomized controlled trial. JAMA. 2001; 286: 700– 707.
- , , , et al. Femoral vs jugular venous catheterization and risk of nosocomial events in adults requiring acute renal replacement therapy. A randomized trial. JAMA. 2008; 299: 2413– 2422.
- , , , , , . A prospective evaluation of the use of femoral venous catheters in critically ill adults. Crit Care Med. 1997; 25: 1986– 1989.
- , , , , . Lower extremity deep vein thrombosis: a prospective, randomized, controlled trial in comatose or sedated patients undergoing femoral vein catheterization. Crit Care Med. 1997; 25: 1982– 1985.
- , , , , . Deep venous thrombosis caused by femoral venous catheters in critically ill adult patients. Chest. 2000; 117: 178– 183.
- , , . The incidence of deep venous thrombosis in ICU patients. Chest. 1997; 111: 661– 664.
- , , , et al. Deep venous thrombosis in medical‐surgical critically il patients: prevalence, incidence and risk factors. Crit Care Med. 2005; 33: 1565– 1571.
- , , , et al. Central vein catheter related thrombosis in intensive care patients: incidence, risk factors and relationship with catheter related sepsis. Chest. 1998; 114: 207– 213.
- Institute for Healthcare Improvement. Optimal catheter site selection, with avoidance of the femoral vein for central venous access in adults. Available at: http://www.ihi.org/IHI/Topics/CriticalCare/IntensiveCare/Changes/IndividualChanges/OptimalCatheterSiteSelectionwithAvoidanceofFemoralVeinforCentralVenousAccessinAdultPatients.htm. Accessed February 2010.
Trends in Thrombolytic Use for Stroke
Recombinant tissue plasminogen activator (tPA), approved for use in the United States for the treatment for acute ischemic stroke since 1996, improves overall outcomes from ischemic stroke when administered to selected patients.14 Several prominent guidelines, including the Brain Attack Coalition and the American Stroke Association, have recommended increasing the use of tPA for acute ischemic stroke.57 In addition, in 2003 the Joint Commission on Accreditation of Healthcare Organizations developed a disease‐specific certification program to designate certain institutions Primary Stroke Centers, with one of the performance measures being the availability of thrombolysis.8
Despite guidelines and regulatory agencies promoting the use of thrombolysis for ischemic stroke, previous studies have shown disappointingly low rates of use.912 The goals of this study were to assess whether national trends in the use of thrombolysis for acute ischemic stroke have increased in light of increased regulatory activity as well as to identify patient characteristics associated with thrombolytic administration.
Materials and Methods
Data for this study were obtained from the 2001 through 2006 National Hospital Discharge Survey (NHDS), a nationally representative sample of inpatient hospitalizations conducted annually by the National Center for Health Statistics.13 The NHDS collects data on approximately 300,000 patients from about 500 short‐stay nonfederal hospitals in the United States and uses a 3‐stage sampling strategy that allows for extrapolation to national level estimates. Response rates typically exceed 90% from participating hospitals. The survey collects demographic data, including age, sex, race, hospital geographic region, hospital bedsize and patient insurance status. In addition, up to 7 diagnostic and 4 procedural codes from the hospitalization are available, as is hospitalization length of stay and patient discharge disposition. No information on timing of symptoms, degree of neurologic compromise, or results of imaging tests were available in the NHDS.
We searched for all patients age 18 years or older with a primary diagnostic code of ischemic stroke using the International Classification of Diseases, 9th Edition, Clinical Modification (ICD‐9‐CM) codes 433, 434, 436, 437.0, and 437.1, excluding codes with a fifth digit of 0 (which indicated arterial occlusion without mention of cerebral infarction). We then searched for the presence of an ICD‐9‐CM procedure code for injection or infusion of thrombolytic agent (code 99.10). Specific comorbid conditions associated with ischemic stroke were identified by searching for specific ICD‐9‐CM codes, including for heart failure, coronary artery disease, hypertension, diabetes mellitus, and atrial fibrillation. To provide a general assessment of the severity of illness of the patients, we calculated an adapted Charlson comorbidity score for each patient using available secondary discharge diagnosis codes.14 We also searched for codes corresponding to intracranial hemorrhage, a complication associated with tPA administration.
Statistical Analysis
We defined thrombolytic utilization rates as the number of patients hospitalized with a primary diagnosis of ischemic stroke who had a procedure code for thrombolysis divided by the total number of patients hospitalized with ischemic stroke. To calculate nationally representative prevalence rates, we used the sample weights provided by the NHDS to account for the complex sampling design of the survey. Differences in thrombolytic administration rates by patient and hospital characteristics were tested using chi‐squared tests for categorical variables and t‐tests for continuous variables. Variables underwent a backwards selection process with a significance level of 0.05 to develop the final multivariable model of predictors of thrombolytic administration. Length of stay and hospital discharge status were not included in the variable selection process, as the focus was on predictors of initial administration of thrombolytics. All analyses were conducted using SAS Version 9.1 (SAS Institute Inc., Cary, NC).
Results
From years 2001 through 2006, we identified 22,842 patients with a primary diagnosis of ischemic stroke. Of these, 313 (1.37%, 95% confidence interval [CI], 1.22‐1.53%) had a procedure code for injection or infusion of thrombolysis. Using NHDS sample weights, these numbers corresponded to an estimated 2.55 million hospitalizations for ischemic stroke in the United States during the time period and to 35,082 patients receiving intravenous thrombolytics. Although the overall rate of thrombolysis administration was quite low overall, the administration rate increased over time, from 0.87% [95% CI, 0.61‐1.22%] of stroke patients in year 2001 to 2.40% [95% CI, 1.95‐2.93%] in year 2006 and with a particular increase especially noted after year 2003 (P <0.001 for trend, Figure 1).
On bivariate analysis, a lower proportion of African‐American patients received tPA compared to white patients (0.8% vs. 1.5%, P = 0.003), while a higher proportion of patients with atrial fibrillation received tPA (2.3% vs. 1.2%, P < 0.001). Older patients were less likely than younger patients to receive tPA (Table 1). The rate of intracranial hemorrhage was significantly higher in patients who received tPA (5.4% vs. 0.6%, P < 0.001) and the overall inpatient mortality in patients who received tPA was 9.0%. Mortality in patients receiving tPA continued to be higher than in patients who did not receive tPA even when patients with intracranial hemorrhage were excluded (8.1% vs. 5.3%, P < 0.001). Larger hospitals were more likely to administer tPA to patients with ischemic stroke, with a 1.79% administration rate in hospitals with 300 beds compared to 0.90% in hospitals with 100 to 199 beds and 0.52% in hospitals with 6 to 99 beds (P < 0.001).
| Thrombolysis, n (%) | No Thrombolysis, n (%) | P Value | |
|---|---|---|---|
| |||
| Age | 0.001 | ||
| <60 | 76 (24.3) | 4478 (19.9) | |
| 60‐69 | 73 (23.3) | 3942 (17.5) | |
| 70‐79 | 82 (26.2) | 6265 (27.8) | |
| 80+ | 82 (26.2) | 7844 (34.8) | |
| Female | 155 (49.5) | 12625 (56.0) | 0.02 |
| Race | 0.003 | ||
| White | 173 (55.3) | 11542 (51.2) | |
| African American | 29 (9.3) | 3774 (16.8) | |
| Other | 16 (5.1) | 814 (3.6) | |
| Not stated | 95 (30.4) | 6399 (28.4) | |
| Region | 0.05 | ||
| Northeast | 78 (24.9) | 4570 (20.3) | |
| Midwest | 84 (26.8) | 6924 (30.7) | |
| South | 104 (33.2) | 8284 (36.8) | |
| West | 47 (15.0) | 2751 (12.2) | |
| Type of admission | <0.001 | ||
| Emergent | 247 (78.9) | 14233 (63.2) | |
| Urgent | 33 (10.5) | 3703 (16.4) | |
| Elective | 5 (1.6) | 1346 (6.0) | |
| Unknown | 28 (9.0) | 3247 (14.4) | |
| Length of stay, days [95% CI] | 7.2 [6.6‐7.8] | 6.0 [5.9‐6.1] | <0.001 |
| Hospital bedsize | <0.001 | ||
| 6‐99 | 16 (5.1) | 3065 (13.6) | |
| 100‐199 | 48 (15.3) | 5289 (23.5) | |
| 200‐299 | 86 (27.5) | 5212 (23.1) | |
| 300+ | 163 (52.1) | 8963 (39.8) | |
| Payment type | <0.001 | ||
| Medicare | 176 (56.2) | 15197 (67.5) | |
| Medicaid | 21 (6.7) | 1245 (5.5) | |
| Private | 45 (14.4) | 2483 (11.0) | |
| HMO/PPO | 39 (12.5) | 2224 (9.9) | |
| Other/unknown | 32 (10.2) | 1380 (6.1) | |
| Discharge status | <0.001 | ||
| Home | 98 (31.3) | 9507 (42.2) | |
| Short term care facility | 25 (8.0) | 1271 (5.6) | |
| Long term care facility | 62 (19.8) | 5400 (24.0) | |
| Alive, status unknown | 89 (28.4) | 4514 (20.0) | |
| Death | 28 (9.0) | 1218 (5.4) | |
| Unknown | 11 (3.5) | 619 (2.8) | |
| Comorbid conditions | |||
| Congestive heart failure | 48 (15.3) | 2769 (12.3) | 0.10 |
| Coronary artery disease | 49 (15.7) | 4082 (18.1) | 0.26 |
| Hypertension | 164 (52.4) | 12480 (55.4) | 0.29 |
| Diabetes mellitus | 42 (13.4) | 4965 (22.0) | <0.001 |
| Atrial fibrillation | 96 (30.7) | 4096 (18.2) | <0.001 |
| Intracranial hemorrhage | 17 (5.4) | 139 (0.6) | <0.001 |
| Charlson score14 (mean) | 2.48 [2.32‐2.64] | 2.38 [2.36‐2.40] | 0.23 |
After adjusting for patient and hospital characteristics, the absolute rate of thrombolysis administration increased by an average of 0.19% per year (95% CI, 0.12‐0.26%). Factors that were significantly associated with administration of thrombolytics included being hospitalized in a larger hospital, having a history of atrial fibrillation, and a higher Charlson comorbidity index (Table 2). Patients aged 80 years or older, African American patients, and those with diabetes mellitus were significantly less likely to receive thrombolysis.
| Characteristic | Adjusted OR (95% CI) |
|---|---|
| |
| Year (per year, from 2001 to 2006) | 1.2 (1.1‐1.3) |
| Age, years | |
| <60 | Referent |
| 60‐69 | 1.0 (0.7‐1.4) |
| 70‐79 | 0.6 (0.5‐0.9) |
| 80+ | 0.4 (0.3‐0.6) |
| Race | |
| Not African American | Referent |
| African‐American | 0.4 (0.3‐0.7) |
| Unknown | 1.0 (0.8‐1.2) |
| Hospital bedsize | |
| 6‐99 | Referent |
| 100‐199 | 1.7 (1.0‐3.1) |
| 200‐299 | 3.2 (1.8‐5.4) |
| 300+ | 3.3 (2.0‐5.6) |
| Diabetes mellitus | 0.5 (0.3‐0.6) |
| Atrial fibrillation | 2.2 (1.7‐2.9) |
| Charlson comorbidity score14 (per point increase) | 1.1 (1.1‐1.2) |
Discussion
Despite strong recommendations from guidelines and regulatory agencies, national rates of intravenous thrombolysis for ischemic stroke continue to be quite low overall. However, tPA administration appears to have increased from previous years and particularly increased in years after the Joint Commission began to accredit institutions as Primary Stroke Centers.11 The oldest patients and African Americans were less likely to receive thrombolytics, while patients with atrial fibrillation were more likely to receive thrombolysis, potentially related to atrial fibrillation causing more severe strokes.15 A total of 5.4% of patients who received tPA were diagnosed with intracranial hemorrhage, and the inpatient mortality rate of patients with tPA was 9.0%.
The exact optimal rate of thrombolysis administration for the patients in our study is unknown, as the NHDS database lacked detailed information on factors that would preclude tPA administration such as late timing of presentation and mild stroke symptoms.3 Studies conducted in stroke registries and regional settings have found that only approximately 15% to 32% of patients presenting with ischemic stroke arrive within 3 hours of symptom onset, and of these, only about 40% to 50% are eligible for tPA clinically.9, 10, 1619 However, even among presumed eligible patients, tPA administration rates only range between 25% and 43%,17, 19, 20 and the ideal rate is likely to be higher than the very low rates we observed in our study. Newer evidence that extending the time window where tPA may be given safely may increase the number of eligible patients.21
Patients who received thrombolysis had higher mortality rates than patients who did not. Although we were unable to determine a causal association, prior observational studies of tPA administration for acute stroke have found that patients with more severe neurologic deficits were more likely to receive thrombolysis.17, 18 The 9.0% inpatient case‐fatality rate observed in our study compares favorably to the 13.4% mortality rate after tPA reported in a post‐approval meta‐analysis of safety outcomes22 and the rate of intracranial hemorrhage in our analysis was similar to those observed in other settings.9, 2225 We were unable to determine whether intracranial hemorrhages in our study were as a result of tPA administration or whether patients who received tPA were more likely to have intracranial hemorrhages detected, such as may be due to increased frequency of head imaging.
Larger hospitals were more likely to administer tPA. This may reflect regionalization of stroke care, particularly in those designated as stroke centers of excellence. As well, there is some evidence that there is a learning curve with thrombolysis administration, where guideline‐recommended practice and use of tPA increases with additional experience with the drug.9, 26 Promoting systems that allow for rapid triage and diagnosis of acute stroke should be encouraged and hospital leaders should develop strategies that allow for early recognition of potential tPA candidates.
There are several limitations to our analysis. The NHDS does not collect detailed data on clinical or presenting features of stroke, and so we lacked information on stroke severity and eligibility for administration of thrombolysis. Our study may have underestimated the overall rates of thrombolysis, as it was dependent on diagnostic codes. A previous study of 34 patients who received tPA found that although the 99.10 code was 100% specific, the code identified only 17 patients who actually received tPA (sensitivity of 50%).20 Another study comparing Medicare administrative claims data to actual pharmacy billing charges for tPA found that administrative data underestimated the rate of tPA administration by approximately 25% to 30%.12 If a diagnostic code sensitivity of 50% was assumed, rates of tPA administration in our study may have been as high as 4.8% (95% CI, 4.1‐5.5%) by year 2006.
Conclusion
In conclusion, the use of intravenous thrombolysis in patients admitted with acute ischemic stroke in the United States has risen over time, but overall use remains very low. Further efforts to improve appropriate administration rates should be encouraged, particularly as the acceptable time‐window for using tPA widens.
Acknowledgements
The authors thank Mr. Loren Yglecias for his assistance with manuscript text and references.
- The National Institute of Neurological Disorders and Stroke rt‐PA Stroke Study Group.Tissue plasminogen activator for acute ischemic stroke.N Engl J Med.1995;333:1581–1587.
- ,,, et al.Effects of tissue plasminogen activator for acute ischemic stroke at one year. National Institute of Neurological Disorders and Stroke Recombinant Tissue Plasminogen Activator Stroke Study Group.N Engl J Med.1999;340:1781–1787.
- ,,, et al.Association of outcome with early stroke treatment: Pooled analysis of ATLANTIS, ECASS, and NINDS rT‐PA stroke trials.Lancet.2004;363:768–774.
- ,,, et al.Thrombolysis with alteplase for acute ischaemic stroke in the safe implementation of thrombolysis in stroke‐monitoring study (SITS‐MOST): An observational study.Lancet.2007;369:275–282.
- ,,, et al.Recommendations for the establishment of primary stroke centers.JAMA.2000;283:3102–3109.
- ,.Management of acute ischaemic stroke: new guidelines from the American Stroke Association and European Stroke Initiative.Lancet Neurol.2003;2:698–701.
- ,,, et al.Guidelines for the early management of adults with ischemic stroke: a guideline from the American Heart Association/American Stroke Association Stroke Council, Clinical Cardiology Council, Cardiovascular Radiology and Intervention council, and the Atherosclerotic Peripheral Vascular Disease and Quality of Care Outcomes in Research Interdisciplinary Working groups: The American Academy of Neurology affirms the value of this guideline as an educational tool for neurologists.Circulation.2007;115:e478–534.
- The Joint Commission Primary Stroke Center Certification. Available at: http://www.jointcommission.org/CertificationPrograms/PrimaryStrokeCenters. Accessed February 2010.
- ,,, et al.Use of tissue‐type plasminogen activator for acute ischemic stroke: The Cleveland area experience.JAMA.2000;283:1151–1158.
- California Acute Stroke Pilot Registry (CASPR) Investigators.Prioritizing interventions to improve rates of thrombolysis for ischemic stroke.Neurology.2005;64:654–659.
- ,,, et al.Thrombolysis for ischemic stroke in the united states: Data from National Hospital Discharge Survey 1999–2001.Neurosurgery.2005;57:647–654; discussion647–654.
- ,,,,.National US estimates of recombinant tissue plasminogen activator use: ICD‐9 codes substantially underestimate.Stroke.2008;39:924–928.
- US Department of Health and Human Services Public Health Service and National Center for Health Statistics.National Hospital Discharge Durvey 1991–2006. Multi‐year public‐use data file documentation.
- ,,.Adapting a clinical comorbidity index for use with ICD‐9‐CM administrative databases.J Clin Epidemiol.1992;45:613–619.
- ,,, et al.Stroke severity in atrial fibrillation. The Framingham study.Stroke.1996;27:1760–1764.
- ,,,,.Why are stroke patients excluded from tPA therapy? An analysis of patient eligibility.Neurology.2001;57:1739–1740.
- ,,,,,.Utilization of intravenous tissue plasminogen activator for acute ischemic stroke.Arch Neurol.2004;61:346–350.
- ,,, et al.Eligibility for recombinant tissue plasminogen activator in acute ischemic stroke: a population‐based study.Stroke.2004;35:27–29.
- ,,, et al.Tpa use for stroke in the registry of the Canadian stroke network.Can J Neurol Sci.2005;32:433–439.
- ,,, et al.Utilization of intravenous tissue‐type plasminogen activator for ischemic stroke at academic medical centers: the influence of ethnicity.Stroke.2001;32:1061–1068.
- ,,, et al.Number needed to treat to benefit and to harm for intravenous tissue plasminogen activator therapy in the 3‐ to 4.5‐hour window: Joint outcome table analysis of the ECASS 3 trial.Stroke.2009;40:2433–2437.
- .Tissue plasminogen activator for acute ischemic stroke in clinical practice: a meta‐analysis of safety data.Stroke.2003;34:2847–2850.
- ,,, et al.Early intravenous thrombolysis for acute ischemic stroke in a community‐based approach.Stroke.1998;29:1544–1549.
- ,,, et al.Factors associated with in‐hospital mortality after administration of thrombolysis in acute ischemic stroke patients: an analysis of the Nationwide Inpatient Sample 1999 to 2002.Stroke.2006;37:440–446.
- ,,, et al.Intravenous t‐PA for acute ischemic stroke: therapeutic yield of a stroke code system.Neurology.1998;50:501–503.
- ,,, et al.Intravenous tissue‐type plasminogen activator therapy for ischemic stroke: Houston experience 1996 to 2000.Arch Neurol.2001;58:2009–2013.
Recombinant tissue plasminogen activator (tPA), approved for use in the United States for the treatment for acute ischemic stroke since 1996, improves overall outcomes from ischemic stroke when administered to selected patients.14 Several prominent guidelines, including the Brain Attack Coalition and the American Stroke Association, have recommended increasing the use of tPA for acute ischemic stroke.57 In addition, in 2003 the Joint Commission on Accreditation of Healthcare Organizations developed a disease‐specific certification program to designate certain institutions Primary Stroke Centers, with one of the performance measures being the availability of thrombolysis.8
Despite guidelines and regulatory agencies promoting the use of thrombolysis for ischemic stroke, previous studies have shown disappointingly low rates of use.912 The goals of this study were to assess whether national trends in the use of thrombolysis for acute ischemic stroke have increased in light of increased regulatory activity as well as to identify patient characteristics associated with thrombolytic administration.
Materials and Methods
Data for this study were obtained from the 2001 through 2006 National Hospital Discharge Survey (NHDS), a nationally representative sample of inpatient hospitalizations conducted annually by the National Center for Health Statistics.13 The NHDS collects data on approximately 300,000 patients from about 500 short‐stay nonfederal hospitals in the United States and uses a 3‐stage sampling strategy that allows for extrapolation to national level estimates. Response rates typically exceed 90% from participating hospitals. The survey collects demographic data, including age, sex, race, hospital geographic region, hospital bedsize and patient insurance status. In addition, up to 7 diagnostic and 4 procedural codes from the hospitalization are available, as is hospitalization length of stay and patient discharge disposition. No information on timing of symptoms, degree of neurologic compromise, or results of imaging tests were available in the NHDS.
We searched for all patients age 18 years or older with a primary diagnostic code of ischemic stroke using the International Classification of Diseases, 9th Edition, Clinical Modification (ICD‐9‐CM) codes 433, 434, 436, 437.0, and 437.1, excluding codes with a fifth digit of 0 (which indicated arterial occlusion without mention of cerebral infarction). We then searched for the presence of an ICD‐9‐CM procedure code for injection or infusion of thrombolytic agent (code 99.10). Specific comorbid conditions associated with ischemic stroke were identified by searching for specific ICD‐9‐CM codes, including for heart failure, coronary artery disease, hypertension, diabetes mellitus, and atrial fibrillation. To provide a general assessment of the severity of illness of the patients, we calculated an adapted Charlson comorbidity score for each patient using available secondary discharge diagnosis codes.14 We also searched for codes corresponding to intracranial hemorrhage, a complication associated with tPA administration.
Statistical Analysis
We defined thrombolytic utilization rates as the number of patients hospitalized with a primary diagnosis of ischemic stroke who had a procedure code for thrombolysis divided by the total number of patients hospitalized with ischemic stroke. To calculate nationally representative prevalence rates, we used the sample weights provided by the NHDS to account for the complex sampling design of the survey. Differences in thrombolytic administration rates by patient and hospital characteristics were tested using chi‐squared tests for categorical variables and t‐tests for continuous variables. Variables underwent a backwards selection process with a significance level of 0.05 to develop the final multivariable model of predictors of thrombolytic administration. Length of stay and hospital discharge status were not included in the variable selection process, as the focus was on predictors of initial administration of thrombolytics. All analyses were conducted using SAS Version 9.1 (SAS Institute Inc., Cary, NC).
Results
From years 2001 through 2006, we identified 22,842 patients with a primary diagnosis of ischemic stroke. Of these, 313 (1.37%, 95% confidence interval [CI], 1.22‐1.53%) had a procedure code for injection or infusion of thrombolysis. Using NHDS sample weights, these numbers corresponded to an estimated 2.55 million hospitalizations for ischemic stroke in the United States during the time period and to 35,082 patients receiving intravenous thrombolytics. Although the overall rate of thrombolysis administration was quite low overall, the administration rate increased over time, from 0.87% [95% CI, 0.61‐1.22%] of stroke patients in year 2001 to 2.40% [95% CI, 1.95‐2.93%] in year 2006 and with a particular increase especially noted after year 2003 (P <0.001 for trend, Figure 1).
On bivariate analysis, a lower proportion of African‐American patients received tPA compared to white patients (0.8% vs. 1.5%, P = 0.003), while a higher proportion of patients with atrial fibrillation received tPA (2.3% vs. 1.2%, P < 0.001). Older patients were less likely than younger patients to receive tPA (Table 1). The rate of intracranial hemorrhage was significantly higher in patients who received tPA (5.4% vs. 0.6%, P < 0.001) and the overall inpatient mortality in patients who received tPA was 9.0%. Mortality in patients receiving tPA continued to be higher than in patients who did not receive tPA even when patients with intracranial hemorrhage were excluded (8.1% vs. 5.3%, P < 0.001). Larger hospitals were more likely to administer tPA to patients with ischemic stroke, with a 1.79% administration rate in hospitals with 300 beds compared to 0.90% in hospitals with 100 to 199 beds and 0.52% in hospitals with 6 to 99 beds (P < 0.001).
| Thrombolysis, n (%) | No Thrombolysis, n (%) | P Value | |
|---|---|---|---|
| |||
| Age | 0.001 | ||
| <60 | 76 (24.3) | 4478 (19.9) | |
| 60‐69 | 73 (23.3) | 3942 (17.5) | |
| 70‐79 | 82 (26.2) | 6265 (27.8) | |
| 80+ | 82 (26.2) | 7844 (34.8) | |
| Female | 155 (49.5) | 12625 (56.0) | 0.02 |
| Race | 0.003 | ||
| White | 173 (55.3) | 11542 (51.2) | |
| African American | 29 (9.3) | 3774 (16.8) | |
| Other | 16 (5.1) | 814 (3.6) | |
| Not stated | 95 (30.4) | 6399 (28.4) | |
| Region | 0.05 | ||
| Northeast | 78 (24.9) | 4570 (20.3) | |
| Midwest | 84 (26.8) | 6924 (30.7) | |
| South | 104 (33.2) | 8284 (36.8) | |
| West | 47 (15.0) | 2751 (12.2) | |
| Type of admission | <0.001 | ||
| Emergent | 247 (78.9) | 14233 (63.2) | |
| Urgent | 33 (10.5) | 3703 (16.4) | |
| Elective | 5 (1.6) | 1346 (6.0) | |
| Unknown | 28 (9.0) | 3247 (14.4) | |
| Length of stay, days [95% CI] | 7.2 [6.6‐7.8] | 6.0 [5.9‐6.1] | <0.001 |
| Hospital bedsize | <0.001 | ||
| 6‐99 | 16 (5.1) | 3065 (13.6) | |
| 100‐199 | 48 (15.3) | 5289 (23.5) | |
| 200‐299 | 86 (27.5) | 5212 (23.1) | |
| 300+ | 163 (52.1) | 8963 (39.8) | |
| Payment type | <0.001 | ||
| Medicare | 176 (56.2) | 15197 (67.5) | |
| Medicaid | 21 (6.7) | 1245 (5.5) | |
| Private | 45 (14.4) | 2483 (11.0) | |
| HMO/PPO | 39 (12.5) | 2224 (9.9) | |
| Other/unknown | 32 (10.2) | 1380 (6.1) | |
| Discharge status | <0.001 | ||
| Home | 98 (31.3) | 9507 (42.2) | |
| Short term care facility | 25 (8.0) | 1271 (5.6) | |
| Long term care facility | 62 (19.8) | 5400 (24.0) | |
| Alive, status unknown | 89 (28.4) | 4514 (20.0) | |
| Death | 28 (9.0) | 1218 (5.4) | |
| Unknown | 11 (3.5) | 619 (2.8) | |
| Comorbid conditions | |||
| Congestive heart failure | 48 (15.3) | 2769 (12.3) | 0.10 |
| Coronary artery disease | 49 (15.7) | 4082 (18.1) | 0.26 |
| Hypertension | 164 (52.4) | 12480 (55.4) | 0.29 |
| Diabetes mellitus | 42 (13.4) | 4965 (22.0) | <0.001 |
| Atrial fibrillation | 96 (30.7) | 4096 (18.2) | <0.001 |
| Intracranial hemorrhage | 17 (5.4) | 139 (0.6) | <0.001 |
| Charlson score14 (mean) | 2.48 [2.32‐2.64] | 2.38 [2.36‐2.40] | 0.23 |
After adjusting for patient and hospital characteristics, the absolute rate of thrombolysis administration increased by an average of 0.19% per year (95% CI, 0.12‐0.26%). Factors that were significantly associated with administration of thrombolytics included being hospitalized in a larger hospital, having a history of atrial fibrillation, and a higher Charlson comorbidity index (Table 2). Patients aged 80 years or older, African American patients, and those with diabetes mellitus were significantly less likely to receive thrombolysis.
| Characteristic | Adjusted OR (95% CI) |
|---|---|
| |
| Year (per year, from 2001 to 2006) | 1.2 (1.1‐1.3) |
| Age, years | |
| <60 | Referent |
| 60‐69 | 1.0 (0.7‐1.4) |
| 70‐79 | 0.6 (0.5‐0.9) |
| 80+ | 0.4 (0.3‐0.6) |
| Race | |
| Not African American | Referent |
| African‐American | 0.4 (0.3‐0.7) |
| Unknown | 1.0 (0.8‐1.2) |
| Hospital bedsize | |
| 6‐99 | Referent |
| 100‐199 | 1.7 (1.0‐3.1) |
| 200‐299 | 3.2 (1.8‐5.4) |
| 300+ | 3.3 (2.0‐5.6) |
| Diabetes mellitus | 0.5 (0.3‐0.6) |
| Atrial fibrillation | 2.2 (1.7‐2.9) |
| Charlson comorbidity score14 (per point increase) | 1.1 (1.1‐1.2) |
Discussion
Despite strong recommendations from guidelines and regulatory agencies, national rates of intravenous thrombolysis for ischemic stroke continue to be quite low overall. However, tPA administration appears to have increased from previous years and particularly increased in years after the Joint Commission began to accredit institutions as Primary Stroke Centers.11 The oldest patients and African Americans were less likely to receive thrombolytics, while patients with atrial fibrillation were more likely to receive thrombolysis, potentially related to atrial fibrillation causing more severe strokes.15 A total of 5.4% of patients who received tPA were diagnosed with intracranial hemorrhage, and the inpatient mortality rate of patients with tPA was 9.0%.
The exact optimal rate of thrombolysis administration for the patients in our study is unknown, as the NHDS database lacked detailed information on factors that would preclude tPA administration such as late timing of presentation and mild stroke symptoms.3 Studies conducted in stroke registries and regional settings have found that only approximately 15% to 32% of patients presenting with ischemic stroke arrive within 3 hours of symptom onset, and of these, only about 40% to 50% are eligible for tPA clinically.9, 10, 1619 However, even among presumed eligible patients, tPA administration rates only range between 25% and 43%,17, 19, 20 and the ideal rate is likely to be higher than the very low rates we observed in our study. Newer evidence that extending the time window where tPA may be given safely may increase the number of eligible patients.21
Patients who received thrombolysis had higher mortality rates than patients who did not. Although we were unable to determine a causal association, prior observational studies of tPA administration for acute stroke have found that patients with more severe neurologic deficits were more likely to receive thrombolysis.17, 18 The 9.0% inpatient case‐fatality rate observed in our study compares favorably to the 13.4% mortality rate after tPA reported in a post‐approval meta‐analysis of safety outcomes22 and the rate of intracranial hemorrhage in our analysis was similar to those observed in other settings.9, 2225 We were unable to determine whether intracranial hemorrhages in our study were as a result of tPA administration or whether patients who received tPA were more likely to have intracranial hemorrhages detected, such as may be due to increased frequency of head imaging.
Larger hospitals were more likely to administer tPA. This may reflect regionalization of stroke care, particularly in those designated as stroke centers of excellence. As well, there is some evidence that there is a learning curve with thrombolysis administration, where guideline‐recommended practice and use of tPA increases with additional experience with the drug.9, 26 Promoting systems that allow for rapid triage and diagnosis of acute stroke should be encouraged and hospital leaders should develop strategies that allow for early recognition of potential tPA candidates.
There are several limitations to our analysis. The NHDS does not collect detailed data on clinical or presenting features of stroke, and so we lacked information on stroke severity and eligibility for administration of thrombolysis. Our study may have underestimated the overall rates of thrombolysis, as it was dependent on diagnostic codes. A previous study of 34 patients who received tPA found that although the 99.10 code was 100% specific, the code identified only 17 patients who actually received tPA (sensitivity of 50%).20 Another study comparing Medicare administrative claims data to actual pharmacy billing charges for tPA found that administrative data underestimated the rate of tPA administration by approximately 25% to 30%.12 If a diagnostic code sensitivity of 50% was assumed, rates of tPA administration in our study may have been as high as 4.8% (95% CI, 4.1‐5.5%) by year 2006.
Conclusion
In conclusion, the use of intravenous thrombolysis in patients admitted with acute ischemic stroke in the United States has risen over time, but overall use remains very low. Further efforts to improve appropriate administration rates should be encouraged, particularly as the acceptable time‐window for using tPA widens.
Acknowledgements
The authors thank Mr. Loren Yglecias for his assistance with manuscript text and references.
- The National Institute of Neurological Disorders and Stroke rt‐PA Stroke Study Group.Tissue plasminogen activator for acute ischemic stroke.N Engl J Med.1995;333:1581–1587.
- ,,, et al.Effects of tissue plasminogen activator for acute ischemic stroke at one year. National Institute of Neurological Disorders and Stroke Recombinant Tissue Plasminogen Activator Stroke Study Group.N Engl J Med.1999;340:1781–1787.
- ,,, et al.Association of outcome with early stroke treatment: Pooled analysis of ATLANTIS, ECASS, and NINDS rT‐PA stroke trials.Lancet.2004;363:768–774.
- ,,, et al.Thrombolysis with alteplase for acute ischaemic stroke in the safe implementation of thrombolysis in stroke‐monitoring study (SITS‐MOST): An observational study.Lancet.2007;369:275–282.
- ,,, et al.Recommendations for the establishment of primary stroke centers.JAMA.2000;283:3102–3109.
- ,.Management of acute ischaemic stroke: new guidelines from the American Stroke Association and European Stroke Initiative.Lancet Neurol.2003;2:698–701.
- ,,, et al.Guidelines for the early management of adults with ischemic stroke: a guideline from the American Heart Association/American Stroke Association Stroke Council, Clinical Cardiology Council, Cardiovascular Radiology and Intervention council, and the Atherosclerotic Peripheral Vascular Disease and Quality of Care Outcomes in Research Interdisciplinary Working groups: The American Academy of Neurology affirms the value of this guideline as an educational tool for neurologists.Circulation.2007;115:e478–534.
- The Joint Commission Primary Stroke Center Certification. Available at: http://www.jointcommission.org/CertificationPrograms/PrimaryStrokeCenters. Accessed February 2010.
- ,,, et al.Use of tissue‐type plasminogen activator for acute ischemic stroke: The Cleveland area experience.JAMA.2000;283:1151–1158.
- California Acute Stroke Pilot Registry (CASPR) Investigators.Prioritizing interventions to improve rates of thrombolysis for ischemic stroke.Neurology.2005;64:654–659.
- ,,, et al.Thrombolysis for ischemic stroke in the united states: Data from National Hospital Discharge Survey 1999–2001.Neurosurgery.2005;57:647–654; discussion647–654.
- ,,,,.National US estimates of recombinant tissue plasminogen activator use: ICD‐9 codes substantially underestimate.Stroke.2008;39:924–928.
- US Department of Health and Human Services Public Health Service and National Center for Health Statistics.National Hospital Discharge Durvey 1991–2006. Multi‐year public‐use data file documentation.
- ,,.Adapting a clinical comorbidity index for use with ICD‐9‐CM administrative databases.J Clin Epidemiol.1992;45:613–619.
- ,,, et al.Stroke severity in atrial fibrillation. The Framingham study.Stroke.1996;27:1760–1764.
- ,,,,.Why are stroke patients excluded from tPA therapy? An analysis of patient eligibility.Neurology.2001;57:1739–1740.
- ,,,,,.Utilization of intravenous tissue plasminogen activator for acute ischemic stroke.Arch Neurol.2004;61:346–350.
- ,,, et al.Eligibility for recombinant tissue plasminogen activator in acute ischemic stroke: a population‐based study.Stroke.2004;35:27–29.
- ,,, et al.Tpa use for stroke in the registry of the Canadian stroke network.Can J Neurol Sci.2005;32:433–439.
- ,,, et al.Utilization of intravenous tissue‐type plasminogen activator for ischemic stroke at academic medical centers: the influence of ethnicity.Stroke.2001;32:1061–1068.
- ,,, et al.Number needed to treat to benefit and to harm for intravenous tissue plasminogen activator therapy in the 3‐ to 4.5‐hour window: Joint outcome table analysis of the ECASS 3 trial.Stroke.2009;40:2433–2437.
- .Tissue plasminogen activator for acute ischemic stroke in clinical practice: a meta‐analysis of safety data.Stroke.2003;34:2847–2850.
- ,,, et al.Early intravenous thrombolysis for acute ischemic stroke in a community‐based approach.Stroke.1998;29:1544–1549.
- ,,, et al.Factors associated with in‐hospital mortality after administration of thrombolysis in acute ischemic stroke patients: an analysis of the Nationwide Inpatient Sample 1999 to 2002.Stroke.2006;37:440–446.
- ,,, et al.Intravenous t‐PA for acute ischemic stroke: therapeutic yield of a stroke code system.Neurology.1998;50:501–503.
- ,,, et al.Intravenous tissue‐type plasminogen activator therapy for ischemic stroke: Houston experience 1996 to 2000.Arch Neurol.2001;58:2009–2013.
Copyright © 2010 Society of Hospital Medicine

Lack of Timely PCP Follow‐Up
Care transitions between the inpatient and outpatient settings are a known period of risk in a patient's care. For instance, 1 in 5 medical patients suffers an adverse event during the first several weeks after hospital discharge, with half of these requiring the use of additional healthcare resources.1 Additionally, medication and lab monitoring errors occur in up to half of all discharged patients.2 Nearly 1 in 5 hospitalized patients, admitted with 1 of 16 different conditions including asthma, diabetes, congestive heart failure and urinary tract infection is readmitted to the hospital within six months. Up to 60% of resources are used in rehospitalized patients.3, 4 In Medicare beneficiaries, the readmission rate is as high as 20% at 30 days. The same study suggests that up to half of Medicare patients readmitted within 30 days are not seen in the outpatient setting following discharge.5 Such statistics underscore the need for seamless post‐discharge care.
Studies of post‐discharge primary care provider (PCP) follow‐up highlight the gaps in current practice within the transition from the hospital to PCP follow‐up. For instance, while more than 1 in 4 discharged patients (27.6%) at one large teaching hospital had outpatient work‐ups recommended by their hospital physicians, more than a third (35.9%) of these recommendations were ultimately not completed. Furthermore, at this same center, an increased time interval between hospital discharge and PCP follow‐up decreased the likelihood that a work‐up recommended by a hospital physician was completed.6 In patients who do have a PCP, post‐hospitalization follow‐up is frequently impacted by a variety of factors, including co‐payment requirements, transportation issues, lack of health insurance, as well as scheduling a follow‐up appointment while in the hospital.710 Uninsured patients are at particular risk for failures in transitions, have poorer health outcomes and higher mortality than insured counterparts, and are nearly 3 times more likely to make an ED visit following hospital discharge.1113
In order to better understand the role of post‐discharge PCP follow‐up, we sought to identify: (1) the percentage of general medical inpatients lacking timely PCP follow‐up after discharge from the hospital, and (2) the impact of patients lacking timely PCP follow‐up on 30‐day readmission rate and hospital length of stay (LOS). For the purposes of this study, we have defined timely PCP follow up as occurring within 4 weeks of hospital discharge.
Methods
Study Setting and Population
This prospective cohort enrolled a convenience sample of patients admitted to Internal Medicine ward teams at the University of Colorado Hospital Anschutz Inpatient Pavilion between December 2007 and March 2008. Up to 2 patients were enrolled on weekdays on the morning following admission (ie, Sunday night through Thursday night admissions). Patients were screened for study entry if they were able to participate in an interview as identified by their medical team and available in their room. Of a total of 121 patients screened for study entry by a professional research assistant (PRA), 75 ultimately provided HIPAA authorization, informed consent, and completed the in‐hospital interview. The most common reasons for screened patients refusing study enrollment included being not interested (26) and too ill (10). Ten subjects were lost to follow‐up after hospital discharge, including one subject who was deceased. Therefore, 65 patients successfully completed the follow‐up phone interview and were included in the analyses. Characteristics of the 121 screened patients and the 75 study patients were similar with respect to sex, age, race, and payer mix, and representative of the demographics of the patient population at large. Case mix indices (mean) were similar among the 121 screened (1.23), 75 enrolled (1.27), and final 65 study patients (1.25).
Exclusion Criteria
Patients admitted to the medical observation unit; patients admitted at night who are ultimately reassigned to specialty services (Oncology, Cardiology, Hepatology and Acute Care for the Elderly) were excluded. Human immunodeficiency virus (HIV) patients were excluded because of routine outpatient ID follow‐up; patients <18 years of age; patients lacking a telephone; patients admitted on Friday and Saturday nights; and outside hospital transfers.
Measures
The primary study outcome was the rate of timely PCP follow‐up defined as that occurring within 4 weeks of hospital discharge. PCP was defined in this study as either a patient's known PCP (or another provider in the same clinic), or a nurse practitioner/physician assistant. Patients seen in follow‐up by a specialist related to the discharge diagnosis, eg, an Endocrinologist in a patient hospitalized for Diabetic complications; a Rheumatologist following up an SLE patient, etc., were also counted as having PCP follow‐up as defined in this study.
Additional outcomes included three measures of hospital readmission: hospital readmission for same condition; hospital readmission or other care sought (ie, ED, Urgent Care) for same condition; and hospital readmission for any condition, and index hospital LOS. The distinction between same condition and any condition was made in an attempt to delineate a potentially preventable readmission (as an example, one study patient was subsequently readmitted with a gunshot injury that clearly would not have been affected by the presence of any PCP follow‐up). Determination of same vs. any condition was made by the investigators through information obtained from patients on follow‐up phone interviews: Have you been readmitted to the University Hospital or another hospital since your discharge last month from the University Hospital? If yes: where, when, and why? The investigators determined same vs. any through comparing this information to the primary diagnosis from the index hospitalization obtained from the final discharge documentation. A condition was considered same if the readmission was for the same condition or for treatment/complications related to the index hospitalized condition.
Descriptive data collected included patient demographics, diagnoses, insurance status, presence of an identified, established PCP, time to PCP follow‐up in weeks, effects of payer source, admitting service (hospitalist vs. General Internal Medicine (GIM) attending), and nature of presenting illness (acute vs. acute on chronic condition). Categories of insurance obtained from chart review included commercial, self‐pay (uninsured), Medicare, Medicaid and Veterans.
Data Collection
A PRA screened and obtained informed consent and a Health Insurance Portability and Accountability Act (HIPAA) waiver from patients the day following admission. At that time, the PRA obtained the patients' vital information from chart review and a scripted patient interview: age, sex, PCP, categories of insurance, contact phone numbers, and admitting date and diagnoses. The in‐house interview included eight questions examining a patient's experiences of and attitudes toward PCPs. Four weeks after discharge, patients were contacted by the PRA via telephone. Scripted telephone interviews were used to determine occurrence and timing of PCP follow‐up and hospital readmission status (to any hospital) per patient self‐report. Potential barriers to PCP follow‐up were assessed. Up to 3 attempts were made to contact study subjects out to 4 weeks from the initial call (8 weeks total). If an appointment for an enrolled patient had been made, but had not yet occurred, an additional phone call was made 2 weeks later to determine whether, and when, the appointment was kept. Review of discharge summaries determined a patient's hospital LOS.
Data Analysis
Descriptive statistics were calculated for the study population. Univariate comparisons were completed for patient characteristics and study outcomes for patients with and without PCP follow‐up. We used t‐tests for continuous variables (age and LOS) and chi‐square or Fisher's exact tests when necessary for dichotomous variables (gender, uninsured vs. insured, and all hospital readmission outcomes). Comparisons according to PCP follow‐up for the categorical variables were tested with the Cochran‐Mantel‐Haenszel statistic for general association (race and insurance category) or for trends in the ordinal variable (education).
Patient characteristics and study outcomes with univariate P value < 0.1 were assessed for inclusion in the multivariate logistic regression models. Separate logistic regression models were examined with PCP follow‐up (yes/no) as the explanatory variable and the 3 hospital readmission rates as the outcomes. Final logistic regression models included the primary predictor, PCP follow‐up, along with potential predictor variables with P value < 0.05. Statistical analyses were carried out using SAS version 9.2 (SAS Institute, Cary, NC).
This protocol was approved by the Colorado Multiple Institutional Review Board (COMIRB) prior to the implemented study.
Results
Sixty‐five patients completed this study. The mean age of the study population was 55.3 years and approximately half (52.3%) of the study participants were female. Fifty‐two subjects reported having an established PCP on admission to the hospital (80%). The rate of timely PCP follow‐up overall was 49.2%. Table 1 shows the study population characteristics stratified by presence of timely PCP follow‐up. Patients lacking timely PCP follow‐up were much younger (48.4 vs. 62.4 years; P < 0.001) than those with timely PCP follow‐up; there were also non‐significant trends toward patients lacking timely PCP follow‐up being non‐white: (33.3% vs. 25%, P = 0.23) and having lower education level (72.7% with high school or lower education vs. 56.2% for those with PCP follow‐up, P = 0.15) than those with timely PCP follow‐up. Of the 32 patients having timely PCP follow‐up, 15.6% were uninsured. In comparison, among the 33 patients lacking timely PCP follow‐up after hospital discharge, over a third (36%) were uninsured (P = 0.06). Among the uninsured, a large majority (70.5%) lacked timely PCP follow‐up (P = 0.06). In contrast, only 11 of the 26 Medicare patients (42.3%) lacked timely PCP follow‐up (P = 0.13).
| Study Demographics | Timely PCP Follow‐Up (n = 32) | No PCP Follow‐Up (n = 33) | P Value |
|---|---|---|---|
| |||
| Female, n (%) | 17 (53.1) | 17 (51.5) | 0.90 |
| Age, years, mean (SD) | 62.4 | 48.4 | <0.001 |
| Race, n (%) | |||
| Caucasian | 24 (75.0) | 23 (69.7) | 0.23 |
| African American | 7 (21.9) | 5 (15.2) | |
| Hispanic/Latino | 1 (3.1) | 5 (15.2) | |
| Highest grade completed, n (%) | |||
| Grammar school | 2 (6.3) | 3 (9.1) | 0.15 |
| High school | 16 (50.0) | 21 (63.6) | |
| College | 13 (40.6) | 9 (27.3) | |
| Postgraduate | 1 (3.1) | 0 (0) | |
| Insurance*, n (%) | |||
| Medicare | 15 (46.9) | 11 (33.3) | 0.13 |
| Medicaid | 1 (3.1) | 3 (9.1) | |
| Commercial/private | 6 (18.8) | 6 (18.2) | |
| VA/Tri‐Care | 5 (15.6) | 1 (3.0) | |
| Self‐pay/uninsured | 5 (15.6) | 12 (36.4) | 0.06 |
| Case mix index, median | 1.15 | 1.11 | |
Readmissions
The 30‐day readmission rates for all study subjects were 12.3% for a patient's same medical condition, 17.2% for readmission or other care sought for the same condition, and 21.5% for any condition. Table 2 contains univariate comparisons for the patient outcomes of readmission and LOS stratified by timely PCP follow‐up. Hospital readmission for the same medical condition was significantly higher in patients lacking timely PCP follow‐up compared to those with timely PCP follow‐up (21.2% vs. 3.1%, P = 0.05). The composite outcome of hospital readmission and/or other care sought (emergency department or urgent care) for a patient's same condition was also significantly higher in patients lacking timely PCP follow‐up (28.1% vs. 6.3%; P = 0.02). However, hospital readmission for any condition did not differ with absence of timely PCP follow‐up.
| Outcome | Timely PCP Follow‐Up (n = 32) | No PCP Follow‐Up (n = 33) | P Value |
|---|---|---|---|
| |||
| Length of stay (days), mean (SD) | 4.4 (3.7) | 6.3 (5.2) | 0.11 |
| Hospital readmission for same condition within 30‐days of discharge, n (%) | 1 (3.1) | 7 (21.2) | 0.05 |
| Hospital readmission or other care sought (ie, ED, urgent care) for same condition within 30‐days of discharge, n (%) | 2 (6.3) | 9 (28.1)* | 0.02 |
| Hospital readmission for any condition within 30‐days of discharge, n (%) | 5 (15.6) | 9 (27.3) | 0.25 |
Multiple logistic regression revealed that patients lacking timely PCP follow‐up were 10 times more likely to be readmitted for the same condition within 30 days of hospital discharge (odds ratio [OR] = 9.9; P = 0.04) and nearly seven times as likely to be readmitted for the same condition or receive other care (OR = 6.8, P = 0.02) (Table 3).
| Outcome | Odds Ratio (CI) | P Value |
|---|---|---|
| ||
| Hospital readmission for same condition | 9.9 (1.2‐84.7) | 0.04 |
| Hospital readmission or other care for same condition | 6.8 (1.4‐34.3) | 0.02 |
| Hospital readmission for any condition | 2.3 (0.7‐7.9) | 0.17 |
LOS
Overall hospital LOS in all patients was 5.4 4.6 days. In patients lacking timely PCP follow‐up, there was a trend toward longer hospital LOS: 6.3 days vs. 4.4 days, P = 0.11. For all uninsured study patients (17), the mean LOS was 6.4 days vs. 5.0 days for all other insurance categories, P = 0.31.
Insurance Status
Being uninsured was associated with a patient lacking timely PCP follow‐up (P = 0.06), but was not directly associated with higher readmission or longer hospital LOS (OR = 1.0, P = 0.96). The lack of insurance was not a significant predictor of hospital readmission in the multiple logistic regression models.
Timing of PCP Follow‐Up
In evaluating timing of any PCP follow‐up after hospital discharge and clinical outcomes, most PCP follow‐up (90.6%) occurred within the first 2 weeks following hospital discharge. However, we found no statistical difference between timing of post‐discharge PCP follow‐up and hospital readmission outcomes (hospital readmission for same reason, P = 0.51; hospital readmission or other care sought for same reason, P = 0.89), or in hospital LOS (P = 0.87). Timing of PCP follow‐upwhen comparing post‐hospitalization follow‐up <1 week, 1 to 2 weeks, and 2 to 4 weekswas not predictive of readmission rates or LOS.
Established PCP
When significance of having an established PCP prior to hospital admission was evaluated, 52 patients reported having an established PCP on hospital admission (80%), half of whom were Medicare patients. Of the 13 patients with no PCP on admission, the majority (10) were self‐pay (77%, P < 0.0001). Interestingly, only 29 (55.8%) of the patients who reported a PCP on admission to the hospital saw their PCP within 4 weeks of hospital discharge. Of 13 patients without a PCP on admission, only 3 obtained 4‐week PCP follow‐up. When we examined our study outcomes for subjects stratified by the presence of an established PCP prior to hospitalization, we found univariate association with timely post‐discharge PCP follow‐up (56% of those with established PCP vs. 23% of those without, P = 0.04), but no difference in readmission rates or hospital LOS.
Severity of patient illnessmeasured using hospital data and the case mix index (CMI)of the 3 patient populations (screened, enrolled, final) was quite similar. The CMI (mean) for the 121 screened patients was 1.23. The CMI for the 75 enrolled patients was 1.27. And the CMI in the 65 final study patients was 1.25. When evaluating illness severity (CMI) of patients in relation to hospital LOS between the 2 final study populations, the CMI (median) was also similar: 1.15 for the 32 patients with timely PCP follow‐up vs. 1.11 for the 33 patients without timely PCP follow‐up.
We found no association when looking at the rate of timely PCP follow‐up based on admitting service attending, or acute vs. acute on chronic diagnosis.
Barriers to PCP follow‐up most frequently cited by study patients were: lacking a PCP (no established PCP prior to hospital, no insurance, out of town, recently changed insurance), could not get an appointment, discharged to a half‐way house, and saw another doctor (specialist unrelated to discharge diagnosis).
Discussion
A growing body of work highlights the role of multiple, varied interventions at, or following discharge, in improving outcomes during the transition from inpatient to outpatient care. Examples include care coordination by advanced nurse practitioners, follow‐up pharmacist phone calls, and involvement of a transition coach encouraging active patient involvementall are known to improve patient outcomes following a hospitalization.1418 The active involvement of a PCP is central to a number of these proven interventions to ensure effective completion of ongoing patient care. And while some previous studies suggest increased overall resource utilization when PCP follow‐up occurs after hospitalization,19 the level of fragmented care that occurs in today's hospitalized patient, as well as the fact many patients lack PCP care at all, raises questions about clinical outcomes after hospitalization related to timely PCP follow‐up. The issue of appropriateness of resources utilized has also not been adequately explored.
Within this context, this study examines the role that PCP follow‐up might play in such interventions and its' effects on patient outcomes. Notably, in this urban academic medical center, we found that timely PCP follow‐up after hospital discharge occurred in fewer than half of general medical inpatients. Lack of timely PCP follow‐up was associated with increased hospital readmission for the same condition and a trend toward a longer index hospital LOS.
While this small study cannot fully elucidate the impact of lack of timely PCP follow‐up on post‐discharge care, our findings suggest some mechanisms by which lack of timely PCP follow‐up might result in poor outcomes. For instance, patients lacking a PCP visit after discharge may not obtain needed follow‐up care in the post‐discharge period, leading to clinical deterioration and hospital readmission. Uninsured patients may be at particular risk for failed transition because they are less likely to have consistent PCP access, whether as an already established patient or one newly assigned.20, 21 Perhaps a larger study would better demonstrate statistical significance in reflecting the association between uninsured patients, lack of a PCP, and post‐discharge follow‐up deficiencies. There may, in fact, be issues related to patient attitudes and beliefs, such as subjectively feeling better or even an implicit distrust of the healthcare system among the uninsured, that exist as well. Even among patients with a PCP prior to hospitalization, PCP follow‐up after hospital discharge may be lacking due to modifiable factors such as patient attitudes and beliefs and logistical barriers in arranging follow‐up.
Patients without potential for timely PCP follow‐up might be kept in the hospital longer to ensure they are well enough medically to sufficiently meet their own follow‐up needs. Hospital LOS might be increased by providers to compensate for the lack of PCP follow‐up. Alternatively, these patients may be sicker with their index hospitalization.
It is not surprising that payer source appears to influence a patients' ability to obtain timely PCP follow‐up. It is well documented that uninsured patients have higher healthcare resource utilization.2224 Lack of access to primary care in such patients contributes to a cycle of using the most expensive sites of care. In our study, we found many of the patients lacking timely PCP follow‐up were younger, perhaps reflecting the same patient population who have higher rates of being uninsured. Conversely, older patients are more likely to have PCP access, in large part due to having Medicare benefits (although this dynamic has shown a shift in recent years). The uninsured may present sicker as a result of lacking pre‐hospital PCP access or transportation to a PCP visit.
Limitations
This study was performed at a single, academic institution limiting its' generalizability. In addition, this small cohort study, which took place over four winter months, may have implicit biases toward certain disease entities and follow‐up issues unique to study size and season. The small study size was dictated by a finite amount of available resources, potentially contributing to minor inconsistencies with some of the results. While statistical significance was still seen with many of our results, a much larger study may better enhance the study outcomes.
It also remains unclear why the effects of PCP follow‐up were evident for a patient's same condition, but not for any condition. The distinction between designations is potentially subjective and may be difficult to accurately determine. Most existing readmission studies in the literature assign readmission for any condition. A future, larger study may be able to examine whether this difference exists between same vs. any condition.
As an academic medical center, access to specialty clinics may be facilitated, thus increasing PCP follow‐up in patients who might otherwise not have it available to them. Additionally, our subjects were limited to a convenience sample of the population of the general medicine wards and may not be representative of all medical inpatients. Patients lacking a telephone were missed. We relied on patient recollection and self‐report of PCP follow‐up visits and re‐hospitalizations. While we acknowledge limitations of patient self‐report, both in communication and comprehension, we believe patients are reasonably able to report on whether or not they were readmitted to the hospital, the cause of their readmission and whether/when they had PCP follow‐up. Patient self‐report could be collected systematically and without long time lags. Finally, the research team did not have reliable access to readmission data for hospitals other than the facility in which the study was conducted.
It is possible patients readmitted early after discharge may have been counted as lacking PCP follow‐up simply because the readmission occurred so soon after discharge precluding the opportunity for PCP follow‐up to occur. The effects of patients having non‐PCP (home health nurse, pharmacist, phone advice) follow‐up after hospital discharge were not examined.
Also, LOS and readmission to a hospital may be more a reflection of disease severity than the absence of PCP follow‐up, ie, patients ultimately readmitted after hospital discharge may have been a sicker subset of patients upon index hospitalization.
In this urban academic medical center, discharged medicine patients commonly lack timely PCP follow‐up. The lack of timely PCP follow‐up after hospital discharge was associated with higher rates of readmission and a non‐significant trend toward longer hospital lengths of stay. Hospital discharge represents a period of significant risk in patient care necessitating the effective continuation of treatment plans including follow‐up of laboratory, radiology or other testing, and management by a variety of providers. PCPs may play a crucial role in care coordination during this period. Structured intervention performed at the time of discharge might increase post‐hospital PCP access and facilitate timely PCP follow‐up to ensure continuity of needed care after hospital discharge in the most vulnerable patients. Such interventions might include systems improvements, such as increasing PCP access in the post‐hospital period, to increase the likelihood that complex needs are met at a vulnerable period in patient care.
A more effective handoff between inpatient and outpatient settings may ultimately improve clinical outcomes, diminish resource utilization, and decrease overall healthcare costs.
Acknowledgements
The authors thank Traci Yamashita and Karen Mellis, Professional Research Assistants.
- , , , .The incidence and severity of adverse events affecting patients after discharge from the hospital.Ann Intern Med.2003;13:161–167.
- , , , .Medical errors related to discontinuity of care from an inpatient to outpatient setting.J Gen Intern Med.200318:646–651.
- , .The high cost users of medical care.N Engl J Med.1980;302:996–1002.
- , .The rate and cost of hospital readmissions for preventable conditions.Med Care Res Rev.2004;61:225–240.
- , , .Rehospitalizations among patients in the medicare fee‐for‐service program.N Engl J Med.2009;360;14:1418–1428.
- , , .Tying up loose ends. Discharging patients with unresolved medical issues.Arch Intern Med.2007;167:1305–1311.
- , .Post‐hospitalization followup appointment‐keeping among the medically indigent.J Community Health.1993;18(5):271–282.
- , , .Factors related to the keeping of appointments by indigent clients.J Health Care Poor Underserved.1993;4(1):21–39.
- , , , , , .Inpatient to outpatient transfer of diabetes care: perceptions of barriers to postdischarge followup in urban African American patients.Ethn Dis.2007;17(2):238–243.
- , , .Effect of a nurse case manager on postdischarge follow‐up.J Gen Intern Med.1996v;11(11):684–688.
- , , .Emergency department visits by persons recently discharges from U.S. hospitals.Natl Health Stat Report.2008;(6):1–9.
- , , .Comparing uninsured and privately insured hospital patients: admission severity, health outcomes and resource use.Health Serv Manage Res.2001;14(3):203–210.
- , , .Comparison of uninsured and privately insured hospital patients. Condition on admission, resource use, and outcome.JAMA.1991;265(3):374–379.
- , , .Effect of a nurse case manager on postdischarge follow‐up.J Gen Intern Med.1996;11:684–688.
- , , , .The care transitions intervention: results of a randomized controlled trial.Arch Intern Med.2006;166(17):1822–1828.
- , , , , , .A multidisciplinary intervention to prevent the readmission of elderly patients with congestive heart failure.N Engl J Med.1995;333:1190–1195.
- , , , .Continuity of care and patient outcomes after hospital discharge.J Gen Intern Med.2004;19:624–631.
- , , , et al.A reengineered hospital discharge program to decrease rehospitalization.Ann Intern Med.2009;150:178–187.
- , , .Does increased access to primary care reduce hospital readmissions?N Engl J Med.1996;334:1441–1447.
- , .Health insurance and access to health care in the united states.Ann NY Acad Sci.1008;1136:149–160.
- , .2006.Summary health statistics for U.S. adults: National Health Interview Survey. 2005, NCHS/CDC/USDHHS, Vital Health Statistics, Series 10.
- , , .Emergency department visits by persons recently discharges from U.S. hospitals.Natl Health Stat Report.2008;(6):1–9.
- , , .Comparison of uninsured and privately insured hospital patients. Condition on admission, resource use, and outcome.JAMA.1991;265(3):374–379.
- , , .Comparing uninsured and privately insured hospital patients: admission severity, health outcomes and resource use.Health Serv Manage Res.2001;14(3):203–210.
Care transitions between the inpatient and outpatient settings are a known period of risk in a patient's care. For instance, 1 in 5 medical patients suffers an adverse event during the first several weeks after hospital discharge, with half of these requiring the use of additional healthcare resources.1 Additionally, medication and lab monitoring errors occur in up to half of all discharged patients.2 Nearly 1 in 5 hospitalized patients, admitted with 1 of 16 different conditions including asthma, diabetes, congestive heart failure and urinary tract infection is readmitted to the hospital within six months. Up to 60% of resources are used in rehospitalized patients.3, 4 In Medicare beneficiaries, the readmission rate is as high as 20% at 30 days. The same study suggests that up to half of Medicare patients readmitted within 30 days are not seen in the outpatient setting following discharge.5 Such statistics underscore the need for seamless post‐discharge care.
Studies of post‐discharge primary care provider (PCP) follow‐up highlight the gaps in current practice within the transition from the hospital to PCP follow‐up. For instance, while more than 1 in 4 discharged patients (27.6%) at one large teaching hospital had outpatient work‐ups recommended by their hospital physicians, more than a third (35.9%) of these recommendations were ultimately not completed. Furthermore, at this same center, an increased time interval between hospital discharge and PCP follow‐up decreased the likelihood that a work‐up recommended by a hospital physician was completed.6 In patients who do have a PCP, post‐hospitalization follow‐up is frequently impacted by a variety of factors, including co‐payment requirements, transportation issues, lack of health insurance, as well as scheduling a follow‐up appointment while in the hospital.710 Uninsured patients are at particular risk for failures in transitions, have poorer health outcomes and higher mortality than insured counterparts, and are nearly 3 times more likely to make an ED visit following hospital discharge.1113
In order to better understand the role of post‐discharge PCP follow‐up, we sought to identify: (1) the percentage of general medical inpatients lacking timely PCP follow‐up after discharge from the hospital, and (2) the impact of patients lacking timely PCP follow‐up on 30‐day readmission rate and hospital length of stay (LOS). For the purposes of this study, we have defined timely PCP follow up as occurring within 4 weeks of hospital discharge.
Methods
Study Setting and Population
This prospective cohort enrolled a convenience sample of patients admitted to Internal Medicine ward teams at the University of Colorado Hospital Anschutz Inpatient Pavilion between December 2007 and March 2008. Up to 2 patients were enrolled on weekdays on the morning following admission (ie, Sunday night through Thursday night admissions). Patients were screened for study entry if they were able to participate in an interview as identified by their medical team and available in their room. Of a total of 121 patients screened for study entry by a professional research assistant (PRA), 75 ultimately provided HIPAA authorization, informed consent, and completed the in‐hospital interview. The most common reasons for screened patients refusing study enrollment included being not interested (26) and too ill (10). Ten subjects were lost to follow‐up after hospital discharge, including one subject who was deceased. Therefore, 65 patients successfully completed the follow‐up phone interview and were included in the analyses. Characteristics of the 121 screened patients and the 75 study patients were similar with respect to sex, age, race, and payer mix, and representative of the demographics of the patient population at large. Case mix indices (mean) were similar among the 121 screened (1.23), 75 enrolled (1.27), and final 65 study patients (1.25).
Exclusion Criteria
Patients admitted to the medical observation unit; patients admitted at night who are ultimately reassigned to specialty services (Oncology, Cardiology, Hepatology and Acute Care for the Elderly) were excluded. Human immunodeficiency virus (HIV) patients were excluded because of routine outpatient ID follow‐up; patients <18 years of age; patients lacking a telephone; patients admitted on Friday and Saturday nights; and outside hospital transfers.
Measures
The primary study outcome was the rate of timely PCP follow‐up defined as that occurring within 4 weeks of hospital discharge. PCP was defined in this study as either a patient's known PCP (or another provider in the same clinic), or a nurse practitioner/physician assistant. Patients seen in follow‐up by a specialist related to the discharge diagnosis, eg, an Endocrinologist in a patient hospitalized for Diabetic complications; a Rheumatologist following up an SLE patient, etc., were also counted as having PCP follow‐up as defined in this study.
Additional outcomes included three measures of hospital readmission: hospital readmission for same condition; hospital readmission or other care sought (ie, ED, Urgent Care) for same condition; and hospital readmission for any condition, and index hospital LOS. The distinction between same condition and any condition was made in an attempt to delineate a potentially preventable readmission (as an example, one study patient was subsequently readmitted with a gunshot injury that clearly would not have been affected by the presence of any PCP follow‐up). Determination of same vs. any condition was made by the investigators through information obtained from patients on follow‐up phone interviews: Have you been readmitted to the University Hospital or another hospital since your discharge last month from the University Hospital? If yes: where, when, and why? The investigators determined same vs. any through comparing this information to the primary diagnosis from the index hospitalization obtained from the final discharge documentation. A condition was considered same if the readmission was for the same condition or for treatment/complications related to the index hospitalized condition.
Descriptive data collected included patient demographics, diagnoses, insurance status, presence of an identified, established PCP, time to PCP follow‐up in weeks, effects of payer source, admitting service (hospitalist vs. General Internal Medicine (GIM) attending), and nature of presenting illness (acute vs. acute on chronic condition). Categories of insurance obtained from chart review included commercial, self‐pay (uninsured), Medicare, Medicaid and Veterans.
Data Collection
A PRA screened and obtained informed consent and a Health Insurance Portability and Accountability Act (HIPAA) waiver from patients the day following admission. At that time, the PRA obtained the patients' vital information from chart review and a scripted patient interview: age, sex, PCP, categories of insurance, contact phone numbers, and admitting date and diagnoses. The in‐house interview included eight questions examining a patient's experiences of and attitudes toward PCPs. Four weeks after discharge, patients were contacted by the PRA via telephone. Scripted telephone interviews were used to determine occurrence and timing of PCP follow‐up and hospital readmission status (to any hospital) per patient self‐report. Potential barriers to PCP follow‐up were assessed. Up to 3 attempts were made to contact study subjects out to 4 weeks from the initial call (8 weeks total). If an appointment for an enrolled patient had been made, but had not yet occurred, an additional phone call was made 2 weeks later to determine whether, and when, the appointment was kept. Review of discharge summaries determined a patient's hospital LOS.
Data Analysis
Descriptive statistics were calculated for the study population. Univariate comparisons were completed for patient characteristics and study outcomes for patients with and without PCP follow‐up. We used t‐tests for continuous variables (age and LOS) and chi‐square or Fisher's exact tests when necessary for dichotomous variables (gender, uninsured vs. insured, and all hospital readmission outcomes). Comparisons according to PCP follow‐up for the categorical variables were tested with the Cochran‐Mantel‐Haenszel statistic for general association (race and insurance category) or for trends in the ordinal variable (education).
Patient characteristics and study outcomes with univariate P value < 0.1 were assessed for inclusion in the multivariate logistic regression models. Separate logistic regression models were examined with PCP follow‐up (yes/no) as the explanatory variable and the 3 hospital readmission rates as the outcomes. Final logistic regression models included the primary predictor, PCP follow‐up, along with potential predictor variables with P value < 0.05. Statistical analyses were carried out using SAS version 9.2 (SAS Institute, Cary, NC).
This protocol was approved by the Colorado Multiple Institutional Review Board (COMIRB) prior to the implemented study.
Results
Sixty‐five patients completed this study. The mean age of the study population was 55.3 years and approximately half (52.3%) of the study participants were female. Fifty‐two subjects reported having an established PCP on admission to the hospital (80%). The rate of timely PCP follow‐up overall was 49.2%. Table 1 shows the study population characteristics stratified by presence of timely PCP follow‐up. Patients lacking timely PCP follow‐up were much younger (48.4 vs. 62.4 years; P < 0.001) than those with timely PCP follow‐up; there were also non‐significant trends toward patients lacking timely PCP follow‐up being non‐white: (33.3% vs. 25%, P = 0.23) and having lower education level (72.7% with high school or lower education vs. 56.2% for those with PCP follow‐up, P = 0.15) than those with timely PCP follow‐up. Of the 32 patients having timely PCP follow‐up, 15.6% were uninsured. In comparison, among the 33 patients lacking timely PCP follow‐up after hospital discharge, over a third (36%) were uninsured (P = 0.06). Among the uninsured, a large majority (70.5%) lacked timely PCP follow‐up (P = 0.06). In contrast, only 11 of the 26 Medicare patients (42.3%) lacked timely PCP follow‐up (P = 0.13).
| Study Demographics | Timely PCP Follow‐Up (n = 32) | No PCP Follow‐Up (n = 33) | P Value |
|---|---|---|---|
| |||
| Female, n (%) | 17 (53.1) | 17 (51.5) | 0.90 |
| Age, years, mean (SD) | 62.4 | 48.4 | <0.001 |
| Race, n (%) | |||
| Caucasian | 24 (75.0) | 23 (69.7) | 0.23 |
| African American | 7 (21.9) | 5 (15.2) | |
| Hispanic/Latino | 1 (3.1) | 5 (15.2) | |
| Highest grade completed, n (%) | |||
| Grammar school | 2 (6.3) | 3 (9.1) | 0.15 |
| High school | 16 (50.0) | 21 (63.6) | |
| College | 13 (40.6) | 9 (27.3) | |
| Postgraduate | 1 (3.1) | 0 (0) | |
| Insurance*, n (%) | |||
| Medicare | 15 (46.9) | 11 (33.3) | 0.13 |
| Medicaid | 1 (3.1) | 3 (9.1) | |
| Commercial/private | 6 (18.8) | 6 (18.2) | |
| VA/Tri‐Care | 5 (15.6) | 1 (3.0) | |
| Self‐pay/uninsured | 5 (15.6) | 12 (36.4) | 0.06 |
| Case mix index, median | 1.15 | 1.11 | |
Readmissions
The 30‐day readmission rates for all study subjects were 12.3% for a patient's same medical condition, 17.2% for readmission or other care sought for the same condition, and 21.5% for any condition. Table 2 contains univariate comparisons for the patient outcomes of readmission and LOS stratified by timely PCP follow‐up. Hospital readmission for the same medical condition was significantly higher in patients lacking timely PCP follow‐up compared to those with timely PCP follow‐up (21.2% vs. 3.1%, P = 0.05). The composite outcome of hospital readmission and/or other care sought (emergency department or urgent care) for a patient's same condition was also significantly higher in patients lacking timely PCP follow‐up (28.1% vs. 6.3%; P = 0.02). However, hospital readmission for any condition did not differ with absence of timely PCP follow‐up.
| Outcome | Timely PCP Follow‐Up (n = 32) | No PCP Follow‐Up (n = 33) | P Value |
|---|---|---|---|
| |||
| Length of stay (days), mean (SD) | 4.4 (3.7) | 6.3 (5.2) | 0.11 |
| Hospital readmission for same condition within 30‐days of discharge, n (%) | 1 (3.1) | 7 (21.2) | 0.05 |
| Hospital readmission or other care sought (ie, ED, urgent care) for same condition within 30‐days of discharge, n (%) | 2 (6.3) | 9 (28.1)* | 0.02 |
| Hospital readmission for any condition within 30‐days of discharge, n (%) | 5 (15.6) | 9 (27.3) | 0.25 |
Multiple logistic regression revealed that patients lacking timely PCP follow‐up were 10 times more likely to be readmitted for the same condition within 30 days of hospital discharge (odds ratio [OR] = 9.9; P = 0.04) and nearly seven times as likely to be readmitted for the same condition or receive other care (OR = 6.8, P = 0.02) (Table 3).
| Outcome | Odds Ratio (CI) | P Value |
|---|---|---|
| ||
| Hospital readmission for same condition | 9.9 (1.2‐84.7) | 0.04 |
| Hospital readmission or other care for same condition | 6.8 (1.4‐34.3) | 0.02 |
| Hospital readmission for any condition | 2.3 (0.7‐7.9) | 0.17 |
LOS
Overall hospital LOS in all patients was 5.4 4.6 days. In patients lacking timely PCP follow‐up, there was a trend toward longer hospital LOS: 6.3 days vs. 4.4 days, P = 0.11. For all uninsured study patients (17), the mean LOS was 6.4 days vs. 5.0 days for all other insurance categories, P = 0.31.
Insurance Status
Being uninsured was associated with a patient lacking timely PCP follow‐up (P = 0.06), but was not directly associated with higher readmission or longer hospital LOS (OR = 1.0, P = 0.96). The lack of insurance was not a significant predictor of hospital readmission in the multiple logistic regression models.
Timing of PCP Follow‐Up
In evaluating timing of any PCP follow‐up after hospital discharge and clinical outcomes, most PCP follow‐up (90.6%) occurred within the first 2 weeks following hospital discharge. However, we found no statistical difference between timing of post‐discharge PCP follow‐up and hospital readmission outcomes (hospital readmission for same reason, P = 0.51; hospital readmission or other care sought for same reason, P = 0.89), or in hospital LOS (P = 0.87). Timing of PCP follow‐upwhen comparing post‐hospitalization follow‐up <1 week, 1 to 2 weeks, and 2 to 4 weekswas not predictive of readmission rates or LOS.
Established PCP
When significance of having an established PCP prior to hospital admission was evaluated, 52 patients reported having an established PCP on hospital admission (80%), half of whom were Medicare patients. Of the 13 patients with no PCP on admission, the majority (10) were self‐pay (77%, P < 0.0001). Interestingly, only 29 (55.8%) of the patients who reported a PCP on admission to the hospital saw their PCP within 4 weeks of hospital discharge. Of 13 patients without a PCP on admission, only 3 obtained 4‐week PCP follow‐up. When we examined our study outcomes for subjects stratified by the presence of an established PCP prior to hospitalization, we found univariate association with timely post‐discharge PCP follow‐up (56% of those with established PCP vs. 23% of those without, P = 0.04), but no difference in readmission rates or hospital LOS.
Severity of patient illnessmeasured using hospital data and the case mix index (CMI)of the 3 patient populations (screened, enrolled, final) was quite similar. The CMI (mean) for the 121 screened patients was 1.23. The CMI for the 75 enrolled patients was 1.27. And the CMI in the 65 final study patients was 1.25. When evaluating illness severity (CMI) of patients in relation to hospital LOS between the 2 final study populations, the CMI (median) was also similar: 1.15 for the 32 patients with timely PCP follow‐up vs. 1.11 for the 33 patients without timely PCP follow‐up.
We found no association when looking at the rate of timely PCP follow‐up based on admitting service attending, or acute vs. acute on chronic diagnosis.
Barriers to PCP follow‐up most frequently cited by study patients were: lacking a PCP (no established PCP prior to hospital, no insurance, out of town, recently changed insurance), could not get an appointment, discharged to a half‐way house, and saw another doctor (specialist unrelated to discharge diagnosis).
Discussion
A growing body of work highlights the role of multiple, varied interventions at, or following discharge, in improving outcomes during the transition from inpatient to outpatient care. Examples include care coordination by advanced nurse practitioners, follow‐up pharmacist phone calls, and involvement of a transition coach encouraging active patient involvementall are known to improve patient outcomes following a hospitalization.1418 The active involvement of a PCP is central to a number of these proven interventions to ensure effective completion of ongoing patient care. And while some previous studies suggest increased overall resource utilization when PCP follow‐up occurs after hospitalization,19 the level of fragmented care that occurs in today's hospitalized patient, as well as the fact many patients lack PCP care at all, raises questions about clinical outcomes after hospitalization related to timely PCP follow‐up. The issue of appropriateness of resources utilized has also not been adequately explored.
Within this context, this study examines the role that PCP follow‐up might play in such interventions and its' effects on patient outcomes. Notably, in this urban academic medical center, we found that timely PCP follow‐up after hospital discharge occurred in fewer than half of general medical inpatients. Lack of timely PCP follow‐up was associated with increased hospital readmission for the same condition and a trend toward a longer index hospital LOS.
While this small study cannot fully elucidate the impact of lack of timely PCP follow‐up on post‐discharge care, our findings suggest some mechanisms by which lack of timely PCP follow‐up might result in poor outcomes. For instance, patients lacking a PCP visit after discharge may not obtain needed follow‐up care in the post‐discharge period, leading to clinical deterioration and hospital readmission. Uninsured patients may be at particular risk for failed transition because they are less likely to have consistent PCP access, whether as an already established patient or one newly assigned.20, 21 Perhaps a larger study would better demonstrate statistical significance in reflecting the association between uninsured patients, lack of a PCP, and post‐discharge follow‐up deficiencies. There may, in fact, be issues related to patient attitudes and beliefs, such as subjectively feeling better or even an implicit distrust of the healthcare system among the uninsured, that exist as well. Even among patients with a PCP prior to hospitalization, PCP follow‐up after hospital discharge may be lacking due to modifiable factors such as patient attitudes and beliefs and logistical barriers in arranging follow‐up.
Patients without potential for timely PCP follow‐up might be kept in the hospital longer to ensure they are well enough medically to sufficiently meet their own follow‐up needs. Hospital LOS might be increased by providers to compensate for the lack of PCP follow‐up. Alternatively, these patients may be sicker with their index hospitalization.
It is not surprising that payer source appears to influence a patients' ability to obtain timely PCP follow‐up. It is well documented that uninsured patients have higher healthcare resource utilization.2224 Lack of access to primary care in such patients contributes to a cycle of using the most expensive sites of care. In our study, we found many of the patients lacking timely PCP follow‐up were younger, perhaps reflecting the same patient population who have higher rates of being uninsured. Conversely, older patients are more likely to have PCP access, in large part due to having Medicare benefits (although this dynamic has shown a shift in recent years). The uninsured may present sicker as a result of lacking pre‐hospital PCP access or transportation to a PCP visit.
Limitations
This study was performed at a single, academic institution limiting its' generalizability. In addition, this small cohort study, which took place over four winter months, may have implicit biases toward certain disease entities and follow‐up issues unique to study size and season. The small study size was dictated by a finite amount of available resources, potentially contributing to minor inconsistencies with some of the results. While statistical significance was still seen with many of our results, a much larger study may better enhance the study outcomes.
It also remains unclear why the effects of PCP follow‐up were evident for a patient's same condition, but not for any condition. The distinction between designations is potentially subjective and may be difficult to accurately determine. Most existing readmission studies in the literature assign readmission for any condition. A future, larger study may be able to examine whether this difference exists between same vs. any condition.
As an academic medical center, access to specialty clinics may be facilitated, thus increasing PCP follow‐up in patients who might otherwise not have it available to them. Additionally, our subjects were limited to a convenience sample of the population of the general medicine wards and may not be representative of all medical inpatients. Patients lacking a telephone were missed. We relied on patient recollection and self‐report of PCP follow‐up visits and re‐hospitalizations. While we acknowledge limitations of patient self‐report, both in communication and comprehension, we believe patients are reasonably able to report on whether or not they were readmitted to the hospital, the cause of their readmission and whether/when they had PCP follow‐up. Patient self‐report could be collected systematically and without long time lags. Finally, the research team did not have reliable access to readmission data for hospitals other than the facility in which the study was conducted.
It is possible patients readmitted early after discharge may have been counted as lacking PCP follow‐up simply because the readmission occurred so soon after discharge precluding the opportunity for PCP follow‐up to occur. The effects of patients having non‐PCP (home health nurse, pharmacist, phone advice) follow‐up after hospital discharge were not examined.
Also, LOS and readmission to a hospital may be more a reflection of disease severity than the absence of PCP follow‐up, ie, patients ultimately readmitted after hospital discharge may have been a sicker subset of patients upon index hospitalization.
In this urban academic medical center, discharged medicine patients commonly lack timely PCP follow‐up. The lack of timely PCP follow‐up after hospital discharge was associated with higher rates of readmission and a non‐significant trend toward longer hospital lengths of stay. Hospital discharge represents a period of significant risk in patient care necessitating the effective continuation of treatment plans including follow‐up of laboratory, radiology or other testing, and management by a variety of providers. PCPs may play a crucial role in care coordination during this period. Structured intervention performed at the time of discharge might increase post‐hospital PCP access and facilitate timely PCP follow‐up to ensure continuity of needed care after hospital discharge in the most vulnerable patients. Such interventions might include systems improvements, such as increasing PCP access in the post‐hospital period, to increase the likelihood that complex needs are met at a vulnerable period in patient care.
A more effective handoff between inpatient and outpatient settings may ultimately improve clinical outcomes, diminish resource utilization, and decrease overall healthcare costs.
Acknowledgements
The authors thank Traci Yamashita and Karen Mellis, Professional Research Assistants.
- , , , .The incidence and severity of adverse events affecting patients after discharge from the hospital.Ann Intern Med.2003;13:161–167.
- , , , .Medical errors related to discontinuity of care from an inpatient to outpatient setting.J Gen Intern Med.200318:646–651.
- , .The high cost users of medical care.N Engl J Med.1980;302:996–1002.
- , .The rate and cost of hospital readmissions for preventable conditions.Med Care Res Rev.2004;61:225–240.
- , , .Rehospitalizations among patients in the medicare fee‐for‐service program.N Engl J Med.2009;360;14:1418–1428.
- , , .Tying up loose ends. Discharging patients with unresolved medical issues.Arch Intern Med.2007;167:1305–1311.
- , .Post‐hospitalization followup appointment‐keeping among the medically indigent.J Community Health.1993;18(5):271–282.
- , , .Factors related to the keeping of appointments by indigent clients.J Health Care Poor Underserved.1993;4(1):21–39.
- , , , , , .Inpatient to outpatient transfer of diabetes care: perceptions of barriers to postdischarge followup in urban African American patients.Ethn Dis.2007;17(2):238–243.
- , , .Effect of a nurse case manager on postdischarge follow‐up.J Gen Intern Med.1996v;11(11):684–688.
- , , .Emergency department visits by persons recently discharges from U.S. hospitals.Natl Health Stat Report.2008;(6):1–9.
- , , .Comparing uninsured and privately insured hospital patients: admission severity, health outcomes and resource use.Health Serv Manage Res.2001;14(3):203–210.
- , , .Comparison of uninsured and privately insured hospital patients. Condition on admission, resource use, and outcome.JAMA.1991;265(3):374–379.
- , , .Effect of a nurse case manager on postdischarge follow‐up.J Gen Intern Med.1996;11:684–688.
- , , , .The care transitions intervention: results of a randomized controlled trial.Arch Intern Med.2006;166(17):1822–1828.
- , , , , , .A multidisciplinary intervention to prevent the readmission of elderly patients with congestive heart failure.N Engl J Med.1995;333:1190–1195.
- , , , .Continuity of care and patient outcomes after hospital discharge.J Gen Intern Med.2004;19:624–631.
- , , , et al.A reengineered hospital discharge program to decrease rehospitalization.Ann Intern Med.2009;150:178–187.
- , , .Does increased access to primary care reduce hospital readmissions?N Engl J Med.1996;334:1441–1447.
- , .Health insurance and access to health care in the united states.Ann NY Acad Sci.1008;1136:149–160.
- , .2006.Summary health statistics for U.S. adults: National Health Interview Survey. 2005, NCHS/CDC/USDHHS, Vital Health Statistics, Series 10.
- , , .Emergency department visits by persons recently discharges from U.S. hospitals.Natl Health Stat Report.2008;(6):1–9.
- , , .Comparison of uninsured and privately insured hospital patients. Condition on admission, resource use, and outcome.JAMA.1991;265(3):374–379.
- , , .Comparing uninsured and privately insured hospital patients: admission severity, health outcomes and resource use.Health Serv Manage Res.2001;14(3):203–210.
Copyright © 2010 Society of Hospital Medicine
Post‐Discharge Inpatients With Depressive Symptoms
Fully 19% of Medicare patients are readmitted to the hospital within 30 days of discharge.1 This represents a large amount of potentially avoidable morbidity and cost. Indeed, projects to improve the discharge process and post‐hospital care have shown that as much as one‐third of hospital utilization in the month after discharge can be avoided.2 Consequently, the rate of early, unplanned hospital utilization after discharge has emerged as an important indicator of hospital quality and the Centers for Medicare and Medicaid Services (CMS) has proposed a policy to decrease payments to hospitals with high rates of early unplanned hospital utilization. Thus, there is great interest in identifying modifiable risk factors for rehospitalization that could be used to refine intervention models and lead to improvements in quality of care, patient outcomes, and cost savings.
To date, known predictors of readmission include: lower socioeconomic status,3 history of prior hospitalization4 and advanced age,5 length of stay greater than 7 days,6 a high burden of comorbid illnesses (based on Charlson score),7 poor social support,8 and specific diagnoses (eg, congestive heart failure, chronic obstructive pulmonary disease [COPD] and myocardial infarction).5, 9, 10 In addition, unplanned readmissions and emergency department (ED) visits have been linked to polypharmacy and adverse drug events related to treatment with medications such as warfarin, digoxin and narcotics.11, 12 Another characteristic that has also been linked to readmission is depression;13 however5 reports supporting this association are from studies of elderly patients or with patients who have specific diagnoses (eg, congestive heart failure [CHF], COPD, myocardial infarction).1416
Depression is common, affecting 13% to 16% of people in the US, and is recognized as an important risk factor for poor outcomes among patients with various chronic illnesses.1719 The mechanisms by which depression can be linked to health outcomes and health service utilization have been studied in age‐specific or disease‐specific cohorts such as cardiac patients or frail elders and include both physiologic factors such as hypercoagulability and hyperinflammatory conditions, as well as behavioral factors such as poor self‐care behaviors and heightened sensitivity to somatic symptoms. How these mechanisms link depression to health outcomes and hospital utilization in a general medical population is not clearly understood. Kartha et al.13 reported findings indicating that depression is a risk factor for rehospitalization in general medical inpatients, but the study sample was relatively small and the study design methodology significantly limited its generalizability.12 It would be useful to provide supporting evidence showing depression as an important risk factor for readmission in the general medical in‐patient population using more rigorous study methods and a larger cohort.
We hypothesized that depressive symptoms would be an independent risk factor for early unplanned hospital utilization after discharge for all medical patients. Therefore, we conducted a secondary analysis of the Project RED clinical trial dataset to assess the association between a positive depression screen during inpatient hospitalization and the rate of subsequent hospital utilization.
Methods
Data from the Project RED clinical trial were reviewed for inclusion in a secondary analysis. Complete data were available for 738 of the 749 subjects recruited for Project RED.
Project RED Setting and Participants
Project RED was a two‐armed randomized controlled trial of English‐speaking adult patients, 18 years or older, admitted to the teaching service of Boston Medical Center, a large urban safety‐net hospital with an ethnically diverse patient population. A total of 749 subjects were enrolled and randomized between January 3, 2006 and October 18, 2007. Patients were required to have a telephone, be able to comprehend study details and the consent process in English, and have plans to be discharged to a US community. Patients were not enrolled if they were admitted from a skilled nursing facility or other hospital, transferred to a different hospital service prior to enrollment, admitted for a planned hospitalization, on hospital precautions, on suicide watch, deaf or blind. The Institutional Review Board of Boston University approved all study activities. A full description of the methods for the Project RED trial has been described previously.2
Outcome Variable
The primary endpoint was rate of hospital utilization within 30 days of discharge from the index admission, defined as the total number of ED visits and readmissions per subject within 30 days of the index discharge. Hospital utilization rates within 60 and 90 days of the index hospitalization discharge were also analyzed as secondary outcomes. Any ED visit in which a subject was subsequently admitted to the hospital was only counted as a readmission. Outcome data were collected by reviewing the hospital's electronic medical records (EMRs) and by contacting subjects by telephone 30 days after discharge. Dates of hospital utilization occurring at Boston Medical Center were obtained from the EMR, while those at other hospitals were collected through subject report. Subjects who could not be reached within 60 days of discharge were assumed alive.
Primary Independent Variable
The primary independent variable of interest was depressive symptoms defined as a positive score for minor or major depression on the nine‐item Patient Health Questionnaire (PHQ‐9) depression screening tool.20 A dichotomized variable was created using a standardized scoring system to determine the screening cut‐off for major or minor depressive symptoms.19
Statistical Analysis
Demographic and other characteristics of the subjects were compared by depression status (Table 1). Potential confounders were identified a priori from the available literature on factors associated with rehospitalization. These included age, gender, marital status, health literacy score (rapid estimate of health literacy in adult medicine tool [REALM]),21 Charlson score,22 insurance type, employment status, income level, homelessness status within past three months, hospital utilization within the 6 months prior to the index hospitalization, educational attainment, length of hospital stay and Project RED study group assignment. Bivariate analyses were conducted to determine which covariates were significant confounders of the relationship between depression and hospital utilization within 30 days of discharge. Chi‐square tests were used for categorical variables and t‐tests for continuous variables.
| Characteristic | Depression Screen* | ||
|---|---|---|---|
| Negative (n = 500) | Positive (n = 238) | P Value | |
| |||
| Race, No. (%) | |||
| White | 140 (30) | 66 (30) | |
| Black | 268 (58) | 117 (54) | |
| Hispanic | 47 (10) | 29 (13) | 0.760 |
| Insurance, No. (%) | |||
| Private | 95 (19) | 22 (9) | |
| Medicare | 69 (14) | 30 (13) | |
| Medicaid | 214 (43) | 143 (61) | |
| Free care | 118 (24) | 40 (17) | <0.001 |
| Education, No. (%) | |||
| <8th grade | 33 (7) | 21 (9) | |
| Some high school | 82 (17) | 52 (22) | |
| High school grad | 192 (38) | 90 (38) | |
| Some college | 126 (25) | 51 (22) | |
| College grad | 67 (13) | 22 (9) | 0.135 |
| Health Literacy | |||
| Grade 3 and below | 64 (13) | 44 (19) | |
| Grade 46 | 54 (11) | 22 (10) | |
| Grade 78 | 156 (32) | 73 (32) | |
| Grade 9 and above | 213 (44) | 89 (39) | 0.170 |
| Income, $, No. (%) | |||
| No income | 61 (12) | 37 (16) | |
| <10K | 77 (15) | 61 (26) | |
| 1020K | 96 (19) | 35 (15) | |
| 2050K | 97 (19) | 34 (14) | |
| 50100K | 35 (8) | 7 (2) | |
| No answer | 132 (27) | 64 (27) | 0.002 |
| Employment status, No. (%) | |||
| Full time | 142 (28) | 34 (14) | |
| Part time | 57 (11) | 30 (13) | |
| Not Working | 297 (59) | 171 (72) | <0.001 |
| Age, mean (SD), years | 49.9 (16.0) | 49.6 (13.3) | 0.802 |
| Gender: No. (%) Female | 239 (48) | 133 (56) | 0.040 |
| Have PCP, No. (%) Yes | 399 (80) | 197 (83) | 0.340 |
| Marital status,∥ No. (%) unmarried | 365 (73) | 201 (85) | <0.001 |
| Charlson score, mean (SD) | 1.058 (1.6) | 1.56 (2.39) | 0.001 |
| RED study group,# No. (%) | |||
| Intervention | 243 (49) | 127 (53) | 0.22 |
| Length of stay, days, mean (SD) | 2.5 (2.8) | 3.1 (3.8) | 0.016 |
| Homeless in last 3 months, No. (%) | 45 (9) | 30 (13) | 0.130 |
| Frequent utilizer,** No. (%) | 159 (32) | 104 (44) | 0.002 |
Age, length of stay, and Charlson score were used as continuous variables. Gender, marital status, frequent prior utilization (01 vs. 2 or more), and homelessness were treated as dichotomous variables. Categorical variables were created for, educational attainment (less than eighth grade, some high school, high school graduate, some college, college graduate), insurance type (Medicare, Medicaid, private insurance or free care), income level (no income, less than $10,000 per year, $10,00020,000, $20,00050,000, $50,000100,000, no answer), level of health literacy (grade 3 and below, grade 46, grade 78, grade 9 or above) and employment status(working full‐time, working part‐time, not working, no answer).
The 30‐day hospital utilization rate reflects the number of hospital utilization events within 30 days of discharge per subject. The same method was used to calculate hospital utilization rates within 60 and 90 days of discharge respectively. The unadjusted incident rate ratio (IRR) was calculated as the ratio of the rate of hospital utilizations among patients with depressive symptoms versus patients without depressive symptoms. Data for hospital utilization at 30, 60, and 90 days are cumulative.
Poisson models were used to test for significant differences between the predicted and observed number of hospitalization events at 30 days. A backward stepwise regression was conducted to identify and control for relevant confounders and construct the final, best‐fit model for the association between depression and hospital reutilization. A statistical significance level of P = 0.10 was used for the stepwise regression. To evaluate potential interactions between depression and the Project RED intervention, interaction terms were included. Two‐sided significance tests were used. P values of less than 0.05 were considered to indicate statistical significance. All data were analyzed with S‐Plus 8.0 (Seattle, WA).
In addition, a Kaplan‐Meier hazard curve was generated for the first hospital utilization event, ED visit or readmission, for the 30‐day period following discharge and compared with a log‐rank test.
Results
A total of 28% of subjects were categorized as having a positive depression screen. More women (36%) had positive depression screens than men (28%). Among patients with a positive depression screen, 58% had a history of depression and 53% were currently taking medications at the time of enrollment, compared with 25% and 22% respectively for subjects with a negative depression screen. Table 1 presents the means or percentages for baseline characteristics by depression status in the analytic cohort. Subjects with Medicaid for insurance had a higher rate of depression (61%) than subjects with Medicare (13%), private insurance (9%), or those who qualified for the Free Care pool (17%) which is the Massachusetts state funding for healthcare to uninsured persons. Subjects who were unemployed, unmarried, or who reported earnings less than $10,000 per year were also more likely to screen positive for depression. In addition, depressed subjects had a higher severity of co‐morbid disease and longer length of stay for the index hospitalization. Patients categorized as frequent utilizers (2 or more prior admissions) for the 6 months prior to the index hospitalization were also more likely to be depressed. Of further note, is the relatively younger average age among both depressive patients (49.6 years) and non‐depressive patients (49.9) of these study subjects.
The unadjusted hospital utilization rate at 30, 60, and 90 days post‐discharge by depression status is shown in Table 2. At 30 days post‐discharge, those with depressive symptoms had a higher rate of hospital utilization than those without depressive symptoms (0.563 vs. 0.296). In other words, 56 utilization events occurred per 100 patients with depressive symptoms, compared with 30 utilization events per 100 patients without depressive symptoms. The unadjusted 30‐day post‐discharge hospital utilization rate among those with depressive symptoms was higher compared with those without symptoms (IRR, 1.90, 95% confidence interval [CI], 1.242.71). A similar trend was found among subjects at 60 and 90 days post‐discharge.
| Hospital Utilization | Depression Screen* | P Value | IRR (CI) | |
|---|---|---|---|---|
| Negative, n = 500 (68%) | Positive, n = 238 (32%) | |||
| ||||
| No. of hospital utilizations | 140 | 134 | 1.90 (1.51,2.40) | |
| 30‐day hospital utilization rate | 0.296 | 0.563 | <0.001 | |
| No. of hospital utilizations | 231 | 205 | 1.87 (1.55,2.26) | |
| 60‐day hospital utilization rate | 0.463 | 0.868 | <0.001 | |
| No. of hospital utilizations | 324 | 275 | 1.79 (1.53,2.10) | |
| 90‐day hospital utilization rate | 0.648 | 1.165 | <0.001 | |
Poisson regression analyses were conducted to control for potential confounding in the relationship between depressive symptoms and hospital utilization rate within 30 days after discharge (Table 3). After controlling for relevant confounders, including age, gender, employment status, frequent prior hospitalization status, marital status, Charlson score, Project RED study group assignment and the interaction variable for RED study group assignment and depression, the association between symptoms of depression, and hospital utilization rate remained significant (IRR, 1.73; 95% CI, 1.272.36).
| Characteristics | IRR | CI | P Value |
|---|---|---|---|
| |||
| Depression symptoms* | <0.001 | ||
| Positive | 1.73 | 1.272.36 | |
| Negative | REF | 1.0 | |
| Gender | <0.001 | ||
| Male | 1.87 | 1.472.40 | |
| Female | REF | 1.0 | |
| Marital status | 0.005 | ||
| Married | 0.625 | 0.440.89 | |
| Unmarried | 1.0 | REF | |
| Frequent utilizer | <0.001 | ||
| 2+ prior visits | 2.45 | 1.923.15 | |
| <2 prior visits | 1.0 | REF | |
| Study group | 0.054 | ||
| Intervention | 0.76 | 0.551.06 | |
| Control | 1.0 | REF | |
| Employment | |||
| Part time | 1.40 | 0.852.30 | 0.095 |
| Not working | 1.67 | 1.152.44 | 0.003 |
| Other | 0.52 | 0.073.85 | 0.262 |
| Full time | 1.0 | REF | |
| Charlson Score∥ | 0.98 | 0.921.04 | 0.250 |
| Group* depression | 0.84 | 0.521.36 | 0.236 |
| Age | 1.00 | 0.991.01 | 0.375 |
Figure 1 depicts the Kaplan‐Meier hazard curve generated for time to first hospital utilization, stratified by depression status. While 21% of participants without symptoms of depression had a hospital utilization within 30 days, fully 29% of participants with symptoms of depression had a hospital utilization within 30 days (P = 0.011).
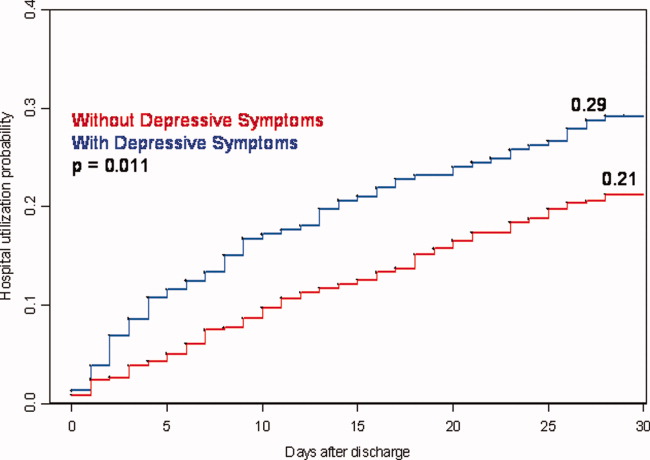
Discussion
Our study shows hospitalized patients who screen positive for depressive symptoms are significantly more likely to have a hospital visit (emergency room or rehospitalization) within 30 days of discharge than those who do not screen positive for depressive symptoms among medical patients admitted to an urban, academic, safety‐net hospital. These findings are consistent with, and extend, prior reports regarding depression and rehospitalization in specific populations (ie, geriatrics) and specific diagnoses (ie, cardiovascular disease [CVD] and COPD).1012 We observed a 73% higher incidence rate for hospital utilization within 30 days of discharge for those with symptoms of depression. This puts symptoms of depression on par with frequent prior rehospitalization, advanced age and low social support, as known risk factors for rehospitalization.4, 5, 23
Also of significance is the relatively young age of this study population (49.9 years non‐depressive patients and 49.6 years for depressive patients) compared with the study cohorts used for research in the majority of the existing literature. The chief reason for the young age of our cohort is that potential subjects were excluded if they came from a skilled nursing facility or other hospital. This may limit the generalizability of our findings; however, it seems likely that interventions relating to depression and transitions of care will need to be quite different for patients that reside in long‐term care facilities vs. patients that live in the community. For example, patients living in the community may have significant barriers to access post‐discharge services due to insurance status and are more likely to be sensitive to variations in social support.
Early rehospitalization is associated with significant morbidity, mortality, and expense. It is also a potential marker for poor quality of care.24 Concerns for patient safety, escalating healthcare costs, and possible change in hospital reimbursement mechanisms are fueling the search for modifiable risk factors associated with early rehospitalization. Our data provide evidence that symptoms of depression may be an important focus of attention. We do not know, however whether treating hospitalized patients who screen positive for depression will decrease early rehospitalization and emergency room utilization rates.
Various physiologic and behavioral mechanisms may link symptoms of depression to hospital utilization after discharge. For example, depressed patients with features of somatization may be more likely to experience worrisome physical symptoms after discharge and present prematurely for reevaluation. Patients who are sicker in some fashion not captured by our measured confounders may have symptoms of depression related to chronic, debilitating disease warranting early return to the hospital. Depression may also yield nonadherence to aspects of the discharge treatment plan leading to rehospitalization as a result of poor post‐discharge disease management. For example, research shows that patients with depression following coronary artery bypass surgery are less likely to adhere with cardiac rehabilitation programs.25 Likewise, depression among chronically ill patients such as diabetics, asthmatics, or human immunodeficiency virus (HIV)‐positive patients impairs medication adherence and self‐care behavior which may lead to disease relapse or recurrence.2628 One study examining depression effects on hypertensive medicine adherence in African Americans identified self‐efficacy as a mediating factor between depression and nonadherence.29 This implies that interventions such as self‐management education, a program through which chronically‐ill patients learn to better manage their illnesses through enhanced self‐confidence and problem‐solving strategies (including mood disorder challenges) may reduce early rehospitalization among depressed patients.30
There is also evidence that depression may have direct physiologic consequences. In patients with CVD, depression is associated with poor outcomes possibly related to decreased heart rate variability, hypercoagulability, high burdens of inflammatory markers, and severity of left ventricular dysfunction.3134 Similarly, depression among HIV/acquired immune deficiency syndrome (AIDS), diabetics and multiple sclerosis (MS) patients is linked to heightened levels of proinflammatory markers and less favorable outcomes that may signal a more severe form of the disease or an impaired response to treatment.3538 Indeed, MS investigators now hypothesize that the proinflammatory environment associated with the neurologic manifestations of MS are also causing depression symptoms among MS patients.34 This theory contrasts the common belief that depression in the chronically ill manifests independent of the chronic illness or in response to living with chronic disease.
A major strength of the current study is the large dataset and the broad range of covariates available for analyses. However, several limitations should be noted. First, data on hospital utilization outside Boston Medical Center were determined by patient self‐report and were not confirmed by document review. Second, we do not know the direction of the associations we report. If symptoms of depression are merely the consequence of having a higher disease burden, treatment of the underlying disease may be the most important response. While this is possible, our model does include several variables (eg, Charlson score and length of stay) that are likely to adjust for disease severity, pointing to the likelihood that symptoms of depression truly predict hospital utilization in a fashion that is independent of disease severity. Third, our results may not be generalizable to populations other than those served by urban safety‐net hospitals or other populations excluded from the Project RED trial (eg, non‐English speaking patients and patients from nursing homes). Finally, social factors such as substance use and social support system variables may residually confound the relationship between depression and hospital reutilization demonstrated in this study. While this dataset does not include a measure of social support other than marital status and housing status, data is available on substance use. Analyses conducted by our colleagues using Project RED data found that in this study population depression was significantly more prevalent among substance users (29% vs. 14%) compared with non‐users and that substance use is an independent risk factor for hospital reutilization (unpublished data).
Our findings linking depression to increased hospital utilization also warrant further consideration from healthcare policymakers. Central to the Obama Administration's February 2009 healthcare reform proposal is the pursuit of cost savings through reductions in unplanned hospital readmissions.39 Thus, identifying potentially modifiable risk factors for readmission, such as depression, is of great concern to healthcare providers and policymakers across the nation. If, through testing of interventions, depression proves to be a modifiable risk for readmission, policymakers, while negotiating healthcare reform measures, must provide for the services required to address this comorbidity at the time of discharge. For example, if a patient screens positive for depressive symptoms during a hospitalization for COPD exacerbation, will the proposed payment reforms allow for mental health services during the immediate post‐discharge period in order to reduce the likelihood of hospital readmission? Will those mental health services be readily available? Payment reforms that account for all necessary transitional care services will indeed help reduce readmission costs with less risk for untoward consequences.
In conclusion, our results indicate that a positive depression screen is a significant risk factor for early post‐discharge hospital utilization among hospitalized adults on a general medical service, even after controlling for relevant confounders. Screening for depression during acute hospitalizations may be an important step in identifying patients at increased risk for readmission. Future research should focus on further characterizing and stratifying populations at highest risk for depression. Efforts should also include developing and evaluating targeted interventions for patients with symptoms of depression among hospitalized patients as part of discharge planning. Timely depression therapy during the hospitalization or following hospital discharge might reduce costly readmissions and enhance patient safety.
- ,,.Rehospitalizations among patients in the Medicare fee‐for‐service program.N Engl J Med.2009;360(14):1457–1459.
- ,,, et al.The reengineered hospital discharge program to decrease rehospitalization.Ann Intern Med.2009;150(3):178–187.
- ,,.The impact of patient socioeconomic status and other social factors on readmission: a prospective study in four Massachusetts hospitals.Inquiry.1994;31(2):163–172.
- ,,,.Continuity of care and patient outcomes after hospital discharge.J Gen Intern Med.2004;19:624–631. [PMID: 15209600]
- ,,,,,.Factors associated with unplanned hospital readmission among patients 65 years of age and older in a Medicare managed care plan.Am J Med.1999;107(1):13–17.
- ,,, et al.Readmission after hospitalization for congestive heart failure among Medicare beneficiaries.Arch Intern Med.1997;157(1):99–104.
- ,,.Chronic comorbidity and outcomes of hospital care: length of stay, mortality and readmission at 30 and 365 days.J Clin Epidemiol.1999;52(3):171–179.
- ,,, et al.Social network as a predictor of hospital readmission and mortality among older patients with heart failure.J Card Fail.2006;12:621–627.
- ,,,,.Acute exacerbation of chronic obstructive pulmonary disease: influence of social factors in determining length of stay and readmission rates.Can Respir J.2008;15(7):361–364.
- ,,, et al.Time course of depression and outcome of myocardial infarction.Arch Intern Med.2006;166(18):2035–2043.
- ,,, et al.Medication use leading to emergency department visits for adverse drug events in older adults.Ann Intern Med.2007;147(11):755–765.
- ,,.A systematic literature review of factors affecting outcomes in older medical patients admitted to hospital.Age Ageing.2004;33(2):110–115.
- ,,, et al.Depression is a risk factor for rehospitalization in medical inpatients.Prim Care Companion J Clin Psychiatry.2007;9(4):256–262.
- ,,, et al.Risk factors for hospital readmission in patients with chronic obstructive pulmonary disease.Respiration.2006;73:311–317.
- ,,, et al.Depression and healthcare costs during the first year following myocardial infarction.J Psychosom Res.2000;48(4–5):471–478.
- ,,, et al.Relationship of depression to increased risk of mortality and rehospitalization.Arch Intern Med.2001;161(15):1849–1856.
- ,,, et al.Time course of depression and outcome of myocardial infarction.Arch Intern Med.2006;166:2035–2043.
- ,.Single item on positive affect is associated with 1‐year survival in consecutive medical inpatients.J Gen Hosp Psych.2009;31:8–13.
- ,,,.Epidemiology of major depressive disorder: results from the National Epidemiologic Survey on Alcoholism and Related Conditions.Arch Gen Psychiatry.2005;62(10):1097–106.
- ,,.The PHQ‐9: Validity of a brief depression severity measure.J Gen Intern Med.2001;16:606–613. [PMID:11556941]
- ,,, et al.Rapid estimate of adult literacy in medicine: a shortened screening instrument.Fam Med.1993;25:391–395. [PMID:8349060]
- ,,,.A new method of classifying prognostic comorbidity in longitudinal studies: development and validation.J Chronic Dis.1987;40:373–383. [PMID: 3558716]
- ,,, et al.Social network as a predictor of hospital readmission and mortality among older patients with heart failure.J Card Fail.2006;12(8):621–627.
- ,,,,.The association between the quality of inpatient care and early readmission: a meta‐analysis of the evidence.Med Care.1997;35(10):1044–1059.
- ,,, et al.Persistent depression affects adherence to secondary prevention behaviors after acute coronary syndromes.J Gen Intern Med.2006;21(11):1178–1183.
- ,,,,.Depression is an important contributor to low medication adherence in hemodialyzed patients and transplant recipients.Kidney Int.2009;75(11):1223–1229.
- ,,, et al.Symptoms of depression prospectively predict poorer self‐care in patients with Type 2 diabetes.Diabet Med.2008;25(9):1102–1107.
- ,,, et al.The effect of adherence on the association between depressive symptoms and mortality among HIV‐infected individuals first initiating HAART.AIDS.2007;21(9):1175–1183.
- ,,.Self‐efficacy mediates the relationship between depressive symptoms and medication adherence.Health Educ Behav.2009;36(1):127–137.
- ,,,.Patient self‐management of chronic disease in primary care.JAMA.2002;288(19):2469–2475.
- .Effects of sertraline on the recovery rate of cardiac autonomic function in depressed patients after acute myocardial infarction.Am Heart J.2001;142:617–623.
- ,,, et al.Relationship between left ventricular dysfunction and depression following myocardial infarction: data from the MIND‐IT.Eur Heart J.2005;26:2650–2656.
- ,,, et al.Platelet/endothelial biomarkers in depressed patients treated with the selective serotonin reuptake inhibitor sertraline after acugte coronary events: the Sertraline AntiDepressant Heart Attack Randomized Trial (SADHART) Platelet SubStudy.Circulation.2003;108:939–944.
- ,.Inflammation in acute coronary syndromes.Cleve Clin J Med.2002;69(Suppl2):SII130–SII142.
- ,.Depression and immunity: inflammation and depressive symptoms in multiple sclerosis.Neurol Clin.2006;24(3):507–519.
- ,,, et al.Synergistic effects of psychological and immune stressors on inflammatory cytokines and sickness responses in humans.Brain Behav Immun.2009;23(2):217–224.
- ,,,,,.Psychological distress, killer lymphocytes and disease severity in HIV/AIDS.Brain Behav Immun.2008;22(6):901–911.
- ,,,.Analysis of potential predictors of depression among coronary heart disease risk factors including heart rate variability, markers of inflammation, and endothelial function.Eur Heart J.2008;29(9):1110–1117.
- .Obama proposes $634 billion fund for health care.Washington Post. February 26,2009:A1.
Fully 19% of Medicare patients are readmitted to the hospital within 30 days of discharge.1 This represents a large amount of potentially avoidable morbidity and cost. Indeed, projects to improve the discharge process and post‐hospital care have shown that as much as one‐third of hospital utilization in the month after discharge can be avoided.2 Consequently, the rate of early, unplanned hospital utilization after discharge has emerged as an important indicator of hospital quality and the Centers for Medicare and Medicaid Services (CMS) has proposed a policy to decrease payments to hospitals with high rates of early unplanned hospital utilization. Thus, there is great interest in identifying modifiable risk factors for rehospitalization that could be used to refine intervention models and lead to improvements in quality of care, patient outcomes, and cost savings.
To date, known predictors of readmission include: lower socioeconomic status,3 history of prior hospitalization4 and advanced age,5 length of stay greater than 7 days,6 a high burden of comorbid illnesses (based on Charlson score),7 poor social support,8 and specific diagnoses (eg, congestive heart failure, chronic obstructive pulmonary disease [COPD] and myocardial infarction).5, 9, 10 In addition, unplanned readmissions and emergency department (ED) visits have been linked to polypharmacy and adverse drug events related to treatment with medications such as warfarin, digoxin and narcotics.11, 12 Another characteristic that has also been linked to readmission is depression;13 however5 reports supporting this association are from studies of elderly patients or with patients who have specific diagnoses (eg, congestive heart failure [CHF], COPD, myocardial infarction).1416
Depression is common, affecting 13% to 16% of people in the US, and is recognized as an important risk factor for poor outcomes among patients with various chronic illnesses.1719 The mechanisms by which depression can be linked to health outcomes and health service utilization have been studied in age‐specific or disease‐specific cohorts such as cardiac patients or frail elders and include both physiologic factors such as hypercoagulability and hyperinflammatory conditions, as well as behavioral factors such as poor self‐care behaviors and heightened sensitivity to somatic symptoms. How these mechanisms link depression to health outcomes and hospital utilization in a general medical population is not clearly understood. Kartha et al.13 reported findings indicating that depression is a risk factor for rehospitalization in general medical inpatients, but the study sample was relatively small and the study design methodology significantly limited its generalizability.12 It would be useful to provide supporting evidence showing depression as an important risk factor for readmission in the general medical in‐patient population using more rigorous study methods and a larger cohort.
We hypothesized that depressive symptoms would be an independent risk factor for early unplanned hospital utilization after discharge for all medical patients. Therefore, we conducted a secondary analysis of the Project RED clinical trial dataset to assess the association between a positive depression screen during inpatient hospitalization and the rate of subsequent hospital utilization.
Methods
Data from the Project RED clinical trial were reviewed for inclusion in a secondary analysis. Complete data were available for 738 of the 749 subjects recruited for Project RED.
Project RED Setting and Participants
Project RED was a two‐armed randomized controlled trial of English‐speaking adult patients, 18 years or older, admitted to the teaching service of Boston Medical Center, a large urban safety‐net hospital with an ethnically diverse patient population. A total of 749 subjects were enrolled and randomized between January 3, 2006 and October 18, 2007. Patients were required to have a telephone, be able to comprehend study details and the consent process in English, and have plans to be discharged to a US community. Patients were not enrolled if they were admitted from a skilled nursing facility or other hospital, transferred to a different hospital service prior to enrollment, admitted for a planned hospitalization, on hospital precautions, on suicide watch, deaf or blind. The Institutional Review Board of Boston University approved all study activities. A full description of the methods for the Project RED trial has been described previously.2
Outcome Variable
The primary endpoint was rate of hospital utilization within 30 days of discharge from the index admission, defined as the total number of ED visits and readmissions per subject within 30 days of the index discharge. Hospital utilization rates within 60 and 90 days of the index hospitalization discharge were also analyzed as secondary outcomes. Any ED visit in which a subject was subsequently admitted to the hospital was only counted as a readmission. Outcome data were collected by reviewing the hospital's electronic medical records (EMRs) and by contacting subjects by telephone 30 days after discharge. Dates of hospital utilization occurring at Boston Medical Center were obtained from the EMR, while those at other hospitals were collected through subject report. Subjects who could not be reached within 60 days of discharge were assumed alive.
Primary Independent Variable
The primary independent variable of interest was depressive symptoms defined as a positive score for minor or major depression on the nine‐item Patient Health Questionnaire (PHQ‐9) depression screening tool.20 A dichotomized variable was created using a standardized scoring system to determine the screening cut‐off for major or minor depressive symptoms.19
Statistical Analysis
Demographic and other characteristics of the subjects were compared by depression status (Table 1). Potential confounders were identified a priori from the available literature on factors associated with rehospitalization. These included age, gender, marital status, health literacy score (rapid estimate of health literacy in adult medicine tool [REALM]),21 Charlson score,22 insurance type, employment status, income level, homelessness status within past three months, hospital utilization within the 6 months prior to the index hospitalization, educational attainment, length of hospital stay and Project RED study group assignment. Bivariate analyses were conducted to determine which covariates were significant confounders of the relationship between depression and hospital utilization within 30 days of discharge. Chi‐square tests were used for categorical variables and t‐tests for continuous variables.
| Characteristic | Depression Screen* | ||
|---|---|---|---|
| Negative (n = 500) | Positive (n = 238) | P Value | |
| |||
| Race, No. (%) | |||
| White | 140 (30) | 66 (30) | |
| Black | 268 (58) | 117 (54) | |
| Hispanic | 47 (10) | 29 (13) | 0.760 |
| Insurance, No. (%) | |||
| Private | 95 (19) | 22 (9) | |
| Medicare | 69 (14) | 30 (13) | |
| Medicaid | 214 (43) | 143 (61) | |
| Free care | 118 (24) | 40 (17) | <0.001 |
| Education, No. (%) | |||
| <8th grade | 33 (7) | 21 (9) | |
| Some high school | 82 (17) | 52 (22) | |
| High school grad | 192 (38) | 90 (38) | |
| Some college | 126 (25) | 51 (22) | |
| College grad | 67 (13) | 22 (9) | 0.135 |
| Health Literacy | |||
| Grade 3 and below | 64 (13) | 44 (19) | |
| Grade 46 | 54 (11) | 22 (10) | |
| Grade 78 | 156 (32) | 73 (32) | |
| Grade 9 and above | 213 (44) | 89 (39) | 0.170 |
| Income, $, No. (%) | |||
| No income | 61 (12) | 37 (16) | |
| <10K | 77 (15) | 61 (26) | |
| 1020K | 96 (19) | 35 (15) | |
| 2050K | 97 (19) | 34 (14) | |
| 50100K | 35 (8) | 7 (2) | |
| No answer | 132 (27) | 64 (27) | 0.002 |
| Employment status, No. (%) | |||
| Full time | 142 (28) | 34 (14) | |
| Part time | 57 (11) | 30 (13) | |
| Not Working | 297 (59) | 171 (72) | <0.001 |
| Age, mean (SD), years | 49.9 (16.0) | 49.6 (13.3) | 0.802 |
| Gender: No. (%) Female | 239 (48) | 133 (56) | 0.040 |
| Have PCP, No. (%) Yes | 399 (80) | 197 (83) | 0.340 |
| Marital status,∥ No. (%) unmarried | 365 (73) | 201 (85) | <0.001 |
| Charlson score, mean (SD) | 1.058 (1.6) | 1.56 (2.39) | 0.001 |
| RED study group,# No. (%) | |||
| Intervention | 243 (49) | 127 (53) | 0.22 |
| Length of stay, days, mean (SD) | 2.5 (2.8) | 3.1 (3.8) | 0.016 |
| Homeless in last 3 months, No. (%) | 45 (9) | 30 (13) | 0.130 |
| Frequent utilizer,** No. (%) | 159 (32) | 104 (44) | 0.002 |
Age, length of stay, and Charlson score were used as continuous variables. Gender, marital status, frequent prior utilization (01 vs. 2 or more), and homelessness were treated as dichotomous variables. Categorical variables were created for, educational attainment (less than eighth grade, some high school, high school graduate, some college, college graduate), insurance type (Medicare, Medicaid, private insurance or free care), income level (no income, less than $10,000 per year, $10,00020,000, $20,00050,000, $50,000100,000, no answer), level of health literacy (grade 3 and below, grade 46, grade 78, grade 9 or above) and employment status(working full‐time, working part‐time, not working, no answer).
The 30‐day hospital utilization rate reflects the number of hospital utilization events within 30 days of discharge per subject. The same method was used to calculate hospital utilization rates within 60 and 90 days of discharge respectively. The unadjusted incident rate ratio (IRR) was calculated as the ratio of the rate of hospital utilizations among patients with depressive symptoms versus patients without depressive symptoms. Data for hospital utilization at 30, 60, and 90 days are cumulative.
Poisson models were used to test for significant differences between the predicted and observed number of hospitalization events at 30 days. A backward stepwise regression was conducted to identify and control for relevant confounders and construct the final, best‐fit model for the association between depression and hospital reutilization. A statistical significance level of P = 0.10 was used for the stepwise regression. To evaluate potential interactions between depression and the Project RED intervention, interaction terms were included. Two‐sided significance tests were used. P values of less than 0.05 were considered to indicate statistical significance. All data were analyzed with S‐Plus 8.0 (Seattle, WA).
In addition, a Kaplan‐Meier hazard curve was generated for the first hospital utilization event, ED visit or readmission, for the 30‐day period following discharge and compared with a log‐rank test.
Results
A total of 28% of subjects were categorized as having a positive depression screen. More women (36%) had positive depression screens than men (28%). Among patients with a positive depression screen, 58% had a history of depression and 53% were currently taking medications at the time of enrollment, compared with 25% and 22% respectively for subjects with a negative depression screen. Table 1 presents the means or percentages for baseline characteristics by depression status in the analytic cohort. Subjects with Medicaid for insurance had a higher rate of depression (61%) than subjects with Medicare (13%), private insurance (9%), or those who qualified for the Free Care pool (17%) which is the Massachusetts state funding for healthcare to uninsured persons. Subjects who were unemployed, unmarried, or who reported earnings less than $10,000 per year were also more likely to screen positive for depression. In addition, depressed subjects had a higher severity of co‐morbid disease and longer length of stay for the index hospitalization. Patients categorized as frequent utilizers (2 or more prior admissions) for the 6 months prior to the index hospitalization were also more likely to be depressed. Of further note, is the relatively younger average age among both depressive patients (49.6 years) and non‐depressive patients (49.9) of these study subjects.
The unadjusted hospital utilization rate at 30, 60, and 90 days post‐discharge by depression status is shown in Table 2. At 30 days post‐discharge, those with depressive symptoms had a higher rate of hospital utilization than those without depressive symptoms (0.563 vs. 0.296). In other words, 56 utilization events occurred per 100 patients with depressive symptoms, compared with 30 utilization events per 100 patients without depressive symptoms. The unadjusted 30‐day post‐discharge hospital utilization rate among those with depressive symptoms was higher compared with those without symptoms (IRR, 1.90, 95% confidence interval [CI], 1.242.71). A similar trend was found among subjects at 60 and 90 days post‐discharge.
| Hospital Utilization | Depression Screen* | P Value | IRR (CI) | |
|---|---|---|---|---|
| Negative, n = 500 (68%) | Positive, n = 238 (32%) | |||
| ||||
| No. of hospital utilizations | 140 | 134 | 1.90 (1.51,2.40) | |
| 30‐day hospital utilization rate | 0.296 | 0.563 | <0.001 | |
| No. of hospital utilizations | 231 | 205 | 1.87 (1.55,2.26) | |
| 60‐day hospital utilization rate | 0.463 | 0.868 | <0.001 | |
| No. of hospital utilizations | 324 | 275 | 1.79 (1.53,2.10) | |
| 90‐day hospital utilization rate | 0.648 | 1.165 | <0.001 | |
Poisson regression analyses were conducted to control for potential confounding in the relationship between depressive symptoms and hospital utilization rate within 30 days after discharge (Table 3). After controlling for relevant confounders, including age, gender, employment status, frequent prior hospitalization status, marital status, Charlson score, Project RED study group assignment and the interaction variable for RED study group assignment and depression, the association between symptoms of depression, and hospital utilization rate remained significant (IRR, 1.73; 95% CI, 1.272.36).
| Characteristics | IRR | CI | P Value |
|---|---|---|---|
| |||
| Depression symptoms* | <0.001 | ||
| Positive | 1.73 | 1.272.36 | |
| Negative | REF | 1.0 | |
| Gender | <0.001 | ||
| Male | 1.87 | 1.472.40 | |
| Female | REF | 1.0 | |
| Marital status | 0.005 | ||
| Married | 0.625 | 0.440.89 | |
| Unmarried | 1.0 | REF | |
| Frequent utilizer | <0.001 | ||
| 2+ prior visits | 2.45 | 1.923.15 | |
| <2 prior visits | 1.0 | REF | |
| Study group | 0.054 | ||
| Intervention | 0.76 | 0.551.06 | |
| Control | 1.0 | REF | |
| Employment | |||
| Part time | 1.40 | 0.852.30 | 0.095 |
| Not working | 1.67 | 1.152.44 | 0.003 |
| Other | 0.52 | 0.073.85 | 0.262 |
| Full time | 1.0 | REF | |
| Charlson Score∥ | 0.98 | 0.921.04 | 0.250 |
| Group* depression | 0.84 | 0.521.36 | 0.236 |
| Age | 1.00 | 0.991.01 | 0.375 |
Figure 1 depicts the Kaplan‐Meier hazard curve generated for time to first hospital utilization, stratified by depression status. While 21% of participants without symptoms of depression had a hospital utilization within 30 days, fully 29% of participants with symptoms of depression had a hospital utilization within 30 days (P = 0.011).
Discussion
Our study shows hospitalized patients who screen positive for depressive symptoms are significantly more likely to have a hospital visit (emergency room or rehospitalization) within 30 days of discharge than those who do not screen positive for depressive symptoms among medical patients admitted to an urban, academic, safety‐net hospital. These findings are consistent with, and extend, prior reports regarding depression and rehospitalization in specific populations (ie, geriatrics) and specific diagnoses (ie, cardiovascular disease [CVD] and COPD).1012 We observed a 73% higher incidence rate for hospital utilization within 30 days of discharge for those with symptoms of depression. This puts symptoms of depression on par with frequent prior rehospitalization, advanced age and low social support, as known risk factors for rehospitalization.4, 5, 23
Also of significance is the relatively young age of this study population (49.9 years non‐depressive patients and 49.6 years for depressive patients) compared with the study cohorts used for research in the majority of the existing literature. The chief reason for the young age of our cohort is that potential subjects were excluded if they came from a skilled nursing facility or other hospital. This may limit the generalizability of our findings; however, it seems likely that interventions relating to depression and transitions of care will need to be quite different for patients that reside in long‐term care facilities vs. patients that live in the community. For example, patients living in the community may have significant barriers to access post‐discharge services due to insurance status and are more likely to be sensitive to variations in social support.
Early rehospitalization is associated with significant morbidity, mortality, and expense. It is also a potential marker for poor quality of care.24 Concerns for patient safety, escalating healthcare costs, and possible change in hospital reimbursement mechanisms are fueling the search for modifiable risk factors associated with early rehospitalization. Our data provide evidence that symptoms of depression may be an important focus of attention. We do not know, however whether treating hospitalized patients who screen positive for depression will decrease early rehospitalization and emergency room utilization rates.
Various physiologic and behavioral mechanisms may link symptoms of depression to hospital utilization after discharge. For example, depressed patients with features of somatization may be more likely to experience worrisome physical symptoms after discharge and present prematurely for reevaluation. Patients who are sicker in some fashion not captured by our measured confounders may have symptoms of depression related to chronic, debilitating disease warranting early return to the hospital. Depression may also yield nonadherence to aspects of the discharge treatment plan leading to rehospitalization as a result of poor post‐discharge disease management. For example, research shows that patients with depression following coronary artery bypass surgery are less likely to adhere with cardiac rehabilitation programs.25 Likewise, depression among chronically ill patients such as diabetics, asthmatics, or human immunodeficiency virus (HIV)‐positive patients impairs medication adherence and self‐care behavior which may lead to disease relapse or recurrence.2628 One study examining depression effects on hypertensive medicine adherence in African Americans identified self‐efficacy as a mediating factor between depression and nonadherence.29 This implies that interventions such as self‐management education, a program through which chronically‐ill patients learn to better manage their illnesses through enhanced self‐confidence and problem‐solving strategies (including mood disorder challenges) may reduce early rehospitalization among depressed patients.30
There is also evidence that depression may have direct physiologic consequences. In patients with CVD, depression is associated with poor outcomes possibly related to decreased heart rate variability, hypercoagulability, high burdens of inflammatory markers, and severity of left ventricular dysfunction.3134 Similarly, depression among HIV/acquired immune deficiency syndrome (AIDS), diabetics and multiple sclerosis (MS) patients is linked to heightened levels of proinflammatory markers and less favorable outcomes that may signal a more severe form of the disease or an impaired response to treatment.3538 Indeed, MS investigators now hypothesize that the proinflammatory environment associated with the neurologic manifestations of MS are also causing depression symptoms among MS patients.34 This theory contrasts the common belief that depression in the chronically ill manifests independent of the chronic illness or in response to living with chronic disease.
A major strength of the current study is the large dataset and the broad range of covariates available for analyses. However, several limitations should be noted. First, data on hospital utilization outside Boston Medical Center were determined by patient self‐report and were not confirmed by document review. Second, we do not know the direction of the associations we report. If symptoms of depression are merely the consequence of having a higher disease burden, treatment of the underlying disease may be the most important response. While this is possible, our model does include several variables (eg, Charlson score and length of stay) that are likely to adjust for disease severity, pointing to the likelihood that symptoms of depression truly predict hospital utilization in a fashion that is independent of disease severity. Third, our results may not be generalizable to populations other than those served by urban safety‐net hospitals or other populations excluded from the Project RED trial (eg, non‐English speaking patients and patients from nursing homes). Finally, social factors such as substance use and social support system variables may residually confound the relationship between depression and hospital reutilization demonstrated in this study. While this dataset does not include a measure of social support other than marital status and housing status, data is available on substance use. Analyses conducted by our colleagues using Project RED data found that in this study population depression was significantly more prevalent among substance users (29% vs. 14%) compared with non‐users and that substance use is an independent risk factor for hospital reutilization (unpublished data).
Our findings linking depression to increased hospital utilization also warrant further consideration from healthcare policymakers. Central to the Obama Administration's February 2009 healthcare reform proposal is the pursuit of cost savings through reductions in unplanned hospital readmissions.39 Thus, identifying potentially modifiable risk factors for readmission, such as depression, is of great concern to healthcare providers and policymakers across the nation. If, through testing of interventions, depression proves to be a modifiable risk for readmission, policymakers, while negotiating healthcare reform measures, must provide for the services required to address this comorbidity at the time of discharge. For example, if a patient screens positive for depressive symptoms during a hospitalization for COPD exacerbation, will the proposed payment reforms allow for mental health services during the immediate post‐discharge period in order to reduce the likelihood of hospital readmission? Will those mental health services be readily available? Payment reforms that account for all necessary transitional care services will indeed help reduce readmission costs with less risk for untoward consequences.
In conclusion, our results indicate that a positive depression screen is a significant risk factor for early post‐discharge hospital utilization among hospitalized adults on a general medical service, even after controlling for relevant confounders. Screening for depression during acute hospitalizations may be an important step in identifying patients at increased risk for readmission. Future research should focus on further characterizing and stratifying populations at highest risk for depression. Efforts should also include developing and evaluating targeted interventions for patients with symptoms of depression among hospitalized patients as part of discharge planning. Timely depression therapy during the hospitalization or following hospital discharge might reduce costly readmissions and enhance patient safety.
- ,,.Rehospitalizations among patients in the Medicare fee‐for‐service program.N Engl J Med.2009;360(14):1457–1459.
- ,,, et al.The reengineered hospital discharge program to decrease rehospitalization.Ann Intern Med.2009;150(3):178–187.
- ,,.The impact of patient socioeconomic status and other social factors on readmission: a prospective study in four Massachusetts hospitals.Inquiry.1994;31(2):163–172.
- ,,,.Continuity of care and patient outcomes after hospital discharge.J Gen Intern Med.2004;19:624–631. [PMID: 15209600]
- ,,,,,.Factors associated with unplanned hospital readmission among patients 65 years of age and older in a Medicare managed care plan.Am J Med.1999;107(1):13–17.
- ,,, et al.Readmission after hospitalization for congestive heart failure among Medicare beneficiaries.Arch Intern Med.1997;157(1):99–104.
- ,,.Chronic comorbidity and outcomes of hospital care: length of stay, mortality and readmission at 30 and 365 days.J Clin Epidemiol.1999;52(3):171–179.
- ,,, et al.Social network as a predictor of hospital readmission and mortality among older patients with heart failure.J Card Fail.2006;12:621–627.
- ,,,,.Acute exacerbation of chronic obstructive pulmonary disease: influence of social factors in determining length of stay and readmission rates.Can Respir J.2008;15(7):361–364.
- ,,, et al.Time course of depression and outcome of myocardial infarction.Arch Intern Med.2006;166(18):2035–2043.
- ,,, et al.Medication use leading to emergency department visits for adverse drug events in older adults.Ann Intern Med.2007;147(11):755–765.
- ,,.A systematic literature review of factors affecting outcomes in older medical patients admitted to hospital.Age Ageing.2004;33(2):110–115.
- ,,, et al.Depression is a risk factor for rehospitalization in medical inpatients.Prim Care Companion J Clin Psychiatry.2007;9(4):256–262.
- ,,, et al.Risk factors for hospital readmission in patients with chronic obstructive pulmonary disease.Respiration.2006;73:311–317.
- ,,, et al.Depression and healthcare costs during the first year following myocardial infarction.J Psychosom Res.2000;48(4–5):471–478.
- ,,, et al.Relationship of depression to increased risk of mortality and rehospitalization.Arch Intern Med.2001;161(15):1849–1856.
- ,,, et al.Time course of depression and outcome of myocardial infarction.Arch Intern Med.2006;166:2035–2043.
- ,.Single item on positive affect is associated with 1‐year survival in consecutive medical inpatients.J Gen Hosp Psych.2009;31:8–13.
- ,,,.Epidemiology of major depressive disorder: results from the National Epidemiologic Survey on Alcoholism and Related Conditions.Arch Gen Psychiatry.2005;62(10):1097–106.
- ,,.The PHQ‐9: Validity of a brief depression severity measure.J Gen Intern Med.2001;16:606–613. [PMID:11556941]
- ,,, et al.Rapid estimate of adult literacy in medicine: a shortened screening instrument.Fam Med.1993;25:391–395. [PMID:8349060]
- ,,,.A new method of classifying prognostic comorbidity in longitudinal studies: development and validation.J Chronic Dis.1987;40:373–383. [PMID: 3558716]
- ,,, et al.Social network as a predictor of hospital readmission and mortality among older patients with heart failure.J Card Fail.2006;12(8):621–627.
- ,,,,.The association between the quality of inpatient care and early readmission: a meta‐analysis of the evidence.Med Care.1997;35(10):1044–1059.
- ,,, et al.Persistent depression affects adherence to secondary prevention behaviors after acute coronary syndromes.J Gen Intern Med.2006;21(11):1178–1183.
- ,,,,.Depression is an important contributor to low medication adherence in hemodialyzed patients and transplant recipients.Kidney Int.2009;75(11):1223–1229.
- ,,, et al.Symptoms of depression prospectively predict poorer self‐care in patients with Type 2 diabetes.Diabet Med.2008;25(9):1102–1107.
- ,,, et al.The effect of adherence on the association between depressive symptoms and mortality among HIV‐infected individuals first initiating HAART.AIDS.2007;21(9):1175–1183.
- ,,.Self‐efficacy mediates the relationship between depressive symptoms and medication adherence.Health Educ Behav.2009;36(1):127–137.
- ,,,.Patient self‐management of chronic disease in primary care.JAMA.2002;288(19):2469–2475.
- .Effects of sertraline on the recovery rate of cardiac autonomic function in depressed patients after acute myocardial infarction.Am Heart J.2001;142:617–623.
- ,,, et al.Relationship between left ventricular dysfunction and depression following myocardial infarction: data from the MIND‐IT.Eur Heart J.2005;26:2650–2656.
- ,,, et al.Platelet/endothelial biomarkers in depressed patients treated with the selective serotonin reuptake inhibitor sertraline after acugte coronary events: the Sertraline AntiDepressant Heart Attack Randomized Trial (SADHART) Platelet SubStudy.Circulation.2003;108:939–944.
- ,.Inflammation in acute coronary syndromes.Cleve Clin J Med.2002;69(Suppl2):SII130–SII142.
- ,.Depression and immunity: inflammation and depressive symptoms in multiple sclerosis.Neurol Clin.2006;24(3):507–519.
- ,,, et al.Synergistic effects of psychological and immune stressors on inflammatory cytokines and sickness responses in humans.Brain Behav Immun.2009;23(2):217–224.
- ,,,,,.Psychological distress, killer lymphocytes and disease severity in HIV/AIDS.Brain Behav Immun.2008;22(6):901–911.
- ,,,.Analysis of potential predictors of depression among coronary heart disease risk factors including heart rate variability, markers of inflammation, and endothelial function.Eur Heart J.2008;29(9):1110–1117.
- .Obama proposes $634 billion fund for health care.Washington Post. February 26,2009:A1.
Copyright © 2010 Society of Hospital Medicine

Seniors Report Post‐Discharge Problems
Recently, there has been an increased focus on improving communication during care transitions for older patients as they leave the hospital. One reason for this focus is the increasing utilization of hospitalists, or hospital‐based physicians, caring for patients in the United States.1 As a result, many primary care physicians (PCPs) no longer care for their patients while in the hospital and may not be informed of their patients' hospitalization.2 Additionally, with an emphasis on shorter lengths of hospital stay, more extensive post‐discharge follow‐up is often warranted for patients, which often becomes the responsibility of a patient's PCP. Recently 6 societies (American College of Physicians, Society of General Internal Medicine, Society of Hospital Medicine, American Geriatrics Society, American College of Emergency Physicians, and Society of Academic Emergency Medicine) have recommended that a patient's PCP is notified during all steps in care transitions and that patient‐centered approaches are employed.3 Despite the increased need for improved inpatient‐ambulatory care transitions, the communication between hospitalists and PCPs has been characterized as being poor and ineffective.4 Prior studies have shown that PCPs are not aware of test results that require follow‐up, may not receive timely or high quality discharge materials, and have an overall poor perception of the quality of communication.46 Ensuring adequate communication is considered important due to the increased risk of adverse events that patients experience after discharge from the hospital.79 Furthermore, recent studies have shown that patients are often able to identify and report adverse events that would not be detected by medical record review alone.10, 11 Eliciting patient perspectives on their experiences after discharge and their expectations of communication between PCPs and hospital physicians can help clinical teams design more patient‐centered solutions for care transitions.
The aim of this study is to report older patients' experiences with problems after hospital discharge and their understanding and expectation of communication between hospital physicians and their PCP. We also explored the relationship between patient experiences and whether their PCPs were aware of their hospitalization.
Methods
Study Design
Patients were recruited for this study from February 2008 to July 2008 using the University of Chicago Hospitalist Study, a large ongoing study that interviews hospitalized patients regarding quality of care.1 Two enrollment strategies were used; in order to oversample frail elders, all patients who were defined to be vulnerable elders using the VES‐13, based on age, self‐rated health, and physical function are asked to consent to surveying their PCP about their admission.12 In addition, every tenth hospitalized patient (with medical record number ending in 5) was asked to consent to have his or her PCP surveyed about communication regarding their admission. Patients who could not name a PCP or those patients who named a physician who denied caring for that patient were excluded. The study was approved by the University of Chicago Institutional Review Board.
Inpatient Interview and Chart Review
Within 48 hours of hospitalization, patients were approached by trained research assistants and first asked to complete the telephone version of the Mini‐Mental Status Exam.13 For those patients who scored a 17 or below on this 22‐point instrument, a proxy was approached to consent to the study and complete the interview protocol. Patients or their proxies then completed an inpatient interview to ascertain age, sex, self‐reported race, income, education and place of residence (home, nursing home). Patients were also asked if their PCP is affiliated with the University of Chicago and whether they had been hospitalized in the year prior to admission. Chart reviews were conducted for calculation of length of stay and location of discharge was also obtained (ie, rehabilitation, home, nursing home).
Two‐Week Post‐Discharge Phone Interview
To ascertain patient reports of problems after discharge, we conducted telephone interviews of eligible patients and/or their proxies 2 weeks after discharge. During the telephone interviews, each patient was asked 12 open‐ended questions to facilitate the reporting of events. Interviews were conducted by trained research assistants, who were blinded to whether the PCP was aware of a patient's hospitalization. Questions focused on the patient's perception of the quality and extent of communication that occurred between his or her identified PCP and the inpatient physician who provided his or her care while hospitalized. For example, the patient was asked if his or her PCP was aware of the hospitalization and if so, the patient was also asked: Do you know who told your regular doctor? Patients were asked about their perception of their PCP's knowledge of their clinical course.
Because we were interested in understanding problems after discharge, we used critical incident technique to solicit the patient's experience with these events. This technique was initially developed to study aviation accidents and can broaden our understanding of rare and poorly observed events by using subjective reports of an individual's own experience.14, 15 From the literature, we a priori identified post‐discharge problems including difficulties with follow‐up tests or appointments, medication changes, and readmission. Thus, we asked each patient, Did anything bad or inconvenient happen following your hospital stay, such as problems with new medications, missing a test, going back to the hospital. The interviews were audio‐taped and transcribed for analysis.
PCP Surveys
To supplement the patient‐reported data and to complete our understanding of what communication did or did not take place, the PCP of each enrolled patient was faxed a survey that ascertained PCP awareness of the hospitalization using the yes or no response to the question Were you aware that your patient had been hospitalized? For those patients who successfully completed the interview, PCPs who had not responded to the fax were also called by telephone to ascertain whether they were aware of the hospitalization, when they became aware (during or post hospitalization) and how they came to be aware.
Data Analysis
The qualitative analysis of the patient interview data was performed using Atlas.ti 5.2 (Berlin) software program. The deductive approach was used for post‐discharge problems that had been characterized in prior literature, such as problems with follow up tests, medications, medical errors, and risk of rehospitalization.2, 16 The constant comparative method was used for the emergence of new codes.17 With this inductive method, the interviews were coded with no a priori assumptions, and each incident was characterized during the initial coding process. The incidents were then compared between the interviews to integrate them into themes and categories. This initial coding scheme was developed by a team (VA, JF, MP) from a sample of 5 transcripts. Using these newly emerged codes, the scheme was then applied to the rest of the transcripts (MP). Two new codes emerged from the deductive approach, negative emotions and patient empowerment, which are discussed in detail in the results.
Quantitative data were analyzed using Stata 10.0 (College Station, TX) software. Descriptive statistics were used to tabulate the frequency and percentage that patients reported a post‐discharge problem. A post‐discharge problem was defined by the patient reporting confusion or having problems at discharge with medications, follow‐up tests or appointments. The frequency and percentage for PCP‐reported awareness of the hospitalization was also tabulated. A Fisher's exact test was used to examine the association between post‐discharge problems and PCP awareness of hospitalization. Similar tests were performed to assess the association between new codes and post‐discharge problems. To assess for responder bias, responders and nonresponders were compared using chi‐square tests and t‐tests, where appropriate, to assess for differences in age, race, gender, education, income, admission in the past 12 months, residence, PCP location, mental status, length of stay, and discharge status.
Results
Of the 114 eligible patients recruited between February and July 2008, 64 patient interviews were completed (56%). The average patient age was 73 years. Most patients were female (69%), African American (70%), live at home (75%), and have a PCP located at the University of Chicago (70%). There were also several who were low income (23% below a median yearly income of $15,000), and did not attend any college (52%). These patients had an average length of stay of 5.3 days, nearly half (48%) having been hospitalized in the past year, and 6 patients (9%) required a proxy to complete the interview (Table 1). There were no significant differences between responders and nonresponders with respect to race, gender, education, income, admission in the past 12 months, residence, PCP location, mental status, length of stay, or discharge status. Responders were more likely to be older than nonresponders (73 years [95% confidence interval {CI} 6976 years] vs. 63 years for nonresponders [95% CI 5769 years]; [P < 0.01]).
Forty‐two percent (27) of patients reported experiencing a post‐discharge problem. These 27 patients reported 42 distinct problems, each of which fell into 1 of 5 broad categories (Table 2). The most common of these were patients having difficulty obtaining follow‐up tests or appointments. These patients either had delay in getting, or were unable to get, follow‐up appointments, or follow‐up tests and test results. There were also many patients who needed reevaluation and thus, were either readmitted to the hospital or had to return to the Emergency Department. Another major category was those who had problems getting medication or therapy. For example, one of (the patients) treatment medswas very hard to find and it delayed us giving her her meds. Others reported they were not properly prepared for discharge. Most of these patients did not receive proper discharge materials which then caused other issues. As one proxy reported, The services were supposed to be provided for (the patient) through her social worker, no one has been informed to her being discharged or her being sent home. We have not gotten any services. Lastly, a few patients reported having hospital complications, such as post‐procedural complications, or questions, such as diagnosis questions.0
| Patient Characteristics (n = 64) | n (%) |
|---|---|
| |
| Mean age (year), mean (SD) | 73 15 |
| Female sex | 44 (69) |
| African American | 45 (70) |
| Mini Mental Status Exam score, mean (SD) | 19 5.8 |
| Proxy used for interview | 6 (9) |
| Length of Stay, mean days (SD) | 5.3 6.1 |
| On‐site PCP (University of Chicago) | 45 (70) |
| Hospitalized in the year prior to admission | 31(48) |
| Income | |
| <$15,000 | 15 (23) |
| >$15,000 | 15 (23) |
| Don't know or refused | 34 (53) |
| Residence | |
| Own house or apartment | 48 (75) |
| Relative or friend house or apartment | 6 (9) |
| Nursing home, group home, long term care home | 10 (16) |
| Education | |
| No college | 33 (52) |
| At least some college | 25 (39) |
| Not sure or do not know | 6 (9) |
| Category (n) | Sub‐Category (n) | Representative Incident (Patient) |
|---|---|---|
| ||
| Difficulty obtaining follow‐up (12) | Appointment issues (8) | I had an earlier (follow‐up appointment) with (my PCP) but by me staying at my daughter's I didn't have access to a car. |
| Test issues (4) | I was in a very weakened state, so I was scared to get on the bus by myself (for the appointment for the chest x‐ray)..I'm going to try (to reschedule), because I can't seem to get the phone number. | |
| Needed re‐evaluation (10) | Readmission (7) | They let me come home, and then that morning they said when I got my house I was on the floor. And so that's why I had to go back to the hospital. |
| Return to ER or clinic (3) | I went back to the emergency room after a few weeks of course. | |
| Problems getting treatments (8) | Medication (7) | I had problems getting my medications because they tell me that the medication was so high, but anyway, I didn't get some of my medications. |
| Therapy (1) | I gave (my insurance company) the information sent the information they wanted to them and we thought everything was settledwe wasn't having any problems until I got hospitalized and came home and started trying to get my oxygen. | |
| Not prepared for discharge (8) | Discharge material issues (6) | I needed a copy of his discharge papers from the hospital for insurance purposesThey didn't give me a discharge paper. |
| Not ready to go home (2) | I told them I wasn't ready to leave, they told me I had to go. | |
| Ongoing problem or question after hospitalization (4) | Post‐procedural problem (3) | Now they're finding out all this bleeding but they don't know where I'm bleeding from. |
| Diagnosis questions (1) | I was diagnoseda long time ago and I went 8 years with this death sentence hanging over my headshe ran a battery of tests and they all came up negativenow they're coming up with the fact that I do have hepatitis C. | |
Patients were often uncertain of whether and how communication between the inpatient physician and PCP (Table 3) took place. One patient said, I don't know what the procedure is as far as giving him the message. Does she fax it to him? I don't know She told me that she was going to call and inform him on everything that happened. I don't know anything from there. The second most commonly expressed perception was from patients who assumed good communication had taken place between his or her physicians. This assumption was grounded in a belief that good communication naturally occurred between physicians. For example 1 patient expressed: (doctors) let the other doctors in too. That's the way to take care of stuff. Lastly, many patients expressed the feeling that their physicians were obligated to communicate with each other. As 1 patient reported, I think that they should have let (my PCP) know that I was in the hospital.
| Category (n) | Sub‐Category (n) | Representative Incident (Patient) |
|---|---|---|
| ||
| Patient Perceptions of inpatient physician communication with PCP (80) | Uncertainty or confusion about the communication (63) | I don't know if they spoke to each other over the phone or if they had any kind of communication. |
| Assumption of good communication (24) | Well I thought by me going to the hospital the doctors would let them know I was there because they all doctors. | |
| Obligation to communicate with PCP (16) | I think they should because there are two doctors who are attending me and they should have communication with each other. | |
Two new themes emerged from the inductive analysis (Table 4). Forty‐five percent of patients reported experiencing negative emotions. These negative emotions were most often expressed as frustration or confusion. For example, 1 patient expressed confusion by saying, When I usually have lab work done I have prescription signedmaybe they changed the way of doing it. Now the pharmacy called me. But I'm supposed to have a note or something. Patients who reported a post‐discharge problem were more likely to report negative emotions (67% vs. 26%, P < 0.01). Feelings of empowerment were reported by 31% of patients. Empowerment was expressed most often as the patient being proactive in communicating with the PCP. One patient reported, We informed (my PCP) and we filled in all of the information that we wanted him to know about. Empowerment was also expressed as being proactive in advocating for communication between the inpatient team and the PCP (Table 3). Some patients expressed feeling empowered through the support of a third party, such as a home nurse. In addition, patients who have a third party advocate are more likely to report being empowered. Empowerment was expressed by 26% of patients with no third party advocate compared with 71% of patients with a third party advocate (P = 0.02).
| Category (n) | Sub‐Category (n) | Representative Incident (Patient) |
|---|---|---|
| ||
| Negative emotions (43) | Frustration (28) | you don't have any decision in your own healthcare at all. I think that's terrible. |
| Confusion (15) | there were all sorts of other tests that different doctors whom I never even knew why they wanted to do these things. | |
| Patient empowerment (24) | Patient proactive in physician communication (19) | I made certain that everybody let (PCP) know exactly what I was doing the whole time I was in and out and all of that (63457) I took it upon myself to call (PCP). |
| Has a third party advocate (8) | The only reason [home follow‐up services] found out is because her nurse was concerned enough to call and keep inquiring about how she was doing. | |
| Patient proactive in his or her own healthcare (5) | I am not scared of the doctors and scared to speak up, especially when it comes to my body and my health. | |
From our sample of patients who completed a 2‐week post‐discharge interview, we were able to obtain PCP surveys for 40 (63%) of these patients (Figure 1). Thirty percent (12) of PCPs reported being unaware of the hospitalization. In all but 4 cases, PCPs had communicated with the medical team during hospitalization. Examining the association between PCP knowledge and patient reported post‐discharge problems showed that patients whose PCPs were not aware of the hospitalization were 2 times more likely to report a post‐discharge problem. A post‐discharge problem was reported by 67% of patients whose PCP was not aware of the hospitalization, while a post‐discharge problem was reported by 32% of patients whose PCP was aware (P < 0.05). Six patients reported returning to the ED or being readmitted. Four patients (33%) of PCPs who were unaware of hospitalization reported returning for reevaluation whereas 7% (n = 2) of patients whose PCP was aware of hospitalization reported returning for evaluation (P = 0.055). Interestingly, patients whose PCPs were not aware of the hospitalization reported feeling more empowered (58%) than those patients whose PCP were aware of the hospitalization (21%, P = 0.03). Because of possible confounding (patient report of problems post‐discharge problems may be affected by PCP awareness of hospitalization), we examined whether patients whose PCPs were aware of their hospitalization differed from those that did not. Patients whose PCPs were aware of their hospitalization were often older (75 vs. 69 years old), white (80% white vs. 65% nonwhite) and female (75% female vs. 54% male). While this small sample size prohibits examining for statistical significance, the magnitude of these differences suggests the need for a larger study to examine patient predictors of PCP awareness of hospitalization.
Discussion
In this sample of frail, older hospitalized patients, nearly half reported at least 1 post‐discharge problem. Most patients have perceptions of what communication did or did not take place between their physicians. While most do not understand the communication process, many expect good communication to occur, and feel that physicians are obligated to communicate with each other. However, patients' perceptions of communication highlight that patient expectations are far from the actual practice in some cases. Nearly half of patients reported feeling negative emotions, such as confusion and frustration, and patients were more likely to experience negative emotions when they also reported a post‐discharge problem. One‐third of patients reported feeling empowered. Empowerment was associated with having a third party who helped advocate for them. Paradoxically, patients whose PCP were not aware of their hospitalization were more likely to feel empowered. Lastly, more patients reported a post‐discharge problem when their PCP was not aware of the hospitalization.
Because this is predominantly a qualitative observational study, it is important to consider the mechanism for these findings since we cannot assume causal relationships. The association of negative emotions, like confusion and frustration, with post‐discharge problems could be explained due to additional stress of the problem itself or that a distressed frame of mind is associated with reporting more problems that may have been overlooked otherwise. In addition, the association between patient empowerment and lack of PCP awareness could be due to the fact that patients are forced to assume a more proactive role in contacting their PCP if they feel that their PCP was not aware. It is equally possible that PCP communication is selectively initiated by hospital physicians when the patients are least empowered. For example, our comparison of demographics for patients whose PCP was aware versus those that were not do suggest that patient characteristics might play a role in whether a patient's PCP is contacted. The association between a third party advocate and patient empowerment is likely explained as the third party is able to keep the patient informed and empowered.
This study has implications for efforts to design a more patient‐centered care transition for hospitalized older patients. First, patients and their proxies should be advocates for good communication to avoid the risks of care transitions. Prior interventions such as use of coaches to boost patient empowerment have had positive results for hospitalized older patients. Moreover, hospitals should keep in mind that problems after discharge are common and are linked to negative emotions, which may lower patient satisfaction or increase liability risk. Similarly, these findings also highlight the importance of keeping PCPs aware of patient hospitalization. For example, PCPs that are aware of hospitalization are better prepared to properly follow‐up on medications, tests, and appointments. The PCP can also help to better prepare the patient for discharge and ease the transition for the patient.
There are several limitations to our study. First and foremost, our small sample size limits our ability to examine statistical significance. This study was part of a short planning grant to design interventions to improve communication with PCPs during hospitalization. Efforts are currently underway to design a communication solution and educational intervention to highlight the importance of contacting PCPs during hospitalization. Because these patients were hospitalized on the teaching service, the resident with the guidance of the teaching attending is responsible for communicating with the PCP. The teaching attending was either a generalist, hospitalist, or specialist who routinely had no a priori relationship with patients prior to the hospitalization. Only 53% of patients were reached by telephone which raises the concern for nonresponse bias. Our low response rate highlights the challenge of doing this type of work with recently discharge patients in low income, underserved areas. In comparing responders and nonresponders, the only difference between the 2 groups was that responders were more likely to be older. One possible reason for this difference may be that older people are more likely to be at home and easier to contact over the phone. Similarly, since data were collected through interviews and adverse events were discussed, these results are subject to recall bias. Efforts were made to reduce this by calling within 2 to 3 weeks after discharge. Lastly, these findings are limited by generalizability. All the patients included in this study were from the University of Chicago Medical Center, which serves largely underserved, African American patients. The experiences of these patients may be unique to this site. In addition, we only studied patients who had a PCP, excluding a population of patients that are at inherent risk due to lack of a coordinating physician to guide ongoing care.
In conclusion, this study suggests that many frail, older patients reported experiencing a post‐discharge problem and patients whose PCPs did not know about their admission were more likely to report a post‐discharge problem. Systematic interventions to improve communications with PCPs during patient care transitions in and out of the hospital are needed.
Acknowledgements
The authors thank Ms. Meryl Prochaska for her research assistance and manuscript preparation.
- , , , et al.Effects of physician experience on costs and outcomes on an academic general medicine service: results of a trial of hospitalists.Ann Intern Med.2002;137(11):866–874.
- , .The Hospitalist Movement 5 Years Later.JAMA.2002;287(4):487–494.
- , , , et al.Transitions of Care Consensus Policy Statement American College of Physicians‐Society of General Internal Medicine‐Society of Hospital Medicine‐American Geriatrics Society‐American College of Emergency Physicians‐Society of Academic Emergency Medicine.J Gen Intern Med.2009;24(8):971–976.
- , , , , , .Deficits in Communication and information transfer between hospital‐based and primary care physicians: implications for patient safety and continuity of care.JAMA.2007;297(8):831–841.
- , , , et al.Patient safety concerns arising from test results that return after hospital discharge.Ann Intern Med.2005;143(2):121–131.
- , , , .Maintaining continuity of care: a look at the quality of communication between Ontario emergency departments and community physicians.CJEM.2005;7(3):155–161.
- , , , , .Adverse drug events occuring following hospital discharge.J Gen Intern Med.2005;20(4):317–323.
- , , , , , .Electronically screening discharge summaries for adverse medical events.J Am Med Infrom Assoc.2003;10(4):339–350.
- , , , , .The incidence and severity of adverse events affecting patients after discharge from the hospital.Ann Intern Med.2003;138:161–167.
- , , , et al.Comparing patient‐reported hospital adverse events with the medical record review: do patients know something that hospitals do not?Ann Intern Med.2005;149(2):100–108.
- , , , et al.What can hospitalized patients tell us about adverse events? Learning from the patient‐reported incidents.J Gen Intern Med.2005;20(9):830–836.
- , , , et al.The Vulnerable Elders Survey: a tool for identifying vulnerable older people in the community.J Am Geriatr Soc.2001;49:1691–1699.
- , , , .Validation of a telephone version of the mini‐mental state examination.J Am Geriatr Soc.1992;40(7):697–702.
- .The critical incident technique.Psychol Bull.1954;51(4):327–359.
- .The critical incident technique in service research.J Serv Res.2004;7:65–89.
- , , , .Medical errors related to discontinuity of care from an inpatient to an outpatient setting.J Gen Intern Med.2003;18:646–651.
- .A Purposeful approach to the constant comparative method in the analysis of qualitative interviews.Qual Quant2002;36:3392–3340.
Recently, there has been an increased focus on improving communication during care transitions for older patients as they leave the hospital. One reason for this focus is the increasing utilization of hospitalists, or hospital‐based physicians, caring for patients in the United States.1 As a result, many primary care physicians (PCPs) no longer care for their patients while in the hospital and may not be informed of their patients' hospitalization.2 Additionally, with an emphasis on shorter lengths of hospital stay, more extensive post‐discharge follow‐up is often warranted for patients, which often becomes the responsibility of a patient's PCP. Recently 6 societies (American College of Physicians, Society of General Internal Medicine, Society of Hospital Medicine, American Geriatrics Society, American College of Emergency Physicians, and Society of Academic Emergency Medicine) have recommended that a patient's PCP is notified during all steps in care transitions and that patient‐centered approaches are employed.3 Despite the increased need for improved inpatient‐ambulatory care transitions, the communication between hospitalists and PCPs has been characterized as being poor and ineffective.4 Prior studies have shown that PCPs are not aware of test results that require follow‐up, may not receive timely or high quality discharge materials, and have an overall poor perception of the quality of communication.46 Ensuring adequate communication is considered important due to the increased risk of adverse events that patients experience after discharge from the hospital.79 Furthermore, recent studies have shown that patients are often able to identify and report adverse events that would not be detected by medical record review alone.10, 11 Eliciting patient perspectives on their experiences after discharge and their expectations of communication between PCPs and hospital physicians can help clinical teams design more patient‐centered solutions for care transitions.
The aim of this study is to report older patients' experiences with problems after hospital discharge and their understanding and expectation of communication between hospital physicians and their PCP. We also explored the relationship between patient experiences and whether their PCPs were aware of their hospitalization.
Methods
Study Design
Patients were recruited for this study from February 2008 to July 2008 using the University of Chicago Hospitalist Study, a large ongoing study that interviews hospitalized patients regarding quality of care.1 Two enrollment strategies were used; in order to oversample frail elders, all patients who were defined to be vulnerable elders using the VES‐13, based on age, self‐rated health, and physical function are asked to consent to surveying their PCP about their admission.12 In addition, every tenth hospitalized patient (with medical record number ending in 5) was asked to consent to have his or her PCP surveyed about communication regarding their admission. Patients who could not name a PCP or those patients who named a physician who denied caring for that patient were excluded. The study was approved by the University of Chicago Institutional Review Board.
Inpatient Interview and Chart Review
Within 48 hours of hospitalization, patients were approached by trained research assistants and first asked to complete the telephone version of the Mini‐Mental Status Exam.13 For those patients who scored a 17 or below on this 22‐point instrument, a proxy was approached to consent to the study and complete the interview protocol. Patients or their proxies then completed an inpatient interview to ascertain age, sex, self‐reported race, income, education and place of residence (home, nursing home). Patients were also asked if their PCP is affiliated with the University of Chicago and whether they had been hospitalized in the year prior to admission. Chart reviews were conducted for calculation of length of stay and location of discharge was also obtained (ie, rehabilitation, home, nursing home).
Two‐Week Post‐Discharge Phone Interview
To ascertain patient reports of problems after discharge, we conducted telephone interviews of eligible patients and/or their proxies 2 weeks after discharge. During the telephone interviews, each patient was asked 12 open‐ended questions to facilitate the reporting of events. Interviews were conducted by trained research assistants, who were blinded to whether the PCP was aware of a patient's hospitalization. Questions focused on the patient's perception of the quality and extent of communication that occurred between his or her identified PCP and the inpatient physician who provided his or her care while hospitalized. For example, the patient was asked if his or her PCP was aware of the hospitalization and if so, the patient was also asked: Do you know who told your regular doctor? Patients were asked about their perception of their PCP's knowledge of their clinical course.
Because we were interested in understanding problems after discharge, we used critical incident technique to solicit the patient's experience with these events. This technique was initially developed to study aviation accidents and can broaden our understanding of rare and poorly observed events by using subjective reports of an individual's own experience.14, 15 From the literature, we a priori identified post‐discharge problems including difficulties with follow‐up tests or appointments, medication changes, and readmission. Thus, we asked each patient, Did anything bad or inconvenient happen following your hospital stay, such as problems with new medications, missing a test, going back to the hospital. The interviews were audio‐taped and transcribed for analysis.
PCP Surveys
To supplement the patient‐reported data and to complete our understanding of what communication did or did not take place, the PCP of each enrolled patient was faxed a survey that ascertained PCP awareness of the hospitalization using the yes or no response to the question Were you aware that your patient had been hospitalized? For those patients who successfully completed the interview, PCPs who had not responded to the fax were also called by telephone to ascertain whether they were aware of the hospitalization, when they became aware (during or post hospitalization) and how they came to be aware.
Data Analysis
The qualitative analysis of the patient interview data was performed using Atlas.ti 5.2 (Berlin) software program. The deductive approach was used for post‐discharge problems that had been characterized in prior literature, such as problems with follow up tests, medications, medical errors, and risk of rehospitalization.2, 16 The constant comparative method was used for the emergence of new codes.17 With this inductive method, the interviews were coded with no a priori assumptions, and each incident was characterized during the initial coding process. The incidents were then compared between the interviews to integrate them into themes and categories. This initial coding scheme was developed by a team (VA, JF, MP) from a sample of 5 transcripts. Using these newly emerged codes, the scheme was then applied to the rest of the transcripts (MP). Two new codes emerged from the deductive approach, negative emotions and patient empowerment, which are discussed in detail in the results.
Quantitative data were analyzed using Stata 10.0 (College Station, TX) software. Descriptive statistics were used to tabulate the frequency and percentage that patients reported a post‐discharge problem. A post‐discharge problem was defined by the patient reporting confusion or having problems at discharge with medications, follow‐up tests or appointments. The frequency and percentage for PCP‐reported awareness of the hospitalization was also tabulated. A Fisher's exact test was used to examine the association between post‐discharge problems and PCP awareness of hospitalization. Similar tests were performed to assess the association between new codes and post‐discharge problems. To assess for responder bias, responders and nonresponders were compared using chi‐square tests and t‐tests, where appropriate, to assess for differences in age, race, gender, education, income, admission in the past 12 months, residence, PCP location, mental status, length of stay, and discharge status.
Results
Of the 114 eligible patients recruited between February and July 2008, 64 patient interviews were completed (56%). The average patient age was 73 years. Most patients were female (69%), African American (70%), live at home (75%), and have a PCP located at the University of Chicago (70%). There were also several who were low income (23% below a median yearly income of $15,000), and did not attend any college (52%). These patients had an average length of stay of 5.3 days, nearly half (48%) having been hospitalized in the past year, and 6 patients (9%) required a proxy to complete the interview (Table 1). There were no significant differences between responders and nonresponders with respect to race, gender, education, income, admission in the past 12 months, residence, PCP location, mental status, length of stay, or discharge status. Responders were more likely to be older than nonresponders (73 years [95% confidence interval {CI} 6976 years] vs. 63 years for nonresponders [95% CI 5769 years]; [P < 0.01]).
Forty‐two percent (27) of patients reported experiencing a post‐discharge problem. These 27 patients reported 42 distinct problems, each of which fell into 1 of 5 broad categories (Table 2). The most common of these were patients having difficulty obtaining follow‐up tests or appointments. These patients either had delay in getting, or were unable to get, follow‐up appointments, or follow‐up tests and test results. There were also many patients who needed reevaluation and thus, were either readmitted to the hospital or had to return to the Emergency Department. Another major category was those who had problems getting medication or therapy. For example, one of (the patients) treatment medswas very hard to find and it delayed us giving her her meds. Others reported they were not properly prepared for discharge. Most of these patients did not receive proper discharge materials which then caused other issues. As one proxy reported, The services were supposed to be provided for (the patient) through her social worker, no one has been informed to her being discharged or her being sent home. We have not gotten any services. Lastly, a few patients reported having hospital complications, such as post‐procedural complications, or questions, such as diagnosis questions.0
| Patient Characteristics (n = 64) | n (%) |
|---|---|
| |
| Mean age (year), mean (SD) | 73 15 |
| Female sex | 44 (69) |
| African American | 45 (70) |
| Mini Mental Status Exam score, mean (SD) | 19 5.8 |
| Proxy used for interview | 6 (9) |
| Length of Stay, mean days (SD) | 5.3 6.1 |
| On‐site PCP (University of Chicago) | 45 (70) |
| Hospitalized in the year prior to admission | 31(48) |
| Income | |
| <$15,000 | 15 (23) |
| >$15,000 | 15 (23) |
| Don't know or refused | 34 (53) |
| Residence | |
| Own house or apartment | 48 (75) |
| Relative or friend house or apartment | 6 (9) |
| Nursing home, group home, long term care home | 10 (16) |
| Education | |
| No college | 33 (52) |
| At least some college | 25 (39) |
| Not sure or do not know | 6 (9) |
| Category (n) | Sub‐Category (n) | Representative Incident (Patient) |
|---|---|---|
| ||
| Difficulty obtaining follow‐up (12) | Appointment issues (8) | I had an earlier (follow‐up appointment) with (my PCP) but by me staying at my daughter's I didn't have access to a car. |
| Test issues (4) | I was in a very weakened state, so I was scared to get on the bus by myself (for the appointment for the chest x‐ray)..I'm going to try (to reschedule), because I can't seem to get the phone number. | |
| Needed re‐evaluation (10) | Readmission (7) | They let me come home, and then that morning they said when I got my house I was on the floor. And so that's why I had to go back to the hospital. |
| Return to ER or clinic (3) | I went back to the emergency room after a few weeks of course. | |
| Problems getting treatments (8) | Medication (7) | I had problems getting my medications because they tell me that the medication was so high, but anyway, I didn't get some of my medications. |
| Therapy (1) | I gave (my insurance company) the information sent the information they wanted to them and we thought everything was settledwe wasn't having any problems until I got hospitalized and came home and started trying to get my oxygen. | |
| Not prepared for discharge (8) | Discharge material issues (6) | I needed a copy of his discharge papers from the hospital for insurance purposesThey didn't give me a discharge paper. |
| Not ready to go home (2) | I told them I wasn't ready to leave, they told me I had to go. | |
| Ongoing problem or question after hospitalization (4) | Post‐procedural problem (3) | Now they're finding out all this bleeding but they don't know where I'm bleeding from. |
| Diagnosis questions (1) | I was diagnoseda long time ago and I went 8 years with this death sentence hanging over my headshe ran a battery of tests and they all came up negativenow they're coming up with the fact that I do have hepatitis C. | |
Patients were often uncertain of whether and how communication between the inpatient physician and PCP (Table 3) took place. One patient said, I don't know what the procedure is as far as giving him the message. Does she fax it to him? I don't know She told me that she was going to call and inform him on everything that happened. I don't know anything from there. The second most commonly expressed perception was from patients who assumed good communication had taken place between his or her physicians. This assumption was grounded in a belief that good communication naturally occurred between physicians. For example 1 patient expressed: (doctors) let the other doctors in too. That's the way to take care of stuff. Lastly, many patients expressed the feeling that their physicians were obligated to communicate with each other. As 1 patient reported, I think that they should have let (my PCP) know that I was in the hospital.
| Category (n) | Sub‐Category (n) | Representative Incident (Patient) |
|---|---|---|
| ||
| Patient Perceptions of inpatient physician communication with PCP (80) | Uncertainty or confusion about the communication (63) | I don't know if they spoke to each other over the phone or if they had any kind of communication. |
| Assumption of good communication (24) | Well I thought by me going to the hospital the doctors would let them know I was there because they all doctors. | |
| Obligation to communicate with PCP (16) | I think they should because there are two doctors who are attending me and they should have communication with each other. | |
Two new themes emerged from the inductive analysis (Table 4). Forty‐five percent of patients reported experiencing negative emotions. These negative emotions were most often expressed as frustration or confusion. For example, 1 patient expressed confusion by saying, When I usually have lab work done I have prescription signedmaybe they changed the way of doing it. Now the pharmacy called me. But I'm supposed to have a note or something. Patients who reported a post‐discharge problem were more likely to report negative emotions (67% vs. 26%, P < 0.01). Feelings of empowerment were reported by 31% of patients. Empowerment was expressed most often as the patient being proactive in communicating with the PCP. One patient reported, We informed (my PCP) and we filled in all of the information that we wanted him to know about. Empowerment was also expressed as being proactive in advocating for communication between the inpatient team and the PCP (Table 3). Some patients expressed feeling empowered through the support of a third party, such as a home nurse. In addition, patients who have a third party advocate are more likely to report being empowered. Empowerment was expressed by 26% of patients with no third party advocate compared with 71% of patients with a third party advocate (P = 0.02).
| Category (n) | Sub‐Category (n) | Representative Incident (Patient) |
|---|---|---|
| ||
| Negative emotions (43) | Frustration (28) | you don't have any decision in your own healthcare at all. I think that's terrible. |
| Confusion (15) | there were all sorts of other tests that different doctors whom I never even knew why they wanted to do these things. | |
| Patient empowerment (24) | Patient proactive in physician communication (19) | I made certain that everybody let (PCP) know exactly what I was doing the whole time I was in and out and all of that (63457) I took it upon myself to call (PCP). |
| Has a third party advocate (8) | The only reason [home follow‐up services] found out is because her nurse was concerned enough to call and keep inquiring about how she was doing. | |
| Patient proactive in his or her own healthcare (5) | I am not scared of the doctors and scared to speak up, especially when it comes to my body and my health. | |
From our sample of patients who completed a 2‐week post‐discharge interview, we were able to obtain PCP surveys for 40 (63%) of these patients (Figure 1). Thirty percent (12) of PCPs reported being unaware of the hospitalization. In all but 4 cases, PCPs had communicated with the medical team during hospitalization. Examining the association between PCP knowledge and patient reported post‐discharge problems showed that patients whose PCPs were not aware of the hospitalization were 2 times more likely to report a post‐discharge problem. A post‐discharge problem was reported by 67% of patients whose PCP was not aware of the hospitalization, while a post‐discharge problem was reported by 32% of patients whose PCP was aware (P < 0.05). Six patients reported returning to the ED or being readmitted. Four patients (33%) of PCPs who were unaware of hospitalization reported returning for reevaluation whereas 7% (n = 2) of patients whose PCP was aware of hospitalization reported returning for evaluation (P = 0.055). Interestingly, patients whose PCPs were not aware of the hospitalization reported feeling more empowered (58%) than those patients whose PCP were aware of the hospitalization (21%, P = 0.03). Because of possible confounding (patient report of problems post‐discharge problems may be affected by PCP awareness of hospitalization), we examined whether patients whose PCPs were aware of their hospitalization differed from those that did not. Patients whose PCPs were aware of their hospitalization were often older (75 vs. 69 years old), white (80% white vs. 65% nonwhite) and female (75% female vs. 54% male). While this small sample size prohibits examining for statistical significance, the magnitude of these differences suggests the need for a larger study to examine patient predictors of PCP awareness of hospitalization.
Discussion
In this sample of frail, older hospitalized patients, nearly half reported at least 1 post‐discharge problem. Most patients have perceptions of what communication did or did not take place between their physicians. While most do not understand the communication process, many expect good communication to occur, and feel that physicians are obligated to communicate with each other. However, patients' perceptions of communication highlight that patient expectations are far from the actual practice in some cases. Nearly half of patients reported feeling negative emotions, such as confusion and frustration, and patients were more likely to experience negative emotions when they also reported a post‐discharge problem. One‐third of patients reported feeling empowered. Empowerment was associated with having a third party who helped advocate for them. Paradoxically, patients whose PCP were not aware of their hospitalization were more likely to feel empowered. Lastly, more patients reported a post‐discharge problem when their PCP was not aware of the hospitalization.
Because this is predominantly a qualitative observational study, it is important to consider the mechanism for these findings since we cannot assume causal relationships. The association of negative emotions, like confusion and frustration, with post‐discharge problems could be explained due to additional stress of the problem itself or that a distressed frame of mind is associated with reporting more problems that may have been overlooked otherwise. In addition, the association between patient empowerment and lack of PCP awareness could be due to the fact that patients are forced to assume a more proactive role in contacting their PCP if they feel that their PCP was not aware. It is equally possible that PCP communication is selectively initiated by hospital physicians when the patients are least empowered. For example, our comparison of demographics for patients whose PCP was aware versus those that were not do suggest that patient characteristics might play a role in whether a patient's PCP is contacted. The association between a third party advocate and patient empowerment is likely explained as the third party is able to keep the patient informed and empowered.
This study has implications for efforts to design a more patient‐centered care transition for hospitalized older patients. First, patients and their proxies should be advocates for good communication to avoid the risks of care transitions. Prior interventions such as use of coaches to boost patient empowerment have had positive results for hospitalized older patients. Moreover, hospitals should keep in mind that problems after discharge are common and are linked to negative emotions, which may lower patient satisfaction or increase liability risk. Similarly, these findings also highlight the importance of keeping PCPs aware of patient hospitalization. For example, PCPs that are aware of hospitalization are better prepared to properly follow‐up on medications, tests, and appointments. The PCP can also help to better prepare the patient for discharge and ease the transition for the patient.
There are several limitations to our study. First and foremost, our small sample size limits our ability to examine statistical significance. This study was part of a short planning grant to design interventions to improve communication with PCPs during hospitalization. Efforts are currently underway to design a communication solution and educational intervention to highlight the importance of contacting PCPs during hospitalization. Because these patients were hospitalized on the teaching service, the resident with the guidance of the teaching attending is responsible for communicating with the PCP. The teaching attending was either a generalist, hospitalist, or specialist who routinely had no a priori relationship with patients prior to the hospitalization. Only 53% of patients were reached by telephone which raises the concern for nonresponse bias. Our low response rate highlights the challenge of doing this type of work with recently discharge patients in low income, underserved areas. In comparing responders and nonresponders, the only difference between the 2 groups was that responders were more likely to be older. One possible reason for this difference may be that older people are more likely to be at home and easier to contact over the phone. Similarly, since data were collected through interviews and adverse events were discussed, these results are subject to recall bias. Efforts were made to reduce this by calling within 2 to 3 weeks after discharge. Lastly, these findings are limited by generalizability. All the patients included in this study were from the University of Chicago Medical Center, which serves largely underserved, African American patients. The experiences of these patients may be unique to this site. In addition, we only studied patients who had a PCP, excluding a population of patients that are at inherent risk due to lack of a coordinating physician to guide ongoing care.
In conclusion, this study suggests that many frail, older patients reported experiencing a post‐discharge problem and patients whose PCPs did not know about their admission were more likely to report a post‐discharge problem. Systematic interventions to improve communications with PCPs during patient care transitions in and out of the hospital are needed.
Acknowledgements
The authors thank Ms. Meryl Prochaska for her research assistance and manuscript preparation.
- , , , et al.Effects of physician experience on costs and outcomes on an academic general medicine service: results of a trial of hospitalists.Ann Intern Med.2002;137(11):866–874.
- , .The Hospitalist Movement 5 Years Later.JAMA.2002;287(4):487–494.
- , , , et al.Transitions of Care Consensus Policy Statement American College of Physicians‐Society of General Internal Medicine‐Society of Hospital Medicine‐American Geriatrics Society‐American College of Emergency Physicians‐Society of Academic Emergency Medicine.J Gen Intern Med.2009;24(8):971–976.
- , , , , , .Deficits in Communication and information transfer between hospital‐based and primary care physicians: implications for patient safety and continuity of care.JAMA.2007;297(8):831–841.
- , , , et al.Patient safety concerns arising from test results that return after hospital discharge.Ann Intern Med.2005;143(2):121–131.
- , , , .Maintaining continuity of care: a look at the quality of communication between Ontario emergency departments and community physicians.CJEM.2005;7(3):155–161.
- , , , , .Adverse drug events occuring following hospital discharge.J Gen Intern Med.2005;20(4):317–323.
- , , , , , .Electronically screening discharge summaries for adverse medical events.J Am Med Infrom Assoc.2003;10(4):339–350.
- , , , , .The incidence and severity of adverse events affecting patients after discharge from the hospital.Ann Intern Med.2003;138:161–167.
- , , , et al.Comparing patient‐reported hospital adverse events with the medical record review: do patients know something that hospitals do not?Ann Intern Med.2005;149(2):100–108.
- , , , et al.What can hospitalized patients tell us about adverse events? Learning from the patient‐reported incidents.J Gen Intern Med.2005;20(9):830–836.
- , , , et al.The Vulnerable Elders Survey: a tool for identifying vulnerable older people in the community.J Am Geriatr Soc.2001;49:1691–1699.
- , , , .Validation of a telephone version of the mini‐mental state examination.J Am Geriatr Soc.1992;40(7):697–702.
- .The critical incident technique.Psychol Bull.1954;51(4):327–359.
- .The critical incident technique in service research.J Serv Res.2004;7:65–89.
- , , , .Medical errors related to discontinuity of care from an inpatient to an outpatient setting.J Gen Intern Med.2003;18:646–651.
- .A Purposeful approach to the constant comparative method in the analysis of qualitative interviews.Qual Quant2002;36:3392–3340.
Copyright © 2010 Society of Hospital Medicine

Calciphylaxis in Renal Failure
Narrative Description
This Case Report reviews the presentation, the differential diagnosis and the treatment modalities used to treat calciphylaxis. It emphasizes the poor prognosis and that there is inadequate clinical experience to guide a physician as to what the most appropriate treatment is despite promising anecdotal reports about a variety of agents. The report demonstrates that intravenous sodium thiosulfate is tolerated.
Key Points
-
Calciphylaxis occurs in 1 to 4% of patients with end stage renal failure.
-
Two patterns of presentation are generally recognizedcentral and peripheral.
-
Pain is a prominent symptom and eschar formation is usually present.
-
The role of surgery is controversial.
-
Several promising modalities for the treatment of this condition have been described in anecdotal reports.
Calciphylaxis is a rare condition. It is seen most frequently in patients with chronic kidney disease and can affect any part of the body.14 Calciphylaxis is increasingly being referred to as calcific uremic arteriolopathy as this term more accurately reflects the histology of vascular calcification in small‐ and medium‐sized arteries, intimal arterial hypertrophy, and small vessel thrombosis associated with panniculitis, dermal necrosis, and eschar formation.5 Pain is a prominent symptom. The most effective treatment for this condition remains uncertain.
Case Report
A 68‐year‐old female presented with an 8‐month history of increasing lower extremity edema, and numerous large, painful, necrotic ulcers with an associated foul odor. She had a past medical history of type 2 diabetes mellitus, hypertension, end stage renal disease requiring hemodialysis 3 times a week for the previous 6 months, severe peripheral vascular disease, coronary artery disease for which she had previously undergone coronary artery bypass surgery, multiple myocardial infarctions, and congestive heart failure with an ejection fraction of 20%. She had also suffered from numerous infections including septicemia, endocarditis, and a sternal wound infection in the past with no current evidence of septicemia or endocarditis. The patient was not on calcium supplements, Vitamin D, warfarin or calcium‐containing phosphate binders.
Eight months prior to admission she developed vesicles on the left thigh that slowly progressed to large, extremely painful, violaceous, indurated plaques with central ulceration and eschar (Figure 1). She subsequently developed several smaller lesions with similar morphology on her legs and feet and gangrene of her left big toe (Figure 2). A biopsy from the left thigh was consistent with calciphylaxis with associated necrosis of the deep dermis and subcutaneous tissues. The patient's lesions were aggressively debrided, broad spectrum antibiotics given, and the patient dialyzed with low calcium dialysates. Ultimately intravenous sodium thiosulfate (25 g intravenously, over 60 minutes), was given which she tolerated with no side effect. Sodium thiosulfate is thought to act by forming highly soluble calcium thiosulfate salts and therefore mobilizing tissue calcium.5 Hyperbaric oxygen was contraindicated because of the patient's left ventricular ejection fraction (LVEF) of 20% and previous history of congestive heart failure as this treatment modality may precipitate congestive heart failure in a patient with a low LVEF particularly with a past history of congestive heart failure. Her condition continued to deteriorate and she died a few days after initiation of intravenous sodium thiosulfate infusion secondary to a massive gastrointestinal bleed.

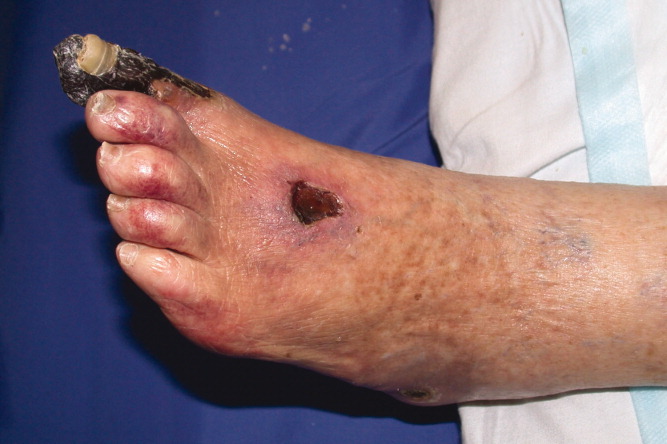
Discussion
The differential diagnosis for painful necrotic cutaneous ulcerations with eschar formation includes: calciphylaxis, cryoglobulinemia, cryofibrinogenema, peripheral vascular disease, embolic phenomenon (endocarditis, septic, cholesterol), warfarin skin necrosis, brown recluse spider bites, hypercoagulable states, hyperoxaluria, and necrotizing vasculitis.14
Calciphylaxis is a rare entity that affects approximately 1% to 4% of end stage renal failure patients.1, 3 The typical patient is a morbidly obese, female with longstanding end stage renal disease, diabetes, hyperphosphatemia and an elevated calcium‐phosphate product usually greater than 60 mg2/dL2.1, 3 It has also been described in patients with alcoholic cirrhosis and acute reversible renal failure,6 primary and secondary hyperparathyroidism,7 and metastatic breast cancer.8
Patients typically present with symmetric lesions that evolve from erythematous to violaceous, livedo‐reticularis like patches or plaques with occasional bullae to painful, indurated, necrotic plaques that subsequently ulcerate. The ulcerations are slow to heal and covered with eschar.4, 9
There are 2 patterns of involvement. The central/proximal pattern involves the abdomen, gluteal region, and thighs while the peripheral/distal pattern involves the extremities distal to the elbows and knees.1, 2, 4 The central pattern tends to carry a worse prognosis,9, 10 though this has not been validated in all reports and recent literature suggests that patients with both patterns have the worst prognosis.11
A biopsy may be required to exclude other diagnoses. The histology demonstrates an obliterative vasculopathy secondary to the vascular intimal changes and endovascular fibrosis.12 A suggestive finding is calcification of the medial wall of small‐ and medium‐sized arteries and arterioles with associated intimal hyperplasia and fibrosis. Necrosis of the surrounding tissue, panniculitis, and soft tissue calcification are often present.9, 13 The trauma of the biopsy can lead to worsening of the disease.
Secondary to its association with end stage renal disease, laboratory data often reveals elevated blood urea nitrogen (BUN), creatinine, parathyroid hormone, and calcium‐phosphate product. Bone scans show increased uptake in the subcutaneous calcified plaques.14 X‐rays utilizing mammogram technique have demonstrated arteriolar calcification.15
Besides chronic kidney disease, other potential risk factors include protein C and S deficiencies, obesity, warfarin use, high calcium containing dialysates, liver disease, and systemic corticosteroids.4, 9, 11, 16
Calciphylaxis is a difficult disease to treat with a mortality of 60% to 70%9 and a 1‐year survival rate of 45.8%.11 There is no consistently effective treatment.5 Therapy therefore, is focused on symptom control, debridement, and treatment of infection. Mortality is most commonly due to wound infections and resulting septicemia. Meticulous wound care is important with any infection treated early and aggressively. Though trauma and surgical procedures have been known to precipitate ulcerations, given their high rate of infection early surgical debridement of wounds is often required and has been shown to improve mortality.11, 17 Because of the poor healing of the involved tissues, wounds are often left to close by secondary intention or in some circumstances with vacuum assistance.2
As secondary hyperparathyroidism is common, attempts are often made to lower the calcium‐phosphate product. This often requires parathyroidectomy.18 Calcium containing phosphate binders are avoided and low calcium dialysate used.19 However, the above interventions do not consistently improve mortality.5, 11
Other potential treatments include: hyperbaric oxygen therapy,20 intravenous sodium thiosulfate,14 low‐dose tissue plasminogen activator,21 cinacalcet,22 etidronate disodium,23 and maggots.24 Because of the rarity of the condition, most of the literature to date is anecdotal and based on case reports and small retrospective studies.
Conclusions
As the number of patients who develop chronic kidney disease and require hemodialysis increases, it is likely that the number of patients who develop calciphylaxis will also increase. Hospitalists, besides nephrologists, should therefore become familiar with the presentation of this disease as it is possible, although unproven, that treatment in the early stage of the disease may result in a better response. Although several treatment modalities have been used to treat calcific uremic arteriolopathy or calciphylaxis, it remains unclear what is the best treatment for these patients. Carefully done clinical trials using some of the treatment modalities mentioned will help physicians decide what the most appropriate treatment is for patients with this debilitating and often fatal disease.
- ,,,.Early recognition and treatment of calciphylaxis.South Med J.2003;96:53–55.
- ,,,.Calciphylaxis: medical and surgical management of chronic extensive wounds in a renal dialysis population.Plast Reconstr Surg.2004;113:304–312.
- ,,, et al.Cutaneous necrosis by calcific uremic arteriolopathy.Int J Dermatol.2005;44:101–106.
- ,.Calciphylaxis.Int J Dermatol.2007;46:231–236.
- ,,.Calcific uremic arteriolopathy: Advances in pathogenesis and treatment.Semin Dial.2007;20:150–157.
- ,,, et al.Calciphylaxis associated with acute, reversible renal failure in the setting of alcoholic cirrhosis.J Am Acad Dermatol2004;50:S125–S128.
- ,,, et al.An unusual presentation of calciphylaxis due to primary hyperparathyroidism.Arch Pathol Lab Med.2001;125:1351–1353.
- ,,, et al.Calciphylaxis associated with metastatic breast carcinoma.J Am Acad Dermatol.1999;41:295–298.
- ,.Panniculitis. In: Freeberg IM, Eisen AZ, Wolff K, Austen KF, Goldsmith LA, Katz SI, eds.Fitzpatrick's Dermatology in General Medicine.6th ed.McGraw‐Hill,New York, NY.2003:1051–1052.
- ,,,.The vascular lesions associated with skin necrosis in renal disease.Br J Dermatol.1983;109:85–95.
- ,,, et al.Calciphylaxis: Natural history, risk factor analysis, and outcome.J Am Acad Dermatol.2007;56:569–579.
- ,.Calciphylaxis: emerging concepts in prevention, diagnosis, and treatment.Semin Dial.2002;15:172–186.
- ,,,.Lever's Histopathology of the Skin.8th ed.Lippincott, Williams 43:1104–1108.
- ,,.A case report comparing various radiological tests in the diagnosis of calcific uremic arteriolopathy.Am J Kidney Dis.2006;48:659–661.
- .Ever‐changing concepts of calciphylaxis.Intern Med.2004;43:7–8.
- ,,, et al.Is calciphylaxis best treated surgically or medically?Surgery2000;128:967–971.
- ,,, et al.Therapy for calciphylaxis: an outcome analysis.Surgery.2003;134:941–945.
- ,,.Successful treatment of severe calciphylaxis in a hemodialysis patient using low‐calcium dialysate and medical parathyroidectomy: case report and literature review.Ren Fail.2004;26:77–82.
- ,,, et al.Hyperbaric oxygen therapy for calcific uremic arteriolopathy: a case series.J Nephrol.2002;15:676–680.
- ,,, et al.Low‐dose tissue plasminogen activator for calciphylaxis.Arch Dermatol.2004;140:1045–1048.
- ,,.Cinacalcet for the treatment of calciphylaxis.Arch Dermatol.2007;143:152–154.
- ,,, et al.Successful treatment of a patient with severe calcific uremic arteriolopathy (calciphylaxis) by etidronate disodium.Am J Kidney Dis.2006;48:151–154.
- ,,, et al.Sterile maggots as adjuvant procedure for local treatment in a patient with proximal calciphylaxis.Nefrologia.2005;25:559–562.
Narrative Description
This Case Report reviews the presentation, the differential diagnosis and the treatment modalities used to treat calciphylaxis. It emphasizes the poor prognosis and that there is inadequate clinical experience to guide a physician as to what the most appropriate treatment is despite promising anecdotal reports about a variety of agents. The report demonstrates that intravenous sodium thiosulfate is tolerated.
Key Points
-
Calciphylaxis occurs in 1 to 4% of patients with end stage renal failure.
-
Two patterns of presentation are generally recognizedcentral and peripheral.
-
Pain is a prominent symptom and eschar formation is usually present.
-
The role of surgery is controversial.
-
Several promising modalities for the treatment of this condition have been described in anecdotal reports.
Calciphylaxis is a rare condition. It is seen most frequently in patients with chronic kidney disease and can affect any part of the body.14 Calciphylaxis is increasingly being referred to as calcific uremic arteriolopathy as this term more accurately reflects the histology of vascular calcification in small‐ and medium‐sized arteries, intimal arterial hypertrophy, and small vessel thrombosis associated with panniculitis, dermal necrosis, and eschar formation.5 Pain is a prominent symptom. The most effective treatment for this condition remains uncertain.
Case Report
A 68‐year‐old female presented with an 8‐month history of increasing lower extremity edema, and numerous large, painful, necrotic ulcers with an associated foul odor. She had a past medical history of type 2 diabetes mellitus, hypertension, end stage renal disease requiring hemodialysis 3 times a week for the previous 6 months, severe peripheral vascular disease, coronary artery disease for which she had previously undergone coronary artery bypass surgery, multiple myocardial infarctions, and congestive heart failure with an ejection fraction of 20%. She had also suffered from numerous infections including septicemia, endocarditis, and a sternal wound infection in the past with no current evidence of septicemia or endocarditis. The patient was not on calcium supplements, Vitamin D, warfarin or calcium‐containing phosphate binders.
Eight months prior to admission she developed vesicles on the left thigh that slowly progressed to large, extremely painful, violaceous, indurated plaques with central ulceration and eschar (Figure 1). She subsequently developed several smaller lesions with similar morphology on her legs and feet and gangrene of her left big toe (Figure 2). A biopsy from the left thigh was consistent with calciphylaxis with associated necrosis of the deep dermis and subcutaneous tissues. The patient's lesions were aggressively debrided, broad spectrum antibiotics given, and the patient dialyzed with low calcium dialysates. Ultimately intravenous sodium thiosulfate (25 g intravenously, over 60 minutes), was given which she tolerated with no side effect. Sodium thiosulfate is thought to act by forming highly soluble calcium thiosulfate salts and therefore mobilizing tissue calcium.5 Hyperbaric oxygen was contraindicated because of the patient's left ventricular ejection fraction (LVEF) of 20% and previous history of congestive heart failure as this treatment modality may precipitate congestive heart failure in a patient with a low LVEF particularly with a past history of congestive heart failure. Her condition continued to deteriorate and she died a few days after initiation of intravenous sodium thiosulfate infusion secondary to a massive gastrointestinal bleed.
Discussion
The differential diagnosis for painful necrotic cutaneous ulcerations with eschar formation includes: calciphylaxis, cryoglobulinemia, cryofibrinogenema, peripheral vascular disease, embolic phenomenon (endocarditis, septic, cholesterol), warfarin skin necrosis, brown recluse spider bites, hypercoagulable states, hyperoxaluria, and necrotizing vasculitis.14
Calciphylaxis is a rare entity that affects approximately 1% to 4% of end stage renal failure patients.1, 3 The typical patient is a morbidly obese, female with longstanding end stage renal disease, diabetes, hyperphosphatemia and an elevated calcium‐phosphate product usually greater than 60 mg2/dL2.1, 3 It has also been described in patients with alcoholic cirrhosis and acute reversible renal failure,6 primary and secondary hyperparathyroidism,7 and metastatic breast cancer.8
Patients typically present with symmetric lesions that evolve from erythematous to violaceous, livedo‐reticularis like patches or plaques with occasional bullae to painful, indurated, necrotic plaques that subsequently ulcerate. The ulcerations are slow to heal and covered with eschar.4, 9
There are 2 patterns of involvement. The central/proximal pattern involves the abdomen, gluteal region, and thighs while the peripheral/distal pattern involves the extremities distal to the elbows and knees.1, 2, 4 The central pattern tends to carry a worse prognosis,9, 10 though this has not been validated in all reports and recent literature suggests that patients with both patterns have the worst prognosis.11
A biopsy may be required to exclude other diagnoses. The histology demonstrates an obliterative vasculopathy secondary to the vascular intimal changes and endovascular fibrosis.12 A suggestive finding is calcification of the medial wall of small‐ and medium‐sized arteries and arterioles with associated intimal hyperplasia and fibrosis. Necrosis of the surrounding tissue, panniculitis, and soft tissue calcification are often present.9, 13 The trauma of the biopsy can lead to worsening of the disease.
Secondary to its association with end stage renal disease, laboratory data often reveals elevated blood urea nitrogen (BUN), creatinine, parathyroid hormone, and calcium‐phosphate product. Bone scans show increased uptake in the subcutaneous calcified plaques.14 X‐rays utilizing mammogram technique have demonstrated arteriolar calcification.15
Besides chronic kidney disease, other potential risk factors include protein C and S deficiencies, obesity, warfarin use, high calcium containing dialysates, liver disease, and systemic corticosteroids.4, 9, 11, 16
Calciphylaxis is a difficult disease to treat with a mortality of 60% to 70%9 and a 1‐year survival rate of 45.8%.11 There is no consistently effective treatment.5 Therapy therefore, is focused on symptom control, debridement, and treatment of infection. Mortality is most commonly due to wound infections and resulting septicemia. Meticulous wound care is important with any infection treated early and aggressively. Though trauma and surgical procedures have been known to precipitate ulcerations, given their high rate of infection early surgical debridement of wounds is often required and has been shown to improve mortality.11, 17 Because of the poor healing of the involved tissues, wounds are often left to close by secondary intention or in some circumstances with vacuum assistance.2
As secondary hyperparathyroidism is common, attempts are often made to lower the calcium‐phosphate product. This often requires parathyroidectomy.18 Calcium containing phosphate binders are avoided and low calcium dialysate used.19 However, the above interventions do not consistently improve mortality.5, 11
Other potential treatments include: hyperbaric oxygen therapy,20 intravenous sodium thiosulfate,14 low‐dose tissue plasminogen activator,21 cinacalcet,22 etidronate disodium,23 and maggots.24 Because of the rarity of the condition, most of the literature to date is anecdotal and based on case reports and small retrospective studies.
Conclusions
As the number of patients who develop chronic kidney disease and require hemodialysis increases, it is likely that the number of patients who develop calciphylaxis will also increase. Hospitalists, besides nephrologists, should therefore become familiar with the presentation of this disease as it is possible, although unproven, that treatment in the early stage of the disease may result in a better response. Although several treatment modalities have been used to treat calcific uremic arteriolopathy or calciphylaxis, it remains unclear what is the best treatment for these patients. Carefully done clinical trials using some of the treatment modalities mentioned will help physicians decide what the most appropriate treatment is for patients with this debilitating and often fatal disease.
- ,,,.Early recognition and treatment of calciphylaxis.South Med J.2003;96:53–55.
- ,,,.Calciphylaxis: medical and surgical management of chronic extensive wounds in a renal dialysis population.Plast Reconstr Surg.2004;113:304–312.
- ,,, et al.Cutaneous necrosis by calcific uremic arteriolopathy.Int J Dermatol.2005;44:101–106.
- ,.Calciphylaxis.Int J Dermatol.2007;46:231–236.
- ,,.Calcific uremic arteriolopathy: Advances in pathogenesis and treatment.Semin Dial.2007;20:150–157.
- ,,, et al.Calciphylaxis associated with acute, reversible renal failure in the setting of alcoholic cirrhosis.J Am Acad Dermatol2004;50:S125–S128.
- ,,, et al.An unusual presentation of calciphylaxis due to primary hyperparathyroidism.Arch Pathol Lab Med.2001;125:1351–1353.
- ,,, et al.Calciphylaxis associated with metastatic breast carcinoma.J Am Acad Dermatol.1999;41:295–298.
- ,.Panniculitis. In: Freeberg IM, Eisen AZ, Wolff K, Austen KF, Goldsmith LA, Katz SI, eds.Fitzpatrick's Dermatology in General Medicine.6th ed.McGraw‐Hill,New York, NY.2003:1051–1052.
- ,,,.The vascular lesions associated with skin necrosis in renal disease.Br J Dermatol.1983;109:85–95.
- ,,, et al.Calciphylaxis: Natural history, risk factor analysis, and outcome.J Am Acad Dermatol.2007;56:569–579.
- ,.Calciphylaxis: emerging concepts in prevention, diagnosis, and treatment.Semin Dial.2002;15:172–186.
- ,,,.Lever's Histopathology of the Skin.8th ed.Lippincott, Williams 43:1104–1108.
- ,,.A case report comparing various radiological tests in the diagnosis of calcific uremic arteriolopathy.Am J Kidney Dis.2006;48:659–661.
- .Ever‐changing concepts of calciphylaxis.Intern Med.2004;43:7–8.
- ,,, et al.Is calciphylaxis best treated surgically or medically?Surgery2000;128:967–971.
- ,,, et al.Therapy for calciphylaxis: an outcome analysis.Surgery.2003;134:941–945.
- ,,.Successful treatment of severe calciphylaxis in a hemodialysis patient using low‐calcium dialysate and medical parathyroidectomy: case report and literature review.Ren Fail.2004;26:77–82.
- ,,, et al.Hyperbaric oxygen therapy for calcific uremic arteriolopathy: a case series.J Nephrol.2002;15:676–680.
- ,,, et al.Low‐dose tissue plasminogen activator for calciphylaxis.Arch Dermatol.2004;140:1045–1048.
- ,,.Cinacalcet for the treatment of calciphylaxis.Arch Dermatol.2007;143:152–154.
- ,,, et al.Successful treatment of a patient with severe calcific uremic arteriolopathy (calciphylaxis) by etidronate disodium.Am J Kidney Dis.2006;48:151–154.
- ,,, et al.Sterile maggots as adjuvant procedure for local treatment in a patient with proximal calciphylaxis.Nefrologia.2005;25:559–562.
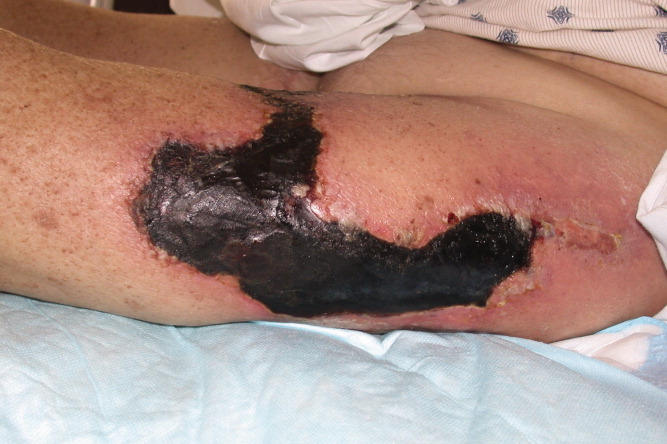
Necrotizing fasciitis associated with acupuncture: A case report
Presentation
An 84 year‐old male with past history of osteoarthritis, extensive degenerative spine disease with spinal stenosis presented to the emergency room with left groin pain accompanied by a foul‐smelling discharge from the acupuncture site. He had been receiving regular physical therapy and acupuncture sessions for the past 6 months prior to his presentation. One and a half weeks prior to presentation, needles were inserted over the left groin as part of his acupuncture regimen. The patient described the acupuncture needles originating from a single use, unopened package. Additionally, the patient states his skin was cleaned with an antiseptic solution prior to insertion. Within 3 days, he developed generalized weakness, malaise with localized swelling, erythema, and warmth over the left groin area. His primary care physician performed an incision and drainage and prescribed ciprofloxacin. The patient continued to experience worsening fatigue, difficulty ambulating, ongoing purulent drainage, and consequently presented to the hospital for further evaluation. The patient has an allergy to penicillin but no history of diabetes. He quit smoking 40 years ago and has occasional alcohol intake. Surgical history includes bilateral knee replacement 15 years ago for osteoarthritis and right inguinal hernia repair and appendectomy 60 years ago.
On physical examination the patient had a temperature of 96.8F, pulse of 88 beats per minute, blood pressure of 97/63 mm Hg, and an oxygen saturation of 98% on room air. There was extensive swelling, erythema, and induration of the left anterior and proximal inguinal area, with a 2‐cm malodorous ulcer over the midline thigh. No crepitation or mass was palpable. Range of motion at the hip on the affected limb was limited due to pain. Distal pulses on the lower extremity were present and equal bilaterally. Laboratory examination revealed white blood cell (WBC) = 16.4 with 41% bands. Blood cultures were sent and intravenous vancomycin, ciprofloxacin, clindamycin, and metronidazole were started. A computed tomography (CT)‐scan of the left lower extremity was performed and revealed skin thickening and reticulation of the subcutaneous tissues edema extending from the left groin to the left buttock. Several foci of gas were present within the soft tissues with the largest in the lateral aspect of the buttocks of gas in the soft tissues (Figure 1). The Laboratory Risk Indicator for Necrotizing Fasciitis, the patient scored a 3 out of a possible 13 points. The diagnosis of necrotizing fasciitis was made based on clinical findings and radiographic imaging.
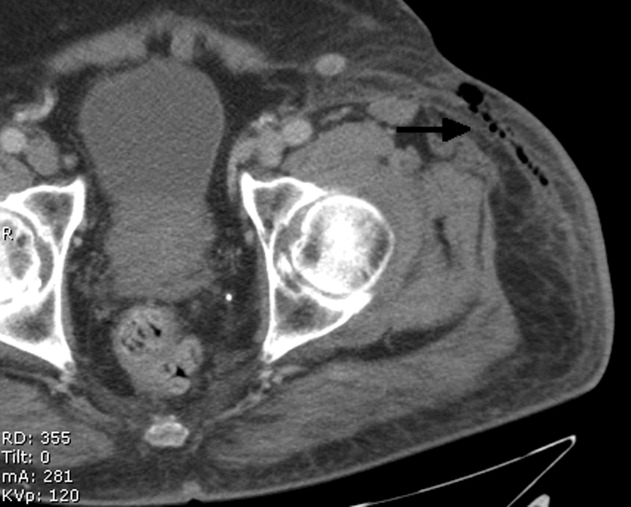
Assessment
Patient became significantly hypotensive which required vasopressor support. He underwent surgical exploration of the left inguinal area. During surgery, tender crepitation of the antero‐lateral aspect of the thigh was noted. Extensive debridement with fasciotomy was performed. Tissue was sent for histopathological analysis and gram‐stain. A negative‐pressure wound dressing was placed over the defect. Post‐operatively, patient required intubation and continued vasopressor support. On post‐operative day 3, patient was extubated. Wound culture report revealed gram negative rods and Enterococcus faecalis which was sensitive to the patients' current antibiotic regimen. Clindamycin was discontinued. The patient was discharged to a subacute rehabilitation facility and returned for a split thickness skin graft 2 months after initial presentation.
Necrotizing fasciitis is a deep‐seated infection of the subcutaneous tissue that results in progressive destruction of fascia and fat. Presenting symptoms include pain, erythema, or bullae formation at the site of infection. Systemic symptoms such as fever, malaise, and myalgias may also be present at the time of presentation. Two types of necrotizing fasciitis are noted to occur. Type 1 is a mixed infection with a predominance of anaerobes1 and carries a 21% mortality.2 It is common post‐operatively and in patients with diabetes. In type 2 necrotizing fasciitis, Group‐A streptococcus was the most common cause of monomicrobial necrotizing fasciitis2 and mortality can be as high as 30%.3 Risk factors for the development of fasciitis include immunosuppression, diabetes, surgery, or penetrating injuries. Gas on soft tissue x‐rays, CT scan, or magnetic resonance imaging (MRI) is a highly specific but insensitive finding and is common in type I necrotizing fasciitis.
The patient in this case likely developed type I necrotizing fasciitis due to the presence of gas on CT scan and polymicrobial culture findings.
Diagnosis
A PubMed search of necrotizing fasciitis and acupuncture reveals only one case report, in which a diabetic patient underwent an unsterile acupuncture consultation.4 To our knowledge, we are the first to describe necrotizing fasciitis occurring in a nondiabetic patient who underwent a sterile acupuncture technique.
Given the lack of an explainable causal relationship regarding the pathogenesis of necrotizing fasciitis in our patient, it appears to be due to the acupuncture needle placement. The patient had no other history of abscesses, trauma and other portals of entry. The patient's presentation, temporal relation of the site of acupuncture, and the development of infection prompted a high index of suspicion as acupuncture as the main etiology.
Management
Treatment of necrotizing fasciitis includes early and aggressive surgical debridement. Multiple antibiotic regimens may be necessary due to the polymicrobial nature of the infection. In our patient, ciprofloxacin was initiated for broadened gram negative coverage, vancomycin for community acquired methicillin‐resistant Staphylococcus aureus (MRSA) and metronidazole for anaerobic coverage. Clindamycin was initiated due to concerns of toxin production, but was discontinued as the patient's condition improved.
Although complications of acupuncture may be rare, there exists the potential to cause life threatening complications. Necrotizing fasciitis has been observed as an adverse effect of acupuncture in a single diabetic patient,4 but can develop in nondiabetic individuals, such as in our patient.
- ,.Clinical and microbiological features of necrotizing fasciitis.J Clin Microbiol.1995;33(9):2382–2387.
- ,,,,.Low CO Necrotizing fasciitis: clinical presentation, microbiology, and determinants of mortality.J Bone Joint Surg Am.2003;85‐A(8):1454–1460.
- ,,, et al.Severe group A streptococcal infections associated with a toxic shock‐like syndrome and scarlet fever toxin A.N Engl J Med.1989;321(1):1–7.
- ,,.Necrotising fasciitis: a life‐threatening complication of acupuncture in a patient with diabetes mellitus.Singapore Med J.2004;45(4):180–182.
Presentation
An 84 year‐old male with past history of osteoarthritis, extensive degenerative spine disease with spinal stenosis presented to the emergency room with left groin pain accompanied by a foul‐smelling discharge from the acupuncture site. He had been receiving regular physical therapy and acupuncture sessions for the past 6 months prior to his presentation. One and a half weeks prior to presentation, needles were inserted over the left groin as part of his acupuncture regimen. The patient described the acupuncture needles originating from a single use, unopened package. Additionally, the patient states his skin was cleaned with an antiseptic solution prior to insertion. Within 3 days, he developed generalized weakness, malaise with localized swelling, erythema, and warmth over the left groin area. His primary care physician performed an incision and drainage and prescribed ciprofloxacin. The patient continued to experience worsening fatigue, difficulty ambulating, ongoing purulent drainage, and consequently presented to the hospital for further evaluation. The patient has an allergy to penicillin but no history of diabetes. He quit smoking 40 years ago and has occasional alcohol intake. Surgical history includes bilateral knee replacement 15 years ago for osteoarthritis and right inguinal hernia repair and appendectomy 60 years ago.
On physical examination the patient had a temperature of 96.8F, pulse of 88 beats per minute, blood pressure of 97/63 mm Hg, and an oxygen saturation of 98% on room air. There was extensive swelling, erythema, and induration of the left anterior and proximal inguinal area, with a 2‐cm malodorous ulcer over the midline thigh. No crepitation or mass was palpable. Range of motion at the hip on the affected limb was limited due to pain. Distal pulses on the lower extremity were present and equal bilaterally. Laboratory examination revealed white blood cell (WBC) = 16.4 with 41% bands. Blood cultures were sent and intravenous vancomycin, ciprofloxacin, clindamycin, and metronidazole were started. A computed tomography (CT)‐scan of the left lower extremity was performed and revealed skin thickening and reticulation of the subcutaneous tissues edema extending from the left groin to the left buttock. Several foci of gas were present within the soft tissues with the largest in the lateral aspect of the buttocks of gas in the soft tissues (Figure 1). The Laboratory Risk Indicator for Necrotizing Fasciitis, the patient scored a 3 out of a possible 13 points. The diagnosis of necrotizing fasciitis was made based on clinical findings and radiographic imaging.
Assessment
Patient became significantly hypotensive which required vasopressor support. He underwent surgical exploration of the left inguinal area. During surgery, tender crepitation of the antero‐lateral aspect of the thigh was noted. Extensive debridement with fasciotomy was performed. Tissue was sent for histopathological analysis and gram‐stain. A negative‐pressure wound dressing was placed over the defect. Post‐operatively, patient required intubation and continued vasopressor support. On post‐operative day 3, patient was extubated. Wound culture report revealed gram negative rods and Enterococcus faecalis which was sensitive to the patients' current antibiotic regimen. Clindamycin was discontinued. The patient was discharged to a subacute rehabilitation facility and returned for a split thickness skin graft 2 months after initial presentation.
Necrotizing fasciitis is a deep‐seated infection of the subcutaneous tissue that results in progressive destruction of fascia and fat. Presenting symptoms include pain, erythema, or bullae formation at the site of infection. Systemic symptoms such as fever, malaise, and myalgias may also be present at the time of presentation. Two types of necrotizing fasciitis are noted to occur. Type 1 is a mixed infection with a predominance of anaerobes1 and carries a 21% mortality.2 It is common post‐operatively and in patients with diabetes. In type 2 necrotizing fasciitis, Group‐A streptococcus was the most common cause of monomicrobial necrotizing fasciitis2 and mortality can be as high as 30%.3 Risk factors for the development of fasciitis include immunosuppression, diabetes, surgery, or penetrating injuries. Gas on soft tissue x‐rays, CT scan, or magnetic resonance imaging (MRI) is a highly specific but insensitive finding and is common in type I necrotizing fasciitis.
The patient in this case likely developed type I necrotizing fasciitis due to the presence of gas on CT scan and polymicrobial culture findings.
Diagnosis
A PubMed search of necrotizing fasciitis and acupuncture reveals only one case report, in which a diabetic patient underwent an unsterile acupuncture consultation.4 To our knowledge, we are the first to describe necrotizing fasciitis occurring in a nondiabetic patient who underwent a sterile acupuncture technique.
Given the lack of an explainable causal relationship regarding the pathogenesis of necrotizing fasciitis in our patient, it appears to be due to the acupuncture needle placement. The patient had no other history of abscesses, trauma and other portals of entry. The patient's presentation, temporal relation of the site of acupuncture, and the development of infection prompted a high index of suspicion as acupuncture as the main etiology.
Management
Treatment of necrotizing fasciitis includes early and aggressive surgical debridement. Multiple antibiotic regimens may be necessary due to the polymicrobial nature of the infection. In our patient, ciprofloxacin was initiated for broadened gram negative coverage, vancomycin for community acquired methicillin‐resistant Staphylococcus aureus (MRSA) and metronidazole for anaerobic coverage. Clindamycin was initiated due to concerns of toxin production, but was discontinued as the patient's condition improved.
Although complications of acupuncture may be rare, there exists the potential to cause life threatening complications. Necrotizing fasciitis has been observed as an adverse effect of acupuncture in a single diabetic patient,4 but can develop in nondiabetic individuals, such as in our patient.
- ,.Clinical and microbiological features of necrotizing fasciitis.J Clin Microbiol.1995;33(9):2382–2387.
- ,,,,.Low CO Necrotizing fasciitis: clinical presentation, microbiology, and determinants of mortality.J Bone Joint Surg Am.2003;85‐A(8):1454–1460.
- ,,, et al.Severe group A streptococcal infections associated with a toxic shock‐like syndrome and scarlet fever toxin A.N Engl J Med.1989;321(1):1–7.
- ,,.Necrotising fasciitis: a life‐threatening complication of acupuncture in a patient with diabetes mellitus.Singapore Med J.2004;45(4):180–182.

Performance of Dutch hospitals in the management of splenectomized patients
Patients without a spleen have a diminished host immune defense in response to bacteria.1 Especially in the first 2 years after surgery there is a risk for severe infection, mostly with encapsulated bacteria such as Streptococcus pneumoniae.2 This syndrome is called post‐splenectomy sepsis (PSS), and although the incidence is estimated to be low, it is associated with a high mortality of 50% to 70%.2 Importantly, PSS can largely be prevented if protective measures such as immunization and the prescription of antibiotics are taken. Several relevant organizations and committees have developed guidelines for prevention of infections in this group of patients.3 The recommendations by the British Committee for Standards in Haematology are currently considered to reflect best practice4, 5 and consist of the key‐elements shown in Box 1.
Unfortunately, adherence to guidelines is generally considered to be low.6 One of the most consistent findings in health services research is the gap between best practice and actual clinical care.7, 8 We have shown earlier that management of splenectomized patients in the Netherlands is not optimal (Lammers et al., Management of post‐splenectomy patients in the Netherlands, EJCMID, in press, DOI: 10.1007/s10096‐009‐0870‐x).
Several studies demonstrate that performance of hospitals is related to structural characteristics such as teaching status and practice organization.911 A large review showed that teaching hospitals in general offer better care than nonteaching hospitals. Furthermore, major teaching hospitals perform better than minor and nonteaching hospitals.12, 13
The aim of the present study was to investigate whether or not hospital structural characteristics of care delivery are associated with better compliance with best‐practice guidelines for preventing infections in splenectomized patients in Dutch hospitals. Our research questions were two‐fold: (1) are teaching hospitals delivering better quality of care in the prevention of infections in splenectomized patients than nonteaching hospitals and (2) is there an association between characteristics of practice organization (ie, the size of the surgical staff, the availability of a protocol for post‐splenectomy management, and the use of a complication registry by the department of surgery) and quality of care. Quality of care parameters were defined as outcome of adherence to the prevention guidelines of the British Committee for Standards in Haematology.
Key Recommendations for the Management of Asplenic Patients by the British Committee for Standards in Haematology
1. Splenectomised patients should receive pneumococcal immunization (23‐valent polysaccharide vaccine, PPV‐23) and lifelong revaccination. They should also receive Haemophilus influenzae type B and meningococcal C vaccine. Yearly influenza immunization is recommended.
2. Continuous prophylactic antibiotics are recommended for the first two years after splenectomy. In case of suspected or proven infection during or after these 2 years, patients should be given systemic antibiotics and be admitted to a hospital.
3. All patients should be educated about the risks of infection (PSS) and the risk associated with traveling (such as infection with Plasmodium falciparum) and unusual infections (ie, dog bites).
Methods
Hospital and Patient Inclusion
This study was approved by the medical ethics committee of the Academic Medical Center, Amsterdam, the Netherlands. After approval, we composed a representative sample out of the total of 93 Dutch hospitals, by including hospitals through a blind drawing. Hospitals were divided into 3 categories: (1) university hospitals, (2) nonuniversity teaching hospitals and (3) nonteaching hospitals. The teaching status of nonuniversity hospitals was based on the (non) presence of an internal or surgical medicine residency training program. After the drawing, each group contained 30% of the total number of Dutch hospitals in its category (source: RIVM, Nationale Atlas Volksgezondheid, 2007).
Subsequently, splenectomized patients were included retrospectively using the Dutch Pathology Registry, since spleens are routinely sent to pathology after removal. In this Registry, a search query *milt* (spleen) was performed, after which all splenectomies performed from 1997 to 2008 were selected and nonrelevant hits such as partial splenectomies or spleen biopsies were removed.
Data Collection
After hospitals and patients were identified, the medical file and all discharge correspondence were assessed on site. All data were collected separately for each hospital by the same 2 investigators (DV, JL) using a standardized survey form. To investigate discharge correspondence, discharge letters as well as all other correspondence up to at least 1 year after splenectomy were included, for example from follow‐up out‐patient visits.
After hospital category was documented, we registered for each hospital the size of the surgical staff at the time of inclusion, the availability of any form of protocol of the surgical department reflecting hospital post‐splenectomy policy, and the practice of systematically registering (surgical) complications by the department of surgery. Patient data included demographics, documentation of vaccine administration and documentation of the prescription of antibiotics. Furthermore, discharge correspondence was checked for mentioning of each of the following: performed splenectomy, vaccination status, the need for revaccination, prescribed prophylactic antibiotics, the need of urgent use of antibiotics in case of suspected infection, and the advice for annual flu‐vaccination.
Data Analysis
When computing vaccination rates, we included only those patients who survived the first 2 weeks after surgery, since correct vaccination is considered by the British Committee to be given 2 weeks prior to or at least 2 or more weeks after surgery. Pneumococcal vaccination was defined as immunization with either the 23‐valent pneumococcal polysaccharides vaccine (PPV‐23, Pneumovax), the 7‐valent pneumococcal conjugate vaccine (PCV‐7, Prevenar), or both.
Prophylactic antibiotics were defined as a prescription of antibiotics for the first 2 years after splenectomy. On demand antibiotics were defined as a prescription to be given to the patient at discharge, to use in case of suspected infection. When investigating prescription rates of prophylactic antibiotics, we excluded patients deceased in the first 2 weeks after surgery, regarding their death as a complication of surgery. In case of on demand antibiotics, patients who died in the hospital before their discharge were excluded as well. When investigating discharge information to the general practitioner (GP), only those patients alive at time of discharge were excluded.
Statistical Analysis
First, we have described the study sample using standard descriptive statistics. Second, to explore differences in performance and calculate P values, we used a chi‐square test between the 3 categories of hospitals (Table 2), between presence or absence of a protocol (Table 3) and complication registry. The influence of surgical staff size (divided into 1‐8 surgeons or >8 surgeons) was calculated using multivariate logistic regression analysis, where surgical staff size and hospital teaching status were used as covariates in the analysis. All statistical analysis of data was performed in SPSS 16.0.
| University | Nonuniversity Teaching | Nonteaching | |
|---|---|---|---|
| Hospitals, n (number of patients) | 2 (40) | 15 (287) | 11 (209) |
| Mean number of surgical staff per hospital (range) | 20 (1822) | 9.2 (316) | 5.5 (47) |
| Presence of splenectomy protocol at surgical department, n (%) | 2 (100) | 14 (93) | 7 (64) |
| Presence of complication registry at surgical department, n (%) | 2 (100) | 15 (100) | 9 (82) |
| Hospital (n = Number of Patients) | University (n = 33) | Nonuniversity Teaching (n = 268) | Nonteaching (n = 197) | P Value | |
|---|---|---|---|---|---|
| |||||
| Immunizations (%) | Pneumococcal | 90 | 85.5 | 84.3 | 0.559 |
| H. influenzae B | 66.7 | 40.3 | 33.5 | 0.001 | |
| Meningococcal C | 63.6 | 30.6 | 29.4 | <0.001 | |
| Antibiotics (%) | Prophylaxis* | 21.2 | 14.1 | 8.6 | 0.056 |
| On‐demand | 6.3 | 8.5 | 9.5 | 0.812 | |
| Both | 18.8 | 3.6 | 0 | <0.001 | |
| None | 53.1 | 72.6 | 81.5 | 0.001 | |
| Discharge letters mentioning (%) | Splenectomy | 100 | 98 | 96.8 | 0.425 |
| Immunization | 83.3 | 81 | 80.5 | 0.609 | |
| Booster immunization | 40.6 | 22.2 | 22.8 | 0.113 | |
| Influenza vaccination | 25 | 9.8 | 14.3 | 0.021 | |
| On‐demand antibiotics | 37.5 | 17.7 | 23.3 | 0.015 | |
| Protocol Present | No Protocol | P Value | |
|---|---|---|---|
| |||
| Immunizations (%) | |||
| Pneumococcal | 85.3 | 85.9 | 0.671 |
| H. influenzae B | 40.2 | 35.3 | 0.970 |
| Meningococcal C | 33.7 | 25.9 | 0.188 |
| Antibiotics (%) | |||
| Prophylaxis* | 13.8 | 6.3 | <0.001 |
| On‐demand | 9.5 | 5.5 | 0.001 |
| Both | 3.9 | 0 | 0.062 |
| None | 72 | 87.7 | 0.230 |
| Discharge letters mentioning (%) | |||
| Splenectomy | 97.7 | 98.8 | 0.096 |
| Immunization | 81.4 | 78.6 | 0.321 |
| Booster immunization | 25.5 | 13.8 | 0.048 |
| Influenza vaccination | 14.4 | 5 | 0.024 |
| On‐demand antibiotics | 23.2 | 12.5 | 0.213 |
Results
We included 28 of 93 Dutch hospitals (30%), containing a total of 536 splenectomized patients (Table 1.) Five hospitals were excluded because they refused cooperation, and were subsequently replaced by comparable hospitals in their category.
Differences Between University and Nonteaching Hospitals
Hospital performance of Dutch university, nonuniversity teaching, and nonteaching hospitals is shown in Table 2. Admission to a university hospital is associated with better guideline adherence: 22 of 33 of patients (66.7%) in university hospitals were immunized with H. influenzae B as compared to 108 of 268 patients (40.3%) in nonuniversity teaching and 66 of 197 (33.5%) in nonteaching hospitals. Vaccination with N. meningitidis C occurred in 21 of 33 patients (63.6%) as compared to 82 of 268 patients (30.6%) in nonuniversity teaching and 58 of 197 (29.4%) in nonteaching hospitals. In 53.1% of patients no antibiotics were prescribed in university hospitals, as compared to 72.6% in nonuniversity teaching and 82.5% in nonteaching hospitals. Differences between nonuniversity teaching hospitals and nonteaching hospitals were small.
Presence of a Post‐Splenectomy Protocol
The availability of a protocol at the surgical department was not associated with higher vaccination rates (Table 3). It did however show a positive relation on the prescription of prophylactic antibiotics. The effect of a protocol on the quality of discharge information to the GP was minimal.
Size of Surgical Staff
Performance in relation to the size of surgical staff was determined (data not shown). There were no differences in vaccination rates or quality of discharge information between the groups of different sizes (less or more than 8 surgeons). Larger surgical groups seemed to perform better in prescribing antibiotics, however when adjusting for hospital category in multivariate analysis these differences were not significant.
Complication Registry
Complications were systematically registered by all but 2 surgical departments in nonteaching hospitals, composing a cohort of 27 patients.
Although numbers are low, it demonstrates that in the absence of a registry, the guideline adherence for this group of patients was similar, and only prophylactic antibiotics were significantly less prescribed: 62 of 473 patients (13.1%) in the presence of a registry, as compared to 0 of 27 patients in absence of a registry (P value = 0.044) (data not shown). The precise role of the registry herein remains unclear, since both hospitals also lacked a hospital post‐splenectomy protocol.
Discussion
Main Findings
The aim of the present study was to investigate quality of care for splenectomized patients in Dutch hospitals with different teaching status. In general, beneficial effects of teaching status only extended to university hospitals in the Netherlands. Other teaching hospitals performed similarly to nonteaching hospitals in the Netherlands. Hospitals in which the surgical department developed a local protocol with recommendations for managing patients after splenectomy did not achieve higher vaccination rates. There was, however, an improvement in prescription of antibiotics and in the quality of discharge correspondence from the hospital to the GP. Surgical staff size was not related to hospital performance.
Explanation of Results
In the Netherlands, all categories of hospitals provided over 80% of their post‐splenectomy patients with pneumococcal immunization, reflecting that Dutch physicians in general are aware of the need for pneumococcal protection after splenectomy. However, university hospitals had better performance results regarding immunizing patients with all 3 recommended vaccines, as well as prescribing prophylactic antibiotics in combination with a prescription for on‐demand antibiotics. Collectively, university hospitals offered their patients a more complete post‐splenectomy treatment.
It has been described elsewhere that minor teaching and nonteaching hospitals show small differences, and that nonteaching hospitals even perform better at certain indicators than minor teaching hospitals.13 We indeed found small differences between nonuniversity teaching hospitals and nonteaching hospitals, where nonuniversity teaching hospitals performed better at prescribing antibiotics, and nonteaching hospitals did better at giving recommendations to the GP on booster immunization and use of on‐demand antibiotics.
Hospital characteristics have been shown to have important effects on hospital outcomes.10, 14, 15 We hypothesized this would also be the case regarding the adherence to post‐splenectomy management recommendations. In particular, we were expecting to find that the availability of a protocol at the department of surgery would be associated with better compliance with all key recommendations in the British Standards, however, vaccination rates did not differ form departments without a protocol. The items that were generally most eligible for improvement seemed to benefit most from the presence of a protocol.
Neither the presence of a protocol nor the size of the surgical staff were related to better performance in university hospitals. We can therefore only speculate about the explanation for the differences found between university and other hospitals. Organizational differences may not be disregarded; it has been described elsewhere that better quality and processes of care are delivered in major teaching hospitals.16, 9, 12 Most prior studies have reported a lower risk‐adjusted mortality in major teaching hospitals as compared with minor teaching or nonteaching hospitals.9, 12 It is also possible that residency and fellowship programs contribute to better compliance of guidelines and have a favorable impact on the delivery of patient care in teaching hospitals.12
Limitations
In absence of a Dutch guideline we chose to investigate adherence to the recommendations by the British Committee for Standards in Haematology, assuming that Dutch professionals have some knowledge of these recommendations. Although these recommendations are internationally considered to reflect current best practice and patients should therefore be managed according to at least comparable standards, the extent of familiarity and use of the British standards by Dutch physicians remains to be investigated in the future. Furthermore, we investigated the availability of a locally designed protocol on the management of post‐splenectomy patients by the surgical department. Checking the contents of each of these local protocols was not part of our study and thus we can not exclude that these protocols are lacking certain recommendations. It also remains unclear how hospitals have implemented their protocols.
Implications for Future Research and Policy
In the Netherlands, hospitals could offer better quality of care for hyposplenic and asplenic patients in the prevention of infections by increasing immunization rates. Furthermore, although academic centers performed better than the other hospital categories, only a minority of patients were given or advised to receive on demand antibiotics. Here lies a tremendous opportunity to improve patient care in the prevention of severe infections.
Potential barriers that exist for delivering optimal care to these patients remain to be investigated. Furthermore, although teaching status is related to performance, the explanation for this difference remains unclear. The results of this study suggest that there is a relation between characteristics of practice organization and performance, but these characteristics should be further elucidated.
Conclusion
University hospitals offer higher guideline adherence in preventing infections after splenectomy than other teaching and nonteaching hospitals. For all Dutch hospitals there is room for improving the quality of post‐splenectomy patient care. The results of this study suggest that the difference in performance may be related to several characteristics of hospital practice organization. Future research should further investigate these hospital characteristics and their influence on performance.
Acknowledgements
The authors would like to thank all participating hospitals.
- , .Structure and function of the spleen.Nat Rev Immunol.2005;5:606–616.
- , , .Postsplenectomy sepsis and its mortality rate: actual versus perceived risks.Br J Surg.1991;78:1031–1038.
- , , , .Vaccination of asplenic or hyposplenic adults.Br J Surg.2008;95:273–280.
- Guidelines for the prevention and treatment of infection in patients with an absent or dysfunctional spleen.Working Party of the British Committee for Standards in Haematology Clinical Haematology Task Force.BMJ.1996;312:430–434.
- , , .Update of guidelines for the prevention and treatment of infection in patients with an absent or dysfunctional spleen.Clin Med.2002;2:440–443.
- , , , et al.Why don't physicians follow clinical practice guidelines? A framework for improvement.JAMA.1999;282:1458–1465.
- , , .Implementing clinical guidelines: current evidence and future implications.J Contin Educ Health Prof.2004;24 Suppl 1:S31‐S37.
- , .From best evidence to best practice: effective implementation of change in patients' care.Lancet.2003;362:1225–1230.
- , , , et al.Relationship of hospital teaching status with quality of care and mortality for Medicare patients with acute MI.JAMA.2000;284:1256–1262.
- , , , , .Do “America's Best Hospitals” perform better for acute myocardial infarction?N Engl J Med.1999;340:286–292.
- , , , et al.Variation between hospitals in patient outcome after stroke is only partly explained by differences in quality of care: results from the Netherlands Stroke Survey.J Neurol Neurosurg Psychiatry.2008;79:888–894.
- , , , , , .Hospital outcomes in major teaching, minor teaching, and nonteaching hospitals in New York state.Am J Med.2002;112:255–261.
- , .Teaching hospitals and quality of care: a review of the literature.Milbank Q.2002;80:569–593, v.
- , , , .The association between hospital volume and survival after acute myocardial infarction in elderly patients.N Engl J Med.1999;340:1640–1648.
- , , , , .The association between hospital type and mortality and length of stay: a study of 16.9 million hospitalized Medicare beneficiaries.Med Care.2000;38:231–245.
- .Quality of care in teaching hospitals: a literature review.Acad Med.2005;80:458–466.
Patients without a spleen have a diminished host immune defense in response to bacteria.1 Especially in the first 2 years after surgery there is a risk for severe infection, mostly with encapsulated bacteria such as Streptococcus pneumoniae.2 This syndrome is called post‐splenectomy sepsis (PSS), and although the incidence is estimated to be low, it is associated with a high mortality of 50% to 70%.2 Importantly, PSS can largely be prevented if protective measures such as immunization and the prescription of antibiotics are taken. Several relevant organizations and committees have developed guidelines for prevention of infections in this group of patients.3 The recommendations by the British Committee for Standards in Haematology are currently considered to reflect best practice4, 5 and consist of the key‐elements shown in Box 1.
Unfortunately, adherence to guidelines is generally considered to be low.6 One of the most consistent findings in health services research is the gap between best practice and actual clinical care.7, 8 We have shown earlier that management of splenectomized patients in the Netherlands is not optimal (Lammers et al., Management of post‐splenectomy patients in the Netherlands, EJCMID, in press, DOI: 10.1007/s10096‐009‐0870‐x).
Several studies demonstrate that performance of hospitals is related to structural characteristics such as teaching status and practice organization.911 A large review showed that teaching hospitals in general offer better care than nonteaching hospitals. Furthermore, major teaching hospitals perform better than minor and nonteaching hospitals.12, 13
The aim of the present study was to investigate whether or not hospital structural characteristics of care delivery are associated with better compliance with best‐practice guidelines for preventing infections in splenectomized patients in Dutch hospitals. Our research questions were two‐fold: (1) are teaching hospitals delivering better quality of care in the prevention of infections in splenectomized patients than nonteaching hospitals and (2) is there an association between characteristics of practice organization (ie, the size of the surgical staff, the availability of a protocol for post‐splenectomy management, and the use of a complication registry by the department of surgery) and quality of care. Quality of care parameters were defined as outcome of adherence to the prevention guidelines of the British Committee for Standards in Haematology.
Key Recommendations for the Management of Asplenic Patients by the British Committee for Standards in Haematology
1. Splenectomised patients should receive pneumococcal immunization (23‐valent polysaccharide vaccine, PPV‐23) and lifelong revaccination. They should also receive Haemophilus influenzae type B and meningococcal C vaccine. Yearly influenza immunization is recommended.
2. Continuous prophylactic antibiotics are recommended for the first two years after splenectomy. In case of suspected or proven infection during or after these 2 years, patients should be given systemic antibiotics and be admitted to a hospital.
3. All patients should be educated about the risks of infection (PSS) and the risk associated with traveling (such as infection with Plasmodium falciparum) and unusual infections (ie, dog bites).
Methods
Hospital and Patient Inclusion
This study was approved by the medical ethics committee of the Academic Medical Center, Amsterdam, the Netherlands. After approval, we composed a representative sample out of the total of 93 Dutch hospitals, by including hospitals through a blind drawing. Hospitals were divided into 3 categories: (1) university hospitals, (2) nonuniversity teaching hospitals and (3) nonteaching hospitals. The teaching status of nonuniversity hospitals was based on the (non) presence of an internal or surgical medicine residency training program. After the drawing, each group contained 30% of the total number of Dutch hospitals in its category (source: RIVM, Nationale Atlas Volksgezondheid, 2007).
Subsequently, splenectomized patients were included retrospectively using the Dutch Pathology Registry, since spleens are routinely sent to pathology after removal. In this Registry, a search query *milt* (spleen) was performed, after which all splenectomies performed from 1997 to 2008 were selected and nonrelevant hits such as partial splenectomies or spleen biopsies were removed.
Data Collection
After hospitals and patients were identified, the medical file and all discharge correspondence were assessed on site. All data were collected separately for each hospital by the same 2 investigators (DV, JL) using a standardized survey form. To investigate discharge correspondence, discharge letters as well as all other correspondence up to at least 1 year after splenectomy were included, for example from follow‐up out‐patient visits.
After hospital category was documented, we registered for each hospital the size of the surgical staff at the time of inclusion, the availability of any form of protocol of the surgical department reflecting hospital post‐splenectomy policy, and the practice of systematically registering (surgical) complications by the department of surgery. Patient data included demographics, documentation of vaccine administration and documentation of the prescription of antibiotics. Furthermore, discharge correspondence was checked for mentioning of each of the following: performed splenectomy, vaccination status, the need for revaccination, prescribed prophylactic antibiotics, the need of urgent use of antibiotics in case of suspected infection, and the advice for annual flu‐vaccination.
Data Analysis
When computing vaccination rates, we included only those patients who survived the first 2 weeks after surgery, since correct vaccination is considered by the British Committee to be given 2 weeks prior to or at least 2 or more weeks after surgery. Pneumococcal vaccination was defined as immunization with either the 23‐valent pneumococcal polysaccharides vaccine (PPV‐23, Pneumovax), the 7‐valent pneumococcal conjugate vaccine (PCV‐7, Prevenar), or both.
Prophylactic antibiotics were defined as a prescription of antibiotics for the first 2 years after splenectomy. On demand antibiotics were defined as a prescription to be given to the patient at discharge, to use in case of suspected infection. When investigating prescription rates of prophylactic antibiotics, we excluded patients deceased in the first 2 weeks after surgery, regarding their death as a complication of surgery. In case of on demand antibiotics, patients who died in the hospital before their discharge were excluded as well. When investigating discharge information to the general practitioner (GP), only those patients alive at time of discharge were excluded.
Statistical Analysis
First, we have described the study sample using standard descriptive statistics. Second, to explore differences in performance and calculate P values, we used a chi‐square test between the 3 categories of hospitals (Table 2), between presence or absence of a protocol (Table 3) and complication registry. The influence of surgical staff size (divided into 1‐8 surgeons or >8 surgeons) was calculated using multivariate logistic regression analysis, where surgical staff size and hospital teaching status were used as covariates in the analysis. All statistical analysis of data was performed in SPSS 16.0.
| University | Nonuniversity Teaching | Nonteaching | |
|---|---|---|---|
| Hospitals, n (number of patients) | 2 (40) | 15 (287) | 11 (209) |
| Mean number of surgical staff per hospital (range) | 20 (1822) | 9.2 (316) | 5.5 (47) |
| Presence of splenectomy protocol at surgical department, n (%) | 2 (100) | 14 (93) | 7 (64) |
| Presence of complication registry at surgical department, n (%) | 2 (100) | 15 (100) | 9 (82) |
| Hospital (n = Number of Patients) | University (n = 33) | Nonuniversity Teaching (n = 268) | Nonteaching (n = 197) | P Value | |
|---|---|---|---|---|---|
| |||||
| Immunizations (%) | Pneumococcal | 90 | 85.5 | 84.3 | 0.559 |
| H. influenzae B | 66.7 | 40.3 | 33.5 | 0.001 | |
| Meningococcal C | 63.6 | 30.6 | 29.4 | <0.001 | |
| Antibiotics (%) | Prophylaxis* | 21.2 | 14.1 | 8.6 | 0.056 |
| On‐demand | 6.3 | 8.5 | 9.5 | 0.812 | |
| Both | 18.8 | 3.6 | 0 | <0.001 | |
| None | 53.1 | 72.6 | 81.5 | 0.001 | |
| Discharge letters mentioning (%) | Splenectomy | 100 | 98 | 96.8 | 0.425 |
| Immunization | 83.3 | 81 | 80.5 | 0.609 | |
| Booster immunization | 40.6 | 22.2 | 22.8 | 0.113 | |
| Influenza vaccination | 25 | 9.8 | 14.3 | 0.021 | |
| On‐demand antibiotics | 37.5 | 17.7 | 23.3 | 0.015 | |
| Protocol Present | No Protocol | P Value | |
|---|---|---|---|
| |||
| Immunizations (%) | |||
| Pneumococcal | 85.3 | 85.9 | 0.671 |
| H. influenzae B | 40.2 | 35.3 | 0.970 |
| Meningococcal C | 33.7 | 25.9 | 0.188 |
| Antibiotics (%) | |||
| Prophylaxis* | 13.8 | 6.3 | <0.001 |
| On‐demand | 9.5 | 5.5 | 0.001 |
| Both | 3.9 | 0 | 0.062 |
| None | 72 | 87.7 | 0.230 |
| Discharge letters mentioning (%) | |||
| Splenectomy | 97.7 | 98.8 | 0.096 |
| Immunization | 81.4 | 78.6 | 0.321 |
| Booster immunization | 25.5 | 13.8 | 0.048 |
| Influenza vaccination | 14.4 | 5 | 0.024 |
| On‐demand antibiotics | 23.2 | 12.5 | 0.213 |
Results
We included 28 of 93 Dutch hospitals (30%), containing a total of 536 splenectomized patients (Table 1.) Five hospitals were excluded because they refused cooperation, and were subsequently replaced by comparable hospitals in their category.
Differences Between University and Nonteaching Hospitals
Hospital performance of Dutch university, nonuniversity teaching, and nonteaching hospitals is shown in Table 2. Admission to a university hospital is associated with better guideline adherence: 22 of 33 of patients (66.7%) in university hospitals were immunized with H. influenzae B as compared to 108 of 268 patients (40.3%) in nonuniversity teaching and 66 of 197 (33.5%) in nonteaching hospitals. Vaccination with N. meningitidis C occurred in 21 of 33 patients (63.6%) as compared to 82 of 268 patients (30.6%) in nonuniversity teaching and 58 of 197 (29.4%) in nonteaching hospitals. In 53.1% of patients no antibiotics were prescribed in university hospitals, as compared to 72.6% in nonuniversity teaching and 82.5% in nonteaching hospitals. Differences between nonuniversity teaching hospitals and nonteaching hospitals were small.
Presence of a Post‐Splenectomy Protocol
The availability of a protocol at the surgical department was not associated with higher vaccination rates (Table 3). It did however show a positive relation on the prescription of prophylactic antibiotics. The effect of a protocol on the quality of discharge information to the GP was minimal.
Size of Surgical Staff
Performance in relation to the size of surgical staff was determined (data not shown). There were no differences in vaccination rates or quality of discharge information between the groups of different sizes (less or more than 8 surgeons). Larger surgical groups seemed to perform better in prescribing antibiotics, however when adjusting for hospital category in multivariate analysis these differences were not significant.
Complication Registry
Complications were systematically registered by all but 2 surgical departments in nonteaching hospitals, composing a cohort of 27 patients.
Although numbers are low, it demonstrates that in the absence of a registry, the guideline adherence for this group of patients was similar, and only prophylactic antibiotics were significantly less prescribed: 62 of 473 patients (13.1%) in the presence of a registry, as compared to 0 of 27 patients in absence of a registry (P value = 0.044) (data not shown). The precise role of the registry herein remains unclear, since both hospitals also lacked a hospital post‐splenectomy protocol.
Discussion
Main Findings
The aim of the present study was to investigate quality of care for splenectomized patients in Dutch hospitals with different teaching status. In general, beneficial effects of teaching status only extended to university hospitals in the Netherlands. Other teaching hospitals performed similarly to nonteaching hospitals in the Netherlands. Hospitals in which the surgical department developed a local protocol with recommendations for managing patients after splenectomy did not achieve higher vaccination rates. There was, however, an improvement in prescription of antibiotics and in the quality of discharge correspondence from the hospital to the GP. Surgical staff size was not related to hospital performance.
Explanation of Results
In the Netherlands, all categories of hospitals provided over 80% of their post‐splenectomy patients with pneumococcal immunization, reflecting that Dutch physicians in general are aware of the need for pneumococcal protection after splenectomy. However, university hospitals had better performance results regarding immunizing patients with all 3 recommended vaccines, as well as prescribing prophylactic antibiotics in combination with a prescription for on‐demand antibiotics. Collectively, university hospitals offered their patients a more complete post‐splenectomy treatment.
It has been described elsewhere that minor teaching and nonteaching hospitals show small differences, and that nonteaching hospitals even perform better at certain indicators than minor teaching hospitals.13 We indeed found small differences between nonuniversity teaching hospitals and nonteaching hospitals, where nonuniversity teaching hospitals performed better at prescribing antibiotics, and nonteaching hospitals did better at giving recommendations to the GP on booster immunization and use of on‐demand antibiotics.
Hospital characteristics have been shown to have important effects on hospital outcomes.10, 14, 15 We hypothesized this would also be the case regarding the adherence to post‐splenectomy management recommendations. In particular, we were expecting to find that the availability of a protocol at the department of surgery would be associated with better compliance with all key recommendations in the British Standards, however, vaccination rates did not differ form departments without a protocol. The items that were generally most eligible for improvement seemed to benefit most from the presence of a protocol.
Neither the presence of a protocol nor the size of the surgical staff were related to better performance in university hospitals. We can therefore only speculate about the explanation for the differences found between university and other hospitals. Organizational differences may not be disregarded; it has been described elsewhere that better quality and processes of care are delivered in major teaching hospitals.16, 9, 12 Most prior studies have reported a lower risk‐adjusted mortality in major teaching hospitals as compared with minor teaching or nonteaching hospitals.9, 12 It is also possible that residency and fellowship programs contribute to better compliance of guidelines and have a favorable impact on the delivery of patient care in teaching hospitals.12
Limitations
In absence of a Dutch guideline we chose to investigate adherence to the recommendations by the British Committee for Standards in Haematology, assuming that Dutch professionals have some knowledge of these recommendations. Although these recommendations are internationally considered to reflect current best practice and patients should therefore be managed according to at least comparable standards, the extent of familiarity and use of the British standards by Dutch physicians remains to be investigated in the future. Furthermore, we investigated the availability of a locally designed protocol on the management of post‐splenectomy patients by the surgical department. Checking the contents of each of these local protocols was not part of our study and thus we can not exclude that these protocols are lacking certain recommendations. It also remains unclear how hospitals have implemented their protocols.
Implications for Future Research and Policy
In the Netherlands, hospitals could offer better quality of care for hyposplenic and asplenic patients in the prevention of infections by increasing immunization rates. Furthermore, although academic centers performed better than the other hospital categories, only a minority of patients were given or advised to receive on demand antibiotics. Here lies a tremendous opportunity to improve patient care in the prevention of severe infections.
Potential barriers that exist for delivering optimal care to these patients remain to be investigated. Furthermore, although teaching status is related to performance, the explanation for this difference remains unclear. The results of this study suggest that there is a relation between characteristics of practice organization and performance, but these characteristics should be further elucidated.
Conclusion
University hospitals offer higher guideline adherence in preventing infections after splenectomy than other teaching and nonteaching hospitals. For all Dutch hospitals there is room for improving the quality of post‐splenectomy patient care. The results of this study suggest that the difference in performance may be related to several characteristics of hospital practice organization. Future research should further investigate these hospital characteristics and their influence on performance.
Acknowledgements
The authors would like to thank all participating hospitals.
- , .Structure and function of the spleen.Nat Rev Immunol.2005;5:606–616.
- , , .Postsplenectomy sepsis and its mortality rate: actual versus perceived risks.Br J Surg.1991;78:1031–1038.
- , , , .Vaccination of asplenic or hyposplenic adults.Br J Surg.2008;95:273–280.
- Guidelines for the prevention and treatment of infection in patients with an absent or dysfunctional spleen.Working Party of the British Committee for Standards in Haematology Clinical Haematology Task Force.BMJ.1996;312:430–434.
- , , .Update of guidelines for the prevention and treatment of infection in patients with an absent or dysfunctional spleen.Clin Med.2002;2:440–443.
- , , , et al.Why don't physicians follow clinical practice guidelines? A framework for improvement.JAMA.1999;282:1458–1465.
- , , .Implementing clinical guidelines: current evidence and future implications.J Contin Educ Health Prof.2004;24 Suppl 1:S31‐S37.
- , .From best evidence to best practice: effective implementation of change in patients' care.Lancet.2003;362:1225–1230.
- , , , et al.Relationship of hospital teaching status with quality of care and mortality for Medicare patients with acute MI.JAMA.2000;284:1256–1262.
- , , , , .Do “America's Best Hospitals” perform better for acute myocardial infarction?N Engl J Med.1999;340:286–292.
- , , , et al.Variation between hospitals in patient outcome after stroke is only partly explained by differences in quality of care: results from the Netherlands Stroke Survey.J Neurol Neurosurg Psychiatry.2008;79:888–894.
- , , , , , .Hospital outcomes in major teaching, minor teaching, and nonteaching hospitals in New York state.Am J Med.2002;112:255–261.
- , .Teaching hospitals and quality of care: a review of the literature.Milbank Q.2002;80:569–593, v.
- , , , .The association between hospital volume and survival after acute myocardial infarction in elderly patients.N Engl J Med.1999;340:1640–1648.
- , , , , .The association between hospital type and mortality and length of stay: a study of 16.9 million hospitalized Medicare beneficiaries.Med Care.2000;38:231–245.
- .Quality of care in teaching hospitals: a literature review.Acad Med.2005;80:458–466.
Copyright © 2010 Society of Hospital Medicine
Electrocardiographic changes of severe hyperkalemia
A 62‐year‐old woman with an extensive medical and surgical history presented with complaints of 2 days of weakness. Physical examination demonstrated a lethargic, but arousable woman in no distress. Her lower extremity motor strength was 4/5 bilaterally. The patient's electrocardiogram (ECG) demonstrated peaked T waves (Figure 1, arrow), absence of P waves, poor R wave progression and QRS interval widening (Figure 1, 2‐headed arrow.) Serum chemistries revealed a potassium level of 10.4 mmol/L and a creatinine of 0.9 mg/dL.

One ampule of D50, 10 units of insulin, 1 ampule of Calcium gluconate and 1 ampule of sodium bicarbonate were given intravenously along with oral Kayexalate. A repeat ECG showed a return of P waves, narrowing of the QRS interval, improved R wave progression and less peaking of the T waves (Figure 2). A repeat potassium level at that time was 9.2 mmol/L.
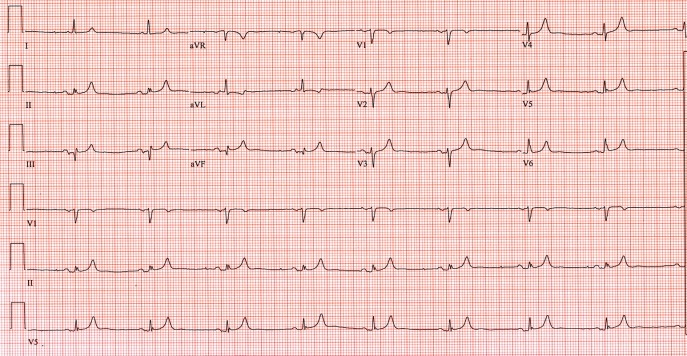
Despite continued therapy to lower the potassium, another ECG showed a return of peaked T waves, a prolonged PR interval and marked widening of the QRS interval to 205 msec; the potassium level was now 10.0 mmol/L (Figure 3).
Despite the patient's renal function being normal, she was emergently dialyzed. After a single dialysis, the patient's potassium level remained normal for the remainder of the hospitalization and a follow‐up ECG returned to baseline (Figure 4). No physiologic explanation was found for her hyperkalemia and it was concluded, despite her denials, that she had taken large quantities of exogenous potassium she had available from previous prescriptions.
A 62‐year‐old woman with an extensive medical and surgical history presented with complaints of 2 days of weakness. Physical examination demonstrated a lethargic, but arousable woman in no distress. Her lower extremity motor strength was 4/5 bilaterally. The patient's electrocardiogram (ECG) demonstrated peaked T waves (Figure 1, arrow), absence of P waves, poor R wave progression and QRS interval widening (Figure 1, 2‐headed arrow.) Serum chemistries revealed a potassium level of 10.4 mmol/L and a creatinine of 0.9 mg/dL.
One ampule of D50, 10 units of insulin, 1 ampule of Calcium gluconate and 1 ampule of sodium bicarbonate were given intravenously along with oral Kayexalate. A repeat ECG showed a return of P waves, narrowing of the QRS interval, improved R wave progression and less peaking of the T waves (Figure 2). A repeat potassium level at that time was 9.2 mmol/L.
Despite continued therapy to lower the potassium, another ECG showed a return of peaked T waves, a prolonged PR interval and marked widening of the QRS interval to 205 msec; the potassium level was now 10.0 mmol/L (Figure 3).
Despite the patient's renal function being normal, she was emergently dialyzed. After a single dialysis, the patient's potassium level remained normal for the remainder of the hospitalization and a follow‐up ECG returned to baseline (Figure 4). No physiologic explanation was found for her hyperkalemia and it was concluded, despite her denials, that she had taken large quantities of exogenous potassium she had available from previous prescriptions.