User login
Seniors Report Post‐Discharge Problems
Recently, there has been an increased focus on improving communication during care transitions for older patients as they leave the hospital. One reason for this focus is the increasing utilization of hospitalists, or hospital‐based physicians, caring for patients in the United States.1 As a result, many primary care physicians (PCPs) no longer care for their patients while in the hospital and may not be informed of their patients' hospitalization.2 Additionally, with an emphasis on shorter lengths of hospital stay, more extensive post‐discharge follow‐up is often warranted for patients, which often becomes the responsibility of a patient's PCP. Recently 6 societies (American College of Physicians, Society of General Internal Medicine, Society of Hospital Medicine, American Geriatrics Society, American College of Emergency Physicians, and Society of Academic Emergency Medicine) have recommended that a patient's PCP is notified during all steps in care transitions and that patient‐centered approaches are employed.3 Despite the increased need for improved inpatient‐ambulatory care transitions, the communication between hospitalists and PCPs has been characterized as being poor and ineffective.4 Prior studies have shown that PCPs are not aware of test results that require follow‐up, may not receive timely or high quality discharge materials, and have an overall poor perception of the quality of communication.46 Ensuring adequate communication is considered important due to the increased risk of adverse events that patients experience after discharge from the hospital.79 Furthermore, recent studies have shown that patients are often able to identify and report adverse events that would not be detected by medical record review alone.10, 11 Eliciting patient perspectives on their experiences after discharge and their expectations of communication between PCPs and hospital physicians can help clinical teams design more patient‐centered solutions for care transitions.
The aim of this study is to report older patients' experiences with problems after hospital discharge and their understanding and expectation of communication between hospital physicians and their PCP. We also explored the relationship between patient experiences and whether their PCPs were aware of their hospitalization.
Methods
Study Design
Patients were recruited for this study from February 2008 to July 2008 using the University of Chicago Hospitalist Study, a large ongoing study that interviews hospitalized patients regarding quality of care.1 Two enrollment strategies were used; in order to oversample frail elders, all patients who were defined to be vulnerable elders using the VES‐13, based on age, self‐rated health, and physical function are asked to consent to surveying their PCP about their admission.12 In addition, every tenth hospitalized patient (with medical record number ending in 5) was asked to consent to have his or her PCP surveyed about communication regarding their admission. Patients who could not name a PCP or those patients who named a physician who denied caring for that patient were excluded. The study was approved by the University of Chicago Institutional Review Board.
Inpatient Interview and Chart Review
Within 48 hours of hospitalization, patients were approached by trained research assistants and first asked to complete the telephone version of the Mini‐Mental Status Exam.13 For those patients who scored a 17 or below on this 22‐point instrument, a proxy was approached to consent to the study and complete the interview protocol. Patients or their proxies then completed an inpatient interview to ascertain age, sex, self‐reported race, income, education and place of residence (home, nursing home). Patients were also asked if their PCP is affiliated with the University of Chicago and whether they had been hospitalized in the year prior to admission. Chart reviews were conducted for calculation of length of stay and location of discharge was also obtained (ie, rehabilitation, home, nursing home).
Two‐Week Post‐Discharge Phone Interview
To ascertain patient reports of problems after discharge, we conducted telephone interviews of eligible patients and/or their proxies 2 weeks after discharge. During the telephone interviews, each patient was asked 12 open‐ended questions to facilitate the reporting of events. Interviews were conducted by trained research assistants, who were blinded to whether the PCP was aware of a patient's hospitalization. Questions focused on the patient's perception of the quality and extent of communication that occurred between his or her identified PCP and the inpatient physician who provided his or her care while hospitalized. For example, the patient was asked if his or her PCP was aware of the hospitalization and if so, the patient was also asked: Do you know who told your regular doctor? Patients were asked about their perception of their PCP's knowledge of their clinical course.
Because we were interested in understanding problems after discharge, we used critical incident technique to solicit the patient's experience with these events. This technique was initially developed to study aviation accidents and can broaden our understanding of rare and poorly observed events by using subjective reports of an individual's own experience.14, 15 From the literature, we a priori identified post‐discharge problems including difficulties with follow‐up tests or appointments, medication changes, and readmission. Thus, we asked each patient, Did anything bad or inconvenient happen following your hospital stay, such as problems with new medications, missing a test, going back to the hospital. The interviews were audio‐taped and transcribed for analysis.
PCP Surveys
To supplement the patient‐reported data and to complete our understanding of what communication did or did not take place, the PCP of each enrolled patient was faxed a survey that ascertained PCP awareness of the hospitalization using the yes or no response to the question Were you aware that your patient had been hospitalized? For those patients who successfully completed the interview, PCPs who had not responded to the fax were also called by telephone to ascertain whether they were aware of the hospitalization, when they became aware (during or post hospitalization) and how they came to be aware.
Data Analysis
The qualitative analysis of the patient interview data was performed using Atlas.ti 5.2 (Berlin) software program. The deductive approach was used for post‐discharge problems that had been characterized in prior literature, such as problems with follow up tests, medications, medical errors, and risk of rehospitalization.2, 16 The constant comparative method was used for the emergence of new codes.17 With this inductive method, the interviews were coded with no a priori assumptions, and each incident was characterized during the initial coding process. The incidents were then compared between the interviews to integrate them into themes and categories. This initial coding scheme was developed by a team (VA, JF, MP) from a sample of 5 transcripts. Using these newly emerged codes, the scheme was then applied to the rest of the transcripts (MP). Two new codes emerged from the deductive approach, negative emotions and patient empowerment, which are discussed in detail in the results.
Quantitative data were analyzed using Stata 10.0 (College Station, TX) software. Descriptive statistics were used to tabulate the frequency and percentage that patients reported a post‐discharge problem. A post‐discharge problem was defined by the patient reporting confusion or having problems at discharge with medications, follow‐up tests or appointments. The frequency and percentage for PCP‐reported awareness of the hospitalization was also tabulated. A Fisher's exact test was used to examine the association between post‐discharge problems and PCP awareness of hospitalization. Similar tests were performed to assess the association between new codes and post‐discharge problems. To assess for responder bias, responders and nonresponders were compared using chi‐square tests and t‐tests, where appropriate, to assess for differences in age, race, gender, education, income, admission in the past 12 months, residence, PCP location, mental status, length of stay, and discharge status.
Results
Of the 114 eligible patients recruited between February and July 2008, 64 patient interviews were completed (56%). The average patient age was 73 years. Most patients were female (69%), African American (70%), live at home (75%), and have a PCP located at the University of Chicago (70%). There were also several who were low income (23% below a median yearly income of $15,000), and did not attend any college (52%). These patients had an average length of stay of 5.3 days, nearly half (48%) having been hospitalized in the past year, and 6 patients (9%) required a proxy to complete the interview (Table 1). There were no significant differences between responders and nonresponders with respect to race, gender, education, income, admission in the past 12 months, residence, PCP location, mental status, length of stay, or discharge status. Responders were more likely to be older than nonresponders (73 years [95% confidence interval {CI} 6976 years] vs. 63 years for nonresponders [95% CI 5769 years]; [P < 0.01]).
Forty‐two percent (27) of patients reported experiencing a post‐discharge problem. These 27 patients reported 42 distinct problems, each of which fell into 1 of 5 broad categories (Table 2). The most common of these were patients having difficulty obtaining follow‐up tests or appointments. These patients either had delay in getting, or were unable to get, follow‐up appointments, or follow‐up tests and test results. There were also many patients who needed reevaluation and thus, were either readmitted to the hospital or had to return to the Emergency Department. Another major category was those who had problems getting medication or therapy. For example, one of (the patients) treatment medswas very hard to find and it delayed us giving her her meds. Others reported they were not properly prepared for discharge. Most of these patients did not receive proper discharge materials which then caused other issues. As one proxy reported, The services were supposed to be provided for (the patient) through her social worker, no one has been informed to her being discharged or her being sent home. We have not gotten any services. Lastly, a few patients reported having hospital complications, such as post‐procedural complications, or questions, such as diagnosis questions.0
| Patient Characteristics (n = 64) | n (%) |
|---|---|
| |
| Mean age (year), mean (SD) | 73 15 |
| Female sex | 44 (69) |
| African American | 45 (70) |
| Mini Mental Status Exam score, mean (SD) | 19 5.8 |
| Proxy used for interview | 6 (9) |
| Length of Stay, mean days (SD) | 5.3 6.1 |
| On‐site PCP (University of Chicago) | 45 (70) |
| Hospitalized in the year prior to admission | 31(48) |
| Income | |
| <$15,000 | 15 (23) |
| >$15,000 | 15 (23) |
| Don't know or refused | 34 (53) |
| Residence | |
| Own house or apartment | 48 (75) |
| Relative or friend house or apartment | 6 (9) |
| Nursing home, group home, long term care home | 10 (16) |
| Education | |
| No college | 33 (52) |
| At least some college | 25 (39) |
| Not sure or do not know | 6 (9) |
| Category (n) | Sub‐Category (n) | Representative Incident (Patient) |
|---|---|---|
| ||
| Difficulty obtaining follow‐up (12) | Appointment issues (8) | I had an earlier (follow‐up appointment) with (my PCP) but by me staying at my daughter's I didn't have access to a car. |
| Test issues (4) | I was in a very weakened state, so I was scared to get on the bus by myself (for the appointment for the chest x‐ray)..I'm going to try (to reschedule), because I can't seem to get the phone number. | |
| Needed re‐evaluation (10) | Readmission (7) | They let me come home, and then that morning they said when I got my house I was on the floor. And so that's why I had to go back to the hospital. |
| Return to ER or clinic (3) | I went back to the emergency room after a few weeks of course. | |
| Problems getting treatments (8) | Medication (7) | I had problems getting my medications because they tell me that the medication was so high, but anyway, I didn't get some of my medications. |
| Therapy (1) | I gave (my insurance company) the information sent the information they wanted to them and we thought everything was settledwe wasn't having any problems until I got hospitalized and came home and started trying to get my oxygen. | |
| Not prepared for discharge (8) | Discharge material issues (6) | I needed a copy of his discharge papers from the hospital for insurance purposesThey didn't give me a discharge paper. |
| Not ready to go home (2) | I told them I wasn't ready to leave, they told me I had to go. | |
| Ongoing problem or question after hospitalization (4) | Post‐procedural problem (3) | Now they're finding out all this bleeding but they don't know where I'm bleeding from. |
| Diagnosis questions (1) | I was diagnoseda long time ago and I went 8 years with this death sentence hanging over my headshe ran a battery of tests and they all came up negativenow they're coming up with the fact that I do have hepatitis C. | |
Patients were often uncertain of whether and how communication between the inpatient physician and PCP (Table 3) took place. One patient said, I don't know what the procedure is as far as giving him the message. Does she fax it to him? I don't know She told me that she was going to call and inform him on everything that happened. I don't know anything from there. The second most commonly expressed perception was from patients who assumed good communication had taken place between his or her physicians. This assumption was grounded in a belief that good communication naturally occurred between physicians. For example 1 patient expressed: (doctors) let the other doctors in too. That's the way to take care of stuff. Lastly, many patients expressed the feeling that their physicians were obligated to communicate with each other. As 1 patient reported, I think that they should have let (my PCP) know that I was in the hospital.
| Category (n) | Sub‐Category (n) | Representative Incident (Patient) |
|---|---|---|
| ||
| Patient Perceptions of inpatient physician communication with PCP (80) | Uncertainty or confusion about the communication (63) | I don't know if they spoke to each other over the phone or if they had any kind of communication. |
| Assumption of good communication (24) | Well I thought by me going to the hospital the doctors would let them know I was there because they all doctors. | |
| Obligation to communicate with PCP (16) | I think they should because there are two doctors who are attending me and they should have communication with each other. | |
Two new themes emerged from the inductive analysis (Table 4). Forty‐five percent of patients reported experiencing negative emotions. These negative emotions were most often expressed as frustration or confusion. For example, 1 patient expressed confusion by saying, When I usually have lab work done I have prescription signedmaybe they changed the way of doing it. Now the pharmacy called me. But I'm supposed to have a note or something. Patients who reported a post‐discharge problem were more likely to report negative emotions (67% vs. 26%, P < 0.01). Feelings of empowerment were reported by 31% of patients. Empowerment was expressed most often as the patient being proactive in communicating with the PCP. One patient reported, We informed (my PCP) and we filled in all of the information that we wanted him to know about. Empowerment was also expressed as being proactive in advocating for communication between the inpatient team and the PCP (Table 3). Some patients expressed feeling empowered through the support of a third party, such as a home nurse. In addition, patients who have a third party advocate are more likely to report being empowered. Empowerment was expressed by 26% of patients with no third party advocate compared with 71% of patients with a third party advocate (P = 0.02).
| Category (n) | Sub‐Category (n) | Representative Incident (Patient) |
|---|---|---|
| ||
| Negative emotions (43) | Frustration (28) | you don't have any decision in your own healthcare at all. I think that's terrible. |
| Confusion (15) | there were all sorts of other tests that different doctors whom I never even knew why they wanted to do these things. | |
| Patient empowerment (24) | Patient proactive in physician communication (19) | I made certain that everybody let (PCP) know exactly what I was doing the whole time I was in and out and all of that (63457) I took it upon myself to call (PCP). |
| Has a third party advocate (8) | The only reason [home follow‐up services] found out is because her nurse was concerned enough to call and keep inquiring about how she was doing. | |
| Patient proactive in his or her own healthcare (5) | I am not scared of the doctors and scared to speak up, especially when it comes to my body and my health. | |
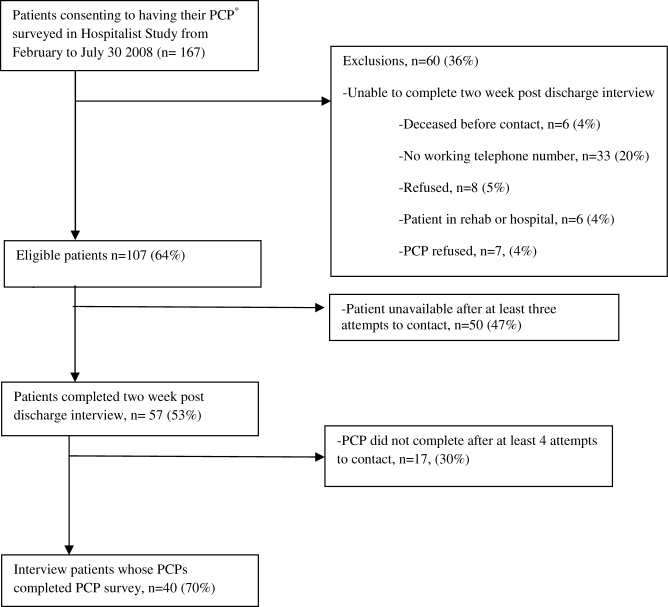
From our sample of patients who completed a 2‐week post‐discharge interview, we were able to obtain PCP surveys for 40 (63%) of these patients (Figure 1). Thirty percent (12) of PCPs reported being unaware of the hospitalization. In all but 4 cases, PCPs had communicated with the medical team during hospitalization. Examining the association between PCP knowledge and patient reported post‐discharge problems showed that patients whose PCPs were not aware of the hospitalization were 2 times more likely to report a post‐discharge problem. A post‐discharge problem was reported by 67% of patients whose PCP was not aware of the hospitalization, while a post‐discharge problem was reported by 32% of patients whose PCP was aware (P < 0.05). Six patients reported returning to the ED or being readmitted. Four patients (33%) of PCPs who were unaware of hospitalization reported returning for reevaluation whereas 7% (n = 2) of patients whose PCP was aware of hospitalization reported returning for evaluation (P = 0.055). Interestingly, patients whose PCPs were not aware of the hospitalization reported feeling more empowered (58%) than those patients whose PCP were aware of the hospitalization (21%, P = 0.03). Because of possible confounding (patient report of problems post‐discharge problems may be affected by PCP awareness of hospitalization), we examined whether patients whose PCPs were aware of their hospitalization differed from those that did not. Patients whose PCPs were aware of their hospitalization were often older (75 vs. 69 years old), white (80% white vs. 65% nonwhite) and female (75% female vs. 54% male). While this small sample size prohibits examining for statistical significance, the magnitude of these differences suggests the need for a larger study to examine patient predictors of PCP awareness of hospitalization.
Discussion
In this sample of frail, older hospitalized patients, nearly half reported at least 1 post‐discharge problem. Most patients have perceptions of what communication did or did not take place between their physicians. While most do not understand the communication process, many expect good communication to occur, and feel that physicians are obligated to communicate with each other. However, patients' perceptions of communication highlight that patient expectations are far from the actual practice in some cases. Nearly half of patients reported feeling negative emotions, such as confusion and frustration, and patients were more likely to experience negative emotions when they also reported a post‐discharge problem. One‐third of patients reported feeling empowered. Empowerment was associated with having a third party who helped advocate for them. Paradoxically, patients whose PCP were not aware of their hospitalization were more likely to feel empowered. Lastly, more patients reported a post‐discharge problem when their PCP was not aware of the hospitalization.
Because this is predominantly a qualitative observational study, it is important to consider the mechanism for these findings since we cannot assume causal relationships. The association of negative emotions, like confusion and frustration, with post‐discharge problems could be explained due to additional stress of the problem itself or that a distressed frame of mind is associated with reporting more problems that may have been overlooked otherwise. In addition, the association between patient empowerment and lack of PCP awareness could be due to the fact that patients are forced to assume a more proactive role in contacting their PCP if they feel that their PCP was not aware. It is equally possible that PCP communication is selectively initiated by hospital physicians when the patients are least empowered. For example, our comparison of demographics for patients whose PCP was aware versus those that were not do suggest that patient characteristics might play a role in whether a patient's PCP is contacted. The association between a third party advocate and patient empowerment is likely explained as the third party is able to keep the patient informed and empowered.
This study has implications for efforts to design a more patient‐centered care transition for hospitalized older patients. First, patients and their proxies should be advocates for good communication to avoid the risks of care transitions. Prior interventions such as use of coaches to boost patient empowerment have had positive results for hospitalized older patients. Moreover, hospitals should keep in mind that problems after discharge are common and are linked to negative emotions, which may lower patient satisfaction or increase liability risk. Similarly, these findings also highlight the importance of keeping PCPs aware of patient hospitalization. For example, PCPs that are aware of hospitalization are better prepared to properly follow‐up on medications, tests, and appointments. The PCP can also help to better prepare the patient for discharge and ease the transition for the patient.
There are several limitations to our study. First and foremost, our small sample size limits our ability to examine statistical significance. This study was part of a short planning grant to design interventions to improve communication with PCPs during hospitalization. Efforts are currently underway to design a communication solution and educational intervention to highlight the importance of contacting PCPs during hospitalization. Because these patients were hospitalized on the teaching service, the resident with the guidance of the teaching attending is responsible for communicating with the PCP. The teaching attending was either a generalist, hospitalist, or specialist who routinely had no a priori relationship with patients prior to the hospitalization. Only 53% of patients were reached by telephone which raises the concern for nonresponse bias. Our low response rate highlights the challenge of doing this type of work with recently discharge patients in low income, underserved areas. In comparing responders and nonresponders, the only difference between the 2 groups was that responders were more likely to be older. One possible reason for this difference may be that older people are more likely to be at home and easier to contact over the phone. Similarly, since data were collected through interviews and adverse events were discussed, these results are subject to recall bias. Efforts were made to reduce this by calling within 2 to 3 weeks after discharge. Lastly, these findings are limited by generalizability. All the patients included in this study were from the University of Chicago Medical Center, which serves largely underserved, African American patients. The experiences of these patients may be unique to this site. In addition, we only studied patients who had a PCP, excluding a population of patients that are at inherent risk due to lack of a coordinating physician to guide ongoing care.
In conclusion, this study suggests that many frail, older patients reported experiencing a post‐discharge problem and patients whose PCPs did not know about their admission were more likely to report a post‐discharge problem. Systematic interventions to improve communications with PCPs during patient care transitions in and out of the hospital are needed.
Acknowledgements
The authors thank Ms. Meryl Prochaska for her research assistance and manuscript preparation.
- , , , et al.Effects of physician experience on costs and outcomes on an academic general medicine service: results of a trial of hospitalists.Ann Intern Med.2002;137(11):866–874.
- , .The Hospitalist Movement 5 Years Later.JAMA.2002;287(4):487–494.
- , , , et al.Transitions of Care Consensus Policy Statement American College of Physicians‐Society of General Internal Medicine‐Society of Hospital Medicine‐American Geriatrics Society‐American College of Emergency Physicians‐Society of Academic Emergency Medicine.J Gen Intern Med.2009;24(8):971–976.
- , , , , , .Deficits in Communication and information transfer between hospital‐based and primary care physicians: implications for patient safety and continuity of care.JAMA.2007;297(8):831–841.
- , , , et al.Patient safety concerns arising from test results that return after hospital discharge.Ann Intern Med.2005;143(2):121–131.
- , , , .Maintaining continuity of care: a look at the quality of communication between Ontario emergency departments and community physicians.CJEM.2005;7(3):155–161.
- , , , , .Adverse drug events occuring following hospital discharge.J Gen Intern Med.2005;20(4):317–323.
- , , , , , .Electronically screening discharge summaries for adverse medical events.J Am Med Infrom Assoc.2003;10(4):339–350.
- , , , , .The incidence and severity of adverse events affecting patients after discharge from the hospital.Ann Intern Med.2003;138:161–167.
- , , , et al.Comparing patient‐reported hospital adverse events with the medical record review: do patients know something that hospitals do not?Ann Intern Med.2005;149(2):100–108.
- , , , et al.What can hospitalized patients tell us about adverse events? Learning from the patient‐reported incidents.J Gen Intern Med.2005;20(9):830–836.
- , , , et al.The Vulnerable Elders Survey: a tool for identifying vulnerable older people in the community.J Am Geriatr Soc.2001;49:1691–1699.
- , , , .Validation of a telephone version of the mini‐mental state examination.J Am Geriatr Soc.1992;40(7):697–702.
- .The critical incident technique.Psychol Bull.1954;51(4):327–359.
- .The critical incident technique in service research.J Serv Res.2004;7:65–89.
- , , , .Medical errors related to discontinuity of care from an inpatient to an outpatient setting.J Gen Intern Med.2003;18:646–651.
- .A Purposeful approach to the constant comparative method in the analysis of qualitative interviews.Qual Quant2002;36:3392–3340.
Recently, there has been an increased focus on improving communication during care transitions for older patients as they leave the hospital. One reason for this focus is the increasing utilization of hospitalists, or hospital‐based physicians, caring for patients in the United States.1 As a result, many primary care physicians (PCPs) no longer care for their patients while in the hospital and may not be informed of their patients' hospitalization.2 Additionally, with an emphasis on shorter lengths of hospital stay, more extensive post‐discharge follow‐up is often warranted for patients, which often becomes the responsibility of a patient's PCP. Recently 6 societies (American College of Physicians, Society of General Internal Medicine, Society of Hospital Medicine, American Geriatrics Society, American College of Emergency Physicians, and Society of Academic Emergency Medicine) have recommended that a patient's PCP is notified during all steps in care transitions and that patient‐centered approaches are employed.3 Despite the increased need for improved inpatient‐ambulatory care transitions, the communication between hospitalists and PCPs has been characterized as being poor and ineffective.4 Prior studies have shown that PCPs are not aware of test results that require follow‐up, may not receive timely or high quality discharge materials, and have an overall poor perception of the quality of communication.46 Ensuring adequate communication is considered important due to the increased risk of adverse events that patients experience after discharge from the hospital.79 Furthermore, recent studies have shown that patients are often able to identify and report adverse events that would not be detected by medical record review alone.10, 11 Eliciting patient perspectives on their experiences after discharge and their expectations of communication between PCPs and hospital physicians can help clinical teams design more patient‐centered solutions for care transitions.
The aim of this study is to report older patients' experiences with problems after hospital discharge and their understanding and expectation of communication between hospital physicians and their PCP. We also explored the relationship between patient experiences and whether their PCPs were aware of their hospitalization.
Methods
Study Design
Patients were recruited for this study from February 2008 to July 2008 using the University of Chicago Hospitalist Study, a large ongoing study that interviews hospitalized patients regarding quality of care.1 Two enrollment strategies were used; in order to oversample frail elders, all patients who were defined to be vulnerable elders using the VES‐13, based on age, self‐rated health, and physical function are asked to consent to surveying their PCP about their admission.12 In addition, every tenth hospitalized patient (with medical record number ending in 5) was asked to consent to have his or her PCP surveyed about communication regarding their admission. Patients who could not name a PCP or those patients who named a physician who denied caring for that patient were excluded. The study was approved by the University of Chicago Institutional Review Board.
Inpatient Interview and Chart Review
Within 48 hours of hospitalization, patients were approached by trained research assistants and first asked to complete the telephone version of the Mini‐Mental Status Exam.13 For those patients who scored a 17 or below on this 22‐point instrument, a proxy was approached to consent to the study and complete the interview protocol. Patients or their proxies then completed an inpatient interview to ascertain age, sex, self‐reported race, income, education and place of residence (home, nursing home). Patients were also asked if their PCP is affiliated with the University of Chicago and whether they had been hospitalized in the year prior to admission. Chart reviews were conducted for calculation of length of stay and location of discharge was also obtained (ie, rehabilitation, home, nursing home).
Two‐Week Post‐Discharge Phone Interview
To ascertain patient reports of problems after discharge, we conducted telephone interviews of eligible patients and/or their proxies 2 weeks after discharge. During the telephone interviews, each patient was asked 12 open‐ended questions to facilitate the reporting of events. Interviews were conducted by trained research assistants, who were blinded to whether the PCP was aware of a patient's hospitalization. Questions focused on the patient's perception of the quality and extent of communication that occurred between his or her identified PCP and the inpatient physician who provided his or her care while hospitalized. For example, the patient was asked if his or her PCP was aware of the hospitalization and if so, the patient was also asked: Do you know who told your regular doctor? Patients were asked about their perception of their PCP's knowledge of their clinical course.
Because we were interested in understanding problems after discharge, we used critical incident technique to solicit the patient's experience with these events. This technique was initially developed to study aviation accidents and can broaden our understanding of rare and poorly observed events by using subjective reports of an individual's own experience.14, 15 From the literature, we a priori identified post‐discharge problems including difficulties with follow‐up tests or appointments, medication changes, and readmission. Thus, we asked each patient, Did anything bad or inconvenient happen following your hospital stay, such as problems with new medications, missing a test, going back to the hospital. The interviews were audio‐taped and transcribed for analysis.
PCP Surveys
To supplement the patient‐reported data and to complete our understanding of what communication did or did not take place, the PCP of each enrolled patient was faxed a survey that ascertained PCP awareness of the hospitalization using the yes or no response to the question Were you aware that your patient had been hospitalized? For those patients who successfully completed the interview, PCPs who had not responded to the fax were also called by telephone to ascertain whether they were aware of the hospitalization, when they became aware (during or post hospitalization) and how they came to be aware.
Data Analysis
The qualitative analysis of the patient interview data was performed using Atlas.ti 5.2 (Berlin) software program. The deductive approach was used for post‐discharge problems that had been characterized in prior literature, such as problems with follow up tests, medications, medical errors, and risk of rehospitalization.2, 16 The constant comparative method was used for the emergence of new codes.17 With this inductive method, the interviews were coded with no a priori assumptions, and each incident was characterized during the initial coding process. The incidents were then compared between the interviews to integrate them into themes and categories. This initial coding scheme was developed by a team (VA, JF, MP) from a sample of 5 transcripts. Using these newly emerged codes, the scheme was then applied to the rest of the transcripts (MP). Two new codes emerged from the deductive approach, negative emotions and patient empowerment, which are discussed in detail in the results.
Quantitative data were analyzed using Stata 10.0 (College Station, TX) software. Descriptive statistics were used to tabulate the frequency and percentage that patients reported a post‐discharge problem. A post‐discharge problem was defined by the patient reporting confusion or having problems at discharge with medications, follow‐up tests or appointments. The frequency and percentage for PCP‐reported awareness of the hospitalization was also tabulated. A Fisher's exact test was used to examine the association between post‐discharge problems and PCP awareness of hospitalization. Similar tests were performed to assess the association between new codes and post‐discharge problems. To assess for responder bias, responders and nonresponders were compared using chi‐square tests and t‐tests, where appropriate, to assess for differences in age, race, gender, education, income, admission in the past 12 months, residence, PCP location, mental status, length of stay, and discharge status.
Results
Of the 114 eligible patients recruited between February and July 2008, 64 patient interviews were completed (56%). The average patient age was 73 years. Most patients were female (69%), African American (70%), live at home (75%), and have a PCP located at the University of Chicago (70%). There were also several who were low income (23% below a median yearly income of $15,000), and did not attend any college (52%). These patients had an average length of stay of 5.3 days, nearly half (48%) having been hospitalized in the past year, and 6 patients (9%) required a proxy to complete the interview (Table 1). There were no significant differences between responders and nonresponders with respect to race, gender, education, income, admission in the past 12 months, residence, PCP location, mental status, length of stay, or discharge status. Responders were more likely to be older than nonresponders (73 years [95% confidence interval {CI} 6976 years] vs. 63 years for nonresponders [95% CI 5769 years]; [P < 0.01]).
Forty‐two percent (27) of patients reported experiencing a post‐discharge problem. These 27 patients reported 42 distinct problems, each of which fell into 1 of 5 broad categories (Table 2). The most common of these were patients having difficulty obtaining follow‐up tests or appointments. These patients either had delay in getting, or were unable to get, follow‐up appointments, or follow‐up tests and test results. There were also many patients who needed reevaluation and thus, were either readmitted to the hospital or had to return to the Emergency Department. Another major category was those who had problems getting medication or therapy. For example, one of (the patients) treatment medswas very hard to find and it delayed us giving her her meds. Others reported they were not properly prepared for discharge. Most of these patients did not receive proper discharge materials which then caused other issues. As one proxy reported, The services were supposed to be provided for (the patient) through her social worker, no one has been informed to her being discharged or her being sent home. We have not gotten any services. Lastly, a few patients reported having hospital complications, such as post‐procedural complications, or questions, such as diagnosis questions.0
| Patient Characteristics (n = 64) | n (%) |
|---|---|
| |
| Mean age (year), mean (SD) | 73 15 |
| Female sex | 44 (69) |
| African American | 45 (70) |
| Mini Mental Status Exam score, mean (SD) | 19 5.8 |
| Proxy used for interview | 6 (9) |
| Length of Stay, mean days (SD) | 5.3 6.1 |
| On‐site PCP (University of Chicago) | 45 (70) |
| Hospitalized in the year prior to admission | 31(48) |
| Income | |
| <$15,000 | 15 (23) |
| >$15,000 | 15 (23) |
| Don't know or refused | 34 (53) |
| Residence | |
| Own house or apartment | 48 (75) |
| Relative or friend house or apartment | 6 (9) |
| Nursing home, group home, long term care home | 10 (16) |
| Education | |
| No college | 33 (52) |
| At least some college | 25 (39) |
| Not sure or do not know | 6 (9) |
| Category (n) | Sub‐Category (n) | Representative Incident (Patient) |
|---|---|---|
| ||
| Difficulty obtaining follow‐up (12) | Appointment issues (8) | I had an earlier (follow‐up appointment) with (my PCP) but by me staying at my daughter's I didn't have access to a car. |
| Test issues (4) | I was in a very weakened state, so I was scared to get on the bus by myself (for the appointment for the chest x‐ray)..I'm going to try (to reschedule), because I can't seem to get the phone number. | |
| Needed re‐evaluation (10) | Readmission (7) | They let me come home, and then that morning they said when I got my house I was on the floor. And so that's why I had to go back to the hospital. |
| Return to ER or clinic (3) | I went back to the emergency room after a few weeks of course. | |
| Problems getting treatments (8) | Medication (7) | I had problems getting my medications because they tell me that the medication was so high, but anyway, I didn't get some of my medications. |
| Therapy (1) | I gave (my insurance company) the information sent the information they wanted to them and we thought everything was settledwe wasn't having any problems until I got hospitalized and came home and started trying to get my oxygen. | |
| Not prepared for discharge (8) | Discharge material issues (6) | I needed a copy of his discharge papers from the hospital for insurance purposesThey didn't give me a discharge paper. |
| Not ready to go home (2) | I told them I wasn't ready to leave, they told me I had to go. | |
| Ongoing problem or question after hospitalization (4) | Post‐procedural problem (3) | Now they're finding out all this bleeding but they don't know where I'm bleeding from. |
| Diagnosis questions (1) | I was diagnoseda long time ago and I went 8 years with this death sentence hanging over my headshe ran a battery of tests and they all came up negativenow they're coming up with the fact that I do have hepatitis C. | |
Patients were often uncertain of whether and how communication between the inpatient physician and PCP (Table 3) took place. One patient said, I don't know what the procedure is as far as giving him the message. Does she fax it to him? I don't know She told me that she was going to call and inform him on everything that happened. I don't know anything from there. The second most commonly expressed perception was from patients who assumed good communication had taken place between his or her physicians. This assumption was grounded in a belief that good communication naturally occurred between physicians. For example 1 patient expressed: (doctors) let the other doctors in too. That's the way to take care of stuff. Lastly, many patients expressed the feeling that their physicians were obligated to communicate with each other. As 1 patient reported, I think that they should have let (my PCP) know that I was in the hospital.
| Category (n) | Sub‐Category (n) | Representative Incident (Patient) |
|---|---|---|
| ||
| Patient Perceptions of inpatient physician communication with PCP (80) | Uncertainty or confusion about the communication (63) | I don't know if they spoke to each other over the phone or if they had any kind of communication. |
| Assumption of good communication (24) | Well I thought by me going to the hospital the doctors would let them know I was there because they all doctors. | |
| Obligation to communicate with PCP (16) | I think they should because there are two doctors who are attending me and they should have communication with each other. | |
Two new themes emerged from the inductive analysis (Table 4). Forty‐five percent of patients reported experiencing negative emotions. These negative emotions were most often expressed as frustration or confusion. For example, 1 patient expressed confusion by saying, When I usually have lab work done I have prescription signedmaybe they changed the way of doing it. Now the pharmacy called me. But I'm supposed to have a note or something. Patients who reported a post‐discharge problem were more likely to report negative emotions (67% vs. 26%, P < 0.01). Feelings of empowerment were reported by 31% of patients. Empowerment was expressed most often as the patient being proactive in communicating with the PCP. One patient reported, We informed (my PCP) and we filled in all of the information that we wanted him to know about. Empowerment was also expressed as being proactive in advocating for communication between the inpatient team and the PCP (Table 3). Some patients expressed feeling empowered through the support of a third party, such as a home nurse. In addition, patients who have a third party advocate are more likely to report being empowered. Empowerment was expressed by 26% of patients with no third party advocate compared with 71% of patients with a third party advocate (P = 0.02).
| Category (n) | Sub‐Category (n) | Representative Incident (Patient) |
|---|---|---|
| ||
| Negative emotions (43) | Frustration (28) | you don't have any decision in your own healthcare at all. I think that's terrible. |
| Confusion (15) | there were all sorts of other tests that different doctors whom I never even knew why they wanted to do these things. | |
| Patient empowerment (24) | Patient proactive in physician communication (19) | I made certain that everybody let (PCP) know exactly what I was doing the whole time I was in and out and all of that (63457) I took it upon myself to call (PCP). |
| Has a third party advocate (8) | The only reason [home follow‐up services] found out is because her nurse was concerned enough to call and keep inquiring about how she was doing. | |
| Patient proactive in his or her own healthcare (5) | I am not scared of the doctors and scared to speak up, especially when it comes to my body and my health. | |
From our sample of patients who completed a 2‐week post‐discharge interview, we were able to obtain PCP surveys for 40 (63%) of these patients (Figure 1). Thirty percent (12) of PCPs reported being unaware of the hospitalization. In all but 4 cases, PCPs had communicated with the medical team during hospitalization. Examining the association between PCP knowledge and patient reported post‐discharge problems showed that patients whose PCPs were not aware of the hospitalization were 2 times more likely to report a post‐discharge problem. A post‐discharge problem was reported by 67% of patients whose PCP was not aware of the hospitalization, while a post‐discharge problem was reported by 32% of patients whose PCP was aware (P < 0.05). Six patients reported returning to the ED or being readmitted. Four patients (33%) of PCPs who were unaware of hospitalization reported returning for reevaluation whereas 7% (n = 2) of patients whose PCP was aware of hospitalization reported returning for evaluation (P = 0.055). Interestingly, patients whose PCPs were not aware of the hospitalization reported feeling more empowered (58%) than those patients whose PCP were aware of the hospitalization (21%, P = 0.03). Because of possible confounding (patient report of problems post‐discharge problems may be affected by PCP awareness of hospitalization), we examined whether patients whose PCPs were aware of their hospitalization differed from those that did not. Patients whose PCPs were aware of their hospitalization were often older (75 vs. 69 years old), white (80% white vs. 65% nonwhite) and female (75% female vs. 54% male). While this small sample size prohibits examining for statistical significance, the magnitude of these differences suggests the need for a larger study to examine patient predictors of PCP awareness of hospitalization.
Discussion
In this sample of frail, older hospitalized patients, nearly half reported at least 1 post‐discharge problem. Most patients have perceptions of what communication did or did not take place between their physicians. While most do not understand the communication process, many expect good communication to occur, and feel that physicians are obligated to communicate with each other. However, patients' perceptions of communication highlight that patient expectations are far from the actual practice in some cases. Nearly half of patients reported feeling negative emotions, such as confusion and frustration, and patients were more likely to experience negative emotions when they also reported a post‐discharge problem. One‐third of patients reported feeling empowered. Empowerment was associated with having a third party who helped advocate for them. Paradoxically, patients whose PCP were not aware of their hospitalization were more likely to feel empowered. Lastly, more patients reported a post‐discharge problem when their PCP was not aware of the hospitalization.
Because this is predominantly a qualitative observational study, it is important to consider the mechanism for these findings since we cannot assume causal relationships. The association of negative emotions, like confusion and frustration, with post‐discharge problems could be explained due to additional stress of the problem itself or that a distressed frame of mind is associated with reporting more problems that may have been overlooked otherwise. In addition, the association between patient empowerment and lack of PCP awareness could be due to the fact that patients are forced to assume a more proactive role in contacting their PCP if they feel that their PCP was not aware. It is equally possible that PCP communication is selectively initiated by hospital physicians when the patients are least empowered. For example, our comparison of demographics for patients whose PCP was aware versus those that were not do suggest that patient characteristics might play a role in whether a patient's PCP is contacted. The association between a third party advocate and patient empowerment is likely explained as the third party is able to keep the patient informed and empowered.
This study has implications for efforts to design a more patient‐centered care transition for hospitalized older patients. First, patients and their proxies should be advocates for good communication to avoid the risks of care transitions. Prior interventions such as use of coaches to boost patient empowerment have had positive results for hospitalized older patients. Moreover, hospitals should keep in mind that problems after discharge are common and are linked to negative emotions, which may lower patient satisfaction or increase liability risk. Similarly, these findings also highlight the importance of keeping PCPs aware of patient hospitalization. For example, PCPs that are aware of hospitalization are better prepared to properly follow‐up on medications, tests, and appointments. The PCP can also help to better prepare the patient for discharge and ease the transition for the patient.
There are several limitations to our study. First and foremost, our small sample size limits our ability to examine statistical significance. This study was part of a short planning grant to design interventions to improve communication with PCPs during hospitalization. Efforts are currently underway to design a communication solution and educational intervention to highlight the importance of contacting PCPs during hospitalization. Because these patients were hospitalized on the teaching service, the resident with the guidance of the teaching attending is responsible for communicating with the PCP. The teaching attending was either a generalist, hospitalist, or specialist who routinely had no a priori relationship with patients prior to the hospitalization. Only 53% of patients were reached by telephone which raises the concern for nonresponse bias. Our low response rate highlights the challenge of doing this type of work with recently discharge patients in low income, underserved areas. In comparing responders and nonresponders, the only difference between the 2 groups was that responders were more likely to be older. One possible reason for this difference may be that older people are more likely to be at home and easier to contact over the phone. Similarly, since data were collected through interviews and adverse events were discussed, these results are subject to recall bias. Efforts were made to reduce this by calling within 2 to 3 weeks after discharge. Lastly, these findings are limited by generalizability. All the patients included in this study were from the University of Chicago Medical Center, which serves largely underserved, African American patients. The experiences of these patients may be unique to this site. In addition, we only studied patients who had a PCP, excluding a population of patients that are at inherent risk due to lack of a coordinating physician to guide ongoing care.
In conclusion, this study suggests that many frail, older patients reported experiencing a post‐discharge problem and patients whose PCPs did not know about their admission were more likely to report a post‐discharge problem. Systematic interventions to improve communications with PCPs during patient care transitions in and out of the hospital are needed.
Acknowledgements
The authors thank Ms. Meryl Prochaska for her research assistance and manuscript preparation.
Recently, there has been an increased focus on improving communication during care transitions for older patients as they leave the hospital. One reason for this focus is the increasing utilization of hospitalists, or hospital‐based physicians, caring for patients in the United States.1 As a result, many primary care physicians (PCPs) no longer care for their patients while in the hospital and may not be informed of their patients' hospitalization.2 Additionally, with an emphasis on shorter lengths of hospital stay, more extensive post‐discharge follow‐up is often warranted for patients, which often becomes the responsibility of a patient's PCP. Recently 6 societies (American College of Physicians, Society of General Internal Medicine, Society of Hospital Medicine, American Geriatrics Society, American College of Emergency Physicians, and Society of Academic Emergency Medicine) have recommended that a patient's PCP is notified during all steps in care transitions and that patient‐centered approaches are employed.3 Despite the increased need for improved inpatient‐ambulatory care transitions, the communication between hospitalists and PCPs has been characterized as being poor and ineffective.4 Prior studies have shown that PCPs are not aware of test results that require follow‐up, may not receive timely or high quality discharge materials, and have an overall poor perception of the quality of communication.46 Ensuring adequate communication is considered important due to the increased risk of adverse events that patients experience after discharge from the hospital.79 Furthermore, recent studies have shown that patients are often able to identify and report adverse events that would not be detected by medical record review alone.10, 11 Eliciting patient perspectives on their experiences after discharge and their expectations of communication between PCPs and hospital physicians can help clinical teams design more patient‐centered solutions for care transitions.
The aim of this study is to report older patients' experiences with problems after hospital discharge and their understanding and expectation of communication between hospital physicians and their PCP. We also explored the relationship between patient experiences and whether their PCPs were aware of their hospitalization.
Methods
Study Design
Patients were recruited for this study from February 2008 to July 2008 using the University of Chicago Hospitalist Study, a large ongoing study that interviews hospitalized patients regarding quality of care.1 Two enrollment strategies were used; in order to oversample frail elders, all patients who were defined to be vulnerable elders using the VES‐13, based on age, self‐rated health, and physical function are asked to consent to surveying their PCP about their admission.12 In addition, every tenth hospitalized patient (with medical record number ending in 5) was asked to consent to have his or her PCP surveyed about communication regarding their admission. Patients who could not name a PCP or those patients who named a physician who denied caring for that patient were excluded. The study was approved by the University of Chicago Institutional Review Board.
Inpatient Interview and Chart Review
Within 48 hours of hospitalization, patients were approached by trained research assistants and first asked to complete the telephone version of the Mini‐Mental Status Exam.13 For those patients who scored a 17 or below on this 22‐point instrument, a proxy was approached to consent to the study and complete the interview protocol. Patients or their proxies then completed an inpatient interview to ascertain age, sex, self‐reported race, income, education and place of residence (home, nursing home). Patients were also asked if their PCP is affiliated with the University of Chicago and whether they had been hospitalized in the year prior to admission. Chart reviews were conducted for calculation of length of stay and location of discharge was also obtained (ie, rehabilitation, home, nursing home).
Two‐Week Post‐Discharge Phone Interview
To ascertain patient reports of problems after discharge, we conducted telephone interviews of eligible patients and/or their proxies 2 weeks after discharge. During the telephone interviews, each patient was asked 12 open‐ended questions to facilitate the reporting of events. Interviews were conducted by trained research assistants, who were blinded to whether the PCP was aware of a patient's hospitalization. Questions focused on the patient's perception of the quality and extent of communication that occurred between his or her identified PCP and the inpatient physician who provided his or her care while hospitalized. For example, the patient was asked if his or her PCP was aware of the hospitalization and if so, the patient was also asked: Do you know who told your regular doctor? Patients were asked about their perception of their PCP's knowledge of their clinical course.
Because we were interested in understanding problems after discharge, we used critical incident technique to solicit the patient's experience with these events. This technique was initially developed to study aviation accidents and can broaden our understanding of rare and poorly observed events by using subjective reports of an individual's own experience.14, 15 From the literature, we a priori identified post‐discharge problems including difficulties with follow‐up tests or appointments, medication changes, and readmission. Thus, we asked each patient, Did anything bad or inconvenient happen following your hospital stay, such as problems with new medications, missing a test, going back to the hospital. The interviews were audio‐taped and transcribed for analysis.
PCP Surveys
To supplement the patient‐reported data and to complete our understanding of what communication did or did not take place, the PCP of each enrolled patient was faxed a survey that ascertained PCP awareness of the hospitalization using the yes or no response to the question Were you aware that your patient had been hospitalized? For those patients who successfully completed the interview, PCPs who had not responded to the fax were also called by telephone to ascertain whether they were aware of the hospitalization, when they became aware (during or post hospitalization) and how they came to be aware.
Data Analysis
The qualitative analysis of the patient interview data was performed using Atlas.ti 5.2 (Berlin) software program. The deductive approach was used for post‐discharge problems that had been characterized in prior literature, such as problems with follow up tests, medications, medical errors, and risk of rehospitalization.2, 16 The constant comparative method was used for the emergence of new codes.17 With this inductive method, the interviews were coded with no a priori assumptions, and each incident was characterized during the initial coding process. The incidents were then compared between the interviews to integrate them into themes and categories. This initial coding scheme was developed by a team (VA, JF, MP) from a sample of 5 transcripts. Using these newly emerged codes, the scheme was then applied to the rest of the transcripts (MP). Two new codes emerged from the deductive approach, negative emotions and patient empowerment, which are discussed in detail in the results.
Quantitative data were analyzed using Stata 10.0 (College Station, TX) software. Descriptive statistics were used to tabulate the frequency and percentage that patients reported a post‐discharge problem. A post‐discharge problem was defined by the patient reporting confusion or having problems at discharge with medications, follow‐up tests or appointments. The frequency and percentage for PCP‐reported awareness of the hospitalization was also tabulated. A Fisher's exact test was used to examine the association between post‐discharge problems and PCP awareness of hospitalization. Similar tests were performed to assess the association between new codes and post‐discharge problems. To assess for responder bias, responders and nonresponders were compared using chi‐square tests and t‐tests, where appropriate, to assess for differences in age, race, gender, education, income, admission in the past 12 months, residence, PCP location, mental status, length of stay, and discharge status.
Results
Of the 114 eligible patients recruited between February and July 2008, 64 patient interviews were completed (56%). The average patient age was 73 years. Most patients were female (69%), African American (70%), live at home (75%), and have a PCP located at the University of Chicago (70%). There were also several who were low income (23% below a median yearly income of $15,000), and did not attend any college (52%). These patients had an average length of stay of 5.3 days, nearly half (48%) having been hospitalized in the past year, and 6 patients (9%) required a proxy to complete the interview (Table 1). There were no significant differences between responders and nonresponders with respect to race, gender, education, income, admission in the past 12 months, residence, PCP location, mental status, length of stay, or discharge status. Responders were more likely to be older than nonresponders (73 years [95% confidence interval {CI} 6976 years] vs. 63 years for nonresponders [95% CI 5769 years]; [P < 0.01]).
Forty‐two percent (27) of patients reported experiencing a post‐discharge problem. These 27 patients reported 42 distinct problems, each of which fell into 1 of 5 broad categories (Table 2). The most common of these were patients having difficulty obtaining follow‐up tests or appointments. These patients either had delay in getting, or were unable to get, follow‐up appointments, or follow‐up tests and test results. There were also many patients who needed reevaluation and thus, were either readmitted to the hospital or had to return to the Emergency Department. Another major category was those who had problems getting medication or therapy. For example, one of (the patients) treatment medswas very hard to find and it delayed us giving her her meds. Others reported they were not properly prepared for discharge. Most of these patients did not receive proper discharge materials which then caused other issues. As one proxy reported, The services were supposed to be provided for (the patient) through her social worker, no one has been informed to her being discharged or her being sent home. We have not gotten any services. Lastly, a few patients reported having hospital complications, such as post‐procedural complications, or questions, such as diagnosis questions.0
| Patient Characteristics (n = 64) | n (%) |
|---|---|
| |
| Mean age (year), mean (SD) | 73 15 |
| Female sex | 44 (69) |
| African American | 45 (70) |
| Mini Mental Status Exam score, mean (SD) | 19 5.8 |
| Proxy used for interview | 6 (9) |
| Length of Stay, mean days (SD) | 5.3 6.1 |
| On‐site PCP (University of Chicago) | 45 (70) |
| Hospitalized in the year prior to admission | 31(48) |
| Income | |
| <$15,000 | 15 (23) |
| >$15,000 | 15 (23) |
| Don't know or refused | 34 (53) |
| Residence | |
| Own house or apartment | 48 (75) |
| Relative or friend house or apartment | 6 (9) |
| Nursing home, group home, long term care home | 10 (16) |
| Education | |
| No college | 33 (52) |
| At least some college | 25 (39) |
| Not sure or do not know | 6 (9) |
| Category (n) | Sub‐Category (n) | Representative Incident (Patient) |
|---|---|---|
| ||
| Difficulty obtaining follow‐up (12) | Appointment issues (8) | I had an earlier (follow‐up appointment) with (my PCP) but by me staying at my daughter's I didn't have access to a car. |
| Test issues (4) | I was in a very weakened state, so I was scared to get on the bus by myself (for the appointment for the chest x‐ray)..I'm going to try (to reschedule), because I can't seem to get the phone number. | |
| Needed re‐evaluation (10) | Readmission (7) | They let me come home, and then that morning they said when I got my house I was on the floor. And so that's why I had to go back to the hospital. |
| Return to ER or clinic (3) | I went back to the emergency room after a few weeks of course. | |
| Problems getting treatments (8) | Medication (7) | I had problems getting my medications because they tell me that the medication was so high, but anyway, I didn't get some of my medications. |
| Therapy (1) | I gave (my insurance company) the information sent the information they wanted to them and we thought everything was settledwe wasn't having any problems until I got hospitalized and came home and started trying to get my oxygen. | |
| Not prepared for discharge (8) | Discharge material issues (6) | I needed a copy of his discharge papers from the hospital for insurance purposesThey didn't give me a discharge paper. |
| Not ready to go home (2) | I told them I wasn't ready to leave, they told me I had to go. | |
| Ongoing problem or question after hospitalization (4) | Post‐procedural problem (3) | Now they're finding out all this bleeding but they don't know where I'm bleeding from. |
| Diagnosis questions (1) | I was diagnoseda long time ago and I went 8 years with this death sentence hanging over my headshe ran a battery of tests and they all came up negativenow they're coming up with the fact that I do have hepatitis C. | |
Patients were often uncertain of whether and how communication between the inpatient physician and PCP (Table 3) took place. One patient said, I don't know what the procedure is as far as giving him the message. Does she fax it to him? I don't know She told me that she was going to call and inform him on everything that happened. I don't know anything from there. The second most commonly expressed perception was from patients who assumed good communication had taken place between his or her physicians. This assumption was grounded in a belief that good communication naturally occurred between physicians. For example 1 patient expressed: (doctors) let the other doctors in too. That's the way to take care of stuff. Lastly, many patients expressed the feeling that their physicians were obligated to communicate with each other. As 1 patient reported, I think that they should have let (my PCP) know that I was in the hospital.
| Category (n) | Sub‐Category (n) | Representative Incident (Patient) |
|---|---|---|
| ||
| Patient Perceptions of inpatient physician communication with PCP (80) | Uncertainty or confusion about the communication (63) | I don't know if they spoke to each other over the phone or if they had any kind of communication. |
| Assumption of good communication (24) | Well I thought by me going to the hospital the doctors would let them know I was there because they all doctors. | |
| Obligation to communicate with PCP (16) | I think they should because there are two doctors who are attending me and they should have communication with each other. | |
Two new themes emerged from the inductive analysis (Table 4). Forty‐five percent of patients reported experiencing negative emotions. These negative emotions were most often expressed as frustration or confusion. For example, 1 patient expressed confusion by saying, When I usually have lab work done I have prescription signedmaybe they changed the way of doing it. Now the pharmacy called me. But I'm supposed to have a note or something. Patients who reported a post‐discharge problem were more likely to report negative emotions (67% vs. 26%, P < 0.01). Feelings of empowerment were reported by 31% of patients. Empowerment was expressed most often as the patient being proactive in communicating with the PCP. One patient reported, We informed (my PCP) and we filled in all of the information that we wanted him to know about. Empowerment was also expressed as being proactive in advocating for communication between the inpatient team and the PCP (Table 3). Some patients expressed feeling empowered through the support of a third party, such as a home nurse. In addition, patients who have a third party advocate are more likely to report being empowered. Empowerment was expressed by 26% of patients with no third party advocate compared with 71% of patients with a third party advocate (P = 0.02).
| Category (n) | Sub‐Category (n) | Representative Incident (Patient) |
|---|---|---|
| ||
| Negative emotions (43) | Frustration (28) | you don't have any decision in your own healthcare at all. I think that's terrible. |
| Confusion (15) | there were all sorts of other tests that different doctors whom I never even knew why they wanted to do these things. | |
| Patient empowerment (24) | Patient proactive in physician communication (19) | I made certain that everybody let (PCP) know exactly what I was doing the whole time I was in and out and all of that (63457) I took it upon myself to call (PCP). |
| Has a third party advocate (8) | The only reason [home follow‐up services] found out is because her nurse was concerned enough to call and keep inquiring about how she was doing. | |
| Patient proactive in his or her own healthcare (5) | I am not scared of the doctors and scared to speak up, especially when it comes to my body and my health. | |
From our sample of patients who completed a 2‐week post‐discharge interview, we were able to obtain PCP surveys for 40 (63%) of these patients (Figure 1). Thirty percent (12) of PCPs reported being unaware of the hospitalization. In all but 4 cases, PCPs had communicated with the medical team during hospitalization. Examining the association between PCP knowledge and patient reported post‐discharge problems showed that patients whose PCPs were not aware of the hospitalization were 2 times more likely to report a post‐discharge problem. A post‐discharge problem was reported by 67% of patients whose PCP was not aware of the hospitalization, while a post‐discharge problem was reported by 32% of patients whose PCP was aware (P < 0.05). Six patients reported returning to the ED or being readmitted. Four patients (33%) of PCPs who were unaware of hospitalization reported returning for reevaluation whereas 7% (n = 2) of patients whose PCP was aware of hospitalization reported returning for evaluation (P = 0.055). Interestingly, patients whose PCPs were not aware of the hospitalization reported feeling more empowered (58%) than those patients whose PCP were aware of the hospitalization (21%, P = 0.03). Because of possible confounding (patient report of problems post‐discharge problems may be affected by PCP awareness of hospitalization), we examined whether patients whose PCPs were aware of their hospitalization differed from those that did not. Patients whose PCPs were aware of their hospitalization were often older (75 vs. 69 years old), white (80% white vs. 65% nonwhite) and female (75% female vs. 54% male). While this small sample size prohibits examining for statistical significance, the magnitude of these differences suggests the need for a larger study to examine patient predictors of PCP awareness of hospitalization.
Discussion
In this sample of frail, older hospitalized patients, nearly half reported at least 1 post‐discharge problem. Most patients have perceptions of what communication did or did not take place between their physicians. While most do not understand the communication process, many expect good communication to occur, and feel that physicians are obligated to communicate with each other. However, patients' perceptions of communication highlight that patient expectations are far from the actual practice in some cases. Nearly half of patients reported feeling negative emotions, such as confusion and frustration, and patients were more likely to experience negative emotions when they also reported a post‐discharge problem. One‐third of patients reported feeling empowered. Empowerment was associated with having a third party who helped advocate for them. Paradoxically, patients whose PCP were not aware of their hospitalization were more likely to feel empowered. Lastly, more patients reported a post‐discharge problem when their PCP was not aware of the hospitalization.
Because this is predominantly a qualitative observational study, it is important to consider the mechanism for these findings since we cannot assume causal relationships. The association of negative emotions, like confusion and frustration, with post‐discharge problems could be explained due to additional stress of the problem itself or that a distressed frame of mind is associated with reporting more problems that may have been overlooked otherwise. In addition, the association between patient empowerment and lack of PCP awareness could be due to the fact that patients are forced to assume a more proactive role in contacting their PCP if they feel that their PCP was not aware. It is equally possible that PCP communication is selectively initiated by hospital physicians when the patients are least empowered. For example, our comparison of demographics for patients whose PCP was aware versus those that were not do suggest that patient characteristics might play a role in whether a patient's PCP is contacted. The association between a third party advocate and patient empowerment is likely explained as the third party is able to keep the patient informed and empowered.
This study has implications for efforts to design a more patient‐centered care transition for hospitalized older patients. First, patients and their proxies should be advocates for good communication to avoid the risks of care transitions. Prior interventions such as use of coaches to boost patient empowerment have had positive results for hospitalized older patients. Moreover, hospitals should keep in mind that problems after discharge are common and are linked to negative emotions, which may lower patient satisfaction or increase liability risk. Similarly, these findings also highlight the importance of keeping PCPs aware of patient hospitalization. For example, PCPs that are aware of hospitalization are better prepared to properly follow‐up on medications, tests, and appointments. The PCP can also help to better prepare the patient for discharge and ease the transition for the patient.
There are several limitations to our study. First and foremost, our small sample size limits our ability to examine statistical significance. This study was part of a short planning grant to design interventions to improve communication with PCPs during hospitalization. Efforts are currently underway to design a communication solution and educational intervention to highlight the importance of contacting PCPs during hospitalization. Because these patients were hospitalized on the teaching service, the resident with the guidance of the teaching attending is responsible for communicating with the PCP. The teaching attending was either a generalist, hospitalist, or specialist who routinely had no a priori relationship with patients prior to the hospitalization. Only 53% of patients were reached by telephone which raises the concern for nonresponse bias. Our low response rate highlights the challenge of doing this type of work with recently discharge patients in low income, underserved areas. In comparing responders and nonresponders, the only difference between the 2 groups was that responders were more likely to be older. One possible reason for this difference may be that older people are more likely to be at home and easier to contact over the phone. Similarly, since data were collected through interviews and adverse events were discussed, these results are subject to recall bias. Efforts were made to reduce this by calling within 2 to 3 weeks after discharge. Lastly, these findings are limited by generalizability. All the patients included in this study were from the University of Chicago Medical Center, which serves largely underserved, African American patients. The experiences of these patients may be unique to this site. In addition, we only studied patients who had a PCP, excluding a population of patients that are at inherent risk due to lack of a coordinating physician to guide ongoing care.
In conclusion, this study suggests that many frail, older patients reported experiencing a post‐discharge problem and patients whose PCPs did not know about their admission were more likely to report a post‐discharge problem. Systematic interventions to improve communications with PCPs during patient care transitions in and out of the hospital are needed.
Acknowledgements
The authors thank Ms. Meryl Prochaska for her research assistance and manuscript preparation.
- , , , et al.Effects of physician experience on costs and outcomes on an academic general medicine service: results of a trial of hospitalists.Ann Intern Med.2002;137(11):866–874.
- , .The Hospitalist Movement 5 Years Later.JAMA.2002;287(4):487–494.
- , , , et al.Transitions of Care Consensus Policy Statement American College of Physicians‐Society of General Internal Medicine‐Society of Hospital Medicine‐American Geriatrics Society‐American College of Emergency Physicians‐Society of Academic Emergency Medicine.J Gen Intern Med.2009;24(8):971–976.
- , , , , , .Deficits in Communication and information transfer between hospital‐based and primary care physicians: implications for patient safety and continuity of care.JAMA.2007;297(8):831–841.
- , , , et al.Patient safety concerns arising from test results that return after hospital discharge.Ann Intern Med.2005;143(2):121–131.
- , , , .Maintaining continuity of care: a look at the quality of communication between Ontario emergency departments and community physicians.CJEM.2005;7(3):155–161.
- , , , , .Adverse drug events occuring following hospital discharge.J Gen Intern Med.2005;20(4):317–323.
- , , , , , .Electronically screening discharge summaries for adverse medical events.J Am Med Infrom Assoc.2003;10(4):339–350.
- , , , , .The incidence and severity of adverse events affecting patients after discharge from the hospital.Ann Intern Med.2003;138:161–167.
- , , , et al.Comparing patient‐reported hospital adverse events with the medical record review: do patients know something that hospitals do not?Ann Intern Med.2005;149(2):100–108.
- , , , et al.What can hospitalized patients tell us about adverse events? Learning from the patient‐reported incidents.J Gen Intern Med.2005;20(9):830–836.
- , , , et al.The Vulnerable Elders Survey: a tool for identifying vulnerable older people in the community.J Am Geriatr Soc.2001;49:1691–1699.
- , , , .Validation of a telephone version of the mini‐mental state examination.J Am Geriatr Soc.1992;40(7):697–702.
- .The critical incident technique.Psychol Bull.1954;51(4):327–359.
- .The critical incident technique in service research.J Serv Res.2004;7:65–89.
- , , , .Medical errors related to discontinuity of care from an inpatient to an outpatient setting.J Gen Intern Med.2003;18:646–651.
- .A Purposeful approach to the constant comparative method in the analysis of qualitative interviews.Qual Quant2002;36:3392–3340.
- , , , et al.Effects of physician experience on costs and outcomes on an academic general medicine service: results of a trial of hospitalists.Ann Intern Med.2002;137(11):866–874.
- , .The Hospitalist Movement 5 Years Later.JAMA.2002;287(4):487–494.
- , , , et al.Transitions of Care Consensus Policy Statement American College of Physicians‐Society of General Internal Medicine‐Society of Hospital Medicine‐American Geriatrics Society‐American College of Emergency Physicians‐Society of Academic Emergency Medicine.J Gen Intern Med.2009;24(8):971–976.
- , , , , , .Deficits in Communication and information transfer between hospital‐based and primary care physicians: implications for patient safety and continuity of care.JAMA.2007;297(8):831–841.
- , , , et al.Patient safety concerns arising from test results that return after hospital discharge.Ann Intern Med.2005;143(2):121–131.
- , , , .Maintaining continuity of care: a look at the quality of communication between Ontario emergency departments and community physicians.CJEM.2005;7(3):155–161.
- , , , , .Adverse drug events occuring following hospital discharge.J Gen Intern Med.2005;20(4):317–323.
- , , , , , .Electronically screening discharge summaries for adverse medical events.J Am Med Infrom Assoc.2003;10(4):339–350.
- , , , , .The incidence and severity of adverse events affecting patients after discharge from the hospital.Ann Intern Med.2003;138:161–167.
- , , , et al.Comparing patient‐reported hospital adverse events with the medical record review: do patients know something that hospitals do not?Ann Intern Med.2005;149(2):100–108.
- , , , et al.What can hospitalized patients tell us about adverse events? Learning from the patient‐reported incidents.J Gen Intern Med.2005;20(9):830–836.
- , , , et al.The Vulnerable Elders Survey: a tool for identifying vulnerable older people in the community.J Am Geriatr Soc.2001;49:1691–1699.
- , , , .Validation of a telephone version of the mini‐mental state examination.J Am Geriatr Soc.1992;40(7):697–702.
- .The critical incident technique.Psychol Bull.1954;51(4):327–359.
- .The critical incident technique in service research.J Serv Res.2004;7:65–89.
- , , , .Medical errors related to discontinuity of care from an inpatient to an outpatient setting.J Gen Intern Med.2003;18:646–651.
- .A Purposeful approach to the constant comparative method in the analysis of qualitative interviews.Qual Quant2002;36:3392–3340.
Copyright © 2010 Society of Hospital Medicine
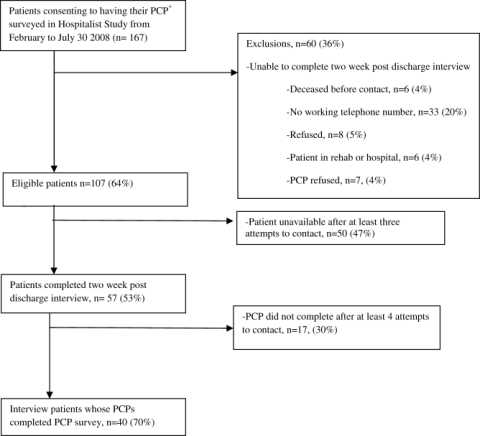
Calciphylaxis in Renal Failure
Narrative Description
This Case Report reviews the presentation, the differential diagnosis and the treatment modalities used to treat calciphylaxis. It emphasizes the poor prognosis and that there is inadequate clinical experience to guide a physician as to what the most appropriate treatment is despite promising anecdotal reports about a variety of agents. The report demonstrates that intravenous sodium thiosulfate is tolerated.
Key Points
-
Calciphylaxis occurs in 1 to 4% of patients with end stage renal failure.
-
Two patterns of presentation are generally recognizedcentral and peripheral.
-
Pain is a prominent symptom and eschar formation is usually present.
-
The role of surgery is controversial.
-
Several promising modalities for the treatment of this condition have been described in anecdotal reports.
Calciphylaxis is a rare condition. It is seen most frequently in patients with chronic kidney disease and can affect any part of the body.14 Calciphylaxis is increasingly being referred to as calcific uremic arteriolopathy as this term more accurately reflects the histology of vascular calcification in small‐ and medium‐sized arteries, intimal arterial hypertrophy, and small vessel thrombosis associated with panniculitis, dermal necrosis, and eschar formation.5 Pain is a prominent symptom. The most effective treatment for this condition remains uncertain.
Case Report
A 68‐year‐old female presented with an 8‐month history of increasing lower extremity edema, and numerous large, painful, necrotic ulcers with an associated foul odor. She had a past medical history of type 2 diabetes mellitus, hypertension, end stage renal disease requiring hemodialysis 3 times a week for the previous 6 months, severe peripheral vascular disease, coronary artery disease for which she had previously undergone coronary artery bypass surgery, multiple myocardial infarctions, and congestive heart failure with an ejection fraction of 20%. She had also suffered from numerous infections including septicemia, endocarditis, and a sternal wound infection in the past with no current evidence of septicemia or endocarditis. The patient was not on calcium supplements, Vitamin D, warfarin or calcium‐containing phosphate binders.
Eight months prior to admission she developed vesicles on the left thigh that slowly progressed to large, extremely painful, violaceous, indurated plaques with central ulceration and eschar (Figure 1). She subsequently developed several smaller lesions with similar morphology on her legs and feet and gangrene of her left big toe (Figure 2). A biopsy from the left thigh was consistent with calciphylaxis with associated necrosis of the deep dermis and subcutaneous tissues. The patient's lesions were aggressively debrided, broad spectrum antibiotics given, and the patient dialyzed with low calcium dialysates. Ultimately intravenous sodium thiosulfate (25 g intravenously, over 60 minutes), was given which she tolerated with no side effect. Sodium thiosulfate is thought to act by forming highly soluble calcium thiosulfate salts and therefore mobilizing tissue calcium.5 Hyperbaric oxygen was contraindicated because of the patient's left ventricular ejection fraction (LVEF) of 20% and previous history of congestive heart failure as this treatment modality may precipitate congestive heart failure in a patient with a low LVEF particularly with a past history of congestive heart failure. Her condition continued to deteriorate and she died a few days after initiation of intravenous sodium thiosulfate infusion secondary to a massive gastrointestinal bleed.
Discussion
The differential diagnosis for painful necrotic cutaneous ulcerations with eschar formation includes: calciphylaxis, cryoglobulinemia, cryofibrinogenema, peripheral vascular disease, embolic phenomenon (endocarditis, septic, cholesterol), warfarin skin necrosis, brown recluse spider bites, hypercoagulable states, hyperoxaluria, and necrotizing vasculitis.14
Calciphylaxis is a rare entity that affects approximately 1% to 4% of end stage renal failure patients.1, 3 The typical patient is a morbidly obese, female with longstanding end stage renal disease, diabetes, hyperphosphatemia and an elevated calcium‐phosphate product usually greater than 60 mg2/dL2.1, 3 It has also been described in patients with alcoholic cirrhosis and acute reversible renal failure,6 primary and secondary hyperparathyroidism,7 and metastatic breast cancer.8
Patients typically present with symmetric lesions that evolve from erythematous to violaceous, livedo‐reticularis like patches or plaques with occasional bullae to painful, indurated, necrotic plaques that subsequently ulcerate. The ulcerations are slow to heal and covered with eschar.4, 9
There are 2 patterns of involvement. The central/proximal pattern involves the abdomen, gluteal region, and thighs while the peripheral/distal pattern involves the extremities distal to the elbows and knees.1, 2, 4 The central pattern tends to carry a worse prognosis,9, 10 though this has not been validated in all reports and recent literature suggests that patients with both patterns have the worst prognosis.11
A biopsy may be required to exclude other diagnoses. The histology demonstrates an obliterative vasculopathy secondary to the vascular intimal changes and endovascular fibrosis.12 A suggestive finding is calcification of the medial wall of small‐ and medium‐sized arteries and arterioles with associated intimal hyperplasia and fibrosis. Necrosis of the surrounding tissue, panniculitis, and soft tissue calcification are often present.9, 13 The trauma of the biopsy can lead to worsening of the disease.
Secondary to its association with end stage renal disease, laboratory data often reveals elevated blood urea nitrogen (BUN), creatinine, parathyroid hormone, and calcium‐phosphate product. Bone scans show increased uptake in the subcutaneous calcified plaques.14 X‐rays utilizing mammogram technique have demonstrated arteriolar calcification.15
Besides chronic kidney disease, other potential risk factors include protein C and S deficiencies, obesity, warfarin use, high calcium containing dialysates, liver disease, and systemic corticosteroids.4, 9, 11, 16
Calciphylaxis is a difficult disease to treat with a mortality of 60% to 70%9 and a 1‐year survival rate of 45.8%.11 There is no consistently effective treatment.5 Therapy therefore, is focused on symptom control, debridement, and treatment of infection. Mortality is most commonly due to wound infections and resulting septicemia. Meticulous wound care is important with any infection treated early and aggressively. Though trauma and surgical procedures have been known to precipitate ulcerations, given their high rate of infection early surgical debridement of wounds is often required and has been shown to improve mortality.11, 17 Because of the poor healing of the involved tissues, wounds are often left to close by secondary intention or in some circumstances with vacuum assistance.2
As secondary hyperparathyroidism is common, attempts are often made to lower the calcium‐phosphate product. This often requires parathyroidectomy.18 Calcium containing phosphate binders are avoided and low calcium dialysate used.19 However, the above interventions do not consistently improve mortality.5, 11
Other potential treatments include: hyperbaric oxygen therapy,20 intravenous sodium thiosulfate,14 low‐dose tissue plasminogen activator,21 cinacalcet,22 etidronate disodium,23 and maggots.24 Because of the rarity of the condition, most of the literature to date is anecdotal and based on case reports and small retrospective studies.
Conclusions
As the number of patients who develop chronic kidney disease and require hemodialysis increases, it is likely that the number of patients who develop calciphylaxis will also increase. Hospitalists, besides nephrologists, should therefore become familiar with the presentation of this disease as it is possible, although unproven, that treatment in the early stage of the disease may result in a better response. Although several treatment modalities have been used to treat calcific uremic arteriolopathy or calciphylaxis, it remains unclear what is the best treatment for these patients. Carefully done clinical trials using some of the treatment modalities mentioned will help physicians decide what the most appropriate treatment is for patients with this debilitating and often fatal disease.
- ,,,.Early recognition and treatment of calciphylaxis.South Med J.2003;96:53–55.
- ,,,.Calciphylaxis: medical and surgical management of chronic extensive wounds in a renal dialysis population.Plast Reconstr Surg.2004;113:304–312.
- ,,, et al.Cutaneous necrosis by calcific uremic arteriolopathy.Int J Dermatol.2005;44:101–106.
- ,.Calciphylaxis.Int J Dermatol.2007;46:231–236.
- ,,.Calcific uremic arteriolopathy: Advances in pathogenesis and treatment.Semin Dial.2007;20:150–157.
- ,,, et al.Calciphylaxis associated with acute, reversible renal failure in the setting of alcoholic cirrhosis.J Am Acad Dermatol2004;50:S125–S128.
- ,,, et al.An unusual presentation of calciphylaxis due to primary hyperparathyroidism.Arch Pathol Lab Med.2001;125:1351–1353.
- ,,, et al.Calciphylaxis associated with metastatic breast carcinoma.J Am Acad Dermatol.1999;41:295–298.
- ,.Panniculitis. In: Freeberg IM, Eisen AZ, Wolff K, Austen KF, Goldsmith LA, Katz SI, eds.Fitzpatrick's Dermatology in General Medicine.6th ed.McGraw‐Hill,New York, NY.2003:1051–1052.
- ,,,.The vascular lesions associated with skin necrosis in renal disease.Br J Dermatol.1983;109:85–95.
- ,,, et al.Calciphylaxis: Natural history, risk factor analysis, and outcome.J Am Acad Dermatol.2007;56:569–579.
- ,.Calciphylaxis: emerging concepts in prevention, diagnosis, and treatment.Semin Dial.2002;15:172–186.
- ,,,.Lever's Histopathology of the Skin.8th ed.Lippincott, Williams 43:1104–1108.
- ,,.A case report comparing various radiological tests in the diagnosis of calcific uremic arteriolopathy.Am J Kidney Dis.2006;48:659–661.
- .Ever‐changing concepts of calciphylaxis.Intern Med.2004;43:7–8.
- ,,, et al.Is calciphylaxis best treated surgically or medically?Surgery2000;128:967–971.
- ,,, et al.Therapy for calciphylaxis: an outcome analysis.Surgery.2003;134:941–945.
- ,,.Successful treatment of severe calciphylaxis in a hemodialysis patient using low‐calcium dialysate and medical parathyroidectomy: case report and literature review.Ren Fail.2004;26:77–82.
- ,,, et al.Hyperbaric oxygen therapy for calcific uremic arteriolopathy: a case series.J Nephrol.2002;15:676–680.
- ,,, et al.Low‐dose tissue plasminogen activator for calciphylaxis.Arch Dermatol.2004;140:1045–1048.
- ,,.Cinacalcet for the treatment of calciphylaxis.Arch Dermatol.2007;143:152–154.
- ,,, et al.Successful treatment of a patient with severe calcific uremic arteriolopathy (calciphylaxis) by etidronate disodium.Am J Kidney Dis.2006;48:151–154.
- ,,, et al.Sterile maggots as adjuvant procedure for local treatment in a patient with proximal calciphylaxis.Nefrologia.2005;25:559–562.
Narrative Description
This Case Report reviews the presentation, the differential diagnosis and the treatment modalities used to treat calciphylaxis. It emphasizes the poor prognosis and that there is inadequate clinical experience to guide a physician as to what the most appropriate treatment is despite promising anecdotal reports about a variety of agents. The report demonstrates that intravenous sodium thiosulfate is tolerated.
Key Points
-
Calciphylaxis occurs in 1 to 4% of patients with end stage renal failure.
-
Two patterns of presentation are generally recognizedcentral and peripheral.
-
Pain is a prominent symptom and eschar formation is usually present.
-
The role of surgery is controversial.
-
Several promising modalities for the treatment of this condition have been described in anecdotal reports.
Calciphylaxis is a rare condition. It is seen most frequently in patients with chronic kidney disease and can affect any part of the body.14 Calciphylaxis is increasingly being referred to as calcific uremic arteriolopathy as this term more accurately reflects the histology of vascular calcification in small‐ and medium‐sized arteries, intimal arterial hypertrophy, and small vessel thrombosis associated with panniculitis, dermal necrosis, and eschar formation.5 Pain is a prominent symptom. The most effective treatment for this condition remains uncertain.
Case Report
A 68‐year‐old female presented with an 8‐month history of increasing lower extremity edema, and numerous large, painful, necrotic ulcers with an associated foul odor. She had a past medical history of type 2 diabetes mellitus, hypertension, end stage renal disease requiring hemodialysis 3 times a week for the previous 6 months, severe peripheral vascular disease, coronary artery disease for which she had previously undergone coronary artery bypass surgery, multiple myocardial infarctions, and congestive heart failure with an ejection fraction of 20%. She had also suffered from numerous infections including septicemia, endocarditis, and a sternal wound infection in the past with no current evidence of septicemia or endocarditis. The patient was not on calcium supplements, Vitamin D, warfarin or calcium‐containing phosphate binders.
Eight months prior to admission she developed vesicles on the left thigh that slowly progressed to large, extremely painful, violaceous, indurated plaques with central ulceration and eschar (Figure 1). She subsequently developed several smaller lesions with similar morphology on her legs and feet and gangrene of her left big toe (Figure 2). A biopsy from the left thigh was consistent with calciphylaxis with associated necrosis of the deep dermis and subcutaneous tissues. The patient's lesions were aggressively debrided, broad spectrum antibiotics given, and the patient dialyzed with low calcium dialysates. Ultimately intravenous sodium thiosulfate (25 g intravenously, over 60 minutes), was given which she tolerated with no side effect. Sodium thiosulfate is thought to act by forming highly soluble calcium thiosulfate salts and therefore mobilizing tissue calcium.5 Hyperbaric oxygen was contraindicated because of the patient's left ventricular ejection fraction (LVEF) of 20% and previous history of congestive heart failure as this treatment modality may precipitate congestive heart failure in a patient with a low LVEF particularly with a past history of congestive heart failure. Her condition continued to deteriorate and she died a few days after initiation of intravenous sodium thiosulfate infusion secondary to a massive gastrointestinal bleed.
Discussion
The differential diagnosis for painful necrotic cutaneous ulcerations with eschar formation includes: calciphylaxis, cryoglobulinemia, cryofibrinogenema, peripheral vascular disease, embolic phenomenon (endocarditis, septic, cholesterol), warfarin skin necrosis, brown recluse spider bites, hypercoagulable states, hyperoxaluria, and necrotizing vasculitis.14
Calciphylaxis is a rare entity that affects approximately 1% to 4% of end stage renal failure patients.1, 3 The typical patient is a morbidly obese, female with longstanding end stage renal disease, diabetes, hyperphosphatemia and an elevated calcium‐phosphate product usually greater than 60 mg2/dL2.1, 3 It has also been described in patients with alcoholic cirrhosis and acute reversible renal failure,6 primary and secondary hyperparathyroidism,7 and metastatic breast cancer.8
Patients typically present with symmetric lesions that evolve from erythematous to violaceous, livedo‐reticularis like patches or plaques with occasional bullae to painful, indurated, necrotic plaques that subsequently ulcerate. The ulcerations are slow to heal and covered with eschar.4, 9
There are 2 patterns of involvement. The central/proximal pattern involves the abdomen, gluteal region, and thighs while the peripheral/distal pattern involves the extremities distal to the elbows and knees.1, 2, 4 The central pattern tends to carry a worse prognosis,9, 10 though this has not been validated in all reports and recent literature suggests that patients with both patterns have the worst prognosis.11
A biopsy may be required to exclude other diagnoses. The histology demonstrates an obliterative vasculopathy secondary to the vascular intimal changes and endovascular fibrosis.12 A suggestive finding is calcification of the medial wall of small‐ and medium‐sized arteries and arterioles with associated intimal hyperplasia and fibrosis. Necrosis of the surrounding tissue, panniculitis, and soft tissue calcification are often present.9, 13 The trauma of the biopsy can lead to worsening of the disease.
Secondary to its association with end stage renal disease, laboratory data often reveals elevated blood urea nitrogen (BUN), creatinine, parathyroid hormone, and calcium‐phosphate product. Bone scans show increased uptake in the subcutaneous calcified plaques.14 X‐rays utilizing mammogram technique have demonstrated arteriolar calcification.15
Besides chronic kidney disease, other potential risk factors include protein C and S deficiencies, obesity, warfarin use, high calcium containing dialysates, liver disease, and systemic corticosteroids.4, 9, 11, 16
Calciphylaxis is a difficult disease to treat with a mortality of 60% to 70%9 and a 1‐year survival rate of 45.8%.11 There is no consistently effective treatment.5 Therapy therefore, is focused on symptom control, debridement, and treatment of infection. Mortality is most commonly due to wound infections and resulting septicemia. Meticulous wound care is important with any infection treated early and aggressively. Though trauma and surgical procedures have been known to precipitate ulcerations, given their high rate of infection early surgical debridement of wounds is often required and has been shown to improve mortality.11, 17 Because of the poor healing of the involved tissues, wounds are often left to close by secondary intention or in some circumstances with vacuum assistance.2
As secondary hyperparathyroidism is common, attempts are often made to lower the calcium‐phosphate product. This often requires parathyroidectomy.18 Calcium containing phosphate binders are avoided and low calcium dialysate used.19 However, the above interventions do not consistently improve mortality.5, 11
Other potential treatments include: hyperbaric oxygen therapy,20 intravenous sodium thiosulfate,14 low‐dose tissue plasminogen activator,21 cinacalcet,22 etidronate disodium,23 and maggots.24 Because of the rarity of the condition, most of the literature to date is anecdotal and based on case reports and small retrospective studies.
Conclusions
As the number of patients who develop chronic kidney disease and require hemodialysis increases, it is likely that the number of patients who develop calciphylaxis will also increase. Hospitalists, besides nephrologists, should therefore become familiar with the presentation of this disease as it is possible, although unproven, that treatment in the early stage of the disease may result in a better response. Although several treatment modalities have been used to treat calcific uremic arteriolopathy or calciphylaxis, it remains unclear what is the best treatment for these patients. Carefully done clinical trials using some of the treatment modalities mentioned will help physicians decide what the most appropriate treatment is for patients with this debilitating and often fatal disease.
Narrative Description
This Case Report reviews the presentation, the differential diagnosis and the treatment modalities used to treat calciphylaxis. It emphasizes the poor prognosis and that there is inadequate clinical experience to guide a physician as to what the most appropriate treatment is despite promising anecdotal reports about a variety of agents. The report demonstrates that intravenous sodium thiosulfate is tolerated.
Key Points
-
Calciphylaxis occurs in 1 to 4% of patients with end stage renal failure.
-
Two patterns of presentation are generally recognizedcentral and peripheral.
-
Pain is a prominent symptom and eschar formation is usually present.
-
The role of surgery is controversial.
-
Several promising modalities for the treatment of this condition have been described in anecdotal reports.
Calciphylaxis is a rare condition. It is seen most frequently in patients with chronic kidney disease and can affect any part of the body.14 Calciphylaxis is increasingly being referred to as calcific uremic arteriolopathy as this term more accurately reflects the histology of vascular calcification in small‐ and medium‐sized arteries, intimal arterial hypertrophy, and small vessel thrombosis associated with panniculitis, dermal necrosis, and eschar formation.5 Pain is a prominent symptom. The most effective treatment for this condition remains uncertain.
Case Report
A 68‐year‐old female presented with an 8‐month history of increasing lower extremity edema, and numerous large, painful, necrotic ulcers with an associated foul odor. She had a past medical history of type 2 diabetes mellitus, hypertension, end stage renal disease requiring hemodialysis 3 times a week for the previous 6 months, severe peripheral vascular disease, coronary artery disease for which she had previously undergone coronary artery bypass surgery, multiple myocardial infarctions, and congestive heart failure with an ejection fraction of 20%. She had also suffered from numerous infections including septicemia, endocarditis, and a sternal wound infection in the past with no current evidence of septicemia or endocarditis. The patient was not on calcium supplements, Vitamin D, warfarin or calcium‐containing phosphate binders.
Eight months prior to admission she developed vesicles on the left thigh that slowly progressed to large, extremely painful, violaceous, indurated plaques with central ulceration and eschar (Figure 1). She subsequently developed several smaller lesions with similar morphology on her legs and feet and gangrene of her left big toe (Figure 2). A biopsy from the left thigh was consistent with calciphylaxis with associated necrosis of the deep dermis and subcutaneous tissues. The patient's lesions were aggressively debrided, broad spectrum antibiotics given, and the patient dialyzed with low calcium dialysates. Ultimately intravenous sodium thiosulfate (25 g intravenously, over 60 minutes), was given which she tolerated with no side effect. Sodium thiosulfate is thought to act by forming highly soluble calcium thiosulfate salts and therefore mobilizing tissue calcium.5 Hyperbaric oxygen was contraindicated because of the patient's left ventricular ejection fraction (LVEF) of 20% and previous history of congestive heart failure as this treatment modality may precipitate congestive heart failure in a patient with a low LVEF particularly with a past history of congestive heart failure. Her condition continued to deteriorate and she died a few days after initiation of intravenous sodium thiosulfate infusion secondary to a massive gastrointestinal bleed.
Discussion
The differential diagnosis for painful necrotic cutaneous ulcerations with eschar formation includes: calciphylaxis, cryoglobulinemia, cryofibrinogenema, peripheral vascular disease, embolic phenomenon (endocarditis, septic, cholesterol), warfarin skin necrosis, brown recluse spider bites, hypercoagulable states, hyperoxaluria, and necrotizing vasculitis.14
Calciphylaxis is a rare entity that affects approximately 1% to 4% of end stage renal failure patients.1, 3 The typical patient is a morbidly obese, female with longstanding end stage renal disease, diabetes, hyperphosphatemia and an elevated calcium‐phosphate product usually greater than 60 mg2/dL2.1, 3 It has also been described in patients with alcoholic cirrhosis and acute reversible renal failure,6 primary and secondary hyperparathyroidism,7 and metastatic breast cancer.8
Patients typically present with symmetric lesions that evolve from erythematous to violaceous, livedo‐reticularis like patches or plaques with occasional bullae to painful, indurated, necrotic plaques that subsequently ulcerate. The ulcerations are slow to heal and covered with eschar.4, 9
There are 2 patterns of involvement. The central/proximal pattern involves the abdomen, gluteal region, and thighs while the peripheral/distal pattern involves the extremities distal to the elbows and knees.1, 2, 4 The central pattern tends to carry a worse prognosis,9, 10 though this has not been validated in all reports and recent literature suggests that patients with both patterns have the worst prognosis.11
A biopsy may be required to exclude other diagnoses. The histology demonstrates an obliterative vasculopathy secondary to the vascular intimal changes and endovascular fibrosis.12 A suggestive finding is calcification of the medial wall of small‐ and medium‐sized arteries and arterioles with associated intimal hyperplasia and fibrosis. Necrosis of the surrounding tissue, panniculitis, and soft tissue calcification are often present.9, 13 The trauma of the biopsy can lead to worsening of the disease.
Secondary to its association with end stage renal disease, laboratory data often reveals elevated blood urea nitrogen (BUN), creatinine, parathyroid hormone, and calcium‐phosphate product. Bone scans show increased uptake in the subcutaneous calcified plaques.14 X‐rays utilizing mammogram technique have demonstrated arteriolar calcification.15
Besides chronic kidney disease, other potential risk factors include protein C and S deficiencies, obesity, warfarin use, high calcium containing dialysates, liver disease, and systemic corticosteroids.4, 9, 11, 16
Calciphylaxis is a difficult disease to treat with a mortality of 60% to 70%9 and a 1‐year survival rate of 45.8%.11 There is no consistently effective treatment.5 Therapy therefore, is focused on symptom control, debridement, and treatment of infection. Mortality is most commonly due to wound infections and resulting septicemia. Meticulous wound care is important with any infection treated early and aggressively. Though trauma and surgical procedures have been known to precipitate ulcerations, given their high rate of infection early surgical debridement of wounds is often required and has been shown to improve mortality.11, 17 Because of the poor healing of the involved tissues, wounds are often left to close by secondary intention or in some circumstances with vacuum assistance.2
As secondary hyperparathyroidism is common, attempts are often made to lower the calcium‐phosphate product. This often requires parathyroidectomy.18 Calcium containing phosphate binders are avoided and low calcium dialysate used.19 However, the above interventions do not consistently improve mortality.5, 11
Other potential treatments include: hyperbaric oxygen therapy,20 intravenous sodium thiosulfate,14 low‐dose tissue plasminogen activator,21 cinacalcet,22 etidronate disodium,23 and maggots.24 Because of the rarity of the condition, most of the literature to date is anecdotal and based on case reports and small retrospective studies.
Conclusions
As the number of patients who develop chronic kidney disease and require hemodialysis increases, it is likely that the number of patients who develop calciphylaxis will also increase. Hospitalists, besides nephrologists, should therefore become familiar with the presentation of this disease as it is possible, although unproven, that treatment in the early stage of the disease may result in a better response. Although several treatment modalities have been used to treat calcific uremic arteriolopathy or calciphylaxis, it remains unclear what is the best treatment for these patients. Carefully done clinical trials using some of the treatment modalities mentioned will help physicians decide what the most appropriate treatment is for patients with this debilitating and often fatal disease.
- ,,,.Early recognition and treatment of calciphylaxis.South Med J.2003;96:53–55.
- ,,,.Calciphylaxis: medical and surgical management of chronic extensive wounds in a renal dialysis population.Plast Reconstr Surg.2004;113:304–312.
- ,,, et al.Cutaneous necrosis by calcific uremic arteriolopathy.Int J Dermatol.2005;44:101–106.
- ,.Calciphylaxis.Int J Dermatol.2007;46:231–236.
- ,,.Calcific uremic arteriolopathy: Advances in pathogenesis and treatment.Semin Dial.2007;20:150–157.
- ,,, et al.Calciphylaxis associated with acute, reversible renal failure in the setting of alcoholic cirrhosis.J Am Acad Dermatol2004;50:S125–S128.
- ,,, et al.An unusual presentation of calciphylaxis due to primary hyperparathyroidism.Arch Pathol Lab Med.2001;125:1351–1353.
- ,,, et al.Calciphylaxis associated with metastatic breast carcinoma.J Am Acad Dermatol.1999;41:295–298.
- ,.Panniculitis. In: Freeberg IM, Eisen AZ, Wolff K, Austen KF, Goldsmith LA, Katz SI, eds.Fitzpatrick's Dermatology in General Medicine.6th ed.McGraw‐Hill,New York, NY.2003:1051–1052.
- ,,,.The vascular lesions associated with skin necrosis in renal disease.Br J Dermatol.1983;109:85–95.
- ,,, et al.Calciphylaxis: Natural history, risk factor analysis, and outcome.J Am Acad Dermatol.2007;56:569–579.
- ,.Calciphylaxis: emerging concepts in prevention, diagnosis, and treatment.Semin Dial.2002;15:172–186.
- ,,,.Lever's Histopathology of the Skin.8th ed.Lippincott, Williams 43:1104–1108.
- ,,.A case report comparing various radiological tests in the diagnosis of calcific uremic arteriolopathy.Am J Kidney Dis.2006;48:659–661.
- .Ever‐changing concepts of calciphylaxis.Intern Med.2004;43:7–8.
- ,,, et al.Is calciphylaxis best treated surgically or medically?Surgery2000;128:967–971.
- ,,, et al.Therapy for calciphylaxis: an outcome analysis.Surgery.2003;134:941–945.
- ,,.Successful treatment of severe calciphylaxis in a hemodialysis patient using low‐calcium dialysate and medical parathyroidectomy: case report and literature review.Ren Fail.2004;26:77–82.
- ,,, et al.Hyperbaric oxygen therapy for calcific uremic arteriolopathy: a case series.J Nephrol.2002;15:676–680.
- ,,, et al.Low‐dose tissue plasminogen activator for calciphylaxis.Arch Dermatol.2004;140:1045–1048.
- ,,.Cinacalcet for the treatment of calciphylaxis.Arch Dermatol.2007;143:152–154.
- ,,, et al.Successful treatment of a patient with severe calcific uremic arteriolopathy (calciphylaxis) by etidronate disodium.Am J Kidney Dis.2006;48:151–154.
- ,,, et al.Sterile maggots as adjuvant procedure for local treatment in a patient with proximal calciphylaxis.Nefrologia.2005;25:559–562.
- ,,,.Early recognition and treatment of calciphylaxis.South Med J.2003;96:53–55.
- ,,,.Calciphylaxis: medical and surgical management of chronic extensive wounds in a renal dialysis population.Plast Reconstr Surg.2004;113:304–312.
- ,,, et al.Cutaneous necrosis by calcific uremic arteriolopathy.Int J Dermatol.2005;44:101–106.
- ,.Calciphylaxis.Int J Dermatol.2007;46:231–236.
- ,,.Calcific uremic arteriolopathy: Advances in pathogenesis and treatment.Semin Dial.2007;20:150–157.
- ,,, et al.Calciphylaxis associated with acute, reversible renal failure in the setting of alcoholic cirrhosis.J Am Acad Dermatol2004;50:S125–S128.
- ,,, et al.An unusual presentation of calciphylaxis due to primary hyperparathyroidism.Arch Pathol Lab Med.2001;125:1351–1353.
- ,,, et al.Calciphylaxis associated with metastatic breast carcinoma.J Am Acad Dermatol.1999;41:295–298.
- ,.Panniculitis. In: Freeberg IM, Eisen AZ, Wolff K, Austen KF, Goldsmith LA, Katz SI, eds.Fitzpatrick's Dermatology in General Medicine.6th ed.McGraw‐Hill,New York, NY.2003:1051–1052.
- ,,,.The vascular lesions associated with skin necrosis in renal disease.Br J Dermatol.1983;109:85–95.
- ,,, et al.Calciphylaxis: Natural history, risk factor analysis, and outcome.J Am Acad Dermatol.2007;56:569–579.
- ,.Calciphylaxis: emerging concepts in prevention, diagnosis, and treatment.Semin Dial.2002;15:172–186.
- ,,,.Lever's Histopathology of the Skin.8th ed.Lippincott, Williams 43:1104–1108.
- ,,.A case report comparing various radiological tests in the diagnosis of calcific uremic arteriolopathy.Am J Kidney Dis.2006;48:659–661.
- .Ever‐changing concepts of calciphylaxis.Intern Med.2004;43:7–8.
- ,,, et al.Is calciphylaxis best treated surgically or medically?Surgery2000;128:967–971.
- ,,, et al.Therapy for calciphylaxis: an outcome analysis.Surgery.2003;134:941–945.
- ,,.Successful treatment of severe calciphylaxis in a hemodialysis patient using low‐calcium dialysate and medical parathyroidectomy: case report and literature review.Ren Fail.2004;26:77–82.
- ,,, et al.Hyperbaric oxygen therapy for calcific uremic arteriolopathy: a case series.J Nephrol.2002;15:676–680.
- ,,, et al.Low‐dose tissue plasminogen activator for calciphylaxis.Arch Dermatol.2004;140:1045–1048.
- ,,.Cinacalcet for the treatment of calciphylaxis.Arch Dermatol.2007;143:152–154.
- ,,, et al.Successful treatment of a patient with severe calcific uremic arteriolopathy (calciphylaxis) by etidronate disodium.Am J Kidney Dis.2006;48:151–154.
- ,,, et al.Sterile maggots as adjuvant procedure for local treatment in a patient with proximal calciphylaxis.Nefrologia.2005;25:559–562.
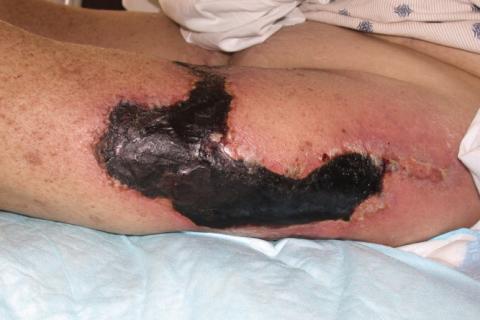
Necrotizing fasciitis associated with acupuncture: A case report
Presentation
An 84 year‐old male with past history of osteoarthritis, extensive degenerative spine disease with spinal stenosis presented to the emergency room with left groin pain accompanied by a foul‐smelling discharge from the acupuncture site. He had been receiving regular physical therapy and acupuncture sessions for the past 6 months prior to his presentation. One and a half weeks prior to presentation, needles were inserted over the left groin as part of his acupuncture regimen. The patient described the acupuncture needles originating from a single use, unopened package. Additionally, the patient states his skin was cleaned with an antiseptic solution prior to insertion. Within 3 days, he developed generalized weakness, malaise with localized swelling, erythema, and warmth over the left groin area. His primary care physician performed an incision and drainage and prescribed ciprofloxacin. The patient continued to experience worsening fatigue, difficulty ambulating, ongoing purulent drainage, and consequently presented to the hospital for further evaluation. The patient has an allergy to penicillin but no history of diabetes. He quit smoking 40 years ago and has occasional alcohol intake. Surgical history includes bilateral knee replacement 15 years ago for osteoarthritis and right inguinal hernia repair and appendectomy 60 years ago.
On physical examination the patient had a temperature of 96.8F, pulse of 88 beats per minute, blood pressure of 97/63 mm Hg, and an oxygen saturation of 98% on room air. There was extensive swelling, erythema, and induration of the left anterior and proximal inguinal area, with a 2‐cm malodorous ulcer over the midline thigh. No crepitation or mass was palpable. Range of motion at the hip on the affected limb was limited due to pain. Distal pulses on the lower extremity were present and equal bilaterally. Laboratory examination revealed white blood cell (WBC) = 16.4 with 41% bands. Blood cultures were sent and intravenous vancomycin, ciprofloxacin, clindamycin, and metronidazole were started. A computed tomography (CT)‐scan of the left lower extremity was performed and revealed skin thickening and reticulation of the subcutaneous tissues edema extending from the left groin to the left buttock. Several foci of gas were present within the soft tissues with the largest in the lateral aspect of the buttocks of gas in the soft tissues (Figure 1). The Laboratory Risk Indicator for Necrotizing Fasciitis, the patient scored a 3 out of a possible 13 points. The diagnosis of necrotizing fasciitis was made based on clinical findings and radiographic imaging.
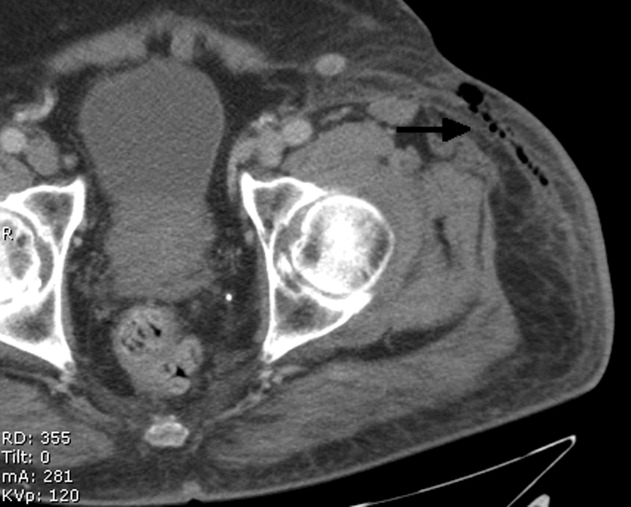
Assessment
Patient became significantly hypotensive which required vasopressor support. He underwent surgical exploration of the left inguinal area. During surgery, tender crepitation of the antero‐lateral aspect of the thigh was noted. Extensive debridement with fasciotomy was performed. Tissue was sent for histopathological analysis and gram‐stain. A negative‐pressure wound dressing was placed over the defect. Post‐operatively, patient required intubation and continued vasopressor support. On post‐operative day 3, patient was extubated. Wound culture report revealed gram negative rods and Enterococcus faecalis which was sensitive to the patients' current antibiotic regimen. Clindamycin was discontinued. The patient was discharged to a subacute rehabilitation facility and returned for a split thickness skin graft 2 months after initial presentation.
Necrotizing fasciitis is a deep‐seated infection of the subcutaneous tissue that results in progressive destruction of fascia and fat. Presenting symptoms include pain, erythema, or bullae formation at the site of infection. Systemic symptoms such as fever, malaise, and myalgias may also be present at the time of presentation. Two types of necrotizing fasciitis are noted to occur. Type 1 is a mixed infection with a predominance of anaerobes1 and carries a 21% mortality.2 It is common post‐operatively and in patients with diabetes. In type 2 necrotizing fasciitis, Group‐A streptococcus was the most common cause of monomicrobial necrotizing fasciitis2 and mortality can be as high as 30%.3 Risk factors for the development of fasciitis include immunosuppression, diabetes, surgery, or penetrating injuries. Gas on soft tissue x‐rays, CT scan, or magnetic resonance imaging (MRI) is a highly specific but insensitive finding and is common in type I necrotizing fasciitis.
The patient in this case likely developed type I necrotizing fasciitis due to the presence of gas on CT scan and polymicrobial culture findings.
Diagnosis
A PubMed search of necrotizing fasciitis and acupuncture reveals only one case report, in which a diabetic patient underwent an unsterile acupuncture consultation.4 To our knowledge, we are the first to describe necrotizing fasciitis occurring in a nondiabetic patient who underwent a sterile acupuncture technique.
Given the lack of an explainable causal relationship regarding the pathogenesis of necrotizing fasciitis in our patient, it appears to be due to the acupuncture needle placement. The patient had no other history of abscesses, trauma and other portals of entry. The patient's presentation, temporal relation of the site of acupuncture, and the development of infection prompted a high index of suspicion as acupuncture as the main etiology.
Management
Treatment of necrotizing fasciitis includes early and aggressive surgical debridement. Multiple antibiotic regimens may be necessary due to the polymicrobial nature of the infection. In our patient, ciprofloxacin was initiated for broadened gram negative coverage, vancomycin for community acquired methicillin‐resistant Staphylococcus aureus (MRSA) and metronidazole for anaerobic coverage. Clindamycin was initiated due to concerns of toxin production, but was discontinued as the patient's condition improved.
Although complications of acupuncture may be rare, there exists the potential to cause life threatening complications. Necrotizing fasciitis has been observed as an adverse effect of acupuncture in a single diabetic patient,4 but can develop in nondiabetic individuals, such as in our patient.
- ,.Clinical and microbiological features of necrotizing fasciitis.J Clin Microbiol.1995;33(9):2382–2387.
- ,,,,.Low CO Necrotizing fasciitis: clinical presentation, microbiology, and determinants of mortality.J Bone Joint Surg Am.2003;85‐A(8):1454–1460.
- ,,, et al.Severe group A streptococcal infections associated with a toxic shock‐like syndrome and scarlet fever toxin A.N Engl J Med.1989;321(1):1–7.
- ,,.Necrotising fasciitis: a life‐threatening complication of acupuncture in a patient with diabetes mellitus.Singapore Med J.2004;45(4):180–182.
Presentation
An 84 year‐old male with past history of osteoarthritis, extensive degenerative spine disease with spinal stenosis presented to the emergency room with left groin pain accompanied by a foul‐smelling discharge from the acupuncture site. He had been receiving regular physical therapy and acupuncture sessions for the past 6 months prior to his presentation. One and a half weeks prior to presentation, needles were inserted over the left groin as part of his acupuncture regimen. The patient described the acupuncture needles originating from a single use, unopened package. Additionally, the patient states his skin was cleaned with an antiseptic solution prior to insertion. Within 3 days, he developed generalized weakness, malaise with localized swelling, erythema, and warmth over the left groin area. His primary care physician performed an incision and drainage and prescribed ciprofloxacin. The patient continued to experience worsening fatigue, difficulty ambulating, ongoing purulent drainage, and consequently presented to the hospital for further evaluation. The patient has an allergy to penicillin but no history of diabetes. He quit smoking 40 years ago and has occasional alcohol intake. Surgical history includes bilateral knee replacement 15 years ago for osteoarthritis and right inguinal hernia repair and appendectomy 60 years ago.
On physical examination the patient had a temperature of 96.8F, pulse of 88 beats per minute, blood pressure of 97/63 mm Hg, and an oxygen saturation of 98% on room air. There was extensive swelling, erythema, and induration of the left anterior and proximal inguinal area, with a 2‐cm malodorous ulcer over the midline thigh. No crepitation or mass was palpable. Range of motion at the hip on the affected limb was limited due to pain. Distal pulses on the lower extremity were present and equal bilaterally. Laboratory examination revealed white blood cell (WBC) = 16.4 with 41% bands. Blood cultures were sent and intravenous vancomycin, ciprofloxacin, clindamycin, and metronidazole were started. A computed tomography (CT)‐scan of the left lower extremity was performed and revealed skin thickening and reticulation of the subcutaneous tissues edema extending from the left groin to the left buttock. Several foci of gas were present within the soft tissues with the largest in the lateral aspect of the buttocks of gas in the soft tissues (Figure 1). The Laboratory Risk Indicator for Necrotizing Fasciitis, the patient scored a 3 out of a possible 13 points. The diagnosis of necrotizing fasciitis was made based on clinical findings and radiographic imaging.
Assessment
Patient became significantly hypotensive which required vasopressor support. He underwent surgical exploration of the left inguinal area. During surgery, tender crepitation of the antero‐lateral aspect of the thigh was noted. Extensive debridement with fasciotomy was performed. Tissue was sent for histopathological analysis and gram‐stain. A negative‐pressure wound dressing was placed over the defect. Post‐operatively, patient required intubation and continued vasopressor support. On post‐operative day 3, patient was extubated. Wound culture report revealed gram negative rods and Enterococcus faecalis which was sensitive to the patients' current antibiotic regimen. Clindamycin was discontinued. The patient was discharged to a subacute rehabilitation facility and returned for a split thickness skin graft 2 months after initial presentation.
Necrotizing fasciitis is a deep‐seated infection of the subcutaneous tissue that results in progressive destruction of fascia and fat. Presenting symptoms include pain, erythema, or bullae formation at the site of infection. Systemic symptoms such as fever, malaise, and myalgias may also be present at the time of presentation. Two types of necrotizing fasciitis are noted to occur. Type 1 is a mixed infection with a predominance of anaerobes1 and carries a 21% mortality.2 It is common post‐operatively and in patients with diabetes. In type 2 necrotizing fasciitis, Group‐A streptococcus was the most common cause of monomicrobial necrotizing fasciitis2 and mortality can be as high as 30%.3 Risk factors for the development of fasciitis include immunosuppression, diabetes, surgery, or penetrating injuries. Gas on soft tissue x‐rays, CT scan, or magnetic resonance imaging (MRI) is a highly specific but insensitive finding and is common in type I necrotizing fasciitis.
The patient in this case likely developed type I necrotizing fasciitis due to the presence of gas on CT scan and polymicrobial culture findings.
Diagnosis
A PubMed search of necrotizing fasciitis and acupuncture reveals only one case report, in which a diabetic patient underwent an unsterile acupuncture consultation.4 To our knowledge, we are the first to describe necrotizing fasciitis occurring in a nondiabetic patient who underwent a sterile acupuncture technique.
Given the lack of an explainable causal relationship regarding the pathogenesis of necrotizing fasciitis in our patient, it appears to be due to the acupuncture needle placement. The patient had no other history of abscesses, trauma and other portals of entry. The patient's presentation, temporal relation of the site of acupuncture, and the development of infection prompted a high index of suspicion as acupuncture as the main etiology.
Management
Treatment of necrotizing fasciitis includes early and aggressive surgical debridement. Multiple antibiotic regimens may be necessary due to the polymicrobial nature of the infection. In our patient, ciprofloxacin was initiated for broadened gram negative coverage, vancomycin for community acquired methicillin‐resistant Staphylococcus aureus (MRSA) and metronidazole for anaerobic coverage. Clindamycin was initiated due to concerns of toxin production, but was discontinued as the patient's condition improved.
Although complications of acupuncture may be rare, there exists the potential to cause life threatening complications. Necrotizing fasciitis has been observed as an adverse effect of acupuncture in a single diabetic patient,4 but can develop in nondiabetic individuals, such as in our patient.
Presentation
An 84 year‐old male with past history of osteoarthritis, extensive degenerative spine disease with spinal stenosis presented to the emergency room with left groin pain accompanied by a foul‐smelling discharge from the acupuncture site. He had been receiving regular physical therapy and acupuncture sessions for the past 6 months prior to his presentation. One and a half weeks prior to presentation, needles were inserted over the left groin as part of his acupuncture regimen. The patient described the acupuncture needles originating from a single use, unopened package. Additionally, the patient states his skin was cleaned with an antiseptic solution prior to insertion. Within 3 days, he developed generalized weakness, malaise with localized swelling, erythema, and warmth over the left groin area. His primary care physician performed an incision and drainage and prescribed ciprofloxacin. The patient continued to experience worsening fatigue, difficulty ambulating, ongoing purulent drainage, and consequently presented to the hospital for further evaluation. The patient has an allergy to penicillin but no history of diabetes. He quit smoking 40 years ago and has occasional alcohol intake. Surgical history includes bilateral knee replacement 15 years ago for osteoarthritis and right inguinal hernia repair and appendectomy 60 years ago.
On physical examination the patient had a temperature of 96.8F, pulse of 88 beats per minute, blood pressure of 97/63 mm Hg, and an oxygen saturation of 98% on room air. There was extensive swelling, erythema, and induration of the left anterior and proximal inguinal area, with a 2‐cm malodorous ulcer over the midline thigh. No crepitation or mass was palpable. Range of motion at the hip on the affected limb was limited due to pain. Distal pulses on the lower extremity were present and equal bilaterally. Laboratory examination revealed white blood cell (WBC) = 16.4 with 41% bands. Blood cultures were sent and intravenous vancomycin, ciprofloxacin, clindamycin, and metronidazole were started. A computed tomography (CT)‐scan of the left lower extremity was performed and revealed skin thickening and reticulation of the subcutaneous tissues edema extending from the left groin to the left buttock. Several foci of gas were present within the soft tissues with the largest in the lateral aspect of the buttocks of gas in the soft tissues (Figure 1). The Laboratory Risk Indicator for Necrotizing Fasciitis, the patient scored a 3 out of a possible 13 points. The diagnosis of necrotizing fasciitis was made based on clinical findings and radiographic imaging.
Assessment
Patient became significantly hypotensive which required vasopressor support. He underwent surgical exploration of the left inguinal area. During surgery, tender crepitation of the antero‐lateral aspect of the thigh was noted. Extensive debridement with fasciotomy was performed. Tissue was sent for histopathological analysis and gram‐stain. A negative‐pressure wound dressing was placed over the defect. Post‐operatively, patient required intubation and continued vasopressor support. On post‐operative day 3, patient was extubated. Wound culture report revealed gram negative rods and Enterococcus faecalis which was sensitive to the patients' current antibiotic regimen. Clindamycin was discontinued. The patient was discharged to a subacute rehabilitation facility and returned for a split thickness skin graft 2 months after initial presentation.
Necrotizing fasciitis is a deep‐seated infection of the subcutaneous tissue that results in progressive destruction of fascia and fat. Presenting symptoms include pain, erythema, or bullae formation at the site of infection. Systemic symptoms such as fever, malaise, and myalgias may also be present at the time of presentation. Two types of necrotizing fasciitis are noted to occur. Type 1 is a mixed infection with a predominance of anaerobes1 and carries a 21% mortality.2 It is common post‐operatively and in patients with diabetes. In type 2 necrotizing fasciitis, Group‐A streptococcus was the most common cause of monomicrobial necrotizing fasciitis2 and mortality can be as high as 30%.3 Risk factors for the development of fasciitis include immunosuppression, diabetes, surgery, or penetrating injuries. Gas on soft tissue x‐rays, CT scan, or magnetic resonance imaging (MRI) is a highly specific but insensitive finding and is common in type I necrotizing fasciitis.
The patient in this case likely developed type I necrotizing fasciitis due to the presence of gas on CT scan and polymicrobial culture findings.
Diagnosis
A PubMed search of necrotizing fasciitis and acupuncture reveals only one case report, in which a diabetic patient underwent an unsterile acupuncture consultation.4 To our knowledge, we are the first to describe necrotizing fasciitis occurring in a nondiabetic patient who underwent a sterile acupuncture technique.
Given the lack of an explainable causal relationship regarding the pathogenesis of necrotizing fasciitis in our patient, it appears to be due to the acupuncture needle placement. The patient had no other history of abscesses, trauma and other portals of entry. The patient's presentation, temporal relation of the site of acupuncture, and the development of infection prompted a high index of suspicion as acupuncture as the main etiology.
Management
Treatment of necrotizing fasciitis includes early and aggressive surgical debridement. Multiple antibiotic regimens may be necessary due to the polymicrobial nature of the infection. In our patient, ciprofloxacin was initiated for broadened gram negative coverage, vancomycin for community acquired methicillin‐resistant Staphylococcus aureus (MRSA) and metronidazole for anaerobic coverage. Clindamycin was initiated due to concerns of toxin production, but was discontinued as the patient's condition improved.
Although complications of acupuncture may be rare, there exists the potential to cause life threatening complications. Necrotizing fasciitis has been observed as an adverse effect of acupuncture in a single diabetic patient,4 but can develop in nondiabetic individuals, such as in our patient.
- ,.Clinical and microbiological features of necrotizing fasciitis.J Clin Microbiol.1995;33(9):2382–2387.
- ,,,,.Low CO Necrotizing fasciitis: clinical presentation, microbiology, and determinants of mortality.J Bone Joint Surg Am.2003;85‐A(8):1454–1460.
- ,,, et al.Severe group A streptococcal infections associated with a toxic shock‐like syndrome and scarlet fever toxin A.N Engl J Med.1989;321(1):1–7.
- ,,.Necrotising fasciitis: a life‐threatening complication of acupuncture in a patient with diabetes mellitus.Singapore Med J.2004;45(4):180–182.
- ,.Clinical and microbiological features of necrotizing fasciitis.J Clin Microbiol.1995;33(9):2382–2387.
- ,,,,.Low CO Necrotizing fasciitis: clinical presentation, microbiology, and determinants of mortality.J Bone Joint Surg Am.2003;85‐A(8):1454–1460.
- ,,, et al.Severe group A streptococcal infections associated with a toxic shock‐like syndrome and scarlet fever toxin A.N Engl J Med.1989;321(1):1–7.
- ,,.Necrotising fasciitis: a life‐threatening complication of acupuncture in a patient with diabetes mellitus.Singapore Med J.2004;45(4):180–182.
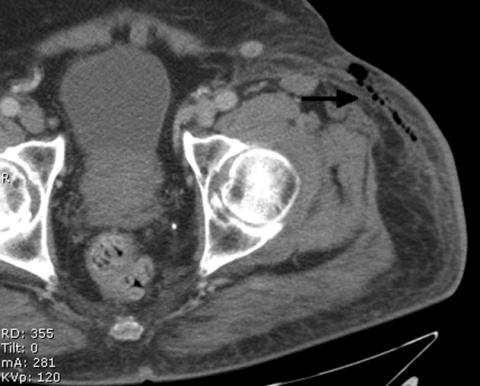
Performance of Dutch hospitals in the management of splenectomized patients
Patients without a spleen have a diminished host immune defense in response to bacteria.1 Especially in the first 2 years after surgery there is a risk for severe infection, mostly with encapsulated bacteria such as Streptococcus pneumoniae.2 This syndrome is called post‐splenectomy sepsis (PSS), and although the incidence is estimated to be low, it is associated with a high mortality of 50% to 70%.2 Importantly, PSS can largely be prevented if protective measures such as immunization and the prescription of antibiotics are taken. Several relevant organizations and committees have developed guidelines for prevention of infections in this group of patients.3 The recommendations by the British Committee for Standards in Haematology are currently considered to reflect best practice4, 5 and consist of the key‐elements shown in Box 1.
Unfortunately, adherence to guidelines is generally considered to be low.6 One of the most consistent findings in health services research is the gap between best practice and actual clinical care.7, 8 We have shown earlier that management of splenectomized patients in the Netherlands is not optimal (Lammers et al., Management of post‐splenectomy patients in the Netherlands, EJCMID, in press, DOI: 10.1007/s10096‐009‐0870‐x).
Several studies demonstrate that performance of hospitals is related to structural characteristics such as teaching status and practice organization.911 A large review showed that teaching hospitals in general offer better care than nonteaching hospitals. Furthermore, major teaching hospitals perform better than minor and nonteaching hospitals.12, 13
The aim of the present study was to investigate whether or not hospital structural characteristics of care delivery are associated with better compliance with best‐practice guidelines for preventing infections in splenectomized patients in Dutch hospitals. Our research questions were two‐fold: (1) are teaching hospitals delivering better quality of care in the prevention of infections in splenectomized patients than nonteaching hospitals and (2) is there an association between characteristics of practice organization (ie, the size of the surgical staff, the availability of a protocol for post‐splenectomy management, and the use of a complication registry by the department of surgery) and quality of care. Quality of care parameters were defined as outcome of adherence to the prevention guidelines of the British Committee for Standards in Haematology.
Key Recommendations for the Management of Asplenic Patients by the British Committee for Standards in Haematology
1. Splenectomised patients should receive pneumococcal immunization (23‐valent polysaccharide vaccine, PPV‐23) and lifelong revaccination. They should also receive Haemophilus influenzae type B and meningococcal C vaccine. Yearly influenza immunization is recommended.
2. Continuous prophylactic antibiotics are recommended for the first two years after splenectomy. In case of suspected or proven infection during or after these 2 years, patients should be given systemic antibiotics and be admitted to a hospital.
3. All patients should be educated about the risks of infection (PSS) and the risk associated with traveling (such as infection with Plasmodium falciparum) and unusual infections (ie, dog bites).
Methods
Hospital and Patient Inclusion
This study was approved by the medical ethics committee of the Academic Medical Center, Amsterdam, the Netherlands. After approval, we composed a representative sample out of the total of 93 Dutch hospitals, by including hospitals through a blind drawing. Hospitals were divided into 3 categories: (1) university hospitals, (2) nonuniversity teaching hospitals and (3) nonteaching hospitals. The teaching status of nonuniversity hospitals was based on the (non) presence of an internal or surgical medicine residency training program. After the drawing, each group contained 30% of the total number of Dutch hospitals in its category (source: RIVM, Nationale Atlas Volksgezondheid, 2007).
Subsequently, splenectomized patients were included retrospectively using the Dutch Pathology Registry, since spleens are routinely sent to pathology after removal. In this Registry, a search query *milt* (spleen) was performed, after which all splenectomies performed from 1997 to 2008 were selected and nonrelevant hits such as partial splenectomies or spleen biopsies were removed.
Data Collection
After hospitals and patients were identified, the medical file and all discharge correspondence were assessed on site. All data were collected separately for each hospital by the same 2 investigators (DV, JL) using a standardized survey form. To investigate discharge correspondence, discharge letters as well as all other correspondence up to at least 1 year after splenectomy were included, for example from follow‐up out‐patient visits.
After hospital category was documented, we registered for each hospital the size of the surgical staff at the time of inclusion, the availability of any form of protocol of the surgical department reflecting hospital post‐splenectomy policy, and the practice of systematically registering (surgical) complications by the department of surgery. Patient data included demographics, documentation of vaccine administration and documentation of the prescription of antibiotics. Furthermore, discharge correspondence was checked for mentioning of each of the following: performed splenectomy, vaccination status, the need for revaccination, prescribed prophylactic antibiotics, the need of urgent use of antibiotics in case of suspected infection, and the advice for annual flu‐vaccination.
Data Analysis
When computing vaccination rates, we included only those patients who survived the first 2 weeks after surgery, since correct vaccination is considered by the British Committee to be given 2 weeks prior to or at least 2 or more weeks after surgery. Pneumococcal vaccination was defined as immunization with either the 23‐valent pneumococcal polysaccharides vaccine (PPV‐23, Pneumovax), the 7‐valent pneumococcal conjugate vaccine (PCV‐7, Prevenar), or both.
Prophylactic antibiotics were defined as a prescription of antibiotics for the first 2 years after splenectomy. On demand antibiotics were defined as a prescription to be given to the patient at discharge, to use in case of suspected infection. When investigating prescription rates of prophylactic antibiotics, we excluded patients deceased in the first 2 weeks after surgery, regarding their death as a complication of surgery. In case of on demand antibiotics, patients who died in the hospital before their discharge were excluded as well. When investigating discharge information to the general practitioner (GP), only those patients alive at time of discharge were excluded.
Statistical Analysis
First, we have described the study sample using standard descriptive statistics. Second, to explore differences in performance and calculate P values, we used a chi‐square test between the 3 categories of hospitals (Table 2), between presence or absence of a protocol (Table 3) and complication registry. The influence of surgical staff size (divided into 1‐8 surgeons or >8 surgeons) was calculated using multivariate logistic regression analysis, where surgical staff size and hospital teaching status were used as covariates in the analysis. All statistical analysis of data was performed in SPSS 16.0.
| University | Nonuniversity Teaching | Nonteaching | |
|---|---|---|---|
| Hospitals, n (number of patients) | 2 (40) | 15 (287) | 11 (209) |
| Mean number of surgical staff per hospital (range) | 20 (1822) | 9.2 (316) | 5.5 (47) |
| Presence of splenectomy protocol at surgical department, n (%) | 2 (100) | 14 (93) | 7 (64) |
| Presence of complication registry at surgical department, n (%) | 2 (100) | 15 (100) | 9 (82) |
| Hospital (n = Number of Patients) | University (n = 33) | Nonuniversity Teaching (n = 268) | Nonteaching (n = 197) | P Value | |
|---|---|---|---|---|---|
| |||||
| Immunizations (%) | Pneumococcal | 90 | 85.5 | 84.3 | 0.559 |
| H. influenzae B | 66.7 | 40.3 | 33.5 | 0.001 | |
| Meningococcal C | 63.6 | 30.6 | 29.4 | <0.001 | |
| Antibiotics (%) | Prophylaxis* | 21.2 | 14.1 | 8.6 | 0.056 |
| On‐demand | 6.3 | 8.5 | 9.5 | 0.812 | |
| Both | 18.8 | 3.6 | 0 | <0.001 | |
| None | 53.1 | 72.6 | 81.5 | 0.001 | |
| Discharge letters mentioning (%) | Splenectomy | 100 | 98 | 96.8 | 0.425 |
| Immunization | 83.3 | 81 | 80.5 | 0.609 | |
| Booster immunization | 40.6 | 22.2 | 22.8 | 0.113 | |
| Influenza vaccination | 25 | 9.8 | 14.3 | 0.021 | |
| On‐demand antibiotics | 37.5 | 17.7 | 23.3 | 0.015 | |
| Protocol Present | No Protocol | P Value | |
|---|---|---|---|
| |||
| Immunizations (%) | |||
| Pneumococcal | 85.3 | 85.9 | 0.671 |
| H. influenzae B | 40.2 | 35.3 | 0.970 |
| Meningococcal C | 33.7 | 25.9 | 0.188 |
| Antibiotics (%) | |||
| Prophylaxis* | 13.8 | 6.3 | <0.001 |
| On‐demand | 9.5 | 5.5 | 0.001 |
| Both | 3.9 | 0 | 0.062 |
| None | 72 | 87.7 | 0.230 |
| Discharge letters mentioning (%) | |||
| Splenectomy | 97.7 | 98.8 | 0.096 |
| Immunization | 81.4 | 78.6 | 0.321 |
| Booster immunization | 25.5 | 13.8 | 0.048 |
| Influenza vaccination | 14.4 | 5 | 0.024 |
| On‐demand antibiotics | 23.2 | 12.5 | 0.213 |
Results
We included 28 of 93 Dutch hospitals (30%), containing a total of 536 splenectomized patients (Table 1.) Five hospitals were excluded because they refused cooperation, and were subsequently replaced by comparable hospitals in their category.
Differences Between University and Nonteaching Hospitals
Hospital performance of Dutch university, nonuniversity teaching, and nonteaching hospitals is shown in Table 2. Admission to a university hospital is associated with better guideline adherence: 22 of 33 of patients (66.7%) in university hospitals were immunized with H. influenzae B as compared to 108 of 268 patients (40.3%) in nonuniversity teaching and 66 of 197 (33.5%) in nonteaching hospitals. Vaccination with N. meningitidis C occurred in 21 of 33 patients (63.6%) as compared to 82 of 268 patients (30.6%) in nonuniversity teaching and 58 of 197 (29.4%) in nonteaching hospitals. In 53.1% of patients no antibiotics were prescribed in university hospitals, as compared to 72.6% in nonuniversity teaching and 82.5% in nonteaching hospitals. Differences between nonuniversity teaching hospitals and nonteaching hospitals were small.
Presence of a Post‐Splenectomy Protocol
The availability of a protocol at the surgical department was not associated with higher vaccination rates (Table 3). It did however show a positive relation on the prescription of prophylactic antibiotics. The effect of a protocol on the quality of discharge information to the GP was minimal.
Size of Surgical Staff
Performance in relation to the size of surgical staff was determined (data not shown). There were no differences in vaccination rates or quality of discharge information between the groups of different sizes (less or more than 8 surgeons). Larger surgical groups seemed to perform better in prescribing antibiotics, however when adjusting for hospital category in multivariate analysis these differences were not significant.
Complication Registry
Complications were systematically registered by all but 2 surgical departments in nonteaching hospitals, composing a cohort of 27 patients.
Although numbers are low, it demonstrates that in the absence of a registry, the guideline adherence for this group of patients was similar, and only prophylactic antibiotics were significantly less prescribed: 62 of 473 patients (13.1%) in the presence of a registry, as compared to 0 of 27 patients in absence of a registry (P value = 0.044) (data not shown). The precise role of the registry herein remains unclear, since both hospitals also lacked a hospital post‐splenectomy protocol.
Discussion
Main Findings
The aim of the present study was to investigate quality of care for splenectomized patients in Dutch hospitals with different teaching status. In general, beneficial effects of teaching status only extended to university hospitals in the Netherlands. Other teaching hospitals performed similarly to nonteaching hospitals in the Netherlands. Hospitals in which the surgical department developed a local protocol with recommendations for managing patients after splenectomy did not achieve higher vaccination rates. There was, however, an improvement in prescription of antibiotics and in the quality of discharge correspondence from the hospital to the GP. Surgical staff size was not related to hospital performance.
Explanation of Results
In the Netherlands, all categories of hospitals provided over 80% of their post‐splenectomy patients with pneumococcal immunization, reflecting that Dutch physicians in general are aware of the need for pneumococcal protection after splenectomy. However, university hospitals had better performance results regarding immunizing patients with all 3 recommended vaccines, as well as prescribing prophylactic antibiotics in combination with a prescription for on‐demand antibiotics. Collectively, university hospitals offered their patients a more complete post‐splenectomy treatment.
It has been described elsewhere that minor teaching and nonteaching hospitals show small differences, and that nonteaching hospitals even perform better at certain indicators than minor teaching hospitals.13 We indeed found small differences between nonuniversity teaching hospitals and nonteaching hospitals, where nonuniversity teaching hospitals performed better at prescribing antibiotics, and nonteaching hospitals did better at giving recommendations to the GP on booster immunization and use of on‐demand antibiotics.
Hospital characteristics have been shown to have important effects on hospital outcomes.10, 14, 15 We hypothesized this would also be the case regarding the adherence to post‐splenectomy management recommendations. In particular, we were expecting to find that the availability of a protocol at the department of surgery would be associated with better compliance with all key recommendations in the British Standards, however, vaccination rates did not differ form departments without a protocol. The items that were generally most eligible for improvement seemed to benefit most from the presence of a protocol.
Neither the presence of a protocol nor the size of the surgical staff were related to better performance in university hospitals. We can therefore only speculate about the explanation for the differences found between university and other hospitals. Organizational differences may not be disregarded; it has been described elsewhere that better quality and processes of care are delivered in major teaching hospitals.16, 9, 12 Most prior studies have reported a lower risk‐adjusted mortality in major teaching hospitals as compared with minor teaching or nonteaching hospitals.9, 12 It is also possible that residency and fellowship programs contribute to better compliance of guidelines and have a favorable impact on the delivery of patient care in teaching hospitals.12
Limitations
In absence of a Dutch guideline we chose to investigate adherence to the recommendations by the British Committee for Standards in Haematology, assuming that Dutch professionals have some knowledge of these recommendations. Although these recommendations are internationally considered to reflect current best practice and patients should therefore be managed according to at least comparable standards, the extent of familiarity and use of the British standards by Dutch physicians remains to be investigated in the future. Furthermore, we investigated the availability of a locally designed protocol on the management of post‐splenectomy patients by the surgical department. Checking the contents of each of these local protocols was not part of our study and thus we can not exclude that these protocols are lacking certain recommendations. It also remains unclear how hospitals have implemented their protocols.
Implications for Future Research and Policy
In the Netherlands, hospitals could offer better quality of care for hyposplenic and asplenic patients in the prevention of infections by increasing immunization rates. Furthermore, although academic centers performed better than the other hospital categories, only a minority of patients were given or advised to receive on demand antibiotics. Here lies a tremendous opportunity to improve patient care in the prevention of severe infections.
Potential barriers that exist for delivering optimal care to these patients remain to be investigated. Furthermore, although teaching status is related to performance, the explanation for this difference remains unclear. The results of this study suggest that there is a relation between characteristics of practice organization and performance, but these characteristics should be further elucidated.
Conclusion
University hospitals offer higher guideline adherence in preventing infections after splenectomy than other teaching and nonteaching hospitals. For all Dutch hospitals there is room for improving the quality of post‐splenectomy patient care. The results of this study suggest that the difference in performance may be related to several characteristics of hospital practice organization. Future research should further investigate these hospital characteristics and their influence on performance.
Acknowledgements
The authors would like to thank all participating hospitals.
- , .Structure and function of the spleen.Nat Rev Immunol.2005;5:606–616.
- , , .Postsplenectomy sepsis and its mortality rate: actual versus perceived risks.Br J Surg.1991;78:1031–1038.
- , , , .Vaccination of asplenic or hyposplenic adults.Br J Surg.2008;95:273–280.
- Guidelines for the prevention and treatment of infection in patients with an absent or dysfunctional spleen.Working Party of the British Committee for Standards in Haematology Clinical Haematology Task Force.BMJ.1996;312:430–434.
- , , .Update of guidelines for the prevention and treatment of infection in patients with an absent or dysfunctional spleen.Clin Med.2002;2:440–443.
- , , , et al.Why don't physicians follow clinical practice guidelines? A framework for improvement.JAMA.1999;282:1458–1465.
- , , .Implementing clinical guidelines: current evidence and future implications.J Contin Educ Health Prof.2004;24 Suppl 1:S31‐S37.
- , .From best evidence to best practice: effective implementation of change in patients' care.Lancet.2003;362:1225–1230.
- , , , et al.Relationship of hospital teaching status with quality of care and mortality for Medicare patients with acute MI.JAMA.2000;284:1256–1262.
- , , , , .Do “America's Best Hospitals” perform better for acute myocardial infarction?N Engl J Med.1999;340:286–292.
- , , , et al.Variation between hospitals in patient outcome after stroke is only partly explained by differences in quality of care: results from the Netherlands Stroke Survey.J Neurol Neurosurg Psychiatry.2008;79:888–894.
- , , , , , .Hospital outcomes in major teaching, minor teaching, and nonteaching hospitals in New York state.Am J Med.2002;112:255–261.
- , .Teaching hospitals and quality of care: a review of the literature.Milbank Q.2002;80:569–593, v.
- , , , .The association between hospital volume and survival after acute myocardial infarction in elderly patients.N Engl J Med.1999;340:1640–1648.
- , , , , .The association between hospital type and mortality and length of stay: a study of 16.9 million hospitalized Medicare beneficiaries.Med Care.2000;38:231–245.
- .Quality of care in teaching hospitals: a literature review.Acad Med.2005;80:458–466.
Patients without a spleen have a diminished host immune defense in response to bacteria.1 Especially in the first 2 years after surgery there is a risk for severe infection, mostly with encapsulated bacteria such as Streptococcus pneumoniae.2 This syndrome is called post‐splenectomy sepsis (PSS), and although the incidence is estimated to be low, it is associated with a high mortality of 50% to 70%.2 Importantly, PSS can largely be prevented if protective measures such as immunization and the prescription of antibiotics are taken. Several relevant organizations and committees have developed guidelines for prevention of infections in this group of patients.3 The recommendations by the British Committee for Standards in Haematology are currently considered to reflect best practice4, 5 and consist of the key‐elements shown in Box 1.
Unfortunately, adherence to guidelines is generally considered to be low.6 One of the most consistent findings in health services research is the gap between best practice and actual clinical care.7, 8 We have shown earlier that management of splenectomized patients in the Netherlands is not optimal (Lammers et al., Management of post‐splenectomy patients in the Netherlands, EJCMID, in press, DOI: 10.1007/s10096‐009‐0870‐x).
Several studies demonstrate that performance of hospitals is related to structural characteristics such as teaching status and practice organization.911 A large review showed that teaching hospitals in general offer better care than nonteaching hospitals. Furthermore, major teaching hospitals perform better than minor and nonteaching hospitals.12, 13
The aim of the present study was to investigate whether or not hospital structural characteristics of care delivery are associated with better compliance with best‐practice guidelines for preventing infections in splenectomized patients in Dutch hospitals. Our research questions were two‐fold: (1) are teaching hospitals delivering better quality of care in the prevention of infections in splenectomized patients than nonteaching hospitals and (2) is there an association between characteristics of practice organization (ie, the size of the surgical staff, the availability of a protocol for post‐splenectomy management, and the use of a complication registry by the department of surgery) and quality of care. Quality of care parameters were defined as outcome of adherence to the prevention guidelines of the British Committee for Standards in Haematology.
Key Recommendations for the Management of Asplenic Patients by the British Committee for Standards in Haematology
1. Splenectomised patients should receive pneumococcal immunization (23‐valent polysaccharide vaccine, PPV‐23) and lifelong revaccination. They should also receive Haemophilus influenzae type B and meningococcal C vaccine. Yearly influenza immunization is recommended.
2. Continuous prophylactic antibiotics are recommended for the first two years after splenectomy. In case of suspected or proven infection during or after these 2 years, patients should be given systemic antibiotics and be admitted to a hospital.
3. All patients should be educated about the risks of infection (PSS) and the risk associated with traveling (such as infection with Plasmodium falciparum) and unusual infections (ie, dog bites).
Methods
Hospital and Patient Inclusion
This study was approved by the medical ethics committee of the Academic Medical Center, Amsterdam, the Netherlands. After approval, we composed a representative sample out of the total of 93 Dutch hospitals, by including hospitals through a blind drawing. Hospitals were divided into 3 categories: (1) university hospitals, (2) nonuniversity teaching hospitals and (3) nonteaching hospitals. The teaching status of nonuniversity hospitals was based on the (non) presence of an internal or surgical medicine residency training program. After the drawing, each group contained 30% of the total number of Dutch hospitals in its category (source: RIVM, Nationale Atlas Volksgezondheid, 2007).
Subsequently, splenectomized patients were included retrospectively using the Dutch Pathology Registry, since spleens are routinely sent to pathology after removal. In this Registry, a search query *milt* (spleen) was performed, after which all splenectomies performed from 1997 to 2008 were selected and nonrelevant hits such as partial splenectomies or spleen biopsies were removed.
Data Collection
After hospitals and patients were identified, the medical file and all discharge correspondence were assessed on site. All data were collected separately for each hospital by the same 2 investigators (DV, JL) using a standardized survey form. To investigate discharge correspondence, discharge letters as well as all other correspondence up to at least 1 year after splenectomy were included, for example from follow‐up out‐patient visits.
After hospital category was documented, we registered for each hospital the size of the surgical staff at the time of inclusion, the availability of any form of protocol of the surgical department reflecting hospital post‐splenectomy policy, and the practice of systematically registering (surgical) complications by the department of surgery. Patient data included demographics, documentation of vaccine administration and documentation of the prescription of antibiotics. Furthermore, discharge correspondence was checked for mentioning of each of the following: performed splenectomy, vaccination status, the need for revaccination, prescribed prophylactic antibiotics, the need of urgent use of antibiotics in case of suspected infection, and the advice for annual flu‐vaccination.
Data Analysis
When computing vaccination rates, we included only those patients who survived the first 2 weeks after surgery, since correct vaccination is considered by the British Committee to be given 2 weeks prior to or at least 2 or more weeks after surgery. Pneumococcal vaccination was defined as immunization with either the 23‐valent pneumococcal polysaccharides vaccine (PPV‐23, Pneumovax), the 7‐valent pneumococcal conjugate vaccine (PCV‐7, Prevenar), or both.
Prophylactic antibiotics were defined as a prescription of antibiotics for the first 2 years after splenectomy. On demand antibiotics were defined as a prescription to be given to the patient at discharge, to use in case of suspected infection. When investigating prescription rates of prophylactic antibiotics, we excluded patients deceased in the first 2 weeks after surgery, regarding their death as a complication of surgery. In case of on demand antibiotics, patients who died in the hospital before their discharge were excluded as well. When investigating discharge information to the general practitioner (GP), only those patients alive at time of discharge were excluded.
Statistical Analysis
First, we have described the study sample using standard descriptive statistics. Second, to explore differences in performance and calculate P values, we used a chi‐square test between the 3 categories of hospitals (Table 2), between presence or absence of a protocol (Table 3) and complication registry. The influence of surgical staff size (divided into 1‐8 surgeons or >8 surgeons) was calculated using multivariate logistic regression analysis, where surgical staff size and hospital teaching status were used as covariates in the analysis. All statistical analysis of data was performed in SPSS 16.0.
| University | Nonuniversity Teaching | Nonteaching | |
|---|---|---|---|
| Hospitals, n (number of patients) | 2 (40) | 15 (287) | 11 (209) |
| Mean number of surgical staff per hospital (range) | 20 (1822) | 9.2 (316) | 5.5 (47) |
| Presence of splenectomy protocol at surgical department, n (%) | 2 (100) | 14 (93) | 7 (64) |
| Presence of complication registry at surgical department, n (%) | 2 (100) | 15 (100) | 9 (82) |
| Hospital (n = Number of Patients) | University (n = 33) | Nonuniversity Teaching (n = 268) | Nonteaching (n = 197) | P Value | |
|---|---|---|---|---|---|
| |||||
| Immunizations (%) | Pneumococcal | 90 | 85.5 | 84.3 | 0.559 |
| H. influenzae B | 66.7 | 40.3 | 33.5 | 0.001 | |
| Meningococcal C | 63.6 | 30.6 | 29.4 | <0.001 | |
| Antibiotics (%) | Prophylaxis* | 21.2 | 14.1 | 8.6 | 0.056 |
| On‐demand | 6.3 | 8.5 | 9.5 | 0.812 | |
| Both | 18.8 | 3.6 | 0 | <0.001 | |
| None | 53.1 | 72.6 | 81.5 | 0.001 | |
| Discharge letters mentioning (%) | Splenectomy | 100 | 98 | 96.8 | 0.425 |
| Immunization | 83.3 | 81 | 80.5 | 0.609 | |
| Booster immunization | 40.6 | 22.2 | 22.8 | 0.113 | |
| Influenza vaccination | 25 | 9.8 | 14.3 | 0.021 | |
| On‐demand antibiotics | 37.5 | 17.7 | 23.3 | 0.015 | |
| Protocol Present | No Protocol | P Value | |
|---|---|---|---|
| |||
| Immunizations (%) | |||
| Pneumococcal | 85.3 | 85.9 | 0.671 |
| H. influenzae B | 40.2 | 35.3 | 0.970 |
| Meningococcal C | 33.7 | 25.9 | 0.188 |
| Antibiotics (%) | |||
| Prophylaxis* | 13.8 | 6.3 | <0.001 |
| On‐demand | 9.5 | 5.5 | 0.001 |
| Both | 3.9 | 0 | 0.062 |
| None | 72 | 87.7 | 0.230 |
| Discharge letters mentioning (%) | |||
| Splenectomy | 97.7 | 98.8 | 0.096 |
| Immunization | 81.4 | 78.6 | 0.321 |
| Booster immunization | 25.5 | 13.8 | 0.048 |
| Influenza vaccination | 14.4 | 5 | 0.024 |
| On‐demand antibiotics | 23.2 | 12.5 | 0.213 |
Results
We included 28 of 93 Dutch hospitals (30%), containing a total of 536 splenectomized patients (Table 1.) Five hospitals were excluded because they refused cooperation, and were subsequently replaced by comparable hospitals in their category.
Differences Between University and Nonteaching Hospitals
Hospital performance of Dutch university, nonuniversity teaching, and nonteaching hospitals is shown in Table 2. Admission to a university hospital is associated with better guideline adherence: 22 of 33 of patients (66.7%) in university hospitals were immunized with H. influenzae B as compared to 108 of 268 patients (40.3%) in nonuniversity teaching and 66 of 197 (33.5%) in nonteaching hospitals. Vaccination with N. meningitidis C occurred in 21 of 33 patients (63.6%) as compared to 82 of 268 patients (30.6%) in nonuniversity teaching and 58 of 197 (29.4%) in nonteaching hospitals. In 53.1% of patients no antibiotics were prescribed in university hospitals, as compared to 72.6% in nonuniversity teaching and 82.5% in nonteaching hospitals. Differences between nonuniversity teaching hospitals and nonteaching hospitals were small.
Presence of a Post‐Splenectomy Protocol
The availability of a protocol at the surgical department was not associated with higher vaccination rates (Table 3). It did however show a positive relation on the prescription of prophylactic antibiotics. The effect of a protocol on the quality of discharge information to the GP was minimal.
Size of Surgical Staff
Performance in relation to the size of surgical staff was determined (data not shown). There were no differences in vaccination rates or quality of discharge information between the groups of different sizes (less or more than 8 surgeons). Larger surgical groups seemed to perform better in prescribing antibiotics, however when adjusting for hospital category in multivariate analysis these differences were not significant.
Complication Registry
Complications were systematically registered by all but 2 surgical departments in nonteaching hospitals, composing a cohort of 27 patients.
Although numbers are low, it demonstrates that in the absence of a registry, the guideline adherence for this group of patients was similar, and only prophylactic antibiotics were significantly less prescribed: 62 of 473 patients (13.1%) in the presence of a registry, as compared to 0 of 27 patients in absence of a registry (P value = 0.044) (data not shown). The precise role of the registry herein remains unclear, since both hospitals also lacked a hospital post‐splenectomy protocol.
Discussion
Main Findings
The aim of the present study was to investigate quality of care for splenectomized patients in Dutch hospitals with different teaching status. In general, beneficial effects of teaching status only extended to university hospitals in the Netherlands. Other teaching hospitals performed similarly to nonteaching hospitals in the Netherlands. Hospitals in which the surgical department developed a local protocol with recommendations for managing patients after splenectomy did not achieve higher vaccination rates. There was, however, an improvement in prescription of antibiotics and in the quality of discharge correspondence from the hospital to the GP. Surgical staff size was not related to hospital performance.
Explanation of Results
In the Netherlands, all categories of hospitals provided over 80% of their post‐splenectomy patients with pneumococcal immunization, reflecting that Dutch physicians in general are aware of the need for pneumococcal protection after splenectomy. However, university hospitals had better performance results regarding immunizing patients with all 3 recommended vaccines, as well as prescribing prophylactic antibiotics in combination with a prescription for on‐demand antibiotics. Collectively, university hospitals offered their patients a more complete post‐splenectomy treatment.
It has been described elsewhere that minor teaching and nonteaching hospitals show small differences, and that nonteaching hospitals even perform better at certain indicators than minor teaching hospitals.13 We indeed found small differences between nonuniversity teaching hospitals and nonteaching hospitals, where nonuniversity teaching hospitals performed better at prescribing antibiotics, and nonteaching hospitals did better at giving recommendations to the GP on booster immunization and use of on‐demand antibiotics.
Hospital characteristics have been shown to have important effects on hospital outcomes.10, 14, 15 We hypothesized this would also be the case regarding the adherence to post‐splenectomy management recommendations. In particular, we were expecting to find that the availability of a protocol at the department of surgery would be associated with better compliance with all key recommendations in the British Standards, however, vaccination rates did not differ form departments without a protocol. The items that were generally most eligible for improvement seemed to benefit most from the presence of a protocol.
Neither the presence of a protocol nor the size of the surgical staff were related to better performance in university hospitals. We can therefore only speculate about the explanation for the differences found between university and other hospitals. Organizational differences may not be disregarded; it has been described elsewhere that better quality and processes of care are delivered in major teaching hospitals.16, 9, 12 Most prior studies have reported a lower risk‐adjusted mortality in major teaching hospitals as compared with minor teaching or nonteaching hospitals.9, 12 It is also possible that residency and fellowship programs contribute to better compliance of guidelines and have a favorable impact on the delivery of patient care in teaching hospitals.12
Limitations
In absence of a Dutch guideline we chose to investigate adherence to the recommendations by the British Committee for Standards in Haematology, assuming that Dutch professionals have some knowledge of these recommendations. Although these recommendations are internationally considered to reflect current best practice and patients should therefore be managed according to at least comparable standards, the extent of familiarity and use of the British standards by Dutch physicians remains to be investigated in the future. Furthermore, we investigated the availability of a locally designed protocol on the management of post‐splenectomy patients by the surgical department. Checking the contents of each of these local protocols was not part of our study and thus we can not exclude that these protocols are lacking certain recommendations. It also remains unclear how hospitals have implemented their protocols.
Implications for Future Research and Policy
In the Netherlands, hospitals could offer better quality of care for hyposplenic and asplenic patients in the prevention of infections by increasing immunization rates. Furthermore, although academic centers performed better than the other hospital categories, only a minority of patients were given or advised to receive on demand antibiotics. Here lies a tremendous opportunity to improve patient care in the prevention of severe infections.
Potential barriers that exist for delivering optimal care to these patients remain to be investigated. Furthermore, although teaching status is related to performance, the explanation for this difference remains unclear. The results of this study suggest that there is a relation between characteristics of practice organization and performance, but these characteristics should be further elucidated.
Conclusion
University hospitals offer higher guideline adherence in preventing infections after splenectomy than other teaching and nonteaching hospitals. For all Dutch hospitals there is room for improving the quality of post‐splenectomy patient care. The results of this study suggest that the difference in performance may be related to several characteristics of hospital practice organization. Future research should further investigate these hospital characteristics and their influence on performance.
Acknowledgements
The authors would like to thank all participating hospitals.
Patients without a spleen have a diminished host immune defense in response to bacteria.1 Especially in the first 2 years after surgery there is a risk for severe infection, mostly with encapsulated bacteria such as Streptococcus pneumoniae.2 This syndrome is called post‐splenectomy sepsis (PSS), and although the incidence is estimated to be low, it is associated with a high mortality of 50% to 70%.2 Importantly, PSS can largely be prevented if protective measures such as immunization and the prescription of antibiotics are taken. Several relevant organizations and committees have developed guidelines for prevention of infections in this group of patients.3 The recommendations by the British Committee for Standards in Haematology are currently considered to reflect best practice4, 5 and consist of the key‐elements shown in Box 1.
Unfortunately, adherence to guidelines is generally considered to be low.6 One of the most consistent findings in health services research is the gap between best practice and actual clinical care.7, 8 We have shown earlier that management of splenectomized patients in the Netherlands is not optimal (Lammers et al., Management of post‐splenectomy patients in the Netherlands, EJCMID, in press, DOI: 10.1007/s10096‐009‐0870‐x).
Several studies demonstrate that performance of hospitals is related to structural characteristics such as teaching status and practice organization.911 A large review showed that teaching hospitals in general offer better care than nonteaching hospitals. Furthermore, major teaching hospitals perform better than minor and nonteaching hospitals.12, 13
The aim of the present study was to investigate whether or not hospital structural characteristics of care delivery are associated with better compliance with best‐practice guidelines for preventing infections in splenectomized patients in Dutch hospitals. Our research questions were two‐fold: (1) are teaching hospitals delivering better quality of care in the prevention of infections in splenectomized patients than nonteaching hospitals and (2) is there an association between characteristics of practice organization (ie, the size of the surgical staff, the availability of a protocol for post‐splenectomy management, and the use of a complication registry by the department of surgery) and quality of care. Quality of care parameters were defined as outcome of adherence to the prevention guidelines of the British Committee for Standards in Haematology.
Key Recommendations for the Management of Asplenic Patients by the British Committee for Standards in Haematology
1. Splenectomised patients should receive pneumococcal immunization (23‐valent polysaccharide vaccine, PPV‐23) and lifelong revaccination. They should also receive Haemophilus influenzae type B and meningococcal C vaccine. Yearly influenza immunization is recommended.
2. Continuous prophylactic antibiotics are recommended for the first two years after splenectomy. In case of suspected or proven infection during or after these 2 years, patients should be given systemic antibiotics and be admitted to a hospital.
3. All patients should be educated about the risks of infection (PSS) and the risk associated with traveling (such as infection with Plasmodium falciparum) and unusual infections (ie, dog bites).
Methods
Hospital and Patient Inclusion
This study was approved by the medical ethics committee of the Academic Medical Center, Amsterdam, the Netherlands. After approval, we composed a representative sample out of the total of 93 Dutch hospitals, by including hospitals through a blind drawing. Hospitals were divided into 3 categories: (1) university hospitals, (2) nonuniversity teaching hospitals and (3) nonteaching hospitals. The teaching status of nonuniversity hospitals was based on the (non) presence of an internal or surgical medicine residency training program. After the drawing, each group contained 30% of the total number of Dutch hospitals in its category (source: RIVM, Nationale Atlas Volksgezondheid, 2007).
Subsequently, splenectomized patients were included retrospectively using the Dutch Pathology Registry, since spleens are routinely sent to pathology after removal. In this Registry, a search query *milt* (spleen) was performed, after which all splenectomies performed from 1997 to 2008 were selected and nonrelevant hits such as partial splenectomies or spleen biopsies were removed.
Data Collection
After hospitals and patients were identified, the medical file and all discharge correspondence were assessed on site. All data were collected separately for each hospital by the same 2 investigators (DV, JL) using a standardized survey form. To investigate discharge correspondence, discharge letters as well as all other correspondence up to at least 1 year after splenectomy were included, for example from follow‐up out‐patient visits.
After hospital category was documented, we registered for each hospital the size of the surgical staff at the time of inclusion, the availability of any form of protocol of the surgical department reflecting hospital post‐splenectomy policy, and the practice of systematically registering (surgical) complications by the department of surgery. Patient data included demographics, documentation of vaccine administration and documentation of the prescription of antibiotics. Furthermore, discharge correspondence was checked for mentioning of each of the following: performed splenectomy, vaccination status, the need for revaccination, prescribed prophylactic antibiotics, the need of urgent use of antibiotics in case of suspected infection, and the advice for annual flu‐vaccination.
Data Analysis
When computing vaccination rates, we included only those patients who survived the first 2 weeks after surgery, since correct vaccination is considered by the British Committee to be given 2 weeks prior to or at least 2 or more weeks after surgery. Pneumococcal vaccination was defined as immunization with either the 23‐valent pneumococcal polysaccharides vaccine (PPV‐23, Pneumovax), the 7‐valent pneumococcal conjugate vaccine (PCV‐7, Prevenar), or both.
Prophylactic antibiotics were defined as a prescription of antibiotics for the first 2 years after splenectomy. On demand antibiotics were defined as a prescription to be given to the patient at discharge, to use in case of suspected infection. When investigating prescription rates of prophylactic antibiotics, we excluded patients deceased in the first 2 weeks after surgery, regarding their death as a complication of surgery. In case of on demand antibiotics, patients who died in the hospital before their discharge were excluded as well. When investigating discharge information to the general practitioner (GP), only those patients alive at time of discharge were excluded.
Statistical Analysis
First, we have described the study sample using standard descriptive statistics. Second, to explore differences in performance and calculate P values, we used a chi‐square test between the 3 categories of hospitals (Table 2), between presence or absence of a protocol (Table 3) and complication registry. The influence of surgical staff size (divided into 1‐8 surgeons or >8 surgeons) was calculated using multivariate logistic regression analysis, where surgical staff size and hospital teaching status were used as covariates in the analysis. All statistical analysis of data was performed in SPSS 16.0.
| University | Nonuniversity Teaching | Nonteaching | |
|---|---|---|---|
| Hospitals, n (number of patients) | 2 (40) | 15 (287) | 11 (209) |
| Mean number of surgical staff per hospital (range) | 20 (1822) | 9.2 (316) | 5.5 (47) |
| Presence of splenectomy protocol at surgical department, n (%) | 2 (100) | 14 (93) | 7 (64) |
| Presence of complication registry at surgical department, n (%) | 2 (100) | 15 (100) | 9 (82) |
| Hospital (n = Number of Patients) | University (n = 33) | Nonuniversity Teaching (n = 268) | Nonteaching (n = 197) | P Value | |
|---|---|---|---|---|---|
| |||||
| Immunizations (%) | Pneumococcal | 90 | 85.5 | 84.3 | 0.559 |
| H. influenzae B | 66.7 | 40.3 | 33.5 | 0.001 | |
| Meningococcal C | 63.6 | 30.6 | 29.4 | <0.001 | |
| Antibiotics (%) | Prophylaxis* | 21.2 | 14.1 | 8.6 | 0.056 |
| On‐demand | 6.3 | 8.5 | 9.5 | 0.812 | |
| Both | 18.8 | 3.6 | 0 | <0.001 | |
| None | 53.1 | 72.6 | 81.5 | 0.001 | |
| Discharge letters mentioning (%) | Splenectomy | 100 | 98 | 96.8 | 0.425 |
| Immunization | 83.3 | 81 | 80.5 | 0.609 | |
| Booster immunization | 40.6 | 22.2 | 22.8 | 0.113 | |
| Influenza vaccination | 25 | 9.8 | 14.3 | 0.021 | |
| On‐demand antibiotics | 37.5 | 17.7 | 23.3 | 0.015 | |
| Protocol Present | No Protocol | P Value | |
|---|---|---|---|
| |||
| Immunizations (%) | |||
| Pneumococcal | 85.3 | 85.9 | 0.671 |
| H. influenzae B | 40.2 | 35.3 | 0.970 |
| Meningococcal C | 33.7 | 25.9 | 0.188 |
| Antibiotics (%) | |||
| Prophylaxis* | 13.8 | 6.3 | <0.001 |
| On‐demand | 9.5 | 5.5 | 0.001 |
| Both | 3.9 | 0 | 0.062 |
| None | 72 | 87.7 | 0.230 |
| Discharge letters mentioning (%) | |||
| Splenectomy | 97.7 | 98.8 | 0.096 |
| Immunization | 81.4 | 78.6 | 0.321 |
| Booster immunization | 25.5 | 13.8 | 0.048 |
| Influenza vaccination | 14.4 | 5 | 0.024 |
| On‐demand antibiotics | 23.2 | 12.5 | 0.213 |
Results
We included 28 of 93 Dutch hospitals (30%), containing a total of 536 splenectomized patients (Table 1.) Five hospitals were excluded because they refused cooperation, and were subsequently replaced by comparable hospitals in their category.
Differences Between University and Nonteaching Hospitals
Hospital performance of Dutch university, nonuniversity teaching, and nonteaching hospitals is shown in Table 2. Admission to a university hospital is associated with better guideline adherence: 22 of 33 of patients (66.7%) in university hospitals were immunized with H. influenzae B as compared to 108 of 268 patients (40.3%) in nonuniversity teaching and 66 of 197 (33.5%) in nonteaching hospitals. Vaccination with N. meningitidis C occurred in 21 of 33 patients (63.6%) as compared to 82 of 268 patients (30.6%) in nonuniversity teaching and 58 of 197 (29.4%) in nonteaching hospitals. In 53.1% of patients no antibiotics were prescribed in university hospitals, as compared to 72.6% in nonuniversity teaching and 82.5% in nonteaching hospitals. Differences between nonuniversity teaching hospitals and nonteaching hospitals were small.
Presence of a Post‐Splenectomy Protocol
The availability of a protocol at the surgical department was not associated with higher vaccination rates (Table 3). It did however show a positive relation on the prescription of prophylactic antibiotics. The effect of a protocol on the quality of discharge information to the GP was minimal.
Size of Surgical Staff
Performance in relation to the size of surgical staff was determined (data not shown). There were no differences in vaccination rates or quality of discharge information between the groups of different sizes (less or more than 8 surgeons). Larger surgical groups seemed to perform better in prescribing antibiotics, however when adjusting for hospital category in multivariate analysis these differences were not significant.
Complication Registry
Complications were systematically registered by all but 2 surgical departments in nonteaching hospitals, composing a cohort of 27 patients.
Although numbers are low, it demonstrates that in the absence of a registry, the guideline adherence for this group of patients was similar, and only prophylactic antibiotics were significantly less prescribed: 62 of 473 patients (13.1%) in the presence of a registry, as compared to 0 of 27 patients in absence of a registry (P value = 0.044) (data not shown). The precise role of the registry herein remains unclear, since both hospitals also lacked a hospital post‐splenectomy protocol.
Discussion
Main Findings
The aim of the present study was to investigate quality of care for splenectomized patients in Dutch hospitals with different teaching status. In general, beneficial effects of teaching status only extended to university hospitals in the Netherlands. Other teaching hospitals performed similarly to nonteaching hospitals in the Netherlands. Hospitals in which the surgical department developed a local protocol with recommendations for managing patients after splenectomy did not achieve higher vaccination rates. There was, however, an improvement in prescription of antibiotics and in the quality of discharge correspondence from the hospital to the GP. Surgical staff size was not related to hospital performance.
Explanation of Results
In the Netherlands, all categories of hospitals provided over 80% of their post‐splenectomy patients with pneumococcal immunization, reflecting that Dutch physicians in general are aware of the need for pneumococcal protection after splenectomy. However, university hospitals had better performance results regarding immunizing patients with all 3 recommended vaccines, as well as prescribing prophylactic antibiotics in combination with a prescription for on‐demand antibiotics. Collectively, university hospitals offered their patients a more complete post‐splenectomy treatment.
It has been described elsewhere that minor teaching and nonteaching hospitals show small differences, and that nonteaching hospitals even perform better at certain indicators than minor teaching hospitals.13 We indeed found small differences between nonuniversity teaching hospitals and nonteaching hospitals, where nonuniversity teaching hospitals performed better at prescribing antibiotics, and nonteaching hospitals did better at giving recommendations to the GP on booster immunization and use of on‐demand antibiotics.
Hospital characteristics have been shown to have important effects on hospital outcomes.10, 14, 15 We hypothesized this would also be the case regarding the adherence to post‐splenectomy management recommendations. In particular, we were expecting to find that the availability of a protocol at the department of surgery would be associated with better compliance with all key recommendations in the British Standards, however, vaccination rates did not differ form departments without a protocol. The items that were generally most eligible for improvement seemed to benefit most from the presence of a protocol.
Neither the presence of a protocol nor the size of the surgical staff were related to better performance in university hospitals. We can therefore only speculate about the explanation for the differences found between university and other hospitals. Organizational differences may not be disregarded; it has been described elsewhere that better quality and processes of care are delivered in major teaching hospitals.16, 9, 12 Most prior studies have reported a lower risk‐adjusted mortality in major teaching hospitals as compared with minor teaching or nonteaching hospitals.9, 12 It is also possible that residency and fellowship programs contribute to better compliance of guidelines and have a favorable impact on the delivery of patient care in teaching hospitals.12
Limitations
In absence of a Dutch guideline we chose to investigate adherence to the recommendations by the British Committee for Standards in Haematology, assuming that Dutch professionals have some knowledge of these recommendations. Although these recommendations are internationally considered to reflect current best practice and patients should therefore be managed according to at least comparable standards, the extent of familiarity and use of the British standards by Dutch physicians remains to be investigated in the future. Furthermore, we investigated the availability of a locally designed protocol on the management of post‐splenectomy patients by the surgical department. Checking the contents of each of these local protocols was not part of our study and thus we can not exclude that these protocols are lacking certain recommendations. It also remains unclear how hospitals have implemented their protocols.
Implications for Future Research and Policy
In the Netherlands, hospitals could offer better quality of care for hyposplenic and asplenic patients in the prevention of infections by increasing immunization rates. Furthermore, although academic centers performed better than the other hospital categories, only a minority of patients were given or advised to receive on demand antibiotics. Here lies a tremendous opportunity to improve patient care in the prevention of severe infections.
Potential barriers that exist for delivering optimal care to these patients remain to be investigated. Furthermore, although teaching status is related to performance, the explanation for this difference remains unclear. The results of this study suggest that there is a relation between characteristics of practice organization and performance, but these characteristics should be further elucidated.
Conclusion
University hospitals offer higher guideline adherence in preventing infections after splenectomy than other teaching and nonteaching hospitals. For all Dutch hospitals there is room for improving the quality of post‐splenectomy patient care. The results of this study suggest that the difference in performance may be related to several characteristics of hospital practice organization. Future research should further investigate these hospital characteristics and their influence on performance.
Acknowledgements
The authors would like to thank all participating hospitals.
- , .Structure and function of the spleen.Nat Rev Immunol.2005;5:606–616.
- , , .Postsplenectomy sepsis and its mortality rate: actual versus perceived risks.Br J Surg.1991;78:1031–1038.
- , , , .Vaccination of asplenic or hyposplenic adults.Br J Surg.2008;95:273–280.
- Guidelines for the prevention and treatment of infection in patients with an absent or dysfunctional spleen.Working Party of the British Committee for Standards in Haematology Clinical Haematology Task Force.BMJ.1996;312:430–434.
- , , .Update of guidelines for the prevention and treatment of infection in patients with an absent or dysfunctional spleen.Clin Med.2002;2:440–443.
- , , , et al.Why don't physicians follow clinical practice guidelines? A framework for improvement.JAMA.1999;282:1458–1465.
- , , .Implementing clinical guidelines: current evidence and future implications.J Contin Educ Health Prof.2004;24 Suppl 1:S31‐S37.
- , .From best evidence to best practice: effective implementation of change in patients' care.Lancet.2003;362:1225–1230.
- , , , et al.Relationship of hospital teaching status with quality of care and mortality for Medicare patients with acute MI.JAMA.2000;284:1256–1262.
- , , , , .Do “America's Best Hospitals” perform better for acute myocardial infarction?N Engl J Med.1999;340:286–292.
- , , , et al.Variation between hospitals in patient outcome after stroke is only partly explained by differences in quality of care: results from the Netherlands Stroke Survey.J Neurol Neurosurg Psychiatry.2008;79:888–894.
- , , , , , .Hospital outcomes in major teaching, minor teaching, and nonteaching hospitals in New York state.Am J Med.2002;112:255–261.
- , .Teaching hospitals and quality of care: a review of the literature.Milbank Q.2002;80:569–593, v.
- , , , .The association between hospital volume and survival after acute myocardial infarction in elderly patients.N Engl J Med.1999;340:1640–1648.
- , , , , .The association between hospital type and mortality and length of stay: a study of 16.9 million hospitalized Medicare beneficiaries.Med Care.2000;38:231–245.
- .Quality of care in teaching hospitals: a literature review.Acad Med.2005;80:458–466.
- , .Structure and function of the spleen.Nat Rev Immunol.2005;5:606–616.
- , , .Postsplenectomy sepsis and its mortality rate: actual versus perceived risks.Br J Surg.1991;78:1031–1038.
- , , , .Vaccination of asplenic or hyposplenic adults.Br J Surg.2008;95:273–280.
- Guidelines for the prevention and treatment of infection in patients with an absent or dysfunctional spleen.Working Party of the British Committee for Standards in Haematology Clinical Haematology Task Force.BMJ.1996;312:430–434.
- , , .Update of guidelines for the prevention and treatment of infection in patients with an absent or dysfunctional spleen.Clin Med.2002;2:440–443.
- , , , et al.Why don't physicians follow clinical practice guidelines? A framework for improvement.JAMA.1999;282:1458–1465.
- , , .Implementing clinical guidelines: current evidence and future implications.J Contin Educ Health Prof.2004;24 Suppl 1:S31‐S37.
- , .From best evidence to best practice: effective implementation of change in patients' care.Lancet.2003;362:1225–1230.
- , , , et al.Relationship of hospital teaching status with quality of care and mortality for Medicare patients with acute MI.JAMA.2000;284:1256–1262.
- , , , , .Do “America's Best Hospitals” perform better for acute myocardial infarction?N Engl J Med.1999;340:286–292.
- , , , et al.Variation between hospitals in patient outcome after stroke is only partly explained by differences in quality of care: results from the Netherlands Stroke Survey.J Neurol Neurosurg Psychiatry.2008;79:888–894.
- , , , , , .Hospital outcomes in major teaching, minor teaching, and nonteaching hospitals in New York state.Am J Med.2002;112:255–261.
- , .Teaching hospitals and quality of care: a review of the literature.Milbank Q.2002;80:569–593, v.
- , , , .The association between hospital volume and survival after acute myocardial infarction in elderly patients.N Engl J Med.1999;340:1640–1648.
- , , , , .The association between hospital type and mortality and length of stay: a study of 16.9 million hospitalized Medicare beneficiaries.Med Care.2000;38:231–245.
- .Quality of care in teaching hospitals: a literature review.Acad Med.2005;80:458–466.
Copyright © 2010 Society of Hospital Medicine
Electrocardiographic changes of severe hyperkalemia
A 62‐year‐old woman with an extensive medical and surgical history presented with complaints of 2 days of weakness. Physical examination demonstrated a lethargic, but arousable woman in no distress. Her lower extremity motor strength was 4/5 bilaterally. The patient's electrocardiogram (ECG) demonstrated peaked T waves (Figure 1, arrow), absence of P waves, poor R wave progression and QRS interval widening (Figure 1, 2‐headed arrow.) Serum chemistries revealed a potassium level of 10.4 mmol/L and a creatinine of 0.9 mg/dL.
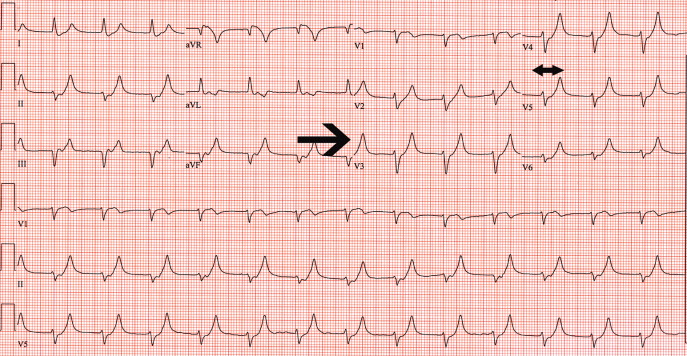
One ampule of D50, 10 units of insulin, 1 ampule of Calcium gluconate and 1 ampule of sodium bicarbonate were given intravenously along with oral Kayexalate. A repeat ECG showed a return of P waves, narrowing of the QRS interval, improved R wave progression and less peaking of the T waves (Figure 2). A repeat potassium level at that time was 9.2 mmol/L.
Despite continued therapy to lower the potassium, another ECG showed a return of peaked T waves, a prolonged PR interval and marked widening of the QRS interval to 205 msec; the potassium level was now 10.0 mmol/L (Figure 3).
Despite the patient's renal function being normal, she was emergently dialyzed. After a single dialysis, the patient's potassium level remained normal for the remainder of the hospitalization and a follow‐up ECG returned to baseline (Figure 4). No physiologic explanation was found for her hyperkalemia and it was concluded, despite her denials, that she had taken large quantities of exogenous potassium she had available from previous prescriptions.
A 62‐year‐old woman with an extensive medical and surgical history presented with complaints of 2 days of weakness. Physical examination demonstrated a lethargic, but arousable woman in no distress. Her lower extremity motor strength was 4/5 bilaterally. The patient's electrocardiogram (ECG) demonstrated peaked T waves (Figure 1, arrow), absence of P waves, poor R wave progression and QRS interval widening (Figure 1, 2‐headed arrow.) Serum chemistries revealed a potassium level of 10.4 mmol/L and a creatinine of 0.9 mg/dL.
One ampule of D50, 10 units of insulin, 1 ampule of Calcium gluconate and 1 ampule of sodium bicarbonate were given intravenously along with oral Kayexalate. A repeat ECG showed a return of P waves, narrowing of the QRS interval, improved R wave progression and less peaking of the T waves (Figure 2). A repeat potassium level at that time was 9.2 mmol/L.
Despite continued therapy to lower the potassium, another ECG showed a return of peaked T waves, a prolonged PR interval and marked widening of the QRS interval to 205 msec; the potassium level was now 10.0 mmol/L (Figure 3).
Despite the patient's renal function being normal, she was emergently dialyzed. After a single dialysis, the patient's potassium level remained normal for the remainder of the hospitalization and a follow‐up ECG returned to baseline (Figure 4). No physiologic explanation was found for her hyperkalemia and it was concluded, despite her denials, that she had taken large quantities of exogenous potassium she had available from previous prescriptions.
A 62‐year‐old woman with an extensive medical and surgical history presented with complaints of 2 days of weakness. Physical examination demonstrated a lethargic, but arousable woman in no distress. Her lower extremity motor strength was 4/5 bilaterally. The patient's electrocardiogram (ECG) demonstrated peaked T waves (Figure 1, arrow), absence of P waves, poor R wave progression and QRS interval widening (Figure 1, 2‐headed arrow.) Serum chemistries revealed a potassium level of 10.4 mmol/L and a creatinine of 0.9 mg/dL.
One ampule of D50, 10 units of insulin, 1 ampule of Calcium gluconate and 1 ampule of sodium bicarbonate were given intravenously along with oral Kayexalate. A repeat ECG showed a return of P waves, narrowing of the QRS interval, improved R wave progression and less peaking of the T waves (Figure 2). A repeat potassium level at that time was 9.2 mmol/L.
Despite continued therapy to lower the potassium, another ECG showed a return of peaked T waves, a prolonged PR interval and marked widening of the QRS interval to 205 msec; the potassium level was now 10.0 mmol/L (Figure 3).
Despite the patient's renal function being normal, she was emergently dialyzed. After a single dialysis, the patient's potassium level remained normal for the remainder of the hospitalization and a follow‐up ECG returned to baseline (Figure 4). No physiologic explanation was found for her hyperkalemia and it was concluded, despite her denials, that she had taken large quantities of exogenous potassium she had available from previous prescriptions.
Iliac vein compression syndrome: An underdiagnosed cause of lower extremity deep venous thrombosis
Hospitalists frequently diagnose and treat lower extremity deep venous thrombosis (DVT). Patients presenting with acute DVT or chronic venous stasis of the left leg can have an underlying anatomic anomaly known as iliac vein compression syndrome (ICS), May‐Thurner syndrome, or Cockett syndrome in Europe. In this condition, the right iliac artery overlies the left iliac vein, causing extrinsic compression of the vein (Figure 1). 1 This compression and accompanying intraluminal changes predisposes patients to left‐sided lower extremity DVT.2 Failure to recognize and treat this anomaly in patients with acute thrombosis can result in serious vascular sequelae and chronic left leg symptoms.3 A high clinical suspicion should be maintained in young individuals presenting with proximal left leg DVT with or without hypercoagulable risk factors. The following report is a case of ICS in a young male recognized and treated early by aggressive diagnostic and therapeutic interventions.
11‐ Grunwald et al.
Case Report
A 19‐year‐old man presented to the ER with sudden onset of left lower extremity swelling and pain 5 days after a fall. He had no known risk factors for DVT. On physical examination his left leg was dusky, swollen, and tender from his groin to his ankle, with good arterial pulses. Duplex ultra‐sonogram of the leg showed a clot in the femoral vein extending up the popliteal vein. Following a venogram, he underwent mechanical thrombectomy and regional thrombolysis. A repeat venogram showed an irregular narrowing of the left iliac vein and a tubular filling defect at the junction of the inferior vena cava and common iliac veins, suggestive of external compression from the right common iliac artery. The patient underwent successful angioplasty and stenting of the common iliac vein. He was treated with intravenous heparin, warfarin and clopidogrel. His hypercoagulable work‐up was inconclusive.
Discussion
In 1956, May and Thurner 1 brought clinical attention to ICS. They hypothesized that an abnormal compression of the left iliac vein by an overriding right iliac arterypresent in 22% of a series of 430 cadaversled to an intraluminal filling defect in the vein. The chronic extrinsic compression and pulsing force from the overlying artery results in endothelial irritation and formation of venous spurs (fibrous vascular lesions) in the intimal layer of the vein.1 Following the principles of Virchow's triad, this endothelial injury propagates the formation of a thrombus. Subsequent studies by Kim et al.4 suggest that there are 3 stages involved in the pathogenesis of thrombosis in ICS: asymptomatic vein compression, venous spur formation, and finally DVT formation.4, 5 It is estimated that 1 to 3 out of 1000 individuals with this malformation develop DVT each year.5, 6
Patients with ICS may present to the emergency or ambulatory setting in either an acute or chronic phase. The acute phase is the actual episode of thrombosis. Symptoms include left leg pain and swelling up to the groin. In rare cases, pulmonary emboli may be the initial presentation. A lifelong chronic phase can follow if undiagnosed, resulting in pain and swelling of the entire left leg, venous claudication, recurrent thrombosis, pigmentation changes, and ulceration. 3
The typical ICS patient is a woman between 18 and 30 years old, 3 possibly due to the developmental changes in the pelvic structures in preparation for child‐bearing.2 Many patients also present after pregnancy; increased lordosis during pregnancy may put additional strain on the anatomic lesion.3 Nevertheless, Steinberg and Jacocks7 reported that out of 127 patients, 38 (30%) were male. Thus, it is critical not to overlook ICS as a possible cause of thrombosis in male patients.
The urgency in diagnosing this anatomic variation lies in the distinct need for more aggressive treatment than that required for a typical DVT. While Doppler ultrasound is typically the first diagnostic test performed in this patient population, it is not specific. For patients with physical exam findings highly suspicious of ICS, venography and magnetic resonance venography are superior modalities to make a definitive diagnosis of the syndrome. 8 In ICS, these studies will reveal left common iliac vein narrowing with intraluminal changes suggestive of spur formation.2
Due to the mechanical nature of ICS pathology, anticoagulation therapy alone is ineffective. ICS prevents recanalization in 70% to 80% of patients and up to 40% will have continued clot propagation. 5, 7 More aggressive treatment using endovascular techniques such as the combination of thrombectomy, angioplasty, and intraluminal stenting have proven to be the most efficacious treatment modality for ICS.9 A study by AbuRahma et al.10 demonstrated that one year following this aggressive combination, patency rate was 83% (vs. 24% following thrombectomy alone).
Conclusion
The anatomic anomaly present in ICS was identified by CT in as many as two‐thirds of an asymptomatic patient population studied by Kibbe et al. 12 Although a common structural anomaly, it is important to note that only 1 to 3 out of 1000 individuals with this malformation develop DVT annually. ICS should be included in the differential diagnosis of all young individuals presenting with proximal left leg DVT with or without hypercoagulable risk factors. If the mechanical compression is not diagnosed and treated, the syndrome can develop into a life‐long chronic phase with multiple complications.2 It is therefore critical that aggressive diagnostic and therapeutic interventions be implemented immediately upon suspicion of ICS.
- , . A vascular spur in the vena iliaca communis sinistra as a cause of predominantly left‐sided thrombosis of the pelvic veins. Z Kreislaufforsch. 1956;45:912–922.
- , , , , . Compression of the left common iliac vein in asymptomatic subjects and patients with left iliofemoral deep vein thrombosis. J Vasc Interv Radiol. 2008;19:366–370; quiz 71.
- . The iliac compression syndrome alias ‘Iliofemoral thrombosis’ or ‘white leg’. Proc R Soc Med. 1966;59:360–361.
- , , . Venographic anatomy, technique and interpretation. Pheripheral Vascular Imaging and Intervention. St. Louis (MO): Mosby‐Year Book; 1992. p. 269–349.
- , , , , . Symptomatic ileofemoral DVT after onset of oral contraceptive use in women with previously undiagnosed May‐Thurner Syndrome. J Vasc Surg. 2009;49:697–703.
- , , . A prospective study of the incidence of deep vein thrombosis within a defined urban population. J Intern Med. 1992;232:152–160.
- , . May‐Thurner syndrome: a previously unreported variant. Ann Vasc Surg. 1993;7:577–581.
- , , , , , . Diagnosis and endovascular treatment of iliocaval compression syndrome. J Vasc Surg. 2001;34:106–113.
- , , , et al. Endovascular management of iliac vein compression (May‐Thurner) syndrome. J Vasc Interv Radiol. 2000;11:823–836.
- , , , . Iliofemoral deep vein thrombosis: conventional therapy versus lysis and percutaneous transluminal angioplasty and stenting. Ann Surg. 2001;233:752–760.
- , , . Endovascular management of May‐Thurner Syndrome. Am J Roentgenol. 2004;183:1523–1524.
- , , , , , . Iliac vein compression in an asymptomatic patient population. J Vasc Surg. 2004:39:937–943.
Hospitalists frequently diagnose and treat lower extremity deep venous thrombosis (DVT). Patients presenting with acute DVT or chronic venous stasis of the left leg can have an underlying anatomic anomaly known as iliac vein compression syndrome (ICS), May‐Thurner syndrome, or Cockett syndrome in Europe. In this condition, the right iliac artery overlies the left iliac vein, causing extrinsic compression of the vein (Figure 1). 1 This compression and accompanying intraluminal changes predisposes patients to left‐sided lower extremity DVT.2 Failure to recognize and treat this anomaly in patients with acute thrombosis can result in serious vascular sequelae and chronic left leg symptoms.3 A high clinical suspicion should be maintained in young individuals presenting with proximal left leg DVT with or without hypercoagulable risk factors. The following report is a case of ICS in a young male recognized and treated early by aggressive diagnostic and therapeutic interventions.
11‐ Grunwald et al.
Case Report
A 19‐year‐old man presented to the ER with sudden onset of left lower extremity swelling and pain 5 days after a fall. He had no known risk factors for DVT. On physical examination his left leg was dusky, swollen, and tender from his groin to his ankle, with good arterial pulses. Duplex ultra‐sonogram of the leg showed a clot in the femoral vein extending up the popliteal vein. Following a venogram, he underwent mechanical thrombectomy and regional thrombolysis. A repeat venogram showed an irregular narrowing of the left iliac vein and a tubular filling defect at the junction of the inferior vena cava and common iliac veins, suggestive of external compression from the right common iliac artery. The patient underwent successful angioplasty and stenting of the common iliac vein. He was treated with intravenous heparin, warfarin and clopidogrel. His hypercoagulable work‐up was inconclusive.
Discussion
In 1956, May and Thurner 1 brought clinical attention to ICS. They hypothesized that an abnormal compression of the left iliac vein by an overriding right iliac arterypresent in 22% of a series of 430 cadaversled to an intraluminal filling defect in the vein. The chronic extrinsic compression and pulsing force from the overlying artery results in endothelial irritation and formation of venous spurs (fibrous vascular lesions) in the intimal layer of the vein.1 Following the principles of Virchow's triad, this endothelial injury propagates the formation of a thrombus. Subsequent studies by Kim et al.4 suggest that there are 3 stages involved in the pathogenesis of thrombosis in ICS: asymptomatic vein compression, venous spur formation, and finally DVT formation.4, 5 It is estimated that 1 to 3 out of 1000 individuals with this malformation develop DVT each year.5, 6
Patients with ICS may present to the emergency or ambulatory setting in either an acute or chronic phase. The acute phase is the actual episode of thrombosis. Symptoms include left leg pain and swelling up to the groin. In rare cases, pulmonary emboli may be the initial presentation. A lifelong chronic phase can follow if undiagnosed, resulting in pain and swelling of the entire left leg, venous claudication, recurrent thrombosis, pigmentation changes, and ulceration. 3
The typical ICS patient is a woman between 18 and 30 years old, 3 possibly due to the developmental changes in the pelvic structures in preparation for child‐bearing.2 Many patients also present after pregnancy; increased lordosis during pregnancy may put additional strain on the anatomic lesion.3 Nevertheless, Steinberg and Jacocks7 reported that out of 127 patients, 38 (30%) were male. Thus, it is critical not to overlook ICS as a possible cause of thrombosis in male patients.
The urgency in diagnosing this anatomic variation lies in the distinct need for more aggressive treatment than that required for a typical DVT. While Doppler ultrasound is typically the first diagnostic test performed in this patient population, it is not specific. For patients with physical exam findings highly suspicious of ICS, venography and magnetic resonance venography are superior modalities to make a definitive diagnosis of the syndrome. 8 In ICS, these studies will reveal left common iliac vein narrowing with intraluminal changes suggestive of spur formation.2
Due to the mechanical nature of ICS pathology, anticoagulation therapy alone is ineffective. ICS prevents recanalization in 70% to 80% of patients and up to 40% will have continued clot propagation. 5, 7 More aggressive treatment using endovascular techniques such as the combination of thrombectomy, angioplasty, and intraluminal stenting have proven to be the most efficacious treatment modality for ICS.9 A study by AbuRahma et al.10 demonstrated that one year following this aggressive combination, patency rate was 83% (vs. 24% following thrombectomy alone).
Conclusion
The anatomic anomaly present in ICS was identified by CT in as many as two‐thirds of an asymptomatic patient population studied by Kibbe et al. 12 Although a common structural anomaly, it is important to note that only 1 to 3 out of 1000 individuals with this malformation develop DVT annually. ICS should be included in the differential diagnosis of all young individuals presenting with proximal left leg DVT with or without hypercoagulable risk factors. If the mechanical compression is not diagnosed and treated, the syndrome can develop into a life‐long chronic phase with multiple complications.2 It is therefore critical that aggressive diagnostic and therapeutic interventions be implemented immediately upon suspicion of ICS.
Hospitalists frequently diagnose and treat lower extremity deep venous thrombosis (DVT). Patients presenting with acute DVT or chronic venous stasis of the left leg can have an underlying anatomic anomaly known as iliac vein compression syndrome (ICS), May‐Thurner syndrome, or Cockett syndrome in Europe. In this condition, the right iliac artery overlies the left iliac vein, causing extrinsic compression of the vein (Figure 1). 1 This compression and accompanying intraluminal changes predisposes patients to left‐sided lower extremity DVT.2 Failure to recognize and treat this anomaly in patients with acute thrombosis can result in serious vascular sequelae and chronic left leg symptoms.3 A high clinical suspicion should be maintained in young individuals presenting with proximal left leg DVT with or without hypercoagulable risk factors. The following report is a case of ICS in a young male recognized and treated early by aggressive diagnostic and therapeutic interventions.
11‐ Grunwald et al.
Case Report
A 19‐year‐old man presented to the ER with sudden onset of left lower extremity swelling and pain 5 days after a fall. He had no known risk factors for DVT. On physical examination his left leg was dusky, swollen, and tender from his groin to his ankle, with good arterial pulses. Duplex ultra‐sonogram of the leg showed a clot in the femoral vein extending up the popliteal vein. Following a venogram, he underwent mechanical thrombectomy and regional thrombolysis. A repeat venogram showed an irregular narrowing of the left iliac vein and a tubular filling defect at the junction of the inferior vena cava and common iliac veins, suggestive of external compression from the right common iliac artery. The patient underwent successful angioplasty and stenting of the common iliac vein. He was treated with intravenous heparin, warfarin and clopidogrel. His hypercoagulable work‐up was inconclusive.
Discussion
In 1956, May and Thurner 1 brought clinical attention to ICS. They hypothesized that an abnormal compression of the left iliac vein by an overriding right iliac arterypresent in 22% of a series of 430 cadaversled to an intraluminal filling defect in the vein. The chronic extrinsic compression and pulsing force from the overlying artery results in endothelial irritation and formation of venous spurs (fibrous vascular lesions) in the intimal layer of the vein.1 Following the principles of Virchow's triad, this endothelial injury propagates the formation of a thrombus. Subsequent studies by Kim et al.4 suggest that there are 3 stages involved in the pathogenesis of thrombosis in ICS: asymptomatic vein compression, venous spur formation, and finally DVT formation.4, 5 It is estimated that 1 to 3 out of 1000 individuals with this malformation develop DVT each year.5, 6
Patients with ICS may present to the emergency or ambulatory setting in either an acute or chronic phase. The acute phase is the actual episode of thrombosis. Symptoms include left leg pain and swelling up to the groin. In rare cases, pulmonary emboli may be the initial presentation. A lifelong chronic phase can follow if undiagnosed, resulting in pain and swelling of the entire left leg, venous claudication, recurrent thrombosis, pigmentation changes, and ulceration. 3
The typical ICS patient is a woman between 18 and 30 years old, 3 possibly due to the developmental changes in the pelvic structures in preparation for child‐bearing.2 Many patients also present after pregnancy; increased lordosis during pregnancy may put additional strain on the anatomic lesion.3 Nevertheless, Steinberg and Jacocks7 reported that out of 127 patients, 38 (30%) were male. Thus, it is critical not to overlook ICS as a possible cause of thrombosis in male patients.
The urgency in diagnosing this anatomic variation lies in the distinct need for more aggressive treatment than that required for a typical DVT. While Doppler ultrasound is typically the first diagnostic test performed in this patient population, it is not specific. For patients with physical exam findings highly suspicious of ICS, venography and magnetic resonance venography are superior modalities to make a definitive diagnosis of the syndrome. 8 In ICS, these studies will reveal left common iliac vein narrowing with intraluminal changes suggestive of spur formation.2
Due to the mechanical nature of ICS pathology, anticoagulation therapy alone is ineffective. ICS prevents recanalization in 70% to 80% of patients and up to 40% will have continued clot propagation. 5, 7 More aggressive treatment using endovascular techniques such as the combination of thrombectomy, angioplasty, and intraluminal stenting have proven to be the most efficacious treatment modality for ICS.9 A study by AbuRahma et al.10 demonstrated that one year following this aggressive combination, patency rate was 83% (vs. 24% following thrombectomy alone).
Conclusion
The anatomic anomaly present in ICS was identified by CT in as many as two‐thirds of an asymptomatic patient population studied by Kibbe et al. 12 Although a common structural anomaly, it is important to note that only 1 to 3 out of 1000 individuals with this malformation develop DVT annually. ICS should be included in the differential diagnosis of all young individuals presenting with proximal left leg DVT with or without hypercoagulable risk factors. If the mechanical compression is not diagnosed and treated, the syndrome can develop into a life‐long chronic phase with multiple complications.2 It is therefore critical that aggressive diagnostic and therapeutic interventions be implemented immediately upon suspicion of ICS.
- , . A vascular spur in the vena iliaca communis sinistra as a cause of predominantly left‐sided thrombosis of the pelvic veins. Z Kreislaufforsch. 1956;45:912–922.
- , , , , . Compression of the left common iliac vein in asymptomatic subjects and patients with left iliofemoral deep vein thrombosis. J Vasc Interv Radiol. 2008;19:366–370; quiz 71.
- . The iliac compression syndrome alias ‘Iliofemoral thrombosis’ or ‘white leg’. Proc R Soc Med. 1966;59:360–361.
- , , . Venographic anatomy, technique and interpretation. Pheripheral Vascular Imaging and Intervention. St. Louis (MO): Mosby‐Year Book; 1992. p. 269–349.
- , , , , . Symptomatic ileofemoral DVT after onset of oral contraceptive use in women with previously undiagnosed May‐Thurner Syndrome. J Vasc Surg. 2009;49:697–703.
- , , . A prospective study of the incidence of deep vein thrombosis within a defined urban population. J Intern Med. 1992;232:152–160.
- , . May‐Thurner syndrome: a previously unreported variant. Ann Vasc Surg. 1993;7:577–581.
- , , , , , . Diagnosis and endovascular treatment of iliocaval compression syndrome. J Vasc Surg. 2001;34:106–113.
- , , , et al. Endovascular management of iliac vein compression (May‐Thurner) syndrome. J Vasc Interv Radiol. 2000;11:823–836.
- , , , . Iliofemoral deep vein thrombosis: conventional therapy versus lysis and percutaneous transluminal angioplasty and stenting. Ann Surg. 2001;233:752–760.
- , , . Endovascular management of May‐Thurner Syndrome. Am J Roentgenol. 2004;183:1523–1524.
- , , , , , . Iliac vein compression in an asymptomatic patient population. J Vasc Surg. 2004:39:937–943.
- , . A vascular spur in the vena iliaca communis sinistra as a cause of predominantly left‐sided thrombosis of the pelvic veins. Z Kreislaufforsch. 1956;45:912–922.
- , , , , . Compression of the left common iliac vein in asymptomatic subjects and patients with left iliofemoral deep vein thrombosis. J Vasc Interv Radiol. 2008;19:366–370; quiz 71.
- . The iliac compression syndrome alias ‘Iliofemoral thrombosis’ or ‘white leg’. Proc R Soc Med. 1966;59:360–361.
- , , . Venographic anatomy, technique and interpretation. Pheripheral Vascular Imaging and Intervention. St. Louis (MO): Mosby‐Year Book; 1992. p. 269–349.
- , , , , . Symptomatic ileofemoral DVT after onset of oral contraceptive use in women with previously undiagnosed May‐Thurner Syndrome. J Vasc Surg. 2009;49:697–703.
- , , . A prospective study of the incidence of deep vein thrombosis within a defined urban population. J Intern Med. 1992;232:152–160.
- , . May‐Thurner syndrome: a previously unreported variant. Ann Vasc Surg. 1993;7:577–581.
- , , , , , . Diagnosis and endovascular treatment of iliocaval compression syndrome. J Vasc Surg. 2001;34:106–113.
- , , , et al. Endovascular management of iliac vein compression (May‐Thurner) syndrome. J Vasc Interv Radiol. 2000;11:823–836.
- , , , . Iliofemoral deep vein thrombosis: conventional therapy versus lysis and percutaneous transluminal angioplasty and stenting. Ann Surg. 2001;233:752–760.
- , , . Endovascular management of May‐Thurner Syndrome. Am J Roentgenol. 2004;183:1523–1524.
- , , , , , . Iliac vein compression in an asymptomatic patient population. J Vasc Surg. 2004:39:937–943.
Stevens‐Johnson and mycoplasma pneumoniae: A scary duo
A 15‐year‐old male was hospitalized with painful blisters on the lips and ulcers in the oral mucosa that were preceded by upper respiratory infection symptoms for 1 week. He had not been treated with antimicrobials. He subsequently developed conjunctival injection and painful blisters at the urethral meatus and symmetric scattered target lesions in the extremities. Examination demonstrated low‐grade fever, mild conjunctival injection (Figure 2), and oral vesicular lesions affecting the lips (Figure 1) and both the hard and soft palate; he had vesicular lesions affecting the glans penis, a ruptured vesicle at the urethral meatus and target lesions in the arms (Figure 3) and legs (Figure 4). His cardiopulmonary exam was normal. He was started on acyclovir and azithromycin, and symptomatic treatment with oral lidocaine and morphine. Serologies for Epstein‐Barr virus (EBV), cytomegalovirus (CMV) and Coxsackievirus and cultures for herpes simplex virus (HSV) were negative. Mycoplasma pneumoniae immunoglobulin G (IgG) and IgM titers were significantly elevated (>4‐fold) and the diagnosis made of Stevens‐Johnson syndrome (SJS) secondary to Mycoplasma pneumoniae infection. He was able to tolerate oral intake after a 1‐week hospital course.
M. pneumoniae infection can cause mucocutaneous involvement varying from mild mucositis to SJS with significant morbidity and mortality, 1, 2 mostly in the pediatric population. The differential diagnosis includes HSV, Kawasaki, and Streptococcal toxic shock syndrome, as well as other viral infections (eg, Coxsackievirus).3 Pharmacologic causesespecially antibiotics, non steroidal anti‐inflammatory drug (NSAIDS) and anticonvulsantsshould also be considered in the etiology of SJS4 especially in the adult population.
- . Erythema multiforme due to Mycoplasma pneumoniae infection in two children. Pediatr Dermatol. 2006;23(6):546–555.
- . Mycoplasma pneumoniae infection complicated by severe mucocutaneous lesions. Lancet Infect Dis. 2008;8:268.
- , , , , , . Mycoplasma pneumoniae and atypical Stevens‐Johnson syndrome: a case series. Pediatrics. 2007;119:e1002–e1005.
- , , , . Mycoplasma pneumoniae associated with Stevens Johnson syndrome. Anaesth Intensive Care. 2007;35:414–417.
A 15‐year‐old male was hospitalized with painful blisters on the lips and ulcers in the oral mucosa that were preceded by upper respiratory infection symptoms for 1 week. He had not been treated with antimicrobials. He subsequently developed conjunctival injection and painful blisters at the urethral meatus and symmetric scattered target lesions in the extremities. Examination demonstrated low‐grade fever, mild conjunctival injection (Figure 2), and oral vesicular lesions affecting the lips (Figure 1) and both the hard and soft palate; he had vesicular lesions affecting the glans penis, a ruptured vesicle at the urethral meatus and target lesions in the arms (Figure 3) and legs (Figure 4). His cardiopulmonary exam was normal. He was started on acyclovir and azithromycin, and symptomatic treatment with oral lidocaine and morphine. Serologies for Epstein‐Barr virus (EBV), cytomegalovirus (CMV) and Coxsackievirus and cultures for herpes simplex virus (HSV) were negative. Mycoplasma pneumoniae immunoglobulin G (IgG) and IgM titers were significantly elevated (>4‐fold) and the diagnosis made of Stevens‐Johnson syndrome (SJS) secondary to Mycoplasma pneumoniae infection. He was able to tolerate oral intake after a 1‐week hospital course.
M. pneumoniae infection can cause mucocutaneous involvement varying from mild mucositis to SJS with significant morbidity and mortality, 1, 2 mostly in the pediatric population. The differential diagnosis includes HSV, Kawasaki, and Streptococcal toxic shock syndrome, as well as other viral infections (eg, Coxsackievirus).3 Pharmacologic causesespecially antibiotics, non steroidal anti‐inflammatory drug (NSAIDS) and anticonvulsantsshould also be considered in the etiology of SJS4 especially in the adult population.
A 15‐year‐old male was hospitalized with painful blisters on the lips and ulcers in the oral mucosa that were preceded by upper respiratory infection symptoms for 1 week. He had not been treated with antimicrobials. He subsequently developed conjunctival injection and painful blisters at the urethral meatus and symmetric scattered target lesions in the extremities. Examination demonstrated low‐grade fever, mild conjunctival injection (Figure 2), and oral vesicular lesions affecting the lips (Figure 1) and both the hard and soft palate; he had vesicular lesions affecting the glans penis, a ruptured vesicle at the urethral meatus and target lesions in the arms (Figure 3) and legs (Figure 4). His cardiopulmonary exam was normal. He was started on acyclovir and azithromycin, and symptomatic treatment with oral lidocaine and morphine. Serologies for Epstein‐Barr virus (EBV), cytomegalovirus (CMV) and Coxsackievirus and cultures for herpes simplex virus (HSV) were negative. Mycoplasma pneumoniae immunoglobulin G (IgG) and IgM titers were significantly elevated (>4‐fold) and the diagnosis made of Stevens‐Johnson syndrome (SJS) secondary to Mycoplasma pneumoniae infection. He was able to tolerate oral intake after a 1‐week hospital course.
M. pneumoniae infection can cause mucocutaneous involvement varying from mild mucositis to SJS with significant morbidity and mortality, 1, 2 mostly in the pediatric population. The differential diagnosis includes HSV, Kawasaki, and Streptococcal toxic shock syndrome, as well as other viral infections (eg, Coxsackievirus).3 Pharmacologic causesespecially antibiotics, non steroidal anti‐inflammatory drug (NSAIDS) and anticonvulsantsshould also be considered in the etiology of SJS4 especially in the adult population.
- . Erythema multiforme due to Mycoplasma pneumoniae infection in two children. Pediatr Dermatol. 2006;23(6):546–555.
- . Mycoplasma pneumoniae infection complicated by severe mucocutaneous lesions. Lancet Infect Dis. 2008;8:268.
- , , , , , . Mycoplasma pneumoniae and atypical Stevens‐Johnson syndrome: a case series. Pediatrics. 2007;119:e1002–e1005.
- , , , . Mycoplasma pneumoniae associated with Stevens Johnson syndrome. Anaesth Intensive Care. 2007;35:414–417.
- . Erythema multiforme due to Mycoplasma pneumoniae infection in two children. Pediatr Dermatol. 2006;23(6):546–555.
- . Mycoplasma pneumoniae infection complicated by severe mucocutaneous lesions. Lancet Infect Dis. 2008;8:268.
- , , , , , . Mycoplasma pneumoniae and atypical Stevens‐Johnson syndrome: a case series. Pediatrics. 2007;119:e1002–e1005.
- , , , . Mycoplasma pneumoniae associated with Stevens Johnson syndrome. Anaesth Intensive Care. 2007;35:414–417.
New Research Target
A report in this month’s Journal of Hospital Medicine shows macrolide and quinolone antibiotics are associated with similar rates of treatment failure in acute exacerbation of chronic pulmonary disease (AECOPD). The lead author says the study could be a precursor to, say, an intrepid HM researcher working on a randomized trial of the antibiotics’ effectiveness.
“It’s a perfect thing for hospitalists to study because they’re the ones treating it,” says Michael Rothberg, MD, MPH, associate professor of medicine at Tufts University School of Medicine in Boston, and lead author of "Comparative Effectiveness of Macrolides and Quinolones for Patients Hospitalized with Acute Exacerbations of Chronic Obstructive Pulmonary Disease (AECOPD)."
The retrospective cohort review reported that out of nearly 20,000 patients, 6,139 (31%) were treated initially with a macrolide and 13,469 (69%) with a quinolone. “Those who received macrolides had a lower risk of treatment failure (6.8% vs. 8.1%, p<0.01), a finding that was attenuated after multivariable adjustment (OR=0.89, 95% CI 0.78-1.01), and disappeared in a grouped-treatment analysis (OR=1.01, 95% CI 0.75-1.35),” the authors wrote. The study found no differences in adjusted length of stay or cost. However, antibiotic-associated diarrhea was more common with quinolones (1.2% vs. 0.6%, p<0.001).
Dr. Rothberg, who is affiliated with the Center for Quality of Care Research at Baystate Medical Center in Springfield, Mass., says the data, while a point in the right direction, should be viewed as a first step in doing more search to determine the best treatment for AECOPD.
“If you look at the guidelines, the recommendations are all over the map,” Dr. Rothberg says. “This is really because there are no randomized trials in COPD patients. … There are so many unanswered questions. There’s been so much focus on pneumonia, heart failure, and acute myocardial infarction. COPD kind of has a dearth of research.”
Dr. Rothberg hopes to further that research via the COPD Outcomes-Based Network for Clinical Effectiveness & Research Translation (CONCERT), a team of physicians and researchers from centers around the country who are advocating for improvements to COPD treatment. Baystate is one of CONCERT’s outposts.
A report in this month’s Journal of Hospital Medicine shows macrolide and quinolone antibiotics are associated with similar rates of treatment failure in acute exacerbation of chronic pulmonary disease (AECOPD). The lead author says the study could be a precursor to, say, an intrepid HM researcher working on a randomized trial of the antibiotics’ effectiveness.
“It’s a perfect thing for hospitalists to study because they’re the ones treating it,” says Michael Rothberg, MD, MPH, associate professor of medicine at Tufts University School of Medicine in Boston, and lead author of "Comparative Effectiveness of Macrolides and Quinolones for Patients Hospitalized with Acute Exacerbations of Chronic Obstructive Pulmonary Disease (AECOPD)."
The retrospective cohort review reported that out of nearly 20,000 patients, 6,139 (31%) were treated initially with a macrolide and 13,469 (69%) with a quinolone. “Those who received macrolides had a lower risk of treatment failure (6.8% vs. 8.1%, p<0.01), a finding that was attenuated after multivariable adjustment (OR=0.89, 95% CI 0.78-1.01), and disappeared in a grouped-treatment analysis (OR=1.01, 95% CI 0.75-1.35),” the authors wrote. The study found no differences in adjusted length of stay or cost. However, antibiotic-associated diarrhea was more common with quinolones (1.2% vs. 0.6%, p<0.001).
Dr. Rothberg, who is affiliated with the Center for Quality of Care Research at Baystate Medical Center in Springfield, Mass., says the data, while a point in the right direction, should be viewed as a first step in doing more search to determine the best treatment for AECOPD.
“If you look at the guidelines, the recommendations are all over the map,” Dr. Rothberg says. “This is really because there are no randomized trials in COPD patients. … There are so many unanswered questions. There’s been so much focus on pneumonia, heart failure, and acute myocardial infarction. COPD kind of has a dearth of research.”
Dr. Rothberg hopes to further that research via the COPD Outcomes-Based Network for Clinical Effectiveness & Research Translation (CONCERT), a team of physicians and researchers from centers around the country who are advocating for improvements to COPD treatment. Baystate is one of CONCERT’s outposts.
A report in this month’s Journal of Hospital Medicine shows macrolide and quinolone antibiotics are associated with similar rates of treatment failure in acute exacerbation of chronic pulmonary disease (AECOPD). The lead author says the study could be a precursor to, say, an intrepid HM researcher working on a randomized trial of the antibiotics’ effectiveness.
“It’s a perfect thing for hospitalists to study because they’re the ones treating it,” says Michael Rothberg, MD, MPH, associate professor of medicine at Tufts University School of Medicine in Boston, and lead author of "Comparative Effectiveness of Macrolides and Quinolones for Patients Hospitalized with Acute Exacerbations of Chronic Obstructive Pulmonary Disease (AECOPD)."
The retrospective cohort review reported that out of nearly 20,000 patients, 6,139 (31%) were treated initially with a macrolide and 13,469 (69%) with a quinolone. “Those who received macrolides had a lower risk of treatment failure (6.8% vs. 8.1%, p<0.01), a finding that was attenuated after multivariable adjustment (OR=0.89, 95% CI 0.78-1.01), and disappeared in a grouped-treatment analysis (OR=1.01, 95% CI 0.75-1.35),” the authors wrote. The study found no differences in adjusted length of stay or cost. However, antibiotic-associated diarrhea was more common with quinolones (1.2% vs. 0.6%, p<0.001).
Dr. Rothberg, who is affiliated with the Center for Quality of Care Research at Baystate Medical Center in Springfield, Mass., says the data, while a point in the right direction, should be viewed as a first step in doing more search to determine the best treatment for AECOPD.
“If you look at the guidelines, the recommendations are all over the map,” Dr. Rothberg says. “This is really because there are no randomized trials in COPD patients. … There are so many unanswered questions. There’s been so much focus on pneumonia, heart failure, and acute myocardial infarction. COPD kind of has a dearth of research.”
Dr. Rothberg hopes to further that research via the COPD Outcomes-Based Network for Clinical Effectiveness & Research Translation (CONCERT), a team of physicians and researchers from centers around the country who are advocating for improvements to COPD treatment. Baystate is one of CONCERT’s outposts.
In the Literature: Research You Need to Know
Clinical question: Is glucose variability associated with increased mortality independent of mean glucose values in intensive-care-unit (ICU) patients on a strict glucose-control algorithm?
Background: Initial studies demonstrating that strict glycemic control in the ICU improves mortality have not been reproduced in more recent trials and meta-analyses. This inconsistency may be due to unstudied aspects of glycemic control, such as glucose variability.
Study design: Retrospective cohort.
Setting: Eighteen-bed medical/surgical ICU in a teaching hospital in Amsterdam, Netherlands.
Synopsis: Data were collected on 5,728 patients admitted to the ICU from January 2004 to December 2007, all of whom were treated with a computerized intensive insulin protocol. Mean glucose, standard deviation in glucose, and mean absolute glucose change per hour (glucose variability) were calculated for each patient stay in the ICU. The results from these three calculated values were divided into quartiles and evaluated for their predictive value of ICU death and in-hospital death.
Within each mean glucose quartile, the uppermost glucose variability quartile was associated with increased risk of death. Compared with the lowest glucose variability quartile, the highest quartile had a 3.3-fold increased risk of ICU death and a 2.8-fold increased risk of in-hospital death. Patients in the highest glucose quartile with the highest glucose variability had a 12.4-fold increased risk of ICU death.
Bottom line: High glucose variability is associated with increased ICU and in-hospital mortality independent of mean glucose values in patients on a strict glucose control algorithm.
Reviewed for TH eWire by Dimitriy Levin, MD, Jeffrey Carter, MD, Erin Egan, MD, JD, Jonathan Pell, MD, Laura Rosenthal, MSN, ACNP, Nichole Zehnder, MD, Hospital Medicine Group, University of Colorado Denver
For more reviews of HM-related literature, visit our website.
Clinical question: Is glucose variability associated with increased mortality independent of mean glucose values in intensive-care-unit (ICU) patients on a strict glucose-control algorithm?
Background: Initial studies demonstrating that strict glycemic control in the ICU improves mortality have not been reproduced in more recent trials and meta-analyses. This inconsistency may be due to unstudied aspects of glycemic control, such as glucose variability.
Study design: Retrospective cohort.
Setting: Eighteen-bed medical/surgical ICU in a teaching hospital in Amsterdam, Netherlands.
Synopsis: Data were collected on 5,728 patients admitted to the ICU from January 2004 to December 2007, all of whom were treated with a computerized intensive insulin protocol. Mean glucose, standard deviation in glucose, and mean absolute glucose change per hour (glucose variability) were calculated for each patient stay in the ICU. The results from these three calculated values were divided into quartiles and evaluated for their predictive value of ICU death and in-hospital death.
Within each mean glucose quartile, the uppermost glucose variability quartile was associated with increased risk of death. Compared with the lowest glucose variability quartile, the highest quartile had a 3.3-fold increased risk of ICU death and a 2.8-fold increased risk of in-hospital death. Patients in the highest glucose quartile with the highest glucose variability had a 12.4-fold increased risk of ICU death.
Bottom line: High glucose variability is associated with increased ICU and in-hospital mortality independent of mean glucose values in patients on a strict glucose control algorithm.
Reviewed for TH eWire by Dimitriy Levin, MD, Jeffrey Carter, MD, Erin Egan, MD, JD, Jonathan Pell, MD, Laura Rosenthal, MSN, ACNP, Nichole Zehnder, MD, Hospital Medicine Group, University of Colorado Denver
For more reviews of HM-related literature, visit our website.
Clinical question: Is glucose variability associated with increased mortality independent of mean glucose values in intensive-care-unit (ICU) patients on a strict glucose-control algorithm?
Background: Initial studies demonstrating that strict glycemic control in the ICU improves mortality have not been reproduced in more recent trials and meta-analyses. This inconsistency may be due to unstudied aspects of glycemic control, such as glucose variability.
Study design: Retrospective cohort.
Setting: Eighteen-bed medical/surgical ICU in a teaching hospital in Amsterdam, Netherlands.
Synopsis: Data were collected on 5,728 patients admitted to the ICU from January 2004 to December 2007, all of whom were treated with a computerized intensive insulin protocol. Mean glucose, standard deviation in glucose, and mean absolute glucose change per hour (glucose variability) were calculated for each patient stay in the ICU. The results from these three calculated values were divided into quartiles and evaluated for their predictive value of ICU death and in-hospital death.
Within each mean glucose quartile, the uppermost glucose variability quartile was associated with increased risk of death. Compared with the lowest glucose variability quartile, the highest quartile had a 3.3-fold increased risk of ICU death and a 2.8-fold increased risk of in-hospital death. Patients in the highest glucose quartile with the highest glucose variability had a 12.4-fold increased risk of ICU death.
Bottom line: High glucose variability is associated with increased ICU and in-hospital mortality independent of mean glucose values in patients on a strict glucose control algorithm.
Reviewed for TH eWire by Dimitriy Levin, MD, Jeffrey Carter, MD, Erin Egan, MD, JD, Jonathan Pell, MD, Laura Rosenthal, MSN, ACNP, Nichole Zehnder, MD, Hospital Medicine Group, University of Colorado Denver
For more reviews of HM-related literature, visit our website.
Insurance Status and Hospital Care
With about 1 in 5 working‐age Americans (age 18‐64 years) currently uninsured and a large number relying on Medicaid, adequate access to quality health care services is becoming increasingly difficult.1 Substantial literature has accumulated over the years suggesting that access and quality in health care are closely linked to an individual's health insurance status.211 Some studies indicate that being uninsured or publicly insured is associated with negative health consequences.12, 13 Although the Medicaid program has improved access for qualifying low‐income individuals, significant gaps in access and quality remain.2, 5, 11, 1419 These issues are likely to become more pervasive should there be further modifications to state Medicaid funding in response to the unfolding economic crisis.
Although numerous studies have focused on insurance‐related disparities in the outpatient setting, few nationally representative studies have examined such disparities among hospitalized patients. A cross‐sectional study of a large hospital database from 1987 reported higher risk‐adjusted in‐hospital mortality, shorter length of stay (LOS), and lower procedure use among uninsured patients.9 A more recent analysis, limited to patients admitted with stroke, reported significant variation in hospital care associated with insurance status.15 Other studies reporting myocardial infarction registry and quality improvement program data are biased by the self‐selection of large urban teaching hospitals.1618 To our knowledge, no nationally representative study has focused on the impact of insurance coverage on hospital care for common medical conditions among working‐age Americans, the fastest growing segment of the uninsured population.
To address this gap in knowledge, we analyzed a nationally representative hospital database to determine whether there are significant insurance‐related disparities in in‐hospital mortality, LOS, and cost per hospitalization for 3 common medical conditions among working‐age adults, and, if present, to determine whether these disparities are due to differences in disease severity and comorbidities, and whether these disparities are affected by the proportion of uninsured and Medicaid patients receiving care in each hospital.
Methods
Design and Subjects
We examined data from the 2005 Nationwide Inpatient Sample (NIS), a nationally representative database of hospital inpatient stays maintained by the Agency for Healthcare Research and Quality (AHRQ) as part of the Healthcare Cost and Utilization Project (HCUP).20, 21 The NIS is a stratified probability sample of 20% of all US community hospitals, including public hospitals, academic medical centers, and specialty hospitals. Long‐term care hospitals, psychiatric hospitals, and alcoholism/chemical‐dependency treatment facilities are excluded. The 2005 NIS contains data on 7,995,048 discharges from 1054 hospitals located in 37 States and is designed to be representative of all acute care discharges from all US community hospitals.21
We identified discharges with a principal diagnosis of acute myocardial infarction (AMI), stroke, and pneumonia using International Classification of Diseases, 9th Revision, Clinical Modification (ICD‐9‐CM) codes specified in the AHRQ definitions of Inpatient Quality Indicators (Supporting Information Appendix).22 These 3 conditions are among the leading causes of noncancer inpatient deaths in patients under 65 years old,23 and evidence suggests that high mortality may be associated with deficiencies in the quality of inpatient care.24
We confined our analysis to patients 18 to 64 years of age, since this population is most at risk of being uninsured or underinsured.25 We excluded pregnant women because they account for an unusually high proportion of uninsured discharges and were relatively few in our cohort.26 In addition, we excluded patients transferred to another acute care hospital and patients missing payer source and discharge disposition. Our study protocol was approved by the Partners Human Research Committee.
Study Variables
We categorized insurance status as privately insured, uninsured, Medicaid, or Medicare. We defined privately insured patients as those having either Blue Cross or another commercial carrier listed as the primary payer and uninsured patients as those having either no charge or self‐pay listed as the primary payer.27 Other governmental payer categories were noted to share several characteristics with Medicare patients and comprised only a small proportion of the sample, and were thus included with Medicare. In order to account for NIS's sampling scheme and accurately apply sample weights in our analysis, we used Medicare as a separate category. However, since Medicare patients age 18 to 64 years represent a fundamentally different population that is primarily disabled or very ill, only results of privately insured, uninsured, and Medicaid patients are reported.
We selected in‐hospital mortality as the outcome measure and LOS and cost per hospitalization as measures of resource utilization. The NIS includes a binary indicator variable for in‐hospital mortality and specifies inpatient LOS in integers, with same‐day stays coded as 0. NIS's cost estimates are based on hospital cost reports submitted to the Centers for Medicare and Medicaid Services. To test the validity of our cost analyses, we performed parallel analyses using hospital charges as a measure of utilization (charges include hospital overhead, charity care, and bad debt). The resulting adjusted ratios differed little from cost ratios and we opted to report only the details of our cost analyses.
In order to assess the independent association between insurance status and the outcome measures listed above, we selected covariates for inclusion in multivariable models based on the existing literature. Patient covariates included: age group (18‐34 years, 35‐49 years, 50‐64 years), sex (male/female), race/ethnicity (non‐Hispanic white, non‐Hispanic black, Hispanic, other, missing), median income by zip code of residence (less than $37,000, $37,000‐$45,999, $46,000‐$60,999, $61,000 or more), admission through the emergency department (yes/no), admission on a weekend (yes/no), measures of disease severity, and comorbidity indicators. Measures of disease severity specific to each outcome are assigned in the NIS using criteria developed by Medstat (Medstat Disease Staging Software Version 5.2, Thomson Medstat Inc., Ann Arbor, MI). Severity is categorized into 5 levels, with a higher level indicating greater risk. We recorded comorbidities for each patient in our sample using HCUP Comorbidity Software, Version 3.2 (
Hospital covariates included: bed size (small, medium, large), ownership/control (private, government, private or government), geographic region (northeast, midwest, south, west), teaching status (teaching, non‐teaching), and the proportion of uninsured and Medicaid patients (combined) admitted to each hospital for AMI, stroke, or pneumonia. The actual number of hospital beds in each bed size category varies according to a hospital's geographic region and teaching status.27 Ownership/control, geographic region, and teaching status are assigned according to information from the American Hospital Association Annual Survey of Hospitals. The proportion of uninsured and Medicaid patients admitted to each hospital was found to have a nonmonotonic relationship with the outcomes being assessed and was thus treated as a 6‐level categorical variable with the following levels: 0% to 10%, 11% to 20%, 21% to 30%, 31% to 40%, 41% to 50%, and 51% to 100%.
Statistical Analysis
Summary statistics were constructed at the patient level and differences in proportions were evaluated with the chi‐square test. We employed direct standardization, using the age and sex distribution of the entire cohort, to compute age‐standardized and sex‐standardized estimates for each insurance group and compared them using the chi‐square test for in‐hospital mortality and t test for log transformed LOS and cost per hospitalization. For each condition, we developed multivariable logistic regression models for in‐hospital mortality and multivariable linear regression models for log transformed LOS and cost. The patient was the unit of analysis in all models.
In order to elucidate the contribution of disease severity and comorbidities and the proportion of uninsured and Medicaid patients admitted to each hospital, we fitted 3 sequential models for each outcome measure: Model 1 adjusted for patient sociodemographic characteristics and hospital characteristics with the exception of the covariate for the proportion of uninsured and Medicaid patients, Model 2 adjusted for all covariates in the preceding model as well as patients' comorbidities and severity of principal diagnosis, and Model 3 adjusted for all previously mentioned covariates as well as the proportion of uninsured and Medicaid patients admitted to each hospital. We excluded patients who died during hospitalization from the models for LOS and cost. We exponentiated the effect estimates from the log transformed linear regression models so that the adjusted ratio represents the percentage change in the mean LOS or mean cost.
To determine whether the association between patients' insurance status and in‐hospital mortality was modified by seeking care in hospitals treating a smaller or larger proportion of uninsured and Medicaid patients, we entered an interaction term for insurance status and proportion of uninsured and Medicaid patients in the final models (Model 3) for our primary outcome of in‐hospital mortality. However, since no significant interaction was found for any of the 3 conditions, this term was removed from the models and results from the interaction models are not described. In order to assess model specification for the linear regression models, we evaluated the normality of model residuals and found that these were approximately normally distributed. Lastly, we attempted to test the robustness of our analyses by creating fixed effects models that controlled for hospital site but were unable to do so due to the computational limitations of available software packages that could not render fixed effects models with more than 1000 hospital sites.
For all variables except race/ethnicity, data were missing for less than 3% of patients, so we excluded these individuals from adjusted analyses. However, race/ethnicity data were missing for 29% of the sample and were analyzed in 3 different ways, namely, with the missing data treated as a separate covariate level, with the missing data removed from the analysis, and with the missing data assigned to the majority covariate level (white race). The results of our analysis were unchanged no matter how the missing values were assigned. As a result, missing values for race/ethnicity were treated as a separate covariate level in the final analysis.15 Sociodemographic characteristics of patients with missing race/ethnicity information were similar to those with complete data.
We used SUDAAN (Release 9.0.1, Research Triangle Institute, NC) to account for NIS's sampling scheme and generalized estimating equations to adjust for the clustering of patients within hospitals and hospitals within sampling strata.29 In order to account for NIS's stratified probability sampling scheme, SUDAAN uses Taylor series linearization for robust variance estimation of descriptive statistics and regression parameters.30, 31 We present 2‐tailed P values or 95% confidence intervals (CIs) for all statistical comparisons.
Results
Patient and Hospital Characteristics
The final cohort comprised of 154,381 patients discharged from 1018 hospitals in 37 states during calendar year 2005 (Table 1). This cohort was representative of 755,346 working‐age Americans, representing approximately 225,947 cases of AMI (29.9%), 151,812 cases of stroke (20.1%), and 377,588 cases of pneumonia (50.0%). Of these patients, 47.5% were privately insured, 12.0% were uninsured, 17.0% received Medicaid, and 23.5% were assigned to Medicare. Compared with the privately insured, uninsured and Medicaid patients were generally younger, less likely to be white, more likely to have lower income, and more likely to be admitted through the emergency department. Of the 1018 hospitals included in our study, close to half (44.3%) were small, with bedsize ranging from 24 to 249. A large number of hospitals were located in the South (39.9%), and 14.9% were designated teaching hospitals.
| Characteristic* | Privately insured (n = 73,256) | Uninsured (n = 18,531) | Medicaid (n = 26,222) |
|---|---|---|---|
| |||
| Principal diagnosis (%) | |||
| Acute myocardial infarction | 36.7 | 31.2 | 19.7 |
| Stroke | 20.6 | 23.7 | 19.9 |
| Pneumonia | 42.7 | 45.2 | 60.4 |
| Age group (%) | |||
| 18‐34 years | 6.8 | 13.0 | 13.7 |
| 35‐49 years | 27.6 | 36.9 | 33.2 |
| 50‐64 years | 65.7 | 50.1 | 53.2 |
| Male sex (%) | 59.3 | 62.3 | 46.6 |
| Race or ethnicity (%) | |||
| White | 55.7 | 41.5 | 38.0 |
| Black | 7.6 | 14.8 | 16.6 |
| Hispanic | 4.8 | 10.5 | 10.4 |
| Other race | 3.6 | 4.7 | 5.2 |
| Missing | 28.4 | 29.0 | 29.7 |
| Median income by ZIP code (%) | |||
| <$37,000 | 21.5 | 36.7 | 43.0 |
| $37,000‐$45,999 | 25.2 | 27.8 | 27.1 |
| $46,000‐$60,999 | 26.3 | 20.3 | 17.6 |
| $61,000 | 24.8 | 11.5 | 8.4 |
| Emergency admission (%) | 63.3 | 75.6 | 72.9 |
| Weekend admission (%) | 24.5 | 26.2 | 25.1 |
| Hospital bed size (%) | |||
| Small | 8.9 | 10.3 | 11.4 |
| Medium | 24.0 | 22.3 | 25.9 |
| Large | 67.1 | 67.5 | 62.8 |
| Hospital control (%) | |||
| Private | 33.8 | 34.8 | 34.4 |
| Government (nonfederal) | 6.7 | 9.7 | 8.3 |
| Private or government | 59.5 | 55.5 | 57.3 |
| Hospital region (%) | |||
| Northeast | 17.4 | 12.5 | 17.6 |
| Midwest | 25.7 | 19.4 | 20.9 |
| South | 39.5 | 56.8 | 42.4 |
| West | 17.4 | 11.3 | 19.2 |
| Teaching hospital (%) | 41.7 | 43.8 | 43.3 |
Compared with privately insured patients, a larger proportion of uninsured and Medicaid patients had higher predicted mortality levels (Table 2). Medicaid patients had a disproportionately higher predicted LOS, whereas predicted resource demand was higher among privately insured patients. Hypertension (48%), chronic pulmonary disease (29.5%), and uncomplicated diabetes (21.5%) were the 3 most common comorbidities in the study cohort, with a generally higher prevalence of comorbidities among Medicaid patients.
| Characteristic* | Privately insured (n = 73,256) | Uninsured (n = 18,531) | Medicaid (n = 26,222) |
|---|---|---|---|
| |||
| Medstat disease staging (%) | |||
| Mortality level 1 | 50.8 | 45.4 | 36.7 |
| Mortality level 2 | 44.0 | 49.1 | 56.7 |
| Mortality level 3 | 5.3 | 5.5 | 6.7 |
| Length of stay level 1 | 66.8 | 71.6 | 53.8 |
| Length of stay level 2 | 28.5 | 24.5 | 39.3 |
| Length of stay level 3 | 4.8 | 3.8 | 6.9 |
| Resource demand level 1 | 45.2 | 54.2 | 48.5 |
| Resource demand level 2 | 40.5 | 34.2 | 39.2 |
| Resource demand level 3 | 14.2 | 11.7 | 12.3 |
| Coexisting medical conditions (%) | |||
| Congestive heart failure | 4.7 | 4.8 | 10.1 |
| Valvular disease | 2.8 | 2.0 | 2.7 |
| Pulmonary circulation disease | 0.8 | 0.6 | 1.5 |
| Peripheral vascular disease | 3.2 | 2.2 | 3.2 |
| Paralysis | 1.2 | 0.8 | 3.5 |
| Other neurological disorders | 2.4 | 1.9 | 7.3 |
| Chronic pulmonary disease | 23.6 | 22.4 | 37.7 |
| Uncomplicated diabetes | 19.6 | 18.6 | 23.4 |
| Complicated diabetes | 3.3 | 2.1 | 4.9 |
| Hypothyroidism | 5.6 | 2.7 | 4.7 |
| Renal failure | 3.0 | 1.9 | 5.6 |
| Liver disease | 1.6 | 2.5 | 4.4 |
| Peptic ulcer disease | <0.5 | <0.5 | <0.5 |
| AIDS | 0.1 | 0.1 | 0.4 |
| Lymphoma | 1.1 | 0.4 | 0.6 |
| Metastatic cancer | 2.1 | 0.7 | 2.2 |
| Non‐metastatic solid tumor | 1.5 | 0.8 | 2.1 |
| Collagen vascular diseases | 2.3 | 0.9 | 2.3 |
| Coagulopathy | 2.7 | 2.4 | 3.4 |
| Obesity | 10.3 | 8.2 | 9.3 |
| Weight loss | 1.6 | 1.8 | 3.3 |
| Fluid and electrolyte disorders | 18.3 | 19.4 | 23.8 |
| Chronic blood loss anemia | 0.6 | 0.6 | 0.8 |
| Deficiency anemias | 8.6 | 8.5 | 13.4 |
| Alcohol abuse | 3.3 | 9.8 | 8.3 |
| Drug abuse | 1.9 | 10.2 | 9.8 |
| Psychoses | 1.5 | 1.9 | 6.8 |
| Depression | 7.2 | 4.8 | 9.9 |
| Hypertension | 48.0 | 44.1 | 45.7 |
In‐Hospital Mortality
Compared with the privately insured, age‐standardized and sex‐standardized in‐hospital mortality for AMI and stroke was significantly higher for uninsured and Medicaid patients (Table 3). Among pneumonia patients, Medicaid recipients had significantly higher in‐hospital mortality compared with privately insured and uninsured patients.
| Privately Insured | Uninsured | Medicaid | |
|---|---|---|---|
| |||
| In‐hospital mortality, rate per 100 discharges (SE) | |||
| Acute myocardial infarction | 2.22 (0.10) | 4.03 (0.31)* | 4.57 (0.34)* |
| Stroke | 7.49 (0.27) | 10.46 (0.64)* | 9.89 (0.45)* |
| Pneumonia | 1.75 (0.09) | 1.74 (0.18) | 2.48 (0.14)* |
| Length of stay, mean (SE), days | |||
| Acute myocardial infarction | 4.17 (0.06) | 4.46 (0.09) | 5.85 (0.16) |
| Stroke | 6.37 (0.13) | 7.15 (0.25) | 9.28 (0.30) |
| Pneumonia | 4.89 (0.05) | 4.64 (0.10) | 5.80 (0.08) |
| Cost per episode, mean (SE), dollars | |||
| Acute myocardial infarction | 21,077 (512) | 19,977 (833) | 22,452 (841) |
| Stroke | 16,022 (679) | 14,571 (1,036) | 18,462 (824) |
| Pneumonia | 8,223 (192) | 7,086 (293) | 9,479 (271) |
After multivariable adjustment for additional patient and hospital characteristics, uninsured AMI and stroke patients continued to have significantly higher in‐hospital mortality compared with the privately insured (Table 4). Among pneumonia patients, Medicaid recipients persisted in having significantly higher in‐hospital mortality than the privately insured.
| Model 1* | Model 2 | Model 3 | |
|---|---|---|---|
| |||
| In‐hospital mortality, adjusted odds ratio (95% CI) | |||
| Acute Myocardial Infarction | |||
| Uninsured vs. privately insured | 1.59 (1.35‐1.88) | 1.58 (1.30‐1.93) | 1.52 (1.24‐1.85) |
| Medicaid vs. privately insured | 1.83 (1.54‐2.18) | 1.22 (0.99‐1.50) | 1.15 (0.94‐1.42) |
| Stroke | |||
| Uninsured vs. privately insured | 1.56 (1.35‐1.80) | 1.50 (1.30‐1.73) | 1.49 (1.29‐1.72) |
| Medicaid vs. privately insured | 1.32 (1.15‐1.52) | 1.09 (0.93‐1.27) | 1.08 (0.93‐1.26) |
| Pneumonia | |||
| Uninsured vs. privately insured | 0.99 (0.81‐1.21) | 1.12 (0.91‐1.39) | 1.10 (0.89‐1.36) |
| Medicaid vs. privately insured | 1.41 (1.20‐1.65) | 1.24 (1.04‐1.48) | 1.21 (1.01‐1.45) |
| Length of stay, adjusted ratio (95% CI)| | |||
| Acute Myocardial Infarction | |||
| Uninsured vs. privately insured | 1.00 (0.98‐1.02) | 1.00 (0.98‐1.02) | 1.00 (0.98‐1.02) |
| Medicaid vs. privately insured | 1.17 (1.14‐1.21) | 1.07 (1.05‐1.09) | 1.07 (1.05‐1.09) |
| Stroke | |||
| Uninsured vs. privately insured | 1.06 (1.02‐1.10) | 1.08 (1.04‐1.11) | 1.07 (1.04‐1.11) |
| Medicaid vs. privately insured | 1.30 (1.26‐1.34) | 1.17 (1.14‐1.20) | 1.17 (1.14‐1.20) |
| Pneumonia | |||
| Uninsured vs. privately insured | 0.95 (0.93‐0.97) | 0.96 (0.94‐0.99) | 0.96 (0.94‐0.98) |
| Medicaid vs. privately insured | 1.15 (1.13‐1.17) | 1.04 (1.03‐1.06) | 1.04 (1.03‐1.06) |
| Cost per episode, adjusted ratio (95% CI)| | |||
| Acute Myocardial Infarction | |||
| Uninsured vs. privately insured | 0.97 (0.95‐0.99) | 0.99 (0.97‐1.00) | 0.99 (0.97‐1.00) |
| Medicaid vs. privately insured | 1.01 (0.98‐1.04) | 0.99 (0.97‐1.01) | 0.99 (0.97‐1.01) |
| Stroke | |||
| Uninsured vs. privately insured | 0.97 (0.93‐1.02) | 1.00 (0.96‐1.03) | 1.00 (0.97‐1.03) |
| Medicaid vs. privately insured | 1.17 (1.13‐1.21) | 1.06 (1.04‐1.09) | 1.06 (1.04‐1.09) |
| Pneumonia | |||
| Uninsured vs. privately insured | 0.95 (0.92‐0.97) | 0.98 (0.96‐1.00) | 0.98 (0.96‐1.00) |
| Medicaid vs. privately insured | 1.17 (1.15‐1.19) | 1.05 (1.04‐1.07) | 1.05 (1.04‐1.07) |
LOS
Among AMI and stroke patients, age‐standardized and sex‐standardized mean LOS was significantly longer for the uninsured and Medicaid recipients compared with the privately insured (Table 3). Among pneumonia patients, the uninsured had a slightly shorter mean LOS compared with the privately insured whereas Medicaid recipients averaged the longest LOS.
These insurance‐related disparities in LOS among pneumonia patients persisted after multivariable adjustment (Table 4). Among AMI patients, only Medicaid recipients persisted in having a significantly longer LOS than the privately insured. Among stroke patients, both the uninsured and Medicaid recipients averaged a longer LOS compared with the privately insured.
Cost per Episode
For all 3 conditions, the uninsured had significantly lower age‐standardized and sex‐standardized costs compared with the privately insured (Table 3). However, Medicaid patients had higher costs than the privately insured for all three conditions, significantly so among patients with stroke and pneumonia.
These insurance‐related disparities in costs persisted in multivariable analyses (Table 4). The uninsured continued to have lower costs compared with the privately insured, significantly so for patients with AMI and pneumonia. Among stroke and pneumonia patients, Medicaid recipients continued to accrue higher costs than the uninsured or privately insured.
Discussion
In this nationally representative study of working‐age Americans hospitalized for 3 common medical conditions, we found that insurance status was associated with significant variations in in‐hospital mortality and resource use. Whereas privately insured patients experienced comparatively lower in‐hospital mortality in most cases, mortality risk was highest among the uninsured for 2 of the 3 common causes of noncancer inpatient deaths. Although previous studies have examined insurance‐related disparities in inpatient care for individual diagnoses and specific populations, no broad overview of this important issue has been published in the past decade. In light of the current economic recession and national healthcare debate, these findings may be a prescient indication of a widening insurance gap in the quality of hospital care.
There are several potential mechanisms for these disparities. For instance, Hadley et al.9 reported significant underuse of high‐cost or high‐discretion procedures among the uninsured in their analysis of a nationally representative sample of 592,598 hospitalized patients. Similarly, Burstin et al.10 found that among a population of 30,195 hospitalized patients with diverse diagnoses, the uninsured were at greater risk for receiving substandard care regardless of hospital characteristics. These, and other similar findings,7, 8, 19 are suggestive of differences in the way uninsured patients are generally managed in the hospital that may partly explain the disparities reported herein.
More specifically, analyses of national registries of AMI have documented lower rates of utilization of invasive, potentially life‐saving, cardiac interventions among the uninsured.16, 17 Similarly, a lower rate of carotid endarterectomy was reported among uninsured stroke patients from an analysis of the 2002 NIS.15 Other differences in inpatient management unmeasured by administrative data, such as the use of subspecialists and allied health professionals, may also contribute.32 Unfortunately, limitations in the available data prevented us from being able to appropriately address the important issue of insurance related differences in the utilization of specific inpatient procedures.
These disparities may also be indicative of differences in severity of illness that are not captured fully by the MedStat disease staging criteria. The uninsured might have more severe illness at admission, either due to the presence of more advanced chronic disease or delay in seeking care for the acute episode. AMI and stroke are usually the culmination of longstanding atherosclerosis that is amenable to improvement through timely and consistent risk‐factor modification. Not having a usual source of medical care,6, 33 inadequate screening and management of known risk‐factors,3, 34 and difficulties in obtaining specialty care5 among the uninsured likely increases their risk of being hospitalized with more advanced disease. The higher likelihood of being admitted through the emergency department19 and on weekends9 among the uninsured lends credence to the possibility of delays in seeking care. All of these are potential mediators of higher AMI and stroke mortality in uninsured patients.
Finally, these mortality differences could also be due to the additional risks imposed by poorly managed comorbidities among uninsured patients. Although we controlled for the presence of comorbidities in our analysis, we lacked data about the severity of individual comorbidities. A recent study reported significant lapses in follow‐up care after the onset of a chronic condition in uninsured individuals under 65 years of age.34 Other studies have also documented insurance related disparities in the care of chronic diseases3, 35 that were among the most common comorbidities in our cohort.
Most of the reasons for insurance‐related disparities noted above for the uninsured are also applicable to Medicaid patients. Differences in the intensity of inpatient care,7, 8, 1519 limited access to health care services,2, 14 unmet health needs,5 and suboptimal management of chronic medical conditions35 were also reported for Medicaid patients in prior research. These factors likely contributed to the higher in‐hospital mortality in this patient population, evidenced by the sequential decrease in odds after adjusting for comorbidities and disease severity. Medicaid patients hospitalized for stroke were noted to have significantly longer LOS, which could plausibly be due to difficulties with arranging appropriate discharge disposition; the higher likelihood of paralysis among these patients15 would likely necessitate a higher frequency of rehabilitation facility placement. The higher costs for Medicaid patients with stroke and pneumonia may potentially be the result of these patients longer LOS. Although cost differences between the uninsured and privately insured were statistically significant, these were not large enough to be of material significance.
Limitations
Our study has several limitations. Since the NIS does not assign unique patient identifiers that would permit tracking of readmissions, we excluded patients transferred to another acute‐care hospital from our study to avoid counting the same patient twice. However, only 10% of hospitalized patients underwent transfer for cardiac procedures in the National Registry of Myocardial Infarction, with privately insured patients more likely to be transferred than other insurance groups.17 Since these patients are also more likely to have better survival, their exclusion likely biased our study toward the null. The same is probable for stroke patients as well.
Some uninsured patients begin Medicaid coverage during hospitalization and should ideally be counted as uninsured but were included under Medicaid in our analysis. They are also likely to be state‐ and plan‐specific variations in Medicaid and private payer coverage that we could not incorporate into our analysis. In addition, we were unable to include deaths that may have occurred shortly after discharge, even though these may have been related to the quality of hospital care. Furthermore, although the 3 conditions we studied are common and responsible for a large number of hospital deaths, they make up about 8% of total annual hospital discharges,23 and caution should be exercised in generalizing our findings to the full spectrum of hospitalizations. Lastly, it is possible that unmeasured confounding could be responsible for the observed associations. Uninsured and Medicaid patients are likely to have more severe disease, which may not be adequately captured by the administrative data available in the NIS. If so, this would explain the mortality association rather than insurance status.36, 37
Conclusions
Significant insurance‐related differences in mortality exist for 2 of the leading causes of noncancer inpatient deaths among working‐age Americans. Further studies are needed to determine whether provider sensitivity to insurance status or unmeasured sociodemographic and clinical prognostic factors are responsible for these disparities. Policy makers, hospital administrators, and physicians should be cognizant of these disparities and consider policies to address potential insurance related gaps in the quality of inpatient care.
- , .The U.S. economy and changes in health insurance coverage, 2000‐2006.Health Aff (Millwood).2008;27(2):w135‐w144.
- , , .Rates of avoidable hospitalization by insurance status in Massachusetts and Maryland.JAMA.1992;268(17):2388‐2394.
- , , , et al.Unmet health needs of uninsured adults in the United States.JAMA.2000;284(16):2061‐2069.
- , , .Health insurance and access to care for symptomatic conditions.Arch Intern Med.2000;160(9):1269‐1274.
- , , , et al.Access to specialty care and medical services in community health centers.Health Aff (Millwood).2007;26(5):1459‐1468.
- , , , et al.A national study of chronic disease prevalence and access to care in uninsured U.S. adults.Ann Intern Med.2008;149:170–176.
- , , , .Relationship between patient source of payment and the intensity of hospital services.Med Care.1988;26(11):1111‐1114.
- , , .The association of payer with utilization of cardiac procedures in Massachusetts.JAMA.1990;264(10):1255‐1260.
- , , .Comparison of uninsured and privately insured hospital patients: condition on admission, resource use, and outcome.JAMA.1991;265:374–379.
- , , .Socioeconomic status and risk for substandard medical care.JAMA.1992;268(17):2383‐2387.
- , , , .The relation between health insurance coverage and clinical outcomes among women with breast cancer.N Engl J Med.1993;329(5):326‐331.
- , , .Health insurance and mortality. Evidence from a national cohort.JAMA.1993;270(6):737‐741.
- , , , .Mortality in the uninsured compared with that in persons with public and private health insurance.Arch Intern Med.1994;154(21):2409‐2416.
- .Medicaid policy and the substitution of hospital outpatient care for physician care.Health Serv Res.1989;24:33–66.
- , .Disparities in outcomes among patients with stroke associated with insurance status.Stroke.2007;38(3):1010‐1016.
- , , , et al.Influence of payor on use of invasive cardiac procedures and patient outcome after myocardial infarction in the United States. Participants in the National Registry of Myocardial Infarction.J Am Coll Cardiol.1998;31(7):1474‐1480.
- , , , et al.Payer status and the utilization of hospital resources in acute myocardial infarction: a report from the National Registry of Myocardial Infarction 2.Arch Intern Med.2000;160(6):817–823.
- , , , et al.Insurance coverage and care of patients with non‐ST‐segment elevation acute coronary syndromes.Ann Intern Med.2006;145(10):739–748.
- , , .Comparing uninsured and privately insured hospital patients: Admission severity, health outcomes and resource use.Health Serv Manage Res.2001;14(3):203–210.
- Healthcare Cost and Utilization Project. Introduction to the HCUP Nationwide Inpatient Sample (NIS) 2005. Rockville, MD: Agency for Healthcare Research and Quality; 2007:6. Available at: www.hcup‐us.ahrq.gov/db/nation/nis/NIS_Introduction_2005.pdf. Accessed February2010.
- Healthcare Cost and Utilization Project. Design of the Nationwide Inpatient Sample (NIS) 2005. Rockville, MD: Agency for Healthcare Research and Quality; 2007. Available at: www.hcup‐us.ahrq.gov/db/nation/nis/reports/NIS_2005_Design_Report.pdf. Accessed February2010.
- AHRQ Quality Indicators. Inpatient Quality Indicators: Technical Specifications. Version 3.1 (March 12, 2007). Available at: www.qualityindicators.ahrq.gov/downloads/iqi/iqi_technical_specs_v31.pdf. Accessed February2010.
- , , . National Hospital Discharge Survey: 2005 annual summary with detailed diagnosis and procedure data. Washington, DC: National Center for Health Statistics; 2007. Vital and Health Statistics 13(165). Available at: www.cdc.gov/nchs/data/series/sr_13/sr13_165.pdf. Accessed February2010.
- AHRQ Quality Indicators. Guide to Inpatient Quality Indicators: Quality of Care in Hospitals—Volume, Mortality, and Utilization. Version 3.1 (March 12, 2007). Available at: www.qualityindicators.ahrq.gov/downloads/iqi/iqi_guide_v31.pdf. Accessed February2010.
- , , .Income, poverty, and health insurance coverage in the United States: 2006.Washington, DC:US Census Bureau. Current Population Reports;2007:60–233.
- , . Conditions Related to Uninsured Hospitalizations, 2003. HCUP Statistical Brief #8. Rockville, MD: Agency for Healthcare Research and Quality; 2006:6. Available at: www.hcup‐us.ahrq.gov/reports/statbriefs/sb8.pdf. Accessed February2010.
- Healthcare Cost and Utilization Project. NIS Description of Data Elements. Available at: www.hcup‐us.ahrq.gov/db/nation/nis/nisdde.jsp. Accessed February2010.
- , , , .Comorbidity measures for use with administrative data.Med Care.1998;36:8–27.
- SUDAAN User's Manual, Release 9.0. Research TrianglePark, NC:Research Triangle Institute;2006.
- , . Final Report on Calculating Nationwide Inpatient Sample (NIS) Variances, 2001. HCUP Methods Series Report #2003‐2. Online June 2005 (revised June 6, 2005). U.S. Agency for Healthcare Research and Quality. Available at: www.hcup‐us.ahrq.gov/reports/CalculatingNISVariances200106092005.pdf. Accessed February2010.
- .On the variances of asymptotically normal estimators from complex surveys.Int Stat Rev.1983;51:279–292.
- , , , et al.Patient characteristics associated with care by a cardiologist among adults hospitalized with severe congestive heart failure.J Am Coll Cardiol.2000;36:2119–2125.
- , . Summary health statistics for U.S. adults: National Health Interview Survey, 2006. Washington, DC: National Center for Health Statistics; 2007:12. Vital and Health Statistics 10(235). Available at: www.cdc.gov/nchs/data/series/sr_10/sr10_235.pdf. Accessed February2010.
- .Insurance coverage, medical care use, and short‐term health changes following an unintentional injury or the onset of a chronic condition.JAMA.2007;297(10):1073–1084.
- , , , et al.The quality of chronic disease care in U.S. community health centers.Health Aff (Millwood).2006;25(6):1712–1723.
- , , , , , .Risk‐adjusting hospital inpatient mortality using automated inpatient, outpatient, and laboratory databases.Med Care.2008;46(3):232–239.
- , , , .The Kaiser Permanente inpatient risk adjustment methodology was valid in an external patient population.J Clin Epidemiol. [E‐pub ahead of print].
With about 1 in 5 working‐age Americans (age 18‐64 years) currently uninsured and a large number relying on Medicaid, adequate access to quality health care services is becoming increasingly difficult.1 Substantial literature has accumulated over the years suggesting that access and quality in health care are closely linked to an individual's health insurance status.211 Some studies indicate that being uninsured or publicly insured is associated with negative health consequences.12, 13 Although the Medicaid program has improved access for qualifying low‐income individuals, significant gaps in access and quality remain.2, 5, 11, 1419 These issues are likely to become more pervasive should there be further modifications to state Medicaid funding in response to the unfolding economic crisis.
Although numerous studies have focused on insurance‐related disparities in the outpatient setting, few nationally representative studies have examined such disparities among hospitalized patients. A cross‐sectional study of a large hospital database from 1987 reported higher risk‐adjusted in‐hospital mortality, shorter length of stay (LOS), and lower procedure use among uninsured patients.9 A more recent analysis, limited to patients admitted with stroke, reported significant variation in hospital care associated with insurance status.15 Other studies reporting myocardial infarction registry and quality improvement program data are biased by the self‐selection of large urban teaching hospitals.1618 To our knowledge, no nationally representative study has focused on the impact of insurance coverage on hospital care for common medical conditions among working‐age Americans, the fastest growing segment of the uninsured population.
To address this gap in knowledge, we analyzed a nationally representative hospital database to determine whether there are significant insurance‐related disparities in in‐hospital mortality, LOS, and cost per hospitalization for 3 common medical conditions among working‐age adults, and, if present, to determine whether these disparities are due to differences in disease severity and comorbidities, and whether these disparities are affected by the proportion of uninsured and Medicaid patients receiving care in each hospital.
Methods
Design and Subjects
We examined data from the 2005 Nationwide Inpatient Sample (NIS), a nationally representative database of hospital inpatient stays maintained by the Agency for Healthcare Research and Quality (AHRQ) as part of the Healthcare Cost and Utilization Project (HCUP).20, 21 The NIS is a stratified probability sample of 20% of all US community hospitals, including public hospitals, academic medical centers, and specialty hospitals. Long‐term care hospitals, psychiatric hospitals, and alcoholism/chemical‐dependency treatment facilities are excluded. The 2005 NIS contains data on 7,995,048 discharges from 1054 hospitals located in 37 States and is designed to be representative of all acute care discharges from all US community hospitals.21
We identified discharges with a principal diagnosis of acute myocardial infarction (AMI), stroke, and pneumonia using International Classification of Diseases, 9th Revision, Clinical Modification (ICD‐9‐CM) codes specified in the AHRQ definitions of Inpatient Quality Indicators (Supporting Information Appendix).22 These 3 conditions are among the leading causes of noncancer inpatient deaths in patients under 65 years old,23 and evidence suggests that high mortality may be associated with deficiencies in the quality of inpatient care.24
We confined our analysis to patients 18 to 64 years of age, since this population is most at risk of being uninsured or underinsured.25 We excluded pregnant women because they account for an unusually high proportion of uninsured discharges and were relatively few in our cohort.26 In addition, we excluded patients transferred to another acute care hospital and patients missing payer source and discharge disposition. Our study protocol was approved by the Partners Human Research Committee.
Study Variables
We categorized insurance status as privately insured, uninsured, Medicaid, or Medicare. We defined privately insured patients as those having either Blue Cross or another commercial carrier listed as the primary payer and uninsured patients as those having either no charge or self‐pay listed as the primary payer.27 Other governmental payer categories were noted to share several characteristics with Medicare patients and comprised only a small proportion of the sample, and were thus included with Medicare. In order to account for NIS's sampling scheme and accurately apply sample weights in our analysis, we used Medicare as a separate category. However, since Medicare patients age 18 to 64 years represent a fundamentally different population that is primarily disabled or very ill, only results of privately insured, uninsured, and Medicaid patients are reported.
We selected in‐hospital mortality as the outcome measure and LOS and cost per hospitalization as measures of resource utilization. The NIS includes a binary indicator variable for in‐hospital mortality and specifies inpatient LOS in integers, with same‐day stays coded as 0. NIS's cost estimates are based on hospital cost reports submitted to the Centers for Medicare and Medicaid Services. To test the validity of our cost analyses, we performed parallel analyses using hospital charges as a measure of utilization (charges include hospital overhead, charity care, and bad debt). The resulting adjusted ratios differed little from cost ratios and we opted to report only the details of our cost analyses.
In order to assess the independent association between insurance status and the outcome measures listed above, we selected covariates for inclusion in multivariable models based on the existing literature. Patient covariates included: age group (18‐34 years, 35‐49 years, 50‐64 years), sex (male/female), race/ethnicity (non‐Hispanic white, non‐Hispanic black, Hispanic, other, missing), median income by zip code of residence (less than $37,000, $37,000‐$45,999, $46,000‐$60,999, $61,000 or more), admission through the emergency department (yes/no), admission on a weekend (yes/no), measures of disease severity, and comorbidity indicators. Measures of disease severity specific to each outcome are assigned in the NIS using criteria developed by Medstat (Medstat Disease Staging Software Version 5.2, Thomson Medstat Inc., Ann Arbor, MI). Severity is categorized into 5 levels, with a higher level indicating greater risk. We recorded comorbidities for each patient in our sample using HCUP Comorbidity Software, Version 3.2 (
Hospital covariates included: bed size (small, medium, large), ownership/control (private, government, private or government), geographic region (northeast, midwest, south, west), teaching status (teaching, non‐teaching), and the proportion of uninsured and Medicaid patients (combined) admitted to each hospital for AMI, stroke, or pneumonia. The actual number of hospital beds in each bed size category varies according to a hospital's geographic region and teaching status.27 Ownership/control, geographic region, and teaching status are assigned according to information from the American Hospital Association Annual Survey of Hospitals. The proportion of uninsured and Medicaid patients admitted to each hospital was found to have a nonmonotonic relationship with the outcomes being assessed and was thus treated as a 6‐level categorical variable with the following levels: 0% to 10%, 11% to 20%, 21% to 30%, 31% to 40%, 41% to 50%, and 51% to 100%.
Statistical Analysis
Summary statistics were constructed at the patient level and differences in proportions were evaluated with the chi‐square test. We employed direct standardization, using the age and sex distribution of the entire cohort, to compute age‐standardized and sex‐standardized estimates for each insurance group and compared them using the chi‐square test for in‐hospital mortality and t test for log transformed LOS and cost per hospitalization. For each condition, we developed multivariable logistic regression models for in‐hospital mortality and multivariable linear regression models for log transformed LOS and cost. The patient was the unit of analysis in all models.
In order to elucidate the contribution of disease severity and comorbidities and the proportion of uninsured and Medicaid patients admitted to each hospital, we fitted 3 sequential models for each outcome measure: Model 1 adjusted for patient sociodemographic characteristics and hospital characteristics with the exception of the covariate for the proportion of uninsured and Medicaid patients, Model 2 adjusted for all covariates in the preceding model as well as patients' comorbidities and severity of principal diagnosis, and Model 3 adjusted for all previously mentioned covariates as well as the proportion of uninsured and Medicaid patients admitted to each hospital. We excluded patients who died during hospitalization from the models for LOS and cost. We exponentiated the effect estimates from the log transformed linear regression models so that the adjusted ratio represents the percentage change in the mean LOS or mean cost.
To determine whether the association between patients' insurance status and in‐hospital mortality was modified by seeking care in hospitals treating a smaller or larger proportion of uninsured and Medicaid patients, we entered an interaction term for insurance status and proportion of uninsured and Medicaid patients in the final models (Model 3) for our primary outcome of in‐hospital mortality. However, since no significant interaction was found for any of the 3 conditions, this term was removed from the models and results from the interaction models are not described. In order to assess model specification for the linear regression models, we evaluated the normality of model residuals and found that these were approximately normally distributed. Lastly, we attempted to test the robustness of our analyses by creating fixed effects models that controlled for hospital site but were unable to do so due to the computational limitations of available software packages that could not render fixed effects models with more than 1000 hospital sites.
For all variables except race/ethnicity, data were missing for less than 3% of patients, so we excluded these individuals from adjusted analyses. However, race/ethnicity data were missing for 29% of the sample and were analyzed in 3 different ways, namely, with the missing data treated as a separate covariate level, with the missing data removed from the analysis, and with the missing data assigned to the majority covariate level (white race). The results of our analysis were unchanged no matter how the missing values were assigned. As a result, missing values for race/ethnicity were treated as a separate covariate level in the final analysis.15 Sociodemographic characteristics of patients with missing race/ethnicity information were similar to those with complete data.
We used SUDAAN (Release 9.0.1, Research Triangle Institute, NC) to account for NIS's sampling scheme and generalized estimating equations to adjust for the clustering of patients within hospitals and hospitals within sampling strata.29 In order to account for NIS's stratified probability sampling scheme, SUDAAN uses Taylor series linearization for robust variance estimation of descriptive statistics and regression parameters.30, 31 We present 2‐tailed P values or 95% confidence intervals (CIs) for all statistical comparisons.
Results
Patient and Hospital Characteristics
The final cohort comprised of 154,381 patients discharged from 1018 hospitals in 37 states during calendar year 2005 (Table 1). This cohort was representative of 755,346 working‐age Americans, representing approximately 225,947 cases of AMI (29.9%), 151,812 cases of stroke (20.1%), and 377,588 cases of pneumonia (50.0%). Of these patients, 47.5% were privately insured, 12.0% were uninsured, 17.0% received Medicaid, and 23.5% were assigned to Medicare. Compared with the privately insured, uninsured and Medicaid patients were generally younger, less likely to be white, more likely to have lower income, and more likely to be admitted through the emergency department. Of the 1018 hospitals included in our study, close to half (44.3%) were small, with bedsize ranging from 24 to 249. A large number of hospitals were located in the South (39.9%), and 14.9% were designated teaching hospitals.
| Characteristic* | Privately insured (n = 73,256) | Uninsured (n = 18,531) | Medicaid (n = 26,222) |
|---|---|---|---|
| |||
| Principal diagnosis (%) | |||
| Acute myocardial infarction | 36.7 | 31.2 | 19.7 |
| Stroke | 20.6 | 23.7 | 19.9 |
| Pneumonia | 42.7 | 45.2 | 60.4 |
| Age group (%) | |||
| 18‐34 years | 6.8 | 13.0 | 13.7 |
| 35‐49 years | 27.6 | 36.9 | 33.2 |
| 50‐64 years | 65.7 | 50.1 | 53.2 |
| Male sex (%) | 59.3 | 62.3 | 46.6 |
| Race or ethnicity (%) | |||
| White | 55.7 | 41.5 | 38.0 |
| Black | 7.6 | 14.8 | 16.6 |
| Hispanic | 4.8 | 10.5 | 10.4 |
| Other race | 3.6 | 4.7 | 5.2 |
| Missing | 28.4 | 29.0 | 29.7 |
| Median income by ZIP code (%) | |||
| <$37,000 | 21.5 | 36.7 | 43.0 |
| $37,000‐$45,999 | 25.2 | 27.8 | 27.1 |
| $46,000‐$60,999 | 26.3 | 20.3 | 17.6 |
| $61,000 | 24.8 | 11.5 | 8.4 |
| Emergency admission (%) | 63.3 | 75.6 | 72.9 |
| Weekend admission (%) | 24.5 | 26.2 | 25.1 |
| Hospital bed size (%) | |||
| Small | 8.9 | 10.3 | 11.4 |
| Medium | 24.0 | 22.3 | 25.9 |
| Large | 67.1 | 67.5 | 62.8 |
| Hospital control (%) | |||
| Private | 33.8 | 34.8 | 34.4 |
| Government (nonfederal) | 6.7 | 9.7 | 8.3 |
| Private or government | 59.5 | 55.5 | 57.3 |
| Hospital region (%) | |||
| Northeast | 17.4 | 12.5 | 17.6 |
| Midwest | 25.7 | 19.4 | 20.9 |
| South | 39.5 | 56.8 | 42.4 |
| West | 17.4 | 11.3 | 19.2 |
| Teaching hospital (%) | 41.7 | 43.8 | 43.3 |
Compared with privately insured patients, a larger proportion of uninsured and Medicaid patients had higher predicted mortality levels (Table 2). Medicaid patients had a disproportionately higher predicted LOS, whereas predicted resource demand was higher among privately insured patients. Hypertension (48%), chronic pulmonary disease (29.5%), and uncomplicated diabetes (21.5%) were the 3 most common comorbidities in the study cohort, with a generally higher prevalence of comorbidities among Medicaid patients.
| Characteristic* | Privately insured (n = 73,256) | Uninsured (n = 18,531) | Medicaid (n = 26,222) |
|---|---|---|---|
| |||
| Medstat disease staging (%) | |||
| Mortality level 1 | 50.8 | 45.4 | 36.7 |
| Mortality level 2 | 44.0 | 49.1 | 56.7 |
| Mortality level 3 | 5.3 | 5.5 | 6.7 |
| Length of stay level 1 | 66.8 | 71.6 | 53.8 |
| Length of stay level 2 | 28.5 | 24.5 | 39.3 |
| Length of stay level 3 | 4.8 | 3.8 | 6.9 |
| Resource demand level 1 | 45.2 | 54.2 | 48.5 |
| Resource demand level 2 | 40.5 | 34.2 | 39.2 |
| Resource demand level 3 | 14.2 | 11.7 | 12.3 |
| Coexisting medical conditions (%) | |||
| Congestive heart failure | 4.7 | 4.8 | 10.1 |
| Valvular disease | 2.8 | 2.0 | 2.7 |
| Pulmonary circulation disease | 0.8 | 0.6 | 1.5 |
| Peripheral vascular disease | 3.2 | 2.2 | 3.2 |
| Paralysis | 1.2 | 0.8 | 3.5 |
| Other neurological disorders | 2.4 | 1.9 | 7.3 |
| Chronic pulmonary disease | 23.6 | 22.4 | 37.7 |
| Uncomplicated diabetes | 19.6 | 18.6 | 23.4 |
| Complicated diabetes | 3.3 | 2.1 | 4.9 |
| Hypothyroidism | 5.6 | 2.7 | 4.7 |
| Renal failure | 3.0 | 1.9 | 5.6 |
| Liver disease | 1.6 | 2.5 | 4.4 |
| Peptic ulcer disease | <0.5 | <0.5 | <0.5 |
| AIDS | 0.1 | 0.1 | 0.4 |
| Lymphoma | 1.1 | 0.4 | 0.6 |
| Metastatic cancer | 2.1 | 0.7 | 2.2 |
| Non‐metastatic solid tumor | 1.5 | 0.8 | 2.1 |
| Collagen vascular diseases | 2.3 | 0.9 | 2.3 |
| Coagulopathy | 2.7 | 2.4 | 3.4 |
| Obesity | 10.3 | 8.2 | 9.3 |
| Weight loss | 1.6 | 1.8 | 3.3 |
| Fluid and electrolyte disorders | 18.3 | 19.4 | 23.8 |
| Chronic blood loss anemia | 0.6 | 0.6 | 0.8 |
| Deficiency anemias | 8.6 | 8.5 | 13.4 |
| Alcohol abuse | 3.3 | 9.8 | 8.3 |
| Drug abuse | 1.9 | 10.2 | 9.8 |
| Psychoses | 1.5 | 1.9 | 6.8 |
| Depression | 7.2 | 4.8 | 9.9 |
| Hypertension | 48.0 | 44.1 | 45.7 |
In‐Hospital Mortality
Compared with the privately insured, age‐standardized and sex‐standardized in‐hospital mortality for AMI and stroke was significantly higher for uninsured and Medicaid patients (Table 3). Among pneumonia patients, Medicaid recipients had significantly higher in‐hospital mortality compared with privately insured and uninsured patients.
| Privately Insured | Uninsured | Medicaid | |
|---|---|---|---|
| |||
| In‐hospital mortality, rate per 100 discharges (SE) | |||
| Acute myocardial infarction | 2.22 (0.10) | 4.03 (0.31)* | 4.57 (0.34)* |
| Stroke | 7.49 (0.27) | 10.46 (0.64)* | 9.89 (0.45)* |
| Pneumonia | 1.75 (0.09) | 1.74 (0.18) | 2.48 (0.14)* |
| Length of stay, mean (SE), days | |||
| Acute myocardial infarction | 4.17 (0.06) | 4.46 (0.09) | 5.85 (0.16) |
| Stroke | 6.37 (0.13) | 7.15 (0.25) | 9.28 (0.30) |
| Pneumonia | 4.89 (0.05) | 4.64 (0.10) | 5.80 (0.08) |
| Cost per episode, mean (SE), dollars | |||
| Acute myocardial infarction | 21,077 (512) | 19,977 (833) | 22,452 (841) |
| Stroke | 16,022 (679) | 14,571 (1,036) | 18,462 (824) |
| Pneumonia | 8,223 (192) | 7,086 (293) | 9,479 (271) |
After multivariable adjustment for additional patient and hospital characteristics, uninsured AMI and stroke patients continued to have significantly higher in‐hospital mortality compared with the privately insured (Table 4). Among pneumonia patients, Medicaid recipients persisted in having significantly higher in‐hospital mortality than the privately insured.
| Model 1* | Model 2 | Model 3 | |
|---|---|---|---|
| |||
| In‐hospital mortality, adjusted odds ratio (95% CI) | |||
| Acute Myocardial Infarction | |||
| Uninsured vs. privately insured | 1.59 (1.35‐1.88) | 1.58 (1.30‐1.93) | 1.52 (1.24‐1.85) |
| Medicaid vs. privately insured | 1.83 (1.54‐2.18) | 1.22 (0.99‐1.50) | 1.15 (0.94‐1.42) |
| Stroke | |||
| Uninsured vs. privately insured | 1.56 (1.35‐1.80) | 1.50 (1.30‐1.73) | 1.49 (1.29‐1.72) |
| Medicaid vs. privately insured | 1.32 (1.15‐1.52) | 1.09 (0.93‐1.27) | 1.08 (0.93‐1.26) |
| Pneumonia | |||
| Uninsured vs. privately insured | 0.99 (0.81‐1.21) | 1.12 (0.91‐1.39) | 1.10 (0.89‐1.36) |
| Medicaid vs. privately insured | 1.41 (1.20‐1.65) | 1.24 (1.04‐1.48) | 1.21 (1.01‐1.45) |
| Length of stay, adjusted ratio (95% CI)| | |||
| Acute Myocardial Infarction | |||
| Uninsured vs. privately insured | 1.00 (0.98‐1.02) | 1.00 (0.98‐1.02) | 1.00 (0.98‐1.02) |
| Medicaid vs. privately insured | 1.17 (1.14‐1.21) | 1.07 (1.05‐1.09) | 1.07 (1.05‐1.09) |
| Stroke | |||
| Uninsured vs. privately insured | 1.06 (1.02‐1.10) | 1.08 (1.04‐1.11) | 1.07 (1.04‐1.11) |
| Medicaid vs. privately insured | 1.30 (1.26‐1.34) | 1.17 (1.14‐1.20) | 1.17 (1.14‐1.20) |
| Pneumonia | |||
| Uninsured vs. privately insured | 0.95 (0.93‐0.97) | 0.96 (0.94‐0.99) | 0.96 (0.94‐0.98) |
| Medicaid vs. privately insured | 1.15 (1.13‐1.17) | 1.04 (1.03‐1.06) | 1.04 (1.03‐1.06) |
| Cost per episode, adjusted ratio (95% CI)| | |||
| Acute Myocardial Infarction | |||
| Uninsured vs. privately insured | 0.97 (0.95‐0.99) | 0.99 (0.97‐1.00) | 0.99 (0.97‐1.00) |
| Medicaid vs. privately insured | 1.01 (0.98‐1.04) | 0.99 (0.97‐1.01) | 0.99 (0.97‐1.01) |
| Stroke | |||
| Uninsured vs. privately insured | 0.97 (0.93‐1.02) | 1.00 (0.96‐1.03) | 1.00 (0.97‐1.03) |
| Medicaid vs. privately insured | 1.17 (1.13‐1.21) | 1.06 (1.04‐1.09) | 1.06 (1.04‐1.09) |
| Pneumonia | |||
| Uninsured vs. privately insured | 0.95 (0.92‐0.97) | 0.98 (0.96‐1.00) | 0.98 (0.96‐1.00) |
| Medicaid vs. privately insured | 1.17 (1.15‐1.19) | 1.05 (1.04‐1.07) | 1.05 (1.04‐1.07) |
LOS
Among AMI and stroke patients, age‐standardized and sex‐standardized mean LOS was significantly longer for the uninsured and Medicaid recipients compared with the privately insured (Table 3). Among pneumonia patients, the uninsured had a slightly shorter mean LOS compared with the privately insured whereas Medicaid recipients averaged the longest LOS.
These insurance‐related disparities in LOS among pneumonia patients persisted after multivariable adjustment (Table 4). Among AMI patients, only Medicaid recipients persisted in having a significantly longer LOS than the privately insured. Among stroke patients, both the uninsured and Medicaid recipients averaged a longer LOS compared with the privately insured.
Cost per Episode
For all 3 conditions, the uninsured had significantly lower age‐standardized and sex‐standardized costs compared with the privately insured (Table 3). However, Medicaid patients had higher costs than the privately insured for all three conditions, significantly so among patients with stroke and pneumonia.
These insurance‐related disparities in costs persisted in multivariable analyses (Table 4). The uninsured continued to have lower costs compared with the privately insured, significantly so for patients with AMI and pneumonia. Among stroke and pneumonia patients, Medicaid recipients continued to accrue higher costs than the uninsured or privately insured.
Discussion
In this nationally representative study of working‐age Americans hospitalized for 3 common medical conditions, we found that insurance status was associated with significant variations in in‐hospital mortality and resource use. Whereas privately insured patients experienced comparatively lower in‐hospital mortality in most cases, mortality risk was highest among the uninsured for 2 of the 3 common causes of noncancer inpatient deaths. Although previous studies have examined insurance‐related disparities in inpatient care for individual diagnoses and specific populations, no broad overview of this important issue has been published in the past decade. In light of the current economic recession and national healthcare debate, these findings may be a prescient indication of a widening insurance gap in the quality of hospital care.
There are several potential mechanisms for these disparities. For instance, Hadley et al.9 reported significant underuse of high‐cost or high‐discretion procedures among the uninsured in their analysis of a nationally representative sample of 592,598 hospitalized patients. Similarly, Burstin et al.10 found that among a population of 30,195 hospitalized patients with diverse diagnoses, the uninsured were at greater risk for receiving substandard care regardless of hospital characteristics. These, and other similar findings,7, 8, 19 are suggestive of differences in the way uninsured patients are generally managed in the hospital that may partly explain the disparities reported herein.
More specifically, analyses of national registries of AMI have documented lower rates of utilization of invasive, potentially life‐saving, cardiac interventions among the uninsured.16, 17 Similarly, a lower rate of carotid endarterectomy was reported among uninsured stroke patients from an analysis of the 2002 NIS.15 Other differences in inpatient management unmeasured by administrative data, such as the use of subspecialists and allied health professionals, may also contribute.32 Unfortunately, limitations in the available data prevented us from being able to appropriately address the important issue of insurance related differences in the utilization of specific inpatient procedures.
These disparities may also be indicative of differences in severity of illness that are not captured fully by the MedStat disease staging criteria. The uninsured might have more severe illness at admission, either due to the presence of more advanced chronic disease or delay in seeking care for the acute episode. AMI and stroke are usually the culmination of longstanding atherosclerosis that is amenable to improvement through timely and consistent risk‐factor modification. Not having a usual source of medical care,6, 33 inadequate screening and management of known risk‐factors,3, 34 and difficulties in obtaining specialty care5 among the uninsured likely increases their risk of being hospitalized with more advanced disease. The higher likelihood of being admitted through the emergency department19 and on weekends9 among the uninsured lends credence to the possibility of delays in seeking care. All of these are potential mediators of higher AMI and stroke mortality in uninsured patients.
Finally, these mortality differences could also be due to the additional risks imposed by poorly managed comorbidities among uninsured patients. Although we controlled for the presence of comorbidities in our analysis, we lacked data about the severity of individual comorbidities. A recent study reported significant lapses in follow‐up care after the onset of a chronic condition in uninsured individuals under 65 years of age.34 Other studies have also documented insurance related disparities in the care of chronic diseases3, 35 that were among the most common comorbidities in our cohort.
Most of the reasons for insurance‐related disparities noted above for the uninsured are also applicable to Medicaid patients. Differences in the intensity of inpatient care,7, 8, 1519 limited access to health care services,2, 14 unmet health needs,5 and suboptimal management of chronic medical conditions35 were also reported for Medicaid patients in prior research. These factors likely contributed to the higher in‐hospital mortality in this patient population, evidenced by the sequential decrease in odds after adjusting for comorbidities and disease severity. Medicaid patients hospitalized for stroke were noted to have significantly longer LOS, which could plausibly be due to difficulties with arranging appropriate discharge disposition; the higher likelihood of paralysis among these patients15 would likely necessitate a higher frequency of rehabilitation facility placement. The higher costs for Medicaid patients with stroke and pneumonia may potentially be the result of these patients longer LOS. Although cost differences between the uninsured and privately insured were statistically significant, these were not large enough to be of material significance.
Limitations
Our study has several limitations. Since the NIS does not assign unique patient identifiers that would permit tracking of readmissions, we excluded patients transferred to another acute‐care hospital from our study to avoid counting the same patient twice. However, only 10% of hospitalized patients underwent transfer for cardiac procedures in the National Registry of Myocardial Infarction, with privately insured patients more likely to be transferred than other insurance groups.17 Since these patients are also more likely to have better survival, their exclusion likely biased our study toward the null. The same is probable for stroke patients as well.
Some uninsured patients begin Medicaid coverage during hospitalization and should ideally be counted as uninsured but were included under Medicaid in our analysis. They are also likely to be state‐ and plan‐specific variations in Medicaid and private payer coverage that we could not incorporate into our analysis. In addition, we were unable to include deaths that may have occurred shortly after discharge, even though these may have been related to the quality of hospital care. Furthermore, although the 3 conditions we studied are common and responsible for a large number of hospital deaths, they make up about 8% of total annual hospital discharges,23 and caution should be exercised in generalizing our findings to the full spectrum of hospitalizations. Lastly, it is possible that unmeasured confounding could be responsible for the observed associations. Uninsured and Medicaid patients are likely to have more severe disease, which may not be adequately captured by the administrative data available in the NIS. If so, this would explain the mortality association rather than insurance status.36, 37
Conclusions
Significant insurance‐related differences in mortality exist for 2 of the leading causes of noncancer inpatient deaths among working‐age Americans. Further studies are needed to determine whether provider sensitivity to insurance status or unmeasured sociodemographic and clinical prognostic factors are responsible for these disparities. Policy makers, hospital administrators, and physicians should be cognizant of these disparities and consider policies to address potential insurance related gaps in the quality of inpatient care.
With about 1 in 5 working‐age Americans (age 18‐64 years) currently uninsured and a large number relying on Medicaid, adequate access to quality health care services is becoming increasingly difficult.1 Substantial literature has accumulated over the years suggesting that access and quality in health care are closely linked to an individual's health insurance status.211 Some studies indicate that being uninsured or publicly insured is associated with negative health consequences.12, 13 Although the Medicaid program has improved access for qualifying low‐income individuals, significant gaps in access and quality remain.2, 5, 11, 1419 These issues are likely to become more pervasive should there be further modifications to state Medicaid funding in response to the unfolding economic crisis.
Although numerous studies have focused on insurance‐related disparities in the outpatient setting, few nationally representative studies have examined such disparities among hospitalized patients. A cross‐sectional study of a large hospital database from 1987 reported higher risk‐adjusted in‐hospital mortality, shorter length of stay (LOS), and lower procedure use among uninsured patients.9 A more recent analysis, limited to patients admitted with stroke, reported significant variation in hospital care associated with insurance status.15 Other studies reporting myocardial infarction registry and quality improvement program data are biased by the self‐selection of large urban teaching hospitals.1618 To our knowledge, no nationally representative study has focused on the impact of insurance coverage on hospital care for common medical conditions among working‐age Americans, the fastest growing segment of the uninsured population.
To address this gap in knowledge, we analyzed a nationally representative hospital database to determine whether there are significant insurance‐related disparities in in‐hospital mortality, LOS, and cost per hospitalization for 3 common medical conditions among working‐age adults, and, if present, to determine whether these disparities are due to differences in disease severity and comorbidities, and whether these disparities are affected by the proportion of uninsured and Medicaid patients receiving care in each hospital.
Methods
Design and Subjects
We examined data from the 2005 Nationwide Inpatient Sample (NIS), a nationally representative database of hospital inpatient stays maintained by the Agency for Healthcare Research and Quality (AHRQ) as part of the Healthcare Cost and Utilization Project (HCUP).20, 21 The NIS is a stratified probability sample of 20% of all US community hospitals, including public hospitals, academic medical centers, and specialty hospitals. Long‐term care hospitals, psychiatric hospitals, and alcoholism/chemical‐dependency treatment facilities are excluded. The 2005 NIS contains data on 7,995,048 discharges from 1054 hospitals located in 37 States and is designed to be representative of all acute care discharges from all US community hospitals.21
We identified discharges with a principal diagnosis of acute myocardial infarction (AMI), stroke, and pneumonia using International Classification of Diseases, 9th Revision, Clinical Modification (ICD‐9‐CM) codes specified in the AHRQ definitions of Inpatient Quality Indicators (Supporting Information Appendix).22 These 3 conditions are among the leading causes of noncancer inpatient deaths in patients under 65 years old,23 and evidence suggests that high mortality may be associated with deficiencies in the quality of inpatient care.24
We confined our analysis to patients 18 to 64 years of age, since this population is most at risk of being uninsured or underinsured.25 We excluded pregnant women because they account for an unusually high proportion of uninsured discharges and were relatively few in our cohort.26 In addition, we excluded patients transferred to another acute care hospital and patients missing payer source and discharge disposition. Our study protocol was approved by the Partners Human Research Committee.
Study Variables
We categorized insurance status as privately insured, uninsured, Medicaid, or Medicare. We defined privately insured patients as those having either Blue Cross or another commercial carrier listed as the primary payer and uninsured patients as those having either no charge or self‐pay listed as the primary payer.27 Other governmental payer categories were noted to share several characteristics with Medicare patients and comprised only a small proportion of the sample, and were thus included with Medicare. In order to account for NIS's sampling scheme and accurately apply sample weights in our analysis, we used Medicare as a separate category. However, since Medicare patients age 18 to 64 years represent a fundamentally different population that is primarily disabled or very ill, only results of privately insured, uninsured, and Medicaid patients are reported.
We selected in‐hospital mortality as the outcome measure and LOS and cost per hospitalization as measures of resource utilization. The NIS includes a binary indicator variable for in‐hospital mortality and specifies inpatient LOS in integers, with same‐day stays coded as 0. NIS's cost estimates are based on hospital cost reports submitted to the Centers for Medicare and Medicaid Services. To test the validity of our cost analyses, we performed parallel analyses using hospital charges as a measure of utilization (charges include hospital overhead, charity care, and bad debt). The resulting adjusted ratios differed little from cost ratios and we opted to report only the details of our cost analyses.
In order to assess the independent association between insurance status and the outcome measures listed above, we selected covariates for inclusion in multivariable models based on the existing literature. Patient covariates included: age group (18‐34 years, 35‐49 years, 50‐64 years), sex (male/female), race/ethnicity (non‐Hispanic white, non‐Hispanic black, Hispanic, other, missing), median income by zip code of residence (less than $37,000, $37,000‐$45,999, $46,000‐$60,999, $61,000 or more), admission through the emergency department (yes/no), admission on a weekend (yes/no), measures of disease severity, and comorbidity indicators. Measures of disease severity specific to each outcome are assigned in the NIS using criteria developed by Medstat (Medstat Disease Staging Software Version 5.2, Thomson Medstat Inc., Ann Arbor, MI). Severity is categorized into 5 levels, with a higher level indicating greater risk. We recorded comorbidities for each patient in our sample using HCUP Comorbidity Software, Version 3.2 (
Hospital covariates included: bed size (small, medium, large), ownership/control (private, government, private or government), geographic region (northeast, midwest, south, west), teaching status (teaching, non‐teaching), and the proportion of uninsured and Medicaid patients (combined) admitted to each hospital for AMI, stroke, or pneumonia. The actual number of hospital beds in each bed size category varies according to a hospital's geographic region and teaching status.27 Ownership/control, geographic region, and teaching status are assigned according to information from the American Hospital Association Annual Survey of Hospitals. The proportion of uninsured and Medicaid patients admitted to each hospital was found to have a nonmonotonic relationship with the outcomes being assessed and was thus treated as a 6‐level categorical variable with the following levels: 0% to 10%, 11% to 20%, 21% to 30%, 31% to 40%, 41% to 50%, and 51% to 100%.
Statistical Analysis
Summary statistics were constructed at the patient level and differences in proportions were evaluated with the chi‐square test. We employed direct standardization, using the age and sex distribution of the entire cohort, to compute age‐standardized and sex‐standardized estimates for each insurance group and compared them using the chi‐square test for in‐hospital mortality and t test for log transformed LOS and cost per hospitalization. For each condition, we developed multivariable logistic regression models for in‐hospital mortality and multivariable linear regression models for log transformed LOS and cost. The patient was the unit of analysis in all models.
In order to elucidate the contribution of disease severity and comorbidities and the proportion of uninsured and Medicaid patients admitted to each hospital, we fitted 3 sequential models for each outcome measure: Model 1 adjusted for patient sociodemographic characteristics and hospital characteristics with the exception of the covariate for the proportion of uninsured and Medicaid patients, Model 2 adjusted for all covariates in the preceding model as well as patients' comorbidities and severity of principal diagnosis, and Model 3 adjusted for all previously mentioned covariates as well as the proportion of uninsured and Medicaid patients admitted to each hospital. We excluded patients who died during hospitalization from the models for LOS and cost. We exponentiated the effect estimates from the log transformed linear regression models so that the adjusted ratio represents the percentage change in the mean LOS or mean cost.
To determine whether the association between patients' insurance status and in‐hospital mortality was modified by seeking care in hospitals treating a smaller or larger proportion of uninsured and Medicaid patients, we entered an interaction term for insurance status and proportion of uninsured and Medicaid patients in the final models (Model 3) for our primary outcome of in‐hospital mortality. However, since no significant interaction was found for any of the 3 conditions, this term was removed from the models and results from the interaction models are not described. In order to assess model specification for the linear regression models, we evaluated the normality of model residuals and found that these were approximately normally distributed. Lastly, we attempted to test the robustness of our analyses by creating fixed effects models that controlled for hospital site but were unable to do so due to the computational limitations of available software packages that could not render fixed effects models with more than 1000 hospital sites.
For all variables except race/ethnicity, data were missing for less than 3% of patients, so we excluded these individuals from adjusted analyses. However, race/ethnicity data were missing for 29% of the sample and were analyzed in 3 different ways, namely, with the missing data treated as a separate covariate level, with the missing data removed from the analysis, and with the missing data assigned to the majority covariate level (white race). The results of our analysis were unchanged no matter how the missing values were assigned. As a result, missing values for race/ethnicity were treated as a separate covariate level in the final analysis.15 Sociodemographic characteristics of patients with missing race/ethnicity information were similar to those with complete data.
We used SUDAAN (Release 9.0.1, Research Triangle Institute, NC) to account for NIS's sampling scheme and generalized estimating equations to adjust for the clustering of patients within hospitals and hospitals within sampling strata.29 In order to account for NIS's stratified probability sampling scheme, SUDAAN uses Taylor series linearization for robust variance estimation of descriptive statistics and regression parameters.30, 31 We present 2‐tailed P values or 95% confidence intervals (CIs) for all statistical comparisons.
Results
Patient and Hospital Characteristics
The final cohort comprised of 154,381 patients discharged from 1018 hospitals in 37 states during calendar year 2005 (Table 1). This cohort was representative of 755,346 working‐age Americans, representing approximately 225,947 cases of AMI (29.9%), 151,812 cases of stroke (20.1%), and 377,588 cases of pneumonia (50.0%). Of these patients, 47.5% were privately insured, 12.0% were uninsured, 17.0% received Medicaid, and 23.5% were assigned to Medicare. Compared with the privately insured, uninsured and Medicaid patients were generally younger, less likely to be white, more likely to have lower income, and more likely to be admitted through the emergency department. Of the 1018 hospitals included in our study, close to half (44.3%) were small, with bedsize ranging from 24 to 249. A large number of hospitals were located in the South (39.9%), and 14.9% were designated teaching hospitals.
| Characteristic* | Privately insured (n = 73,256) | Uninsured (n = 18,531) | Medicaid (n = 26,222) |
|---|---|---|---|
| |||
| Principal diagnosis (%) | |||
| Acute myocardial infarction | 36.7 | 31.2 | 19.7 |
| Stroke | 20.6 | 23.7 | 19.9 |
| Pneumonia | 42.7 | 45.2 | 60.4 |
| Age group (%) | |||
| 18‐34 years | 6.8 | 13.0 | 13.7 |
| 35‐49 years | 27.6 | 36.9 | 33.2 |
| 50‐64 years | 65.7 | 50.1 | 53.2 |
| Male sex (%) | 59.3 | 62.3 | 46.6 |
| Race or ethnicity (%) | |||
| White | 55.7 | 41.5 | 38.0 |
| Black | 7.6 | 14.8 | 16.6 |
| Hispanic | 4.8 | 10.5 | 10.4 |
| Other race | 3.6 | 4.7 | 5.2 |
| Missing | 28.4 | 29.0 | 29.7 |
| Median income by ZIP code (%) | |||
| <$37,000 | 21.5 | 36.7 | 43.0 |
| $37,000‐$45,999 | 25.2 | 27.8 | 27.1 |
| $46,000‐$60,999 | 26.3 | 20.3 | 17.6 |
| $61,000 | 24.8 | 11.5 | 8.4 |
| Emergency admission (%) | 63.3 | 75.6 | 72.9 |
| Weekend admission (%) | 24.5 | 26.2 | 25.1 |
| Hospital bed size (%) | |||
| Small | 8.9 | 10.3 | 11.4 |
| Medium | 24.0 | 22.3 | 25.9 |
| Large | 67.1 | 67.5 | 62.8 |
| Hospital control (%) | |||
| Private | 33.8 | 34.8 | 34.4 |
| Government (nonfederal) | 6.7 | 9.7 | 8.3 |
| Private or government | 59.5 | 55.5 | 57.3 |
| Hospital region (%) | |||
| Northeast | 17.4 | 12.5 | 17.6 |
| Midwest | 25.7 | 19.4 | 20.9 |
| South | 39.5 | 56.8 | 42.4 |
| West | 17.4 | 11.3 | 19.2 |
| Teaching hospital (%) | 41.7 | 43.8 | 43.3 |
Compared with privately insured patients, a larger proportion of uninsured and Medicaid patients had higher predicted mortality levels (Table 2). Medicaid patients had a disproportionately higher predicted LOS, whereas predicted resource demand was higher among privately insured patients. Hypertension (48%), chronic pulmonary disease (29.5%), and uncomplicated diabetes (21.5%) were the 3 most common comorbidities in the study cohort, with a generally higher prevalence of comorbidities among Medicaid patients.
| Characteristic* | Privately insured (n = 73,256) | Uninsured (n = 18,531) | Medicaid (n = 26,222) |
|---|---|---|---|
| |||
| Medstat disease staging (%) | |||
| Mortality level 1 | 50.8 | 45.4 | 36.7 |
| Mortality level 2 | 44.0 | 49.1 | 56.7 |
| Mortality level 3 | 5.3 | 5.5 | 6.7 |
| Length of stay level 1 | 66.8 | 71.6 | 53.8 |
| Length of stay level 2 | 28.5 | 24.5 | 39.3 |
| Length of stay level 3 | 4.8 | 3.8 | 6.9 |
| Resource demand level 1 | 45.2 | 54.2 | 48.5 |
| Resource demand level 2 | 40.5 | 34.2 | 39.2 |
| Resource demand level 3 | 14.2 | 11.7 | 12.3 |
| Coexisting medical conditions (%) | |||
| Congestive heart failure | 4.7 | 4.8 | 10.1 |
| Valvular disease | 2.8 | 2.0 | 2.7 |
| Pulmonary circulation disease | 0.8 | 0.6 | 1.5 |
| Peripheral vascular disease | 3.2 | 2.2 | 3.2 |
| Paralysis | 1.2 | 0.8 | 3.5 |
| Other neurological disorders | 2.4 | 1.9 | 7.3 |
| Chronic pulmonary disease | 23.6 | 22.4 | 37.7 |
| Uncomplicated diabetes | 19.6 | 18.6 | 23.4 |
| Complicated diabetes | 3.3 | 2.1 | 4.9 |
| Hypothyroidism | 5.6 | 2.7 | 4.7 |
| Renal failure | 3.0 | 1.9 | 5.6 |
| Liver disease | 1.6 | 2.5 | 4.4 |
| Peptic ulcer disease | <0.5 | <0.5 | <0.5 |
| AIDS | 0.1 | 0.1 | 0.4 |
| Lymphoma | 1.1 | 0.4 | 0.6 |
| Metastatic cancer | 2.1 | 0.7 | 2.2 |
| Non‐metastatic solid tumor | 1.5 | 0.8 | 2.1 |
| Collagen vascular diseases | 2.3 | 0.9 | 2.3 |
| Coagulopathy | 2.7 | 2.4 | 3.4 |
| Obesity | 10.3 | 8.2 | 9.3 |
| Weight loss | 1.6 | 1.8 | 3.3 |
| Fluid and electrolyte disorders | 18.3 | 19.4 | 23.8 |
| Chronic blood loss anemia | 0.6 | 0.6 | 0.8 |
| Deficiency anemias | 8.6 | 8.5 | 13.4 |
| Alcohol abuse | 3.3 | 9.8 | 8.3 |
| Drug abuse | 1.9 | 10.2 | 9.8 |
| Psychoses | 1.5 | 1.9 | 6.8 |
| Depression | 7.2 | 4.8 | 9.9 |
| Hypertension | 48.0 | 44.1 | 45.7 |
In‐Hospital Mortality
Compared with the privately insured, age‐standardized and sex‐standardized in‐hospital mortality for AMI and stroke was significantly higher for uninsured and Medicaid patients (Table 3). Among pneumonia patients, Medicaid recipients had significantly higher in‐hospital mortality compared with privately insured and uninsured patients.
| Privately Insured | Uninsured | Medicaid | |
|---|---|---|---|
| |||
| In‐hospital mortality, rate per 100 discharges (SE) | |||
| Acute myocardial infarction | 2.22 (0.10) | 4.03 (0.31)* | 4.57 (0.34)* |
| Stroke | 7.49 (0.27) | 10.46 (0.64)* | 9.89 (0.45)* |
| Pneumonia | 1.75 (0.09) | 1.74 (0.18) | 2.48 (0.14)* |
| Length of stay, mean (SE), days | |||
| Acute myocardial infarction | 4.17 (0.06) | 4.46 (0.09) | 5.85 (0.16) |
| Stroke | 6.37 (0.13) | 7.15 (0.25) | 9.28 (0.30) |
| Pneumonia | 4.89 (0.05) | 4.64 (0.10) | 5.80 (0.08) |
| Cost per episode, mean (SE), dollars | |||
| Acute myocardial infarction | 21,077 (512) | 19,977 (833) | 22,452 (841) |
| Stroke | 16,022 (679) | 14,571 (1,036) | 18,462 (824) |
| Pneumonia | 8,223 (192) | 7,086 (293) | 9,479 (271) |
After multivariable adjustment for additional patient and hospital characteristics, uninsured AMI and stroke patients continued to have significantly higher in‐hospital mortality compared with the privately insured (Table 4). Among pneumonia patients, Medicaid recipients persisted in having significantly higher in‐hospital mortality than the privately insured.
| Model 1* | Model 2 | Model 3 | |
|---|---|---|---|
| |||
| In‐hospital mortality, adjusted odds ratio (95% CI) | |||
| Acute Myocardial Infarction | |||
| Uninsured vs. privately insured | 1.59 (1.35‐1.88) | 1.58 (1.30‐1.93) | 1.52 (1.24‐1.85) |
| Medicaid vs. privately insured | 1.83 (1.54‐2.18) | 1.22 (0.99‐1.50) | 1.15 (0.94‐1.42) |
| Stroke | |||
| Uninsured vs. privately insured | 1.56 (1.35‐1.80) | 1.50 (1.30‐1.73) | 1.49 (1.29‐1.72) |
| Medicaid vs. privately insured | 1.32 (1.15‐1.52) | 1.09 (0.93‐1.27) | 1.08 (0.93‐1.26) |
| Pneumonia | |||
| Uninsured vs. privately insured | 0.99 (0.81‐1.21) | 1.12 (0.91‐1.39) | 1.10 (0.89‐1.36) |
| Medicaid vs. privately insured | 1.41 (1.20‐1.65) | 1.24 (1.04‐1.48) | 1.21 (1.01‐1.45) |
| Length of stay, adjusted ratio (95% CI)| | |||
| Acute Myocardial Infarction | |||
| Uninsured vs. privately insured | 1.00 (0.98‐1.02) | 1.00 (0.98‐1.02) | 1.00 (0.98‐1.02) |
| Medicaid vs. privately insured | 1.17 (1.14‐1.21) | 1.07 (1.05‐1.09) | 1.07 (1.05‐1.09) |
| Stroke | |||
| Uninsured vs. privately insured | 1.06 (1.02‐1.10) | 1.08 (1.04‐1.11) | 1.07 (1.04‐1.11) |
| Medicaid vs. privately insured | 1.30 (1.26‐1.34) | 1.17 (1.14‐1.20) | 1.17 (1.14‐1.20) |
| Pneumonia | |||
| Uninsured vs. privately insured | 0.95 (0.93‐0.97) | 0.96 (0.94‐0.99) | 0.96 (0.94‐0.98) |
| Medicaid vs. privately insured | 1.15 (1.13‐1.17) | 1.04 (1.03‐1.06) | 1.04 (1.03‐1.06) |
| Cost per episode, adjusted ratio (95% CI)| | |||
| Acute Myocardial Infarction | |||
| Uninsured vs. privately insured | 0.97 (0.95‐0.99) | 0.99 (0.97‐1.00) | 0.99 (0.97‐1.00) |
| Medicaid vs. privately insured | 1.01 (0.98‐1.04) | 0.99 (0.97‐1.01) | 0.99 (0.97‐1.01) |
| Stroke | |||
| Uninsured vs. privately insured | 0.97 (0.93‐1.02) | 1.00 (0.96‐1.03) | 1.00 (0.97‐1.03) |
| Medicaid vs. privately insured | 1.17 (1.13‐1.21) | 1.06 (1.04‐1.09) | 1.06 (1.04‐1.09) |
| Pneumonia | |||
| Uninsured vs. privately insured | 0.95 (0.92‐0.97) | 0.98 (0.96‐1.00) | 0.98 (0.96‐1.00) |
| Medicaid vs. privately insured | 1.17 (1.15‐1.19) | 1.05 (1.04‐1.07) | 1.05 (1.04‐1.07) |
LOS
Among AMI and stroke patients, age‐standardized and sex‐standardized mean LOS was significantly longer for the uninsured and Medicaid recipients compared with the privately insured (Table 3). Among pneumonia patients, the uninsured had a slightly shorter mean LOS compared with the privately insured whereas Medicaid recipients averaged the longest LOS.
These insurance‐related disparities in LOS among pneumonia patients persisted after multivariable adjustment (Table 4). Among AMI patients, only Medicaid recipients persisted in having a significantly longer LOS than the privately insured. Among stroke patients, both the uninsured and Medicaid recipients averaged a longer LOS compared with the privately insured.
Cost per Episode
For all 3 conditions, the uninsured had significantly lower age‐standardized and sex‐standardized costs compared with the privately insured (Table 3). However, Medicaid patients had higher costs than the privately insured for all three conditions, significantly so among patients with stroke and pneumonia.
These insurance‐related disparities in costs persisted in multivariable analyses (Table 4). The uninsured continued to have lower costs compared with the privately insured, significantly so for patients with AMI and pneumonia. Among stroke and pneumonia patients, Medicaid recipients continued to accrue higher costs than the uninsured or privately insured.
Discussion
In this nationally representative study of working‐age Americans hospitalized for 3 common medical conditions, we found that insurance status was associated with significant variations in in‐hospital mortality and resource use. Whereas privately insured patients experienced comparatively lower in‐hospital mortality in most cases, mortality risk was highest among the uninsured for 2 of the 3 common causes of noncancer inpatient deaths. Although previous studies have examined insurance‐related disparities in inpatient care for individual diagnoses and specific populations, no broad overview of this important issue has been published in the past decade. In light of the current economic recession and national healthcare debate, these findings may be a prescient indication of a widening insurance gap in the quality of hospital care.
There are several potential mechanisms for these disparities. For instance, Hadley et al.9 reported significant underuse of high‐cost or high‐discretion procedures among the uninsured in their analysis of a nationally representative sample of 592,598 hospitalized patients. Similarly, Burstin et al.10 found that among a population of 30,195 hospitalized patients with diverse diagnoses, the uninsured were at greater risk for receiving substandard care regardless of hospital characteristics. These, and other similar findings,7, 8, 19 are suggestive of differences in the way uninsured patients are generally managed in the hospital that may partly explain the disparities reported herein.
More specifically, analyses of national registries of AMI have documented lower rates of utilization of invasive, potentially life‐saving, cardiac interventions among the uninsured.16, 17 Similarly, a lower rate of carotid endarterectomy was reported among uninsured stroke patients from an analysis of the 2002 NIS.15 Other differences in inpatient management unmeasured by administrative data, such as the use of subspecialists and allied health professionals, may also contribute.32 Unfortunately, limitations in the available data prevented us from being able to appropriately address the important issue of insurance related differences in the utilization of specific inpatient procedures.
These disparities may also be indicative of differences in severity of illness that are not captured fully by the MedStat disease staging criteria. The uninsured might have more severe illness at admission, either due to the presence of more advanced chronic disease or delay in seeking care for the acute episode. AMI and stroke are usually the culmination of longstanding atherosclerosis that is amenable to improvement through timely and consistent risk‐factor modification. Not having a usual source of medical care,6, 33 inadequate screening and management of known risk‐factors,3, 34 and difficulties in obtaining specialty care5 among the uninsured likely increases their risk of being hospitalized with more advanced disease. The higher likelihood of being admitted through the emergency department19 and on weekends9 among the uninsured lends credence to the possibility of delays in seeking care. All of these are potential mediators of higher AMI and stroke mortality in uninsured patients.
Finally, these mortality differences could also be due to the additional risks imposed by poorly managed comorbidities among uninsured patients. Although we controlled for the presence of comorbidities in our analysis, we lacked data about the severity of individual comorbidities. A recent study reported significant lapses in follow‐up care after the onset of a chronic condition in uninsured individuals under 65 years of age.34 Other studies have also documented insurance related disparities in the care of chronic diseases3, 35 that were among the most common comorbidities in our cohort.
Most of the reasons for insurance‐related disparities noted above for the uninsured are also applicable to Medicaid patients. Differences in the intensity of inpatient care,7, 8, 1519 limited access to health care services,2, 14 unmet health needs,5 and suboptimal management of chronic medical conditions35 were also reported for Medicaid patients in prior research. These factors likely contributed to the higher in‐hospital mortality in this patient population, evidenced by the sequential decrease in odds after adjusting for comorbidities and disease severity. Medicaid patients hospitalized for stroke were noted to have significantly longer LOS, which could plausibly be due to difficulties with arranging appropriate discharge disposition; the higher likelihood of paralysis among these patients15 would likely necessitate a higher frequency of rehabilitation facility placement. The higher costs for Medicaid patients with stroke and pneumonia may potentially be the result of these patients longer LOS. Although cost differences between the uninsured and privately insured were statistically significant, these were not large enough to be of material significance.
Limitations
Our study has several limitations. Since the NIS does not assign unique patient identifiers that would permit tracking of readmissions, we excluded patients transferred to another acute‐care hospital from our study to avoid counting the same patient twice. However, only 10% of hospitalized patients underwent transfer for cardiac procedures in the National Registry of Myocardial Infarction, with privately insured patients more likely to be transferred than other insurance groups.17 Since these patients are also more likely to have better survival, their exclusion likely biased our study toward the null. The same is probable for stroke patients as well.
Some uninsured patients begin Medicaid coverage during hospitalization and should ideally be counted as uninsured but were included under Medicaid in our analysis. They are also likely to be state‐ and plan‐specific variations in Medicaid and private payer coverage that we could not incorporate into our analysis. In addition, we were unable to include deaths that may have occurred shortly after discharge, even though these may have been related to the quality of hospital care. Furthermore, although the 3 conditions we studied are common and responsible for a large number of hospital deaths, they make up about 8% of total annual hospital discharges,23 and caution should be exercised in generalizing our findings to the full spectrum of hospitalizations. Lastly, it is possible that unmeasured confounding could be responsible for the observed associations. Uninsured and Medicaid patients are likely to have more severe disease, which may not be adequately captured by the administrative data available in the NIS. If so, this would explain the mortality association rather than insurance status.36, 37
Conclusions
Significant insurance‐related differences in mortality exist for 2 of the leading causes of noncancer inpatient deaths among working‐age Americans. Further studies are needed to determine whether provider sensitivity to insurance status or unmeasured sociodemographic and clinical prognostic factors are responsible for these disparities. Policy makers, hospital administrators, and physicians should be cognizant of these disparities and consider policies to address potential insurance related gaps in the quality of inpatient care.
- , .The U.S. economy and changes in health insurance coverage, 2000‐2006.Health Aff (Millwood).2008;27(2):w135‐w144.
- , , .Rates of avoidable hospitalization by insurance status in Massachusetts and Maryland.JAMA.1992;268(17):2388‐2394.
- , , , et al.Unmet health needs of uninsured adults in the United States.JAMA.2000;284(16):2061‐2069.
- , , .Health insurance and access to care for symptomatic conditions.Arch Intern Med.2000;160(9):1269‐1274.
- , , , et al.Access to specialty care and medical services in community health centers.Health Aff (Millwood).2007;26(5):1459‐1468.
- , , , et al.A national study of chronic disease prevalence and access to care in uninsured U.S. adults.Ann Intern Med.2008;149:170–176.
- , , , .Relationship between patient source of payment and the intensity of hospital services.Med Care.1988;26(11):1111‐1114.
- , , .The association of payer with utilization of cardiac procedures in Massachusetts.JAMA.1990;264(10):1255‐1260.
- , , .Comparison of uninsured and privately insured hospital patients: condition on admission, resource use, and outcome.JAMA.1991;265:374–379.
- , , .Socioeconomic status and risk for substandard medical care.JAMA.1992;268(17):2383‐2387.
- , , , .The relation between health insurance coverage and clinical outcomes among women with breast cancer.N Engl J Med.1993;329(5):326‐331.
- , , .Health insurance and mortality. Evidence from a national cohort.JAMA.1993;270(6):737‐741.
- , , , .Mortality in the uninsured compared with that in persons with public and private health insurance.Arch Intern Med.1994;154(21):2409‐2416.
- .Medicaid policy and the substitution of hospital outpatient care for physician care.Health Serv Res.1989;24:33–66.
- , .Disparities in outcomes among patients with stroke associated with insurance status.Stroke.2007;38(3):1010‐1016.
- , , , et al.Influence of payor on use of invasive cardiac procedures and patient outcome after myocardial infarction in the United States. Participants in the National Registry of Myocardial Infarction.J Am Coll Cardiol.1998;31(7):1474‐1480.
- , , , et al.Payer status and the utilization of hospital resources in acute myocardial infarction: a report from the National Registry of Myocardial Infarction 2.Arch Intern Med.2000;160(6):817–823.
- , , , et al.Insurance coverage and care of patients with non‐ST‐segment elevation acute coronary syndromes.Ann Intern Med.2006;145(10):739–748.
- , , .Comparing uninsured and privately insured hospital patients: Admission severity, health outcomes and resource use.Health Serv Manage Res.2001;14(3):203–210.
- Healthcare Cost and Utilization Project. Introduction to the HCUP Nationwide Inpatient Sample (NIS) 2005. Rockville, MD: Agency for Healthcare Research and Quality; 2007:6. Available at: www.hcup‐us.ahrq.gov/db/nation/nis/NIS_Introduction_2005.pdf. Accessed February2010.
- Healthcare Cost and Utilization Project. Design of the Nationwide Inpatient Sample (NIS) 2005. Rockville, MD: Agency for Healthcare Research and Quality; 2007. Available at: www.hcup‐us.ahrq.gov/db/nation/nis/reports/NIS_2005_Design_Report.pdf. Accessed February2010.
- AHRQ Quality Indicators. Inpatient Quality Indicators: Technical Specifications. Version 3.1 (March 12, 2007). Available at: www.qualityindicators.ahrq.gov/downloads/iqi/iqi_technical_specs_v31.pdf. Accessed February2010.
- , , . National Hospital Discharge Survey: 2005 annual summary with detailed diagnosis and procedure data. Washington, DC: National Center for Health Statistics; 2007. Vital and Health Statistics 13(165). Available at: www.cdc.gov/nchs/data/series/sr_13/sr13_165.pdf. Accessed February2010.
- AHRQ Quality Indicators. Guide to Inpatient Quality Indicators: Quality of Care in Hospitals—Volume, Mortality, and Utilization. Version 3.1 (March 12, 2007). Available at: www.qualityindicators.ahrq.gov/downloads/iqi/iqi_guide_v31.pdf. Accessed February2010.
- , , .Income, poverty, and health insurance coverage in the United States: 2006.Washington, DC:US Census Bureau. Current Population Reports;2007:60–233.
- , . Conditions Related to Uninsured Hospitalizations, 2003. HCUP Statistical Brief #8. Rockville, MD: Agency for Healthcare Research and Quality; 2006:6. Available at: www.hcup‐us.ahrq.gov/reports/statbriefs/sb8.pdf. Accessed February2010.
- Healthcare Cost and Utilization Project. NIS Description of Data Elements. Available at: www.hcup‐us.ahrq.gov/db/nation/nis/nisdde.jsp. Accessed February2010.
- , , , .Comorbidity measures for use with administrative data.Med Care.1998;36:8–27.
- SUDAAN User's Manual, Release 9.0. Research TrianglePark, NC:Research Triangle Institute;2006.
- , . Final Report on Calculating Nationwide Inpatient Sample (NIS) Variances, 2001. HCUP Methods Series Report #2003‐2. Online June 2005 (revised June 6, 2005). U.S. Agency for Healthcare Research and Quality. Available at: www.hcup‐us.ahrq.gov/reports/CalculatingNISVariances200106092005.pdf. Accessed February2010.
- .On the variances of asymptotically normal estimators from complex surveys.Int Stat Rev.1983;51:279–292.
- , , , et al.Patient characteristics associated with care by a cardiologist among adults hospitalized with severe congestive heart failure.J Am Coll Cardiol.2000;36:2119–2125.
- , . Summary health statistics for U.S. adults: National Health Interview Survey, 2006. Washington, DC: National Center for Health Statistics; 2007:12. Vital and Health Statistics 10(235). Available at: www.cdc.gov/nchs/data/series/sr_10/sr10_235.pdf. Accessed February2010.
- .Insurance coverage, medical care use, and short‐term health changes following an unintentional injury or the onset of a chronic condition.JAMA.2007;297(10):1073–1084.
- , , , et al.The quality of chronic disease care in U.S. community health centers.Health Aff (Millwood).2006;25(6):1712–1723.
- , , , , , .Risk‐adjusting hospital inpatient mortality using automated inpatient, outpatient, and laboratory databases.Med Care.2008;46(3):232–239.
- , , , .The Kaiser Permanente inpatient risk adjustment methodology was valid in an external patient population.J Clin Epidemiol. [E‐pub ahead of print].
- , .The U.S. economy and changes in health insurance coverage, 2000‐2006.Health Aff (Millwood).2008;27(2):w135‐w144.
- , , .Rates of avoidable hospitalization by insurance status in Massachusetts and Maryland.JAMA.1992;268(17):2388‐2394.
- , , , et al.Unmet health needs of uninsured adults in the United States.JAMA.2000;284(16):2061‐2069.
- , , .Health insurance and access to care for symptomatic conditions.Arch Intern Med.2000;160(9):1269‐1274.
- , , , et al.Access to specialty care and medical services in community health centers.Health Aff (Millwood).2007;26(5):1459‐1468.
- , , , et al.A national study of chronic disease prevalence and access to care in uninsured U.S. adults.Ann Intern Med.2008;149:170–176.
- , , , .Relationship between patient source of payment and the intensity of hospital services.Med Care.1988;26(11):1111‐1114.
- , , .The association of payer with utilization of cardiac procedures in Massachusetts.JAMA.1990;264(10):1255‐1260.
- , , .Comparison of uninsured and privately insured hospital patients: condition on admission, resource use, and outcome.JAMA.1991;265:374–379.
- , , .Socioeconomic status and risk for substandard medical care.JAMA.1992;268(17):2383‐2387.
- , , , .The relation between health insurance coverage and clinical outcomes among women with breast cancer.N Engl J Med.1993;329(5):326‐331.
- , , .Health insurance and mortality. Evidence from a national cohort.JAMA.1993;270(6):737‐741.
- , , , .Mortality in the uninsured compared with that in persons with public and private health insurance.Arch Intern Med.1994;154(21):2409‐2416.
- .Medicaid policy and the substitution of hospital outpatient care for physician care.Health Serv Res.1989;24:33–66.
- , .Disparities in outcomes among patients with stroke associated with insurance status.Stroke.2007;38(3):1010‐1016.
- , , , et al.Influence of payor on use of invasive cardiac procedures and patient outcome after myocardial infarction in the United States. Participants in the National Registry of Myocardial Infarction.J Am Coll Cardiol.1998;31(7):1474‐1480.
- , , , et al.Payer status and the utilization of hospital resources in acute myocardial infarction: a report from the National Registry of Myocardial Infarction 2.Arch Intern Med.2000;160(6):817–823.
- , , , et al.Insurance coverage and care of patients with non‐ST‐segment elevation acute coronary syndromes.Ann Intern Med.2006;145(10):739–748.
- , , .Comparing uninsured and privately insured hospital patients: Admission severity, health outcomes and resource use.Health Serv Manage Res.2001;14(3):203–210.
- Healthcare Cost and Utilization Project. Introduction to the HCUP Nationwide Inpatient Sample (NIS) 2005. Rockville, MD: Agency for Healthcare Research and Quality; 2007:6. Available at: www.hcup‐us.ahrq.gov/db/nation/nis/NIS_Introduction_2005.pdf. Accessed February2010.
- Healthcare Cost and Utilization Project. Design of the Nationwide Inpatient Sample (NIS) 2005. Rockville, MD: Agency for Healthcare Research and Quality; 2007. Available at: www.hcup‐us.ahrq.gov/db/nation/nis/reports/NIS_2005_Design_Report.pdf. Accessed February2010.
- AHRQ Quality Indicators. Inpatient Quality Indicators: Technical Specifications. Version 3.1 (March 12, 2007). Available at: www.qualityindicators.ahrq.gov/downloads/iqi/iqi_technical_specs_v31.pdf. Accessed February2010.
- , , . National Hospital Discharge Survey: 2005 annual summary with detailed diagnosis and procedure data. Washington, DC: National Center for Health Statistics; 2007. Vital and Health Statistics 13(165). Available at: www.cdc.gov/nchs/data/series/sr_13/sr13_165.pdf. Accessed February2010.
- AHRQ Quality Indicators. Guide to Inpatient Quality Indicators: Quality of Care in Hospitals—Volume, Mortality, and Utilization. Version 3.1 (March 12, 2007). Available at: www.qualityindicators.ahrq.gov/downloads/iqi/iqi_guide_v31.pdf. Accessed February2010.
- , , .Income, poverty, and health insurance coverage in the United States: 2006.Washington, DC:US Census Bureau. Current Population Reports;2007:60–233.
- , . Conditions Related to Uninsured Hospitalizations, 2003. HCUP Statistical Brief #8. Rockville, MD: Agency for Healthcare Research and Quality; 2006:6. Available at: www.hcup‐us.ahrq.gov/reports/statbriefs/sb8.pdf. Accessed February2010.
- Healthcare Cost and Utilization Project. NIS Description of Data Elements. Available at: www.hcup‐us.ahrq.gov/db/nation/nis/nisdde.jsp. Accessed February2010.
- , , , .Comorbidity measures for use with administrative data.Med Care.1998;36:8–27.
- SUDAAN User's Manual, Release 9.0. Research TrianglePark, NC:Research Triangle Institute;2006.
- , . Final Report on Calculating Nationwide Inpatient Sample (NIS) Variances, 2001. HCUP Methods Series Report #2003‐2. Online June 2005 (revised June 6, 2005). U.S. Agency for Healthcare Research and Quality. Available at: www.hcup‐us.ahrq.gov/reports/CalculatingNISVariances200106092005.pdf. Accessed February2010.
- .On the variances of asymptotically normal estimators from complex surveys.Int Stat Rev.1983;51:279–292.
- , , , et al.Patient characteristics associated with care by a cardiologist among adults hospitalized with severe congestive heart failure.J Am Coll Cardiol.2000;36:2119–2125.
- , . Summary health statistics for U.S. adults: National Health Interview Survey, 2006. Washington, DC: National Center for Health Statistics; 2007:12. Vital and Health Statistics 10(235). Available at: www.cdc.gov/nchs/data/series/sr_10/sr10_235.pdf. Accessed February2010.
- .Insurance coverage, medical care use, and short‐term health changes following an unintentional injury or the onset of a chronic condition.JAMA.2007;297(10):1073–1084.
- , , , et al.The quality of chronic disease care in U.S. community health centers.Health Aff (Millwood).2006;25(6):1712–1723.
- , , , , , .Risk‐adjusting hospital inpatient mortality using automated inpatient, outpatient, and laboratory databases.Med Care.2008;46(3):232–239.
- , , , .The Kaiser Permanente inpatient risk adjustment methodology was valid in an external patient population.J Clin Epidemiol. [E‐pub ahead of print].
Copyright © 2010 Society of Hospital Medicine