User login
A Small Kindness
On August 6, 2009, my vigorously healthy 59‐year‐old brother‐in‐law, a beloved husband and father of 2 sons, developed mild right hand clumsiness and slight slurring of speech. This led to a primary care visit and the symptoms were originally felt to be related to working long hours and stress. The symptoms failed to improve and on August 11th, an magnetic resonance imaging (MRI) made a shocking discovery, my brother‐in‐law had a brain tumor. He was seen in the Neurosurgery department of a major academic center the following day and on August 13th he underwent resection of the majority of the tumor with a pathologic finding of grade IV glioblastoma multiforme (GBM).
During this initial admission, a consultation was obtained from a neuro‐oncologist who would then become the principle director of his care. My brother‐in‐law was crystal clear with his physicians; he wanted honest information about what to expect. From the outset he understood this was an incurable disease, but hoped that with aggressive treatment, he could live for months, possibly even years. He started chemotherapy almost immediately and in early October started a 6‐week course of daily radiation. The early weeks went relatively well. He saw his oncologist regularly and stayed in close contact with his oncology nurse. With his engineering background and attention to details, he followed his physician's instructions to the letter; however, despite his very best efforts at compliance and working intensively with physical therapy he was becoming progressively weaker.
In early November, a follow‐up MRI appeared to show progression of tumor and on November 12th, a second resection was undertaken. Pathologically, this seemed successful with removal of tumor bulk, but he was left even weaker, particularly on the right side. His symptoms were managed with dexamethasone; however, aphasia and hemiparesis would always reemerge with attempts to taper the drug and his functional status was too poor to allow for further chemotherapy. As his communication ability was becoming more limited, my sister‐in‐law was increasingly becoming his spokesperson at doctor visits and with phone updates to his oncology nurse.
On January 21, 2010 after working with a home physical therapist, he was making a transfer and became nonresponsive. Paramedics were called, arriving within minutes, but he was found pulseless. Despite a heroic resuscitative effort, he was pronounced dead at a nearby hospital a short time thereafter. A postmortem was not performed and the presumptive cause of death was pulmonary embolism.
His funeral was January 29th.
My brother‐in‐law and I lived 1600 miles apart and saw each other on only the rarest occasions. When the diagnosis was made, my role changed as I am the only relative within the extended family with medical expertise. Questions were directed to me via e‐mails and I did my best using UpToDate and other resources to learn about GBM and relay this information back to the family.
Recently, and in a vicarious way, I was becoming more and more deeply involved. Using the best descriptions of functional status that I could extract from e‐mail and phone calls, I estimated his Karnofsky Performance Score as being fairly poor. By way of my e‐mails to him and his wife, I was just beginning, ever so gently, to touch on the subject of hospice care at the time of his sudden death.
At the visitation and reception following the funeral, I think I was seen as more than a distant brother‐in‐law; I was also seen as a surrogate for the medical profession and for his doctors in particular. One message that I got loud and clear, from more than 1 family member was the devastated, abandoned feeling that was emerging in the 8 days since his death. On the morning following his death, my sister‐in‐law called his physician's office and told his oncology nurse that her husband had died suddenly and unexpectedly the night before. The nurse expressed sympathy and indicated she would relay this information to his doctor and she would personally call back. As of the time I left to return home, that was the last communication any family member had received from anyone involved in his care.
Although the outpouring of community support and sympathy was powerful and touching, not a single condolence card or phone call came from his doctor. I was shocked at the suddenness of his death, but I was also shocked at the complete absence of any communication, any acknowledgement of his courageous struggle against a terrible illness, or of his family's depth of caring and love over these last few months.
I am reminded of an essay by Gregory Kane, MD in CHEST,1 in which he describes a disturbing personal encounter with the following;
In a personal and memorable patient encounter, I sat and listened while a tearful patient cried at having received no contact from the physician who treated her husband for metastatic lung cancer for a treatment duration of 9 months. As I struggled to comprehend her sense of pain and abandonment, I considered offering as possible explanation that the physician may not have been on call at the time of the death and may have mistakenly believed that his partner had offered such a gesture verbally. Before I could respond, however, my patient added that her veterinarian had sent a card when the family dog died. I was speechless.1
As Hospitalists, we are gifted and privileged to work closely with patients and their loved ones struggling with the existential and eternal questions of life and death. As we can all well attest from 6 PM family meetings, the unit‐of‐care extends beyond the patient and certainly includes the loving and caring members of the patient's family and close support system. If we fail to acknowledge a family's bereavement, we run the risk of unintentionally communicating the message that the patient was not important, that their suffering did not matter or that the crushing grief the family may be bearing is somehow insignificant compared to our busy schedules.
I have asked you to join me on this short journey my brother‐in‐law has taken these last few months in the interest of raising awareness. There are many occasions when a verbal, bedside expression of condolence is very appropriate and completely adequate. There are other times when a condolence letter will better facilitate the closure of the physician‐patient‐family relationship. This may be intimidating, both the extra work involved and especially the challenge of not knowing what to say. The article quoted above by Dr. Kane is an excellent resource for guidance concerning content, style, and other writing considerations. Using examples, such as a letter from Abraham Lincoln to a girl whose father died in the Civil War, he shows that this essential communication does not have to be lengthy or difficult. Another excellent resource can be found in the New England Journal of Medicine; The Doctor's Letter of Condolence.2 See Table 1 for suggestions to help with bereavement communications.
| Handwritten on a card or stationary. |
| Timely (within 1‐2 weeks of death). |
| Use sensitive, caring language and avoid clich. |
| Acknowledge the family's grief and loss. |
| Acknowledge the patient's courage or other qualities. |
| Mention the privilege it has been to work with the patient. |
| Mention your appreciation of the family's caring. |
| Avoid sincerely yours and end on a personal note such as suggesting your thoughts are with them at this most difficult time. |
We are the profession of Hospital Medicine. It is our knowledge, our hope, our compassion, our experience and judgment that often directs care at the end‐of‐life for many of our patients. We are teammates along with the primary care provider, subspecialty consultants, palliative care specialists and other members of the care team. We have a professional obligation to extend a thoughtful condolence to surviving family members and to contact other members of the care team so that they too may have this opportunity. The responsibility for the final closure rests with us and within this responsibility is a powerful fulfillment of the promise of the practice of medicine.
The condolence note is a small kindness, a part of the art of medicine, a part of our humanness and essential to our vision of patient‐centered hospital care.
- .A Dying Art?: The Doctor's Letter of Condolence.Chest.2007;131(4):1245–1247. Permission for use obtained by direct communication with the author on January 31, 2010.
- ,,.The doctor's letter of condolence.N Engl J Med.2001;344(15):1162–1163.
On August 6, 2009, my vigorously healthy 59‐year‐old brother‐in‐law, a beloved husband and father of 2 sons, developed mild right hand clumsiness and slight slurring of speech. This led to a primary care visit and the symptoms were originally felt to be related to working long hours and stress. The symptoms failed to improve and on August 11th, an magnetic resonance imaging (MRI) made a shocking discovery, my brother‐in‐law had a brain tumor. He was seen in the Neurosurgery department of a major academic center the following day and on August 13th he underwent resection of the majority of the tumor with a pathologic finding of grade IV glioblastoma multiforme (GBM).
During this initial admission, a consultation was obtained from a neuro‐oncologist who would then become the principle director of his care. My brother‐in‐law was crystal clear with his physicians; he wanted honest information about what to expect. From the outset he understood this was an incurable disease, but hoped that with aggressive treatment, he could live for months, possibly even years. He started chemotherapy almost immediately and in early October started a 6‐week course of daily radiation. The early weeks went relatively well. He saw his oncologist regularly and stayed in close contact with his oncology nurse. With his engineering background and attention to details, he followed his physician's instructions to the letter; however, despite his very best efforts at compliance and working intensively with physical therapy he was becoming progressively weaker.
In early November, a follow‐up MRI appeared to show progression of tumor and on November 12th, a second resection was undertaken. Pathologically, this seemed successful with removal of tumor bulk, but he was left even weaker, particularly on the right side. His symptoms were managed with dexamethasone; however, aphasia and hemiparesis would always reemerge with attempts to taper the drug and his functional status was too poor to allow for further chemotherapy. As his communication ability was becoming more limited, my sister‐in‐law was increasingly becoming his spokesperson at doctor visits and with phone updates to his oncology nurse.
On January 21, 2010 after working with a home physical therapist, he was making a transfer and became nonresponsive. Paramedics were called, arriving within minutes, but he was found pulseless. Despite a heroic resuscitative effort, he was pronounced dead at a nearby hospital a short time thereafter. A postmortem was not performed and the presumptive cause of death was pulmonary embolism.
His funeral was January 29th.
My brother‐in‐law and I lived 1600 miles apart and saw each other on only the rarest occasions. When the diagnosis was made, my role changed as I am the only relative within the extended family with medical expertise. Questions were directed to me via e‐mails and I did my best using UpToDate and other resources to learn about GBM and relay this information back to the family.
Recently, and in a vicarious way, I was becoming more and more deeply involved. Using the best descriptions of functional status that I could extract from e‐mail and phone calls, I estimated his Karnofsky Performance Score as being fairly poor. By way of my e‐mails to him and his wife, I was just beginning, ever so gently, to touch on the subject of hospice care at the time of his sudden death.
At the visitation and reception following the funeral, I think I was seen as more than a distant brother‐in‐law; I was also seen as a surrogate for the medical profession and for his doctors in particular. One message that I got loud and clear, from more than 1 family member was the devastated, abandoned feeling that was emerging in the 8 days since his death. On the morning following his death, my sister‐in‐law called his physician's office and told his oncology nurse that her husband had died suddenly and unexpectedly the night before. The nurse expressed sympathy and indicated she would relay this information to his doctor and she would personally call back. As of the time I left to return home, that was the last communication any family member had received from anyone involved in his care.
Although the outpouring of community support and sympathy was powerful and touching, not a single condolence card or phone call came from his doctor. I was shocked at the suddenness of his death, but I was also shocked at the complete absence of any communication, any acknowledgement of his courageous struggle against a terrible illness, or of his family's depth of caring and love over these last few months.
I am reminded of an essay by Gregory Kane, MD in CHEST,1 in which he describes a disturbing personal encounter with the following;
In a personal and memorable patient encounter, I sat and listened while a tearful patient cried at having received no contact from the physician who treated her husband for metastatic lung cancer for a treatment duration of 9 months. As I struggled to comprehend her sense of pain and abandonment, I considered offering as possible explanation that the physician may not have been on call at the time of the death and may have mistakenly believed that his partner had offered such a gesture verbally. Before I could respond, however, my patient added that her veterinarian had sent a card when the family dog died. I was speechless.1
As Hospitalists, we are gifted and privileged to work closely with patients and their loved ones struggling with the existential and eternal questions of life and death. As we can all well attest from 6 PM family meetings, the unit‐of‐care extends beyond the patient and certainly includes the loving and caring members of the patient's family and close support system. If we fail to acknowledge a family's bereavement, we run the risk of unintentionally communicating the message that the patient was not important, that their suffering did not matter or that the crushing grief the family may be bearing is somehow insignificant compared to our busy schedules.
I have asked you to join me on this short journey my brother‐in‐law has taken these last few months in the interest of raising awareness. There are many occasions when a verbal, bedside expression of condolence is very appropriate and completely adequate. There are other times when a condolence letter will better facilitate the closure of the physician‐patient‐family relationship. This may be intimidating, both the extra work involved and especially the challenge of not knowing what to say. The article quoted above by Dr. Kane is an excellent resource for guidance concerning content, style, and other writing considerations. Using examples, such as a letter from Abraham Lincoln to a girl whose father died in the Civil War, he shows that this essential communication does not have to be lengthy or difficult. Another excellent resource can be found in the New England Journal of Medicine; The Doctor's Letter of Condolence.2 See Table 1 for suggestions to help with bereavement communications.
| Handwritten on a card or stationary. |
| Timely (within 1‐2 weeks of death). |
| Use sensitive, caring language and avoid clich. |
| Acknowledge the family's grief and loss. |
| Acknowledge the patient's courage or other qualities. |
| Mention the privilege it has been to work with the patient. |
| Mention your appreciation of the family's caring. |
| Avoid sincerely yours and end on a personal note such as suggesting your thoughts are with them at this most difficult time. |
We are the profession of Hospital Medicine. It is our knowledge, our hope, our compassion, our experience and judgment that often directs care at the end‐of‐life for many of our patients. We are teammates along with the primary care provider, subspecialty consultants, palliative care specialists and other members of the care team. We have a professional obligation to extend a thoughtful condolence to surviving family members and to contact other members of the care team so that they too may have this opportunity. The responsibility for the final closure rests with us and within this responsibility is a powerful fulfillment of the promise of the practice of medicine.
The condolence note is a small kindness, a part of the art of medicine, a part of our humanness and essential to our vision of patient‐centered hospital care.
- .A Dying Art?: The Doctor's Letter of Condolence.Chest.2007;131(4):1245–1247. Permission for use obtained by direct communication with the author on January 31, 2010.
- ,,.The doctor's letter of condolence.N Engl J Med.2001;344(15):1162–1163.
- .A Dying Art?: The Doctor's Letter of Condolence.Chest.2007;131(4):1245–1247. Permission for use obtained by direct communication with the author on January 31, 2010.
- ,,.The doctor's letter of condolence.N Engl J Med.2001;344(15):1162–1163.
Band-Aids Won't Fix Medicare Payment Problems
July 1 marked the debut of several features in this year’s healthcare reform legislation, including the acceptance of uninsured applicants to high-risk insurance pools. For many hospitalists and other doctors, however, the new arrivals only heightened their disappointment over the legislation’s lost opportunity: a permanent fix to the flawed sustainable growth rate, or SGR, that dictates Medicare reimbursements.
“It should have been taken care of in that bill,” says Ron Greeno, MD, SFHM, a member of SHM’s Public Policy Committee and CMO of Brentwood, Tenn.-based Cogent Healthcare. “Obviously, there’s a lot of frustration around the issue, especially on the membership side.”
June provided a stark reminder of the potential for catastrophe should the annual rate cuts to Medicare reimbursements to physicians—21.3% to date—ever go into effect. Congress eventually pushed through yet another temporary fix, delaying any cut from June 1 until Dec. 1 (after the midterm elections, of course) and even tacking on a 2.2% increase. But the House didn’t pass the extension until June 24, nearly a week after the Centers for Medicare & Medicaid Services (CMS) began processing June claims at the lower rate.
By that point, some doctors had begun refusing to see Medicare patients. Both doctors and hospitals have since had to resubmit some June claims to gain the full value, creating new headaches and expenses over the additional paperwork. “It’s wreaking havoc on the provider community,” Dr. Greeno says. “The uncertainty that has been created around these short-term fixes is very disquieting.”
Doctors and hospitals have had to resubmit some June claims to gain the full value, creating expenses over the additional paperwork. And then, of course, there’s the new Nov. 30 deadline facing a lame-duck Congress. As politicians continue dithering over a permanent fix and an accompanying price tag of $250 billion or more over a decade, CMS has announced next year’s rate cut. With a 6.1% decrease slated to take effect on Jan. 1, 2011, the combined SGR-mandated drop would reach nearly 30%. Ouch.
Find out the latest information on SGR reform and contact your legislators in support of permanent repeal through SHM's Legislative Action Center.
Handoffs Smoother in Rural Communities
Before Matthew Schreiber, MD, became chief medical officer of Piedmont Hospital in Atlanta, he was director of hospitalist services for the four-hospital Piedmont health system, and before that, a hospitalist for the system’s smallest hospital, 35-bed Piedmont Mountainside in Jasper, Ga., population 2,000, so he knows just how different transitions of care are between hospitals large and small.
In many rural communities, the hospitalist concept has only recently been introduced, and patients are accustomed to PCPs being responsible for all of their medical care. But it can be easier to achieve high-quality handoffs in rural areas because the number of physicians involved is much smaller, Dr. Schreiber says.
“At Piedmont Mountainside, only eight physicians made most of our referrals. It was possible to memorize their office numbers and their call-coverage arrangements,” he explains. Some doctors are accessible 24 hours, seven days a week, while others take their patients’ charts home overnight in case they get called. This encourages an individualized approach to communicating with them. “It makes the care feel more personal, with a different level of accountability,” Dr. Schreiber says. “You feel a connection to the patient and the doctor—and that your job isn’t done when the patient goes home.”
Rural hospitals and doctors also tend to have closer relationships with community services like home health agencies. “We can give the medication list to the home health nurse and say, ‘This is what we think the patient is taking. We want you to go in and find out what they’re actually taking and reconcile the two,’ ” Dr. Schreiber says.
However, small and rural hospitals—particularly stand-alone and critical access facilities—are less likely to have computerized tools for automating and facilitating care transitions, Dr. Schreiber says. In some cases, the rural hospitalist carries a pager and takes calls 24/7.
Dr. Schreiber says it’s important to hand patients a piece of paper that summarizes their condition, key events in the hospitalization, and new medications, all in patient-friendly language, to take home and post on the refrigerator. “In our experience, patients hold onto this document and bring it to the doctor’s office or even to the emergency room,” he says, adding that if the formal discharge summary doesn’t reach the PCP in time, this summary could be a godsend.
Visit our website for more information about local and national efforts to improve care transitions.
Check out the SHM website for information on Project BOOST (Better Outcomes for Older Adults through Safer Transitions), a national QI initiative to improve handoffs and transitions.
Two-Way Street
Brad Schmidt, MD, can remember recruiting hospitalists to the HM program at Dean Clinic at St. Mary’s Hospital in Madison, Wis., seven years ago. He was a young doctor, just a couple of years removed from residency.
Back then, having Dr. Schmidt recruit hospitalists was a matter of necessity. He was the only hospitalist practicing at St. Mary’s. Today, hospitalists continue to be in charge of recruiting at Dean’s 18-physician HM department, but now it’s by design.
“It’s critical for hospitalists to get involved, because doctors being recruited want to be part of a team. They want to know how they would be contributing,” says Dr. Schmidt, who is the medical director of eight departments, including the HM department. “I also think it’s important for people to know who they are going to be working with.”
For hospitalists looking to advance their careers, being recruited by a group that heavily involves its own hospitalists in the process can provide an opportunity to get an in-depth look at the prospective job and community, observes Kenneth G. Simone, DO, FHM, founder and president of Hospitalist and Practice Solutions, a practice-management consultancy based in Veazie, Maine. At the same time, hospitalists who are active in recruitment efforts are helping their own pursuits, says Dr. Simone, a member of Team Hospitalist and author of several HM-centered books, including “Hospitalist Recruit-ment and Retention.”
It gives new meaning to the saying recruiting is a two-way street. In this case, it’s a two-way street to success if hospitalists at both ends of the recruitment process use the situation to their advantage.
Candidate Advantage
If given the chance to interact with hospitalists at a potential job, a candidate should really pay attention to what the workday is like, Dr. Simone says. How is the workload? What kind of specialist support are the hospitalists getting? Are primary-care physicians (PCPs) referring patients to the group? Is there a good rapport with nursing staff?
“As a candidate, I should be asking why they are looking for a provider,” Dr. Simone says. “Is it growth? Is it turnover due to burnout?”
Having hospitalists engaged in the recruitment effort gives a candidate a great opportunity to ask questions he or she might not be comfortable asking of a director or hospital human resources personnel, Dr. Simone says. A candidate also gets a chance to observe the level of collegiality among prospective coworkers and gauge if the hospitalists are happy in the workplace and with the community.

—Kenneth G. Simone, DO, FHM, president, Hospitalist and Practice Solutions, Veazie, Maine, Team Hospitalist member
“They want to know that they are not just a cog in the wheel, not just a person filling a shift,” Dr. Schmidt explains. “By and large, they want to be part of a team.”
According to Drs. Simone and Schmidt, hospitalist job candidates should make an effort to:
- Ask potential colleagues to show them the local neighborhoods, services, and cultural and entertainment amenities;
- Get the e-mail addresses and phone numbers of the hospitalists to contact them with any follow-up questions after the interview and site visit; and
- Meet the group’s newest hospitalists, as they are the people who are in the best position to talk about the job transition.
A candidate’s goal is to gather enough information to determine if the job opportunity is the best fit for them and their family, Dr. Schmidt says. But candidates must remember that the time they spend and the conversations they share with the group’s hospitalists are still part of the interview process, Dr. Simone emphasizes. “If the person interviewing for a job has a lot of questions about vacation time and workload, that could send a signal that he or she doesn’t have a good work ethic,” he says.
Conversely, candidates should be wary of any program that doesn’t in some degree include their hospitalists in the recruitment process. It could mean that the group is trying to hide something, or that morale is so low that the hospitalists don’t want to promote the program. “I personally would be very uncomfortable not knowing who my partners would be,” Dr. Schmidt says.
Other red flags to look out for are constant references to the job’s competitive salary, which could indicate problems in other areas that the hospitalist practice is trying to mask, and no references to challenging issues the group is facing. If the group appears too good to be true, it probably is, Dr. Simone says.
Recruitment = Leadership
Hospitalists who get involved in their group’s recruitment efforts show their employer and supervisor that they are team players and care about the group and its future. It shows they are willing to help the program beyond providing patient care, and it demonstrates to both current and future employers that they have valuable professional characteristics and skills.
“Hospitalists who are good at recruiting show that they are a leader, a good communicator, and a positive person,” Dr. Simone says. “They can put this on a resume and give examples of what they did to help bring a quality provider to the team.”
When recruiting, be honest about the program’s strengths and weaknesses. “You want to avoid telling a candidate something a program is not,” Dr. Schmidt says. “You should be open about the program’s goals, workload, and expectations.”
Hospitalists who help in recruiting can frame the challenges a program is facing in a positive light. If an HM program is having trouble with, for example, a pulmonology group that is understaffed, the hospitalist recruiting candidates could explain the program is temporarily cross-covering patients at night until a new specialist can be found, Dr. Simone explains. He also notes it’s always best to place negatives into a context that shows the hospitalist group is working on a solution.
Getting engaged in recruiting also helps a hospitalist improve their current job by strengthening their team with good doctors who care about doing quality work, Drs. Schmidt and Simone say.
And that is more important than building a resume. TH
Lisa Ryan is a freelance writer based in New Jersey.
Brad Schmidt, MD, can remember recruiting hospitalists to the HM program at Dean Clinic at St. Mary’s Hospital in Madison, Wis., seven years ago. He was a young doctor, just a couple of years removed from residency.
Back then, having Dr. Schmidt recruit hospitalists was a matter of necessity. He was the only hospitalist practicing at St. Mary’s. Today, hospitalists continue to be in charge of recruiting at Dean’s 18-physician HM department, but now it’s by design.
“It’s critical for hospitalists to get involved, because doctors being recruited want to be part of a team. They want to know how they would be contributing,” says Dr. Schmidt, who is the medical director of eight departments, including the HM department. “I also think it’s important for people to know who they are going to be working with.”
For hospitalists looking to advance their careers, being recruited by a group that heavily involves its own hospitalists in the process can provide an opportunity to get an in-depth look at the prospective job and community, observes Kenneth G. Simone, DO, FHM, founder and president of Hospitalist and Practice Solutions, a practice-management consultancy based in Veazie, Maine. At the same time, hospitalists who are active in recruitment efforts are helping their own pursuits, says Dr. Simone, a member of Team Hospitalist and author of several HM-centered books, including “Hospitalist Recruit-ment and Retention.”
It gives new meaning to the saying recruiting is a two-way street. In this case, it’s a two-way street to success if hospitalists at both ends of the recruitment process use the situation to their advantage.
Candidate Advantage
If given the chance to interact with hospitalists at a potential job, a candidate should really pay attention to what the workday is like, Dr. Simone says. How is the workload? What kind of specialist support are the hospitalists getting? Are primary-care physicians (PCPs) referring patients to the group? Is there a good rapport with nursing staff?
“As a candidate, I should be asking why they are looking for a provider,” Dr. Simone says. “Is it growth? Is it turnover due to burnout?”
Having hospitalists engaged in the recruitment effort gives a candidate a great opportunity to ask questions he or she might not be comfortable asking of a director or hospital human resources personnel, Dr. Simone says. A candidate also gets a chance to observe the level of collegiality among prospective coworkers and gauge if the hospitalists are happy in the workplace and with the community.
—Kenneth G. Simone, DO, FHM, president, Hospitalist and Practice Solutions, Veazie, Maine, Team Hospitalist member
“They want to know that they are not just a cog in the wheel, not just a person filling a shift,” Dr. Schmidt explains. “By and large, they want to be part of a team.”
According to Drs. Simone and Schmidt, hospitalist job candidates should make an effort to:
- Ask potential colleagues to show them the local neighborhoods, services, and cultural and entertainment amenities;
- Get the e-mail addresses and phone numbers of the hospitalists to contact them with any follow-up questions after the interview and site visit; and
- Meet the group’s newest hospitalists, as they are the people who are in the best position to talk about the job transition.
A candidate’s goal is to gather enough information to determine if the job opportunity is the best fit for them and their family, Dr. Schmidt says. But candidates must remember that the time they spend and the conversations they share with the group’s hospitalists are still part of the interview process, Dr. Simone emphasizes. “If the person interviewing for a job has a lot of questions about vacation time and workload, that could send a signal that he or she doesn’t have a good work ethic,” he says.
Conversely, candidates should be wary of any program that doesn’t in some degree include their hospitalists in the recruitment process. It could mean that the group is trying to hide something, or that morale is so low that the hospitalists don’t want to promote the program. “I personally would be very uncomfortable not knowing who my partners would be,” Dr. Schmidt says.
Other red flags to look out for are constant references to the job’s competitive salary, which could indicate problems in other areas that the hospitalist practice is trying to mask, and no references to challenging issues the group is facing. If the group appears too good to be true, it probably is, Dr. Simone says.
Recruitment = Leadership
Hospitalists who get involved in their group’s recruitment efforts show their employer and supervisor that they are team players and care about the group and its future. It shows they are willing to help the program beyond providing patient care, and it demonstrates to both current and future employers that they have valuable professional characteristics and skills.
“Hospitalists who are good at recruiting show that they are a leader, a good communicator, and a positive person,” Dr. Simone says. “They can put this on a resume and give examples of what they did to help bring a quality provider to the team.”
When recruiting, be honest about the program’s strengths and weaknesses. “You want to avoid telling a candidate something a program is not,” Dr. Schmidt says. “You should be open about the program’s goals, workload, and expectations.”
Hospitalists who help in recruiting can frame the challenges a program is facing in a positive light. If an HM program is having trouble with, for example, a pulmonology group that is understaffed, the hospitalist recruiting candidates could explain the program is temporarily cross-covering patients at night until a new specialist can be found, Dr. Simone explains. He also notes it’s always best to place negatives into a context that shows the hospitalist group is working on a solution.
Getting engaged in recruiting also helps a hospitalist improve their current job by strengthening their team with good doctors who care about doing quality work, Drs. Schmidt and Simone say.
And that is more important than building a resume. TH
Lisa Ryan is a freelance writer based in New Jersey.
Change You Should Believe In
Christina Payne, MD, is a third-year resident at Emory University Hospital in Atlanta who will begin her first hospitalist job, with Emory in September. In spite of her dearth of practical experience, she already has experience researching one of the most vexing problems confronting HM: how to improve transitions of care.
Dr. Payne has been studying the benefits of a structured electronic tool that generates a standardized sign-out list of a hospital team’s full census at the time of shift change, compared with the usual, highly variable sign-out practices of medical residents. At a poster presentation at Internal Medicine 2010 in April in Toronto, Dr. Payne and colleagues reported that residents using the tool were twice as confident at performing handoffs, had lower rates of perceived near-miss events, and were happier.1
“Hospitalists everywhere are starting to realize the importance of trying to reduce opportunities for human error that occur during care transitions,” Dr. Payne says. “The biggest thing I learned from this research is the importance of standardizing the handoff process [with information communicated consistently].
“It is essential to keep communication lines open,” Dr. Payne adds. “No tool can replace the importance of communication between doctors and the need to sit down and talk. The ideal signout happens in a quiet room where the two of you can talk about active patients and achieve rapport. But, realistically, how often does that happen?”
Standardization is one of a handful of strategies hospitalists, researchers, and policymakers are using to tackle transitions—both in-hospital handoffs and post-discharge transitions—with outpatient care. Some hospitalists are using practice simulations and training strategies; others have implemented medication reconciliation checks at every discharge, checklists and other communication strategies, team-based quality-improvement (QI) initiatives, and new technologies to enhance and streamline communication. Some interventions follow the patient from the hospital to the community physician with a phone call, follow-up clinic, or other contact; others aim to empower the patient to be a better self-advocate. But for hospitalists, the challenge is to communicate the right amount of transfer information to the right receiver at the right time.
No matter the technique, the goal is the same: Improve the handoff and discharge process in a way that promotes efficiency and patient safety. And hospitalists are at the forefront of the changing landscape of care transitions.
Under the Microscope
Care transitions of all kinds are under the magnifying glass of national healthcare reform, with growing recognition of the need to make care safer and reduce the preventable, costly hospital readmissions caused by incomplete handoffs. Care transitions for hospitalists include internal handoffs, both at daily shift changes and at service changes when an outgoing provider is leaving after a period of consecutive daily shifts. These typically involve a sign-out process and face-to-face encounter, with some kind of written backup. One teaching institution reported that such handoffs take place 4,000 times per day in the hospital, or 1.6 million times per year.2

—Arpana Vidyarthi, MD, University of California at San Francisco
Geographical transitions can be from one floor or department to another, or out the hospital door to another facility or home. Transitions typically involve a discharge process and a written discharge summary. Care transitions also include hospital admissions, which put the hospitalist in the role of handoff receiver rather than initiator, plus a variety of other transitions involving nurses, physician extenders, and other practitioners.
Each transition is a major decision point in the course of a patient’s hospitalization; each transition also presents a time of heightened vulnerability (e.g., potential communication breakdowns, medication errors, patient anxiety or confusion, etc.). In fact, according to a Transitions of Care Consensus Policy Statement published in 2009 by SHM and five other medical societies, handoffs are ubiquitous in HM, with significant patient safety and quality deficiencies in handoffs existing in the current system.3
Poor communication at the time of handoff has been implicated in near-misses and adverse events in a variety of healthcare contexts, including 70% of hospital sentinel events studied by The Joint Commission, which named standardized handoffs (with an opportunity for interactive communication) as a National Patient Safety Goal in 2006.4 The federal government is studying care transitions, supporting demonstration projects for Medicare enrollees, and including readmission rates in national hospital report card data.

“Transitions of care and handoffs are a huge focus right now because of the increased fragmentation of care in the United States. Hospitalists are in charge of a greater percentage of hospitalized patients, which means more coordination of care is needed,” says Vineet Arora, MD, MA, FHM, assistant professor of medicine and associate director of the internal-medicine residency at the University of Chicago, and chair of the SHM task force on handoffs.
Inadequate communication and poor care transitions can undermine hospitalists’ best care-planning efforts, erode patients’ and families’ confidence and satisfaction with hospital care, and leave primary-care physicians (PCPs) feeling unsatisfied with the relationship. As many as 1 in 5 Medicare beneficiary hospitalizations result in a readmission within 30 days, and while not all of these are preventable, far too many are.5 Another prospective cohort study found that 1 in 5 patients discharged from the hospital to the home experienced an adverse event within three weeks of discharge.6 Complex comorbidities, advanced age, unknown PCP, and limited healthcare literacy present hospitalists with extremely difficult transitions.
Patient safety and cost control are the linchpins to national efforts to improve transitions of care. Dr. Arora recently coauthored an original research paper, which will be published in the Journal of Hospital Medicine in September, showing older hospitalized patients are twice as likely to report problems after discharge if their PCPs were not aware they were hospitalized.
“With escalating healthcare costs, people are looking at ways to save money and reduce redundant care,” Dr. Arora explains, pointing out, as an example, repeated tests resulting from inadequate communication between healthcare providers.
The System Must Change
“All of the effort we put into saving someone’s life—the years of experience, training, medical school, and residency—all of it comes to bear on that hospitalized patient. And it can all be unraveled at the time of discharge if it’s not handled properly,” says Arpana Vidyarthi, MD, a hospitalist and director of quality at the University of California at San Francisco.
Dr. Vidyarthi views in-hospital and discharge transitions as integrally related. “The analysis is similar, even if different techniques may be needed,” she says, adding that, fundamentally, it involves having a system that allows people—or forces them—to do the “right thing.”
That’s why achieving effective care transitions will require more than just a standardized tool or process, Dr. Vidyarthi says. “This is about understanding the ways people communicate and finding ways to train them to communicate better,” she says. “The problem we have is not a lack of information, but how to communicate what, to whom, and when.”
What’s really needed, Dr. Vidyarthi says, is a hospital’s commitment to more effective transitions and its hospitalists’ leadership in driving a comprehensive, multidisciplinary, team- and evidence-based QI process. The new process should be a QI-based solution to a hospital’s care-transitions issues. “Before you can standardize your process, you need to understand it,” she says. “This is a complex problem, and it needs a multifaceted solution. But this lies squarely within the hospitalist arena. We’re part of everything that happens in the hospital.

—Anuj Dalal, MD, Brigham and Women’s Hospital, Boston
Hospital administrators are looking to HM to solve transition and readmission problems now, says Tina Budnitz, MPH, BOOST Project Director (Better Outcomes for Older Adults through Safe Transitions). She expects the scrutiny from the C-suite, legislators, and watchdog groups to increase as the spotlight continues to shine on the healthcare system.
“Any hospitalist can act as a leader in their institution,” Budnitz says. “Be a change agent, pull a group together, and start asking questions: Do we have safe care-transitions practices and processes in place? Just by asking the right question, you can be a catalyst for the system.”
Budnitz also emphasizes the importance of teamwork in the hospital setting. “How can I help my teammates? What am I communicating to the nurses on rounds?” she says. “Can you initiate dialogue with your outpatient medical groups: ‘These faxes we’re sending you—is that information getting to you in ways and times that are helpful? And, by the way, when your patient is admitted, this information would really help me.’ ”

Innovative Strategies
One of the most important initiatives responding to concerns about care transitions is Project BOOST (www.hos pitalmedicine.org/BOOST), a comprehensive toolkit for improving a hospital’s transitions of care. The project aims to build a national consensus for best practices in transitions; collaborate with representatives from the Agency for Healthcare Research and Quality (AHRQ), the Centers for Medicare and Medicaid Services (CMS), and the Joint Commission; and develop a national resource library, Budnitz says.
“Project BOOST not only puts forth best practices for admitting patients, planning for discharge, and then doing the discharge, it also helps show facilities how to change their systems, with resources and tools for analyzing and re-engineering the system,” she says. “Sites get one-to-one assistance from a mentor.”
Six hospitals signed on to the pilot program in 2008; 24 more joined last year. In January, SHM announced a collaborative with the University of Michigan and Blue Cross Blue Shield of Michigan for 15 Michigan hospitals to receive training and mentorship starting in May. And last month, SHM and the California HealthCare Foundation announced a Project BOOST initiative for 20 of the health system’s hospitals (see “California Dreamin’”, p. 6). Other free resources offered on the BOOST Web portal include clinical, data collection, and project management tools. SHM also has a DVD that explains how to use the “teachback” method to improve communication with patients.
Jennifer Myers, MD, FHM, assistant professor of clinical medicine and patient-safety officer at the Hospital of the University of Pennsylvania in Philadelphia, is a Project BOOST participant who spearheaded a process change to improve the quality of her facility’s discharge summary, along with accompanying resident education.7 The discharge summary recently was integrated with the hospital’s electronic health record (EHR) system.
“We’ve gone from dictating the discharge summary to an electronic version completed by the hospitalist, with prompts for key components of the summary, which allows us to create summaries more efficiently—ideally on the day of discharge, but usually within 48 hours,” Dr. Myers says. “We previously researched whether teaching made a difference in the quality of discharges; we found that it did. So we look forward to standardizing our teaching approach around this important topic for all residents.”
Another care-transitions innovation receiving a lot of attention from the government and the private sector is Project RED (Re-Engineered Discharge), led by Brian Jack, MD, vice chair of the department of family medicine at Boston Medical Center. The Project RED research group develops and tests strategies to improve the hospital discharge process to promote patient safety and reduce rehospitalization rates.
“We used re-engineering tools borrowed from other fields, brought together experts from all over the hospital, divided up the whole discharge process, and identified key principles,” Dr. Jack explains. The resulting discharge strategy is reflected in an 11-item checklist of discrete, mutually reinforcing components, which have been shown to reduce rehospitalization rates by 32% while raising patient satisfaction.8 It includes comprehensive discharge and after-hospital plans, a nurse discharge advocate, and a medication reconciliation phone call to the patient. A virtual “patient advocate,” a computerized avatar named Louise, is now being tested. If successful, it will allow patients to interact with a touch-screen teacher of the after-care plan who has time to work at the patient’s pace.
Technology and Transitions

Informatics can be a key player in facilitating care transitions, says Anuj Dalal, MD, a hospitalist and instructor in medicine at Brigham and Women’s Hospital in Boston. He is using one of his hospital’s technological strengths—a well-established, firewall-protected e-mail system—to help improve the discharge process.
“We decided to try to improve awareness of test results pending at the time of discharge,” Dr. Dalal explains. “We created an intervention that automatically triggers an e-mail with the finalized test results to the responsible providers. The intervention creates a loop of communication between the inpatient attending and the PCP. What we hope to show in our research over the next year or two is whether the intervention actually increases awareness of test results by providers.”
One thing to remember is that “all kinds of things can go wrong with care transitions,” no matter the size of the institution, the experience of the staff, or technological limitations, says Vineet Chopra, MD, FACP, a hospitalist at the University of Michigan Health System in Ann Arbor. “The problems of transitions vary from place to place, day to day, time of day, shift changes; and let’s not forget physician extenders and the other members of the healthcare team,” he says. “The more complicated the team, the more complicated the information needing to be handed off becomes.”
Who Else Is Looking at Transitions of Care?

SHM convened the Handoffs Task Force in 2006. The team systematically reviewed the literature and published recommendations in the September 2009 Journal of Hospital Medicine.9 The recommendations are aimed at both community and academic hospitals, as well as hospitalists and other healthcare providers. A new collaborative designed to supplement Project BOOST for hospitalist group handoffs and help put the guidelines into practice is in the works, says Dr. Arora, the task force’s chair.
SHM and five medical groups, including the American College of Physicians, issued a Transitions of Care Consensus Statement, published in the July 2009 issue of the Journal of Hospital Medicine.5 Guiding principles relate to education, measurement, accountability, timely interchange of information, inclusion of patient and family, respect for the medical home, and the need for national standards.
The Joint Commission’s Center for Transforming Health Care, established in 2009 to solve healthcare’s most critical safety and quality problems, has made handoff communications its second major target, and is now working with 10 healthcare systems. Standardized handoff processes and communications were the subject of the Joint Commission’s 2006 National Patient Safety Goal, while the Comprehensive Accreditation Manual for Hospitals also specifies that before a hospital discharges or transfers a patient, it should inform and educate the patient about his or her follow-up care and services.
“We now have a safety goal under review dealing with medication reconciliation, and there are relevant standards related to culturally sensitive communication and low-literacy-level communication,” says Deborah Zadzam, PhD, RN, FAAN, director of international quality and performance measures for Joint Commission Resources. “The essential message the Joint Commission has for hospitalists is to communicate clearly, effectively and thoroughly; don’t assume you are understood or that you understand.”—LB
Before he joined the group at the university, Dr. Chopra worked at a community hospital, St. Joseph’s Mercy Hospital in Hot Springs, Ark. “It’s hard to come up with a one-size-fits-all solution when there are so many variables,” he says. At the community hospital, “we mandated that the hospitalist call the PCP at the time of discharge. At the academic medical center, we share an EHR with the PCPs and can reach them electronically. We are required to have the discharge summary in the computer before the patient leaves the hospital, and we mandate that hospitalists are reachable by e-mail or phone when they are off.
“I’m not a believer in throwing more technology at problems and just adding more layers of information tools,” Dr. Chopra adds. “Hospitalists who used to carry stethoscopes now also have a clipboard, phone, pager, PDA, and nine different signouts in their pockets. What we want to do is make their life easier. Here, we are looking at technology as a means to do that.”
Dr. Chopra and hospitalist colleague Prasanth Gosineni, MD, have been working with an Ann Arbor tech company called Synaptin to develop a lightweight, mobile client application designed to work on smartphones. Still in pilot testing, it would allow for task-oriented and priority-based messaging in real time and the systematic transfer of important information for the next hospitalist shift.
“You need to be able to share information in a systematic way, but that’s only half of the answer. The other half is the ability to ask specific questions,” Dr. Chopra says. “Technology doesn’t take away from the face-to-face encounter that needs to happen. Nothing will replace face time, but part of the solution is to provide data efficiently and in a way that is easily accessible.”
Dr. Chopra admits that EHR presents both positives and negatives to improved transitions and patient care, “depending on how well it works and what smart features it offers,” he says, “but also recognizing that EHR and other technologies have also taken us farther away from face-to-face exchanges. Some would say that’s part of the problem.”
Handoffs, discharges, and other transitions are ubiquitous in HM—and fraught with the potential for costly and harmful errors. The ideal of an interactive, face-to-face handoff simply is not available for many care transitions. However, hospitalists are challenged to find solutions that will work in their hospitals, with their teams, and their types of patients. Patients and policymakers expect nothing less. TH
Larry Beresford is a freelance writer based in Oakland, Calif.
References
- Payne C, Stein J, Dressler D. Implementation of a structured electronic tool to improve patient handoffs and resident satisfaction. Poster abstract: Internal Medicine 2010, April 21-24, 2010, Toronto.
- Vidyarthi AR. Triple Handoff. AHRQ WebM&M website. Available at: webmm.ahrq.gov/case.aspx? caseID=134. Published May 2006. Accessed May 29, 2010.
- Snow V, Beck D, Budnitz T, et al. Transitions of Care Consensus Policy Statement: American College of Physicians, Society of General Internal Medicine, Society of Hospital Medicine, American Geriatrics Society, American College of Emergency Physicians, and Society for Academic Emergency Medicine. J Hosp Med. 2009;4(6):364-370.
- 2006 National Patient Safety Goals. The Joint Commission website. Available at: www.jointcommission.org/PatientSafety/NationalPatientSafetyGoals/06_npsgs.htm. Accessed June 8, 2010.
- Jencks SF, Williams MV, Coleman EA. Rehospitalizations among patients in the Medicare fee-for-service program. N Engl J Med. 2009; 2:360:1418-1428.
- Forster AJ, Murff HJ, Peterson JF, Gandhi TK, Bates DW. The incidence and severity of adverse events affecting patients after discharge from the hospital. Ann Intern Med. 2003;138(3):161-167.
- Myers JS, Jaipaul CK, Kogan JR, Krekun S, Bellini LM, Shea JA. Are discharge summaries teachable? The effects of a discharge summary curriculum on the quality of discharge summaries in an internal medicine residency program. Acad Med. 2006; 81(10):S5-S8.
- Jack BW, Chetty VK, Anthony D, et al. A reengineered hospital discharge program to decrease rehospitalization: a randomized trial. Ann Intern Med. 2009;150(3):178-187.
- Arora VM, Manjarrez E, Dressler DD, Basaviah P, Halasyamani L, Kripalani S. Hospitalist handoffs: a systematic review and task force recommendations. J Hosp Med. 2009;4(7): 433-440.
- Halasyamani L, Kripalani S, Coleman E, et al. Transition of care for hospitalized elderly patients—development of a discharge checklist for hospitalists. J Hosp Med. 2006;1(6):354-360.
- Schnipper JL, Kirwin JL, Cotugno MC, et al. Role of pharmacist counseling in preventing adverse drug events after hospitalization. Arch Int Med. 2006;166(5):565-571.
- Dudas V, Bookwalter T, Kerr KM, Pantilat SZ. The impact of follow-up telephone calls to patients after hospitalization. Am J Med. 2001;111(9B): 26S-30S.
Care Transition Tips for Hospitalists and Groups

One recognized key to effective internal handoffs is the face-to-face verbal update, with opportunities to ask questions, priority given to sicker patients, and a written backup filling in the blanks with information that might become important as the patient’s condition changes. But if that is not practical for your HM group, what tools and processes will come closest to the ideal?
A key to effective discharge from the hospital is connection with the PCP, although face-to-face encounters with PCPs are highly unlikely. Hospitalists say there are levels of connection with PCPs, from the urgent (“I need to talk to someone right now”) to the routine (“It’s OK if they get this information tomorrow”). Many often wonder if there should be two levels of discharge communication with PCPs: an immediate message relaying crucial information and a formal discharge summary coming later.
For HM groups, the following is a list of suggestions from transitions-of-care researchers:
- Keep accurate and up-to-date contact information, including preferred communication medium, on referring physicians; survey them on their satisfaction with the discharge communications they receive from hospitalists.
- Partner with hospital administrators and with patient-safety and quality officers to address handoff issues.
- Partner with IT staff to help bridge the divide between clinicians and information technology.
- Track such outcomes as rehospitalization rates.
- Offer formal training on handoffs, discharges, and effective communication to physicians and other providers.
- Standardize the signout process, with computerized tools when appropriate, and create automated systems for following up on tests and lab results that come back after discharge.
- Structure shifts and their overlaps to help facilitate signouts.
- Consider implementing a discharge checklist.10
- Develop a strategy for medication reconciliation, with someone assigned to the process, be that a hospitalist, pharmacist or nurse.11
- Advocate for a post-discharge call-back policy by assigned staff at defined intervals, either for every patient discharged or for those targeted as higher-risk.12
- Consider creating a post-discharge clinic and/or a phone number that discharged patients can call to clarify post-discharge questions and concerns.
For individual hospitalists:
- Understand the transition process, where it fails, and why.
- Be open to changing the way you do things. Be accountable for transitions, and a role model for others.
- Focus on the present—today’s baseline, current to-do items, and what to expect next in the patient’s care.
- Track patients and their future discharge needs from the day of admission. What’s the likely date for going home? What does the patient need to learn in the meantime? Help nurses focus on achieving those needs and, if possible, schedule the initial outpatient clinic appointment before the patient leaves the hospital.
- Take time to talk your patients, listen to their concerns and confirm their understanding of what lies ahead.
For hospitalists on the receiving end of transition messages:
- Actively listen—stay focused, limit interruptions, take notes.
- Ask questions to ensure your understanding and read back what you understand to be the communication.
- Have a system for keeping track of to-do items requiring follow-up.—LB
Christina Payne, MD, is a third-year resident at Emory University Hospital in Atlanta who will begin her first hospitalist job, with Emory in September. In spite of her dearth of practical experience, she already has experience researching one of the most vexing problems confronting HM: how to improve transitions of care.
Dr. Payne has been studying the benefits of a structured electronic tool that generates a standardized sign-out list of a hospital team’s full census at the time of shift change, compared with the usual, highly variable sign-out practices of medical residents. At a poster presentation at Internal Medicine 2010 in April in Toronto, Dr. Payne and colleagues reported that residents using the tool were twice as confident at performing handoffs, had lower rates of perceived near-miss events, and were happier.1
“Hospitalists everywhere are starting to realize the importance of trying to reduce opportunities for human error that occur during care transitions,” Dr. Payne says. “The biggest thing I learned from this research is the importance of standardizing the handoff process [with information communicated consistently].
“It is essential to keep communication lines open,” Dr. Payne adds. “No tool can replace the importance of communication between doctors and the need to sit down and talk. The ideal signout happens in a quiet room where the two of you can talk about active patients and achieve rapport. But, realistically, how often does that happen?”
Standardization is one of a handful of strategies hospitalists, researchers, and policymakers are using to tackle transitions—both in-hospital handoffs and post-discharge transitions—with outpatient care. Some hospitalists are using practice simulations and training strategies; others have implemented medication reconciliation checks at every discharge, checklists and other communication strategies, team-based quality-improvement (QI) initiatives, and new technologies to enhance and streamline communication. Some interventions follow the patient from the hospital to the community physician with a phone call, follow-up clinic, or other contact; others aim to empower the patient to be a better self-advocate. But for hospitalists, the challenge is to communicate the right amount of transfer information to the right receiver at the right time.
No matter the technique, the goal is the same: Improve the handoff and discharge process in a way that promotes efficiency and patient safety. And hospitalists are at the forefront of the changing landscape of care transitions.
Under the Microscope
Care transitions of all kinds are under the magnifying glass of national healthcare reform, with growing recognition of the need to make care safer and reduce the preventable, costly hospital readmissions caused by incomplete handoffs. Care transitions for hospitalists include internal handoffs, both at daily shift changes and at service changes when an outgoing provider is leaving after a period of consecutive daily shifts. These typically involve a sign-out process and face-to-face encounter, with some kind of written backup. One teaching institution reported that such handoffs take place 4,000 times per day in the hospital, or 1.6 million times per year.2
—Arpana Vidyarthi, MD, University of California at San Francisco
Geographical transitions can be from one floor or department to another, or out the hospital door to another facility or home. Transitions typically involve a discharge process and a written discharge summary. Care transitions also include hospital admissions, which put the hospitalist in the role of handoff receiver rather than initiator, plus a variety of other transitions involving nurses, physician extenders, and other practitioners.
Each transition is a major decision point in the course of a patient’s hospitalization; each transition also presents a time of heightened vulnerability (e.g., potential communication breakdowns, medication errors, patient anxiety or confusion, etc.). In fact, according to a Transitions of Care Consensus Policy Statement published in 2009 by SHM and five other medical societies, handoffs are ubiquitous in HM, with significant patient safety and quality deficiencies in handoffs existing in the current system.3
Poor communication at the time of handoff has been implicated in near-misses and adverse events in a variety of healthcare contexts, including 70% of hospital sentinel events studied by The Joint Commission, which named standardized handoffs (with an opportunity for interactive communication) as a National Patient Safety Goal in 2006.4 The federal government is studying care transitions, supporting demonstration projects for Medicare enrollees, and including readmission rates in national hospital report card data.
“Transitions of care and handoffs are a huge focus right now because of the increased fragmentation of care in the United States. Hospitalists are in charge of a greater percentage of hospitalized patients, which means more coordination of care is needed,” says Vineet Arora, MD, MA, FHM, assistant professor of medicine and associate director of the internal-medicine residency at the University of Chicago, and chair of the SHM task force on handoffs.
Inadequate communication and poor care transitions can undermine hospitalists’ best care-planning efforts, erode patients’ and families’ confidence and satisfaction with hospital care, and leave primary-care physicians (PCPs) feeling unsatisfied with the relationship. As many as 1 in 5 Medicare beneficiary hospitalizations result in a readmission within 30 days, and while not all of these are preventable, far too many are.5 Another prospective cohort study found that 1 in 5 patients discharged from the hospital to the home experienced an adverse event within three weeks of discharge.6 Complex comorbidities, advanced age, unknown PCP, and limited healthcare literacy present hospitalists with extremely difficult transitions.
Patient safety and cost control are the linchpins to national efforts to improve transitions of care. Dr. Arora recently coauthored an original research paper, which will be published in the Journal of Hospital Medicine in September, showing older hospitalized patients are twice as likely to report problems after discharge if their PCPs were not aware they were hospitalized.
“With escalating healthcare costs, people are looking at ways to save money and reduce redundant care,” Dr. Arora explains, pointing out, as an example, repeated tests resulting from inadequate communication between healthcare providers.
The System Must Change
“All of the effort we put into saving someone’s life—the years of experience, training, medical school, and residency—all of it comes to bear on that hospitalized patient. And it can all be unraveled at the time of discharge if it’s not handled properly,” says Arpana Vidyarthi, MD, a hospitalist and director of quality at the University of California at San Francisco.
Dr. Vidyarthi views in-hospital and discharge transitions as integrally related. “The analysis is similar, even if different techniques may be needed,” she says, adding that, fundamentally, it involves having a system that allows people—or forces them—to do the “right thing.”
That’s why achieving effective care transitions will require more than just a standardized tool or process, Dr. Vidyarthi says. “This is about understanding the ways people communicate and finding ways to train them to communicate better,” she says. “The problem we have is not a lack of information, but how to communicate what, to whom, and when.”
What’s really needed, Dr. Vidyarthi says, is a hospital’s commitment to more effective transitions and its hospitalists’ leadership in driving a comprehensive, multidisciplinary, team- and evidence-based QI process. The new process should be a QI-based solution to a hospital’s care-transitions issues. “Before you can standardize your process, you need to understand it,” she says. “This is a complex problem, and it needs a multifaceted solution. But this lies squarely within the hospitalist arena. We’re part of everything that happens in the hospital.
—Anuj Dalal, MD, Brigham and Women’s Hospital, Boston
Hospital administrators are looking to HM to solve transition and readmission problems now, says Tina Budnitz, MPH, BOOST Project Director (Better Outcomes for Older Adults through Safe Transitions). She expects the scrutiny from the C-suite, legislators, and watchdog groups to increase as the spotlight continues to shine on the healthcare system.
“Any hospitalist can act as a leader in their institution,” Budnitz says. “Be a change agent, pull a group together, and start asking questions: Do we have safe care-transitions practices and processes in place? Just by asking the right question, you can be a catalyst for the system.”
Budnitz also emphasizes the importance of teamwork in the hospital setting. “How can I help my teammates? What am I communicating to the nurses on rounds?” she says. “Can you initiate dialogue with your outpatient medical groups: ‘These faxes we’re sending you—is that information getting to you in ways and times that are helpful? And, by the way, when your patient is admitted, this information would really help me.’ ”
Innovative Strategies
One of the most important initiatives responding to concerns about care transitions is Project BOOST (www.hos pitalmedicine.org/BOOST), a comprehensive toolkit for improving a hospital’s transitions of care. The project aims to build a national consensus for best practices in transitions; collaborate with representatives from the Agency for Healthcare Research and Quality (AHRQ), the Centers for Medicare and Medicaid Services (CMS), and the Joint Commission; and develop a national resource library, Budnitz says.
“Project BOOST not only puts forth best practices for admitting patients, planning for discharge, and then doing the discharge, it also helps show facilities how to change their systems, with resources and tools for analyzing and re-engineering the system,” she says. “Sites get one-to-one assistance from a mentor.”
Six hospitals signed on to the pilot program in 2008; 24 more joined last year. In January, SHM announced a collaborative with the University of Michigan and Blue Cross Blue Shield of Michigan for 15 Michigan hospitals to receive training and mentorship starting in May. And last month, SHM and the California HealthCare Foundation announced a Project BOOST initiative for 20 of the health system’s hospitals (see “California Dreamin’”, p. 6). Other free resources offered on the BOOST Web portal include clinical, data collection, and project management tools. SHM also has a DVD that explains how to use the “teachback” method to improve communication with patients.
Jennifer Myers, MD, FHM, assistant professor of clinical medicine and patient-safety officer at the Hospital of the University of Pennsylvania in Philadelphia, is a Project BOOST participant who spearheaded a process change to improve the quality of her facility’s discharge summary, along with accompanying resident education.7 The discharge summary recently was integrated with the hospital’s electronic health record (EHR) system.
“We’ve gone from dictating the discharge summary to an electronic version completed by the hospitalist, with prompts for key components of the summary, which allows us to create summaries more efficiently—ideally on the day of discharge, but usually within 48 hours,” Dr. Myers says. “We previously researched whether teaching made a difference in the quality of discharges; we found that it did. So we look forward to standardizing our teaching approach around this important topic for all residents.”
Another care-transitions innovation receiving a lot of attention from the government and the private sector is Project RED (Re-Engineered Discharge), led by Brian Jack, MD, vice chair of the department of family medicine at Boston Medical Center. The Project RED research group develops and tests strategies to improve the hospital discharge process to promote patient safety and reduce rehospitalization rates.
“We used re-engineering tools borrowed from other fields, brought together experts from all over the hospital, divided up the whole discharge process, and identified key principles,” Dr. Jack explains. The resulting discharge strategy is reflected in an 11-item checklist of discrete, mutually reinforcing components, which have been shown to reduce rehospitalization rates by 32% while raising patient satisfaction.8 It includes comprehensive discharge and after-hospital plans, a nurse discharge advocate, and a medication reconciliation phone call to the patient. A virtual “patient advocate,” a computerized avatar named Louise, is now being tested. If successful, it will allow patients to interact with a touch-screen teacher of the after-care plan who has time to work at the patient’s pace.
Technology and Transitions
Informatics can be a key player in facilitating care transitions, says Anuj Dalal, MD, a hospitalist and instructor in medicine at Brigham and Women’s Hospital in Boston. He is using one of his hospital’s technological strengths—a well-established, firewall-protected e-mail system—to help improve the discharge process.
“We decided to try to improve awareness of test results pending at the time of discharge,” Dr. Dalal explains. “We created an intervention that automatically triggers an e-mail with the finalized test results to the responsible providers. The intervention creates a loop of communication between the inpatient attending and the PCP. What we hope to show in our research over the next year or two is whether the intervention actually increases awareness of test results by providers.”
One thing to remember is that “all kinds of things can go wrong with care transitions,” no matter the size of the institution, the experience of the staff, or technological limitations, says Vineet Chopra, MD, FACP, a hospitalist at the University of Michigan Health System in Ann Arbor. “The problems of transitions vary from place to place, day to day, time of day, shift changes; and let’s not forget physician extenders and the other members of the healthcare team,” he says. “The more complicated the team, the more complicated the information needing to be handed off becomes.”
Who Else Is Looking at Transitions of Care?
SHM convened the Handoffs Task Force in 2006. The team systematically reviewed the literature and published recommendations in the September 2009 Journal of Hospital Medicine.9 The recommendations are aimed at both community and academic hospitals, as well as hospitalists and other healthcare providers. A new collaborative designed to supplement Project BOOST for hospitalist group handoffs and help put the guidelines into practice is in the works, says Dr. Arora, the task force’s chair.
SHM and five medical groups, including the American College of Physicians, issued a Transitions of Care Consensus Statement, published in the July 2009 issue of the Journal of Hospital Medicine.5 Guiding principles relate to education, measurement, accountability, timely interchange of information, inclusion of patient and family, respect for the medical home, and the need for national standards.
The Joint Commission’s Center for Transforming Health Care, established in 2009 to solve healthcare’s most critical safety and quality problems, has made handoff communications its second major target, and is now working with 10 healthcare systems. Standardized handoff processes and communications were the subject of the Joint Commission’s 2006 National Patient Safety Goal, while the Comprehensive Accreditation Manual for Hospitals also specifies that before a hospital discharges or transfers a patient, it should inform and educate the patient about his or her follow-up care and services.
“We now have a safety goal under review dealing with medication reconciliation, and there are relevant standards related to culturally sensitive communication and low-literacy-level communication,” says Deborah Zadzam, PhD, RN, FAAN, director of international quality and performance measures for Joint Commission Resources. “The essential message the Joint Commission has for hospitalists is to communicate clearly, effectively and thoroughly; don’t assume you are understood or that you understand.”—LB
Before he joined the group at the university, Dr. Chopra worked at a community hospital, St. Joseph’s Mercy Hospital in Hot Springs, Ark. “It’s hard to come up with a one-size-fits-all solution when there are so many variables,” he says. At the community hospital, “we mandated that the hospitalist call the PCP at the time of discharge. At the academic medical center, we share an EHR with the PCPs and can reach them electronically. We are required to have the discharge summary in the computer before the patient leaves the hospital, and we mandate that hospitalists are reachable by e-mail or phone when they are off.
“I’m not a believer in throwing more technology at problems and just adding more layers of information tools,” Dr. Chopra adds. “Hospitalists who used to carry stethoscopes now also have a clipboard, phone, pager, PDA, and nine different signouts in their pockets. What we want to do is make their life easier. Here, we are looking at technology as a means to do that.”
Dr. Chopra and hospitalist colleague Prasanth Gosineni, MD, have been working with an Ann Arbor tech company called Synaptin to develop a lightweight, mobile client application designed to work on smartphones. Still in pilot testing, it would allow for task-oriented and priority-based messaging in real time and the systematic transfer of important information for the next hospitalist shift.
“You need to be able to share information in a systematic way, but that’s only half of the answer. The other half is the ability to ask specific questions,” Dr. Chopra says. “Technology doesn’t take away from the face-to-face encounter that needs to happen. Nothing will replace face time, but part of the solution is to provide data efficiently and in a way that is easily accessible.”
Dr. Chopra admits that EHR presents both positives and negatives to improved transitions and patient care, “depending on how well it works and what smart features it offers,” he says, “but also recognizing that EHR and other technologies have also taken us farther away from face-to-face exchanges. Some would say that’s part of the problem.”
Handoffs, discharges, and other transitions are ubiquitous in HM—and fraught with the potential for costly and harmful errors. The ideal of an interactive, face-to-face handoff simply is not available for many care transitions. However, hospitalists are challenged to find solutions that will work in their hospitals, with their teams, and their types of patients. Patients and policymakers expect nothing less. TH
Larry Beresford is a freelance writer based in Oakland, Calif.
References
- Payne C, Stein J, Dressler D. Implementation of a structured electronic tool to improve patient handoffs and resident satisfaction. Poster abstract: Internal Medicine 2010, April 21-24, 2010, Toronto.
- Vidyarthi AR. Triple Handoff. AHRQ WebM&M website. Available at: webmm.ahrq.gov/case.aspx? caseID=134. Published May 2006. Accessed May 29, 2010.
- Snow V, Beck D, Budnitz T, et al. Transitions of Care Consensus Policy Statement: American College of Physicians, Society of General Internal Medicine, Society of Hospital Medicine, American Geriatrics Society, American College of Emergency Physicians, and Society for Academic Emergency Medicine. J Hosp Med. 2009;4(6):364-370.
- 2006 National Patient Safety Goals. The Joint Commission website. Available at: www.jointcommission.org/PatientSafety/NationalPatientSafetyGoals/06_npsgs.htm. Accessed June 8, 2010.
- Jencks SF, Williams MV, Coleman EA. Rehospitalizations among patients in the Medicare fee-for-service program. N Engl J Med. 2009; 2:360:1418-1428.
- Forster AJ, Murff HJ, Peterson JF, Gandhi TK, Bates DW. The incidence and severity of adverse events affecting patients after discharge from the hospital. Ann Intern Med. 2003;138(3):161-167.
- Myers JS, Jaipaul CK, Kogan JR, Krekun S, Bellini LM, Shea JA. Are discharge summaries teachable? The effects of a discharge summary curriculum on the quality of discharge summaries in an internal medicine residency program. Acad Med. 2006; 81(10):S5-S8.
- Jack BW, Chetty VK, Anthony D, et al. A reengineered hospital discharge program to decrease rehospitalization: a randomized trial. Ann Intern Med. 2009;150(3):178-187.
- Arora VM, Manjarrez E, Dressler DD, Basaviah P, Halasyamani L, Kripalani S. Hospitalist handoffs: a systematic review and task force recommendations. J Hosp Med. 2009;4(7): 433-440.
- Halasyamani L, Kripalani S, Coleman E, et al. Transition of care for hospitalized elderly patients—development of a discharge checklist for hospitalists. J Hosp Med. 2006;1(6):354-360.
- Schnipper JL, Kirwin JL, Cotugno MC, et al. Role of pharmacist counseling in preventing adverse drug events after hospitalization. Arch Int Med. 2006;166(5):565-571.
- Dudas V, Bookwalter T, Kerr KM, Pantilat SZ. The impact of follow-up telephone calls to patients after hospitalization. Am J Med. 2001;111(9B): 26S-30S.
Care Transition Tips for Hospitalists and Groups
One recognized key to effective internal handoffs is the face-to-face verbal update, with opportunities to ask questions, priority given to sicker patients, and a written backup filling in the blanks with information that might become important as the patient’s condition changes. But if that is not practical for your HM group, what tools and processes will come closest to the ideal?
A key to effective discharge from the hospital is connection with the PCP, although face-to-face encounters with PCPs are highly unlikely. Hospitalists say there are levels of connection with PCPs, from the urgent (“I need to talk to someone right now”) to the routine (“It’s OK if they get this information tomorrow”). Many often wonder if there should be two levels of discharge communication with PCPs: an immediate message relaying crucial information and a formal discharge summary coming later.
For HM groups, the following is a list of suggestions from transitions-of-care researchers:
- Keep accurate and up-to-date contact information, including preferred communication medium, on referring physicians; survey them on their satisfaction with the discharge communications they receive from hospitalists.
- Partner with hospital administrators and with patient-safety and quality officers to address handoff issues.
- Partner with IT staff to help bridge the divide between clinicians and information technology.
- Track such outcomes as rehospitalization rates.
- Offer formal training on handoffs, discharges, and effective communication to physicians and other providers.
- Standardize the signout process, with computerized tools when appropriate, and create automated systems for following up on tests and lab results that come back after discharge.
- Structure shifts and their overlaps to help facilitate signouts.
- Consider implementing a discharge checklist.10
- Develop a strategy for medication reconciliation, with someone assigned to the process, be that a hospitalist, pharmacist or nurse.11
- Advocate for a post-discharge call-back policy by assigned staff at defined intervals, either for every patient discharged or for those targeted as higher-risk.12
- Consider creating a post-discharge clinic and/or a phone number that discharged patients can call to clarify post-discharge questions and concerns.
For individual hospitalists:
- Understand the transition process, where it fails, and why.
- Be open to changing the way you do things. Be accountable for transitions, and a role model for others.
- Focus on the present—today’s baseline, current to-do items, and what to expect next in the patient’s care.
- Track patients and their future discharge needs from the day of admission. What’s the likely date for going home? What does the patient need to learn in the meantime? Help nurses focus on achieving those needs and, if possible, schedule the initial outpatient clinic appointment before the patient leaves the hospital.
- Take time to talk your patients, listen to their concerns and confirm their understanding of what lies ahead.
For hospitalists on the receiving end of transition messages:
- Actively listen—stay focused, limit interruptions, take notes.
- Ask questions to ensure your understanding and read back what you understand to be the communication.
- Have a system for keeping track of to-do items requiring follow-up.—LB
California Dreamin’
Project BOOST, SHM’s popular mentorship program designed to help hospitals reduce readmissions, is headed to the most populous state in the country. In a joint venture with the California HealthCare Foundation, Project BOOST (Better Outcomes for Older Adults through Safe Transitions) will launch a groundbreaking, two-year program in 20 hospitals in the Golden State.
The California HealthCare Founda-tion will cover almost half of the $28,000 in tuition costs for each hospital accepted into the collaborative program. Individual sites will be responsible for the other $14,500.

In year one, hospitals will begin improving their discharge procedures using Project BOOST’s toolkit and one-on-one mentorships with leaders in the field. The second year of the project will focus on training additional mentors in California. The foundation has committed not only to improving outcomes in the first 20 sites, but also building a sustainable infrastructure that will allow gains to quickly spread throughout the state.
Recruiting for the California sites has just begun. Potential applicants can visit www.hospitalmedicine.org/boost for more information.
“California is a microcosm for the challenges and opportunities for hospitalized care in our healthcare system,” says Janet Nagamine, RN, MD, SFHM, program leader for the California BOOST program and an SHM board member. “We are very excited to work with the California HealthCare Foundation, one of the state’s leaders in healthcare quality improvement. … Their support will help California’s hospitals and primary-care physicians [PCPs] safely transition patients from hospital to home during that vulnerable period.”

Project BOOST’s Continued Expansion
The California program will be SHM’s largest state-specific program to date, representing the fourth wave of BOOST’s continued expansion. With the support of the John A. Hartford Foundation, the program began with six pilot sites throughout the country in 2008. In 2009, Hartford funded 24 additional sites.
In January, SHM, the University of Michigan, and Blue Cross Blue Shield of Michigan announced the first state-specific Project BOOST program. The three organizations announced Michigan’s 14 participating sites in May.
Two other hospital sites began implementing Project BOOST on a tuition-based model in May.
Readmission Challenge
Most hospitalists are intimately familiar with the challenges involved with transitions of care. Research in the April 2009 New England Journal of Medicine by Stephen F. Jencks, MD, MPH, Mark V. Williams, MD, FHM, and Eric A. Coleman, MD, MPH, indicates that 1 in 5 hospitalized patients is readmitted to the hospital within a month of their discharge.1
Balancing the three-legged stool of communication between the hospitalist, PCP, and patient can be demanding. For the individual hospitalist or PCP, it requires intense attention to detail, strong communication skills, and patience. For hospitals, safe transitions require a systemic, team-based approach.
But the alternative—continued or increased readmissions after discharge—is even more taxing. The study found that unplanned readmissions cost Medicare $17.4 billion each year, making estimates of the total cost even higher.1
Looking beyond the costs directly associated with readmissions, the study’s authors see the issue as a potential vital sign that could assess overall healthcare quality. “Although the readmission rate is often presented as a measure of the performance of hospitals, it may also be a useful indicator of the performance of our healthcare system,” they write.
The Approach: Gain Traction, Results
Rather than forcing a one-size-fits-all process on every hospital site, Project BOOST provides individual hospitals with the capacity and experience necessary to implement processes that best fit their unique situation.
Project BOOST sites participate in a two-pronged program consisting of a yearlong, one-on-one mentorship with the leaders in the field. It begins with an intensive, two-day conference and the Project BOOST toolkit.
The toolkit includes printed materials and a new DVD for use by hospitalists and other care providers to facilitate communication with patients and caregivers during discharge.
New case studies published by SHM document some of the program’s earliest successes.
At Piedmont Hospital, a 481-bed acute-care hospital near Atlanta, the full implementation of Project BOOST in one hospital unit has improved many of its “vital signs” in comparison with units that have not implemented BOOST, including decreased length of stay and lower 30-day readmissions (see “Piedmont Hospital: Project BOOST unit vs. regular hospital units,” p. 6).
For St. Mary’s Medical Center, a 582-bed community teaching hospital in St. Louis, hospitalists implementing Project BOOST made a major difference in just three months:
Not only did the Project BOOST unit nearly halve 30-day readmissions (7% from 12%), but the program also increased patient satisfaction, to 68% from 52%.
BOOSTing into the Future
Project BOOST benefits haven’t been limited to program sites and their patients. New innovations from the mentored implementation program have led to resources that all hospitals can use.
SHM recently introduced a new DVD and curriculum package that teaches nurses and discharge planners to use the “teachback” method to communicate with patients during the discharge process. It helps ensure that patients fully understand their care plans and post-discharge instructions.
The teachback package is available at the SHM online store (www.hospitalmedicine.org); it is $85 for SHM members and $125 for nonmembers.
SHM has also launched a BOOST data center and a BOOST community site. The data center enables sites to enter, track, and benchmark key outcomes, which can then be evaluated against comparison units at their own hospitals, BOOST averages, and subsets of hospitals with similar characteristics. The BOOST community site facilitates the sharing of ideas and documents between BOOST hospitals.
New funding approaches will help Project BOOST to continue to reach more hospitals. Since its inception, third parties have provided financial resources for the program.
Now, SHM is offering a tuition-based model, open to hospitals nationwide, which is set to begin this fall.
SHM is accepting applications at www.hospitalmedicine.org/boost. TH
Brendon Shank is a freelance writer based in Philadelphia.
Reference
- Jencks SF, Williams MV, Coleman EA. Rehospitalizations among patients in the Medicare fee-for-service program. N Eng J Med. 2009:360:1418-1428.
Project BOOST, SHM’s popular mentorship program designed to help hospitals reduce readmissions, is headed to the most populous state in the country. In a joint venture with the California HealthCare Foundation, Project BOOST (Better Outcomes for Older Adults through Safe Transitions) will launch a groundbreaking, two-year program in 20 hospitals in the Golden State.
The California HealthCare Founda-tion will cover almost half of the $28,000 in tuition costs for each hospital accepted into the collaborative program. Individual sites will be responsible for the other $14,500.
In year one, hospitals will begin improving their discharge procedures using Project BOOST’s toolkit and one-on-one mentorships with leaders in the field. The second year of the project will focus on training additional mentors in California. The foundation has committed not only to improving outcomes in the first 20 sites, but also building a sustainable infrastructure that will allow gains to quickly spread throughout the state.
Recruiting for the California sites has just begun. Potential applicants can visit www.hospitalmedicine.org/boost for more information.
“California is a microcosm for the challenges and opportunities for hospitalized care in our healthcare system,” says Janet Nagamine, RN, MD, SFHM, program leader for the California BOOST program and an SHM board member. “We are very excited to work with the California HealthCare Foundation, one of the state’s leaders in healthcare quality improvement. … Their support will help California’s hospitals and primary-care physicians [PCPs] safely transition patients from hospital to home during that vulnerable period.”
Project BOOST’s Continued Expansion
The California program will be SHM’s largest state-specific program to date, representing the fourth wave of BOOST’s continued expansion. With the support of the John A. Hartford Foundation, the program began with six pilot sites throughout the country in 2008. In 2009, Hartford funded 24 additional sites.
In January, SHM, the University of Michigan, and Blue Cross Blue Shield of Michigan announced the first state-specific Project BOOST program. The three organizations announced Michigan’s 14 participating sites in May.
Two other hospital sites began implementing Project BOOST on a tuition-based model in May.
Readmission Challenge
Most hospitalists are intimately familiar with the challenges involved with transitions of care. Research in the April 2009 New England Journal of Medicine by Stephen F. Jencks, MD, MPH, Mark V. Williams, MD, FHM, and Eric A. Coleman, MD, MPH, indicates that 1 in 5 hospitalized patients is readmitted to the hospital within a month of their discharge.1
Balancing the three-legged stool of communication between the hospitalist, PCP, and patient can be demanding. For the individual hospitalist or PCP, it requires intense attention to detail, strong communication skills, and patience. For hospitals, safe transitions require a systemic, team-based approach.
But the alternative—continued or increased readmissions after discharge—is even more taxing. The study found that unplanned readmissions cost Medicare $17.4 billion each year, making estimates of the total cost even higher.1
Looking beyond the costs directly associated with readmissions, the study’s authors see the issue as a potential vital sign that could assess overall healthcare quality. “Although the readmission rate is often presented as a measure of the performance of hospitals, it may also be a useful indicator of the performance of our healthcare system,” they write.
The Approach: Gain Traction, Results
Rather than forcing a one-size-fits-all process on every hospital site, Project BOOST provides individual hospitals with the capacity and experience necessary to implement processes that best fit their unique situation.
Project BOOST sites participate in a two-pronged program consisting of a yearlong, one-on-one mentorship with the leaders in the field. It begins with an intensive, two-day conference and the Project BOOST toolkit.
The toolkit includes printed materials and a new DVD for use by hospitalists and other care providers to facilitate communication with patients and caregivers during discharge.
New case studies published by SHM document some of the program’s earliest successes.
At Piedmont Hospital, a 481-bed acute-care hospital near Atlanta, the full implementation of Project BOOST in one hospital unit has improved many of its “vital signs” in comparison with units that have not implemented BOOST, including decreased length of stay and lower 30-day readmissions (see “Piedmont Hospital: Project BOOST unit vs. regular hospital units,” p. 6).
For St. Mary’s Medical Center, a 582-bed community teaching hospital in St. Louis, hospitalists implementing Project BOOST made a major difference in just three months:
Not only did the Project BOOST unit nearly halve 30-day readmissions (7% from 12%), but the program also increased patient satisfaction, to 68% from 52%.
BOOSTing into the Future
Project BOOST benefits haven’t been limited to program sites and their patients. New innovations from the mentored implementation program have led to resources that all hospitals can use.
SHM recently introduced a new DVD and curriculum package that teaches nurses and discharge planners to use the “teachback” method to communicate with patients during the discharge process. It helps ensure that patients fully understand their care plans and post-discharge instructions.
The teachback package is available at the SHM online store (www.hospitalmedicine.org); it is $85 for SHM members and $125 for nonmembers.
SHM has also launched a BOOST data center and a BOOST community site. The data center enables sites to enter, track, and benchmark key outcomes, which can then be evaluated against comparison units at their own hospitals, BOOST averages, and subsets of hospitals with similar characteristics. The BOOST community site facilitates the sharing of ideas and documents between BOOST hospitals.
New funding approaches will help Project BOOST to continue to reach more hospitals. Since its inception, third parties have provided financial resources for the program.
Now, SHM is offering a tuition-based model, open to hospitals nationwide, which is set to begin this fall.
SHM is accepting applications at www.hospitalmedicine.org/boost. TH
Brendon Shank is a freelance writer based in Philadelphia.
Reference
- Jencks SF, Williams MV, Coleman EA. Rehospitalizations among patients in the Medicare fee-for-service program. N Eng J Med. 2009:360:1418-1428.
Market Watch
New Drugs, Indications, Dosage Forms, and Approval Recommendations
- Acetaminophen intravenous (Ofirmev) received a complete response letter in February from the FDA related to facility manufacturing deficiencies. The FDA did not cite any safety or efficacy issues and is not requiring any additional studies to be done prior to approval.1 The third-party manufacturer has submitted its response to the FDA and is ready to resubmit their new drug application (NDA) for this agent. It is being investigated to treat fever and pain in adults and children.2
- Ciprofloxacin dry powder inhaler (DPI) has received orphan drug status from the FDA for treating pulmonary infections in cystic fibrosis (CF) patients.3,4 It is in clinical trials to determine if it can improve pulmonary function in CF patients with Pseudomonas aeruginosa infections.
- Carglumic acid (Carbaglu) has been approved by the FDA to treat the metabolic disorder N-acetylglutamate synthetase (NAGS) deficiency.5 NAGS deficiency is an extremely rare genetic disorder that presents shortly after birth. It results in hyperammonemia, and can be fatal if not rapidly detected and managed. Carglumic acid treats the hyperammonemia within three days, with a lowering of the ammonia level within 24 hours. In clinical trials, a small number of patients (n=23) received the drug from six months to 21 years; the majority of patients were able to maintain normal ammonia levels long-term with continued treatment. It is recommended that carglumic acid only be administered by physicians who have experience dealing with metabolic disorders. The starting dose is between 100 mg/kg/day and 250 mg/kg/day for treatment of acute hyperammonemia. Using other agents to lower the ammonia level during acute episodes is recommended. Dosing should be based on the ammonia level and the patient’s symptoms.
- CK-2017357 has received orphan drug status for treating amyotrophic lateral sclerosis (ALS), or Lou Gehrig’s disease.6
- Desirudin injection (Iprivask), a direct thrombin inhibitor, has been approved by the FDA for the prevention of DVT.7 In clinical trials, it was superior to enoxaparin and unfractionated heparin for preventing proximal DVT and prevention of major venous thromboembolic events following elective hip replacement surgery. Desirudin is administered as a fixed subcutaneous dose. It does not cause thrombocytopenia, is relatively short-acting, and is easy to monitor. Some of the adverse reactions in clinical trials were thrombosis, hypotension, lower-extremity edema, fever, decreased hemoglobin level, and hematuria.8 Also known as Revasc, this medication has been available in Europe for more than 10 years.
- Doxepin tablets (Silenor) have been approved by the FDA for the treatment of short-term and chronic insomnia distinguished by difficulty with sleep maintenance in adults and elderly patients.9 Sleep maintenance includes difficulty staying asleep, waking up too much or too early, and not being able to fall back asleep. In clinical trials, adverse reactions were similar to placebo, there was a low-therapy discontinuation rate, and no evidence of amnesia, tolerance, or complex sleep behaviors such as sleep eating or sleep driving.10 It will be available in 3-mg and 6-mg tablets. It is not designated as a controlled substance.
- GVAX pancreas vaccine has received orphan drug status as a potential treatment for pancreatic cancer.11 It also is being investigated for other cancers, including those of the breast and for leukemias.
- Ritonavir (Norvir) has been approved by the FDA in a new formulation, which is heat-stable and can be stored at room temperature rather than in the refrigerator.12 The rate of drug absorption with the new formulation is different but does not require a dosage change.
- Somatropin [rDNA origin] prefilled injection pen (Norditropin FlexPro) has been approved by the FDA to treat adults and children with growth hormone disorders.13 The pen has an audible click and does not require any reconstitution or cartridge loading. After initial use, the pen can be left at room temperature for up to three weeks without worry of drug degradation.
Pipeline
- Agalsidase (Replagal) has received fast-track status from the FDA for treating Fabry disease.14 It is an enzyme replacement therapy.
- Exenatide LAR (Bydureon), the once-weekly version of exenatide (Byetta), is in final discussions at the FDA. The FDA has asked for additional information related to the product label, risk mitigation, and manufacturing, which the manufacturer is addressing.15
- Insulin powder for inhalation, ultra-rapid-acting (Afrezza), has been reviewed by the FDA, and the agency has requested additional information related to safety and labeling.16
- A combination therapy of saxagliptin/metformin has been submitted to the FDA as a once-daily treatment of Type 2 diabetes mellitus as an adjunct to diet in adults who cannot adequately control their diabetes on metformin monotherapy, or in treatment-naïve patients.17
- Vilanterol/fluticasone is a combination of the inhaled corticosteroid fluticasone and the long-acting beta-agonist (LABA) vilanterol, which is currently in Phase 3 clinical trials for treating asthma.18 The trial will compare the combination’s efficacy and safety to fluticasone/salmeterol (Advair). TH
Michele B. Kaufman, PharmD, BSc, RPh, is a freelance medical writer based in New York City and a clinical pharmacist at New York Downtown Hospital.
References
- Cadence pharmaceuticals receives complete response letter from FDA for intravenous acetaminophen NDA. Cadence Pharmaceuticals website. Available at: http://cadx.client.shareholder.com/releasedetail.cfm?ReleaseID=444303. Accessed March 23, 2010.
- Cadence pharmaceuticals reports fourth quarter and full year 2009 financial results. Cadence Pharmaceuticals website. Available at: http://files.shareholder.com/downloads/CADX/874963043x0x359109/1cf00f72-0872-4d4e-b27d-bde1c03d625a/CADX_News_2010_3_15_General_Releases.pdf. Accessed March 23, 2010.
- Bayer lung infection drug gets orphan status. Forbes website. Available at: http://www.forbes.com/feeds/ap/2010/03/11/business-energy-us-bayer-healthcare-orphan-drug_7427368.html. Accessed March 23, 2010.
- FDA grants orphan status for Bayer’s ciprofloxacin for cystic fibrosis. The Pharma Letter website. Available at: http://www.thepharmaletter.com/file/4e4fb33313eddf122cdb730e3ea71840/fda-grants-orphan-status-for-bayers-ciprofloxacin-for-cystic-fibrosis.html. Accessed March 23, 2010.
- Burgess S. FDA approves drug to treat condition that causes elevated ammonia levels. U.S. Food and Drug Administration website. Available at: http://www.fda.gov/NewsEvents/Newsroom/PressAnnouncements/ucm205150.htm. Accessed March 23, 2010.
- UPDATE 1: Cytokinetics’ Lou Gehrig’s drug gets orphan status. Reuters website. Available at: http://www.reuters.com/assets/print?aid=USSGE6290J820100310. Accessed March 23, 2010.
- Iprivask available for prevention of deep vein thrombosis. Monthly Prescribing Reference website. Available at: http://www.empr.com/iprivask-available-for-prevention-of-deep-vein-thrombosis/article/164779/. Accessed March 23, 2010.
- First direct thrombin inhibitor for DVT prevention now available from Canyon Pharmaceuticals. Canyon Pharmaceuticals website. Available at: http://www.canyonpharma.com/newsexpand.aspx?id=7. Accessed March 23, 2010.
- FDA approves Silenor. Drugs.com website. Available at: http://www.drugs.com/newdrugs/somaxon-announces-fda-approval-silenor-doxepin-insomnia-2070.html?printable=1. Accessed March 23, 2010.
- UPDATE 1: Somaxon gets FDA nod for insomnia drug, shares soar. Reuters website. Available at: http://www.reuters.com/assets/print?aid=USSGE62H0KI20100318. Accessed March 21, 2010.
- BioSante announces FDA orphan drug designation for GVAX pancreatic cancer vaccine. The New York Times website. Available at: http://markets.on.nytimes.com/research/stocks/news/press_release.asp?docTag=201003150755BIZWIRE_USPRX____BW5298&feedID=600&press_symbol=64917. Accessed March 23, 2010.
- Abbott receives U.S. FDA approval for heat-stable Norvir (ritonavir) tablets. Abbott website. Available at: http://www.abbott.com/global/url/pressRelease/en_US/60.5:5/Press_Release_0820.htm. Accessed March 23, 2010.
- Novo Nordisk receives FDA approval for Norditropin FlexPro for growth hormone treatment. Novo Nordisk website. Available at: http://press.novonordisk-us.com/index.php?s=43&item=239. Accessed March 23, 2010.
- Dane L. Shire receives FDA fast-track designation for Replagal. FirstWord website. Available at: http://www.firstwordplus.com/Fws.do?articleid=97AF48EBA7054EF0857F055877E82B2C&logRowId=352323. Accessed March 23, 2010.
- Amylin shares up on FDA response for diabetes drug. Forbes website. Available at: http://www.forbes.com/feeds/ap/2010/03/15/business-health-care-us-amylin-mover_7435579.html. Accessed March 23, 2010.
- Russell J. MannKind drug fails to win FDA approval. Los Angeles Business Journal website. Available at: http://labusinessjournal.com/article.asp?aid=4998235.0597195.1894204.8500584.7421642.713. Accessed March 23, 2010.
- U.S. Food and Drug Administration accepts NDA for once-daily fixed dose combination of Onglyza (saxagliptin) and extended-release metformin for the treatment of type 2 diabetes mellitus in adults. AstraZeneca website. Available at: http://www.astrazeneca-us.com/about-astrazeneca-us/newsroom/product/8804120?itemId=8804120#. Accessed March 23, 2010.
- Dennis M. GlaxoSmithKline begins late-stage clinical programme for asthma drug Relovair. FirstWord website. Available at: http://www.firstwordplus.com/Fws.do?articleid=E256469FBD8F4A2F80C5DD3E844CC1E1&logRowId=356423. Accessed March 23, 2010.
In the Literature
In This Edition
Literature at a Glance
A guide to this month’s studies
- Effect of restrictive antibiotic policies on dosing timeliness
- Desired consultation format and content
- Risk of cancer associated with CT imaging
- Bleeding, mortality with aspirin after peptic ulcer bleed
- Diagnosis of lung cancer after pneumonia
- Outcomes associated with hyponatremia
- Patient awareness, interest in inpatient medication list
- Monoclonal antibodies in C. difficile
Restrictive Antimicrobial Policy Delays Administration
Clinical question: Does the approval process for restricted on-formulary antimicrobials cause a significant delay in their administration?
Background: Widespread and often unwarranted, antimicrobial use in the hospital lends itself to the development of microbial resistance and increases overall costs. To curb such practices, many hospitals require subspecialty approval prior to dispensing select broad-spectrum antimicrobials. Though shown to improve outcomes, the impact of the approval process on the timeliness of antimicrobial administration remains to be seen.
Study design: Retrospective cohort study.
Setting: Tertiary-care university hospital.
Synopsis: The study included 3,251 inpatients with computerized orders for a “stat” first dose of any of 24 pre-selected, parenteral antimicrobials. Time lag (more than one hour, and more than two hours) to nursing documentation of drug administration was separately analyzed for restricted and unrestricted antimicrobials.
Delay of more than one hour was significantly higher for restricted antimicrobials with an odds ratio of 1.49 (95% CI; 1.23-1.82), while the odds ratio for a delay of more than two hours was 1.78 (95% CI, 1.39-2.21). Also, for restricted antimicrobials, the percentage of orders delayed for more than one hour was significantly different between daytime and nighttime (when the first dose was exempt from pre-approval) orders: 46.1% versus 38.8% (P<0.001). For unrestricted drugs, delay was uniform irrespective of time of day (36.4% of daytime and 36.6% of nighttime orders were delayed more than one hour). The effect of delay in drug administration on patient outcomes was not evaluated.
Though the approval process aims in part to affect resistance patterns and overall costs, this research highlights the need to minimize the delay in administration and probably skip the approval for the first dose in critically ill patients.
Bottom line: Antibiotic approval processes can delay their administration in hospitalized patients, but the effect of this delay on patient outcomes is not yet known.
Citation: Winters BD, Thiemann DR, Brotman DJ. Impact of a restrictive antimicrobial policy on the process and timing of antimicrobial administration. J Hosp Med. 2010;5(1):E41-45.
Physicians Uphold Tenets of Effective Consultation while Highlighting Some Newer Viewpoints
Clinical question: What key features of a consultation are most desirable for physicians?
Background: With new changes in healthcare delivery, the standardization offered by the electronic health record (EHR) system will undoubtedly be confronted by the heterogeneity of clinical consultations. Determination of the various characteristics considered essential for a consultation can help standardize the processes and improve the quality of communication.
Study design: Opinion surveys with a 16-question, Web-based questionnaire about inpatient consultations.
Setting: Four Minnesota teaching hospitals affiliated with the University of Minnesota.
Synopsis: This study surveyed 651 physicians, mostly from general medicine and pediatrics (30% in-training; 54% were more than five years out of training). The response rate to the survey was 50% (323). Responses were analyzed separately for physicians predominantly requesting consultations (requesters) and those predominantly providing them (consultants).
Regarding the consultation request, the majority of consultants preferred a precise consult question (94%), contact information of the ordering provider (68%), and the urgency of consultation (66%), with telephonic communication for emergent consults (75%). Responses were similar regardless of practice site, specialty, or experience.
Regarding the consultation, more requesters desired verbal communication over written advice alone: Sixty-six percent preferred to have the rationale of the recommendations explained. They also preferred a separate recommendations section (48%) with bulleted suggestions (69%) at the top or bottom of the note (74%). Emphasis was placed on specificity of drug names, dose, and duration of therapy (80%), along with alternative options (76%). Most requesters desired a clear “signoff” note when appropriate, with a follow-up plan (74%) or scheduled appointments (44%).
Bottom line: For consultations, the majority of physicians prefer an explanation of medical decision-making, a crisp recommendation section, and specific directions for follow-up.
Citation: Boulware DR, Dekarske AS, Filice GA. Physician preferences for elements of effective consultations. J Gen Intern Med. 2010;25(1):25-30.
CT Scanning Could Be Related to a Future Risk of Cancer at a Population Level
Clinical question: Does the accelerated use of CT scans increase the future risk for radiation-related cancer?
Background: Computed tomography (CT) has come through as a powerful diagnostic and interventional imaging modality at the cost of higher radiation exposures. The potential cancer risk is minimal at an individual level; however, CT technology is used in more than 70 million scans annually. This volume can translate into a significant number of future cancers in the population.
Study design: Indirect risk modeling based on CT scan frequencies and radiation risk models.
Synopsis: Annual frequencies of CT scans (age- and sex-specific) were extracted from insurance claims. The study included 57 million scans, of which 30% were performed in adults 35 to 54 years old. The majority of scans were in females (60%).
Age-specific cancer risk for each CT scan type was estimated through published radiation risk models and national surveys. The projected number of incident cancers per 10,000 scans was highest for chest or abdominal CT angiography (CTA) and whole-body CT. Incidence was higher for females.
The CT scan frequencies were combined with the cancer risk, and it was estimated that approximately 29,000 (95% UL, 15,000-45,000) future cancers could be related to the exposure from CT scans. Uncertainty limits (UL), an estimation of the total error of measurement, accounted for statistical and subjective uncertainties. The risk was dependent on the radiation dose (chest CTA) and frequency of use (abdomen/pelvis followed by chest and head). The most common cancers were lung, colon, and leukemia.
Two-thirds of the projected cancers were in females and attributable to the higher frequency of scans in women coupled with their dual risk of breast and lung cancer with chest radiation. The results provide potential study targets for risk-reduction efforts.
Bottom line: CTA of the chest, abdomen, or pelvis could be related to risk of future cancers, especially in middle-aged females.
Citation: Berrington de González A, Mahesh M, Kim KP, et al. Projected cancer risks from computed tomographic scans performed in the United States in 2007. Arch Intern Med. 2009;169(22):2071-2077.
Early Resumption of Low-Dose Aspirin after Peptic Ulcer Bleeding Might Be Beneficial
Clinical question: Is it safe to restart aspirin after acute gastrointestinal (GI) bleeding in patients with cardiovascular or cerebrovascular disease?
Background: The increasing cardiovascular burden in the aging population has indirectly increased aspirin-related peptic ulcer bleeding. Proton-pump inhibitors (PPI) have shown promise in reducing recurrent GI bleeding in non-aspirin-related cases. It is unclear if this protective effect applies to patients on aspirin and, if so, if aspirin resumption after endoscopic treatment is safe.
Study design: Parallel, randomized, placebo-controlled, noninferiority trial.
Setting: Single tertiary endoscopy center in Hong Kong.
Synopsis: One hundred fifty-six patients with aspirin-related peptic ulcer bleeding were selected for the study. After successful endoscopic treatment and 72 hours on pantoprazole infusion, the patients were started on oral pantoprazole for the duration of the study (eight weeks). Patients were equally randomized to receive low-dose aspirin (80 mg/d) or placebo. Primary outcome was recurrent bleeding within 30 days. Secondary outcomes included eight-week all-cause mortality, cause-specific mortality, and recurrence of cardiovascular events.
The aspirin group had a 50% higher risk of recurrent bleeding within 30 days compared with placebo (10.3% vs. 5.4%). However, for the secondary endpoints, aspirin had lower all-cause mortality (1.3% vs. 12.9%), which was not related to increased GI bleeding. On the other hand, discontinuation of aspirin and use of PPI in the placebo group did not prevent mortality related to GI complications.
The small numbers restrict interpretation of the mortality rates but offer support to the fact that the cardioprotective effects of aspirin outweigh its potential for GI bleeding. It is to be noted that these results cannot be extrapolated to higher doses of aspirin.
Bottom line: Early resumption of aspirin after successful treatment of peptic ulcer bleeding might increase the risk of rebleeding but potentially decreases overall mortality.
Citation: Sung JJ, Lau JY, Ching JY, et al. Continuation of low-dose aspirin therapy in peptic ulcer bleeding: a randomized trial. Ann Intern Med. 2010;152(1):1-9.
A Substantial Number of Elderly Patients with Pneumonia Have Pulmonary Malignancy
Clinical question: What is the incidence of, and risk factors for, diagnosis of lung cancer after discharge for pneumonia?
Background: Pneumonia-related admissions in elderly individuals have increased by nearly 20% during the past two decades. Based on the risk profile of this age group, many physicians recommend follow-up chest imaging after pneumonia to ensure resolution and exclude underlying malignancy. However, this practice is not backed by substantial evidence.
Study design: Retrospective cohort study from administrative databases of the VA system.
Setting: Veteran Affairs (VA) Health Care System.
Synopsis: More than 40,000 patients (older than 65, 98.1% male) hospitalized for pneumonia were included in the study. These patients had no pneumonia in the preceding year and did not carry a diagnosis of lung cancer. During the follow-up period of up to five years, a significant proportion (9.2%) of these patients were diagnosed with pulmonary malignancy.
Pertinent factors associated with increased risk of diagnosis included active tobacco use, COPD, and prior nonpulmonary malignancy. Interestingly, stroke, diabetes, dementia, and heart failure were associated with a lower risk of diagnosis, likely due to early mortality from these diseases prior to diagnosis of lung cancer.
Mean time to diagnosis was 297 days, with just 27% diagnosed within 30 days. On mortality analysis, 12.9% (n=5270) of the patients died within 30 days and 20.7% (n=8451) within 90 days. Thus, a period of surveillance of 30 to 90 days following pneumonia, especially in patients with risk factors, could be beneficial.
This study was limited due to the shortcomings of database analyses. Also, the predominantly male, elderly, veteran population restricts extrapolation to the general population.
Bottom line: Patients with risk factors for lung cancer might benefit from surveillance chest imaging after hospitalization for pneumonia to rule out an underlying malignancy.
Citation: Mortensen EM, Copeland LA, Pugh MJ, et al. Diagnosis of pulmonary malignancy after hospitalization for pneumonia. Am J Med. 2010:123(1):66-71.
Hospital-Associated Hyponatremia of Any Severity Adversely Impacts Mortality and Financial Metrics
Clinical question: Does hyponatremia during a hospitalization prophesize a worse outcome?
Study design: Retrospective cohort study from 2002-2007.
Setting: Urban academic medical center.
Synopsis: This study included 53,236 adults based on the presence of admission or subsequent hyponatremia (defined as [Na+] <138 mEq/L). The patients were classified as community-acquired (CAH=37.9%), hospital-aggravated (5.7%), or hospital-acquired hyponatremia (HAH=38.2%).
Across all subgroups, all types of hyponatremia were independently associated with worse primary outcomes, including an increase in hospital mortality (CAH 52%, HAH 66%), prolongation of hospital stay, and discharge to a facility. Also, for the same [Na+], HAH had significantly increased mortality compared with CAH. Though the elderly were more prone to develop hyponatremia, patients younger than 65 had worse outcomes.
The severity of hyponatremia prognosticated adverse outcomes. The liberal definition of hyponatremia, as opposed to the current standard of <135 mEq/L, explains the large numbers in prevalence. However, even mild hyponatremia (133 mEq/L to 137) was linked to poor outcomes (adjusted OR 1.34; CI 1.18-1.51).
The study weaknesses include the use of administrative codes to identify comorbidities, less applicability to outpatient setting, and lack of evaluation of outcomes postdischarge. However, the robust numbers do establish inpatient hyponatremia as a marker of worse outcomes.
Bottom line: Inpatient hyponatremia of any severity is a marker of increased mortality and excessive financial burden.
Citation: Wald R, Jaber BL, Price LL, Upadhyay A, Madias NE. Impact of hospital-associated hyponatremia on selected outcomes. Arch Intern Med. 2010;170(3):294-302.
Patients Lack Awareness and Prefer to Be Updated Regarding Their Inpatient Medications
Clinical question: Is patient knowledge of their medications deficient, and does this reflect a lack of desire to be involved in the medication reconciliation process?
Background: Medication errors remain a significant healthcare problem due to their potential to increase morbidity. For medication administration errors, apart from the dispensing pharmacist and the nurses, patients could be the final checkpoint to ensure medication safety. However, their awareness and enthusiasm to participate has not been adequately assessed in the literature.
Study design: A cross-sectional study using individual surveys to assess awareness and attitudes regarding inpatient medications.
Setting: Single tertiary-care academic teaching hospital.
Synopsis: Fifty cognitively intact adult patients were consented for the study. Of these, 54% provided an accurate recollection of their outpatient medications. When they were surveyed regarding inpatient medications, 96% omitted at least one medication, with the average of 6.8 medication omissions. This was noted to correlate with age >65 years. Also, 44% erroneously presumed they were on a medication while they were in the hospital, even though they weren’t.
When attitudes were surveyed, most of the patients would have preferred to get an inpatient medication list (78%) with the goal of improving their satisfaction (81%) and reducing errors (94%). Also, no association was found between patients’ errors of omission and their reported desire to be involved in the medication safety process.
This small study was limited to cognitively intact patients only. Also, the relatively younger age might cause an overestimation of patient interest in participation. However, the results highlight key medication reconciliation issues. Although patient involvement is desirable, a systematic program of educating them about their medications would be required to make their feedback effective and useful.
Bottom line: Healthy patients might be unaware of their exact hospital medications but prefer to be kept in the loop.
Citation: Cumbler E, Wald H, Kutner J. Lack of patient knowledge regarding hospital medications. J Hosp Med. 2010;5(2):83-86.
Monoclonal Antibodies against Clostridium difficile Toxins Prevent Recurrence
Clinical question: Are human monoclonal antibodies against C. difficile toxin A (CDA1) and B (CDB1) effective in preventing recurrence of C. diff infection (CDI)?
Background: Widespread use of antibiotics, coupled with the emergence of the hypervirulent (B1/NAP1/027) strain of C. diff, has altered the epidemiology of CDI. Even with effective treatment regimens, there is an escalation in severity, treatment failures, and recurrences. Antibodies against the C. diff toxins are being evaluated as the next frontier in treatment of CDI.
Study design: Phase 2 randomized, double-blind, placebo-controlled trial.
Setting: Thirty study centers in Canada and the U.S.
Synopsis: Two hundred patients with laboratory documented CDI on standard therapy with either metronidazole or vancomycin were randomized to receive a single IV infusion of combined monoclonal antibodies against CDA1 and CDB1 (n=101) or a normal saline placebo infusion (n=99). Patients were followed for 84 days with daily stool counts and intermittent blood samples for immunogenicity analysis.
The primary endpoint of recurrence of laboratory-proven C. diff diarrhea was significantly lower in the monoclonal antibody group (7% vs. 25% in placebo. 95% CI, 7-29; P <0.001). In a subgroup analysis of the epidemic BI/NAP1/027 strain, this favorable association persisted (8% vs. 32%). Recurrence in the antibody group was seen more in elderly patients hospitalized with a higher severity of underlying disease.
Secondary endpoints relating to the initial episode of CDI including treatment failure, severity of diarrhea, and duration to resolution were not significantly different between the two groups. Fewer accounts of serious adverse events were documented in the antibody group (18 patients vs. 28 patients in placebo, P=0.09), and immunogenicity was not detected in any patient.
Bottom line: Monoclonal antibody infusion against C. diff toxins reduces recurrence of infection, even with a hypervirulent (B1/NAP1/027) strain, without any significant adverse events.
Citation: Lowy I, Molrine DC, Leav BA, et al. Treatment with monoclonal antibodies against Clostridium difficile toxins. N Engl J Med. 2010; 362(3):197-205. TH
PEDIATRIC HM LITERATURE
By Mark Shen, MD

Rectal Colonization with S. aureus Associated with Skin Abscesses
Clinical question: Is rectal colonization with Staphylococcus aureus more strongly associated with staphylococcal skin abscesses than nasal colonization?
Background: Staphylococcal skin and soft tissue infections have dramatically increased in recent years. While increased rates of nasal colonization with S. aureus have also been noted, a strong association with skin infections in children has not been established. The relationship between staphylococcal colonization of other body sites and skin infection is unknown.
Study design: Prospective cohort study.
Setting: Tertiary-care hospital in Buffalo, N.Y.
Synopsis: Sixty children, 0 to 18 years of age, requiring surgical drainage of S. aureus skin abscesses and 90 children undergoing other surgical procedures were enrolled consecutively. Rectal, nasal, and abscess (if applicable) cultures were obtained on all patients. Enrollment ceased when notably different rates of rectal colonization were recorded.
Rectal cultures were significantly more likely to be positive in the abscess group than the control group (47% vs. 1%; P<0.0001), while rates of nasal colonization were similar (27% vs. 21%; P=0.44). Abscess isolates were identical to rectal isolates in 88% of cases and nasal isolates in 75% of cases.
Other findings included a 60% prevalence of methicillin-resistant S. aureus (MRSA) in the abscess group. Fifty-nine of the 60 abscess isolates contained Panton-Valentine leukocidin genes; 57 were pulsed-field type USA300; and all 60 contained the staphylococcal cassette chromosome mec type IVa.
Given this representative sample of community-associated staphylococcal disease, these findings suggest that a focus on nasal carriage of S. aureus might be misguided.
Bottom Line: Rectal colonization with S. aureus better predicts skin abscess isolate than nasal carriage.
Citation: Faden H, Lesse AJ, Trask J, et al. Importance of colonization site in the current epidemic of staphylococcal skin abscesses. Pediatrics. 2010;125(3):e618-e624.
In This Edition
Literature at a Glance
A guide to this month’s studies
- Effect of restrictive antibiotic policies on dosing timeliness
- Desired consultation format and content
- Risk of cancer associated with CT imaging
- Bleeding, mortality with aspirin after peptic ulcer bleed
- Diagnosis of lung cancer after pneumonia
- Outcomes associated with hyponatremia
- Patient awareness, interest in inpatient medication list
- Monoclonal antibodies in C. difficile
Restrictive Antimicrobial Policy Delays Administration
Clinical question: Does the approval process for restricted on-formulary antimicrobials cause a significant delay in their administration?
Background: Widespread and often unwarranted, antimicrobial use in the hospital lends itself to the development of microbial resistance and increases overall costs. To curb such practices, many hospitals require subspecialty approval prior to dispensing select broad-spectrum antimicrobials. Though shown to improve outcomes, the impact of the approval process on the timeliness of antimicrobial administration remains to be seen.
Study design: Retrospective cohort study.
Setting: Tertiary-care university hospital.
Synopsis: The study included 3,251 inpatients with computerized orders for a “stat” first dose of any of 24 pre-selected, parenteral antimicrobials. Time lag (more than one hour, and more than two hours) to nursing documentation of drug administration was separately analyzed for restricted and unrestricted antimicrobials.
Delay of more than one hour was significantly higher for restricted antimicrobials with an odds ratio of 1.49 (95% CI; 1.23-1.82), while the odds ratio for a delay of more than two hours was 1.78 (95% CI, 1.39-2.21). Also, for restricted antimicrobials, the percentage of orders delayed for more than one hour was significantly different between daytime and nighttime (when the first dose was exempt from pre-approval) orders: 46.1% versus 38.8% (P<0.001). For unrestricted drugs, delay was uniform irrespective of time of day (36.4% of daytime and 36.6% of nighttime orders were delayed more than one hour). The effect of delay in drug administration on patient outcomes was not evaluated.
Though the approval process aims in part to affect resistance patterns and overall costs, this research highlights the need to minimize the delay in administration and probably skip the approval for the first dose in critically ill patients.
Bottom line: Antibiotic approval processes can delay their administration in hospitalized patients, but the effect of this delay on patient outcomes is not yet known.
Citation: Winters BD, Thiemann DR, Brotman DJ. Impact of a restrictive antimicrobial policy on the process and timing of antimicrobial administration. J Hosp Med. 2010;5(1):E41-45.
Physicians Uphold Tenets of Effective Consultation while Highlighting Some Newer Viewpoints
Clinical question: What key features of a consultation are most desirable for physicians?
Background: With new changes in healthcare delivery, the standardization offered by the electronic health record (EHR) system will undoubtedly be confronted by the heterogeneity of clinical consultations. Determination of the various characteristics considered essential for a consultation can help standardize the processes and improve the quality of communication.
Study design: Opinion surveys with a 16-question, Web-based questionnaire about inpatient consultations.
Setting: Four Minnesota teaching hospitals affiliated with the University of Minnesota.
Synopsis: This study surveyed 651 physicians, mostly from general medicine and pediatrics (30% in-training; 54% were more than five years out of training). The response rate to the survey was 50% (323). Responses were analyzed separately for physicians predominantly requesting consultations (requesters) and those predominantly providing them (consultants).
Regarding the consultation request, the majority of consultants preferred a precise consult question (94%), contact information of the ordering provider (68%), and the urgency of consultation (66%), with telephonic communication for emergent consults (75%). Responses were similar regardless of practice site, specialty, or experience.
Regarding the consultation, more requesters desired verbal communication over written advice alone: Sixty-six percent preferred to have the rationale of the recommendations explained. They also preferred a separate recommendations section (48%) with bulleted suggestions (69%) at the top or bottom of the note (74%). Emphasis was placed on specificity of drug names, dose, and duration of therapy (80%), along with alternative options (76%). Most requesters desired a clear “signoff” note when appropriate, with a follow-up plan (74%) or scheduled appointments (44%).
Bottom line: For consultations, the majority of physicians prefer an explanation of medical decision-making, a crisp recommendation section, and specific directions for follow-up.
Citation: Boulware DR, Dekarske AS, Filice GA. Physician preferences for elements of effective consultations. J Gen Intern Med. 2010;25(1):25-30.
CT Scanning Could Be Related to a Future Risk of Cancer at a Population Level
Clinical question: Does the accelerated use of CT scans increase the future risk for radiation-related cancer?
Background: Computed tomography (CT) has come through as a powerful diagnostic and interventional imaging modality at the cost of higher radiation exposures. The potential cancer risk is minimal at an individual level; however, CT technology is used in more than 70 million scans annually. This volume can translate into a significant number of future cancers in the population.
Study design: Indirect risk modeling based on CT scan frequencies and radiation risk models.
Synopsis: Annual frequencies of CT scans (age- and sex-specific) were extracted from insurance claims. The study included 57 million scans, of which 30% were performed in adults 35 to 54 years old. The majority of scans were in females (60%).
Age-specific cancer risk for each CT scan type was estimated through published radiation risk models and national surveys. The projected number of incident cancers per 10,000 scans was highest for chest or abdominal CT angiography (CTA) and whole-body CT. Incidence was higher for females.
The CT scan frequencies were combined with the cancer risk, and it was estimated that approximately 29,000 (95% UL, 15,000-45,000) future cancers could be related to the exposure from CT scans. Uncertainty limits (UL), an estimation of the total error of measurement, accounted for statistical and subjective uncertainties. The risk was dependent on the radiation dose (chest CTA) and frequency of use (abdomen/pelvis followed by chest and head). The most common cancers were lung, colon, and leukemia.
Two-thirds of the projected cancers were in females and attributable to the higher frequency of scans in women coupled with their dual risk of breast and lung cancer with chest radiation. The results provide potential study targets for risk-reduction efforts.
Bottom line: CTA of the chest, abdomen, or pelvis could be related to risk of future cancers, especially in middle-aged females.
Citation: Berrington de González A, Mahesh M, Kim KP, et al. Projected cancer risks from computed tomographic scans performed in the United States in 2007. Arch Intern Med. 2009;169(22):2071-2077.
Early Resumption of Low-Dose Aspirin after Peptic Ulcer Bleeding Might Be Beneficial
Clinical question: Is it safe to restart aspirin after acute gastrointestinal (GI) bleeding in patients with cardiovascular or cerebrovascular disease?
Background: The increasing cardiovascular burden in the aging population has indirectly increased aspirin-related peptic ulcer bleeding. Proton-pump inhibitors (PPI) have shown promise in reducing recurrent GI bleeding in non-aspirin-related cases. It is unclear if this protective effect applies to patients on aspirin and, if so, if aspirin resumption after endoscopic treatment is safe.
Study design: Parallel, randomized, placebo-controlled, noninferiority trial.
Setting: Single tertiary endoscopy center in Hong Kong.
Synopsis: One hundred fifty-six patients with aspirin-related peptic ulcer bleeding were selected for the study. After successful endoscopic treatment and 72 hours on pantoprazole infusion, the patients were started on oral pantoprazole for the duration of the study (eight weeks). Patients were equally randomized to receive low-dose aspirin (80 mg/d) or placebo. Primary outcome was recurrent bleeding within 30 days. Secondary outcomes included eight-week all-cause mortality, cause-specific mortality, and recurrence of cardiovascular events.
The aspirin group had a 50% higher risk of recurrent bleeding within 30 days compared with placebo (10.3% vs. 5.4%). However, for the secondary endpoints, aspirin had lower all-cause mortality (1.3% vs. 12.9%), which was not related to increased GI bleeding. On the other hand, discontinuation of aspirin and use of PPI in the placebo group did not prevent mortality related to GI complications.
The small numbers restrict interpretation of the mortality rates but offer support to the fact that the cardioprotective effects of aspirin outweigh its potential for GI bleeding. It is to be noted that these results cannot be extrapolated to higher doses of aspirin.
Bottom line: Early resumption of aspirin after successful treatment of peptic ulcer bleeding might increase the risk of rebleeding but potentially decreases overall mortality.
Citation: Sung JJ, Lau JY, Ching JY, et al. Continuation of low-dose aspirin therapy in peptic ulcer bleeding: a randomized trial. Ann Intern Med. 2010;152(1):1-9.
A Substantial Number of Elderly Patients with Pneumonia Have Pulmonary Malignancy
Clinical question: What is the incidence of, and risk factors for, diagnosis of lung cancer after discharge for pneumonia?
Background: Pneumonia-related admissions in elderly individuals have increased by nearly 20% during the past two decades. Based on the risk profile of this age group, many physicians recommend follow-up chest imaging after pneumonia to ensure resolution and exclude underlying malignancy. However, this practice is not backed by substantial evidence.
Study design: Retrospective cohort study from administrative databases of the VA system.
Setting: Veteran Affairs (VA) Health Care System.
Synopsis: More than 40,000 patients (older than 65, 98.1% male) hospitalized for pneumonia were included in the study. These patients had no pneumonia in the preceding year and did not carry a diagnosis of lung cancer. During the follow-up period of up to five years, a significant proportion (9.2%) of these patients were diagnosed with pulmonary malignancy.
Pertinent factors associated with increased risk of diagnosis included active tobacco use, COPD, and prior nonpulmonary malignancy. Interestingly, stroke, diabetes, dementia, and heart failure were associated with a lower risk of diagnosis, likely due to early mortality from these diseases prior to diagnosis of lung cancer.
Mean time to diagnosis was 297 days, with just 27% diagnosed within 30 days. On mortality analysis, 12.9% (n=5270) of the patients died within 30 days and 20.7% (n=8451) within 90 days. Thus, a period of surveillance of 30 to 90 days following pneumonia, especially in patients with risk factors, could be beneficial.
This study was limited due to the shortcomings of database analyses. Also, the predominantly male, elderly, veteran population restricts extrapolation to the general population.
Bottom line: Patients with risk factors for lung cancer might benefit from surveillance chest imaging after hospitalization for pneumonia to rule out an underlying malignancy.
Citation: Mortensen EM, Copeland LA, Pugh MJ, et al. Diagnosis of pulmonary malignancy after hospitalization for pneumonia. Am J Med. 2010:123(1):66-71.
Hospital-Associated Hyponatremia of Any Severity Adversely Impacts Mortality and Financial Metrics
Clinical question: Does hyponatremia during a hospitalization prophesize a worse outcome?
Study design: Retrospective cohort study from 2002-2007.
Setting: Urban academic medical center.
Synopsis: This study included 53,236 adults based on the presence of admission or subsequent hyponatremia (defined as [Na+] <138 mEq/L). The patients were classified as community-acquired (CAH=37.9%), hospital-aggravated (5.7%), or hospital-acquired hyponatremia (HAH=38.2%).
Across all subgroups, all types of hyponatremia were independently associated with worse primary outcomes, including an increase in hospital mortality (CAH 52%, HAH 66%), prolongation of hospital stay, and discharge to a facility. Also, for the same [Na+], HAH had significantly increased mortality compared with CAH. Though the elderly were more prone to develop hyponatremia, patients younger than 65 had worse outcomes.
The severity of hyponatremia prognosticated adverse outcomes. The liberal definition of hyponatremia, as opposed to the current standard of <135 mEq/L, explains the large numbers in prevalence. However, even mild hyponatremia (133 mEq/L to 137) was linked to poor outcomes (adjusted OR 1.34; CI 1.18-1.51).
The study weaknesses include the use of administrative codes to identify comorbidities, less applicability to outpatient setting, and lack of evaluation of outcomes postdischarge. However, the robust numbers do establish inpatient hyponatremia as a marker of worse outcomes.
Bottom line: Inpatient hyponatremia of any severity is a marker of increased mortality and excessive financial burden.
Citation: Wald R, Jaber BL, Price LL, Upadhyay A, Madias NE. Impact of hospital-associated hyponatremia on selected outcomes. Arch Intern Med. 2010;170(3):294-302.
Patients Lack Awareness and Prefer to Be Updated Regarding Their Inpatient Medications
Clinical question: Is patient knowledge of their medications deficient, and does this reflect a lack of desire to be involved in the medication reconciliation process?
Background: Medication errors remain a significant healthcare problem due to their potential to increase morbidity. For medication administration errors, apart from the dispensing pharmacist and the nurses, patients could be the final checkpoint to ensure medication safety. However, their awareness and enthusiasm to participate has not been adequately assessed in the literature.
Study design: A cross-sectional study using individual surveys to assess awareness and attitudes regarding inpatient medications.
Setting: Single tertiary-care academic teaching hospital.
Synopsis: Fifty cognitively intact adult patients were consented for the study. Of these, 54% provided an accurate recollection of their outpatient medications. When they were surveyed regarding inpatient medications, 96% omitted at least one medication, with the average of 6.8 medication omissions. This was noted to correlate with age >65 years. Also, 44% erroneously presumed they were on a medication while they were in the hospital, even though they weren’t.
When attitudes were surveyed, most of the patients would have preferred to get an inpatient medication list (78%) with the goal of improving their satisfaction (81%) and reducing errors (94%). Also, no association was found between patients’ errors of omission and their reported desire to be involved in the medication safety process.
This small study was limited to cognitively intact patients only. Also, the relatively younger age might cause an overestimation of patient interest in participation. However, the results highlight key medication reconciliation issues. Although patient involvement is desirable, a systematic program of educating them about their medications would be required to make their feedback effective and useful.
Bottom line: Healthy patients might be unaware of their exact hospital medications but prefer to be kept in the loop.
Citation: Cumbler E, Wald H, Kutner J. Lack of patient knowledge regarding hospital medications. J Hosp Med. 2010;5(2):83-86.
Monoclonal Antibodies against Clostridium difficile Toxins Prevent Recurrence
Clinical question: Are human monoclonal antibodies against C. difficile toxin A (CDA1) and B (CDB1) effective in preventing recurrence of C. diff infection (CDI)?
Background: Widespread use of antibiotics, coupled with the emergence of the hypervirulent (B1/NAP1/027) strain of C. diff, has altered the epidemiology of CDI. Even with effective treatment regimens, there is an escalation in severity, treatment failures, and recurrences. Antibodies against the C. diff toxins are being evaluated as the next frontier in treatment of CDI.
Study design: Phase 2 randomized, double-blind, placebo-controlled trial.
Setting: Thirty study centers in Canada and the U.S.
Synopsis: Two hundred patients with laboratory documented CDI on standard therapy with either metronidazole or vancomycin were randomized to receive a single IV infusion of combined monoclonal antibodies against CDA1 and CDB1 (n=101) or a normal saline placebo infusion (n=99). Patients were followed for 84 days with daily stool counts and intermittent blood samples for immunogenicity analysis.
The primary endpoint of recurrence of laboratory-proven C. diff diarrhea was significantly lower in the monoclonal antibody group (7% vs. 25% in placebo. 95% CI, 7-29; P <0.001). In a subgroup analysis of the epidemic BI/NAP1/027 strain, this favorable association persisted (8% vs. 32%). Recurrence in the antibody group was seen more in elderly patients hospitalized with a higher severity of underlying disease.
Secondary endpoints relating to the initial episode of CDI including treatment failure, severity of diarrhea, and duration to resolution were not significantly different between the two groups. Fewer accounts of serious adverse events were documented in the antibody group (18 patients vs. 28 patients in placebo, P=0.09), and immunogenicity was not detected in any patient.
Bottom line: Monoclonal antibody infusion against C. diff toxins reduces recurrence of infection, even with a hypervirulent (B1/NAP1/027) strain, without any significant adverse events.
Citation: Lowy I, Molrine DC, Leav BA, et al. Treatment with monoclonal antibodies against Clostridium difficile toxins. N Engl J Med. 2010; 362(3):197-205. TH
PEDIATRIC HM LITERATURE
By Mark Shen, MD
Rectal Colonization with S. aureus Associated with Skin Abscesses
Clinical question: Is rectal colonization with Staphylococcus aureus more strongly associated with staphylococcal skin abscesses than nasal colonization?
Background: Staphylococcal skin and soft tissue infections have dramatically increased in recent years. While increased rates of nasal colonization with S. aureus have also been noted, a strong association with skin infections in children has not been established. The relationship between staphylococcal colonization of other body sites and skin infection is unknown.
Study design: Prospective cohort study.
Setting: Tertiary-care hospital in Buffalo, N.Y.
Synopsis: Sixty children, 0 to 18 years of age, requiring surgical drainage of S. aureus skin abscesses and 90 children undergoing other surgical procedures were enrolled consecutively. Rectal, nasal, and abscess (if applicable) cultures were obtained on all patients. Enrollment ceased when notably different rates of rectal colonization were recorded.
Rectal cultures were significantly more likely to be positive in the abscess group than the control group (47% vs. 1%; P<0.0001), while rates of nasal colonization were similar (27% vs. 21%; P=0.44). Abscess isolates were identical to rectal isolates in 88% of cases and nasal isolates in 75% of cases.
Other findings included a 60% prevalence of methicillin-resistant S. aureus (MRSA) in the abscess group. Fifty-nine of the 60 abscess isolates contained Panton-Valentine leukocidin genes; 57 were pulsed-field type USA300; and all 60 contained the staphylococcal cassette chromosome mec type IVa.
Given this representative sample of community-associated staphylococcal disease, these findings suggest that a focus on nasal carriage of S. aureus might be misguided.
Bottom Line: Rectal colonization with S. aureus better predicts skin abscess isolate than nasal carriage.
Citation: Faden H, Lesse AJ, Trask J, et al. Importance of colonization site in the current epidemic of staphylococcal skin abscesses. Pediatrics. 2010;125(3):e618-e624.
Observation Care
Many conditions once treated during an “inpatient” hospital stay are currently treated during an “observation” stay (OBS). Although the care remains the same, physician billing is different and requires close attention to admission details for effective charge capture.
Let’s take a look at a typical OBS scenario. A 65-year-old female with longstanding diabetes presents to the ED at 10 p.m. with palpitations, lightheadedness, mild disorientation, and elevated blood sugar. The hospitalist admits the patient to observation, treats her for dehydration, and discharges her the next day. Before billing, the hospitalist should consider the following factors.
Physician of Record
The attending of record writes the orders to admit the patient to observation; indicates the reason for the stay; outlines the plan of care; and manages the patient during the stay. The attending reports the initial patient encounter with the most appropriate initial observation-care code, as reflected by the documentation:1
- 99218: Initial observation care, requiring both a detailed or comprehensive history and exam, and straightforward/low-complexity medical decision-making. Usually, the problem(s) is of low severity.
- 99219: Initial observation care, requiring both a comprehensive history and exam, and moderate-complexity medical decision-making. Usually, the problem(s) is of moderate severity.
- 99220: Initial observation care, requiring both a comprehensive history and exam, and high-complexity medical decision-making. Usually, the problem(s) is of high severity.
While other physicians (e.g., specialists) might be involved in the patient’s care, only the attending physician reports codes 99218-99220. Specialists typically are called to an OBS case for their opinion or advice but do not function as the attending of record. Billing for the specialist (consultation) service depends upon the payor.
For a non-Medicare patient who pays for consultation codes, the specialist reports an outpatient consultation code (99241-99245) for the appropriately documented service. Conversely, Medicare no longer recognizes consultation codes, and specialists must report either a new patient visit code (99201-99205) or established patient visit code (99212-99215) for Medicare beneficiaries.
Selection of the new or established patient codes follows the “three-year rule”: A “new patient” has not received any face-to-face services (e.g., visit or procedure) in any location from any physician within the same group and same specialty within the past three years.2 There could be occasion when a hospitalist is not the attending of record but is asked to provide their opinion, and must report one of the “non-OBS” codes.
The attending of record is permitted to report a discharge service as long as this service occurs on a calendar day different from the admission service (as in the listed scenario). The attending documents the face-to-face discharge service and any pertinent clinical details, and reports 99217 (observation-care discharge-day management).
Length of Stay
Observation-care services typically do not exceed 24 hours and two calendar days. Observation care for more than 48 hours without inpatient admission is not considered medically necessary but might be payable after medical review. Should the OBS stay span more than two calendar days (as might be the case with “downgraded” hospitalizations), hospitalists should report established patient visit codes (99212-99215) for the calendar day(s) between the admission service (99218-99220) and the discharge service (99217).3 The physician must provide and document a face-to-face encounter on each date of service for which a claim was submitted.
A more likely occurrence is the admission and discharge from OBS on the same calendar date. The attending of record reports the code that corresponds to the patient’s length of stay (LOS). If the total LOS is less than eight hours, the attending only reports standard OBS codes (99218-99220). The hospitalist does not separately report the OBS discharge service (99217), even though the documentation must reflect the attending discharge order and corresponding discharge plan. If the total duration of the patient’s stay lasts more than eight hours and does not overlap two calendar days, the attending reports the same-day admit/discharge codes:1
- 99234: Observation or inpatient care, same date admission and discharge, requiring both a detailed or comprehensive history and exam, and straightforward or low-complexity medical decision-making. Usually the presenting problem(s) is of low severity.
- 99235: Observation or inpatient care, same date admission and discharge, requiring a comprehensive history and exam, and moderate-complexity medical decision-making. Usually the presenting problem(s) is of moderate severity.
- 99236: Observation or inpatient care, same date admission and discharge, requiring a comprehensive history and exam, and high-complexity medical decision-making. Usually the presenting problem(s) is of high severity.
OBS discharge service (99217) is not separately reported with 99234-99236 because these codes are valued to include the discharge component (e.g., the comprehensive service, 99236 [4.26 wRVU, $211], is equivalent to its components, 99220 [2.99 wRVU, $148] and 99217 [1.28 wRVU, $68]). The attending must document the total duration of the stay, as well as the face-to-face service and the corresponding details of each service component (i.e., both an admission and discharge note).3TH
Carol Pohlig is a billing and coding expert with the University of Pennsylvania Medical Center in Philadelphia. She is also on the faculty of SHM’s inpatient coding course.
References
- Abraham M, Beebe M, Dalton J, Evans D, Glenn R. Current Procedural Terminology Professional Edition. Chicago: American Medical Association Press; 2010:11-16.
- Medicare Claims Processing Manual: Chapter 12, Section 30.6.7A. Centers for Medicare and Medicaid Services website. Available at: www.cms.hhs.gov/manuals/downloads/clm104c12.pdf. Accessed May 11, 2010.
- Medicare Claims Processing Manual: Chapter 12, Section 30.6.8C. Centers for Medicare and Medicaid Services website. Available at: www.cms.hhs.gov/manuals/downloads/clm104c12.pdf. Accessed May 11, 2010.
- Medicare Claims Processing Manual: Chapter 12, Section 30.6.8D. Centers for Medicare and Medicaid Services website. Available at: www.cms.hhs.gov/manuals/downloads/clm104c12.pdf. Accessed May 11, 2010.
- Medicare Claims Processing Manual: Chapter 1, Section 50.3. Centers for Medicare and Medicaid Services website. Available at: www.cms.hhs.gov/manuals/downloads/clm104c01.pdf. Accessed May 12, 2010.
What Is the Most Cost- Effective Evaluation for a First Syncopal Episode?
Case
A 71-year-old woman is admitted after losing consciousness and falling at home. Her history is significant for hypertension, bilateral internal carotid artery stenoses, chronic kidney disease, and diabetes. Resting vital signs are normal. Cardiac, pulmonary, and neurologic exams are unremarkable, as is an electrocardiogram (ECG). She was noted to have a small scalp laceration. Noncontrast CT of the head demonstrates a small occipital subdural bleed thought to be a result of her fall.

What is the most cost-effective evaluation for this patient admitted with suspected first syncopal episode?
Overview
Syncope is defined as sudden, self-terminating loss of consciousness. The final common pathway of all causes of syncope is global cerebral hypoperfusion—specifically, hypoperfusion of the reticular activating system. The differential diagnosis of syncopal loss of consciousness includes neurally mediated (e.g., vasovagal) syncope, orthostatic hypotension, cardiac arrhythmias, structural heart disease, and cerebrovascular disease.
Among young, otherwise healthy people, neurally mediated syncope, which has a relatively benign prognosis, is by far the most common etiology, while in older patients, primary cardiac causes are more common. Nonsyncopal mechanisms, such as seizure and hypoglycemia, should also be considered in the differential diagnosis of transient loss of consciousness (see Table 1, p. 19).1
Syncope is a common problem, accounting for 1% to 2% of ED visits in the U.S.2 The primary objective for evaluation is identification of individuals at increased risk of death due to associated conditions, especially cardiac conditions such as structural heart disease; myocardial ischemia and infarction (MI); Wolff-Parkinson-White, Brugada, or long QT syndromes; and polymorphic ventricular tachycardia.3 True syncope can be associated with other concerning causes, such as aortic stenosis, aortic dissection, and massive pulmonary embolus, as well as arrhythmias from underlying cardiac disease.4
Review of the Data
History: A detailed history and physical examination reveals the cause in 50% of syncopal episodes. Key factors include the account of third-party observers, although it is important to note that tonic-clonic movements can be associated with the global cerebral hypoperfusion of syncope as well as with seizure.4 History of dyspnea, chest pain, or palpitations argue for a primary cardiac or pulmonary cause.
Among patients who endorse a history of palpitations, the sensation of rapid and regular pulsations in the neck points very strongly toward an AV-nodal re-entrant tachycardia, because the carotid pulse and cannon A wave arrive simultaneously in the neck.5 Postictal confusion and focal neurologic exam findings suggest a neurologic rather than syncopal cause, although there are exceptions, and the relationship between seizure and impaired myocardial perfusion is complex.
One factor shown to be significantly associated with a cardiac cause for episodic syncope is family history of sudden cardiac death.4
Physical exam: A thorough general and neurologic exam is critical in evaluation of a first syncopal episode. Supine and standing blood pressure and heart rate should be measured, waiting at least one minute (and by some protocols up to three minutes) after the patient stands up to record standing vitals. Measurement of sitting vitals is not necessary. Neither postural hypotension nor tachycardia are sensitive for hypovolemia in normal volunteers, but a 30-point increase in heart rate is more than 99% specific; a 20-point drop in systolic blood pressure (SBP) is less so.5 A difference of more than 20 mmHg between systolic arm pressures in an individual with chest pain suggests aortic dissection.
Other findings useful in diagnosis of syncope include signs of aortic stenosis, pulmonary hypertension, and myxoma. Absent aortic component of S2, a late-peaking or prolonged murmur, sustained apical impulse, and delayed carotid upstroke (“pulsus tardus”) strongly support the presence of severe aortic stenosis. Absence of a palpable pulmonic component of S2 argues strongly against significant pulmonary hypertension.
There are few physical exam findings reliably seen in pulmonary embolism, but the presence of tachycardia is reliably seen about 80% of the time.4 Although atrial myxoma is associated with a characteristic “tumor plop” heard in early diastole, the finding is not common.5
Diagnostic studies: In a recent observational study of more than 2,000 adults older than 65 hospitalized after a syncopal episode, cardiac enzymes, electroencephalography, CT scan of the head, and carotid ultrasonography determined the etiology of syncope in less than 1% of cases. Inpatient monitoring on telemetry was helpful about 5% of the time. On the other hand, postural vital signs contributed to the diagnosis more than 20% of the time, at a fraction of the cost of these other diagnostics (see Table 2, above).6
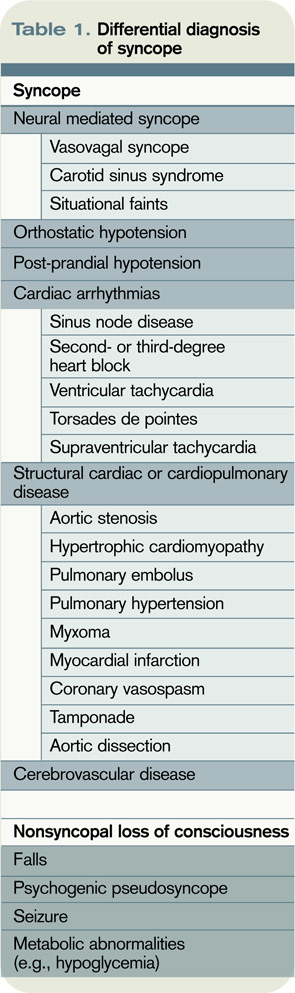
The role of transthoracic echocardiogram (echo) is more controversial. It does seem clear, however, that echo is more likely to be diagnostic in adults older than 60, in the presence of a heart murmur on physical exam or with an abnormal ECG.7 Although it demonstrated an arrhythmia that determined the etiology of syncope in only 3% of cases in this study, ECG is still routinely recommended; it is relatively inexpensive, risk-free, and can reveal abnormalities, including bundle-branch block, prior MI, and nonsustained ventricular tachycardia, which may be associated with cardiovascular comorbidities.4
Although the diagnostic tests above are of limited utility in uncovering the cause of syncopal episodes, they may be helpful when history or physical examination suggests a specific cause. For example, in individuals presenting with syncope who have lateralizing neurologic signs or symptoms or carotid bruits, carotid ultrasound is an appropriate diagnostic tool. In a retrospective analysis of 140 older adults who underwent carotid ultrasonography as part of a syncope evaluation, carotid lesions were identified in just 2% of subjects.8 These lesions were not thought to have been the primary etiology of syncope but did prompt additional evaluation or intervention.
Among older individuals or individuals with known heart disease, longer-term cardiac monitoring might be appropriate. The method of cardiac monitoring should be guided by the frequency of episodes. For events occurring daily, Holter monitoring is appropriate. For events occurring at least monthly, an event monitor is appropriate.
For less frequent events, the clinician can consider an implantable loop recorder (ILR).3 In a study of 167 individuals without a clear cause of syncope after initial evaluation, diagnosis was achieved in 90% of patients after one year of monitoring by ILR.9
Among individuals in whom the etiology remains unclear, tilt-table testing is often considered. This modality remains controversial and is unlikely to establish a diagnosis in individuals with an otherwise normal evaluation.3 Electrophysiologic testing is of similarly low yield in individuals with otherwise normal evaluation and is generally not recommended, except in individuals with known heart disease, including history of MI, congestive heart failure (CHF), and pre-excitation.10
Diagnostic algorithms: Algorithm-driven diagnostic protocols for evaluation of syncope do exist, but they are generally based on expert consensus opinion rather than large-scale studies. There are evidence-based syncope risk scores under development, but definitive validation is forthcoming. Examination of two such protocols is provided here.
The San Francisco Syncope Rule is among the most well-known algorithms, and predicts adverse outcomes at seven days. The study cohort included 684 patients presenting with syncope to an academic ED. Adverse outcomes, including death, myocardial infarction, arrhythmia, pulmonary embolus, stroke, subarachnoid hemorrhage, ED return, or hospitalization at seven days, were identified. History of CHF, hematocrit less than 30%, ECG abnormality, shortness of breath, and SBP less than 90 mmHg at presentation were associated with increased risk of an adverse outcome. If any of these findings is present, a patient is considered at high risk for adverse outcome at one week.2 The rule is simple to use; however, external validation has been controversial.
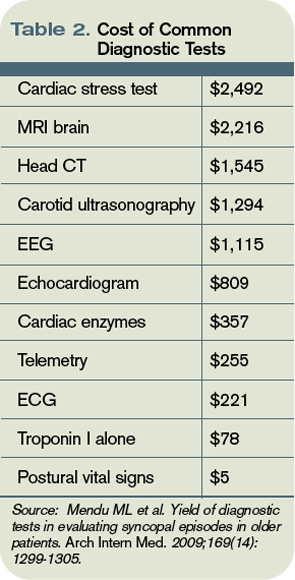
In another risk-prediction study—a large multicenter study of patients older than 60—age greater than 90 years, male sex, history of arrhythmia, SBP greater than 160 mm Hg, ECG abnormality, and elevated troponin I were used to construct a score for risk stratification.11 Specific ECG abnormalities included nonsinus rhythm, heart rate less than 40 beats per minute, evidence of acute or chronic ischemic heart disease, prolonged QRS or QT, left or right ventricular hypertrophy, left-axis deviation, and bundle-branch block. Notably, in this older cohort, CHF (specifically, systolic dysfunction with ejection fraction less than 40%) was not significantly associated with risk of adverse event at 30 days. Study authors stratified participants into low- (score ≤0), intermediate- (score 1-2), and high-risk groups (score >2), with 30-day risk of an adverse event ranging from 2.5% to 20%.
One caveat to the interpretation of these data is the fact that even in the “low risk” group, risk of adverse event was still 2.5%, a figure that many clinicians might consider intolerably high.11 This risk score has not been externally validated.
Back to the Case
Our patient was admitted to the inpatient medicine service. She was monitored overnight on telemetry without evidence of arrhythmia. Collateral history revealed new use of multiple antihypertensives prescribed by outside providers, including both atenolol and propranolol. Her subdural hematoma was managed conservatively and she remained free of neurologic deficits. On discharge, her hypertension regimen was simplified. She was referred for outpatient stress echocardiogram.
Bottom Line
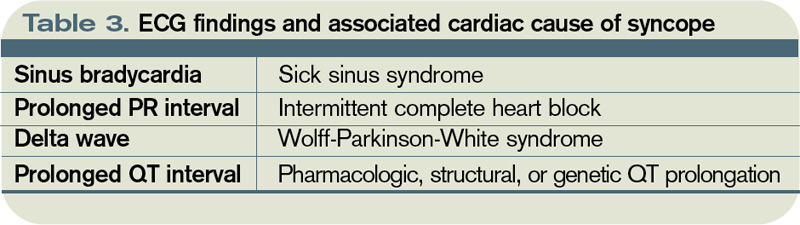
Detailed history and physical exam, including postural vital signs, should form the backbone of the routine evaluation of syncope. An ECG is a critical—and inexpensive—initial diagnostic test, while inpatient telemetry, although a routine component of inpatient evaluation, is expensive and relatively low-yield. Risk prediction rules might ultimately help guide admission decisions and inpatient workup, but definitive external validation of these rules has yet to be accomplished. TH
Dr. Wander is a resident in the Department of Medicine at the University of Washington School of Medicine in Seattle. Dr. Best is an assistant professor of medicine in the Division of General Internal Medicine at the University of Washington School of Medicine.
References
- Jhanjee R, Can I, Benditt DG. Syncope. Dis Mon. 2009;55(9):532-585.
- Quinn JV, Stiell IG, McDermott DA, Sellers KL, Kohn MA, Wells GA. Derivation of the San Francisco Syncope Rule to predict patients with short-term serious outcomes. Ann Emerg Med. 2004;43(2):224-232.
- Strickberger SA, Benson DW, Biaggioni I, et al. AHA/ACCF Scientific Statement on the evaluation of syncope: from the American Heart Association Councils on Clinical Cardiology, Cardiovascular Nursing, Cardiovascular Disease in the Young, and Stroke, and the Quality of Care and Outcomes Research Interdisciplinary Working Group; and the American College of Cardiology Foundation: in collaboration with the Heart Rhythm Society: endorsed by the American Autonomic Society. Circulation. 2006;113(2):316-327.
- Linzer M, Yang EH, Estes NA 3rd, Wang P, Vorperian VR, Kapoor WN. Diagnosing syncope. Part 1: Value of history, physical examination, and electrocardiography. Clinical Efficacy Assessment Project of the American College of Physicians. Ann Intern Med. 1997;126(12):989-996.
- McGee S. Evidence-Based Physical Diagnosis. Saunders; 2001.
- Mendu ML, McAvay G, Lampert R, Stoehr J, Tinetti ME. Yield of diagnostic tests in evaluating syncopal episodes in older patients. Arch Intern Med. 2009;169(14):1299-1305.
- Panther R, Mahmood S, Gal R. Echocardiography in the diagnostic evaluation of syncope. J Am Soc Echocardiogr. 1998;11(3):294-298.
- Schnipper JL, Ackerman RH, Krier JB, Honour M. Diagnostic yield and utility of neurovascular ultrasonography in the evaluation of patients with syncope. Mayo Clin Proc. 2005;80(4):480-488.
- Assar MD, Krahn AD, Klein GJ, Yee R, Skanes AC. Optimal duration of monitoring in patients with unexplained syncope. Am J Cardiol. 2003;92(10):1231-1233.
- Linzer M, Yang EH, Estes NA 3rd, Wang P, Vorperian VR, Kapoor WN. Diagnosing syncope. Part 2: Unexplained syncope. Clinical Efficacy Assessment Project of the American College of Physicians. Ann Intern Med. 1997;127(1):76-86.
- Sun BC, Derose SF, Liang LJ, et al. Predictors of 30-day serious events in older patients with syncope. Ann Emerg Med. 2009;54(6):769-778.e1-5.
Case
A 71-year-old woman is admitted after losing consciousness and falling at home. Her history is significant for hypertension, bilateral internal carotid artery stenoses, chronic kidney disease, and diabetes. Resting vital signs are normal. Cardiac, pulmonary, and neurologic exams are unremarkable, as is an electrocardiogram (ECG). She was noted to have a small scalp laceration. Noncontrast CT of the head demonstrates a small occipital subdural bleed thought to be a result of her fall.
What is the most cost-effective evaluation for this patient admitted with suspected first syncopal episode?
Overview
Syncope is defined as sudden, self-terminating loss of consciousness. The final common pathway of all causes of syncope is global cerebral hypoperfusion—specifically, hypoperfusion of the reticular activating system. The differential diagnosis of syncopal loss of consciousness includes neurally mediated (e.g., vasovagal) syncope, orthostatic hypotension, cardiac arrhythmias, structural heart disease, and cerebrovascular disease.
Among young, otherwise healthy people, neurally mediated syncope, which has a relatively benign prognosis, is by far the most common etiology, while in older patients, primary cardiac causes are more common. Nonsyncopal mechanisms, such as seizure and hypoglycemia, should also be considered in the differential diagnosis of transient loss of consciousness (see Table 1, p. 19).1
Syncope is a common problem, accounting for 1% to 2% of ED visits in the U.S.2 The primary objective for evaluation is identification of individuals at increased risk of death due to associated conditions, especially cardiac conditions such as structural heart disease; myocardial ischemia and infarction (MI); Wolff-Parkinson-White, Brugada, or long QT syndromes; and polymorphic ventricular tachycardia.3 True syncope can be associated with other concerning causes, such as aortic stenosis, aortic dissection, and massive pulmonary embolus, as well as arrhythmias from underlying cardiac disease.4
Review of the Data
History: A detailed history and physical examination reveals the cause in 50% of syncopal episodes. Key factors include the account of third-party observers, although it is important to note that tonic-clonic movements can be associated with the global cerebral hypoperfusion of syncope as well as with seizure.4 History of dyspnea, chest pain, or palpitations argue for a primary cardiac or pulmonary cause.
Among patients who endorse a history of palpitations, the sensation of rapid and regular pulsations in the neck points very strongly toward an AV-nodal re-entrant tachycardia, because the carotid pulse and cannon A wave arrive simultaneously in the neck.5 Postictal confusion and focal neurologic exam findings suggest a neurologic rather than syncopal cause, although there are exceptions, and the relationship between seizure and impaired myocardial perfusion is complex.
One factor shown to be significantly associated with a cardiac cause for episodic syncope is family history of sudden cardiac death.4
Physical exam: A thorough general and neurologic exam is critical in evaluation of a first syncopal episode. Supine and standing blood pressure and heart rate should be measured, waiting at least one minute (and by some protocols up to three minutes) after the patient stands up to record standing vitals. Measurement of sitting vitals is not necessary. Neither postural hypotension nor tachycardia are sensitive for hypovolemia in normal volunteers, but a 30-point increase in heart rate is more than 99% specific; a 20-point drop in systolic blood pressure (SBP) is less so.5 A difference of more than 20 mmHg between systolic arm pressures in an individual with chest pain suggests aortic dissection.
Other findings useful in diagnosis of syncope include signs of aortic stenosis, pulmonary hypertension, and myxoma. Absent aortic component of S2, a late-peaking or prolonged murmur, sustained apical impulse, and delayed carotid upstroke (“pulsus tardus”) strongly support the presence of severe aortic stenosis. Absence of a palpable pulmonic component of S2 argues strongly against significant pulmonary hypertension.
There are few physical exam findings reliably seen in pulmonary embolism, but the presence of tachycardia is reliably seen about 80% of the time.4 Although atrial myxoma is associated with a characteristic “tumor plop” heard in early diastole, the finding is not common.5
Diagnostic studies: In a recent observational study of more than 2,000 adults older than 65 hospitalized after a syncopal episode, cardiac enzymes, electroencephalography, CT scan of the head, and carotid ultrasonography determined the etiology of syncope in less than 1% of cases. Inpatient monitoring on telemetry was helpful about 5% of the time. On the other hand, postural vital signs contributed to the diagnosis more than 20% of the time, at a fraction of the cost of these other diagnostics (see Table 2, above).6
The role of transthoracic echocardiogram (echo) is more controversial. It does seem clear, however, that echo is more likely to be diagnostic in adults older than 60, in the presence of a heart murmur on physical exam or with an abnormal ECG.7 Although it demonstrated an arrhythmia that determined the etiology of syncope in only 3% of cases in this study, ECG is still routinely recommended; it is relatively inexpensive, risk-free, and can reveal abnormalities, including bundle-branch block, prior MI, and nonsustained ventricular tachycardia, which may be associated with cardiovascular comorbidities.4
Although the diagnostic tests above are of limited utility in uncovering the cause of syncopal episodes, they may be helpful when history or physical examination suggests a specific cause. For example, in individuals presenting with syncope who have lateralizing neurologic signs or symptoms or carotid bruits, carotid ultrasound is an appropriate diagnostic tool. In a retrospective analysis of 140 older adults who underwent carotid ultrasonography as part of a syncope evaluation, carotid lesions were identified in just 2% of subjects.8 These lesions were not thought to have been the primary etiology of syncope but did prompt additional evaluation or intervention.
Among older individuals or individuals with known heart disease, longer-term cardiac monitoring might be appropriate. The method of cardiac monitoring should be guided by the frequency of episodes. For events occurring daily, Holter monitoring is appropriate. For events occurring at least monthly, an event monitor is appropriate.
For less frequent events, the clinician can consider an implantable loop recorder (ILR).3 In a study of 167 individuals without a clear cause of syncope after initial evaluation, diagnosis was achieved in 90% of patients after one year of monitoring by ILR.9
Among individuals in whom the etiology remains unclear, tilt-table testing is often considered. This modality remains controversial and is unlikely to establish a diagnosis in individuals with an otherwise normal evaluation.3 Electrophysiologic testing is of similarly low yield in individuals with otherwise normal evaluation and is generally not recommended, except in individuals with known heart disease, including history of MI, congestive heart failure (CHF), and pre-excitation.10
Diagnostic algorithms: Algorithm-driven diagnostic protocols for evaluation of syncope do exist, but they are generally based on expert consensus opinion rather than large-scale studies. There are evidence-based syncope risk scores under development, but definitive validation is forthcoming. Examination of two such protocols is provided here.
The San Francisco Syncope Rule is among the most well-known algorithms, and predicts adverse outcomes at seven days. The study cohort included 684 patients presenting with syncope to an academic ED. Adverse outcomes, including death, myocardial infarction, arrhythmia, pulmonary embolus, stroke, subarachnoid hemorrhage, ED return, or hospitalization at seven days, were identified. History of CHF, hematocrit less than 30%, ECG abnormality, shortness of breath, and SBP less than 90 mmHg at presentation were associated with increased risk of an adverse outcome. If any of these findings is present, a patient is considered at high risk for adverse outcome at one week.2 The rule is simple to use; however, external validation has been controversial.
In another risk-prediction study—a large multicenter study of patients older than 60—age greater than 90 years, male sex, history of arrhythmia, SBP greater than 160 mm Hg, ECG abnormality, and elevated troponin I were used to construct a score for risk stratification.11 Specific ECG abnormalities included nonsinus rhythm, heart rate less than 40 beats per minute, evidence of acute or chronic ischemic heart disease, prolonged QRS or QT, left or right ventricular hypertrophy, left-axis deviation, and bundle-branch block. Notably, in this older cohort, CHF (specifically, systolic dysfunction with ejection fraction less than 40%) was not significantly associated with risk of adverse event at 30 days. Study authors stratified participants into low- (score ≤0), intermediate- (score 1-2), and high-risk groups (score >2), with 30-day risk of an adverse event ranging from 2.5% to 20%.
One caveat to the interpretation of these data is the fact that even in the “low risk” group, risk of adverse event was still 2.5%, a figure that many clinicians might consider intolerably high.11 This risk score has not been externally validated.
Back to the Case
Our patient was admitted to the inpatient medicine service. She was monitored overnight on telemetry without evidence of arrhythmia. Collateral history revealed new use of multiple antihypertensives prescribed by outside providers, including both atenolol and propranolol. Her subdural hematoma was managed conservatively and she remained free of neurologic deficits. On discharge, her hypertension regimen was simplified. She was referred for outpatient stress echocardiogram.
Bottom Line
Detailed history and physical exam, including postural vital signs, should form the backbone of the routine evaluation of syncope. An ECG is a critical—and inexpensive—initial diagnostic test, while inpatient telemetry, although a routine component of inpatient evaluation, is expensive and relatively low-yield. Risk prediction rules might ultimately help guide admission decisions and inpatient workup, but definitive external validation of these rules has yet to be accomplished. TH
Dr. Wander is a resident in the Department of Medicine at the University of Washington School of Medicine in Seattle. Dr. Best is an assistant professor of medicine in the Division of General Internal Medicine at the University of Washington School of Medicine.
References
- Jhanjee R, Can I, Benditt DG. Syncope. Dis Mon. 2009;55(9):532-585.
- Quinn JV, Stiell IG, McDermott DA, Sellers KL, Kohn MA, Wells GA. Derivation of the San Francisco Syncope Rule to predict patients with short-term serious outcomes. Ann Emerg Med. 2004;43(2):224-232.
- Strickberger SA, Benson DW, Biaggioni I, et al. AHA/ACCF Scientific Statement on the evaluation of syncope: from the American Heart Association Councils on Clinical Cardiology, Cardiovascular Nursing, Cardiovascular Disease in the Young, and Stroke, and the Quality of Care and Outcomes Research Interdisciplinary Working Group; and the American College of Cardiology Foundation: in collaboration with the Heart Rhythm Society: endorsed by the American Autonomic Society. Circulation. 2006;113(2):316-327.
- Linzer M, Yang EH, Estes NA 3rd, Wang P, Vorperian VR, Kapoor WN. Diagnosing syncope. Part 1: Value of history, physical examination, and electrocardiography. Clinical Efficacy Assessment Project of the American College of Physicians. Ann Intern Med. 1997;126(12):989-996.
- McGee S. Evidence-Based Physical Diagnosis. Saunders; 2001.
- Mendu ML, McAvay G, Lampert R, Stoehr J, Tinetti ME. Yield of diagnostic tests in evaluating syncopal episodes in older patients. Arch Intern Med. 2009;169(14):1299-1305.
- Panther R, Mahmood S, Gal R. Echocardiography in the diagnostic evaluation of syncope. J Am Soc Echocardiogr. 1998;11(3):294-298.
- Schnipper JL, Ackerman RH, Krier JB, Honour M. Diagnostic yield and utility of neurovascular ultrasonography in the evaluation of patients with syncope. Mayo Clin Proc. 2005;80(4):480-488.
- Assar MD, Krahn AD, Klein GJ, Yee R, Skanes AC. Optimal duration of monitoring in patients with unexplained syncope. Am J Cardiol. 2003;92(10):1231-1233.
- Linzer M, Yang EH, Estes NA 3rd, Wang P, Vorperian VR, Kapoor WN. Diagnosing syncope. Part 2: Unexplained syncope. Clinical Efficacy Assessment Project of the American College of Physicians. Ann Intern Med. 1997;127(1):76-86.
- Sun BC, Derose SF, Liang LJ, et al. Predictors of 30-day serious events in older patients with syncope. Ann Emerg Med. 2009;54(6):769-778.e1-5.