User login
Improving Heart Failure Treatment
Heart failure (HF) carries a high rate of morbidity and mortality.1 In the past decades, the incidence of HF and HF‐related hospital admissions has risen continuously, posing a formidable healthcare and economic burden.24 Extensive evidence has shown that treatment of angiotensin converting enzyme inhibitors (ACEi) and angiotensin receptor blockers (ARBs) reduces morbidity and mortality and improves quality of life in patients with HF and left ventricular systolic dysfunction (LVSD).57 Consequently, ACEi/ARB utilization in HF and LVSD has become one of the practice guidelines8 and a nationally required quality performance measure by The Joint Commission (TJC, formally known as JCAHO) and Centers for Medicare & Medicaid Services (CMS).
Despite the well‐demonstrated salutary effects and clear guidelines, under‐utilization of ACEi/ARB for HF patients has repeatedly been demonstrated.911 There seems to be a lasting quality chasm between the lifesaving therapy and its utilization in our practice.12 This chasm is illustrated by a recent study of 54,453 U.S. patients who were hospitalized for HF and discharged alive, showing that use of proven therapies such as ACEi/ARBs remains far from sufficient (48% for the total HF patients and 52% for HF patients with prior myocardial infarction).11 In large academic hospital centers, the ACEi/ARB utilization for HF patients has averaged between 8388%.13
Strides have been made to bridge the chasm;1419 however, these efforts have been impeded by complex and multifaceted problems. One of these problems is the sheer number of HF patients. In the current economic environment, traditional methods of pouring in more resources are unsustainable. Yet, the majority of quality improvement methods tried thus far involve increasing manpower, intensifying the delivery of staff and patient education, applying multiprong intervening systems, and prolonging the duration of the patients' hospital stay.1422
Although most of these measures achieve their intended goals, ongoing cost is required and the sustainability remains doubtful. Health information technology (IT) is emerging as a promising tool for improving care quality and containing cost.23 The electronic medical record (EMR) system at Mayo Clinic Rochester is built upon an IT patient record platform of Last Word (formerly a product of IDX, now General Electric, Fairfield, Connecticut) and has the capability of receiving vast input from databases in each department in our institution. In recent years, Mayo Clinic also has developed an IT hospital rule (algorithm)‐based system (HRBS) for comprehensive, multidisciplinary patient monitoring and cost containment (detailed in ref. 24). Pharmaceutical Care (P‐Care) is 1 of the 6 subsystems under HRBS. P‐care has been used primarily by inpatient pharmacists to detect situations where there is a high probability of suboptimal medication prescribing and where intervention by a pharmacist may be beneficial.
The primary goal of this project was to improve ACEi/ARB adherence for inpatients in a manner that would be sustainable. We intended to incorporate the existing features of our EMR as well as modify and utilize the P‐Care system to create a model that would improve ACEi/ARB adherence and work well with work‐flows of inpatient pharmacists and patient‐care teams.
Methods
Setting
Saint Mary's Hospital, a 920‐bed facility of the Mayo Clinic Rochester, has 30 individual care units, 1000 staff physicians and 1900 trainees. Approximately 900 patients with a primary admission diagnosis of HF and LVSD are discharged annually. This study was approved by the Institutional Review Board.
Planning the Intervention
An ACEi/ARB team, formed in 2005, was a subgroup of the institutional HF Quality Improvement Team, comprised of quality specialists, a computer programmer from the IT department, a pharmacist, nurses, hospitalists and specialists from cardiology and nephrology.
The group identified three root causes for ACEi/ARB non‐adherence: (1) Unawareness of practice guidelines; (2) information overload and distraction, especially for patients with multiple co‐morbidities; eg, a low left ventricular ejection fraction (LVEF) finding might be buried among stacks of information and go unrecognized and, (3) under‐documentation of legitimate ACEi/ARB intolerance in the designated area (Allergy‐Intolerance Module) within the institutional EMR system.
Implementation of the Intervention
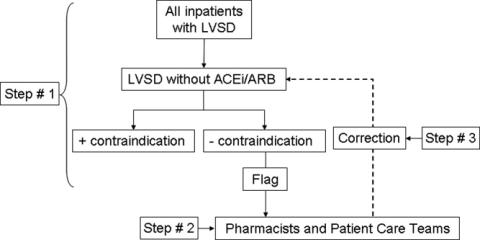
The intervention Model included three components: a computer‐based daily screening program developed from the existing P‐Care rule,24 inpatient pharmacists, and inpatient care teams. The interventional algorithm is illustrated in Figure 1. The computer‐based screening program that retrieved patients' LVEF data from EMR was up and running by the first quarter of 2006. A major attribute of the existing IT systems at Mayo Clinic has been that, however enormous, the data (input daily from diverse sources within the institution) are entered in a discrete, searchable and extractable format, which is critical for the data utilization. In the second quarter of 2006, we began an intense Plan‐Do‐Study‐Act (PDSA) cycle through multidisciplinary teamwork. To monitor e‐flagging efficiency, we randomly selected five units, manually monitored the number of patients who failed ACEi/ARB adherence and compared the number with that generated by the screening program. We found that the capturing rate was 100%.

Several problems were encountered with the model's operating process during implementation. The flagged list generated by the screening program was examined first by a pharmacist who then prepared a written note, indicating the deficiency along with a concise version of the guidelines. This note was placed in the patients' chart. Alternatively, the pharmacist might notify the patient‐care team by phone or in person during the teams' on their rounds.
However, notes were sometimes lost or overlooked, and verbal communications were inconsistent. In addition, the pharmacists were sometimes unsure whether, under certain clinical conditions (eg, serum creatinine elevation amidst diuresis), a HF patient should receive ACEis/ARBs.
Occasionally, care teams objected to the calls and viewed visits by pharmacists as interruption of their work flow resulting in awkward, and sometimes ineffective communications. Thus, the model seemed to have generated sizable extra work for the pharmacists and there was a notable time‐lag between the generation of the flag‐list and the successful delivery of the message.
To solve these problems, with the advantage of a programmer on the team, we created an electronic message (e‐message) delivery function within our EMR. When a patient‐care physician accesses the patient's information in EMR, a prompt indicating e‐message would appear. This modification allowed pharmacists' verification and an e‐message to be semiautomatically delivered to the patient‐care team. If the problem (non‐compliance to ACEi/ARB guidelines) was not addressed within 24 hours after the e‐message delivery, a pharmacist would then contact the team by phone or face‐to‐face. Additionally, an inpatient nephrologist was made available to answer any clinical questions that the pharmacists might have. We found that with these modifications the vast majority of the flags were corrected within 24 hours and pharmacists' workload was markedly reduced. After several initial communications between pharmacists and the nephrologist, the input by the nephrologist became minimal as pharmacists grew more accustomed to the majority of case scenarios.
Through such PDSA cycles, the operating process improved progressively. By March 2007, the implementation was complete and the model ran smoothly to the satisfaction of the team and other stakeholders.
Methods of Evaluation
To determine the effectiveness of the model, we examined the number of patients whose ACEi/ARB status changed as a result of the model and the overall ACEi/ARB guideline adherence at the time of hospital discharge in HF/LVSD patients with a primary admission diagnosis of HF. These guideline adherence data in this patient population, reported periodically to TJC and CMS as part of inpatient quality measurement, were collected by methods in accordance with the Population and Sampling Specifications set forth by CMS (
Statistical Analysis
We compared the institutional data from before, during, and after the implementation of the model. We closely tracked the timing of the intervention and the corresponding outcomes. Pearson's chi‐square test was employed for comparison among three groups, and Fisher's Exact test for pair‐wise comparisons. All data are expressed as mean frequency (in %) and a 2‐tailed P value of 0.05 was considered statistically significant.
Results
Rate of the Screening Program Utilization
Daily census was 650 to 700 patients; eligible patients with LVSD (but lacking ACEi/ARB therapy) ranged between 200 to 300 per month. They were captured by the screening program and 95% of them were brought into ACEi/ARB compliance directly related to the function of the model. Approximately 5% were not reconciled due to hospital discharge before the model was inacted.
Percentage ACEi/ARB Adherence With the Intervention
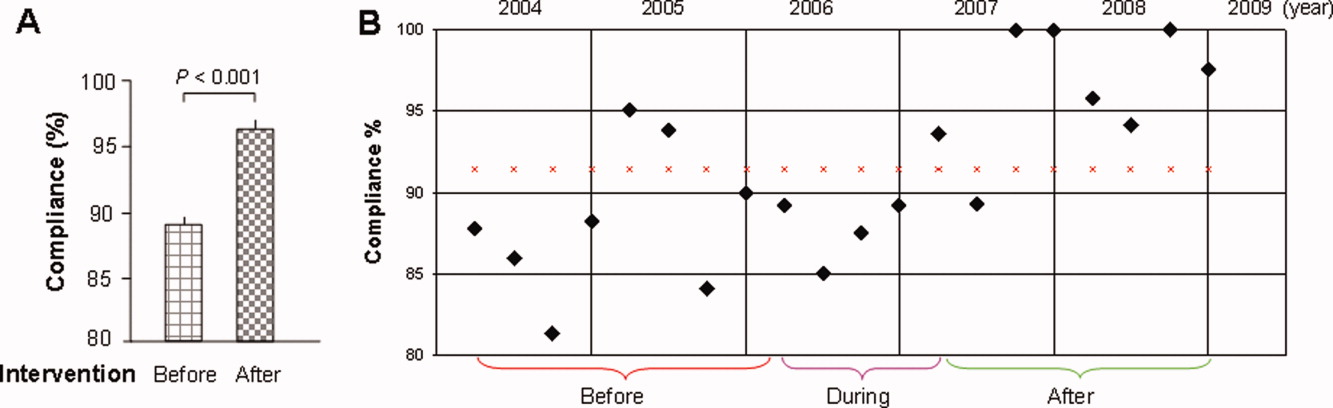
The mean percentages of ACEi/ARB adherence in the periods before, during, and after the model implantation were 88.4%, 88.8%, and 97.6% respectively. Significant differences were detected between the three periods by Pearson's chi‐square test (P 0.001). Fisher's Exact Test was used for comparing the periods before and after (P 0.001, Figure 2A) and during and after (P 0.001). Figure 2B shows the quarterly sensors of the adherence rate. Notably, after the implementation, the compliance rate remained high and the variations lessened.
Discussion
The results of this study show that the computer‐based quality improvement tool was associated with improved adherence to the ACEi/ARB guidelines for patients with LVSD/HF. This was accomplished without the need for additional, ongoing expenses in a system fitting our EMR capabilities and work flow.
Specific studies on the improvement of ACEi/ARB utilization for LVSD patients are limited.16, 21 One randomized controlled trial evaluated an inpatient HF intervention without a post‐discharge care plan.21 The intervention included inpatient guidelines for the use of ACEi, echocardiogram, daily weights and a consultative service provided by a nurse care manager and cardiologist. The consultative service included patient education, treatment recommendations, and discharge planning. This intervention significantly improved ACEi use at discharge.
Another randomized controlled study of 98 patients showed that compared to routine care, those who received multidisciplinary care (inpatient and outpatient education and intense telephone and clinic follow‐up), ACEi usage was maximized and re‐hospitalization and HFrelated death was significantly reduced at three months.16 Although effective, such interventions require substantial ongoing cost and sustainability is again called into question. Our initiative is unique in that incorporating a computer‐based semiautomatic system into the care‐delivery process has enhanced care quality without incurring ongoing extra cost (we have neither hired extra personnel nor created a heavier work burden for pharmacists and patientcare teams, as the model has been diffused into their daily routine) thus maximizing its longterm sustainability.
Notwithstanding the positive aspects, this study has several limitations. First, it is not a randomized, controlled trial, and unidentified external factors may have had some influence. However, in the examination of all potential external effects, we could not identify any factor that would have the capacity to substantially and consistently influence the results. Second, prepost study design is less ideal than randomized, controlled trials on the study design hierarchy. However, given the unsatisfactory adherence rate, anticipated positive effects with the model, and the pressing need for improving the adherence, a randomized trial was not an option at that juncture. Third, we could not precisely compare the difference in the awareness of ACEi/ARB guidelines among different classes of trainees during the study period. We did have a one‐time online, non‐mandatory education program for all providers. However, new trainees rotated in and‐ out on a monthly basis. This factor is unlikely to have caused a sustained change. Fourth, we did not have the outcome data for patients in whom HF was their secondary admission diagnosis. These patients were equally flagged by the model, and their ACEi/ARB status, when flagged, was obliged to be corrected. We suspect that these patients most likely benefited even more by the model because they were likely in a compensated state of HF, and the care‐teams tended to be more focused on their primary issue, leaving room for overlooking LVSD‐related issues.
Finally, we report the outcomes in the first 21 months after the full implementation of the model. We still need to monitor the long‐term outcome, although a reasonable length of time has elapsed. There has been no sign of decay in its effectiveness and we have no compelling reason to anticipate a significant regression.
Under ideal conditions, the outcome should consistently be 100% based on the design. In reality the adherence had been oscillating with an average of 97%. We noted two main scenarios that had contributed to this outcome. First, some LVSD/HF patients were taken off ACEi/ARB temporarily before discharge because of worsening pre‐renal azotemia with diuresis. They were discharged off ACEi/ARB with a plan to resume it. These patients would not have been labeled as ACEi/ARB‐intolerant but were classified as those without meeting the guidelines. Second, some patients had their echocardiogram on the same day or within 24 hours of discharge. A fraction of them had LVEF 40%, but ACEi/ARB had not been initiated before discharge.
The rising volume of patients with increasing age and co‐morbidities, combined with constraints in healthcare resources, compels us to explore high‐efficiency care‐delivery models. Although computerized technology is well understood and readily available, the challenge we face is how to fully utilize the technology. A recent study shows that the improvement of IT infrastructure and research on implementation are interdependent and both can be translated to better patient care.25 Our experience serves as another example demonstrating that, when carefully conceived and properly executed, computer‐based care‐delivery prompts can be highly efficient and effective, suitable for large hospital settings with a heavy patient load like ours.
Moreover, because of the availability of basic IT platforms, similar algorithm‐based model systems can foreseeably be adopted by hospitals of comparable size and structure and also be applied to other care‐delivery settings including out‐patient clinics, chronic dialysis units and various long‐term care facilities.
Developing efficient, IT‐based quality improvement tools that facilitate the application of evidence‐based care and improve quality without significant additional resources is imperative in today's economic climate. Strategies such as our e‐messaging intervention with ACEi and ARB demonstrate sustainable improvement, can be applied to other conditions, and should be vigorously pursued.
Acknowledgements
The authors are grateful for the input provided by Mr. Jeff Leland and for the statistical analysis by Dr. Wen‐zhi Zhan and Mr. Stephen S. Cha.
- ,,, et al.Heart disease and stroke statistics–2009 update: a report from the American Heart Association Statistics Committee and Stroke Statistics Subcommittee.Circulation.2009;119(3):480–486.
- ,,,,,.Confirmation of a heart failure epidemic: findings from the Resource Utilization Among Congestive Heart Failure (REACH) study.J Am Coll Cardiol.2002;39(1):60–69.
- Hospital Discharges for Cardiovascular Diseases.CDC/NCHS ‐ Centers for Disease Control and Prevention/National Center for Health Statistics and the American Heart Association;2006.
- ,,,.Economic burden of heart failure: a summary of recent literature.Heart Lung.2004;33(6):362–371.
- SOLVD.Effect of enalapril on survival in patients with reduced left ventricular ejection fractions and congestive heart failure. The SOLVD Investigators.N Engl J Med.1991;325(5):293–302.
- SOLVD.Effect of enalapril on mortality and the development of heart failure in asymptomatic patients with reduced left ventricular ejection fractions. The SOLVD Investigattors.N Engl J Med.1992;327(10):685–691.
- ,,,,,.Metaanalysis: angiotensin‐receptor blockers in chronic heart failure and high‐risk acute myocardial infarction.Ann Intern Med.2004;141(9):693–704.
- ,,, et al.ACC/AHA guidelines for the evaluation and management of chronic heart failure in the adult: executive summary.J Heart Lung Transplant.2002;21(2):189–203.
- ,,, et al.Predictors of delivery of hospital‐based heart failure patient education: a report from OPTIMIZE‐HF.J Card Fail.2007;13(3):189–198.
- ,,, et al.Angiotensin‐converting enzyme inhibitors and angiotensin receptor blockers in patients with congestive heart failure and chronic kidney disease.Am Heart J.2007;153(6):1064–1073.
- ,,.Long‐term trends of angiotensin‐converting enzyme inhibitor and angiotensin‐receptor blocker use after heart failure hospitalization in community‐dwelling seniors.Int J Cardiol.2008;125(2):172–177.
- Committee on Quality of Health Care in America, Institute of Medicine. Crossing the Quality Chasm: A New Health System for the 21st Century. Washington, DC: National Academies Press; 2001.
- .Quality and safety performance in teaching hospitals.Am Surg.2006;72(11):1051–1054. discussion1061–1059,1133–1048.
- ,,, et al.Randomised controlled trial of specialist nurse intervention in heart failure.BMJ.2001;323(7315):715–718.
- ,,, et al.Readmission after hospitalization for congestive heart failure among Medicare beneficiaries.Arch Intern Med.1997;157(1):99–104.
- ,,, et al.Heart failure management: multidisciplinary care has intrinsic benefit above the optimization of medical care.J Card Fail.2002;8(3):142–148.
- ,,, et al.Comprehensive discharge planning for the hospitalized elderly. A randomized clinical trial.Ann Intern Med.1994;120(12):999–1006.
- ,,, et al.A multidisciplinary intervention to prevent the readmission of elderly patients with congestive heart failure.N Engl J Med.1995;333(18):1190–1195.
- ,,, et al.A comprehensive management system for heart failure improves clinical outcomes and reduces medical resource utilization.Am J Cardiol.1997;79(1):58–63.
- ,.Multidisciplinary team for enhancing care for patients with acute myocardial infarction or heart failure.Am J Health Syst Pharm.2007;64(12):1274–1278.
- ,,, et al.Impact of a guideline‐based disease management team on outcomes of hospitalized patients with congestive heart failure.Arch Intern Med.2001;161(2):177–182.
- ,,, et al.Predischarge initiation of carvedilol in patients hospitalized for decompensated heart failure: results of the Initiation Management Predischarge: Process for Assessment of Carvedilol Therapy in Heart Failure (IMPACT‐HF) trial.J Am Coll Cardiol.2004;43(9):1534–1541.
- ,,, et al.Systematic review: impact of health information technology on quality, efficiency, and costs of medical care.Ann Intern Med.2006;144(10):742–752.
- ,,, et al.Hospital rules‐based system: the next generation of medical informatics for patient safety.Am J Health Syst Pharm.2005;62(5):499–505.
- ,,, et al.Use of health information technology to advance evidence‐based care: lessons from the VA QUERI Program.J Gen Intern Med.2010;25Suppl 1:44–49.
Heart failure (HF) carries a high rate of morbidity and mortality.1 In the past decades, the incidence of HF and HF‐related hospital admissions has risen continuously, posing a formidable healthcare and economic burden.24 Extensive evidence has shown that treatment of angiotensin converting enzyme inhibitors (ACEi) and angiotensin receptor blockers (ARBs) reduces morbidity and mortality and improves quality of life in patients with HF and left ventricular systolic dysfunction (LVSD).57 Consequently, ACEi/ARB utilization in HF and LVSD has become one of the practice guidelines8 and a nationally required quality performance measure by The Joint Commission (TJC, formally known as JCAHO) and Centers for Medicare & Medicaid Services (CMS).
Despite the well‐demonstrated salutary effects and clear guidelines, under‐utilization of ACEi/ARB for HF patients has repeatedly been demonstrated.911 There seems to be a lasting quality chasm between the lifesaving therapy and its utilization in our practice.12 This chasm is illustrated by a recent study of 54,453 U.S. patients who were hospitalized for HF and discharged alive, showing that use of proven therapies such as ACEi/ARBs remains far from sufficient (48% for the total HF patients and 52% for HF patients with prior myocardial infarction).11 In large academic hospital centers, the ACEi/ARB utilization for HF patients has averaged between 8388%.13
Strides have been made to bridge the chasm;1419 however, these efforts have been impeded by complex and multifaceted problems. One of these problems is the sheer number of HF patients. In the current economic environment, traditional methods of pouring in more resources are unsustainable. Yet, the majority of quality improvement methods tried thus far involve increasing manpower, intensifying the delivery of staff and patient education, applying multiprong intervening systems, and prolonging the duration of the patients' hospital stay.1422
Although most of these measures achieve their intended goals, ongoing cost is required and the sustainability remains doubtful. Health information technology (IT) is emerging as a promising tool for improving care quality and containing cost.23 The electronic medical record (EMR) system at Mayo Clinic Rochester is built upon an IT patient record platform of Last Word (formerly a product of IDX, now General Electric, Fairfield, Connecticut) and has the capability of receiving vast input from databases in each department in our institution. In recent years, Mayo Clinic also has developed an IT hospital rule (algorithm)‐based system (HRBS) for comprehensive, multidisciplinary patient monitoring and cost containment (detailed in ref. 24). Pharmaceutical Care (P‐Care) is 1 of the 6 subsystems under HRBS. P‐care has been used primarily by inpatient pharmacists to detect situations where there is a high probability of suboptimal medication prescribing and where intervention by a pharmacist may be beneficial.
The primary goal of this project was to improve ACEi/ARB adherence for inpatients in a manner that would be sustainable. We intended to incorporate the existing features of our EMR as well as modify and utilize the P‐Care system to create a model that would improve ACEi/ARB adherence and work well with work‐flows of inpatient pharmacists and patient‐care teams.
Methods
Setting
Saint Mary's Hospital, a 920‐bed facility of the Mayo Clinic Rochester, has 30 individual care units, 1000 staff physicians and 1900 trainees. Approximately 900 patients with a primary admission diagnosis of HF and LVSD are discharged annually. This study was approved by the Institutional Review Board.
Planning the Intervention
An ACEi/ARB team, formed in 2005, was a subgroup of the institutional HF Quality Improvement Team, comprised of quality specialists, a computer programmer from the IT department, a pharmacist, nurses, hospitalists and specialists from cardiology and nephrology.
The group identified three root causes for ACEi/ARB non‐adherence: (1) Unawareness of practice guidelines; (2) information overload and distraction, especially for patients with multiple co‐morbidities; eg, a low left ventricular ejection fraction (LVEF) finding might be buried among stacks of information and go unrecognized and, (3) under‐documentation of legitimate ACEi/ARB intolerance in the designated area (Allergy‐Intolerance Module) within the institutional EMR system.
Implementation of the Intervention
The intervention Model included three components: a computer‐based daily screening program developed from the existing P‐Care rule,24 inpatient pharmacists, and inpatient care teams. The interventional algorithm is illustrated in Figure 1. The computer‐based screening program that retrieved patients' LVEF data from EMR was up and running by the first quarter of 2006. A major attribute of the existing IT systems at Mayo Clinic has been that, however enormous, the data (input daily from diverse sources within the institution) are entered in a discrete, searchable and extractable format, which is critical for the data utilization. In the second quarter of 2006, we began an intense Plan‐Do‐Study‐Act (PDSA) cycle through multidisciplinary teamwork. To monitor e‐flagging efficiency, we randomly selected five units, manually monitored the number of patients who failed ACEi/ARB adherence and compared the number with that generated by the screening program. We found that the capturing rate was 100%.
Several problems were encountered with the model's operating process during implementation. The flagged list generated by the screening program was examined first by a pharmacist who then prepared a written note, indicating the deficiency along with a concise version of the guidelines. This note was placed in the patients' chart. Alternatively, the pharmacist might notify the patient‐care team by phone or in person during the teams' on their rounds.
However, notes were sometimes lost or overlooked, and verbal communications were inconsistent. In addition, the pharmacists were sometimes unsure whether, under certain clinical conditions (eg, serum creatinine elevation amidst diuresis), a HF patient should receive ACEis/ARBs.
Occasionally, care teams objected to the calls and viewed visits by pharmacists as interruption of their work flow resulting in awkward, and sometimes ineffective communications. Thus, the model seemed to have generated sizable extra work for the pharmacists and there was a notable time‐lag between the generation of the flag‐list and the successful delivery of the message.
To solve these problems, with the advantage of a programmer on the team, we created an electronic message (e‐message) delivery function within our EMR. When a patient‐care physician accesses the patient's information in EMR, a prompt indicating e‐message would appear. This modification allowed pharmacists' verification and an e‐message to be semiautomatically delivered to the patient‐care team. If the problem (non‐compliance to ACEi/ARB guidelines) was not addressed within 24 hours after the e‐message delivery, a pharmacist would then contact the team by phone or face‐to‐face. Additionally, an inpatient nephrologist was made available to answer any clinical questions that the pharmacists might have. We found that with these modifications the vast majority of the flags were corrected within 24 hours and pharmacists' workload was markedly reduced. After several initial communications between pharmacists and the nephrologist, the input by the nephrologist became minimal as pharmacists grew more accustomed to the majority of case scenarios.
Through such PDSA cycles, the operating process improved progressively. By March 2007, the implementation was complete and the model ran smoothly to the satisfaction of the team and other stakeholders.
Methods of Evaluation
To determine the effectiveness of the model, we examined the number of patients whose ACEi/ARB status changed as a result of the model and the overall ACEi/ARB guideline adherence at the time of hospital discharge in HF/LVSD patients with a primary admission diagnosis of HF. These guideline adherence data in this patient population, reported periodically to TJC and CMS as part of inpatient quality measurement, were collected by methods in accordance with the Population and Sampling Specifications set forth by CMS (
Statistical Analysis
We compared the institutional data from before, during, and after the implementation of the model. We closely tracked the timing of the intervention and the corresponding outcomes. Pearson's chi‐square test was employed for comparison among three groups, and Fisher's Exact test for pair‐wise comparisons. All data are expressed as mean frequency (in %) and a 2‐tailed P value of 0.05 was considered statistically significant.
Results
Rate of the Screening Program Utilization
Daily census was 650 to 700 patients; eligible patients with LVSD (but lacking ACEi/ARB therapy) ranged between 200 to 300 per month. They were captured by the screening program and 95% of them were brought into ACEi/ARB compliance directly related to the function of the model. Approximately 5% were not reconciled due to hospital discharge before the model was inacted.
Percentage ACEi/ARB Adherence With the Intervention
The mean percentages of ACEi/ARB adherence in the periods before, during, and after the model implantation were 88.4%, 88.8%, and 97.6% respectively. Significant differences were detected between the three periods by Pearson's chi‐square test (P 0.001). Fisher's Exact Test was used for comparing the periods before and after (P 0.001, Figure 2A) and during and after (P 0.001). Figure 2B shows the quarterly sensors of the adherence rate. Notably, after the implementation, the compliance rate remained high and the variations lessened.
Discussion
The results of this study show that the computer‐based quality improvement tool was associated with improved adherence to the ACEi/ARB guidelines for patients with LVSD/HF. This was accomplished without the need for additional, ongoing expenses in a system fitting our EMR capabilities and work flow.
Specific studies on the improvement of ACEi/ARB utilization for LVSD patients are limited.16, 21 One randomized controlled trial evaluated an inpatient HF intervention without a post‐discharge care plan.21 The intervention included inpatient guidelines for the use of ACEi, echocardiogram, daily weights and a consultative service provided by a nurse care manager and cardiologist. The consultative service included patient education, treatment recommendations, and discharge planning. This intervention significantly improved ACEi use at discharge.
Another randomized controlled study of 98 patients showed that compared to routine care, those who received multidisciplinary care (inpatient and outpatient education and intense telephone and clinic follow‐up), ACEi usage was maximized and re‐hospitalization and HFrelated death was significantly reduced at three months.16 Although effective, such interventions require substantial ongoing cost and sustainability is again called into question. Our initiative is unique in that incorporating a computer‐based semiautomatic system into the care‐delivery process has enhanced care quality without incurring ongoing extra cost (we have neither hired extra personnel nor created a heavier work burden for pharmacists and patientcare teams, as the model has been diffused into their daily routine) thus maximizing its longterm sustainability.
Notwithstanding the positive aspects, this study has several limitations. First, it is not a randomized, controlled trial, and unidentified external factors may have had some influence. However, in the examination of all potential external effects, we could not identify any factor that would have the capacity to substantially and consistently influence the results. Second, prepost study design is less ideal than randomized, controlled trials on the study design hierarchy. However, given the unsatisfactory adherence rate, anticipated positive effects with the model, and the pressing need for improving the adherence, a randomized trial was not an option at that juncture. Third, we could not precisely compare the difference in the awareness of ACEi/ARB guidelines among different classes of trainees during the study period. We did have a one‐time online, non‐mandatory education program for all providers. However, new trainees rotated in and‐ out on a monthly basis. This factor is unlikely to have caused a sustained change. Fourth, we did not have the outcome data for patients in whom HF was their secondary admission diagnosis. These patients were equally flagged by the model, and their ACEi/ARB status, when flagged, was obliged to be corrected. We suspect that these patients most likely benefited even more by the model because they were likely in a compensated state of HF, and the care‐teams tended to be more focused on their primary issue, leaving room for overlooking LVSD‐related issues.
Finally, we report the outcomes in the first 21 months after the full implementation of the model. We still need to monitor the long‐term outcome, although a reasonable length of time has elapsed. There has been no sign of decay in its effectiveness and we have no compelling reason to anticipate a significant regression.
Under ideal conditions, the outcome should consistently be 100% based on the design. In reality the adherence had been oscillating with an average of 97%. We noted two main scenarios that had contributed to this outcome. First, some LVSD/HF patients were taken off ACEi/ARB temporarily before discharge because of worsening pre‐renal azotemia with diuresis. They were discharged off ACEi/ARB with a plan to resume it. These patients would not have been labeled as ACEi/ARB‐intolerant but were classified as those without meeting the guidelines. Second, some patients had their echocardiogram on the same day or within 24 hours of discharge. A fraction of them had LVEF 40%, but ACEi/ARB had not been initiated before discharge.
The rising volume of patients with increasing age and co‐morbidities, combined with constraints in healthcare resources, compels us to explore high‐efficiency care‐delivery models. Although computerized technology is well understood and readily available, the challenge we face is how to fully utilize the technology. A recent study shows that the improvement of IT infrastructure and research on implementation are interdependent and both can be translated to better patient care.25 Our experience serves as another example demonstrating that, when carefully conceived and properly executed, computer‐based care‐delivery prompts can be highly efficient and effective, suitable for large hospital settings with a heavy patient load like ours.
Moreover, because of the availability of basic IT platforms, similar algorithm‐based model systems can foreseeably be adopted by hospitals of comparable size and structure and also be applied to other care‐delivery settings including out‐patient clinics, chronic dialysis units and various long‐term care facilities.
Developing efficient, IT‐based quality improvement tools that facilitate the application of evidence‐based care and improve quality without significant additional resources is imperative in today's economic climate. Strategies such as our e‐messaging intervention with ACEi and ARB demonstrate sustainable improvement, can be applied to other conditions, and should be vigorously pursued.
Acknowledgements
The authors are grateful for the input provided by Mr. Jeff Leland and for the statistical analysis by Dr. Wen‐zhi Zhan and Mr. Stephen S. Cha.
Heart failure (HF) carries a high rate of morbidity and mortality.1 In the past decades, the incidence of HF and HF‐related hospital admissions has risen continuously, posing a formidable healthcare and economic burden.24 Extensive evidence has shown that treatment of angiotensin converting enzyme inhibitors (ACEi) and angiotensin receptor blockers (ARBs) reduces morbidity and mortality and improves quality of life in patients with HF and left ventricular systolic dysfunction (LVSD).57 Consequently, ACEi/ARB utilization in HF and LVSD has become one of the practice guidelines8 and a nationally required quality performance measure by The Joint Commission (TJC, formally known as JCAHO) and Centers for Medicare & Medicaid Services (CMS).
Despite the well‐demonstrated salutary effects and clear guidelines, under‐utilization of ACEi/ARB for HF patients has repeatedly been demonstrated.911 There seems to be a lasting quality chasm between the lifesaving therapy and its utilization in our practice.12 This chasm is illustrated by a recent study of 54,453 U.S. patients who were hospitalized for HF and discharged alive, showing that use of proven therapies such as ACEi/ARBs remains far from sufficient (48% for the total HF patients and 52% for HF patients with prior myocardial infarction).11 In large academic hospital centers, the ACEi/ARB utilization for HF patients has averaged between 8388%.13
Strides have been made to bridge the chasm;1419 however, these efforts have been impeded by complex and multifaceted problems. One of these problems is the sheer number of HF patients. In the current economic environment, traditional methods of pouring in more resources are unsustainable. Yet, the majority of quality improvement methods tried thus far involve increasing manpower, intensifying the delivery of staff and patient education, applying multiprong intervening systems, and prolonging the duration of the patients' hospital stay.1422
Although most of these measures achieve their intended goals, ongoing cost is required and the sustainability remains doubtful. Health information technology (IT) is emerging as a promising tool for improving care quality and containing cost.23 The electronic medical record (EMR) system at Mayo Clinic Rochester is built upon an IT patient record platform of Last Word (formerly a product of IDX, now General Electric, Fairfield, Connecticut) and has the capability of receiving vast input from databases in each department in our institution. In recent years, Mayo Clinic also has developed an IT hospital rule (algorithm)‐based system (HRBS) for comprehensive, multidisciplinary patient monitoring and cost containment (detailed in ref. 24). Pharmaceutical Care (P‐Care) is 1 of the 6 subsystems under HRBS. P‐care has been used primarily by inpatient pharmacists to detect situations where there is a high probability of suboptimal medication prescribing and where intervention by a pharmacist may be beneficial.
The primary goal of this project was to improve ACEi/ARB adherence for inpatients in a manner that would be sustainable. We intended to incorporate the existing features of our EMR as well as modify and utilize the P‐Care system to create a model that would improve ACEi/ARB adherence and work well with work‐flows of inpatient pharmacists and patient‐care teams.
Methods
Setting
Saint Mary's Hospital, a 920‐bed facility of the Mayo Clinic Rochester, has 30 individual care units, 1000 staff physicians and 1900 trainees. Approximately 900 patients with a primary admission diagnosis of HF and LVSD are discharged annually. This study was approved by the Institutional Review Board.
Planning the Intervention
An ACEi/ARB team, formed in 2005, was a subgroup of the institutional HF Quality Improvement Team, comprised of quality specialists, a computer programmer from the IT department, a pharmacist, nurses, hospitalists and specialists from cardiology and nephrology.
The group identified three root causes for ACEi/ARB non‐adherence: (1) Unawareness of practice guidelines; (2) information overload and distraction, especially for patients with multiple co‐morbidities; eg, a low left ventricular ejection fraction (LVEF) finding might be buried among stacks of information and go unrecognized and, (3) under‐documentation of legitimate ACEi/ARB intolerance in the designated area (Allergy‐Intolerance Module) within the institutional EMR system.
Implementation of the Intervention
The intervention Model included three components: a computer‐based daily screening program developed from the existing P‐Care rule,24 inpatient pharmacists, and inpatient care teams. The interventional algorithm is illustrated in Figure 1. The computer‐based screening program that retrieved patients' LVEF data from EMR was up and running by the first quarter of 2006. A major attribute of the existing IT systems at Mayo Clinic has been that, however enormous, the data (input daily from diverse sources within the institution) are entered in a discrete, searchable and extractable format, which is critical for the data utilization. In the second quarter of 2006, we began an intense Plan‐Do‐Study‐Act (PDSA) cycle through multidisciplinary teamwork. To monitor e‐flagging efficiency, we randomly selected five units, manually monitored the number of patients who failed ACEi/ARB adherence and compared the number with that generated by the screening program. We found that the capturing rate was 100%.
Several problems were encountered with the model's operating process during implementation. The flagged list generated by the screening program was examined first by a pharmacist who then prepared a written note, indicating the deficiency along with a concise version of the guidelines. This note was placed in the patients' chart. Alternatively, the pharmacist might notify the patient‐care team by phone or in person during the teams' on their rounds.
However, notes were sometimes lost or overlooked, and verbal communications were inconsistent. In addition, the pharmacists were sometimes unsure whether, under certain clinical conditions (eg, serum creatinine elevation amidst diuresis), a HF patient should receive ACEis/ARBs.
Occasionally, care teams objected to the calls and viewed visits by pharmacists as interruption of their work flow resulting in awkward, and sometimes ineffective communications. Thus, the model seemed to have generated sizable extra work for the pharmacists and there was a notable time‐lag between the generation of the flag‐list and the successful delivery of the message.
To solve these problems, with the advantage of a programmer on the team, we created an electronic message (e‐message) delivery function within our EMR. When a patient‐care physician accesses the patient's information in EMR, a prompt indicating e‐message would appear. This modification allowed pharmacists' verification and an e‐message to be semiautomatically delivered to the patient‐care team. If the problem (non‐compliance to ACEi/ARB guidelines) was not addressed within 24 hours after the e‐message delivery, a pharmacist would then contact the team by phone or face‐to‐face. Additionally, an inpatient nephrologist was made available to answer any clinical questions that the pharmacists might have. We found that with these modifications the vast majority of the flags were corrected within 24 hours and pharmacists' workload was markedly reduced. After several initial communications between pharmacists and the nephrologist, the input by the nephrologist became minimal as pharmacists grew more accustomed to the majority of case scenarios.
Through such PDSA cycles, the operating process improved progressively. By March 2007, the implementation was complete and the model ran smoothly to the satisfaction of the team and other stakeholders.
Methods of Evaluation
To determine the effectiveness of the model, we examined the number of patients whose ACEi/ARB status changed as a result of the model and the overall ACEi/ARB guideline adherence at the time of hospital discharge in HF/LVSD patients with a primary admission diagnosis of HF. These guideline adherence data in this patient population, reported periodically to TJC and CMS as part of inpatient quality measurement, were collected by methods in accordance with the Population and Sampling Specifications set forth by CMS (
Statistical Analysis
We compared the institutional data from before, during, and after the implementation of the model. We closely tracked the timing of the intervention and the corresponding outcomes. Pearson's chi‐square test was employed for comparison among three groups, and Fisher's Exact test for pair‐wise comparisons. All data are expressed as mean frequency (in %) and a 2‐tailed P value of 0.05 was considered statistically significant.
Results
Rate of the Screening Program Utilization
Daily census was 650 to 700 patients; eligible patients with LVSD (but lacking ACEi/ARB therapy) ranged between 200 to 300 per month. They were captured by the screening program and 95% of them were brought into ACEi/ARB compliance directly related to the function of the model. Approximately 5% were not reconciled due to hospital discharge before the model was inacted.
Percentage ACEi/ARB Adherence With the Intervention
The mean percentages of ACEi/ARB adherence in the periods before, during, and after the model implantation were 88.4%, 88.8%, and 97.6% respectively. Significant differences were detected between the three periods by Pearson's chi‐square test (P 0.001). Fisher's Exact Test was used for comparing the periods before and after (P 0.001, Figure 2A) and during and after (P 0.001). Figure 2B shows the quarterly sensors of the adherence rate. Notably, after the implementation, the compliance rate remained high and the variations lessened.
Discussion
The results of this study show that the computer‐based quality improvement tool was associated with improved adherence to the ACEi/ARB guidelines for patients with LVSD/HF. This was accomplished without the need for additional, ongoing expenses in a system fitting our EMR capabilities and work flow.
Specific studies on the improvement of ACEi/ARB utilization for LVSD patients are limited.16, 21 One randomized controlled trial evaluated an inpatient HF intervention without a post‐discharge care plan.21 The intervention included inpatient guidelines for the use of ACEi, echocardiogram, daily weights and a consultative service provided by a nurse care manager and cardiologist. The consultative service included patient education, treatment recommendations, and discharge planning. This intervention significantly improved ACEi use at discharge.
Another randomized controlled study of 98 patients showed that compared to routine care, those who received multidisciplinary care (inpatient and outpatient education and intense telephone and clinic follow‐up), ACEi usage was maximized and re‐hospitalization and HFrelated death was significantly reduced at three months.16 Although effective, such interventions require substantial ongoing cost and sustainability is again called into question. Our initiative is unique in that incorporating a computer‐based semiautomatic system into the care‐delivery process has enhanced care quality without incurring ongoing extra cost (we have neither hired extra personnel nor created a heavier work burden for pharmacists and patientcare teams, as the model has been diffused into their daily routine) thus maximizing its longterm sustainability.
Notwithstanding the positive aspects, this study has several limitations. First, it is not a randomized, controlled trial, and unidentified external factors may have had some influence. However, in the examination of all potential external effects, we could not identify any factor that would have the capacity to substantially and consistently influence the results. Second, prepost study design is less ideal than randomized, controlled trials on the study design hierarchy. However, given the unsatisfactory adherence rate, anticipated positive effects with the model, and the pressing need for improving the adherence, a randomized trial was not an option at that juncture. Third, we could not precisely compare the difference in the awareness of ACEi/ARB guidelines among different classes of trainees during the study period. We did have a one‐time online, non‐mandatory education program for all providers. However, new trainees rotated in and‐ out on a monthly basis. This factor is unlikely to have caused a sustained change. Fourth, we did not have the outcome data for patients in whom HF was their secondary admission diagnosis. These patients were equally flagged by the model, and their ACEi/ARB status, when flagged, was obliged to be corrected. We suspect that these patients most likely benefited even more by the model because they were likely in a compensated state of HF, and the care‐teams tended to be more focused on their primary issue, leaving room for overlooking LVSD‐related issues.
Finally, we report the outcomes in the first 21 months after the full implementation of the model. We still need to monitor the long‐term outcome, although a reasonable length of time has elapsed. There has been no sign of decay in its effectiveness and we have no compelling reason to anticipate a significant regression.
Under ideal conditions, the outcome should consistently be 100% based on the design. In reality the adherence had been oscillating with an average of 97%. We noted two main scenarios that had contributed to this outcome. First, some LVSD/HF patients were taken off ACEi/ARB temporarily before discharge because of worsening pre‐renal azotemia with diuresis. They were discharged off ACEi/ARB with a plan to resume it. These patients would not have been labeled as ACEi/ARB‐intolerant but were classified as those without meeting the guidelines. Second, some patients had their echocardiogram on the same day or within 24 hours of discharge. A fraction of them had LVEF 40%, but ACEi/ARB had not been initiated before discharge.
The rising volume of patients with increasing age and co‐morbidities, combined with constraints in healthcare resources, compels us to explore high‐efficiency care‐delivery models. Although computerized technology is well understood and readily available, the challenge we face is how to fully utilize the technology. A recent study shows that the improvement of IT infrastructure and research on implementation are interdependent and both can be translated to better patient care.25 Our experience serves as another example demonstrating that, when carefully conceived and properly executed, computer‐based care‐delivery prompts can be highly efficient and effective, suitable for large hospital settings with a heavy patient load like ours.
Moreover, because of the availability of basic IT platforms, similar algorithm‐based model systems can foreseeably be adopted by hospitals of comparable size and structure and also be applied to other care‐delivery settings including out‐patient clinics, chronic dialysis units and various long‐term care facilities.
Developing efficient, IT‐based quality improvement tools that facilitate the application of evidence‐based care and improve quality without significant additional resources is imperative in today's economic climate. Strategies such as our e‐messaging intervention with ACEi and ARB demonstrate sustainable improvement, can be applied to other conditions, and should be vigorously pursued.
Acknowledgements
The authors are grateful for the input provided by Mr. Jeff Leland and for the statistical analysis by Dr. Wen‐zhi Zhan and Mr. Stephen S. Cha.
- ,,, et al.Heart disease and stroke statistics–2009 update: a report from the American Heart Association Statistics Committee and Stroke Statistics Subcommittee.Circulation.2009;119(3):480–486.
- ,,,,,.Confirmation of a heart failure epidemic: findings from the Resource Utilization Among Congestive Heart Failure (REACH) study.J Am Coll Cardiol.2002;39(1):60–69.
- Hospital Discharges for Cardiovascular Diseases.CDC/NCHS ‐ Centers for Disease Control and Prevention/National Center for Health Statistics and the American Heart Association;2006.
- ,,,.Economic burden of heart failure: a summary of recent literature.Heart Lung.2004;33(6):362–371.
- SOLVD.Effect of enalapril on survival in patients with reduced left ventricular ejection fractions and congestive heart failure. The SOLVD Investigators.N Engl J Med.1991;325(5):293–302.
- SOLVD.Effect of enalapril on mortality and the development of heart failure in asymptomatic patients with reduced left ventricular ejection fractions. The SOLVD Investigattors.N Engl J Med.1992;327(10):685–691.
- ,,,,,.Metaanalysis: angiotensin‐receptor blockers in chronic heart failure and high‐risk acute myocardial infarction.Ann Intern Med.2004;141(9):693–704.
- ,,, et al.ACC/AHA guidelines for the evaluation and management of chronic heart failure in the adult: executive summary.J Heart Lung Transplant.2002;21(2):189–203.
- ,,, et al.Predictors of delivery of hospital‐based heart failure patient education: a report from OPTIMIZE‐HF.J Card Fail.2007;13(3):189–198.
- ,,, et al.Angiotensin‐converting enzyme inhibitors and angiotensin receptor blockers in patients with congestive heart failure and chronic kidney disease.Am Heart J.2007;153(6):1064–1073.
- ,,.Long‐term trends of angiotensin‐converting enzyme inhibitor and angiotensin‐receptor blocker use after heart failure hospitalization in community‐dwelling seniors.Int J Cardiol.2008;125(2):172–177.
- Committee on Quality of Health Care in America, Institute of Medicine. Crossing the Quality Chasm: A New Health System for the 21st Century. Washington, DC: National Academies Press; 2001.
- .Quality and safety performance in teaching hospitals.Am Surg.2006;72(11):1051–1054. discussion1061–1059,1133–1048.
- ,,, et al.Randomised controlled trial of specialist nurse intervention in heart failure.BMJ.2001;323(7315):715–718.
- ,,, et al.Readmission after hospitalization for congestive heart failure among Medicare beneficiaries.Arch Intern Med.1997;157(1):99–104.
- ,,, et al.Heart failure management: multidisciplinary care has intrinsic benefit above the optimization of medical care.J Card Fail.2002;8(3):142–148.
- ,,, et al.Comprehensive discharge planning for the hospitalized elderly. A randomized clinical trial.Ann Intern Med.1994;120(12):999–1006.
- ,,, et al.A multidisciplinary intervention to prevent the readmission of elderly patients with congestive heart failure.N Engl J Med.1995;333(18):1190–1195.
- ,,, et al.A comprehensive management system for heart failure improves clinical outcomes and reduces medical resource utilization.Am J Cardiol.1997;79(1):58–63.
- ,.Multidisciplinary team for enhancing care for patients with acute myocardial infarction or heart failure.Am J Health Syst Pharm.2007;64(12):1274–1278.
- ,,, et al.Impact of a guideline‐based disease management team on outcomes of hospitalized patients with congestive heart failure.Arch Intern Med.2001;161(2):177–182.
- ,,, et al.Predischarge initiation of carvedilol in patients hospitalized for decompensated heart failure: results of the Initiation Management Predischarge: Process for Assessment of Carvedilol Therapy in Heart Failure (IMPACT‐HF) trial.J Am Coll Cardiol.2004;43(9):1534–1541.
- ,,, et al.Systematic review: impact of health information technology on quality, efficiency, and costs of medical care.Ann Intern Med.2006;144(10):742–752.
- ,,, et al.Hospital rules‐based system: the next generation of medical informatics for patient safety.Am J Health Syst Pharm.2005;62(5):499–505.
- ,,, et al.Use of health information technology to advance evidence‐based care: lessons from the VA QUERI Program.J Gen Intern Med.2010;25Suppl 1:44–49.
- ,,, et al.Heart disease and stroke statistics–2009 update: a report from the American Heart Association Statistics Committee and Stroke Statistics Subcommittee.Circulation.2009;119(3):480–486.
- ,,,,,.Confirmation of a heart failure epidemic: findings from the Resource Utilization Among Congestive Heart Failure (REACH) study.J Am Coll Cardiol.2002;39(1):60–69.
- Hospital Discharges for Cardiovascular Diseases.CDC/NCHS ‐ Centers for Disease Control and Prevention/National Center for Health Statistics and the American Heart Association;2006.
- ,,,.Economic burden of heart failure: a summary of recent literature.Heart Lung.2004;33(6):362–371.
- SOLVD.Effect of enalapril on survival in patients with reduced left ventricular ejection fractions and congestive heart failure. The SOLVD Investigators.N Engl J Med.1991;325(5):293–302.
- SOLVD.Effect of enalapril on mortality and the development of heart failure in asymptomatic patients with reduced left ventricular ejection fractions. The SOLVD Investigattors.N Engl J Med.1992;327(10):685–691.
- ,,,,,.Metaanalysis: angiotensin‐receptor blockers in chronic heart failure and high‐risk acute myocardial infarction.Ann Intern Med.2004;141(9):693–704.
- ,,, et al.ACC/AHA guidelines for the evaluation and management of chronic heart failure in the adult: executive summary.J Heart Lung Transplant.2002;21(2):189–203.
- ,,, et al.Predictors of delivery of hospital‐based heart failure patient education: a report from OPTIMIZE‐HF.J Card Fail.2007;13(3):189–198.
- ,,, et al.Angiotensin‐converting enzyme inhibitors and angiotensin receptor blockers in patients with congestive heart failure and chronic kidney disease.Am Heart J.2007;153(6):1064–1073.
- ,,.Long‐term trends of angiotensin‐converting enzyme inhibitor and angiotensin‐receptor blocker use after heart failure hospitalization in community‐dwelling seniors.Int J Cardiol.2008;125(2):172–177.
- Committee on Quality of Health Care in America, Institute of Medicine. Crossing the Quality Chasm: A New Health System for the 21st Century. Washington, DC: National Academies Press; 2001.
- .Quality and safety performance in teaching hospitals.Am Surg.2006;72(11):1051–1054. discussion1061–1059,1133–1048.
- ,,, et al.Randomised controlled trial of specialist nurse intervention in heart failure.BMJ.2001;323(7315):715–718.
- ,,, et al.Readmission after hospitalization for congestive heart failure among Medicare beneficiaries.Arch Intern Med.1997;157(1):99–104.
- ,,, et al.Heart failure management: multidisciplinary care has intrinsic benefit above the optimization of medical care.J Card Fail.2002;8(3):142–148.
- ,,, et al.Comprehensive discharge planning for the hospitalized elderly. A randomized clinical trial.Ann Intern Med.1994;120(12):999–1006.
- ,,, et al.A multidisciplinary intervention to prevent the readmission of elderly patients with congestive heart failure.N Engl J Med.1995;333(18):1190–1195.
- ,,, et al.A comprehensive management system for heart failure improves clinical outcomes and reduces medical resource utilization.Am J Cardiol.1997;79(1):58–63.
- ,.Multidisciplinary team for enhancing care for patients with acute myocardial infarction or heart failure.Am J Health Syst Pharm.2007;64(12):1274–1278.
- ,,, et al.Impact of a guideline‐based disease management team on outcomes of hospitalized patients with congestive heart failure.Arch Intern Med.2001;161(2):177–182.
- ,,, et al.Predischarge initiation of carvedilol in patients hospitalized for decompensated heart failure: results of the Initiation Management Predischarge: Process for Assessment of Carvedilol Therapy in Heart Failure (IMPACT‐HF) trial.J Am Coll Cardiol.2004;43(9):1534–1541.
- ,,, et al.Systematic review: impact of health information technology on quality, efficiency, and costs of medical care.Ann Intern Med.2006;144(10):742–752.
- ,,, et al.Hospital rules‐based system: the next generation of medical informatics for patient safety.Am J Health Syst Pharm.2005;62(5):499–505.
- ,,, et al.Use of health information technology to advance evidence‐based care: lessons from the VA QUERI Program.J Gen Intern Med.2010;25Suppl 1:44–49.
OB-GYN Society Takes Step Toward HM Model
The American College of Obstetricians and Gynecologists (ACOG) has given a preliminary imprimatur to the HM model, whose practitioners are known in maternity circles as laborists.
ACOG’s Committee on Patient Safety and Quality released an internally published opinion this month describing the structure as “one potential solution to the achieving increased professional and patient satisfaction.” The committee, however, stopped short of formally approving the laborist movement, its chair says.
“ACOG is not officially endorsing this as a standard and a must,” says Patrice Weiss, MD, chair of the Carilion Clinic’s OB-GYN department in Roanoke, Va. “This is an option for communities or hospitals in which there may be a manpower issue with obstetricians.”
The college’s qualified blessing sees advantages in the “obstetric-gynecologic hospitalist,” including the relieved pressure of not running a private practice, more predictable schedules, competitive compensation, paid benefits, and guaranteed time off. Internal-medicine hospitalist programs routinely tout those same benefits when advertising for openings. The committee opinion adds that the laborist model also delivers benefits to a hospital, including enhanced patient safety, increased levels of nursing satisfaction, and, potentially, improved outcomes.
Dr. Weiss cautions that while the laborist approach is “gaining popularity and momentum,” institutions must safeguard against potential issues, such as arguments with PCPs over delivery fees and potential complications on handoffs. While internal-medicine HM groups have long dealt with potential frictions between PCPs and hospitalists, the conflicts are still developing in the laborist model.
“For such a program to be implemented, clear, concise communication between the providers, patients, and hospitals is key,” Dr. Weiss says. “Up-front communication will prevent surprises.”
The American College of Obstetricians and Gynecologists (ACOG) has given a preliminary imprimatur to the HM model, whose practitioners are known in maternity circles as laborists.
ACOG’s Committee on Patient Safety and Quality released an internally published opinion this month describing the structure as “one potential solution to the achieving increased professional and patient satisfaction.” The committee, however, stopped short of formally approving the laborist movement, its chair says.
“ACOG is not officially endorsing this as a standard and a must,” says Patrice Weiss, MD, chair of the Carilion Clinic’s OB-GYN department in Roanoke, Va. “This is an option for communities or hospitals in which there may be a manpower issue with obstetricians.”
The college’s qualified blessing sees advantages in the “obstetric-gynecologic hospitalist,” including the relieved pressure of not running a private practice, more predictable schedules, competitive compensation, paid benefits, and guaranteed time off. Internal-medicine hospitalist programs routinely tout those same benefits when advertising for openings. The committee opinion adds that the laborist model also delivers benefits to a hospital, including enhanced patient safety, increased levels of nursing satisfaction, and, potentially, improved outcomes.
Dr. Weiss cautions that while the laborist approach is “gaining popularity and momentum,” institutions must safeguard against potential issues, such as arguments with PCPs over delivery fees and potential complications on handoffs. While internal-medicine HM groups have long dealt with potential frictions between PCPs and hospitalists, the conflicts are still developing in the laborist model.
“For such a program to be implemented, clear, concise communication between the providers, patients, and hospitals is key,” Dr. Weiss says. “Up-front communication will prevent surprises.”
The American College of Obstetricians and Gynecologists (ACOG) has given a preliminary imprimatur to the HM model, whose practitioners are known in maternity circles as laborists.
ACOG’s Committee on Patient Safety and Quality released an internally published opinion this month describing the structure as “one potential solution to the achieving increased professional and patient satisfaction.” The committee, however, stopped short of formally approving the laborist movement, its chair says.
“ACOG is not officially endorsing this as a standard and a must,” says Patrice Weiss, MD, chair of the Carilion Clinic’s OB-GYN department in Roanoke, Va. “This is an option for communities or hospitals in which there may be a manpower issue with obstetricians.”
The college’s qualified blessing sees advantages in the “obstetric-gynecologic hospitalist,” including the relieved pressure of not running a private practice, more predictable schedules, competitive compensation, paid benefits, and guaranteed time off. Internal-medicine hospitalist programs routinely tout those same benefits when advertising for openings. The committee opinion adds that the laborist model also delivers benefits to a hospital, including enhanced patient safety, increased levels of nursing satisfaction, and, potentially, improved outcomes.
Dr. Weiss cautions that while the laborist approach is “gaining popularity and momentum,” institutions must safeguard against potential issues, such as arguments with PCPs over delivery fees and potential complications on handoffs. While internal-medicine HM groups have long dealt with potential frictions between PCPs and hospitalists, the conflicts are still developing in the laborist model.
“For such a program to be implemented, clear, concise communication between the providers, patients, and hospitals is key,” Dr. Weiss says. “Up-front communication will prevent surprises.”
HM to the Rescue
In the day-to-day grind of practicing medicine, it might be easy to lose perspective, but three weeks ago, hospitalist Rohini Noronha was unexpectedly reminded of the value of her training.
Dr. Noronha, MD, MBBS, MB, program director of Apogee Physicians hospitalist group at Wilkes-Barre General Hospital in Pennsylvania, was aboard a US Airways flight from Philadelphia to Dallas on May 20 when a voice on the public-address system asked for a doctor. She responded and was taken to a man who wasn’t breathing—and instinct and muscle memory took over.
“As a hospitalist, we are always in charge of running all the cardiac codes and arrests in the hospital,” Dr. Noronha says. “That prepared me. If you’re in private practice, you don’t see all those codes.”
Dr. Noronha, a native of India who came to the U.S. about eight years ago, performed CPR and, with the aid of two jolts from an automated external cardiac defibrillator, resuscitated the man. It was a heroic tale of a hospitalist in the right time at the right place—and one that has shined a positive spotlight on HM.
“I was pretty shocked it got so much attention,” Dr. Noronha adds. “This is just what we do. If someone is sick, it’s part of our training to go and help.”
Dr. Noronha’s training began in Mumbai, where she went to medical school, continued with another year of schooling at the University of Massachusetts, and finished with residency at Good Samaritan Hospital in Baltimore. She has worked with Apogee since 2006. Although she had a brief stint in India in private practice, she chose HM for the pace, the interaction with patients, and the ability to see immediate results—all traits that were on display on May 20. Her patient not only survived, but he was talking when paramedics arrived to ferry him off the plane.
Dr. Noronha eventually took off on her way to a conference. She conducted interviews and politely recounted her story for anyone who asked. She returned to work the next week, where cardiac codes are more routine and her first thought was a guilty pleasure.
“This is so much easier,” she says.
In the day-to-day grind of practicing medicine, it might be easy to lose perspective, but three weeks ago, hospitalist Rohini Noronha was unexpectedly reminded of the value of her training.
Dr. Noronha, MD, MBBS, MB, program director of Apogee Physicians hospitalist group at Wilkes-Barre General Hospital in Pennsylvania, was aboard a US Airways flight from Philadelphia to Dallas on May 20 when a voice on the public-address system asked for a doctor. She responded and was taken to a man who wasn’t breathing—and instinct and muscle memory took over.
“As a hospitalist, we are always in charge of running all the cardiac codes and arrests in the hospital,” Dr. Noronha says. “That prepared me. If you’re in private practice, you don’t see all those codes.”
Dr. Noronha, a native of India who came to the U.S. about eight years ago, performed CPR and, with the aid of two jolts from an automated external cardiac defibrillator, resuscitated the man. It was a heroic tale of a hospitalist in the right time at the right place—and one that has shined a positive spotlight on HM.
“I was pretty shocked it got so much attention,” Dr. Noronha adds. “This is just what we do. If someone is sick, it’s part of our training to go and help.”
Dr. Noronha’s training began in Mumbai, where she went to medical school, continued with another year of schooling at the University of Massachusetts, and finished with residency at Good Samaritan Hospital in Baltimore. She has worked with Apogee since 2006. Although she had a brief stint in India in private practice, she chose HM for the pace, the interaction with patients, and the ability to see immediate results—all traits that were on display on May 20. Her patient not only survived, but he was talking when paramedics arrived to ferry him off the plane.
Dr. Noronha eventually took off on her way to a conference. She conducted interviews and politely recounted her story for anyone who asked. She returned to work the next week, where cardiac codes are more routine and her first thought was a guilty pleasure.
“This is so much easier,” she says.
In the day-to-day grind of practicing medicine, it might be easy to lose perspective, but three weeks ago, hospitalist Rohini Noronha was unexpectedly reminded of the value of her training.
Dr. Noronha, MD, MBBS, MB, program director of Apogee Physicians hospitalist group at Wilkes-Barre General Hospital in Pennsylvania, was aboard a US Airways flight from Philadelphia to Dallas on May 20 when a voice on the public-address system asked for a doctor. She responded and was taken to a man who wasn’t breathing—and instinct and muscle memory took over.
“As a hospitalist, we are always in charge of running all the cardiac codes and arrests in the hospital,” Dr. Noronha says. “That prepared me. If you’re in private practice, you don’t see all those codes.”
Dr. Noronha, a native of India who came to the U.S. about eight years ago, performed CPR and, with the aid of two jolts from an automated external cardiac defibrillator, resuscitated the man. It was a heroic tale of a hospitalist in the right time at the right place—and one that has shined a positive spotlight on HM.
“I was pretty shocked it got so much attention,” Dr. Noronha adds. “This is just what we do. If someone is sick, it’s part of our training to go and help.”
Dr. Noronha’s training began in Mumbai, where she went to medical school, continued with another year of schooling at the University of Massachusetts, and finished with residency at Good Samaritan Hospital in Baltimore. She has worked with Apogee since 2006. Although she had a brief stint in India in private practice, she chose HM for the pace, the interaction with patients, and the ability to see immediate results—all traits that were on display on May 20. Her patient not only survived, but he was talking when paramedics arrived to ferry him off the plane.
Dr. Noronha eventually took off on her way to a conference. She conducted interviews and politely recounted her story for anyone who asked. She returned to work the next week, where cardiac codes are more routine and her first thought was a guilty pleasure.
“This is so much easier,” she says.
Readmission and Mortality [Rates] in Pneumonia
Pneumonia results in some 1.2 million hospital admissions each year in the United States, is the second leading cause of hospitalization among patients over 65, and accounts for more than $10 billion annually in hospital expenditures.1, 2 As a result of complex demographic and clinical forces, including an aging population, increasing prevalence of comorbidities, and changes in antimicrobial resistance patterns, between the periods 1988 to 1990 and 2000 to 2002 the number of patients hospitalized for pneumonia grew by 20%, and pneumonia was the leading infectious cause of death.3, 4
Given its public health significance, pneumonia has been the subject of intensive quality measurement and improvement efforts for well over a decade. Two of the largest initiatives are the Centers for Medicare & Medicaid Services (CMS) National Pneumonia Project and The Joint Commission ORYX program.5, 6 These efforts have largely entailed measuring hospital performance on pneumonia‐specific processes of care, such as whether blood oxygen levels were assessed, whether blood cultures were drawn before antibiotic treatment was initiated, the choice and timing of antibiotics, and smoking cessation counseling and vaccination at the time of discharge. While measuring processes of care (especially when they are based on sound evidence), can provide insights about quality, and can help guide hospital improvement efforts, these measures necessarily focus on a narrow spectrum of the overall care provided. Outcomes can complement process measures by directing attention to the results of care, which are influenced by both measured and unmeasured factors, and which may be more relevant from the patient's perspective.79
In 2008 CMS expanded its public reporting initiatives by adding risk‐standardized hospital mortality rates for pneumonia to the Hospital Compare website (
Methods
Design, Setting, Subjects
We conducted a cross‐sectional study at the hospital level of the outcomes of care of fee‐for‐service patients hospitalized for pneumonia between July 2006 and June 2009. Patients are eligible to be included in the measures if they are 65 years or older, have a principal diagnosis of pneumonia (International Classification of Diseases, Ninth Revision, Clinical Modification codes 480.X, 481, 482.XX, 483.X, 485, 486, and 487.0), and are cared for at a nonfederal acute care hospital in the US and its organized territories, including Puerto Rico, Guam, the US Virgin Islands, and the Northern Mariana Islands.
The mortality measure excludes patients enrolled in the Medicare hospice program in the year prior to, or on the day of admission, those in whom pneumonia is listed as a secondary diagnosis (to eliminate cases resulting from complications of hospitalization), those discharged against medical advice, and patients who are discharged alive but whose length of stay in the hospital is less than 1 day (because of concerns about the accuracy of the pneumonia diagnosis). Patients are also excluded if their administrative records for the period of analysis (1 year prior to hospitalization and 30 days following discharge) were not available or were incomplete, because these are needed to assess comorbid illness and outcomes. The readmission measure is similar, but does not exclude patients on the basis of hospice program enrollment (because these patients have been admitted and readmissions for hospice patients are likely unplanned events that can be measured and reduced), nor on the basis of hospital length of stay (because patients discharged within 24 hours may be at a heightened risk of readmission).11, 12
Information about patient comorbidities is derived from diagnoses recorded in the year prior to the index hospitalization as found in Medicare inpatient, outpatient, and carrier (physician) standard analytic files. Comorbidities are identified using the Condition Categories of the Hierarchical Condition Category grouper, which sorts the more than 15,000 possible diagnostic codes into 189 clinically‐coherent conditions and which was originally developed to support risk‐adjusted payments within Medicare managed care.13
Outcomes
The patient outcomes assessed include death from any cause within 30 days of admission and readmission for any cause within 30 days of discharge. All‐cause, rather than disease‐specific, readmission was chosen because hospital readmission as a consequence of suboptimal inpatient care or discharge coordination may manifest in many different diagnoses, and no validated method is available to distinguish related from unrelated readmissions. The measures use the Medicare Enrollment Database to determine mortality status, and acute care hospital inpatient claims are used to identify readmission events. For patients with multiple hospitalizations during the study period, the mortality measure randomly selects one hospitalization to use for determination of mortality. Admissions that are counted as readmissions (i.e., those that occurred within 30 days of discharge following hospitalization for pneumonia) are not also treated as index hospitalizations. In the case of patients who are transferred to or from another acute care facility, responsibility for deaths is assigned to the hospital that initially admitted the patient, while responsibility for readmissions is assigned to the hospital that ultimately discharges the patient to a nonacute setting (e.g., home, skilled nursing facilities).
Risk‐Standardization Methods
Hierarchical logistic regression is used to model the log‐odds of mortality or readmission within 30 days of admission or discharge from an index pneumonia admission as a function of patient demographic and clinical characteristics and a random hospital‐specific intercept. This strategy accounts for within‐hospital correlation of the observed outcomes, and reflects the assumption that underlying differences in quality among the hospitals being evaluated lead to systematic differences in outcomes. In contrast to nonhierarchical models which ignore hospital effects, this method attempts to measure the influence of the hospital on patient outcome after adjusting for patient characteristics. Comorbidities from the index admission that could represent potential complications of care are not included in the model unless they are also documented in the 12 months prior to admission. Hospital‐specific mortality and readmission rates are calculated as the ratio of predicted‐to‐expected events (similar to the observed/expected ratio), multiplied by the national unadjusted rate, a form of indirect standardization.
The model for mortality has a c‐statistic of 0.72 whereas a model based on medical record review that was developed for validation purposes had a c‐statistic of 0.77. The model for readmission has a c‐statistic of 0.63 whereas a model based on medical review had a c‐statistic of 0.59. The mortality and readmission models produce similar state‐level mortality and readmission rate estimates as the models derived from medical record review, and can therefore serve as reasonable surrogates. These methods, including their development and validation, have been described fully elsewhere,14, 15 and have been evaluated and subsequently endorsed by the National Quality Forum.16
Identification of Geographic Regions
To characterize patterns of performance geographically we identified the 306 hospital referral regions for each hospital in our analysis using definitions provided by the Dartmouth Atlas of Health Care project. Unlike a hospital‐level analysis, the hospital referral regions represent regional markets for tertiary care and are widely used to summarize variation in medical care inputs, utilization patterns, and health outcomes and provide a more detailed look at variation in outcomes than results at the state level.17
Analyses
Summary statistics were constructed using frequencies and proportions for categorical data, and means, medians and interquartile ranges for continuous variables. To characterize 30‐day risk‐standardized mortality and readmission rates at the hospital‐referral region level, we calculated means and percentiles by weighting each hospital's value by the inverse of the variance of the hospital's estimated rate. Hospitals with larger sample sizes, and therefore more precise estimates, lend more weight to the average. Hierarchical models were estimated using the SAS GLIMMIX procedure. Bayesian shrinkage was used to estimate rates in order to take into account the greater uncertainty in the true rates of hospitals with small caseloads. Using this technique, estimated rates at low volume institutions are shrunken toward the population mean, while hospitals with large caseloads have a relatively smaller amount of shrinkage and the estimate is closer to the hospital's observed rate.18
To determine whether a hospital's performance is significantly different than the national rate we measured whether the 95% interval estimate for the risk‐standardized rate overlapped with the national crude mortality or readmission rate. This information is used to categorize hospitals on Hospital Compare as better than the US national rate, worse than the US national rate, or no different than the US national rate. Hospitals with fewer than 25 cases in the 3‐year period, are excluded from this categorization on Hospital Compare.
Analyses were conducted with the use of SAS 9.1.3 (SAS Institute Inc, Cary, NC). We created the hospital referral region maps using ArcGIS version 9.3 (ESRI, Redlands, CA). The Human Investigation Committee at the Yale School of Medicine approved an exemption for the authors to use CMS claims and enrollment data for research analyses and publication.
Results
Hospital‐Specific Risk‐Standardized 30‐Day Mortality and Readmission Rates
Of the 1,118,583 patients included in the mortality analysis 129,444 (11.6%) died within 30 days of hospital admission. The median (Q1, Q3) hospital 30‐day risk‐standardized mortality rate was 11.1% (10.0%, 12.3%), and ranged from 6.7% to 20.9% (Table 1, Figure 1). Hospitals at the 10th percentile had 30‐day risk‐standardized mortality rates of 9.0% while for those at the 90th percentile of performance the rate was 13.5%. The odds of all‐cause mortality for a patient treated at a hospital that was one standard deviation above the national average was 1.68 times higher than that of a patient treated at a hospital that was one standard deviation below the national average.
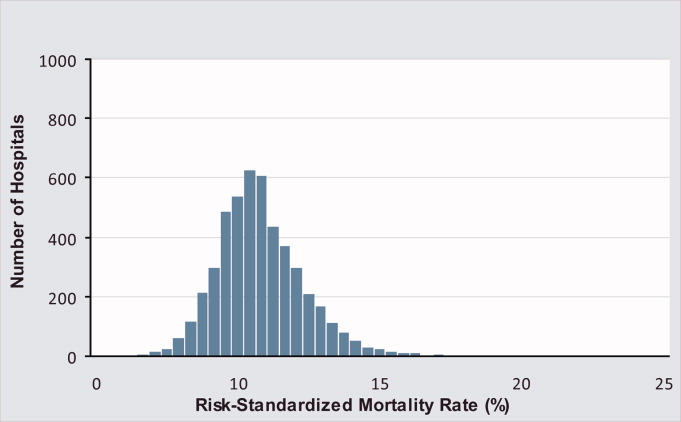
| Mortality | Readmission | |
|---|---|---|
| ||
| Patients (n) | 1118583 | 1161817 |
| Hospitals (n) | 4788 | 4813 |
| Patient age, years, median (Q1, Q3) | 81 (74,86) | 80 (74,86) |
| Nonwhite, % | 11.1 | 11.1 |
| Hospital case volume, median (Q1, Q3) | 168 (77,323) | 174 (79,334) |
| Risk‐standardized hospital rate, mean (SD) | 11.2 (1.2) | 18.3 (0.9) |
| Minimum | 6.7 | 13.6 |
| 1st percentile | 7.5 | 14.9 |
| 5th percentile | 8.5 | 15.8 |
| 10th percentile | 9.0 | 16.4 |
| 25th percentile | 10.0 | 17.2 |
| Median | 11.1 | 18.2 |
| 75th percentile | 12.3 | 19.2 |
| 90th percentile | 13.5 | 20.4 |
| 95th percentile | 14.4 | 21.1 |
| 99th percentile | 16.1 | 22.8 |
| Maximum | 20.9 | 26.7 |
| Model fit statistics | ||
| c‐Statistic | 0.72 | 0.63 |
| Intrahospital Correlation | 0.07 | 0.03 |
For the 3‐year period 2006 to 2009, 222 (4.7%) hospitals were categorized as having a mortality rate that was better than the national average, 3968 (83.7%) were no different than the national average, 221 (4.6%) were worse and 332 (7.0%) did not meet the minimum case threshold.
Among the 1,161,817 patients included in the readmission analysis 212,638 (18.3%) were readmitted within 30 days of hospital discharge. The median (Q1,Q3) 30‐day risk‐standardized readmission rate was 18.2% (17.2%, 19.2%) and ranged from 13.6% to 26.7% (Table 1, Figure 2). Hospitals at the 10th percentile had 30‐day risk‐standardized readmission rates of 16.4% while for those at the 90th percentile of performance the rate was 20.4%. The odds of all‐cause readmission for a patient treated at a hospital that was one standard deviation above the national average was 1.40 times higher than the odds of all‐cause readmission if treated at a hospital that was one standard deviation below the national average.
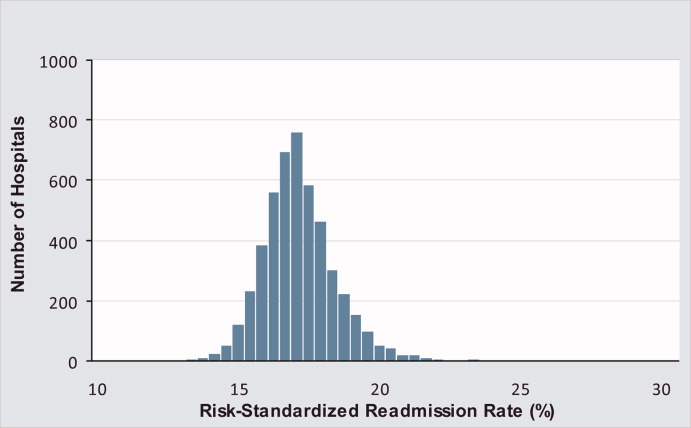
For the 3‐year period 2006 to 2009, 64 (1.3%) hospitals were categorized as having a readmission rate that was better than the national average, 4203 (88.2%) were no different than the national average, 163 (3.4%) were worse and 333 (7.0%) had less than 25 cases and were therefore not categorized.
While risk‐standardized readmission rates were substantially higher than risk‐standardized mortality rates, mortality rates varied more. For example, the top 10% of hospitals had a relative mortality rate that was 33% lower than those in the bottom 10%, as compared with just a 20% relative difference for readmission rates. The coefficient of variation, a normalized measure of dispersion that unlike the standard deviation is independent of the population mean, was 10.7 for risk‐standardized mortality rates and 4.9 for readmission rates.
Regional Risk‐Standardized 30‐Day Mortality and Readmission Rates
Figures 3 and 4 show the distribution of 30‐day risk‐standardized mortality and readmission rates among hospital referral regions by quintile. Highest mortality regions were found across the entire country, including parts of Northern New England, the Mid and South Atlantic, East and the West South Central, East and West North Central, and the Mountain and Pacific regions of the West. The lowest mortality rates were observed in Southern New England, parts of the Mid and South Atlantic, East and West South Central, and parts of the Mountain and Pacific regions of the West (Figure 3).
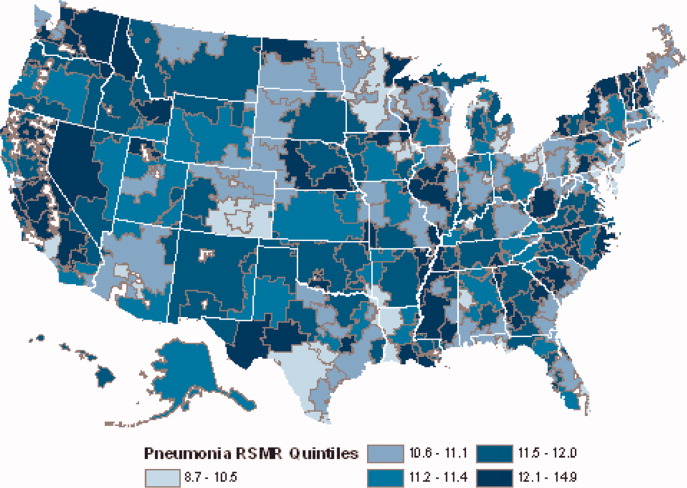
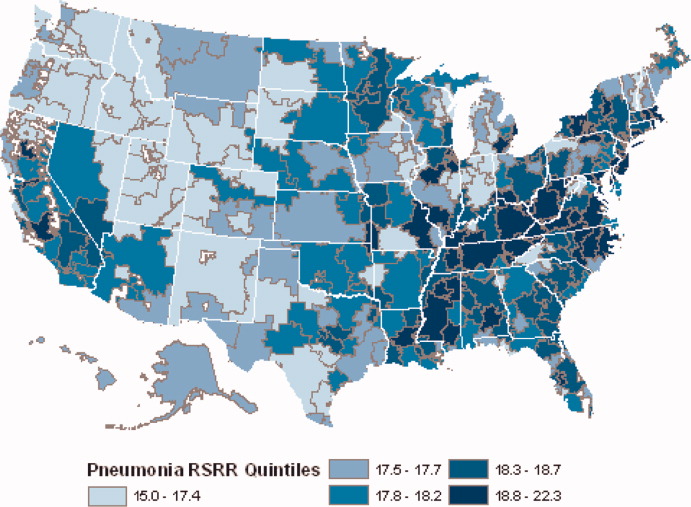
Readmission rates were higher in the eastern portions of the US (including the Northeast, Mid and South Atlantic, East South Central) as well as the East North Central, and small parts of the West North Central portions of the Midwest and in Central California. The lowest readmission rates were observed in the West (Mountain and Pacific regions), parts of the Midwest (East and West North Central) and small pockets within the South and Northeast (Figure 4).
Discussion
In this 3‐year analysis of patient, hospital, and regional outcomes we observed that pneumonia in the elderly remains a highly morbid illness, with a 30‐day mortality rate of approximately 11.6%. More notably we observed that risk‐standardized mortality rates, and to a lesser extent readmission rates, vary significantly across hospitals and regions. Finally, we observed that readmission rates, but not mortality rates, show strong geographic concentration.
These findings suggest possible opportunities to save or extend the lives of a substantial number of Americans, and to reduce the burden of rehospitalization on patients and families, if low performing institutions were able to achieve the performance of those with better outcomes. Additionally, because readmission is so common (nearly 1 in 5 patients), efforts to reduce overall health care spending should focus on this large potential source of savings.19 In this regard, impending changes in payment to hospitals around readmissions will change incentives for hospitals and physicians that may ultimately lead to lower readmission rates.20
Previous analyses of the quality of hospital care for patients with pneumonia have focused on the percentage of eligible patients who received guideline‐recommended antibiotics within a specified time frame (4 or 8 hours), and vaccination prior to hospital discharge.21, 22 These studies have highlighted large differences across hospitals and states in the percentage receiving recommended care. In contrast, the focus of this study was to compare risk‐standardized outcomes of care at the nation's hospitals and across its regions. This effort was guided by the notion that the measurement of care outcomes is an important complement to process measurement because outcomes represent a more holistic assessment of care, that an outcomes focus offers hospitals greater autonomy in terms of what processes to improve, and that outcomes are ultimately more meaningful to patients than the technical aspects of how the outcomes were achieved. In contrast to these earlier process‐oriented efforts, the magnitude of the differences we observed in mortality and readmission rates across hospitals was not nearly as large.
A recent analysis of the outcomes of care for patients with heart failure and acute myocardial infarction also found significant variation in both hospital and regional mortality and readmission rates.23 The relative differences in risk‐standardized hospital mortality rates across the 10th to 90th percentiles of hospital performance was 25% for acute myocardial infarction, and 39% for heart failure. By contrast, we found that the difference in risk‐standardized hospital mortality rates across the 10th to 90th percentiles in pneumonia was an even greater 50% (13.5% vs. 9.0%). Similar to the findings in acute myocardial infarction and heart failure, we observed that risk‐standardized mortality rates varied more so than did readmission rates.
Our study has a number of limitations. First, the analysis was restricted to Medicare patients only, and our findings may not be generalizable to younger patients. Second, our risk‐adjustment methods relied on claims data, not clinical information abstracted from charts. Nevertheless, we assessed comorbidities using all physician and hospital claims from the year prior to the index admission. Additionally our mortality and readmission models were validated against those based on medical record data and the outputs of the 2 approaches were highly correlated.15, 24, 25 Our study was restricted to patients with a principal diagnosis of pneumonia, and we therefore did not include those whose principal diagnosis was sepsis or respiratory failure and who had a secondary diagnosis of pneumonia. While this decision was made to reduce the risk of misclassifying complications of care as the reason for admission, we acknowledge that this is likely to have limited our study to patients with less severe disease, and may have introduced bias related to differences in hospital coding practices regarding the use of sepsis and respiratory failure codes. While we excluded patients with 1 day length of stay from the mortality analysis to reduce the risk of including patients in the measure who did not actually have pneumonia, we did not exclude them from the readmission analysis because very short length of stay may be a risk factor for readmission. An additional limitation of our study is that our findings are primarily descriptive, and we did not attempt to explain the sources of the variation we observed. For example, we did not examine the extent to which these differences might be explained by differences in adherence to process measures across hospitals or regions. However, if the experience in acute myocardial infarction can serve as a guide, then it is unlikely that more than a small fraction of the observed variation in outcomes can be attributed to factors such as antibiotic timing or selection.26 Additionally, we cannot explain why readmission rates were more geographically distributed than mortality rates, however it is possible that this may be related to the supply of physicians or hospital beds.27 Finally, some have argued that mortality and readmission rates do not necessarily reflect the very quality they intend to measure.2830
The outcomes of patients with pneumonia appear to be significantly influenced by both the hospital and region where they receive care. Efforts to improve population level outcomes might be informed by studying the practices of hospitals and regions that consistently achieve high levels of performance.31
Acknowledgements
The authors thank Sandi Nelson, Eric Schone, and Marian Wrobel at Mathematicia Policy Research and Changquin Wang and Jinghong Gao at YNHHS/Yale CORE for analytic support. They also acknowledge Shantal Savage, Kanchana Bhat, and Mayur M. Desai at Yale, Joseph S. Ross at the Mount Sinai School of Medicine, and Shaheen Halim at the Centers for Medicare and Medicaid Services.
- , , , , . HCUP Facts and Figures: Statistics on Hospital‐based Care in the United States, 2007 [Internet]. 2009 [cited 2009 Nov 7]. Available at: http://www.hcup‐us.ahrq.gov/reports.jsp. Accessed June2010.
- Agency for Healthcare Research and Quality. HCUP Nationwide Inpatient Sample (NIS). Healthcare Cost and Utilization Project (HCUP). [Internet]. 2007 [cited 2010 May 13]. Available at: http://www.hcup‐us.ahrq.gov/nisoverview.jsp. Accessed June2010.
- , , , , .Trends in hospitalizations for pneumonia among persons aged 65 years or older in the United States, 1988‐2002.JAMA.20057;294(21):2712–2719.
- . Deaths: Leading Causes for 2006. NVSS [Internet]. 2010 Mar 31;58(14). Available at: http://www.cdc.gov/nchs/data/nvsr/nvsr58/nvsr58_ 14.pdf. Accessed June2010.
- Centers for Medicare and Medicaid Services. Pneumonia [Internet]. [cited 2010 May 13]. Available at: http://www.qualitynet.org/dcs/ContentServer?cid= 108981596702326(1):75–85.
- , , .Performance measures for pneumonia: are they valuable, and are process measures adequate?Curr Opin Infect Dis.2007;20(2):182–189.
- , .Relationship Between Medicare's Hospital Compare Performance Measures and Mortality Rates.JAMA.2006;296(22):2694–2702.
- Medicare.gov ‐ Hospital Compare [Internet]. [cited 2009 Nov 6]. Available at: http://www.hospitalcompare.hhs.gov/Hospital/Search/Welcome.asp? version=default 2010. Available at: http://www.qualitynet.org/dcs/ContentServer? c=Page 2010. Available at: http://www.qualitynet.org/dcs/ContentServer? c=Page 2000 [cited 2009 Nov 7]. Available at: http://www.cms.hhs.gov/Reports/Reports/ItemDetail.asp?ItemID=CMS023176. Accessed June2010.
- , , , et al. Risk‐Adjustment Methodology for Hospital Monitoring/Surveillance and Public Reporting Supplement #1: 30‐Day Mortality Model for Pneumonia [Internet]. Yale University; 2006. Available at: http://www.qualitynet.org/dcs/ContentServer?c= Page 2008. Available at: http://www.qualitynet.org/dcs/ContentServer?c= Page1999.
- , .Statistical and clinical aspects of hospital outcomes profiling.Stat Sci.2007;22(2):206–226.
- Medicare Payment Advisory Commission. Report to the Congress: Promoting Greater Efficiency in Medicare.2007 June.
- Patient Protection and Affordable Care Act [Internet]. 2010. Available at: http://thomas.loc.gov. Accessed June2010.
- , , , et al.Quality of medical care delivered to medicare beneficiaries: a profile at state and national levels.JAMA.2000;284(13):1670–1676.
- , , , .Care in U.S. hospitals — the hospital quality alliance program.N Engl J Med.2005;353(3):265–274.
- , , , et al.Patterns of hospital performance in acute myocardial infarction and heart failure 30‐day mortality and readmission.Circ Cardiovasc Qual Outcomes.2009;2(5):407–413.
- , , , et al.An administrative claims model suitable for profiling hospital performance based on 30‐day mortality rates among patients with heart failure.Circulation.2006;113(13):1693–1701.
- , , , et al.An administrative claims model suitable for profiling hospital performance based on 30‐day mortality rates among patients with an acute myocardial infarction.Circulation.2006;113(13):1683–1692.
- , , , et al.Hospital quality for acute myocardial infarction: correlation among process measures and relationship with short‐term mortality.JAMA.2006;296(1):72–78.
- , , , .Hospital readmission rates for cohorts of medicare beneficiaries in Boston and New Haven.N Engl J Med.1994;331(15):989–995.
- , .Research evidence on the validity of risk‐adjusted mortality rate as a measure of hospital quality of care.Med Care Res Rev.1998;55(4):371–404.
- , .Hospital readmissions as a measure of quality of health care: advantages and limitations.Arch Intern Med.2000;160(8):1074–1081.
- , .Hospital mortality: when failure is not a good measure of success.CMAJ.2008;179(2):153–157.
- , , , , , .Research in action: using positive deviance to improve quality of health care.Implement Sci.2009;4:25.
Pneumonia results in some 1.2 million hospital admissions each year in the United States, is the second leading cause of hospitalization among patients over 65, and accounts for more than $10 billion annually in hospital expenditures.1, 2 As a result of complex demographic and clinical forces, including an aging population, increasing prevalence of comorbidities, and changes in antimicrobial resistance patterns, between the periods 1988 to 1990 and 2000 to 2002 the number of patients hospitalized for pneumonia grew by 20%, and pneumonia was the leading infectious cause of death.3, 4
Given its public health significance, pneumonia has been the subject of intensive quality measurement and improvement efforts for well over a decade. Two of the largest initiatives are the Centers for Medicare & Medicaid Services (CMS) National Pneumonia Project and The Joint Commission ORYX program.5, 6 These efforts have largely entailed measuring hospital performance on pneumonia‐specific processes of care, such as whether blood oxygen levels were assessed, whether blood cultures were drawn before antibiotic treatment was initiated, the choice and timing of antibiotics, and smoking cessation counseling and vaccination at the time of discharge. While measuring processes of care (especially when they are based on sound evidence), can provide insights about quality, and can help guide hospital improvement efforts, these measures necessarily focus on a narrow spectrum of the overall care provided. Outcomes can complement process measures by directing attention to the results of care, which are influenced by both measured and unmeasured factors, and which may be more relevant from the patient's perspective.79
In 2008 CMS expanded its public reporting initiatives by adding risk‐standardized hospital mortality rates for pneumonia to the Hospital Compare website (
Methods
Design, Setting, Subjects
We conducted a cross‐sectional study at the hospital level of the outcomes of care of fee‐for‐service patients hospitalized for pneumonia between July 2006 and June 2009. Patients are eligible to be included in the measures if they are 65 years or older, have a principal diagnosis of pneumonia (International Classification of Diseases, Ninth Revision, Clinical Modification codes 480.X, 481, 482.XX, 483.X, 485, 486, and 487.0), and are cared for at a nonfederal acute care hospital in the US and its organized territories, including Puerto Rico, Guam, the US Virgin Islands, and the Northern Mariana Islands.
The mortality measure excludes patients enrolled in the Medicare hospice program in the year prior to, or on the day of admission, those in whom pneumonia is listed as a secondary diagnosis (to eliminate cases resulting from complications of hospitalization), those discharged against medical advice, and patients who are discharged alive but whose length of stay in the hospital is less than 1 day (because of concerns about the accuracy of the pneumonia diagnosis). Patients are also excluded if their administrative records for the period of analysis (1 year prior to hospitalization and 30 days following discharge) were not available or were incomplete, because these are needed to assess comorbid illness and outcomes. The readmission measure is similar, but does not exclude patients on the basis of hospice program enrollment (because these patients have been admitted and readmissions for hospice patients are likely unplanned events that can be measured and reduced), nor on the basis of hospital length of stay (because patients discharged within 24 hours may be at a heightened risk of readmission).11, 12
Information about patient comorbidities is derived from diagnoses recorded in the year prior to the index hospitalization as found in Medicare inpatient, outpatient, and carrier (physician) standard analytic files. Comorbidities are identified using the Condition Categories of the Hierarchical Condition Category grouper, which sorts the more than 15,000 possible diagnostic codes into 189 clinically‐coherent conditions and which was originally developed to support risk‐adjusted payments within Medicare managed care.13
Outcomes
The patient outcomes assessed include death from any cause within 30 days of admission and readmission for any cause within 30 days of discharge. All‐cause, rather than disease‐specific, readmission was chosen because hospital readmission as a consequence of suboptimal inpatient care or discharge coordination may manifest in many different diagnoses, and no validated method is available to distinguish related from unrelated readmissions. The measures use the Medicare Enrollment Database to determine mortality status, and acute care hospital inpatient claims are used to identify readmission events. For patients with multiple hospitalizations during the study period, the mortality measure randomly selects one hospitalization to use for determination of mortality. Admissions that are counted as readmissions (i.e., those that occurred within 30 days of discharge following hospitalization for pneumonia) are not also treated as index hospitalizations. In the case of patients who are transferred to or from another acute care facility, responsibility for deaths is assigned to the hospital that initially admitted the patient, while responsibility for readmissions is assigned to the hospital that ultimately discharges the patient to a nonacute setting (e.g., home, skilled nursing facilities).
Risk‐Standardization Methods
Hierarchical logistic regression is used to model the log‐odds of mortality or readmission within 30 days of admission or discharge from an index pneumonia admission as a function of patient demographic and clinical characteristics and a random hospital‐specific intercept. This strategy accounts for within‐hospital correlation of the observed outcomes, and reflects the assumption that underlying differences in quality among the hospitals being evaluated lead to systematic differences in outcomes. In contrast to nonhierarchical models which ignore hospital effects, this method attempts to measure the influence of the hospital on patient outcome after adjusting for patient characteristics. Comorbidities from the index admission that could represent potential complications of care are not included in the model unless they are also documented in the 12 months prior to admission. Hospital‐specific mortality and readmission rates are calculated as the ratio of predicted‐to‐expected events (similar to the observed/expected ratio), multiplied by the national unadjusted rate, a form of indirect standardization.
The model for mortality has a c‐statistic of 0.72 whereas a model based on medical record review that was developed for validation purposes had a c‐statistic of 0.77. The model for readmission has a c‐statistic of 0.63 whereas a model based on medical review had a c‐statistic of 0.59. The mortality and readmission models produce similar state‐level mortality and readmission rate estimates as the models derived from medical record review, and can therefore serve as reasonable surrogates. These methods, including their development and validation, have been described fully elsewhere,14, 15 and have been evaluated and subsequently endorsed by the National Quality Forum.16
Identification of Geographic Regions
To characterize patterns of performance geographically we identified the 306 hospital referral regions for each hospital in our analysis using definitions provided by the Dartmouth Atlas of Health Care project. Unlike a hospital‐level analysis, the hospital referral regions represent regional markets for tertiary care and are widely used to summarize variation in medical care inputs, utilization patterns, and health outcomes and provide a more detailed look at variation in outcomes than results at the state level.17
Analyses
Summary statistics were constructed using frequencies and proportions for categorical data, and means, medians and interquartile ranges for continuous variables. To characterize 30‐day risk‐standardized mortality and readmission rates at the hospital‐referral region level, we calculated means and percentiles by weighting each hospital's value by the inverse of the variance of the hospital's estimated rate. Hospitals with larger sample sizes, and therefore more precise estimates, lend more weight to the average. Hierarchical models were estimated using the SAS GLIMMIX procedure. Bayesian shrinkage was used to estimate rates in order to take into account the greater uncertainty in the true rates of hospitals with small caseloads. Using this technique, estimated rates at low volume institutions are shrunken toward the population mean, while hospitals with large caseloads have a relatively smaller amount of shrinkage and the estimate is closer to the hospital's observed rate.18
To determine whether a hospital's performance is significantly different than the national rate we measured whether the 95% interval estimate for the risk‐standardized rate overlapped with the national crude mortality or readmission rate. This information is used to categorize hospitals on Hospital Compare as better than the US national rate, worse than the US national rate, or no different than the US national rate. Hospitals with fewer than 25 cases in the 3‐year period, are excluded from this categorization on Hospital Compare.
Analyses were conducted with the use of SAS 9.1.3 (SAS Institute Inc, Cary, NC). We created the hospital referral region maps using ArcGIS version 9.3 (ESRI, Redlands, CA). The Human Investigation Committee at the Yale School of Medicine approved an exemption for the authors to use CMS claims and enrollment data for research analyses and publication.
Results
Hospital‐Specific Risk‐Standardized 30‐Day Mortality and Readmission Rates
Of the 1,118,583 patients included in the mortality analysis 129,444 (11.6%) died within 30 days of hospital admission. The median (Q1, Q3) hospital 30‐day risk‐standardized mortality rate was 11.1% (10.0%, 12.3%), and ranged from 6.7% to 20.9% (Table 1, Figure 1). Hospitals at the 10th percentile had 30‐day risk‐standardized mortality rates of 9.0% while for those at the 90th percentile of performance the rate was 13.5%. The odds of all‐cause mortality for a patient treated at a hospital that was one standard deviation above the national average was 1.68 times higher than that of a patient treated at a hospital that was one standard deviation below the national average.
| Mortality | Readmission | |
|---|---|---|
| ||
| Patients (n) | 1118583 | 1161817 |
| Hospitals (n) | 4788 | 4813 |
| Patient age, years, median (Q1, Q3) | 81 (74,86) | 80 (74,86) |
| Nonwhite, % | 11.1 | 11.1 |
| Hospital case volume, median (Q1, Q3) | 168 (77,323) | 174 (79,334) |
| Risk‐standardized hospital rate, mean (SD) | 11.2 (1.2) | 18.3 (0.9) |
| Minimum | 6.7 | 13.6 |
| 1st percentile | 7.5 | 14.9 |
| 5th percentile | 8.5 | 15.8 |
| 10th percentile | 9.0 | 16.4 |
| 25th percentile | 10.0 | 17.2 |
| Median | 11.1 | 18.2 |
| 75th percentile | 12.3 | 19.2 |
| 90th percentile | 13.5 | 20.4 |
| 95th percentile | 14.4 | 21.1 |
| 99th percentile | 16.1 | 22.8 |
| Maximum | 20.9 | 26.7 |
| Model fit statistics | ||
| c‐Statistic | 0.72 | 0.63 |
| Intrahospital Correlation | 0.07 | 0.03 |
For the 3‐year period 2006 to 2009, 222 (4.7%) hospitals were categorized as having a mortality rate that was better than the national average, 3968 (83.7%) were no different than the national average, 221 (4.6%) were worse and 332 (7.0%) did not meet the minimum case threshold.
Among the 1,161,817 patients included in the readmission analysis 212,638 (18.3%) were readmitted within 30 days of hospital discharge. The median (Q1,Q3) 30‐day risk‐standardized readmission rate was 18.2% (17.2%, 19.2%) and ranged from 13.6% to 26.7% (Table 1, Figure 2). Hospitals at the 10th percentile had 30‐day risk‐standardized readmission rates of 16.4% while for those at the 90th percentile of performance the rate was 20.4%. The odds of all‐cause readmission for a patient treated at a hospital that was one standard deviation above the national average was 1.40 times higher than the odds of all‐cause readmission if treated at a hospital that was one standard deviation below the national average.
For the 3‐year period 2006 to 2009, 64 (1.3%) hospitals were categorized as having a readmission rate that was better than the national average, 4203 (88.2%) were no different than the national average, 163 (3.4%) were worse and 333 (7.0%) had less than 25 cases and were therefore not categorized.
While risk‐standardized readmission rates were substantially higher than risk‐standardized mortality rates, mortality rates varied more. For example, the top 10% of hospitals had a relative mortality rate that was 33% lower than those in the bottom 10%, as compared with just a 20% relative difference for readmission rates. The coefficient of variation, a normalized measure of dispersion that unlike the standard deviation is independent of the population mean, was 10.7 for risk‐standardized mortality rates and 4.9 for readmission rates.
Regional Risk‐Standardized 30‐Day Mortality and Readmission Rates
Figures 3 and 4 show the distribution of 30‐day risk‐standardized mortality and readmission rates among hospital referral regions by quintile. Highest mortality regions were found across the entire country, including parts of Northern New England, the Mid and South Atlantic, East and the West South Central, East and West North Central, and the Mountain and Pacific regions of the West. The lowest mortality rates were observed in Southern New England, parts of the Mid and South Atlantic, East and West South Central, and parts of the Mountain and Pacific regions of the West (Figure 3).
Readmission rates were higher in the eastern portions of the US (including the Northeast, Mid and South Atlantic, East South Central) as well as the East North Central, and small parts of the West North Central portions of the Midwest and in Central California. The lowest readmission rates were observed in the West (Mountain and Pacific regions), parts of the Midwest (East and West North Central) and small pockets within the South and Northeast (Figure 4).
Discussion
In this 3‐year analysis of patient, hospital, and regional outcomes we observed that pneumonia in the elderly remains a highly morbid illness, with a 30‐day mortality rate of approximately 11.6%. More notably we observed that risk‐standardized mortality rates, and to a lesser extent readmission rates, vary significantly across hospitals and regions. Finally, we observed that readmission rates, but not mortality rates, show strong geographic concentration.
These findings suggest possible opportunities to save or extend the lives of a substantial number of Americans, and to reduce the burden of rehospitalization on patients and families, if low performing institutions were able to achieve the performance of those with better outcomes. Additionally, because readmission is so common (nearly 1 in 5 patients), efforts to reduce overall health care spending should focus on this large potential source of savings.19 In this regard, impending changes in payment to hospitals around readmissions will change incentives for hospitals and physicians that may ultimately lead to lower readmission rates.20
Previous analyses of the quality of hospital care for patients with pneumonia have focused on the percentage of eligible patients who received guideline‐recommended antibiotics within a specified time frame (4 or 8 hours), and vaccination prior to hospital discharge.21, 22 These studies have highlighted large differences across hospitals and states in the percentage receiving recommended care. In contrast, the focus of this study was to compare risk‐standardized outcomes of care at the nation's hospitals and across its regions. This effort was guided by the notion that the measurement of care outcomes is an important complement to process measurement because outcomes represent a more holistic assessment of care, that an outcomes focus offers hospitals greater autonomy in terms of what processes to improve, and that outcomes are ultimately more meaningful to patients than the technical aspects of how the outcomes were achieved. In contrast to these earlier process‐oriented efforts, the magnitude of the differences we observed in mortality and readmission rates across hospitals was not nearly as large.
A recent analysis of the outcomes of care for patients with heart failure and acute myocardial infarction also found significant variation in both hospital and regional mortality and readmission rates.23 The relative differences in risk‐standardized hospital mortality rates across the 10th to 90th percentiles of hospital performance was 25% for acute myocardial infarction, and 39% for heart failure. By contrast, we found that the difference in risk‐standardized hospital mortality rates across the 10th to 90th percentiles in pneumonia was an even greater 50% (13.5% vs. 9.0%). Similar to the findings in acute myocardial infarction and heart failure, we observed that risk‐standardized mortality rates varied more so than did readmission rates.
Our study has a number of limitations. First, the analysis was restricted to Medicare patients only, and our findings may not be generalizable to younger patients. Second, our risk‐adjustment methods relied on claims data, not clinical information abstracted from charts. Nevertheless, we assessed comorbidities using all physician and hospital claims from the year prior to the index admission. Additionally our mortality and readmission models were validated against those based on medical record data and the outputs of the 2 approaches were highly correlated.15, 24, 25 Our study was restricted to patients with a principal diagnosis of pneumonia, and we therefore did not include those whose principal diagnosis was sepsis or respiratory failure and who had a secondary diagnosis of pneumonia. While this decision was made to reduce the risk of misclassifying complications of care as the reason for admission, we acknowledge that this is likely to have limited our study to patients with less severe disease, and may have introduced bias related to differences in hospital coding practices regarding the use of sepsis and respiratory failure codes. While we excluded patients with 1 day length of stay from the mortality analysis to reduce the risk of including patients in the measure who did not actually have pneumonia, we did not exclude them from the readmission analysis because very short length of stay may be a risk factor for readmission. An additional limitation of our study is that our findings are primarily descriptive, and we did not attempt to explain the sources of the variation we observed. For example, we did not examine the extent to which these differences might be explained by differences in adherence to process measures across hospitals or regions. However, if the experience in acute myocardial infarction can serve as a guide, then it is unlikely that more than a small fraction of the observed variation in outcomes can be attributed to factors such as antibiotic timing or selection.26 Additionally, we cannot explain why readmission rates were more geographically distributed than mortality rates, however it is possible that this may be related to the supply of physicians or hospital beds.27 Finally, some have argued that mortality and readmission rates do not necessarily reflect the very quality they intend to measure.2830
The outcomes of patients with pneumonia appear to be significantly influenced by both the hospital and region where they receive care. Efforts to improve population level outcomes might be informed by studying the practices of hospitals and regions that consistently achieve high levels of performance.31
Acknowledgements
The authors thank Sandi Nelson, Eric Schone, and Marian Wrobel at Mathematicia Policy Research and Changquin Wang and Jinghong Gao at YNHHS/Yale CORE for analytic support. They also acknowledge Shantal Savage, Kanchana Bhat, and Mayur M. Desai at Yale, Joseph S. Ross at the Mount Sinai School of Medicine, and Shaheen Halim at the Centers for Medicare and Medicaid Services.
Pneumonia results in some 1.2 million hospital admissions each year in the United States, is the second leading cause of hospitalization among patients over 65, and accounts for more than $10 billion annually in hospital expenditures.1, 2 As a result of complex demographic and clinical forces, including an aging population, increasing prevalence of comorbidities, and changes in antimicrobial resistance patterns, between the periods 1988 to 1990 and 2000 to 2002 the number of patients hospitalized for pneumonia grew by 20%, and pneumonia was the leading infectious cause of death.3, 4
Given its public health significance, pneumonia has been the subject of intensive quality measurement and improvement efforts for well over a decade. Two of the largest initiatives are the Centers for Medicare & Medicaid Services (CMS) National Pneumonia Project and The Joint Commission ORYX program.5, 6 These efforts have largely entailed measuring hospital performance on pneumonia‐specific processes of care, such as whether blood oxygen levels were assessed, whether blood cultures were drawn before antibiotic treatment was initiated, the choice and timing of antibiotics, and smoking cessation counseling and vaccination at the time of discharge. While measuring processes of care (especially when they are based on sound evidence), can provide insights about quality, and can help guide hospital improvement efforts, these measures necessarily focus on a narrow spectrum of the overall care provided. Outcomes can complement process measures by directing attention to the results of care, which are influenced by both measured and unmeasured factors, and which may be more relevant from the patient's perspective.79
In 2008 CMS expanded its public reporting initiatives by adding risk‐standardized hospital mortality rates for pneumonia to the Hospital Compare website (
Methods
Design, Setting, Subjects
We conducted a cross‐sectional study at the hospital level of the outcomes of care of fee‐for‐service patients hospitalized for pneumonia between July 2006 and June 2009. Patients are eligible to be included in the measures if they are 65 years or older, have a principal diagnosis of pneumonia (International Classification of Diseases, Ninth Revision, Clinical Modification codes 480.X, 481, 482.XX, 483.X, 485, 486, and 487.0), and are cared for at a nonfederal acute care hospital in the US and its organized territories, including Puerto Rico, Guam, the US Virgin Islands, and the Northern Mariana Islands.
The mortality measure excludes patients enrolled in the Medicare hospice program in the year prior to, or on the day of admission, those in whom pneumonia is listed as a secondary diagnosis (to eliminate cases resulting from complications of hospitalization), those discharged against medical advice, and patients who are discharged alive but whose length of stay in the hospital is less than 1 day (because of concerns about the accuracy of the pneumonia diagnosis). Patients are also excluded if their administrative records for the period of analysis (1 year prior to hospitalization and 30 days following discharge) were not available or were incomplete, because these are needed to assess comorbid illness and outcomes. The readmission measure is similar, but does not exclude patients on the basis of hospice program enrollment (because these patients have been admitted and readmissions for hospice patients are likely unplanned events that can be measured and reduced), nor on the basis of hospital length of stay (because patients discharged within 24 hours may be at a heightened risk of readmission).11, 12
Information about patient comorbidities is derived from diagnoses recorded in the year prior to the index hospitalization as found in Medicare inpatient, outpatient, and carrier (physician) standard analytic files. Comorbidities are identified using the Condition Categories of the Hierarchical Condition Category grouper, which sorts the more than 15,000 possible diagnostic codes into 189 clinically‐coherent conditions and which was originally developed to support risk‐adjusted payments within Medicare managed care.13
Outcomes
The patient outcomes assessed include death from any cause within 30 days of admission and readmission for any cause within 30 days of discharge. All‐cause, rather than disease‐specific, readmission was chosen because hospital readmission as a consequence of suboptimal inpatient care or discharge coordination may manifest in many different diagnoses, and no validated method is available to distinguish related from unrelated readmissions. The measures use the Medicare Enrollment Database to determine mortality status, and acute care hospital inpatient claims are used to identify readmission events. For patients with multiple hospitalizations during the study period, the mortality measure randomly selects one hospitalization to use for determination of mortality. Admissions that are counted as readmissions (i.e., those that occurred within 30 days of discharge following hospitalization for pneumonia) are not also treated as index hospitalizations. In the case of patients who are transferred to or from another acute care facility, responsibility for deaths is assigned to the hospital that initially admitted the patient, while responsibility for readmissions is assigned to the hospital that ultimately discharges the patient to a nonacute setting (e.g., home, skilled nursing facilities).
Risk‐Standardization Methods
Hierarchical logistic regression is used to model the log‐odds of mortality or readmission within 30 days of admission or discharge from an index pneumonia admission as a function of patient demographic and clinical characteristics and a random hospital‐specific intercept. This strategy accounts for within‐hospital correlation of the observed outcomes, and reflects the assumption that underlying differences in quality among the hospitals being evaluated lead to systematic differences in outcomes. In contrast to nonhierarchical models which ignore hospital effects, this method attempts to measure the influence of the hospital on patient outcome after adjusting for patient characteristics. Comorbidities from the index admission that could represent potential complications of care are not included in the model unless they are also documented in the 12 months prior to admission. Hospital‐specific mortality and readmission rates are calculated as the ratio of predicted‐to‐expected events (similar to the observed/expected ratio), multiplied by the national unadjusted rate, a form of indirect standardization.
The model for mortality has a c‐statistic of 0.72 whereas a model based on medical record review that was developed for validation purposes had a c‐statistic of 0.77. The model for readmission has a c‐statistic of 0.63 whereas a model based on medical review had a c‐statistic of 0.59. The mortality and readmission models produce similar state‐level mortality and readmission rate estimates as the models derived from medical record review, and can therefore serve as reasonable surrogates. These methods, including their development and validation, have been described fully elsewhere,14, 15 and have been evaluated and subsequently endorsed by the National Quality Forum.16
Identification of Geographic Regions
To characterize patterns of performance geographically we identified the 306 hospital referral regions for each hospital in our analysis using definitions provided by the Dartmouth Atlas of Health Care project. Unlike a hospital‐level analysis, the hospital referral regions represent regional markets for tertiary care and are widely used to summarize variation in medical care inputs, utilization patterns, and health outcomes and provide a more detailed look at variation in outcomes than results at the state level.17
Analyses
Summary statistics were constructed using frequencies and proportions for categorical data, and means, medians and interquartile ranges for continuous variables. To characterize 30‐day risk‐standardized mortality and readmission rates at the hospital‐referral region level, we calculated means and percentiles by weighting each hospital's value by the inverse of the variance of the hospital's estimated rate. Hospitals with larger sample sizes, and therefore more precise estimates, lend more weight to the average. Hierarchical models were estimated using the SAS GLIMMIX procedure. Bayesian shrinkage was used to estimate rates in order to take into account the greater uncertainty in the true rates of hospitals with small caseloads. Using this technique, estimated rates at low volume institutions are shrunken toward the population mean, while hospitals with large caseloads have a relatively smaller amount of shrinkage and the estimate is closer to the hospital's observed rate.18
To determine whether a hospital's performance is significantly different than the national rate we measured whether the 95% interval estimate for the risk‐standardized rate overlapped with the national crude mortality or readmission rate. This information is used to categorize hospitals on Hospital Compare as better than the US national rate, worse than the US national rate, or no different than the US national rate. Hospitals with fewer than 25 cases in the 3‐year period, are excluded from this categorization on Hospital Compare.
Analyses were conducted with the use of SAS 9.1.3 (SAS Institute Inc, Cary, NC). We created the hospital referral region maps using ArcGIS version 9.3 (ESRI, Redlands, CA). The Human Investigation Committee at the Yale School of Medicine approved an exemption for the authors to use CMS claims and enrollment data for research analyses and publication.
Results
Hospital‐Specific Risk‐Standardized 30‐Day Mortality and Readmission Rates
Of the 1,118,583 patients included in the mortality analysis 129,444 (11.6%) died within 30 days of hospital admission. The median (Q1, Q3) hospital 30‐day risk‐standardized mortality rate was 11.1% (10.0%, 12.3%), and ranged from 6.7% to 20.9% (Table 1, Figure 1). Hospitals at the 10th percentile had 30‐day risk‐standardized mortality rates of 9.0% while for those at the 90th percentile of performance the rate was 13.5%. The odds of all‐cause mortality for a patient treated at a hospital that was one standard deviation above the national average was 1.68 times higher than that of a patient treated at a hospital that was one standard deviation below the national average.
| Mortality | Readmission | |
|---|---|---|
| ||
| Patients (n) | 1118583 | 1161817 |
| Hospitals (n) | 4788 | 4813 |
| Patient age, years, median (Q1, Q3) | 81 (74,86) | 80 (74,86) |
| Nonwhite, % | 11.1 | 11.1 |
| Hospital case volume, median (Q1, Q3) | 168 (77,323) | 174 (79,334) |
| Risk‐standardized hospital rate, mean (SD) | 11.2 (1.2) | 18.3 (0.9) |
| Minimum | 6.7 | 13.6 |
| 1st percentile | 7.5 | 14.9 |
| 5th percentile | 8.5 | 15.8 |
| 10th percentile | 9.0 | 16.4 |
| 25th percentile | 10.0 | 17.2 |
| Median | 11.1 | 18.2 |
| 75th percentile | 12.3 | 19.2 |
| 90th percentile | 13.5 | 20.4 |
| 95th percentile | 14.4 | 21.1 |
| 99th percentile | 16.1 | 22.8 |
| Maximum | 20.9 | 26.7 |
| Model fit statistics | ||
| c‐Statistic | 0.72 | 0.63 |
| Intrahospital Correlation | 0.07 | 0.03 |
For the 3‐year period 2006 to 2009, 222 (4.7%) hospitals were categorized as having a mortality rate that was better than the national average, 3968 (83.7%) were no different than the national average, 221 (4.6%) were worse and 332 (7.0%) did not meet the minimum case threshold.
Among the 1,161,817 patients included in the readmission analysis 212,638 (18.3%) were readmitted within 30 days of hospital discharge. The median (Q1,Q3) 30‐day risk‐standardized readmission rate was 18.2% (17.2%, 19.2%) and ranged from 13.6% to 26.7% (Table 1, Figure 2). Hospitals at the 10th percentile had 30‐day risk‐standardized readmission rates of 16.4% while for those at the 90th percentile of performance the rate was 20.4%. The odds of all‐cause readmission for a patient treated at a hospital that was one standard deviation above the national average was 1.40 times higher than the odds of all‐cause readmission if treated at a hospital that was one standard deviation below the national average.
For the 3‐year period 2006 to 2009, 64 (1.3%) hospitals were categorized as having a readmission rate that was better than the national average, 4203 (88.2%) were no different than the national average, 163 (3.4%) were worse and 333 (7.0%) had less than 25 cases and were therefore not categorized.
While risk‐standardized readmission rates were substantially higher than risk‐standardized mortality rates, mortality rates varied more. For example, the top 10% of hospitals had a relative mortality rate that was 33% lower than those in the bottom 10%, as compared with just a 20% relative difference for readmission rates. The coefficient of variation, a normalized measure of dispersion that unlike the standard deviation is independent of the population mean, was 10.7 for risk‐standardized mortality rates and 4.9 for readmission rates.
Regional Risk‐Standardized 30‐Day Mortality and Readmission Rates
Figures 3 and 4 show the distribution of 30‐day risk‐standardized mortality and readmission rates among hospital referral regions by quintile. Highest mortality regions were found across the entire country, including parts of Northern New England, the Mid and South Atlantic, East and the West South Central, East and West North Central, and the Mountain and Pacific regions of the West. The lowest mortality rates were observed in Southern New England, parts of the Mid and South Atlantic, East and West South Central, and parts of the Mountain and Pacific regions of the West (Figure 3).
Readmission rates were higher in the eastern portions of the US (including the Northeast, Mid and South Atlantic, East South Central) as well as the East North Central, and small parts of the West North Central portions of the Midwest and in Central California. The lowest readmission rates were observed in the West (Mountain and Pacific regions), parts of the Midwest (East and West North Central) and small pockets within the South and Northeast (Figure 4).
Discussion
In this 3‐year analysis of patient, hospital, and regional outcomes we observed that pneumonia in the elderly remains a highly morbid illness, with a 30‐day mortality rate of approximately 11.6%. More notably we observed that risk‐standardized mortality rates, and to a lesser extent readmission rates, vary significantly across hospitals and regions. Finally, we observed that readmission rates, but not mortality rates, show strong geographic concentration.
These findings suggest possible opportunities to save or extend the lives of a substantial number of Americans, and to reduce the burden of rehospitalization on patients and families, if low performing institutions were able to achieve the performance of those with better outcomes. Additionally, because readmission is so common (nearly 1 in 5 patients), efforts to reduce overall health care spending should focus on this large potential source of savings.19 In this regard, impending changes in payment to hospitals around readmissions will change incentives for hospitals and physicians that may ultimately lead to lower readmission rates.20
Previous analyses of the quality of hospital care for patients with pneumonia have focused on the percentage of eligible patients who received guideline‐recommended antibiotics within a specified time frame (4 or 8 hours), and vaccination prior to hospital discharge.21, 22 These studies have highlighted large differences across hospitals and states in the percentage receiving recommended care. In contrast, the focus of this study was to compare risk‐standardized outcomes of care at the nation's hospitals and across its regions. This effort was guided by the notion that the measurement of care outcomes is an important complement to process measurement because outcomes represent a more holistic assessment of care, that an outcomes focus offers hospitals greater autonomy in terms of what processes to improve, and that outcomes are ultimately more meaningful to patients than the technical aspects of how the outcomes were achieved. In contrast to these earlier process‐oriented efforts, the magnitude of the differences we observed in mortality and readmission rates across hospitals was not nearly as large.
A recent analysis of the outcomes of care for patients with heart failure and acute myocardial infarction also found significant variation in both hospital and regional mortality and readmission rates.23 The relative differences in risk‐standardized hospital mortality rates across the 10th to 90th percentiles of hospital performance was 25% for acute myocardial infarction, and 39% for heart failure. By contrast, we found that the difference in risk‐standardized hospital mortality rates across the 10th to 90th percentiles in pneumonia was an even greater 50% (13.5% vs. 9.0%). Similar to the findings in acute myocardial infarction and heart failure, we observed that risk‐standardized mortality rates varied more so than did readmission rates.
Our study has a number of limitations. First, the analysis was restricted to Medicare patients only, and our findings may not be generalizable to younger patients. Second, our risk‐adjustment methods relied on claims data, not clinical information abstracted from charts. Nevertheless, we assessed comorbidities using all physician and hospital claims from the year prior to the index admission. Additionally our mortality and readmission models were validated against those based on medical record data and the outputs of the 2 approaches were highly correlated.15, 24, 25 Our study was restricted to patients with a principal diagnosis of pneumonia, and we therefore did not include those whose principal diagnosis was sepsis or respiratory failure and who had a secondary diagnosis of pneumonia. While this decision was made to reduce the risk of misclassifying complications of care as the reason for admission, we acknowledge that this is likely to have limited our study to patients with less severe disease, and may have introduced bias related to differences in hospital coding practices regarding the use of sepsis and respiratory failure codes. While we excluded patients with 1 day length of stay from the mortality analysis to reduce the risk of including patients in the measure who did not actually have pneumonia, we did not exclude them from the readmission analysis because very short length of stay may be a risk factor for readmission. An additional limitation of our study is that our findings are primarily descriptive, and we did not attempt to explain the sources of the variation we observed. For example, we did not examine the extent to which these differences might be explained by differences in adherence to process measures across hospitals or regions. However, if the experience in acute myocardial infarction can serve as a guide, then it is unlikely that more than a small fraction of the observed variation in outcomes can be attributed to factors such as antibiotic timing or selection.26 Additionally, we cannot explain why readmission rates were more geographically distributed than mortality rates, however it is possible that this may be related to the supply of physicians or hospital beds.27 Finally, some have argued that mortality and readmission rates do not necessarily reflect the very quality they intend to measure.2830
The outcomes of patients with pneumonia appear to be significantly influenced by both the hospital and region where they receive care. Efforts to improve population level outcomes might be informed by studying the practices of hospitals and regions that consistently achieve high levels of performance.31
Acknowledgements
The authors thank Sandi Nelson, Eric Schone, and Marian Wrobel at Mathematicia Policy Research and Changquin Wang and Jinghong Gao at YNHHS/Yale CORE for analytic support. They also acknowledge Shantal Savage, Kanchana Bhat, and Mayur M. Desai at Yale, Joseph S. Ross at the Mount Sinai School of Medicine, and Shaheen Halim at the Centers for Medicare and Medicaid Services.
- , , , , . HCUP Facts and Figures: Statistics on Hospital‐based Care in the United States, 2007 [Internet]. 2009 [cited 2009 Nov 7]. Available at: http://www.hcup‐us.ahrq.gov/reports.jsp. Accessed June2010.
- Agency for Healthcare Research and Quality. HCUP Nationwide Inpatient Sample (NIS). Healthcare Cost and Utilization Project (HCUP). [Internet]. 2007 [cited 2010 May 13]. Available at: http://www.hcup‐us.ahrq.gov/nisoverview.jsp. Accessed June2010.
- , , , , .Trends in hospitalizations for pneumonia among persons aged 65 years or older in the United States, 1988‐2002.JAMA.20057;294(21):2712–2719.
- . Deaths: Leading Causes for 2006. NVSS [Internet]. 2010 Mar 31;58(14). Available at: http://www.cdc.gov/nchs/data/nvsr/nvsr58/nvsr58_ 14.pdf. Accessed June2010.
- Centers for Medicare and Medicaid Services. Pneumonia [Internet]. [cited 2010 May 13]. Available at: http://www.qualitynet.org/dcs/ContentServer?cid= 108981596702326(1):75–85.
- , , .Performance measures for pneumonia: are they valuable, and are process measures adequate?Curr Opin Infect Dis.2007;20(2):182–189.
- , .Relationship Between Medicare's Hospital Compare Performance Measures and Mortality Rates.JAMA.2006;296(22):2694–2702.
- Medicare.gov ‐ Hospital Compare [Internet]. [cited 2009 Nov 6]. Available at: http://www.hospitalcompare.hhs.gov/Hospital/Search/Welcome.asp? version=default 2010. Available at: http://www.qualitynet.org/dcs/ContentServer? c=Page 2010. Available at: http://www.qualitynet.org/dcs/ContentServer? c=Page 2000 [cited 2009 Nov 7]. Available at: http://www.cms.hhs.gov/Reports/Reports/ItemDetail.asp?ItemID=CMS023176. Accessed June2010.
- , , , et al. Risk‐Adjustment Methodology for Hospital Monitoring/Surveillance and Public Reporting Supplement #1: 30‐Day Mortality Model for Pneumonia [Internet]. Yale University; 2006. Available at: http://www.qualitynet.org/dcs/ContentServer?c= Page 2008. Available at: http://www.qualitynet.org/dcs/ContentServer?c= Page1999.
- , .Statistical and clinical aspects of hospital outcomes profiling.Stat Sci.2007;22(2):206–226.
- Medicare Payment Advisory Commission. Report to the Congress: Promoting Greater Efficiency in Medicare.2007 June.
- Patient Protection and Affordable Care Act [Internet]. 2010. Available at: http://thomas.loc.gov. Accessed June2010.
- , , , et al.Quality of medical care delivered to medicare beneficiaries: a profile at state and national levels.JAMA.2000;284(13):1670–1676.
- , , , .Care in U.S. hospitals — the hospital quality alliance program.N Engl J Med.2005;353(3):265–274.
- , , , et al.Patterns of hospital performance in acute myocardial infarction and heart failure 30‐day mortality and readmission.Circ Cardiovasc Qual Outcomes.2009;2(5):407–413.
- , , , et al.An administrative claims model suitable for profiling hospital performance based on 30‐day mortality rates among patients with heart failure.Circulation.2006;113(13):1693–1701.
- , , , et al.An administrative claims model suitable for profiling hospital performance based on 30‐day mortality rates among patients with an acute myocardial infarction.Circulation.2006;113(13):1683–1692.
- , , , et al.Hospital quality for acute myocardial infarction: correlation among process measures and relationship with short‐term mortality.JAMA.2006;296(1):72–78.
- , , , .Hospital readmission rates for cohorts of medicare beneficiaries in Boston and New Haven.N Engl J Med.1994;331(15):989–995.
- , .Research evidence on the validity of risk‐adjusted mortality rate as a measure of hospital quality of care.Med Care Res Rev.1998;55(4):371–404.
- , .Hospital readmissions as a measure of quality of health care: advantages and limitations.Arch Intern Med.2000;160(8):1074–1081.
- , .Hospital mortality: when failure is not a good measure of success.CMAJ.2008;179(2):153–157.
- , , , , , .Research in action: using positive deviance to improve quality of health care.Implement Sci.2009;4:25.
- , , , , . HCUP Facts and Figures: Statistics on Hospital‐based Care in the United States, 2007 [Internet]. 2009 [cited 2009 Nov 7]. Available at: http://www.hcup‐us.ahrq.gov/reports.jsp. Accessed June2010.
- Agency for Healthcare Research and Quality. HCUP Nationwide Inpatient Sample (NIS). Healthcare Cost and Utilization Project (HCUP). [Internet]. 2007 [cited 2010 May 13]. Available at: http://www.hcup‐us.ahrq.gov/nisoverview.jsp. Accessed June2010.
- , , , , .Trends in hospitalizations for pneumonia among persons aged 65 years or older in the United States, 1988‐2002.JAMA.20057;294(21):2712–2719.
- . Deaths: Leading Causes for 2006. NVSS [Internet]. 2010 Mar 31;58(14). Available at: http://www.cdc.gov/nchs/data/nvsr/nvsr58/nvsr58_ 14.pdf. Accessed June2010.
- Centers for Medicare and Medicaid Services. Pneumonia [Internet]. [cited 2010 May 13]. Available at: http://www.qualitynet.org/dcs/ContentServer?cid= 108981596702326(1):75–85.
- , , .Performance measures for pneumonia: are they valuable, and are process measures adequate?Curr Opin Infect Dis.2007;20(2):182–189.
- , .Relationship Between Medicare's Hospital Compare Performance Measures and Mortality Rates.JAMA.2006;296(22):2694–2702.
- Medicare.gov ‐ Hospital Compare [Internet]. [cited 2009 Nov 6]. Available at: http://www.hospitalcompare.hhs.gov/Hospital/Search/Welcome.asp? version=default 2010. Available at: http://www.qualitynet.org/dcs/ContentServer? c=Page 2010. Available at: http://www.qualitynet.org/dcs/ContentServer? c=Page 2000 [cited 2009 Nov 7]. Available at: http://www.cms.hhs.gov/Reports/Reports/ItemDetail.asp?ItemID=CMS023176. Accessed June2010.
- , , , et al. Risk‐Adjustment Methodology for Hospital Monitoring/Surveillance and Public Reporting Supplement #1: 30‐Day Mortality Model for Pneumonia [Internet]. Yale University; 2006. Available at: http://www.qualitynet.org/dcs/ContentServer?c= Page 2008. Available at: http://www.qualitynet.org/dcs/ContentServer?c= Page1999.
- , .Statistical and clinical aspects of hospital outcomes profiling.Stat Sci.2007;22(2):206–226.
- Medicare Payment Advisory Commission. Report to the Congress: Promoting Greater Efficiency in Medicare.2007 June.
- Patient Protection and Affordable Care Act [Internet]. 2010. Available at: http://thomas.loc.gov. Accessed June2010.
- , , , et al.Quality of medical care delivered to medicare beneficiaries: a profile at state and national levels.JAMA.2000;284(13):1670–1676.
- , , , .Care in U.S. hospitals — the hospital quality alliance program.N Engl J Med.2005;353(3):265–274.
- , , , et al.Patterns of hospital performance in acute myocardial infarction and heart failure 30‐day mortality and readmission.Circ Cardiovasc Qual Outcomes.2009;2(5):407–413.
- , , , et al.An administrative claims model suitable for profiling hospital performance based on 30‐day mortality rates among patients with heart failure.Circulation.2006;113(13):1693–1701.
- , , , et al.An administrative claims model suitable for profiling hospital performance based on 30‐day mortality rates among patients with an acute myocardial infarction.Circulation.2006;113(13):1683–1692.
- , , , et al.Hospital quality for acute myocardial infarction: correlation among process measures and relationship with short‐term mortality.JAMA.2006;296(1):72–78.
- , , , .Hospital readmission rates for cohorts of medicare beneficiaries in Boston and New Haven.N Engl J Med.1994;331(15):989–995.
- , .Research evidence on the validity of risk‐adjusted mortality rate as a measure of hospital quality of care.Med Care Res Rev.1998;55(4):371–404.
- , .Hospital readmissions as a measure of quality of health care: advantages and limitations.Arch Intern Med.2000;160(8):1074–1081.
- , .Hospital mortality: when failure is not a good measure of success.CMAJ.2008;179(2):153–157.
- , , , , , .Research in action: using positive deviance to improve quality of health care.Implement Sci.2009;4:25.
Copyright © 2010 Society of Hospital Medicine
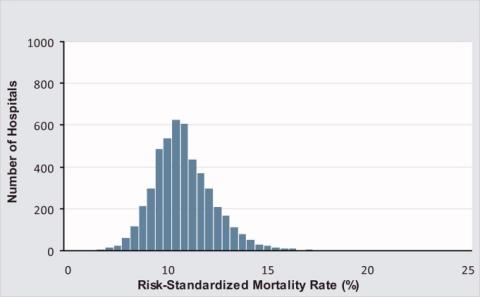
Care Coordination Under Comanagement
Technological advances drive medical providers to specialize through the need for proficiency around increasingly focused areas of expertise.1 But the benefits of specialization are attained only by balancing the advantages of increasing expertise and the costs of coordinating care that must be borne as specialization increases.2 Integrating experts into modern medical delivery systems requires attention to the coordinating mechanisms that govern team‐based care.3
Coordination, defined as the management of task interdependencies,4 is a central component and a useful measure of teamwork.5 Several studies demonstrate the patient‐level impact of coordination among providers.69 Gittell et al.8 demonstrated that orthopedic hospitals whose staff had better relational coordination (RC) measures had shorter lengths of stay and better post‐operative pain control for patients undergoing surgery. In medical intensive care units (ICUs), Wheelan et al.9 showed that staff members of units with lower mortality rates perceived their teams as functioning at higher stages of group development and perceived their team members as less dependent and more trusting.
Communication is the cornerstone of effective team coordination.10, 11 As such, practice model interventions that facilitate frequent communication of higher quality are associated with lower error rates10 and better teamwork.11 The use of hospitalists, for example, is shown to capitalize on this advantage by improving coordination through physician availability that facilitates communication and relational interactions among hospital‐based staff.12 While system‐level interventions such as this have received significant attention from experts in organizations, empirical studies that explore the contribution of team member characteristics to overall coordination are lacking.13
Inpatient comanagement services offer a unique model for studying teamwork. While the label is used to describe a variety of arrangements,1416 comanagement broadly describes a practice model wherein providers of various specialties deliver direct care to patients, in contrast to the traditional generalist‐consultant model in which specialists lend expertise.17 Many recent comanagement practices involve hospitalists in partnership with surgeons in the care of patients with concurrent medical and surgical needs,18 but similar arrangements between hospitalists and medical subspecialists are being adopted in some medical centers for the care of complex patients with conditions such as heart failure, cancer, stroke, and solid organ transplantations. Coordination among providers has not been studied in this context.
The goals of this study are: (1) to measure the input of individual providers to the overall coordination of care on a highly interdependent medical comanagement service, (2) to characterize high and low coordinators, and (3) to explore the relationship between coordination and patient outcomes. The main hypothesis is that the quality of team coordination is determined partly by the attributes of its members such that their individual contributions to the coordination of care affect the outcomes of vulnerable hospitalized patients.
Materials and Methods
Setting
The study was conducted at the University of Chicago Medical Center, Chicago, IL, an urban 572‐bed tertiary care hospital. The comanaged multidisciplinary inpatient service serves hospitalized patients with complex medical needs. This study focused on providers and patients from a subset of the comanaged multidisciplinary inpatient service that involved the collaboration of medical hepatologists with hospitalists. A hepatology team, composed of an attending hepatologist and a fellow, comanaged with 2 hospitalist teams, each composed of an attending hospitalist and 1 or 2 nonphysician providers (NPPs). Attending physicians rotated on the service in 1‐week to 3‐week rotations, while fellows rotated in 4‐week stretches. NPPs worked nonuniform 3‐day or 4‐day weeks excluding weekends and holidays. The hepatology team was responsible for arranging admissions, developing a care plan with a specialty focus, coordinating care with transplant surgeons when necessary, and managing post‐discharge care. The hospitalist teams were responsible for admitting patients, managing routine and emergent inpatient issues, coordinating care with ancillary and consultative staff, and discharging patients. Dedicated evening and night hospitalists, who were not part of the comanaging day‐time teams, provided after‐hours care. Outside of these areas, there was no instruction or education about how responsibilities should be shared among providers on the service.
Subjects and Study Design
Baseline Survey of Providers
All hospitalists, NPPs, hepatologists, and fellows scheduled to rotate on the comanaged multidisciplinary inpatient service signed a written consent to participate. In April 2008 a nonanonymous baseline 17‐item paper survey was administered.
Items of the Baseline Survey (supporting information Appendix A) were generated from a consideration of the most salient issues around the management structure of comanagement models from a comprehensive review the literature. Two items addressed the respondents' experience and intent to leave their role. Twelve items addressed their preferences about the provider management structure of an ideally comanaged inpatient service, specifically soliciting their preferences about a single physician leader, consensus seeking, and their preferred degree of information, participation, and decision making under the model. Included in this set of items was a single item assessment of the provider's sense of patient ownership on an ideally comanaged service. The final 3 items addressed the perceived assignment of responsibilities. Each of these items presented a clinical objective followed by up to 7 contingent tasks on whose completion the successful execution of the objective depended. Each respondent was asked to indicate one or more of the 4 provider types that should be responsible for completing each task.
Repeated Survey of Providers
From April to October 2008, providers who rotated on the comanaged liver service were surveyed repeatedly to give information about the actual management structure and coordination within teams, which consisted of combinations of randomly assigned providers. Physicians were surveyed on the day when any 1 of the 3 physician types ended his or her rotation. NPPs were surveyed every Wednesday except on the weeks when none of the physicians had changed since the previous survey. One investigator (KH) hand‐delivered the surveys, usually during the first minutes of the joint daily rounds and collected them immediately upon completion. Surveys that could not be completed immediately were collected on daily rounds on subsequent days within 1 week. The primary reason for nonresponse was lost surveys that were not immediately completed.
The 14‐item Repeated Survey (supporting information Appendix B) consisted of 2 parts. The first 7 items reprised items from the Baseline Survey that addressed management structures, but were rephrased to allow respondents to report their experiences on their immediate rotation. The second part of the Repeated Survey addressed RC, which is described below.
The study protocols, consents, and data collection mechanisms were approved by the institutional review board of the University of Chicago Medical Center. Collection of patient information was designed to comply with the Health Insurance Portability and Accountability Act of 1996.
Patients
Patients were admitted to 1 of the 2 hospitalist teams on the comanaged service on alternating days, which allowed patients to be assigned to providers pseudo‐randomly. Consent to use clinical data was obtained during their stay or by telephone after discharge. If patients were unable to provide consent due to cognitive impairment, consent was sought through designated proxies.19
Main Measurements
Relational Care Coordination
The survey instrument used to measure individual contributions to overall coordination was adapted from the Relational Coordination tool developed by Gittell.20 This instrument was chosen because it has already been validated in various clinical contexts8, 12, 21 and the theoretical assumptions about the independent relational and communication components of coordination are applicable to our context. RC is characterized by the 7 domains of frequent, timely, accurate, and problem‐solving communications; shared goals, shared knowledge, and mutual respect. Respondents rated, on a 5‐point scale (1 = negative, 5 = positive), team members of the other 3 provider types during each rotation on all of the 7 domains. The mean across the domains yielded the RC score. Although the instrument was originally developed to measure the coordination in groups of individuals, the RC for a single provider was calculated by taking the mean of all the RC directed at that individual across team members who worked with him or her during the study period. Because some providers worked more rotations than others, a nonuniform number of observations contributed to the calculation of individual RC (Table 1). For each provider type, individuals were ranked on their RC and categorized in tertiles representing high, middle, and low coordinators.
| Baseline Survey (%) | Repeated Surveys (%) | % Female | Years Experience Median (range) | # RC Evaluations of Each Provider Median (range) | RC Mean (range) | |
|---|---|---|---|---|---|---|
| ||||||
| Hospitalists | 15/15 (100) | 36/43 (84) | 42 | 1 (0‐10) | 6 (3‐21) | 4.71 (4.33‐4.94) |
| NPPs | 5/5 (100) | 92/97 (95) | 100 | 4 (2‐15) | 30 (23‐34) | 4.60 (4.48‐4.71) |
| Hepatologists | 6/6 (100) | 26/42 (62) | 33 | 7 (1‐25) | 16 (5‐51) | 4.37 (4.03‐4.59) |
| GI fellows | 6/6 (100) | 23/42 (55) | 48 | 1 (0‐1) | 19 (8‐37) | 4.28 (3.88‐4.53) |
| Total | 32/32 (100) | 177/223 (79) | 55 | 2 (0‐25) | 12.5 (3‐51) | 4.57 (3.88‐4.94) |
Statistical Analysis
The discriminating ability of the RC for individuals was assessed by comparing the highest and lowest RC of each provider type using the 2‐tailed t‐test. The difference in responses to items from the Baseline and Repeated Surveys by individual RC tertiles was assessed with the Chi‐squared test for categorical data and the 2‐tailed t‐test for comparing means. For each physician type, the frequency of the composite bad outcomes between the highest and lowest RC tertile categories were compared using a 2‐sample Wilcoxon rank‐sum (Mann‐Whitney) test for nonparametric data.
Results
All 32 providers (100%) completed the Baseline Survey and participated in the Repeated Surveys of which 177/224 (79%) were completed. The median number of surveys that contributed to the calculation of individual RC and the mean RC by provider type are summarized in Table 1.
Of the 119 patients managed on the service, the mean age (standard deviation [SD]) was 55 (14) years and 48% were women. Of the 201 hospitalizations, there were 13 floor‐to‐ICU transfers and 5 in‐hospital deaths, however, we excluded from the analysis 1 death of a patient who was admitted under inpatient hospice status.
RC Measures
Individual provider RC ranges were 4.33 to 4.94 (p = 0.05) for hospitalists; 4.48 to 4.71 (p = 0.10) for NP/PAs; 4.03 to 4.59 (p < 0.01) for hepatologists; and 3.88 to 4.52 (p = 0.02) for fellows. The high, middle, and low coordinator categories for each provider type were shown to be durable through time by demonstrating that the coordination ranking of individuals was essentially preserved even when using partial data from each half of the study period. Thus, RC appears to reflect a stable attribute of the provider as opposed to specific circumstances of the rotation. The categories were shown to be durable to the influences of bad outcomes (inpatient deaths and ICU transfers) by demonstrating that the placement of individuals into 1 of the 3 coordination categories were preserved even when data from rotations involving a bad outcome were removed. Nonetheless, in order to address the possibility of bad outcomes negatively affecting perception of coordination, all analysis involving RC used the values that excluded data from these rotations.
Characteristics of Good and Poor Coordinators
Patient Ownership
The single‐item measure of patient ownership in the Baseline Survey reads: I have as much a sense of ownership of my patients on the comanaged service as on a non‐comanaged service. The majority of providers of every type in the high and middle coordinator categories agreed, while providers in the low coordinator category generally disagreed with the statement. The aggregated responses of all the provider types are shown in Table 2.
| Agree | Somewhat Agree | Somewhat Disagree | Disagree | |
|---|---|---|---|---|
| High | 4 | 6 | 0 | 1 |
| Middle | 5 | 4 | 0 | 2 |
| Low | 2 | 0 | 4 | 4 |
| p < 0.01 |
Leadership
Hepatologists are the potential leader of the comanaged team because of their content expertise in liver diseases. Their responses to the 3 items in the Baseline Survey that addressed perceived assignment of responsibilities are shown in Table 3. The high compared to the low coordinator hepatologists delegated the responsibility of completing necessary tasks to more providers, overall, such that an average of 3 providers were redundantly held responsible for the completion of each task by the high coordinators while only 1 provider was held responsible by the low coordinators. Furthermore, the high coordinators delegated the responsibility of completing more tasks to themselves compared to the low coordinators.
| Hepatologists | Mean # of Tasks Delegated Overall, n (SD) | Mean # of Providers Delegated to Each Task, n (SD) | Mean # of Tasks Delegated to Self, n (SD) |
|---|---|---|---|
| |||
| High (n = 2) | 56 (0.0) | 2.9 (0.0) | 11.5 (2.1) |
| Middle (n = 2) | 35 (2.8) | 1.8 (0.2) | 9.5 (3.5) |
| Low (n = 2) | 19 (1.4) | 1.0 (0.1) | 4.5 (2.1) |
| p value(high vs. low) | <0.01 | <0.01 | 0.08 |
According to responses to the management structure items of the Repeated Surveys, more providers of every type indicated that a single physician leader directed the overall management of every patient when a high or middle coordinator hospitalist was on service as opposed to a service with a low coordinator hospitalist (high 76% vs. middle 73% vs. low 58%, P = 0.06). Furthermore, a low coordinator hospitalist on service was more likely to indicate a desire for greater influence in directing the management of patients (desire influence 93% vs. not 7%, P < 0.01). This pattern was also seen with low coordinator NPPs, who more often indicated a desire for greater influence in directing patient management (desire influence 100% vs. not 0%, P < 0.01).
Experience
Age, years in practice, years at the institution, and time spent on the comanaged service were not associated with RC in our small sample of providers.
Outcomes by Provider Coordination
The unit of analysis in this section is the team‐patient encounter, which is the consecutive days during which a unique assortment of physicians managed a patient's hospitalization. NPPs could not be associated with any single team due to their nonuniform work patterns. The 201 hospitalizations in this study were composed of 351 team‐patient encounters. Table 4 displays the unadjusted frequency of inpatient deaths and ICU transfers that occurred during these encounters by RC tertiles. In each of the 3 physician types, composite bad outcomes are most frequent among the lowest coordinators. The pattern is statistically significant for hospitalists.
| Team‐Patient Encounters, n | Mean Length of Encounter, n (days) | ICU Transfer, n (%) | Hospital Death, n (%) | Bad Outcome, n (%) | |
|---|---|---|---|---|---|
| |||||
| Hospitalists | |||||
| High (n = 5) | 92 | 3.1 | 1 (1.1) | 1 (1.1) | 1 (1.1) |
| Middle (n = 5) | 119 | 3.2 | 1 (0.8) | 1 (0.8) | 1 (0.8) |
| Low (n = 5) | 140 | 3.2 | 11 (7.9) | 2 (1.4) | 12 (8.6) |
| p value (high vs. low) | NA | 0.70 | 0.02 | 0.82 | 0.02 |
| Hepatologists | |||||
| High (n = 2) | 99 | 3.2 | (2.0) | 0 (0.0) | 2 (2.0) |
| Middle (n = 2) | 79 | 3.4 | 3 (3.0) | 1 (1.3) | 3 (3.0) |
| Low (n = 2) | 173 | 3.0 | 8 (4.6) | 3 (1.7) | 9 (5.2) |
| p value (high vs. low) | NA | 0.52 | 0.27 | 0.19 | 0.20 |
| GI fellows | |||||
| High (n = 2) | 111 | 3.1 | 2 (1.8) | 0 (0.0) | 2 (1.8) |
| Middle (n = 2) | 67 | 3.3 | 2 (3.0) | 1 (1.5) | 2 (3.0) |
| Low (n = 2) | 173 | 3.2 | 9 (5.2) | 3 (1.7) | 10 (5.8) |
| p value (high vs. low) | NA | 0.74 | 0.15 | 0.16 | 0.10 |
Another interesting observation is the largest number of encounters in the lowest coordination tertile of each physician type. While the reason for this finding is not clear, associations between work‐load and poor coordination evoke issues related to burnout. In order to address the possibility of an artifactually elevated probability of a bad outcome among providers who rotated through the service more often, we calculated the correlation between the number of encounter‐days and the frequency of bad outcomes for the 15 providers who were associated with at last one such event. If these events occurred by chance, we should find a positive correlation between its frequency and the number of encounters. The Pearson's correlation coefficient of 0.38 suggests that bad outcomes do not occur more frequently with providers who work more rotations by chance alone.
Discussion
By adapting Gittell's RC instrument to focus on individual providers, we found that their characteristic attributes such as preference for particular management styles, leadership quality, and patient ownership are associated with their externally perceived contributions to the overall coordination of care. In an unadjusted analysis, we also observed an intriguing trend towards more frequent major hospital complications when the worst coordinators of each physician type were on service.
Existing evidence22, 23 mostly summarized in a recent RAND Health report shows a weak association between clinical teamwork quality and patient mortality. While our data also support this association, it does so with limitations. Most importantly, the small sample size limited our ability to rigorously account for potential confounders that may have contributed to this apparent association. Further studies may better address whether or not bad outcomes are indeed associated with poor coordinators in highly interdependent clinical teams. In addition to confounding, the small sample size of providers makes the analysis vulnerable to type 1 errors. We addressed this issue by intensively surveying providers repeatedly to achieve a high resolution of the coordination and management structure measures from each comanaged team. The potential for omitted variables and reverse causality in that the coordination scores may be negatively influenced by particularly complex patients and bad outcomes remains a valid concern. We addressed this by confirming the stability of provider RC over time and excluding the RC data from rotations with a bad outcome, but the negative perception of an individual tied to past bad outcomes may persist beyond a particular rotation. Survey responses are subject to recall and hindsight biases, which we attempted to minimize by surveying respondents immediately after each team rotation. Finally, all of our findings may be not be generalizable to other comanagement settings. However, the important correlations between coordination and quality have been observed in other contexts.24, 25
In our study, in‐hospital deaths and ICU transfers are treated as consequences of uncoordinated care. This interpretation may be problematic for circumstances when death is inevitable no matter how well coordinated the care, or when transfer to a higher level of care is appropriate. The rationale for grouping the 2 events into 1 composite bad outcome is based on the assumption that both death and the escalation of care can be delayed to an extent, if not wholly prevented, with the coordinated utilization of a modern hospital's resources. The attribution of these events to poor coordinators may indicate the unraveling of coordination that normally must be maintained to help patients overcome decompensating events that are particularly common in the course of patients with severe liver diseases. Due to the exploratory nature of this analysis, additional studies are necessary to fully characterize the relationship between care coordination and care transfers.
An important implication of this study is that the communication skill and ethical disposition of each individual provider is relevant to the coordination that is sought in multi‐provider teams. Training medical professionals to be better team members may have direct impact on the patients they serve. Our finding about patient ownership suggests that commitment to patients in the framework of care is not merely tradition but a characteristic of competent physicians. Moreover, physicians' commitment to patients is a possible factor, not just in achieving patients' satisfaction, but in securing better outcomes. To that end, the teaching of this and other humanistic principles must remain a vital part of medical education at all levels of training.
Several implications about team leadership and hierarchy are apparent from the data. Findings around the perceived assignment of responsibilities show that high coordinator hepatologists acknowledge the advantages of overlapping task boundaries to prevent critical tasks from being missed and risking bad outcomes. High RC hepatologists in our study adopted a more participatory than supervisory role which presumably facilitated better coordination by transmitting organizational goals to other team members. The function of a comanaged team is likely to be enhanced by a fluid assignment of roles to better handle tasks with high uncertainty. Accordingly, comanagement models of care may not be appropriate in settings where tasks are not interdependent.26 Inherent hierarchy appears to be a feature of well coordinated teams. One possible interpretation of our data is that hospitalists who yield the leadership role to the hepatologist are perceived to be better coordinators and that those who insist on exerting more influence in team decisions are perceived to be poor coordinators.
Existing evidence around care coordination predicts that comanagement designs improve provider coordination through stage‐based and site‐based specialization.12 However, the mechanisms that mediate coordination and patient outcomes are not clear. Moreover, the mechanisms of coordinating multi‐disciplinary teams may be specific to each clinical setting. The role of individual provider characteristics on coordination deserves more attention. Similarly, the impact of organizational culture under which favorable provider characteristics thrive is unknown. Finally, a detailed exposition of patient ownership and the role patients play in affecting the coordination of healthcare resources needs further exploration.
- .Technology, specialization, and the allied health professions.J Allied Health.1983;12(3):177–182.
- .Hospitalists and the doctor‐patient relationship.J Legal Stud.2001;30:589–606.
- .From Chaos to Care: The Promise of Team‐Based medicine.Cambridge, MA:Perseus;2002.
- ,,.Determinants of coordination modes within organizations.Am Sociol Rev.1976;41:322–338.
- .Teamwork and patient safety in dynamic domains of healthcare: a review of the literature.Acta Anaesthesiol Scand.2009;53(2):143–151.
- ,,,,.The association between interdisciplinary collaboration and patient outcomes in a medical intensive care unit.Heart Lung.1992;21:18–24.
- ,,, et al.Patterns of coordination and clinical outcomes: a study of surgical services.Health Serv Res.1998;22:1211–1236.
- ,,, et al.Impact of relational coordination on quality of care, postoperative pain and functioning, and length of stay: a nine‐hospital study of surgical patients.Med Care.2000;38(8):807–819.
- ,,.The link between teamwork and patients' outcomes in intensive care units.Am J Crit Care.2003;12(6):527–534.
- ,,.Assessing system failures in operating rooms and intensive care units.Qual Saf health Care.2007;16:45–50.
- ,,, et al.Patient handover from surgery to intensive care: using Formula 1 pit‐stop and aviation models to improve safety and quality.Paediatr Anaesth.2007;17(5):470–478.
- ,,,.Is the doctor in? A relational approach to job design and the coordination of work.Hum Resour Manage.2008;47(4):729–755.
- ,,,.Developing a team performance framework for the intensive care unit.Crit Care Med.2009;37(5):1787–1793.
- ,,, et al.Medical and surgical comanagement after elective hip and knee arthroplasty: a randomized, controlled trial.Ann Intern Med.2004;141(1):28–38.
- ,,.Medical/psychiatric comanagement by nurse practitioners in chronic hepatitis C treatment: a case study.Arch Psychiatr Nurs.2007;21(2):87–90.
- ,.Perioperative medicine for the hospitalized patient.Med Clin North Am.2008;92(2):325–348.
- .The place and training of the general practitioner.Calif Med.1949;70(4):265–268.
- ,.Surgical comanagement: a natural evolution of hospitalist practice.J Hosp Med.2008;3(5):394–397.
- ,,,.Validation of a telephone version of the mini‐mental state examination.J Am Geriatr Soc.1992;40(7):697–702.
- .Organizing work to support relational co‐ordination.Int J of Human Resource Management.2000;11(3):517–539.
- ,,,,.Beyond our walls: impact of patient and provider coordination across the continuum on outcomes for surgical patients.Health Serv Res.2007;42:7–24.
- ,,,,.The effect of multidisciplinary care teams on intensive care unit mortality.Arch Intern Med.2010;170(4):369–376.
- ,,,.Outcome measures for effective teamwork in inpatient care: final report.Santa Monica:RAND Health;2008.
- ,,, et al.The performance of intensive care units: does good management make a difference?Med Care.1994;32(5):508–525.
- ,,,.Observational assessment of surgical teamwork: a feasibility study.World J Surg.2006;30(10):1774–1783.
- .Just because you can, doesn't mean that you should: A call for the rational application of hospitalist comanagement.J Hosp Med.2008;3(5):398–3402.
Technological advances drive medical providers to specialize through the need for proficiency around increasingly focused areas of expertise.1 But the benefits of specialization are attained only by balancing the advantages of increasing expertise and the costs of coordinating care that must be borne as specialization increases.2 Integrating experts into modern medical delivery systems requires attention to the coordinating mechanisms that govern team‐based care.3
Coordination, defined as the management of task interdependencies,4 is a central component and a useful measure of teamwork.5 Several studies demonstrate the patient‐level impact of coordination among providers.69 Gittell et al.8 demonstrated that orthopedic hospitals whose staff had better relational coordination (RC) measures had shorter lengths of stay and better post‐operative pain control for patients undergoing surgery. In medical intensive care units (ICUs), Wheelan et al.9 showed that staff members of units with lower mortality rates perceived their teams as functioning at higher stages of group development and perceived their team members as less dependent and more trusting.
Communication is the cornerstone of effective team coordination.10, 11 As such, practice model interventions that facilitate frequent communication of higher quality are associated with lower error rates10 and better teamwork.11 The use of hospitalists, for example, is shown to capitalize on this advantage by improving coordination through physician availability that facilitates communication and relational interactions among hospital‐based staff.12 While system‐level interventions such as this have received significant attention from experts in organizations, empirical studies that explore the contribution of team member characteristics to overall coordination are lacking.13
Inpatient comanagement services offer a unique model for studying teamwork. While the label is used to describe a variety of arrangements,1416 comanagement broadly describes a practice model wherein providers of various specialties deliver direct care to patients, in contrast to the traditional generalist‐consultant model in which specialists lend expertise.17 Many recent comanagement practices involve hospitalists in partnership with surgeons in the care of patients with concurrent medical and surgical needs,18 but similar arrangements between hospitalists and medical subspecialists are being adopted in some medical centers for the care of complex patients with conditions such as heart failure, cancer, stroke, and solid organ transplantations. Coordination among providers has not been studied in this context.
The goals of this study are: (1) to measure the input of individual providers to the overall coordination of care on a highly interdependent medical comanagement service, (2) to characterize high and low coordinators, and (3) to explore the relationship between coordination and patient outcomes. The main hypothesis is that the quality of team coordination is determined partly by the attributes of its members such that their individual contributions to the coordination of care affect the outcomes of vulnerable hospitalized patients.
Materials and Methods
Setting
The study was conducted at the University of Chicago Medical Center, Chicago, IL, an urban 572‐bed tertiary care hospital. The comanaged multidisciplinary inpatient service serves hospitalized patients with complex medical needs. This study focused on providers and patients from a subset of the comanaged multidisciplinary inpatient service that involved the collaboration of medical hepatologists with hospitalists. A hepatology team, composed of an attending hepatologist and a fellow, comanaged with 2 hospitalist teams, each composed of an attending hospitalist and 1 or 2 nonphysician providers (NPPs). Attending physicians rotated on the service in 1‐week to 3‐week rotations, while fellows rotated in 4‐week stretches. NPPs worked nonuniform 3‐day or 4‐day weeks excluding weekends and holidays. The hepatology team was responsible for arranging admissions, developing a care plan with a specialty focus, coordinating care with transplant surgeons when necessary, and managing post‐discharge care. The hospitalist teams were responsible for admitting patients, managing routine and emergent inpatient issues, coordinating care with ancillary and consultative staff, and discharging patients. Dedicated evening and night hospitalists, who were not part of the comanaging day‐time teams, provided after‐hours care. Outside of these areas, there was no instruction or education about how responsibilities should be shared among providers on the service.
Subjects and Study Design
Baseline Survey of Providers
All hospitalists, NPPs, hepatologists, and fellows scheduled to rotate on the comanaged multidisciplinary inpatient service signed a written consent to participate. In April 2008 a nonanonymous baseline 17‐item paper survey was administered.
Items of the Baseline Survey (supporting information Appendix A) were generated from a consideration of the most salient issues around the management structure of comanagement models from a comprehensive review the literature. Two items addressed the respondents' experience and intent to leave their role. Twelve items addressed their preferences about the provider management structure of an ideally comanaged inpatient service, specifically soliciting their preferences about a single physician leader, consensus seeking, and their preferred degree of information, participation, and decision making under the model. Included in this set of items was a single item assessment of the provider's sense of patient ownership on an ideally comanaged service. The final 3 items addressed the perceived assignment of responsibilities. Each of these items presented a clinical objective followed by up to 7 contingent tasks on whose completion the successful execution of the objective depended. Each respondent was asked to indicate one or more of the 4 provider types that should be responsible for completing each task.
Repeated Survey of Providers
From April to October 2008, providers who rotated on the comanaged liver service were surveyed repeatedly to give information about the actual management structure and coordination within teams, which consisted of combinations of randomly assigned providers. Physicians were surveyed on the day when any 1 of the 3 physician types ended his or her rotation. NPPs were surveyed every Wednesday except on the weeks when none of the physicians had changed since the previous survey. One investigator (KH) hand‐delivered the surveys, usually during the first minutes of the joint daily rounds and collected them immediately upon completion. Surveys that could not be completed immediately were collected on daily rounds on subsequent days within 1 week. The primary reason for nonresponse was lost surveys that were not immediately completed.
The 14‐item Repeated Survey (supporting information Appendix B) consisted of 2 parts. The first 7 items reprised items from the Baseline Survey that addressed management structures, but were rephrased to allow respondents to report their experiences on their immediate rotation. The second part of the Repeated Survey addressed RC, which is described below.
The study protocols, consents, and data collection mechanisms were approved by the institutional review board of the University of Chicago Medical Center. Collection of patient information was designed to comply with the Health Insurance Portability and Accountability Act of 1996.
Patients
Patients were admitted to 1 of the 2 hospitalist teams on the comanaged service on alternating days, which allowed patients to be assigned to providers pseudo‐randomly. Consent to use clinical data was obtained during their stay or by telephone after discharge. If patients were unable to provide consent due to cognitive impairment, consent was sought through designated proxies.19
Main Measurements
Relational Care Coordination
The survey instrument used to measure individual contributions to overall coordination was adapted from the Relational Coordination tool developed by Gittell.20 This instrument was chosen because it has already been validated in various clinical contexts8, 12, 21 and the theoretical assumptions about the independent relational and communication components of coordination are applicable to our context. RC is characterized by the 7 domains of frequent, timely, accurate, and problem‐solving communications; shared goals, shared knowledge, and mutual respect. Respondents rated, on a 5‐point scale (1 = negative, 5 = positive), team members of the other 3 provider types during each rotation on all of the 7 domains. The mean across the domains yielded the RC score. Although the instrument was originally developed to measure the coordination in groups of individuals, the RC for a single provider was calculated by taking the mean of all the RC directed at that individual across team members who worked with him or her during the study period. Because some providers worked more rotations than others, a nonuniform number of observations contributed to the calculation of individual RC (Table 1). For each provider type, individuals were ranked on their RC and categorized in tertiles representing high, middle, and low coordinators.
| Baseline Survey (%) | Repeated Surveys (%) | % Female | Years Experience Median (range) | # RC Evaluations of Each Provider Median (range) | RC Mean (range) | |
|---|---|---|---|---|---|---|
| ||||||
| Hospitalists | 15/15 (100) | 36/43 (84) | 42 | 1 (0‐10) | 6 (3‐21) | 4.71 (4.33‐4.94) |
| NPPs | 5/5 (100) | 92/97 (95) | 100 | 4 (2‐15) | 30 (23‐34) | 4.60 (4.48‐4.71) |
| Hepatologists | 6/6 (100) | 26/42 (62) | 33 | 7 (1‐25) | 16 (5‐51) | 4.37 (4.03‐4.59) |
| GI fellows | 6/6 (100) | 23/42 (55) | 48 | 1 (0‐1) | 19 (8‐37) | 4.28 (3.88‐4.53) |
| Total | 32/32 (100) | 177/223 (79) | 55 | 2 (0‐25) | 12.5 (3‐51) | 4.57 (3.88‐4.94) |
Statistical Analysis
The discriminating ability of the RC for individuals was assessed by comparing the highest and lowest RC of each provider type using the 2‐tailed t‐test. The difference in responses to items from the Baseline and Repeated Surveys by individual RC tertiles was assessed with the Chi‐squared test for categorical data and the 2‐tailed t‐test for comparing means. For each physician type, the frequency of the composite bad outcomes between the highest and lowest RC tertile categories were compared using a 2‐sample Wilcoxon rank‐sum (Mann‐Whitney) test for nonparametric data.
Results
All 32 providers (100%) completed the Baseline Survey and participated in the Repeated Surveys of which 177/224 (79%) were completed. The median number of surveys that contributed to the calculation of individual RC and the mean RC by provider type are summarized in Table 1.
Of the 119 patients managed on the service, the mean age (standard deviation [SD]) was 55 (14) years and 48% were women. Of the 201 hospitalizations, there were 13 floor‐to‐ICU transfers and 5 in‐hospital deaths, however, we excluded from the analysis 1 death of a patient who was admitted under inpatient hospice status.
RC Measures
Individual provider RC ranges were 4.33 to 4.94 (p = 0.05) for hospitalists; 4.48 to 4.71 (p = 0.10) for NP/PAs; 4.03 to 4.59 (p < 0.01) for hepatologists; and 3.88 to 4.52 (p = 0.02) for fellows. The high, middle, and low coordinator categories for each provider type were shown to be durable through time by demonstrating that the coordination ranking of individuals was essentially preserved even when using partial data from each half of the study period. Thus, RC appears to reflect a stable attribute of the provider as opposed to specific circumstances of the rotation. The categories were shown to be durable to the influences of bad outcomes (inpatient deaths and ICU transfers) by demonstrating that the placement of individuals into 1 of the 3 coordination categories were preserved even when data from rotations involving a bad outcome were removed. Nonetheless, in order to address the possibility of bad outcomes negatively affecting perception of coordination, all analysis involving RC used the values that excluded data from these rotations.
Characteristics of Good and Poor Coordinators
Patient Ownership
The single‐item measure of patient ownership in the Baseline Survey reads: I have as much a sense of ownership of my patients on the comanaged service as on a non‐comanaged service. The majority of providers of every type in the high and middle coordinator categories agreed, while providers in the low coordinator category generally disagreed with the statement. The aggregated responses of all the provider types are shown in Table 2.
| Agree | Somewhat Agree | Somewhat Disagree | Disagree | |
|---|---|---|---|---|
| High | 4 | 6 | 0 | 1 |
| Middle | 5 | 4 | 0 | 2 |
| Low | 2 | 0 | 4 | 4 |
| p < 0.01 |
Leadership
Hepatologists are the potential leader of the comanaged team because of their content expertise in liver diseases. Their responses to the 3 items in the Baseline Survey that addressed perceived assignment of responsibilities are shown in Table 3. The high compared to the low coordinator hepatologists delegated the responsibility of completing necessary tasks to more providers, overall, such that an average of 3 providers were redundantly held responsible for the completion of each task by the high coordinators while only 1 provider was held responsible by the low coordinators. Furthermore, the high coordinators delegated the responsibility of completing more tasks to themselves compared to the low coordinators.
| Hepatologists | Mean # of Tasks Delegated Overall, n (SD) | Mean # of Providers Delegated to Each Task, n (SD) | Mean # of Tasks Delegated to Self, n (SD) |
|---|---|---|---|
| |||
| High (n = 2) | 56 (0.0) | 2.9 (0.0) | 11.5 (2.1) |
| Middle (n = 2) | 35 (2.8) | 1.8 (0.2) | 9.5 (3.5) |
| Low (n = 2) | 19 (1.4) | 1.0 (0.1) | 4.5 (2.1) |
| p value(high vs. low) | <0.01 | <0.01 | 0.08 |
According to responses to the management structure items of the Repeated Surveys, more providers of every type indicated that a single physician leader directed the overall management of every patient when a high or middle coordinator hospitalist was on service as opposed to a service with a low coordinator hospitalist (high 76% vs. middle 73% vs. low 58%, P = 0.06). Furthermore, a low coordinator hospitalist on service was more likely to indicate a desire for greater influence in directing the management of patients (desire influence 93% vs. not 7%, P < 0.01). This pattern was also seen with low coordinator NPPs, who more often indicated a desire for greater influence in directing patient management (desire influence 100% vs. not 0%, P < 0.01).
Experience
Age, years in practice, years at the institution, and time spent on the comanaged service were not associated with RC in our small sample of providers.
Outcomes by Provider Coordination
The unit of analysis in this section is the team‐patient encounter, which is the consecutive days during which a unique assortment of physicians managed a patient's hospitalization. NPPs could not be associated with any single team due to their nonuniform work patterns. The 201 hospitalizations in this study were composed of 351 team‐patient encounters. Table 4 displays the unadjusted frequency of inpatient deaths and ICU transfers that occurred during these encounters by RC tertiles. In each of the 3 physician types, composite bad outcomes are most frequent among the lowest coordinators. The pattern is statistically significant for hospitalists.
| Team‐Patient Encounters, n | Mean Length of Encounter, n (days) | ICU Transfer, n (%) | Hospital Death, n (%) | Bad Outcome, n (%) | |
|---|---|---|---|---|---|
| |||||
| Hospitalists | |||||
| High (n = 5) | 92 | 3.1 | 1 (1.1) | 1 (1.1) | 1 (1.1) |
| Middle (n = 5) | 119 | 3.2 | 1 (0.8) | 1 (0.8) | 1 (0.8) |
| Low (n = 5) | 140 | 3.2 | 11 (7.9) | 2 (1.4) | 12 (8.6) |
| p value (high vs. low) | NA | 0.70 | 0.02 | 0.82 | 0.02 |
| Hepatologists | |||||
| High (n = 2) | 99 | 3.2 | (2.0) | 0 (0.0) | 2 (2.0) |
| Middle (n = 2) | 79 | 3.4 | 3 (3.0) | 1 (1.3) | 3 (3.0) |
| Low (n = 2) | 173 | 3.0 | 8 (4.6) | 3 (1.7) | 9 (5.2) |
| p value (high vs. low) | NA | 0.52 | 0.27 | 0.19 | 0.20 |
| GI fellows | |||||
| High (n = 2) | 111 | 3.1 | 2 (1.8) | 0 (0.0) | 2 (1.8) |
| Middle (n = 2) | 67 | 3.3 | 2 (3.0) | 1 (1.5) | 2 (3.0) |
| Low (n = 2) | 173 | 3.2 | 9 (5.2) | 3 (1.7) | 10 (5.8) |
| p value (high vs. low) | NA | 0.74 | 0.15 | 0.16 | 0.10 |
Another interesting observation is the largest number of encounters in the lowest coordination tertile of each physician type. While the reason for this finding is not clear, associations between work‐load and poor coordination evoke issues related to burnout. In order to address the possibility of an artifactually elevated probability of a bad outcome among providers who rotated through the service more often, we calculated the correlation between the number of encounter‐days and the frequency of bad outcomes for the 15 providers who were associated with at last one such event. If these events occurred by chance, we should find a positive correlation between its frequency and the number of encounters. The Pearson's correlation coefficient of 0.38 suggests that bad outcomes do not occur more frequently with providers who work more rotations by chance alone.
Discussion
By adapting Gittell's RC instrument to focus on individual providers, we found that their characteristic attributes such as preference for particular management styles, leadership quality, and patient ownership are associated with their externally perceived contributions to the overall coordination of care. In an unadjusted analysis, we also observed an intriguing trend towards more frequent major hospital complications when the worst coordinators of each physician type were on service.
Existing evidence22, 23 mostly summarized in a recent RAND Health report shows a weak association between clinical teamwork quality and patient mortality. While our data also support this association, it does so with limitations. Most importantly, the small sample size limited our ability to rigorously account for potential confounders that may have contributed to this apparent association. Further studies may better address whether or not bad outcomes are indeed associated with poor coordinators in highly interdependent clinical teams. In addition to confounding, the small sample size of providers makes the analysis vulnerable to type 1 errors. We addressed this issue by intensively surveying providers repeatedly to achieve a high resolution of the coordination and management structure measures from each comanaged team. The potential for omitted variables and reverse causality in that the coordination scores may be negatively influenced by particularly complex patients and bad outcomes remains a valid concern. We addressed this by confirming the stability of provider RC over time and excluding the RC data from rotations with a bad outcome, but the negative perception of an individual tied to past bad outcomes may persist beyond a particular rotation. Survey responses are subject to recall and hindsight biases, which we attempted to minimize by surveying respondents immediately after each team rotation. Finally, all of our findings may be not be generalizable to other comanagement settings. However, the important correlations between coordination and quality have been observed in other contexts.24, 25
In our study, in‐hospital deaths and ICU transfers are treated as consequences of uncoordinated care. This interpretation may be problematic for circumstances when death is inevitable no matter how well coordinated the care, or when transfer to a higher level of care is appropriate. The rationale for grouping the 2 events into 1 composite bad outcome is based on the assumption that both death and the escalation of care can be delayed to an extent, if not wholly prevented, with the coordinated utilization of a modern hospital's resources. The attribution of these events to poor coordinators may indicate the unraveling of coordination that normally must be maintained to help patients overcome decompensating events that are particularly common in the course of patients with severe liver diseases. Due to the exploratory nature of this analysis, additional studies are necessary to fully characterize the relationship between care coordination and care transfers.
An important implication of this study is that the communication skill and ethical disposition of each individual provider is relevant to the coordination that is sought in multi‐provider teams. Training medical professionals to be better team members may have direct impact on the patients they serve. Our finding about patient ownership suggests that commitment to patients in the framework of care is not merely tradition but a characteristic of competent physicians. Moreover, physicians' commitment to patients is a possible factor, not just in achieving patients' satisfaction, but in securing better outcomes. To that end, the teaching of this and other humanistic principles must remain a vital part of medical education at all levels of training.
Several implications about team leadership and hierarchy are apparent from the data. Findings around the perceived assignment of responsibilities show that high coordinator hepatologists acknowledge the advantages of overlapping task boundaries to prevent critical tasks from being missed and risking bad outcomes. High RC hepatologists in our study adopted a more participatory than supervisory role which presumably facilitated better coordination by transmitting organizational goals to other team members. The function of a comanaged team is likely to be enhanced by a fluid assignment of roles to better handle tasks with high uncertainty. Accordingly, comanagement models of care may not be appropriate in settings where tasks are not interdependent.26 Inherent hierarchy appears to be a feature of well coordinated teams. One possible interpretation of our data is that hospitalists who yield the leadership role to the hepatologist are perceived to be better coordinators and that those who insist on exerting more influence in team decisions are perceived to be poor coordinators.
Existing evidence around care coordination predicts that comanagement designs improve provider coordination through stage‐based and site‐based specialization.12 However, the mechanisms that mediate coordination and patient outcomes are not clear. Moreover, the mechanisms of coordinating multi‐disciplinary teams may be specific to each clinical setting. The role of individual provider characteristics on coordination deserves more attention. Similarly, the impact of organizational culture under which favorable provider characteristics thrive is unknown. Finally, a detailed exposition of patient ownership and the role patients play in affecting the coordination of healthcare resources needs further exploration.
Technological advances drive medical providers to specialize through the need for proficiency around increasingly focused areas of expertise.1 But the benefits of specialization are attained only by balancing the advantages of increasing expertise and the costs of coordinating care that must be borne as specialization increases.2 Integrating experts into modern medical delivery systems requires attention to the coordinating mechanisms that govern team‐based care.3
Coordination, defined as the management of task interdependencies,4 is a central component and a useful measure of teamwork.5 Several studies demonstrate the patient‐level impact of coordination among providers.69 Gittell et al.8 demonstrated that orthopedic hospitals whose staff had better relational coordination (RC) measures had shorter lengths of stay and better post‐operative pain control for patients undergoing surgery. In medical intensive care units (ICUs), Wheelan et al.9 showed that staff members of units with lower mortality rates perceived their teams as functioning at higher stages of group development and perceived their team members as less dependent and more trusting.
Communication is the cornerstone of effective team coordination.10, 11 As such, practice model interventions that facilitate frequent communication of higher quality are associated with lower error rates10 and better teamwork.11 The use of hospitalists, for example, is shown to capitalize on this advantage by improving coordination through physician availability that facilitates communication and relational interactions among hospital‐based staff.12 While system‐level interventions such as this have received significant attention from experts in organizations, empirical studies that explore the contribution of team member characteristics to overall coordination are lacking.13
Inpatient comanagement services offer a unique model for studying teamwork. While the label is used to describe a variety of arrangements,1416 comanagement broadly describes a practice model wherein providers of various specialties deliver direct care to patients, in contrast to the traditional generalist‐consultant model in which specialists lend expertise.17 Many recent comanagement practices involve hospitalists in partnership with surgeons in the care of patients with concurrent medical and surgical needs,18 but similar arrangements between hospitalists and medical subspecialists are being adopted in some medical centers for the care of complex patients with conditions such as heart failure, cancer, stroke, and solid organ transplantations. Coordination among providers has not been studied in this context.
The goals of this study are: (1) to measure the input of individual providers to the overall coordination of care on a highly interdependent medical comanagement service, (2) to characterize high and low coordinators, and (3) to explore the relationship between coordination and patient outcomes. The main hypothesis is that the quality of team coordination is determined partly by the attributes of its members such that their individual contributions to the coordination of care affect the outcomes of vulnerable hospitalized patients.
Materials and Methods
Setting
The study was conducted at the University of Chicago Medical Center, Chicago, IL, an urban 572‐bed tertiary care hospital. The comanaged multidisciplinary inpatient service serves hospitalized patients with complex medical needs. This study focused on providers and patients from a subset of the comanaged multidisciplinary inpatient service that involved the collaboration of medical hepatologists with hospitalists. A hepatology team, composed of an attending hepatologist and a fellow, comanaged with 2 hospitalist teams, each composed of an attending hospitalist and 1 or 2 nonphysician providers (NPPs). Attending physicians rotated on the service in 1‐week to 3‐week rotations, while fellows rotated in 4‐week stretches. NPPs worked nonuniform 3‐day or 4‐day weeks excluding weekends and holidays. The hepatology team was responsible for arranging admissions, developing a care plan with a specialty focus, coordinating care with transplant surgeons when necessary, and managing post‐discharge care. The hospitalist teams were responsible for admitting patients, managing routine and emergent inpatient issues, coordinating care with ancillary and consultative staff, and discharging patients. Dedicated evening and night hospitalists, who were not part of the comanaging day‐time teams, provided after‐hours care. Outside of these areas, there was no instruction or education about how responsibilities should be shared among providers on the service.
Subjects and Study Design
Baseline Survey of Providers
All hospitalists, NPPs, hepatologists, and fellows scheduled to rotate on the comanaged multidisciplinary inpatient service signed a written consent to participate. In April 2008 a nonanonymous baseline 17‐item paper survey was administered.
Items of the Baseline Survey (supporting information Appendix A) were generated from a consideration of the most salient issues around the management structure of comanagement models from a comprehensive review the literature. Two items addressed the respondents' experience and intent to leave their role. Twelve items addressed their preferences about the provider management structure of an ideally comanaged inpatient service, specifically soliciting their preferences about a single physician leader, consensus seeking, and their preferred degree of information, participation, and decision making under the model. Included in this set of items was a single item assessment of the provider's sense of patient ownership on an ideally comanaged service. The final 3 items addressed the perceived assignment of responsibilities. Each of these items presented a clinical objective followed by up to 7 contingent tasks on whose completion the successful execution of the objective depended. Each respondent was asked to indicate one or more of the 4 provider types that should be responsible for completing each task.
Repeated Survey of Providers
From April to October 2008, providers who rotated on the comanaged liver service were surveyed repeatedly to give information about the actual management structure and coordination within teams, which consisted of combinations of randomly assigned providers. Physicians were surveyed on the day when any 1 of the 3 physician types ended his or her rotation. NPPs were surveyed every Wednesday except on the weeks when none of the physicians had changed since the previous survey. One investigator (KH) hand‐delivered the surveys, usually during the first minutes of the joint daily rounds and collected them immediately upon completion. Surveys that could not be completed immediately were collected on daily rounds on subsequent days within 1 week. The primary reason for nonresponse was lost surveys that were not immediately completed.
The 14‐item Repeated Survey (supporting information Appendix B) consisted of 2 parts. The first 7 items reprised items from the Baseline Survey that addressed management structures, but were rephrased to allow respondents to report their experiences on their immediate rotation. The second part of the Repeated Survey addressed RC, which is described below.
The study protocols, consents, and data collection mechanisms were approved by the institutional review board of the University of Chicago Medical Center. Collection of patient information was designed to comply with the Health Insurance Portability and Accountability Act of 1996.
Patients
Patients were admitted to 1 of the 2 hospitalist teams on the comanaged service on alternating days, which allowed patients to be assigned to providers pseudo‐randomly. Consent to use clinical data was obtained during their stay or by telephone after discharge. If patients were unable to provide consent due to cognitive impairment, consent was sought through designated proxies.19
Main Measurements
Relational Care Coordination
The survey instrument used to measure individual contributions to overall coordination was adapted from the Relational Coordination tool developed by Gittell.20 This instrument was chosen because it has already been validated in various clinical contexts8, 12, 21 and the theoretical assumptions about the independent relational and communication components of coordination are applicable to our context. RC is characterized by the 7 domains of frequent, timely, accurate, and problem‐solving communications; shared goals, shared knowledge, and mutual respect. Respondents rated, on a 5‐point scale (1 = negative, 5 = positive), team members of the other 3 provider types during each rotation on all of the 7 domains. The mean across the domains yielded the RC score. Although the instrument was originally developed to measure the coordination in groups of individuals, the RC for a single provider was calculated by taking the mean of all the RC directed at that individual across team members who worked with him or her during the study period. Because some providers worked more rotations than others, a nonuniform number of observations contributed to the calculation of individual RC (Table 1). For each provider type, individuals were ranked on their RC and categorized in tertiles representing high, middle, and low coordinators.
| Baseline Survey (%) | Repeated Surveys (%) | % Female | Years Experience Median (range) | # RC Evaluations of Each Provider Median (range) | RC Mean (range) | |
|---|---|---|---|---|---|---|
| ||||||
| Hospitalists | 15/15 (100) | 36/43 (84) | 42 | 1 (0‐10) | 6 (3‐21) | 4.71 (4.33‐4.94) |
| NPPs | 5/5 (100) | 92/97 (95) | 100 | 4 (2‐15) | 30 (23‐34) | 4.60 (4.48‐4.71) |
| Hepatologists | 6/6 (100) | 26/42 (62) | 33 | 7 (1‐25) | 16 (5‐51) | 4.37 (4.03‐4.59) |
| GI fellows | 6/6 (100) | 23/42 (55) | 48 | 1 (0‐1) | 19 (8‐37) | 4.28 (3.88‐4.53) |
| Total | 32/32 (100) | 177/223 (79) | 55 | 2 (0‐25) | 12.5 (3‐51) | 4.57 (3.88‐4.94) |
Statistical Analysis
The discriminating ability of the RC for individuals was assessed by comparing the highest and lowest RC of each provider type using the 2‐tailed t‐test. The difference in responses to items from the Baseline and Repeated Surveys by individual RC tertiles was assessed with the Chi‐squared test for categorical data and the 2‐tailed t‐test for comparing means. For each physician type, the frequency of the composite bad outcomes between the highest and lowest RC tertile categories were compared using a 2‐sample Wilcoxon rank‐sum (Mann‐Whitney) test for nonparametric data.
Results
All 32 providers (100%) completed the Baseline Survey and participated in the Repeated Surveys of which 177/224 (79%) were completed. The median number of surveys that contributed to the calculation of individual RC and the mean RC by provider type are summarized in Table 1.
Of the 119 patients managed on the service, the mean age (standard deviation [SD]) was 55 (14) years and 48% were women. Of the 201 hospitalizations, there were 13 floor‐to‐ICU transfers and 5 in‐hospital deaths, however, we excluded from the analysis 1 death of a patient who was admitted under inpatient hospice status.
RC Measures
Individual provider RC ranges were 4.33 to 4.94 (p = 0.05) for hospitalists; 4.48 to 4.71 (p = 0.10) for NP/PAs; 4.03 to 4.59 (p < 0.01) for hepatologists; and 3.88 to 4.52 (p = 0.02) for fellows. The high, middle, and low coordinator categories for each provider type were shown to be durable through time by demonstrating that the coordination ranking of individuals was essentially preserved even when using partial data from each half of the study period. Thus, RC appears to reflect a stable attribute of the provider as opposed to specific circumstances of the rotation. The categories were shown to be durable to the influences of bad outcomes (inpatient deaths and ICU transfers) by demonstrating that the placement of individuals into 1 of the 3 coordination categories were preserved even when data from rotations involving a bad outcome were removed. Nonetheless, in order to address the possibility of bad outcomes negatively affecting perception of coordination, all analysis involving RC used the values that excluded data from these rotations.
Characteristics of Good and Poor Coordinators
Patient Ownership
The single‐item measure of patient ownership in the Baseline Survey reads: I have as much a sense of ownership of my patients on the comanaged service as on a non‐comanaged service. The majority of providers of every type in the high and middle coordinator categories agreed, while providers in the low coordinator category generally disagreed with the statement. The aggregated responses of all the provider types are shown in Table 2.
| Agree | Somewhat Agree | Somewhat Disagree | Disagree | |
|---|---|---|---|---|
| High | 4 | 6 | 0 | 1 |
| Middle | 5 | 4 | 0 | 2 |
| Low | 2 | 0 | 4 | 4 |
| p < 0.01 |
Leadership
Hepatologists are the potential leader of the comanaged team because of their content expertise in liver diseases. Their responses to the 3 items in the Baseline Survey that addressed perceived assignment of responsibilities are shown in Table 3. The high compared to the low coordinator hepatologists delegated the responsibility of completing necessary tasks to more providers, overall, such that an average of 3 providers were redundantly held responsible for the completion of each task by the high coordinators while only 1 provider was held responsible by the low coordinators. Furthermore, the high coordinators delegated the responsibility of completing more tasks to themselves compared to the low coordinators.
| Hepatologists | Mean # of Tasks Delegated Overall, n (SD) | Mean # of Providers Delegated to Each Task, n (SD) | Mean # of Tasks Delegated to Self, n (SD) |
|---|---|---|---|
| |||
| High (n = 2) | 56 (0.0) | 2.9 (0.0) | 11.5 (2.1) |
| Middle (n = 2) | 35 (2.8) | 1.8 (0.2) | 9.5 (3.5) |
| Low (n = 2) | 19 (1.4) | 1.0 (0.1) | 4.5 (2.1) |
| p value(high vs. low) | <0.01 | <0.01 | 0.08 |
According to responses to the management structure items of the Repeated Surveys, more providers of every type indicated that a single physician leader directed the overall management of every patient when a high or middle coordinator hospitalist was on service as opposed to a service with a low coordinator hospitalist (high 76% vs. middle 73% vs. low 58%, P = 0.06). Furthermore, a low coordinator hospitalist on service was more likely to indicate a desire for greater influence in directing the management of patients (desire influence 93% vs. not 7%, P < 0.01). This pattern was also seen with low coordinator NPPs, who more often indicated a desire for greater influence in directing patient management (desire influence 100% vs. not 0%, P < 0.01).
Experience
Age, years in practice, years at the institution, and time spent on the comanaged service were not associated with RC in our small sample of providers.
Outcomes by Provider Coordination
The unit of analysis in this section is the team‐patient encounter, which is the consecutive days during which a unique assortment of physicians managed a patient's hospitalization. NPPs could not be associated with any single team due to their nonuniform work patterns. The 201 hospitalizations in this study were composed of 351 team‐patient encounters. Table 4 displays the unadjusted frequency of inpatient deaths and ICU transfers that occurred during these encounters by RC tertiles. In each of the 3 physician types, composite bad outcomes are most frequent among the lowest coordinators. The pattern is statistically significant for hospitalists.
| Team‐Patient Encounters, n | Mean Length of Encounter, n (days) | ICU Transfer, n (%) | Hospital Death, n (%) | Bad Outcome, n (%) | |
|---|---|---|---|---|---|
| |||||
| Hospitalists | |||||
| High (n = 5) | 92 | 3.1 | 1 (1.1) | 1 (1.1) | 1 (1.1) |
| Middle (n = 5) | 119 | 3.2 | 1 (0.8) | 1 (0.8) | 1 (0.8) |
| Low (n = 5) | 140 | 3.2 | 11 (7.9) | 2 (1.4) | 12 (8.6) |
| p value (high vs. low) | NA | 0.70 | 0.02 | 0.82 | 0.02 |
| Hepatologists | |||||
| High (n = 2) | 99 | 3.2 | (2.0) | 0 (0.0) | 2 (2.0) |
| Middle (n = 2) | 79 | 3.4 | 3 (3.0) | 1 (1.3) | 3 (3.0) |
| Low (n = 2) | 173 | 3.0 | 8 (4.6) | 3 (1.7) | 9 (5.2) |
| p value (high vs. low) | NA | 0.52 | 0.27 | 0.19 | 0.20 |
| GI fellows | |||||
| High (n = 2) | 111 | 3.1 | 2 (1.8) | 0 (0.0) | 2 (1.8) |
| Middle (n = 2) | 67 | 3.3 | 2 (3.0) | 1 (1.5) | 2 (3.0) |
| Low (n = 2) | 173 | 3.2 | 9 (5.2) | 3 (1.7) | 10 (5.8) |
| p value (high vs. low) | NA | 0.74 | 0.15 | 0.16 | 0.10 |
Another interesting observation is the largest number of encounters in the lowest coordination tertile of each physician type. While the reason for this finding is not clear, associations between work‐load and poor coordination evoke issues related to burnout. In order to address the possibility of an artifactually elevated probability of a bad outcome among providers who rotated through the service more often, we calculated the correlation between the number of encounter‐days and the frequency of bad outcomes for the 15 providers who were associated with at last one such event. If these events occurred by chance, we should find a positive correlation between its frequency and the number of encounters. The Pearson's correlation coefficient of 0.38 suggests that bad outcomes do not occur more frequently with providers who work more rotations by chance alone.
Discussion
By adapting Gittell's RC instrument to focus on individual providers, we found that their characteristic attributes such as preference for particular management styles, leadership quality, and patient ownership are associated with their externally perceived contributions to the overall coordination of care. In an unadjusted analysis, we also observed an intriguing trend towards more frequent major hospital complications when the worst coordinators of each physician type were on service.
Existing evidence22, 23 mostly summarized in a recent RAND Health report shows a weak association between clinical teamwork quality and patient mortality. While our data also support this association, it does so with limitations. Most importantly, the small sample size limited our ability to rigorously account for potential confounders that may have contributed to this apparent association. Further studies may better address whether or not bad outcomes are indeed associated with poor coordinators in highly interdependent clinical teams. In addition to confounding, the small sample size of providers makes the analysis vulnerable to type 1 errors. We addressed this issue by intensively surveying providers repeatedly to achieve a high resolution of the coordination and management structure measures from each comanaged team. The potential for omitted variables and reverse causality in that the coordination scores may be negatively influenced by particularly complex patients and bad outcomes remains a valid concern. We addressed this by confirming the stability of provider RC over time and excluding the RC data from rotations with a bad outcome, but the negative perception of an individual tied to past bad outcomes may persist beyond a particular rotation. Survey responses are subject to recall and hindsight biases, which we attempted to minimize by surveying respondents immediately after each team rotation. Finally, all of our findings may be not be generalizable to other comanagement settings. However, the important correlations between coordination and quality have been observed in other contexts.24, 25
In our study, in‐hospital deaths and ICU transfers are treated as consequences of uncoordinated care. This interpretation may be problematic for circumstances when death is inevitable no matter how well coordinated the care, or when transfer to a higher level of care is appropriate. The rationale for grouping the 2 events into 1 composite bad outcome is based on the assumption that both death and the escalation of care can be delayed to an extent, if not wholly prevented, with the coordinated utilization of a modern hospital's resources. The attribution of these events to poor coordinators may indicate the unraveling of coordination that normally must be maintained to help patients overcome decompensating events that are particularly common in the course of patients with severe liver diseases. Due to the exploratory nature of this analysis, additional studies are necessary to fully characterize the relationship between care coordination and care transfers.
An important implication of this study is that the communication skill and ethical disposition of each individual provider is relevant to the coordination that is sought in multi‐provider teams. Training medical professionals to be better team members may have direct impact on the patients they serve. Our finding about patient ownership suggests that commitment to patients in the framework of care is not merely tradition but a characteristic of competent physicians. Moreover, physicians' commitment to patients is a possible factor, not just in achieving patients' satisfaction, but in securing better outcomes. To that end, the teaching of this and other humanistic principles must remain a vital part of medical education at all levels of training.
Several implications about team leadership and hierarchy are apparent from the data. Findings around the perceived assignment of responsibilities show that high coordinator hepatologists acknowledge the advantages of overlapping task boundaries to prevent critical tasks from being missed and risking bad outcomes. High RC hepatologists in our study adopted a more participatory than supervisory role which presumably facilitated better coordination by transmitting organizational goals to other team members. The function of a comanaged team is likely to be enhanced by a fluid assignment of roles to better handle tasks with high uncertainty. Accordingly, comanagement models of care may not be appropriate in settings where tasks are not interdependent.26 Inherent hierarchy appears to be a feature of well coordinated teams. One possible interpretation of our data is that hospitalists who yield the leadership role to the hepatologist are perceived to be better coordinators and that those who insist on exerting more influence in team decisions are perceived to be poor coordinators.
Existing evidence around care coordination predicts that comanagement designs improve provider coordination through stage‐based and site‐based specialization.12 However, the mechanisms that mediate coordination and patient outcomes are not clear. Moreover, the mechanisms of coordinating multi‐disciplinary teams may be specific to each clinical setting. The role of individual provider characteristics on coordination deserves more attention. Similarly, the impact of organizational culture under which favorable provider characteristics thrive is unknown. Finally, a detailed exposition of patient ownership and the role patients play in affecting the coordination of healthcare resources needs further exploration.
- .Technology, specialization, and the allied health professions.J Allied Health.1983;12(3):177–182.
- .Hospitalists and the doctor‐patient relationship.J Legal Stud.2001;30:589–606.
- .From Chaos to Care: The Promise of Team‐Based medicine.Cambridge, MA:Perseus;2002.
- ,,.Determinants of coordination modes within organizations.Am Sociol Rev.1976;41:322–338.
- .Teamwork and patient safety in dynamic domains of healthcare: a review of the literature.Acta Anaesthesiol Scand.2009;53(2):143–151.
- ,,,,.The association between interdisciplinary collaboration and patient outcomes in a medical intensive care unit.Heart Lung.1992;21:18–24.
- ,,, et al.Patterns of coordination and clinical outcomes: a study of surgical services.Health Serv Res.1998;22:1211–1236.
- ,,, et al.Impact of relational coordination on quality of care, postoperative pain and functioning, and length of stay: a nine‐hospital study of surgical patients.Med Care.2000;38(8):807–819.
- ,,.The link between teamwork and patients' outcomes in intensive care units.Am J Crit Care.2003;12(6):527–534.
- ,,.Assessing system failures in operating rooms and intensive care units.Qual Saf health Care.2007;16:45–50.
- ,,, et al.Patient handover from surgery to intensive care: using Formula 1 pit‐stop and aviation models to improve safety and quality.Paediatr Anaesth.2007;17(5):470–478.
- ,,,.Is the doctor in? A relational approach to job design and the coordination of work.Hum Resour Manage.2008;47(4):729–755.
- ,,,.Developing a team performance framework for the intensive care unit.Crit Care Med.2009;37(5):1787–1793.
- ,,, et al.Medical and surgical comanagement after elective hip and knee arthroplasty: a randomized, controlled trial.Ann Intern Med.2004;141(1):28–38.
- ,,.Medical/psychiatric comanagement by nurse practitioners in chronic hepatitis C treatment: a case study.Arch Psychiatr Nurs.2007;21(2):87–90.
- ,.Perioperative medicine for the hospitalized patient.Med Clin North Am.2008;92(2):325–348.
- .The place and training of the general practitioner.Calif Med.1949;70(4):265–268.
- ,.Surgical comanagement: a natural evolution of hospitalist practice.J Hosp Med.2008;3(5):394–397.
- ,,,.Validation of a telephone version of the mini‐mental state examination.J Am Geriatr Soc.1992;40(7):697–702.
- .Organizing work to support relational co‐ordination.Int J of Human Resource Management.2000;11(3):517–539.
- ,,,,.Beyond our walls: impact of patient and provider coordination across the continuum on outcomes for surgical patients.Health Serv Res.2007;42:7–24.
- ,,,,.The effect of multidisciplinary care teams on intensive care unit mortality.Arch Intern Med.2010;170(4):369–376.
- ,,,.Outcome measures for effective teamwork in inpatient care: final report.Santa Monica:RAND Health;2008.
- ,,, et al.The performance of intensive care units: does good management make a difference?Med Care.1994;32(5):508–525.
- ,,,.Observational assessment of surgical teamwork: a feasibility study.World J Surg.2006;30(10):1774–1783.
- .Just because you can, doesn't mean that you should: A call for the rational application of hospitalist comanagement.J Hosp Med.2008;3(5):398–3402.
- .Technology, specialization, and the allied health professions.J Allied Health.1983;12(3):177–182.
- .Hospitalists and the doctor‐patient relationship.J Legal Stud.2001;30:589–606.
- .From Chaos to Care: The Promise of Team‐Based medicine.Cambridge, MA:Perseus;2002.
- ,,.Determinants of coordination modes within organizations.Am Sociol Rev.1976;41:322–338.
- .Teamwork and patient safety in dynamic domains of healthcare: a review of the literature.Acta Anaesthesiol Scand.2009;53(2):143–151.
- ,,,,.The association between interdisciplinary collaboration and patient outcomes in a medical intensive care unit.Heart Lung.1992;21:18–24.
- ,,, et al.Patterns of coordination and clinical outcomes: a study of surgical services.Health Serv Res.1998;22:1211–1236.
- ,,, et al.Impact of relational coordination on quality of care, postoperative pain and functioning, and length of stay: a nine‐hospital study of surgical patients.Med Care.2000;38(8):807–819.
- ,,.The link between teamwork and patients' outcomes in intensive care units.Am J Crit Care.2003;12(6):527–534.
- ,,.Assessing system failures in operating rooms and intensive care units.Qual Saf health Care.2007;16:45–50.
- ,,, et al.Patient handover from surgery to intensive care: using Formula 1 pit‐stop and aviation models to improve safety and quality.Paediatr Anaesth.2007;17(5):470–478.
- ,,,.Is the doctor in? A relational approach to job design and the coordination of work.Hum Resour Manage.2008;47(4):729–755.
- ,,,.Developing a team performance framework for the intensive care unit.Crit Care Med.2009;37(5):1787–1793.
- ,,, et al.Medical and surgical comanagement after elective hip and knee arthroplasty: a randomized, controlled trial.Ann Intern Med.2004;141(1):28–38.
- ,,.Medical/psychiatric comanagement by nurse practitioners in chronic hepatitis C treatment: a case study.Arch Psychiatr Nurs.2007;21(2):87–90.
- ,.Perioperative medicine for the hospitalized patient.Med Clin North Am.2008;92(2):325–348.
- .The place and training of the general practitioner.Calif Med.1949;70(4):265–268.
- ,.Surgical comanagement: a natural evolution of hospitalist practice.J Hosp Med.2008;3(5):394–397.
- ,,,.Validation of a telephone version of the mini‐mental state examination.J Am Geriatr Soc.1992;40(7):697–702.
- .Organizing work to support relational co‐ordination.Int J of Human Resource Management.2000;11(3):517–539.
- ,,,,.Beyond our walls: impact of patient and provider coordination across the continuum on outcomes for surgical patients.Health Serv Res.2007;42:7–24.
- ,,,,.The effect of multidisciplinary care teams on intensive care unit mortality.Arch Intern Med.2010;170(4):369–376.
- ,,,.Outcome measures for effective teamwork in inpatient care: final report.Santa Monica:RAND Health;2008.
- ,,, et al.The performance of intensive care units: does good management make a difference?Med Care.1994;32(5):508–525.
- ,,,.Observational assessment of surgical teamwork: a feasibility study.World J Surg.2006;30(10):1774–1783.
- .Just because you can, doesn't mean that you should: A call for the rational application of hospitalist comanagement.J Hosp Med.2008;3(5):398–3402.
Copyright © 2010 Society of Hospital Medicine
TEN Associated with Herbal Medication Use
A 49‐year‐old woman with history of rheumatic fever necessitating mechanical mitral valve replacement and a cerebrovascular accident of presumed embolic etiology presented with several months of progressive fatigue, weakness, arthralgias, and myalgias. After an extensive workup, a rheumatologist in the community diagnosed her with systemic lupus erythematosus and dermatomyositis. The patient refused therapy with corticosteroids and disease‐modifying agents, citing concerns of adverse effects. She consulted a naturopathic clinician, who gave her Rejuvenator Pills, Super Booster pill, Genesis Juice, and alkaline water (Table 1).
| Rejuvenator Pill |
| Slippery elm 45 mg (Ulmus rubra) |
| Capsicum 40 mg (Capsicum spp.) |
| Fennel seeds 35 mg (Foeniculum vulgare) |
| Chickweed 35 mg (Stellaria media) |
| Hawthorn berry 30 mg (Crataegus oxyacantha) |
| Mullein 30 mg (Verbascum thapsus) |
| Scullcap 25 mg (Scutellaria spp.) |
| Rosehip 25 mg (Rosa spp.) |
| Barberry 20 mg (Berberis vulgaris) |
| Pau d'arco 20 mg (Tabebuia spp.) |
| Comfrey leaf 20 mg (Symphytum officinale) |
| Alfalfa 20 mg (Medicago sativa) |
| Kelp 20 mg (Laminaria spp.) |
| Papaya leaf 15 mg (Carica papaya) |
| Bee pollen 15 mg |
| Black cohosh 15 mg (Cimicifuga racemosa) |
| Chaparral 10 mg (Larrea tridentata) |
| Ginger 10 mg (Zingiber officinale) |
| Dandelion 5 mg (Taraxacum officinale) |
| Sunflower 5 mg (Helianthus annuus) |
| Licorice root 5 mg (Glycyrrhiza glabra) |
| Cascara sagrada 25 mg |
| Super Booster pill |
| Cascara sagrada |
| Psyllium (Plantago spp.) |
| Fennel (Foeniculum vulgare) |
| Genesis Juice |
| Apple (Malus domestica) |
| Pomegranate (Punica granatum) |
| Aloe vera juice (reconstituted) |
| Whole fruit grape extract (Vitis vinifera spp.) |
| Barley grass (Hordeum vulgare) |
| Cinnamon bark (Cinnamomum spp.) |
| Coriander leaf (Coriandrum sativum) |
| Coriander seed (Coriandrum sativum) |
| Cucumber (Cucumis sativus) |
| Fig fruit (Ficus carica) |
| Garlic bulb (Allium sativum) |
| Juniper berry (Juniperus spp.) |
| Leek (Allium ampeloprasum) |
| Lentil (Lens culinaris) |
| Mulberry fruit (Morus spp.) |
| Olive leaf (Olea europaea) |
| Onion bulb (Allium cepa) |
| Sweet almond (Prunus amygdalus dulcis) |
| Wheat grass (Triticum aestivum) |
| Alkaline water |
Several weeks later, the patient developed dusky erythematous plaques on her anterior and posterior trunk, face, and proximal extremities. Over the next several weeks, she became progressively weak until she was ultimately bedbound. The plaques over her back began to denude. Upon admission to an outside hospital, she was diagnosed with warfarin‐related skin necrosis, superinfected decubitus ulcers, and severe anemia. She refused blood transfusion, and was discharged home with clindamycin and iron. After her clinical status deteriorated over the subsequent week, she arrived at our hospital by ambulance.
In addition to the herbal medications she had recently started, she had been taking warfarin, furosemide, nitroglycerin via skin patch, and aspirin for over 10 years. On exam, she was febrile, tachycardic, hypotensive, and toxic‐appearing. Conjunctivitis was absent. Her mucous membranes were dry, with easily removable white and yellowish deposits on the buccal mucosa. No lesions or ulcerations were present. Dermatologic exam demonstrated confluent scaly, violaceous erythematous patches and plaques covering 60% of the total body surface area with focal areas that were denuded. Large areas of denuded skin were present over the back, inframammary folds, and underneath her abdominal pannus (Figures 1 and 2). Nikolsky's sign was present. She was oriented to person only.
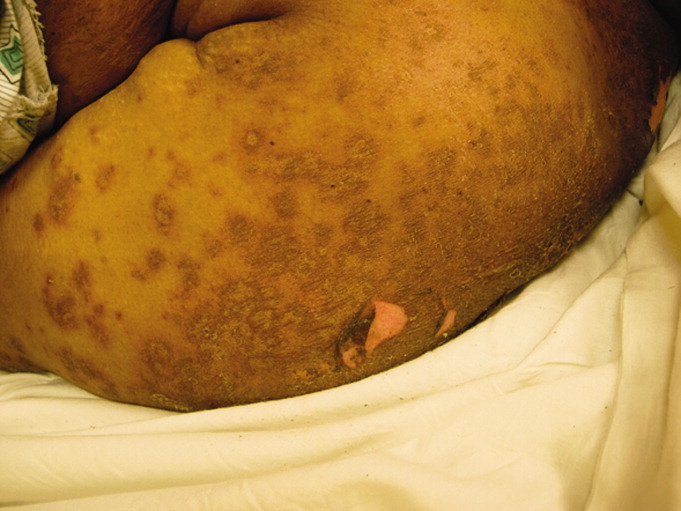
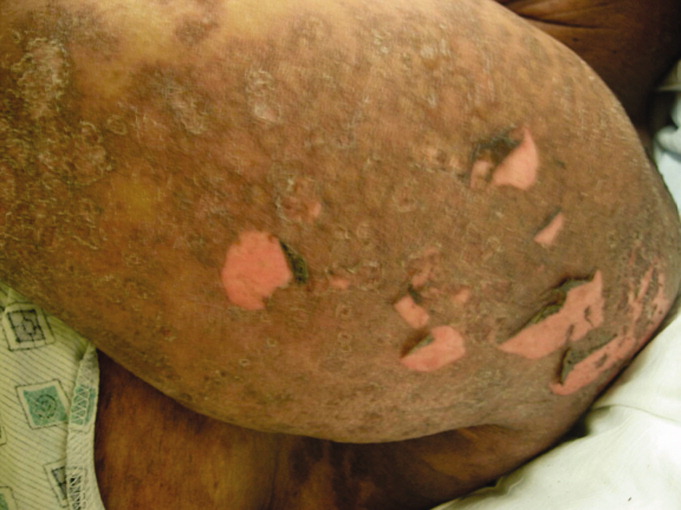
Initial laboratory studies were significant for the following: white blood cell count = 12,800 cells/mm3, hemoglobin = 7.3 g/dL, creatinine = 11.2 mg/dL, blood urea nitrogen = 136 mg/dL, and bicarbonate level = 15 mmol/L. She was admitted to the medical intensive care unit for presumed sepsis. Aggressive resuscitation and broad spectrum antibiotics were administered. A thorough workup for infection, including blood and urine cultures, chest radiography, and lumbar puncture, was unremarkable. Antinuclear antibodies (ANAs) were present in a 1:2560 titer; with a nucleolar and speckled pattern and cytoplasmic antibodies. Additional rheumatologic workup revealed positive anti‐Smith antibody and weakly positive antiribonuclear protein antibody. Pathology from a punch biopsy performed by a dermatology consultant on hospital day 2 demonstrated full‐thickness skin necrosis with scant perivascular infiltrate. While the patient's family had disposed of the pill containers, they had kept several pills. These were sent for analysis, which did not reveal contamination with heavy metals or allopathic medications.
The patient was ultimately diagnosed with TEN and systemic lupus erythematosus with overlap syndrome, and intravenous methylprednisolone was administered. Broad‐spectrum antibiotics were administered for 48 hours, but stopped after workup for infection proved unrevealing. Wound care was mupirocin ointment with petrolatum dressings twice daily as per the hospital's TEN protocol. The patient's course was complicated by acidosis requiring hemodialysis and several tonic‐clonic seizures, a result of presumed lupus cerebritis due to rapidly progressive lesions on serial magnetic resonance images (MRIs) with a negative lumbar puncture. Renal biopsy demonstrated acute tubular necrosis and collapsing glomerulopathy. The patient ultimately recovered, and was discharged to a rehabilitation facility. In follow‐up several months later, she had healing skin with residual dyspigmentation and normal renal function. She was ambulatory and fully oriented, but complained of persistent memory difficulties.
Discussion
While use of complementary or alternative medicine (CAM) is widespread, physicians often underestimate the prevalence of CAM use in their patients. Only one‐half of primary care practitioners are aware of the risk for serious adverse reactions from CAMs.1 This case demonstrates the need for hospitalists to obtain a thorough medication history, including probing for CAM use, when evaluating a new patient. The delayed diagnosis of TEN, whether due to failure to elicit CAM use or recognize the clinical presentation, delayed appropriate treatment by a week and this patient developed potentially lethal complications.
Stevens‐Johnson syndrome (SJS) and TEN lie on a spectrum of disorders involving separation of the epidermis from the dermis when tension is applied to the skin, associated with mucositis, conjunctivitis, and generalized toxicity. The rash is dusky and erythematous, and Nikolsky's sign (separation of the epidermis from the dermis with tension applied to the skin) is present. These entities most commonly develop secondary to medications or infections. Most reactions occur within 60 days of drug initiation. The rash progressives over 1 to 15 days, and the rate of healing is variable. The overall mortality is 30% and is predicted by the SCORTEN system, which incorporates laboratory data, patient history, and the extent of skin breakdown.2 Treatment is primarily supportive; the use of corticosteroids, nonsteroidal immunosuppressive agents, intravenous immunoglobulin (IVIG), or plasmapheresis remains controversial.3
Case reports have described the development of SJS or TEN with CAM use. For example, 1 patient repeatedly developed SJS, with each episode occurring after exposure to an herbal medication containing red clover, burdock, queen's delight, poke root, prickly ash, sassafras bark, and passion flower.4 Similar to our case, identifying the exact agent responsible for TEN was impossible due to large numbers of herbal medications combined into a single pill. SJS and TEN are not limited to Western herbal medicines. Traditional Chinese medications are one of the most common causes of SJS and TEN in East Asia,5 although adulteration with allopathic medications is common in this setting. Ayurvedic medications,6 an ophiopogonis‐containing health drink,7 ginseng,8 and Gingko biloba9, 10 have also been implicated.
Conclusions
This case demonstrates the difficulty in making a diagnosis of CAM‐induced toxicity and identifying the likely agent responsible. Hospitalists must have a high index of suspicion of CAM‐associated toxicity to make this diagnosis, especially when admitting patients who may not volunteer CAM use without direct questioning.
Acknowledgements
This case was initially presented at the Midwest Society of General Internal Medicine regional meeting on September 2526, 2008. Figures 1 and 2 are courtesy of Dr. Robert Chen. The authors thank Dr. James Rhee from the Section of Emergency Medicine at the University of Chicago, who provided toxicology consultation and assisted with toxicology analysis. The authors also acknowledge Meryl Prochaska for manuscript preparation and the patient and her family for their courage and tenacity during the recovery process.
- ,,,.A survey of primary care physicians' perceptions of their patients' use of complementary medicine.Complement Ther Med.2003;11(4):254–260.
- ,,,,,.SCORTEN: a severity‐of‐illness score for toxic epidermal necrolysis.J Invest Dermatol.2000;115(2):149–153.
- ,,.Toxic epidermal necrolysis.J Am Acad Dermatol.2007;56(2):181–200.
- .Severe cutaneous reactions to alternative remedies.Br Med J.1986;293(6548):665–666.
- ,.Toxic epidermal necrolysis in a burns centre: a 6‐year review.Burns.1996;22(4):275–258.
- ,,,,.Herbal medicine induced Stevens‐Johnson syndrome: a case report.Int J Paediatr Dent.2004;14(3):204–207.
- ,,,,.Stevens‐Johnson syndrome caused by a health drink (Eberu) containing ophiopogonis tuber.J Dermatol.1998;25(10):662–665.
- ,,,,.Ginseng as a cause for Stevens‐Johnson syndrome?Lancet.1996;347:1344.
- ,.Stevens‐Johnson syndrome with Ginkgo biloba.J Herbal Pharmacother.2001;1(3):65–69.
- ,,, et al.[Stevens‐Johnson syndrome/toxic epidermal necrolysis treated with intravenous immunoglobulins].Actas Dermosifiliogr.2005;96(9):589–592. [Spanish].
A 49‐year‐old woman with history of rheumatic fever necessitating mechanical mitral valve replacement and a cerebrovascular accident of presumed embolic etiology presented with several months of progressive fatigue, weakness, arthralgias, and myalgias. After an extensive workup, a rheumatologist in the community diagnosed her with systemic lupus erythematosus and dermatomyositis. The patient refused therapy with corticosteroids and disease‐modifying agents, citing concerns of adverse effects. She consulted a naturopathic clinician, who gave her Rejuvenator Pills, Super Booster pill, Genesis Juice, and alkaline water (Table 1).
| Rejuvenator Pill |
| Slippery elm 45 mg (Ulmus rubra) |
| Capsicum 40 mg (Capsicum spp.) |
| Fennel seeds 35 mg (Foeniculum vulgare) |
| Chickweed 35 mg (Stellaria media) |
| Hawthorn berry 30 mg (Crataegus oxyacantha) |
| Mullein 30 mg (Verbascum thapsus) |
| Scullcap 25 mg (Scutellaria spp.) |
| Rosehip 25 mg (Rosa spp.) |
| Barberry 20 mg (Berberis vulgaris) |
| Pau d'arco 20 mg (Tabebuia spp.) |
| Comfrey leaf 20 mg (Symphytum officinale) |
| Alfalfa 20 mg (Medicago sativa) |
| Kelp 20 mg (Laminaria spp.) |
| Papaya leaf 15 mg (Carica papaya) |
| Bee pollen 15 mg |
| Black cohosh 15 mg (Cimicifuga racemosa) |
| Chaparral 10 mg (Larrea tridentata) |
| Ginger 10 mg (Zingiber officinale) |
| Dandelion 5 mg (Taraxacum officinale) |
| Sunflower 5 mg (Helianthus annuus) |
| Licorice root 5 mg (Glycyrrhiza glabra) |
| Cascara sagrada 25 mg |
| Super Booster pill |
| Cascara sagrada |
| Psyllium (Plantago spp.) |
| Fennel (Foeniculum vulgare) |
| Genesis Juice |
| Apple (Malus domestica) |
| Pomegranate (Punica granatum) |
| Aloe vera juice (reconstituted) |
| Whole fruit grape extract (Vitis vinifera spp.) |
| Barley grass (Hordeum vulgare) |
| Cinnamon bark (Cinnamomum spp.) |
| Coriander leaf (Coriandrum sativum) |
| Coriander seed (Coriandrum sativum) |
| Cucumber (Cucumis sativus) |
| Fig fruit (Ficus carica) |
| Garlic bulb (Allium sativum) |
| Juniper berry (Juniperus spp.) |
| Leek (Allium ampeloprasum) |
| Lentil (Lens culinaris) |
| Mulberry fruit (Morus spp.) |
| Olive leaf (Olea europaea) |
| Onion bulb (Allium cepa) |
| Sweet almond (Prunus amygdalus dulcis) |
| Wheat grass (Triticum aestivum) |
| Alkaline water |
Several weeks later, the patient developed dusky erythematous plaques on her anterior and posterior trunk, face, and proximal extremities. Over the next several weeks, she became progressively weak until she was ultimately bedbound. The plaques over her back began to denude. Upon admission to an outside hospital, she was diagnosed with warfarin‐related skin necrosis, superinfected decubitus ulcers, and severe anemia. She refused blood transfusion, and was discharged home with clindamycin and iron. After her clinical status deteriorated over the subsequent week, she arrived at our hospital by ambulance.
In addition to the herbal medications she had recently started, she had been taking warfarin, furosemide, nitroglycerin via skin patch, and aspirin for over 10 years. On exam, she was febrile, tachycardic, hypotensive, and toxic‐appearing. Conjunctivitis was absent. Her mucous membranes were dry, with easily removable white and yellowish deposits on the buccal mucosa. No lesions or ulcerations were present. Dermatologic exam demonstrated confluent scaly, violaceous erythematous patches and plaques covering 60% of the total body surface area with focal areas that were denuded. Large areas of denuded skin were present over the back, inframammary folds, and underneath her abdominal pannus (Figures 1 and 2). Nikolsky's sign was present. She was oriented to person only.
Initial laboratory studies were significant for the following: white blood cell count = 12,800 cells/mm3, hemoglobin = 7.3 g/dL, creatinine = 11.2 mg/dL, blood urea nitrogen = 136 mg/dL, and bicarbonate level = 15 mmol/L. She was admitted to the medical intensive care unit for presumed sepsis. Aggressive resuscitation and broad spectrum antibiotics were administered. A thorough workup for infection, including blood and urine cultures, chest radiography, and lumbar puncture, was unremarkable. Antinuclear antibodies (ANAs) were present in a 1:2560 titer; with a nucleolar and speckled pattern and cytoplasmic antibodies. Additional rheumatologic workup revealed positive anti‐Smith antibody and weakly positive antiribonuclear protein antibody. Pathology from a punch biopsy performed by a dermatology consultant on hospital day 2 demonstrated full‐thickness skin necrosis with scant perivascular infiltrate. While the patient's family had disposed of the pill containers, they had kept several pills. These were sent for analysis, which did not reveal contamination with heavy metals or allopathic medications.
The patient was ultimately diagnosed with TEN and systemic lupus erythematosus with overlap syndrome, and intravenous methylprednisolone was administered. Broad‐spectrum antibiotics were administered for 48 hours, but stopped after workup for infection proved unrevealing. Wound care was mupirocin ointment with petrolatum dressings twice daily as per the hospital's TEN protocol. The patient's course was complicated by acidosis requiring hemodialysis and several tonic‐clonic seizures, a result of presumed lupus cerebritis due to rapidly progressive lesions on serial magnetic resonance images (MRIs) with a negative lumbar puncture. Renal biopsy demonstrated acute tubular necrosis and collapsing glomerulopathy. The patient ultimately recovered, and was discharged to a rehabilitation facility. In follow‐up several months later, she had healing skin with residual dyspigmentation and normal renal function. She was ambulatory and fully oriented, but complained of persistent memory difficulties.
Discussion
While use of complementary or alternative medicine (CAM) is widespread, physicians often underestimate the prevalence of CAM use in their patients. Only one‐half of primary care practitioners are aware of the risk for serious adverse reactions from CAMs.1 This case demonstrates the need for hospitalists to obtain a thorough medication history, including probing for CAM use, when evaluating a new patient. The delayed diagnosis of TEN, whether due to failure to elicit CAM use or recognize the clinical presentation, delayed appropriate treatment by a week and this patient developed potentially lethal complications.
Stevens‐Johnson syndrome (SJS) and TEN lie on a spectrum of disorders involving separation of the epidermis from the dermis when tension is applied to the skin, associated with mucositis, conjunctivitis, and generalized toxicity. The rash is dusky and erythematous, and Nikolsky's sign (separation of the epidermis from the dermis with tension applied to the skin) is present. These entities most commonly develop secondary to medications or infections. Most reactions occur within 60 days of drug initiation. The rash progressives over 1 to 15 days, and the rate of healing is variable. The overall mortality is 30% and is predicted by the SCORTEN system, which incorporates laboratory data, patient history, and the extent of skin breakdown.2 Treatment is primarily supportive; the use of corticosteroids, nonsteroidal immunosuppressive agents, intravenous immunoglobulin (IVIG), or plasmapheresis remains controversial.3
Case reports have described the development of SJS or TEN with CAM use. For example, 1 patient repeatedly developed SJS, with each episode occurring after exposure to an herbal medication containing red clover, burdock, queen's delight, poke root, prickly ash, sassafras bark, and passion flower.4 Similar to our case, identifying the exact agent responsible for TEN was impossible due to large numbers of herbal medications combined into a single pill. SJS and TEN are not limited to Western herbal medicines. Traditional Chinese medications are one of the most common causes of SJS and TEN in East Asia,5 although adulteration with allopathic medications is common in this setting. Ayurvedic medications,6 an ophiopogonis‐containing health drink,7 ginseng,8 and Gingko biloba9, 10 have also been implicated.
Conclusions
This case demonstrates the difficulty in making a diagnosis of CAM‐induced toxicity and identifying the likely agent responsible. Hospitalists must have a high index of suspicion of CAM‐associated toxicity to make this diagnosis, especially when admitting patients who may not volunteer CAM use without direct questioning.
Acknowledgements
This case was initially presented at the Midwest Society of General Internal Medicine regional meeting on September 2526, 2008. Figures 1 and 2 are courtesy of Dr. Robert Chen. The authors thank Dr. James Rhee from the Section of Emergency Medicine at the University of Chicago, who provided toxicology consultation and assisted with toxicology analysis. The authors also acknowledge Meryl Prochaska for manuscript preparation and the patient and her family for their courage and tenacity during the recovery process.
A 49‐year‐old woman with history of rheumatic fever necessitating mechanical mitral valve replacement and a cerebrovascular accident of presumed embolic etiology presented with several months of progressive fatigue, weakness, arthralgias, and myalgias. After an extensive workup, a rheumatologist in the community diagnosed her with systemic lupus erythematosus and dermatomyositis. The patient refused therapy with corticosteroids and disease‐modifying agents, citing concerns of adverse effects. She consulted a naturopathic clinician, who gave her Rejuvenator Pills, Super Booster pill, Genesis Juice, and alkaline water (Table 1).
| Rejuvenator Pill |
| Slippery elm 45 mg (Ulmus rubra) |
| Capsicum 40 mg (Capsicum spp.) |
| Fennel seeds 35 mg (Foeniculum vulgare) |
| Chickweed 35 mg (Stellaria media) |
| Hawthorn berry 30 mg (Crataegus oxyacantha) |
| Mullein 30 mg (Verbascum thapsus) |
| Scullcap 25 mg (Scutellaria spp.) |
| Rosehip 25 mg (Rosa spp.) |
| Barberry 20 mg (Berberis vulgaris) |
| Pau d'arco 20 mg (Tabebuia spp.) |
| Comfrey leaf 20 mg (Symphytum officinale) |
| Alfalfa 20 mg (Medicago sativa) |
| Kelp 20 mg (Laminaria spp.) |
| Papaya leaf 15 mg (Carica papaya) |
| Bee pollen 15 mg |
| Black cohosh 15 mg (Cimicifuga racemosa) |
| Chaparral 10 mg (Larrea tridentata) |
| Ginger 10 mg (Zingiber officinale) |
| Dandelion 5 mg (Taraxacum officinale) |
| Sunflower 5 mg (Helianthus annuus) |
| Licorice root 5 mg (Glycyrrhiza glabra) |
| Cascara sagrada 25 mg |
| Super Booster pill |
| Cascara sagrada |
| Psyllium (Plantago spp.) |
| Fennel (Foeniculum vulgare) |
| Genesis Juice |
| Apple (Malus domestica) |
| Pomegranate (Punica granatum) |
| Aloe vera juice (reconstituted) |
| Whole fruit grape extract (Vitis vinifera spp.) |
| Barley grass (Hordeum vulgare) |
| Cinnamon bark (Cinnamomum spp.) |
| Coriander leaf (Coriandrum sativum) |
| Coriander seed (Coriandrum sativum) |
| Cucumber (Cucumis sativus) |
| Fig fruit (Ficus carica) |
| Garlic bulb (Allium sativum) |
| Juniper berry (Juniperus spp.) |
| Leek (Allium ampeloprasum) |
| Lentil (Lens culinaris) |
| Mulberry fruit (Morus spp.) |
| Olive leaf (Olea europaea) |
| Onion bulb (Allium cepa) |
| Sweet almond (Prunus amygdalus dulcis) |
| Wheat grass (Triticum aestivum) |
| Alkaline water |
Several weeks later, the patient developed dusky erythematous plaques on her anterior and posterior trunk, face, and proximal extremities. Over the next several weeks, she became progressively weak until she was ultimately bedbound. The plaques over her back began to denude. Upon admission to an outside hospital, she was diagnosed with warfarin‐related skin necrosis, superinfected decubitus ulcers, and severe anemia. She refused blood transfusion, and was discharged home with clindamycin and iron. After her clinical status deteriorated over the subsequent week, she arrived at our hospital by ambulance.
In addition to the herbal medications she had recently started, she had been taking warfarin, furosemide, nitroglycerin via skin patch, and aspirin for over 10 years. On exam, she was febrile, tachycardic, hypotensive, and toxic‐appearing. Conjunctivitis was absent. Her mucous membranes were dry, with easily removable white and yellowish deposits on the buccal mucosa. No lesions or ulcerations were present. Dermatologic exam demonstrated confluent scaly, violaceous erythematous patches and plaques covering 60% of the total body surface area with focal areas that were denuded. Large areas of denuded skin were present over the back, inframammary folds, and underneath her abdominal pannus (Figures 1 and 2). Nikolsky's sign was present. She was oriented to person only.
Initial laboratory studies were significant for the following: white blood cell count = 12,800 cells/mm3, hemoglobin = 7.3 g/dL, creatinine = 11.2 mg/dL, blood urea nitrogen = 136 mg/dL, and bicarbonate level = 15 mmol/L. She was admitted to the medical intensive care unit for presumed sepsis. Aggressive resuscitation and broad spectrum antibiotics were administered. A thorough workup for infection, including blood and urine cultures, chest radiography, and lumbar puncture, was unremarkable. Antinuclear antibodies (ANAs) were present in a 1:2560 titer; with a nucleolar and speckled pattern and cytoplasmic antibodies. Additional rheumatologic workup revealed positive anti‐Smith antibody and weakly positive antiribonuclear protein antibody. Pathology from a punch biopsy performed by a dermatology consultant on hospital day 2 demonstrated full‐thickness skin necrosis with scant perivascular infiltrate. While the patient's family had disposed of the pill containers, they had kept several pills. These were sent for analysis, which did not reveal contamination with heavy metals or allopathic medications.
The patient was ultimately diagnosed with TEN and systemic lupus erythematosus with overlap syndrome, and intravenous methylprednisolone was administered. Broad‐spectrum antibiotics were administered for 48 hours, but stopped after workup for infection proved unrevealing. Wound care was mupirocin ointment with petrolatum dressings twice daily as per the hospital's TEN protocol. The patient's course was complicated by acidosis requiring hemodialysis and several tonic‐clonic seizures, a result of presumed lupus cerebritis due to rapidly progressive lesions on serial magnetic resonance images (MRIs) with a negative lumbar puncture. Renal biopsy demonstrated acute tubular necrosis and collapsing glomerulopathy. The patient ultimately recovered, and was discharged to a rehabilitation facility. In follow‐up several months later, she had healing skin with residual dyspigmentation and normal renal function. She was ambulatory and fully oriented, but complained of persistent memory difficulties.
Discussion
While use of complementary or alternative medicine (CAM) is widespread, physicians often underestimate the prevalence of CAM use in their patients. Only one‐half of primary care practitioners are aware of the risk for serious adverse reactions from CAMs.1 This case demonstrates the need for hospitalists to obtain a thorough medication history, including probing for CAM use, when evaluating a new patient. The delayed diagnosis of TEN, whether due to failure to elicit CAM use or recognize the clinical presentation, delayed appropriate treatment by a week and this patient developed potentially lethal complications.
Stevens‐Johnson syndrome (SJS) and TEN lie on a spectrum of disorders involving separation of the epidermis from the dermis when tension is applied to the skin, associated with mucositis, conjunctivitis, and generalized toxicity. The rash is dusky and erythematous, and Nikolsky's sign (separation of the epidermis from the dermis with tension applied to the skin) is present. These entities most commonly develop secondary to medications or infections. Most reactions occur within 60 days of drug initiation. The rash progressives over 1 to 15 days, and the rate of healing is variable. The overall mortality is 30% and is predicted by the SCORTEN system, which incorporates laboratory data, patient history, and the extent of skin breakdown.2 Treatment is primarily supportive; the use of corticosteroids, nonsteroidal immunosuppressive agents, intravenous immunoglobulin (IVIG), or plasmapheresis remains controversial.3
Case reports have described the development of SJS or TEN with CAM use. For example, 1 patient repeatedly developed SJS, with each episode occurring after exposure to an herbal medication containing red clover, burdock, queen's delight, poke root, prickly ash, sassafras bark, and passion flower.4 Similar to our case, identifying the exact agent responsible for TEN was impossible due to large numbers of herbal medications combined into a single pill. SJS and TEN are not limited to Western herbal medicines. Traditional Chinese medications are one of the most common causes of SJS and TEN in East Asia,5 although adulteration with allopathic medications is common in this setting. Ayurvedic medications,6 an ophiopogonis‐containing health drink,7 ginseng,8 and Gingko biloba9, 10 have also been implicated.
Conclusions
This case demonstrates the difficulty in making a diagnosis of CAM‐induced toxicity and identifying the likely agent responsible. Hospitalists must have a high index of suspicion of CAM‐associated toxicity to make this diagnosis, especially when admitting patients who may not volunteer CAM use without direct questioning.
Acknowledgements
This case was initially presented at the Midwest Society of General Internal Medicine regional meeting on September 2526, 2008. Figures 1 and 2 are courtesy of Dr. Robert Chen. The authors thank Dr. James Rhee from the Section of Emergency Medicine at the University of Chicago, who provided toxicology consultation and assisted with toxicology analysis. The authors also acknowledge Meryl Prochaska for manuscript preparation and the patient and her family for their courage and tenacity during the recovery process.
- ,,,.A survey of primary care physicians' perceptions of their patients' use of complementary medicine.Complement Ther Med.2003;11(4):254–260.
- ,,,,,.SCORTEN: a severity‐of‐illness score for toxic epidermal necrolysis.J Invest Dermatol.2000;115(2):149–153.
- ,,.Toxic epidermal necrolysis.J Am Acad Dermatol.2007;56(2):181–200.
- .Severe cutaneous reactions to alternative remedies.Br Med J.1986;293(6548):665–666.
- ,.Toxic epidermal necrolysis in a burns centre: a 6‐year review.Burns.1996;22(4):275–258.
- ,,,,.Herbal medicine induced Stevens‐Johnson syndrome: a case report.Int J Paediatr Dent.2004;14(3):204–207.
- ,,,,.Stevens‐Johnson syndrome caused by a health drink (Eberu) containing ophiopogonis tuber.J Dermatol.1998;25(10):662–665.
- ,,,,.Ginseng as a cause for Stevens‐Johnson syndrome?Lancet.1996;347:1344.
- ,.Stevens‐Johnson syndrome with Ginkgo biloba.J Herbal Pharmacother.2001;1(3):65–69.
- ,,, et al.[Stevens‐Johnson syndrome/toxic epidermal necrolysis treated with intravenous immunoglobulins].Actas Dermosifiliogr.2005;96(9):589–592. [Spanish].
- ,,,.A survey of primary care physicians' perceptions of their patients' use of complementary medicine.Complement Ther Med.2003;11(4):254–260.
- ,,,,,.SCORTEN: a severity‐of‐illness score for toxic epidermal necrolysis.J Invest Dermatol.2000;115(2):149–153.
- ,,.Toxic epidermal necrolysis.J Am Acad Dermatol.2007;56(2):181–200.
- .Severe cutaneous reactions to alternative remedies.Br Med J.1986;293(6548):665–666.
- ,.Toxic epidermal necrolysis in a burns centre: a 6‐year review.Burns.1996;22(4):275–258.
- ,,,,.Herbal medicine induced Stevens‐Johnson syndrome: a case report.Int J Paediatr Dent.2004;14(3):204–207.
- ,,,,.Stevens‐Johnson syndrome caused by a health drink (Eberu) containing ophiopogonis tuber.J Dermatol.1998;25(10):662–665.
- ,,,,.Ginseng as a cause for Stevens‐Johnson syndrome?Lancet.1996;347:1344.
- ,.Stevens‐Johnson syndrome with Ginkgo biloba.J Herbal Pharmacother.2001;1(3):65–69.
- ,,, et al.[Stevens‐Johnson syndrome/toxic epidermal necrolysis treated with intravenous immunoglobulins].Actas Dermosifiliogr.2005;96(9):589–592. [Spanish].
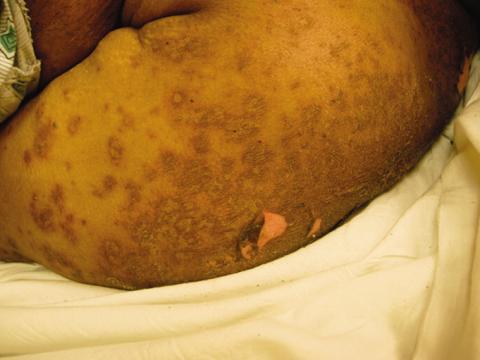
A Multiple Choice Answer?
A 49‐year‐old man with a history of hypertension presented to our hospital with a 2‐week history of sharp pain in the right upper abdomen and right lower chest radiating to the back. The patient reported a few days of fevers, chills, drenching night sweats, shortness of breath, malaise, and fatigue. He denied recent travel. Vital signs were temperature 38.4C, blood pressure 119/74 mmHg, heart rate 95 beats/minutes, respiratory rate 16 breaths/minutes, and oxygen saturation 96% on 5 L nasal cannula. Physical examination revealed poor dentition, right upper abdominal quadrant tenderness, and dullness to percussion over the right lung base.
Initial labs showed white blood count (WBC) 22,540/mm3, alkaline phosphatase 280 units/L, bilirubin 1.1 mg/dL, aspartate aminotransferase (AST) 28 units/L, alanine aminotransferase (ALT) 33 units/L. Blood cultures were negative. An human immunodeficiency virus (HIV)1/HIV2 antibody screen was negative. Computed tomography (CT) of the chest demonstrated a large cystic lesion in the diaphragmatic dome of the liver with multiple lesions in the right lobe of the liver. Elevation of the right hemidiaphragm and moderate right pleural effusion were noted. CT abdomen showed multiple areas of fluid collection within the liver suspicious for liver abscesses (see Figure 1). Multiple gallstones were seen within gallbladder with a large stone in the region of the gallbladder neck vs. cystic duct without evidence of extrahepatic biliary dilatation. There was mild distention of the appendix with minimal soft tissue stranding.
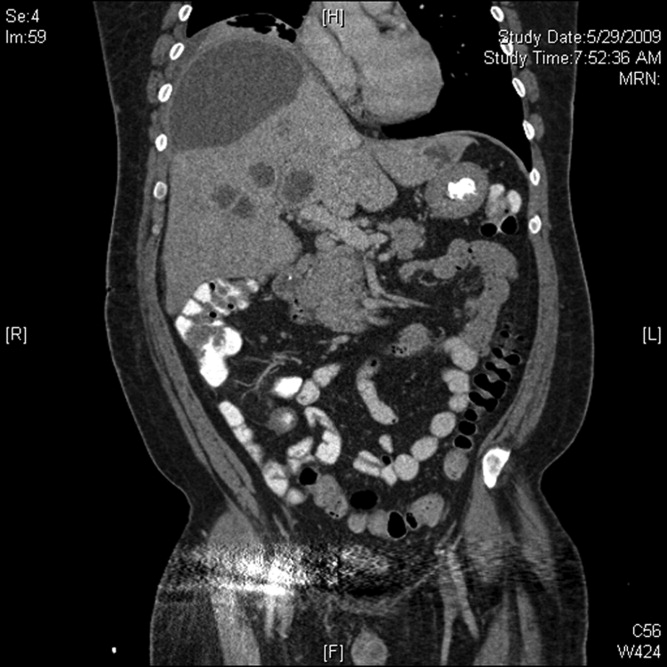
The patient underwent ultrasound‐guided drainage of the largest liver abscess. Cultures from the aspiration grew Fusobacterium nucleatum. The patient's stool studies for ova and parasites were negative. The patient was started on piperacillin/tazobactam and metronidazole, then switched to ertapenem. A hepatobiliary iminodiacetic acid (HIDA) scan confirmed cholecystitis, and the patient underwent open cholecystectomy. Pathology on the gallbladder returned as chronic cholecystitis with cholelithiasis. A full dental examination revealed possible periapical abscesses of teeth #12 and #30 and stringent daily oral hygiene was recommended. Tooth extraction was initially recommended but ultimately postponed. Plans were made for dental follow‐up.
With continued antibiotic treatment, the patient's fevers resolved and leukocytosis improved. A follow‐up CT abdomen/pelvis obtained on hospital day 10 showed a reduction in size of the multiple liver abscesses. There was also increased prominence of the appendix with mild stranding. The patient was taken for appendectomy. Pathology was consistent with acute appendicitis with focal fat necrosis. The patient was ultimately discharged with the plan being to continue ertapenem until radiographic resolution of all the abscesses was demonstrated.
Discussion
Pyogenic liver abscesses are infrequently encountered in the western population, but when present, result in significant morbidity and mortality.1 Mortality rates range from 6% to 31%, decreased from 100% mortality in the preantibiotic era.1 The leading cause of pyogenic liver abscesses has been in the past ascribed to ruptured appendicitis.2 However, biliary tract pathology is now the leading cause, accounting for 43% to 60% of cases.2 In addition, hematogenous seeding of infection from the oral cavity has been recognized in the literature as a potential source of infection in the development of pyogenic liver abscesses.2
The empiric treatment of pyogenic liver abscesses is intravenous broad‐spectrum antibiotics, most commonly metronidazole in combination with quinolones, aminoglycosides, third generation cephalosporins, carbapenems, piperacillin/tazobactam, ampicillin‐sulbactam, or amoxicillin/clavulanate.1 The optimal treatment course is controversial but suggested to include 2 weeks to 3 weeks of intravenous antibiotics followed by at least 3 weeks to 4 weeks of oral antibiotics.1
According to a study of 84 patients hospitalized with pyogenic liver abscesses of which 70 cases were cultured, the most typical organisms isolated from liver abscesses are Streptococcus spp. (40.5%), Escherichia coli (27.4%), Klebsiella spp. (14.3%), and anaerobic organisms (17.9%).1 The anaerobic Gram‐negative bacterium Fusobacterium nucleatum, known to play a role in periodontal disease, is an uncommon cause of liver abscesses: a review of the literature revealed only 14 cases of liver abscesses caused by Fusobacterium nucleatum, five cases of which occurred in patients with known immunodeficiency, and a retrospective study of 70 cases of liver abscesses revealed only 2 cases linked to this bacterium.1, 2 Though accounting for a minority of cases of pyogenic liver abscesses, it is commonly cited as a cause of liver abscesses resulting from spread of infection from the oral cavity. Four case reports have implicated severe dental disease or recent dental work in the development of pyogenic liver abscesses involving Fusobacterium nucleatum.2 For example, a literature search revealed a case report of a patient with a liver abscess due to Fusobacterium nucleatum resulting from hematogenous spread of infection from the oral cavity.2
Although Fusobacterium has rarely been reported in biliary culture from patients with cholangitis or gangrenous cholecystitis,3 this organism has been identified as a causative organism in appendicitis. In two separate studies of 41 children with appendicitis and 30 patients older than 12 years with gangrenous or perforated appendicitis, Fusobacterium nucleatum or Fusobacterium spp. were isolated in 44% and 33% of cases, respectively.4, 5 Nevertheless, the mechanism of appendicitis causing liver abscesses is thought to be by direct spread via the peritoneum after perforation.2 Thus, despite the isolation of this bacterium from appendectomy specimens, appendicitis is less likely the source of infection in this patient given that there is no evidence that appendiceal perforation occurred in this case.
Our patient was found to have dental abscesses, cholecystitis requiring cholecystectomy, and appendicitis requiring appendectomyall of which, to varying degrees, were plausible sources of infection by virtue of their known role in the development of pyogenic liver abscesses. Although periodontal disease was the likely source of Fusobacterium nucleatum infection, we could not exclude the leading causes of pyogenic liver abscesses, appendicitis and/or biliary tract disease. As a result, the patient underwent 2 surgeries and was counseled to maintain good oral hygiene in order to eliminate all persisting sources of infection.
This was an unusual case in which the question What is the source of infection? appears to have had multiple correct answers. We theorize that leaving any 1 of the 3 possible sources of infection in place could have led to treatment failure. This patient is a humbling reminder that not every clinical problem will have one clear solution. In such cases, all possible underlying conditions need to be managed appropriately to achieve the desired outcome.
- ,,,,,.Pyogenic liver abscesses: mortality‐related factors.Eur J Gastroenterol Hepatol.2007;19:853–858.
- ,,, et al.Pyogenic liver abscess related to dental disease in an immunocompetent host.Intern Med.2008;47:675–678.
- ,,,.Gangrenous cholecystitis and acute cholangitis associated with anaerobic bacteria in bile.Eur J Clin Microbiol.1986;5:35–39.
- ,,,,.Bacteriology of histopathologically defined appendicitis in children.Ped Infect Dis J.2000;19:1078–1083.
- ,,, et al.The bacteriology of gangrenous and perforated appendicitis—revisited.Ann Surg.1990;211:165–171.
A 49‐year‐old man with a history of hypertension presented to our hospital with a 2‐week history of sharp pain in the right upper abdomen and right lower chest radiating to the back. The patient reported a few days of fevers, chills, drenching night sweats, shortness of breath, malaise, and fatigue. He denied recent travel. Vital signs were temperature 38.4C, blood pressure 119/74 mmHg, heart rate 95 beats/minutes, respiratory rate 16 breaths/minutes, and oxygen saturation 96% on 5 L nasal cannula. Physical examination revealed poor dentition, right upper abdominal quadrant tenderness, and dullness to percussion over the right lung base.
Initial labs showed white blood count (WBC) 22,540/mm3, alkaline phosphatase 280 units/L, bilirubin 1.1 mg/dL, aspartate aminotransferase (AST) 28 units/L, alanine aminotransferase (ALT) 33 units/L. Blood cultures were negative. An human immunodeficiency virus (HIV)1/HIV2 antibody screen was negative. Computed tomography (CT) of the chest demonstrated a large cystic lesion in the diaphragmatic dome of the liver with multiple lesions in the right lobe of the liver. Elevation of the right hemidiaphragm and moderate right pleural effusion were noted. CT abdomen showed multiple areas of fluid collection within the liver suspicious for liver abscesses (see Figure 1). Multiple gallstones were seen within gallbladder with a large stone in the region of the gallbladder neck vs. cystic duct without evidence of extrahepatic biliary dilatation. There was mild distention of the appendix with minimal soft tissue stranding.
The patient underwent ultrasound‐guided drainage of the largest liver abscess. Cultures from the aspiration grew Fusobacterium nucleatum. The patient's stool studies for ova and parasites were negative. The patient was started on piperacillin/tazobactam and metronidazole, then switched to ertapenem. A hepatobiliary iminodiacetic acid (HIDA) scan confirmed cholecystitis, and the patient underwent open cholecystectomy. Pathology on the gallbladder returned as chronic cholecystitis with cholelithiasis. A full dental examination revealed possible periapical abscesses of teeth #12 and #30 and stringent daily oral hygiene was recommended. Tooth extraction was initially recommended but ultimately postponed. Plans were made for dental follow‐up.
With continued antibiotic treatment, the patient's fevers resolved and leukocytosis improved. A follow‐up CT abdomen/pelvis obtained on hospital day 10 showed a reduction in size of the multiple liver abscesses. There was also increased prominence of the appendix with mild stranding. The patient was taken for appendectomy. Pathology was consistent with acute appendicitis with focal fat necrosis. The patient was ultimately discharged with the plan being to continue ertapenem until radiographic resolution of all the abscesses was demonstrated.
Discussion
Pyogenic liver abscesses are infrequently encountered in the western population, but when present, result in significant morbidity and mortality.1 Mortality rates range from 6% to 31%, decreased from 100% mortality in the preantibiotic era.1 The leading cause of pyogenic liver abscesses has been in the past ascribed to ruptured appendicitis.2 However, biliary tract pathology is now the leading cause, accounting for 43% to 60% of cases.2 In addition, hematogenous seeding of infection from the oral cavity has been recognized in the literature as a potential source of infection in the development of pyogenic liver abscesses.2
The empiric treatment of pyogenic liver abscesses is intravenous broad‐spectrum antibiotics, most commonly metronidazole in combination with quinolones, aminoglycosides, third generation cephalosporins, carbapenems, piperacillin/tazobactam, ampicillin‐sulbactam, or amoxicillin/clavulanate.1 The optimal treatment course is controversial but suggested to include 2 weeks to 3 weeks of intravenous antibiotics followed by at least 3 weeks to 4 weeks of oral antibiotics.1
According to a study of 84 patients hospitalized with pyogenic liver abscesses of which 70 cases were cultured, the most typical organisms isolated from liver abscesses are Streptococcus spp. (40.5%), Escherichia coli (27.4%), Klebsiella spp. (14.3%), and anaerobic organisms (17.9%).1 The anaerobic Gram‐negative bacterium Fusobacterium nucleatum, known to play a role in periodontal disease, is an uncommon cause of liver abscesses: a review of the literature revealed only 14 cases of liver abscesses caused by Fusobacterium nucleatum, five cases of which occurred in patients with known immunodeficiency, and a retrospective study of 70 cases of liver abscesses revealed only 2 cases linked to this bacterium.1, 2 Though accounting for a minority of cases of pyogenic liver abscesses, it is commonly cited as a cause of liver abscesses resulting from spread of infection from the oral cavity. Four case reports have implicated severe dental disease or recent dental work in the development of pyogenic liver abscesses involving Fusobacterium nucleatum.2 For example, a literature search revealed a case report of a patient with a liver abscess due to Fusobacterium nucleatum resulting from hematogenous spread of infection from the oral cavity.2
Although Fusobacterium has rarely been reported in biliary culture from patients with cholangitis or gangrenous cholecystitis,3 this organism has been identified as a causative organism in appendicitis. In two separate studies of 41 children with appendicitis and 30 patients older than 12 years with gangrenous or perforated appendicitis, Fusobacterium nucleatum or Fusobacterium spp. were isolated in 44% and 33% of cases, respectively.4, 5 Nevertheless, the mechanism of appendicitis causing liver abscesses is thought to be by direct spread via the peritoneum after perforation.2 Thus, despite the isolation of this bacterium from appendectomy specimens, appendicitis is less likely the source of infection in this patient given that there is no evidence that appendiceal perforation occurred in this case.
Our patient was found to have dental abscesses, cholecystitis requiring cholecystectomy, and appendicitis requiring appendectomyall of which, to varying degrees, were plausible sources of infection by virtue of their known role in the development of pyogenic liver abscesses. Although periodontal disease was the likely source of Fusobacterium nucleatum infection, we could not exclude the leading causes of pyogenic liver abscesses, appendicitis and/or biliary tract disease. As a result, the patient underwent 2 surgeries and was counseled to maintain good oral hygiene in order to eliminate all persisting sources of infection.
This was an unusual case in which the question What is the source of infection? appears to have had multiple correct answers. We theorize that leaving any 1 of the 3 possible sources of infection in place could have led to treatment failure. This patient is a humbling reminder that not every clinical problem will have one clear solution. In such cases, all possible underlying conditions need to be managed appropriately to achieve the desired outcome.
A 49‐year‐old man with a history of hypertension presented to our hospital with a 2‐week history of sharp pain in the right upper abdomen and right lower chest radiating to the back. The patient reported a few days of fevers, chills, drenching night sweats, shortness of breath, malaise, and fatigue. He denied recent travel. Vital signs were temperature 38.4C, blood pressure 119/74 mmHg, heart rate 95 beats/minutes, respiratory rate 16 breaths/minutes, and oxygen saturation 96% on 5 L nasal cannula. Physical examination revealed poor dentition, right upper abdominal quadrant tenderness, and dullness to percussion over the right lung base.
Initial labs showed white blood count (WBC) 22,540/mm3, alkaline phosphatase 280 units/L, bilirubin 1.1 mg/dL, aspartate aminotransferase (AST) 28 units/L, alanine aminotransferase (ALT) 33 units/L. Blood cultures were negative. An human immunodeficiency virus (HIV)1/HIV2 antibody screen was negative. Computed tomography (CT) of the chest demonstrated a large cystic lesion in the diaphragmatic dome of the liver with multiple lesions in the right lobe of the liver. Elevation of the right hemidiaphragm and moderate right pleural effusion were noted. CT abdomen showed multiple areas of fluid collection within the liver suspicious for liver abscesses (see Figure 1). Multiple gallstones were seen within gallbladder with a large stone in the region of the gallbladder neck vs. cystic duct without evidence of extrahepatic biliary dilatation. There was mild distention of the appendix with minimal soft tissue stranding.
The patient underwent ultrasound‐guided drainage of the largest liver abscess. Cultures from the aspiration grew Fusobacterium nucleatum. The patient's stool studies for ova and parasites were negative. The patient was started on piperacillin/tazobactam and metronidazole, then switched to ertapenem. A hepatobiliary iminodiacetic acid (HIDA) scan confirmed cholecystitis, and the patient underwent open cholecystectomy. Pathology on the gallbladder returned as chronic cholecystitis with cholelithiasis. A full dental examination revealed possible periapical abscesses of teeth #12 and #30 and stringent daily oral hygiene was recommended. Tooth extraction was initially recommended but ultimately postponed. Plans were made for dental follow‐up.
With continued antibiotic treatment, the patient's fevers resolved and leukocytosis improved. A follow‐up CT abdomen/pelvis obtained on hospital day 10 showed a reduction in size of the multiple liver abscesses. There was also increased prominence of the appendix with mild stranding. The patient was taken for appendectomy. Pathology was consistent with acute appendicitis with focal fat necrosis. The patient was ultimately discharged with the plan being to continue ertapenem until radiographic resolution of all the abscesses was demonstrated.
Discussion
Pyogenic liver abscesses are infrequently encountered in the western population, but when present, result in significant morbidity and mortality.1 Mortality rates range from 6% to 31%, decreased from 100% mortality in the preantibiotic era.1 The leading cause of pyogenic liver abscesses has been in the past ascribed to ruptured appendicitis.2 However, biliary tract pathology is now the leading cause, accounting for 43% to 60% of cases.2 In addition, hematogenous seeding of infection from the oral cavity has been recognized in the literature as a potential source of infection in the development of pyogenic liver abscesses.2
The empiric treatment of pyogenic liver abscesses is intravenous broad‐spectrum antibiotics, most commonly metronidazole in combination with quinolones, aminoglycosides, third generation cephalosporins, carbapenems, piperacillin/tazobactam, ampicillin‐sulbactam, or amoxicillin/clavulanate.1 The optimal treatment course is controversial but suggested to include 2 weeks to 3 weeks of intravenous antibiotics followed by at least 3 weeks to 4 weeks of oral antibiotics.1
According to a study of 84 patients hospitalized with pyogenic liver abscesses of which 70 cases were cultured, the most typical organisms isolated from liver abscesses are Streptococcus spp. (40.5%), Escherichia coli (27.4%), Klebsiella spp. (14.3%), and anaerobic organisms (17.9%).1 The anaerobic Gram‐negative bacterium Fusobacterium nucleatum, known to play a role in periodontal disease, is an uncommon cause of liver abscesses: a review of the literature revealed only 14 cases of liver abscesses caused by Fusobacterium nucleatum, five cases of which occurred in patients with known immunodeficiency, and a retrospective study of 70 cases of liver abscesses revealed only 2 cases linked to this bacterium.1, 2 Though accounting for a minority of cases of pyogenic liver abscesses, it is commonly cited as a cause of liver abscesses resulting from spread of infection from the oral cavity. Four case reports have implicated severe dental disease or recent dental work in the development of pyogenic liver abscesses involving Fusobacterium nucleatum.2 For example, a literature search revealed a case report of a patient with a liver abscess due to Fusobacterium nucleatum resulting from hematogenous spread of infection from the oral cavity.2
Although Fusobacterium has rarely been reported in biliary culture from patients with cholangitis or gangrenous cholecystitis,3 this organism has been identified as a causative organism in appendicitis. In two separate studies of 41 children with appendicitis and 30 patients older than 12 years with gangrenous or perforated appendicitis, Fusobacterium nucleatum or Fusobacterium spp. were isolated in 44% and 33% of cases, respectively.4, 5 Nevertheless, the mechanism of appendicitis causing liver abscesses is thought to be by direct spread via the peritoneum after perforation.2 Thus, despite the isolation of this bacterium from appendectomy specimens, appendicitis is less likely the source of infection in this patient given that there is no evidence that appendiceal perforation occurred in this case.
Our patient was found to have dental abscesses, cholecystitis requiring cholecystectomy, and appendicitis requiring appendectomyall of which, to varying degrees, were plausible sources of infection by virtue of their known role in the development of pyogenic liver abscesses. Although periodontal disease was the likely source of Fusobacterium nucleatum infection, we could not exclude the leading causes of pyogenic liver abscesses, appendicitis and/or biliary tract disease. As a result, the patient underwent 2 surgeries and was counseled to maintain good oral hygiene in order to eliminate all persisting sources of infection.
This was an unusual case in which the question What is the source of infection? appears to have had multiple correct answers. We theorize that leaving any 1 of the 3 possible sources of infection in place could have led to treatment failure. This patient is a humbling reminder that not every clinical problem will have one clear solution. In such cases, all possible underlying conditions need to be managed appropriately to achieve the desired outcome.
- ,,,,,.Pyogenic liver abscesses: mortality‐related factors.Eur J Gastroenterol Hepatol.2007;19:853–858.
- ,,, et al.Pyogenic liver abscess related to dental disease in an immunocompetent host.Intern Med.2008;47:675–678.
- ,,,.Gangrenous cholecystitis and acute cholangitis associated with anaerobic bacteria in bile.Eur J Clin Microbiol.1986;5:35–39.
- ,,,,.Bacteriology of histopathologically defined appendicitis in children.Ped Infect Dis J.2000;19:1078–1083.
- ,,, et al.The bacteriology of gangrenous and perforated appendicitis—revisited.Ann Surg.1990;211:165–171.
- ,,,,,.Pyogenic liver abscesses: mortality‐related factors.Eur J Gastroenterol Hepatol.2007;19:853–858.
- ,,, et al.Pyogenic liver abscess related to dental disease in an immunocompetent host.Intern Med.2008;47:675–678.
- ,,,.Gangrenous cholecystitis and acute cholangitis associated with anaerobic bacteria in bile.Eur J Clin Microbiol.1986;5:35–39.
- ,,,,.Bacteriology of histopathologically defined appendicitis in children.Ped Infect Dis J.2000;19:1078–1083.
- ,,, et al.The bacteriology of gangrenous and perforated appendicitis—revisited.Ann Surg.1990;211:165–171.
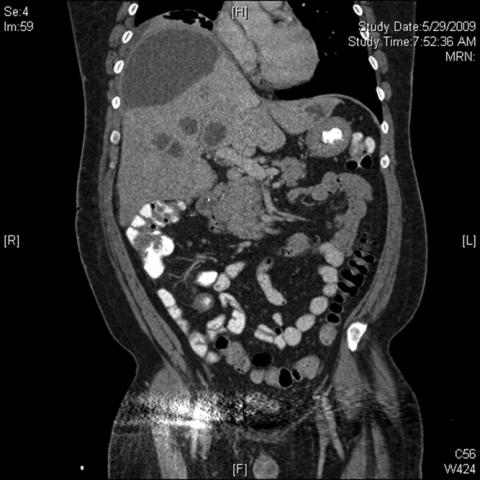
Thromboembolism Prophylaxis in Liver Disease
Venous thromboembolism (VTE) is a major cause of morbidity and mortality in hospitalized patients.13 Major efforts are underway to increase appropriate VTE prophylaxis (VTEP)4 and adherence to VTEP guidelines are increasingly used as a quality of care measure. National 2008 VTEP guidelines suggest that all medical patients ill enough to require hospitalization, particularly those requiring admission to the Intensive Care Unit (ICU), have at least a moderate risk of developing VTE and prophylaxis is recommended.4 Hospitalized patients with end‐stage liver disease (ESLD), despite their coagulopathy, are known to be at risk for VTE48 and may be VTEP candidates.
Based on available literature, it is unknown whether pharmacologic VTEP should be utilized in acutely ill, hospitalized patients with ESLD, particularly in those admitted with variceal bleeding. These patients are at high risk for rebleeding, with the highest risk in the first 5 days.9 Early rebleeding, defined as recurrent bleeding within 6 weeks of initial bleed, declined from 47% in the 1980s to 13% by 2000 because of increased early endoscopic intervention and use of medications to prevent rebleeding.911 In multicenter cohort studies, D'Amico and De Franchis12 reported that 13% of patients with variceal bleeding had uncontrolled bleeding, rebleeding, or death within 5 days of admission while Bahmba et al.13 reported a 16% rate of rebleeding within 5 days. We are unaware of prior reports regarding the safety of VTEP in this high‐risk group of patients.
Objective
We sought to describe rebleeding in a series of 22 patients with ESLD admitted with variceal bleeding who received pharmacologic VTEP.
Methods
We identified all patients 18 years and older with upper gastrointestinal bleeding admitted to Harborview Medical Center, a 400‐bed urban county teaching hospital in Seattle, Washington, between January 1, 2003 and December 31, 2005 (Figure 1), just prior to medical center‐wide implementation of a VTEP guideline. Potential cases were identified using administrative data based on 8 discharge diagnoses (Supporting Information Appendix 1) and 10 procedure codes (Supporting Information Appendix 2).14 Inpatient pharmacy data indicating continuous octreotide infusion were used to refine the sample. At our institution, it is a standard of care to initiate octreotide in patients admitted with variceal bleeding. We excluded patients who did not have ESLD (defined as evidence of cirrhosis and associated complications including but not limited to ascites, encephalopathy, variceal bleeding, portal hypertension) documented in their problem list or past medical history and those with no variceal bleeding based on medical record review. We identified cases receiving pharmacologic VTEP, either subcutaneous unfractionated heparin (UFH) or low molecular weight heparin (LMWH), during hospitalization from pharmacy records.
We obtained demographic and clinical data from administrative billing systems, electronic and paper medical records, and inpatient pharmacy databases and verified transfusion data from the Puget Sound Blood Center. We abstracted esophagogastroduodenoscopy (EGD) findings indicating high risk of rebleeding including variceal grade and stigmata of recent bleeding such as red spots or wales.15, 16 Data were abstracted by the first 3 authors (AS, MS, KJ) and reviewed again by 2 authors (AS, KJ) blinded to the others' abstractions.
We calculated Model for ESLD (MELD) scores on admission. These scores correlate with 3 month mortality in ESLD.17 We tabulated 5 factors shown in some studies to predict bleeding including high International Normalized Ratio (INR) (>1.5), low hematocrit (25%), low platelet count (100,000 per microliter), active bleeding at EGD, and transfusion of four or more units of red cells within 24 hours of admission.1013
We defined rebleeding as a decrease in hematocrit of greater than 5 percentage points compared with postresuscitation hematocrit, transfusion of additional red cells more than 48 hours after initial resuscitation, repeat unscheduled EGD, or return to the ICU for therapies related to rebleeding.18 The University of Washington Human Subjects Board approved this study.
Results
Of 224 patients initially identified, 36 received pharmacologic VTEP. We excluded 14 who did not have ESLD (n = 1) or did not have a variceal bleed (n = 13). The remaining 22 patients form the sample described in Figure 1.
The median age of patients was 52 years (range 42‐85) and 77% were men (Table 1). Twenty‐one of 22 patients (95%) were initially admitted to the ICU; median length of stay was 8 days (range 4‐30). Median MELD score on admission was 15 (range 825). On EGD, the number of variceal columns ranged from 1 to 4; 17 patients (77%) had at least 3. A total of 15 patients (68%) had stigmata of recent bleeding and 16 (72%) underwent banding (range 16 bands). All patients had at least 1 bleeding risk factor (Table 1) of which the most common factors observed were initial transfusion of 4 or more units of red cells (50%, n = 11), INR > 1.5 (45%, n = 10), and hematocrit 25% (45%, n = 10).
| Parameter | Range | Median Value/% | Interquartile Range | Mean | Standard Deviation |
|---|---|---|---|---|---|
| |||||
| Age (years) | 4285 | 52 | 4758 | 53 | 9 |
| Sex (men) | 17 | 77% | |||
| MELD scores | 825 | 14.5 | 1120 | 15 | 5 |
| Initial ICU admission | 21 | 95% | |||
| Hospital length of stay (days) | 430 | 8 | 9.9 | 6.7 | |
| Initial INR | 1.12.4 | 1.5 | 1.42.0 | 1.7 | 0.4 |
| Initial hematocrit (%) | 1444 | 26 | 2232 | 27 | 8 |
| Initial platelets (thousand/L) | 43494 | 131 | 83159 | 147 | 98 |
| EGD results | |||||
| Grade 1 | 3 | 14% | |||
| Grade 2 | 6 | 27% | |||
| Grade 3 | 12 | 55% | |||
| Grade 4 | 1 | 5% | |||
| Stigmata of recent bleeding | 15 | 68% | |||
| Number of risk factors for rebleeding* | |||||
| 0 | 0 | 0% | |||
| 1 | 9 | 41% | |||
| 2 | 7 | 32% | |||
| 3 | 5 | 23% | |||
| 4 | 1 | 4% | |||
| Initial transfusion red blood cells | |||||
| None | 2 | 9% | |||
| 13 units | 9 | 41% | |||
| 4+ units | 11 | 50% | |||
| Initial transfusion frozen plasma | |||||
| None | 10 | 45% | |||
| 14 units | 3 | 14% | |||
| 58 units | 6 | 27% | |||
| 9+ units | 4 | 18% | |||
| Initial transfusion platelets | |||||
| None | 13 | 59% | |||
| 14 units | 4 | 18% | |||
| 5+ units | 5 | 23% | |||
A total of 12 patients (55%) received 5000 units of UFH every 8 hours, 8 (36%) received 5000 units UFH every 12 hours, and 2 (9%) received LMWH. VTEP was initiated as early as day of admission and as late as day 19. Median VTEP start date was hospital day 4. Median duration of of VTEP was 5 days.
Only 1 patient (4.5%) rebled after VTEP initiation. The patient received UFH every 8 hours starting on hospital day 6, and rebleeding occurred on day 9. Repeat EGD showed ulcers at banding sites. The patient was restarted on VTEP on hospital day 13 without recurrence of rebleeding. This patient had a MELD score of 24, initial INR >2, hematocrit 25%, had grade 3 varices and stigmata of recent bleeding on EGD, and received 4 units of packed red cells. These values are similar to those of the cohort as a whole (Table 1). This patient also was diagnosed with DVT while receiving VTEP on hospital day 15. This patient's coagulopathy was in the setting of terminal illness; the patient expired on hospital day 25.
One additional patient rebled prior to VTEP initiation on day 3 with repeat EGD showing a bleeding varix. This patient was nevertheless started on VTEP 4 days after rebleeding. Despite use of VTEP, this patient was diagnosed with DVT on hospital day 9 (and may well have had the DVT at the time of VTEP initiation). The patient was transitioned to therapeutic dose heparin which was tolerated without recurrence of rebleeding.
There were no other confirmed cases of DVT in this series. One additional patient underwent angiogram that showed no pulmonary embolism; 2 other patients underwent lower extremity ultrasounds that were negative for DVT.
Discussion
At our medical center, only a few inpatients with ESLD admitted with variceal bleed received VTEP. These patients were seemingly at high risk for bleeding and rebleeding given high MELD scores, variceal bleeding, and presence of at least one clinical factor suggesting bleeding risk, and in several cases 3 or more such factors.13, 18 Despite this, only 1 patient rebled while receiving VTEP. We captured rebleeding rates only during the index hospitalization. We therefore may underestimate early rebleeding rates.1013 Nevertheless, our inpatient data included complete coverage of the earliest period after the index bleeds and the period during which patients were exposed to VTEP, which should be the time of highest rebleeding risk related to VTEP exposure. Interestingly the patient who rebled while on VTEP was also diagnosed with VTE while on VTEP. Two patients (9%) in our sample were diagnosed with VTE.
This case series is limited by its small sample size, retrospective nature, single center observation, and perhaps especially by possible selection bias. We were unable to specifically quantify rebleeding risk. Several authors have identified individual factors associated with rebleeding,1013 these were tabulated for patients in this case series (Table 1) and all patients had at least 1 of these factors. Concurrent infection and hepatic vein pressure gradient have been shown to predict rebleeding;9, 19 we were unable to identify these factors in our data.
There was considerable variability in this case series in timing of VTEP initiation relative to initial bleed. We were unable to characterize provider or patient characteristics that may have influenced the decision to initiate VTEP and timing. The sample size was also too small to comment upon factors associated with choice of UFH versus LMWH and any potential differences in rebleeding risk between the 2. We also did not look at outcomes postindex hospitalization so we can not comment on the extended risk of rebleeding with VTEP after discharge. However, the risk of rebleeding is highest within the first 96 hours13 and all patients in this series were hospitalized at least 4 days. Nonetheless, we captured all patients with ESLD and variceal bleeding exposed to VTEP at a large center over a three‐year period and found rebleeding rates less than what might be expected.
Conclusions
Our observations suggest that some inpatients with ESLD and variceal bleeding may tolerate pharmacologic VTEP. In this small group of patients, VTEP was associated with an unexpectedly low incidence of rebleeding. While this case series does not support broad use of VTEP in this population, the lower‐than‐expected rates of rebleeding suggest that further study of the safety and effectiveness of pharmacologic VTEP in inpatient populations with ESLD may be warranted, particularly given the recommendations of recent national VTE prophylaxis guidelines.4
- ,,, et al.Validation of a model to predict adverse outcomes in patients with pulmonary embolism.Eur Heart J.2006;27(4):476–481.
- .The epidemiology of venous thromboembolism.Circulation.2003;107(23 Suppl 1):I4–I8.
- ,,,,.The prevalence of risk factors for venous thromboembolism among hospital patients.Arch Intern Med.1992;152(8):1660–1664.
- ,,, et al.Prevention of venous thromboembolism: American College of Chest Physicians Evidence‐Based Clinical Practice Guidelines. 8th Edition.Chest.2008;133(6 Suppl):381S–453S.
- ,,, et al.Coagulopathy does not fully protect hospitalized cirrhosis patients from peripheral venous thromboembolism.Am J Gastroenterol.2006;101(7):1524–1528; quiz 680.
- ,,,.Coagulation disorders in liver disease.Semin Liver Dis.2002;22(1):83–96.
- ,,,,.Deep vein thrombosis and pulmonary embolism in cirrhosis patients.Dig Dis Sci.2008;53(11):3012–3017.
- ,,,,,.Risk of venous thromboembolism in patients with liver disease: a nationwide population‐based case‐control study.Am J Gastroenterol.2009;104(1):96–101.
- ,.Non‐invasive diagnosis of cirrhosis and the natural history of its complications.Best Pract Res Clin Gastroenterol.2007;21(1):3–18.
- ,,,et al.Improved patient survival after acute variceal bleeding: a multicenter, cohort study.Am J Gastroenterol.2003;98(3):653–659.
- ,,,,,.Improved survival after variceal bleeding in patients with cirrhosis over the past two decades.Hepatology.2004;40(3):652–659.
- ,.Upper digestive bleeding in cirrhosis. Post‐therapeutic outcome and prognostic indicators.Hepatology.2003;38(3):599–612.
- ,,,,,.Predictors of early re‐bleeding and mortality after acute variceal haemorrhage in patients with cirrhosis.Gut.2008;57(6):814–820.
- ,,,,,.Use of hospital administrative data to assess quality improvement initiatives.J Gen Intern Med.2007;22(Supplement).
- ,.UK guidelines on the management of variceal haemorrhage in cirrhotic patients.Gut.2000,year="2000"2000;46(90003):iii1–15.
- ,,,,,.Prognostic significance of the white nipple sign in variceal bleeding.Gastrointest Endosc.1991;37(1):51–55.
- ,,, et al.A model to predict survival in patients with end‐stage liver disease.Hepatology.2001;33(2):464–470.
- .Evolving consensus in portal hypertension. Report of the Baveno IV consensus workshop on methodology of diagnosis and therapy in portal hypertension.J Hepatol.2005;43(1):167–176.
- ,,, et al.Antibiotic prophylaxis after endoscopic therapy prevents rebleeding in acute variceal hemorrhage: a randomized trial.Hepatology.2004;39(3):746–753.
Venous thromboembolism (VTE) is a major cause of morbidity and mortality in hospitalized patients.13 Major efforts are underway to increase appropriate VTE prophylaxis (VTEP)4 and adherence to VTEP guidelines are increasingly used as a quality of care measure. National 2008 VTEP guidelines suggest that all medical patients ill enough to require hospitalization, particularly those requiring admission to the Intensive Care Unit (ICU), have at least a moderate risk of developing VTE and prophylaxis is recommended.4 Hospitalized patients with end‐stage liver disease (ESLD), despite their coagulopathy, are known to be at risk for VTE48 and may be VTEP candidates.
Based on available literature, it is unknown whether pharmacologic VTEP should be utilized in acutely ill, hospitalized patients with ESLD, particularly in those admitted with variceal bleeding. These patients are at high risk for rebleeding, with the highest risk in the first 5 days.9 Early rebleeding, defined as recurrent bleeding within 6 weeks of initial bleed, declined from 47% in the 1980s to 13% by 2000 because of increased early endoscopic intervention and use of medications to prevent rebleeding.911 In multicenter cohort studies, D'Amico and De Franchis12 reported that 13% of patients with variceal bleeding had uncontrolled bleeding, rebleeding, or death within 5 days of admission while Bahmba et al.13 reported a 16% rate of rebleeding within 5 days. We are unaware of prior reports regarding the safety of VTEP in this high‐risk group of patients.
Objective
We sought to describe rebleeding in a series of 22 patients with ESLD admitted with variceal bleeding who received pharmacologic VTEP.
Methods
We identified all patients 18 years and older with upper gastrointestinal bleeding admitted to Harborview Medical Center, a 400‐bed urban county teaching hospital in Seattle, Washington, between January 1, 2003 and December 31, 2005 (Figure 1), just prior to medical center‐wide implementation of a VTEP guideline. Potential cases were identified using administrative data based on 8 discharge diagnoses (Supporting Information Appendix 1) and 10 procedure codes (Supporting Information Appendix 2).14 Inpatient pharmacy data indicating continuous octreotide infusion were used to refine the sample. At our institution, it is a standard of care to initiate octreotide in patients admitted with variceal bleeding. We excluded patients who did not have ESLD (defined as evidence of cirrhosis and associated complications including but not limited to ascites, encephalopathy, variceal bleeding, portal hypertension) documented in their problem list or past medical history and those with no variceal bleeding based on medical record review. We identified cases receiving pharmacologic VTEP, either subcutaneous unfractionated heparin (UFH) or low molecular weight heparin (LMWH), during hospitalization from pharmacy records.
We obtained demographic and clinical data from administrative billing systems, electronic and paper medical records, and inpatient pharmacy databases and verified transfusion data from the Puget Sound Blood Center. We abstracted esophagogastroduodenoscopy (EGD) findings indicating high risk of rebleeding including variceal grade and stigmata of recent bleeding such as red spots or wales.15, 16 Data were abstracted by the first 3 authors (AS, MS, KJ) and reviewed again by 2 authors (AS, KJ) blinded to the others' abstractions.
We calculated Model for ESLD (MELD) scores on admission. These scores correlate with 3 month mortality in ESLD.17 We tabulated 5 factors shown in some studies to predict bleeding including high International Normalized Ratio (INR) (>1.5), low hematocrit (25%), low platelet count (100,000 per microliter), active bleeding at EGD, and transfusion of four or more units of red cells within 24 hours of admission.1013
We defined rebleeding as a decrease in hematocrit of greater than 5 percentage points compared with postresuscitation hematocrit, transfusion of additional red cells more than 48 hours after initial resuscitation, repeat unscheduled EGD, or return to the ICU for therapies related to rebleeding.18 The University of Washington Human Subjects Board approved this study.
Results
Of 224 patients initially identified, 36 received pharmacologic VTEP. We excluded 14 who did not have ESLD (n = 1) or did not have a variceal bleed (n = 13). The remaining 22 patients form the sample described in Figure 1.
The median age of patients was 52 years (range 42‐85) and 77% were men (Table 1). Twenty‐one of 22 patients (95%) were initially admitted to the ICU; median length of stay was 8 days (range 4‐30). Median MELD score on admission was 15 (range 825). On EGD, the number of variceal columns ranged from 1 to 4; 17 patients (77%) had at least 3. A total of 15 patients (68%) had stigmata of recent bleeding and 16 (72%) underwent banding (range 16 bands). All patients had at least 1 bleeding risk factor (Table 1) of which the most common factors observed were initial transfusion of 4 or more units of red cells (50%, n = 11), INR > 1.5 (45%, n = 10), and hematocrit 25% (45%, n = 10).
| Parameter | Range | Median Value/% | Interquartile Range | Mean | Standard Deviation |
|---|---|---|---|---|---|
| |||||
| Age (years) | 4285 | 52 | 4758 | 53 | 9 |
| Sex (men) | 17 | 77% | |||
| MELD scores | 825 | 14.5 | 1120 | 15 | 5 |
| Initial ICU admission | 21 | 95% | |||
| Hospital length of stay (days) | 430 | 8 | 9.9 | 6.7 | |
| Initial INR | 1.12.4 | 1.5 | 1.42.0 | 1.7 | 0.4 |
| Initial hematocrit (%) | 1444 | 26 | 2232 | 27 | 8 |
| Initial platelets (thousand/L) | 43494 | 131 | 83159 | 147 | 98 |
| EGD results | |||||
| Grade 1 | 3 | 14% | |||
| Grade 2 | 6 | 27% | |||
| Grade 3 | 12 | 55% | |||
| Grade 4 | 1 | 5% | |||
| Stigmata of recent bleeding | 15 | 68% | |||
| Number of risk factors for rebleeding* | |||||
| 0 | 0 | 0% | |||
| 1 | 9 | 41% | |||
| 2 | 7 | 32% | |||
| 3 | 5 | 23% | |||
| 4 | 1 | 4% | |||
| Initial transfusion red blood cells | |||||
| None | 2 | 9% | |||
| 13 units | 9 | 41% | |||
| 4+ units | 11 | 50% | |||
| Initial transfusion frozen plasma | |||||
| None | 10 | 45% | |||
| 14 units | 3 | 14% | |||
| 58 units | 6 | 27% | |||
| 9+ units | 4 | 18% | |||
| Initial transfusion platelets | |||||
| None | 13 | 59% | |||
| 14 units | 4 | 18% | |||
| 5+ units | 5 | 23% | |||
A total of 12 patients (55%) received 5000 units of UFH every 8 hours, 8 (36%) received 5000 units UFH every 12 hours, and 2 (9%) received LMWH. VTEP was initiated as early as day of admission and as late as day 19. Median VTEP start date was hospital day 4. Median duration of of VTEP was 5 days.
Only 1 patient (4.5%) rebled after VTEP initiation. The patient received UFH every 8 hours starting on hospital day 6, and rebleeding occurred on day 9. Repeat EGD showed ulcers at banding sites. The patient was restarted on VTEP on hospital day 13 without recurrence of rebleeding. This patient had a MELD score of 24, initial INR >2, hematocrit 25%, had grade 3 varices and stigmata of recent bleeding on EGD, and received 4 units of packed red cells. These values are similar to those of the cohort as a whole (Table 1). This patient also was diagnosed with DVT while receiving VTEP on hospital day 15. This patient's coagulopathy was in the setting of terminal illness; the patient expired on hospital day 25.
One additional patient rebled prior to VTEP initiation on day 3 with repeat EGD showing a bleeding varix. This patient was nevertheless started on VTEP 4 days after rebleeding. Despite use of VTEP, this patient was diagnosed with DVT on hospital day 9 (and may well have had the DVT at the time of VTEP initiation). The patient was transitioned to therapeutic dose heparin which was tolerated without recurrence of rebleeding.
There were no other confirmed cases of DVT in this series. One additional patient underwent angiogram that showed no pulmonary embolism; 2 other patients underwent lower extremity ultrasounds that were negative for DVT.
Discussion
At our medical center, only a few inpatients with ESLD admitted with variceal bleed received VTEP. These patients were seemingly at high risk for bleeding and rebleeding given high MELD scores, variceal bleeding, and presence of at least one clinical factor suggesting bleeding risk, and in several cases 3 or more such factors.13, 18 Despite this, only 1 patient rebled while receiving VTEP. We captured rebleeding rates only during the index hospitalization. We therefore may underestimate early rebleeding rates.1013 Nevertheless, our inpatient data included complete coverage of the earliest period after the index bleeds and the period during which patients were exposed to VTEP, which should be the time of highest rebleeding risk related to VTEP exposure. Interestingly the patient who rebled while on VTEP was also diagnosed with VTE while on VTEP. Two patients (9%) in our sample were diagnosed with VTE.
This case series is limited by its small sample size, retrospective nature, single center observation, and perhaps especially by possible selection bias. We were unable to specifically quantify rebleeding risk. Several authors have identified individual factors associated with rebleeding,1013 these were tabulated for patients in this case series (Table 1) and all patients had at least 1 of these factors. Concurrent infection and hepatic vein pressure gradient have been shown to predict rebleeding;9, 19 we were unable to identify these factors in our data.
There was considerable variability in this case series in timing of VTEP initiation relative to initial bleed. We were unable to characterize provider or patient characteristics that may have influenced the decision to initiate VTEP and timing. The sample size was also too small to comment upon factors associated with choice of UFH versus LMWH and any potential differences in rebleeding risk between the 2. We also did not look at outcomes postindex hospitalization so we can not comment on the extended risk of rebleeding with VTEP after discharge. However, the risk of rebleeding is highest within the first 96 hours13 and all patients in this series were hospitalized at least 4 days. Nonetheless, we captured all patients with ESLD and variceal bleeding exposed to VTEP at a large center over a three‐year period and found rebleeding rates less than what might be expected.
Conclusions
Our observations suggest that some inpatients with ESLD and variceal bleeding may tolerate pharmacologic VTEP. In this small group of patients, VTEP was associated with an unexpectedly low incidence of rebleeding. While this case series does not support broad use of VTEP in this population, the lower‐than‐expected rates of rebleeding suggest that further study of the safety and effectiveness of pharmacologic VTEP in inpatient populations with ESLD may be warranted, particularly given the recommendations of recent national VTE prophylaxis guidelines.4
Venous thromboembolism (VTE) is a major cause of morbidity and mortality in hospitalized patients.13 Major efforts are underway to increase appropriate VTE prophylaxis (VTEP)4 and adherence to VTEP guidelines are increasingly used as a quality of care measure. National 2008 VTEP guidelines suggest that all medical patients ill enough to require hospitalization, particularly those requiring admission to the Intensive Care Unit (ICU), have at least a moderate risk of developing VTE and prophylaxis is recommended.4 Hospitalized patients with end‐stage liver disease (ESLD), despite their coagulopathy, are known to be at risk for VTE48 and may be VTEP candidates.
Based on available literature, it is unknown whether pharmacologic VTEP should be utilized in acutely ill, hospitalized patients with ESLD, particularly in those admitted with variceal bleeding. These patients are at high risk for rebleeding, with the highest risk in the first 5 days.9 Early rebleeding, defined as recurrent bleeding within 6 weeks of initial bleed, declined from 47% in the 1980s to 13% by 2000 because of increased early endoscopic intervention and use of medications to prevent rebleeding.911 In multicenter cohort studies, D'Amico and De Franchis12 reported that 13% of patients with variceal bleeding had uncontrolled bleeding, rebleeding, or death within 5 days of admission while Bahmba et al.13 reported a 16% rate of rebleeding within 5 days. We are unaware of prior reports regarding the safety of VTEP in this high‐risk group of patients.
Objective
We sought to describe rebleeding in a series of 22 patients with ESLD admitted with variceal bleeding who received pharmacologic VTEP.
Methods
We identified all patients 18 years and older with upper gastrointestinal bleeding admitted to Harborview Medical Center, a 400‐bed urban county teaching hospital in Seattle, Washington, between January 1, 2003 and December 31, 2005 (Figure 1), just prior to medical center‐wide implementation of a VTEP guideline. Potential cases were identified using administrative data based on 8 discharge diagnoses (Supporting Information Appendix 1) and 10 procedure codes (Supporting Information Appendix 2).14 Inpatient pharmacy data indicating continuous octreotide infusion were used to refine the sample. At our institution, it is a standard of care to initiate octreotide in patients admitted with variceal bleeding. We excluded patients who did not have ESLD (defined as evidence of cirrhosis and associated complications including but not limited to ascites, encephalopathy, variceal bleeding, portal hypertension) documented in their problem list or past medical history and those with no variceal bleeding based on medical record review. We identified cases receiving pharmacologic VTEP, either subcutaneous unfractionated heparin (UFH) or low molecular weight heparin (LMWH), during hospitalization from pharmacy records.
We obtained demographic and clinical data from administrative billing systems, electronic and paper medical records, and inpatient pharmacy databases and verified transfusion data from the Puget Sound Blood Center. We abstracted esophagogastroduodenoscopy (EGD) findings indicating high risk of rebleeding including variceal grade and stigmata of recent bleeding such as red spots or wales.15, 16 Data were abstracted by the first 3 authors (AS, MS, KJ) and reviewed again by 2 authors (AS, KJ) blinded to the others' abstractions.
We calculated Model for ESLD (MELD) scores on admission. These scores correlate with 3 month mortality in ESLD.17 We tabulated 5 factors shown in some studies to predict bleeding including high International Normalized Ratio (INR) (>1.5), low hematocrit (25%), low platelet count (100,000 per microliter), active bleeding at EGD, and transfusion of four or more units of red cells within 24 hours of admission.1013
We defined rebleeding as a decrease in hematocrit of greater than 5 percentage points compared with postresuscitation hematocrit, transfusion of additional red cells more than 48 hours after initial resuscitation, repeat unscheduled EGD, or return to the ICU for therapies related to rebleeding.18 The University of Washington Human Subjects Board approved this study.
Results
Of 224 patients initially identified, 36 received pharmacologic VTEP. We excluded 14 who did not have ESLD (n = 1) or did not have a variceal bleed (n = 13). The remaining 22 patients form the sample described in Figure 1.
The median age of patients was 52 years (range 42‐85) and 77% were men (Table 1). Twenty‐one of 22 patients (95%) were initially admitted to the ICU; median length of stay was 8 days (range 4‐30). Median MELD score on admission was 15 (range 825). On EGD, the number of variceal columns ranged from 1 to 4; 17 patients (77%) had at least 3. A total of 15 patients (68%) had stigmata of recent bleeding and 16 (72%) underwent banding (range 16 bands). All patients had at least 1 bleeding risk factor (Table 1) of which the most common factors observed were initial transfusion of 4 or more units of red cells (50%, n = 11), INR > 1.5 (45%, n = 10), and hematocrit 25% (45%, n = 10).
| Parameter | Range | Median Value/% | Interquartile Range | Mean | Standard Deviation |
|---|---|---|---|---|---|
| |||||
| Age (years) | 4285 | 52 | 4758 | 53 | 9 |
| Sex (men) | 17 | 77% | |||
| MELD scores | 825 | 14.5 | 1120 | 15 | 5 |
| Initial ICU admission | 21 | 95% | |||
| Hospital length of stay (days) | 430 | 8 | 9.9 | 6.7 | |
| Initial INR | 1.12.4 | 1.5 | 1.42.0 | 1.7 | 0.4 |
| Initial hematocrit (%) | 1444 | 26 | 2232 | 27 | 8 |
| Initial platelets (thousand/L) | 43494 | 131 | 83159 | 147 | 98 |
| EGD results | |||||
| Grade 1 | 3 | 14% | |||
| Grade 2 | 6 | 27% | |||
| Grade 3 | 12 | 55% | |||
| Grade 4 | 1 | 5% | |||
| Stigmata of recent bleeding | 15 | 68% | |||
| Number of risk factors for rebleeding* | |||||
| 0 | 0 | 0% | |||
| 1 | 9 | 41% | |||
| 2 | 7 | 32% | |||
| 3 | 5 | 23% | |||
| 4 | 1 | 4% | |||
| Initial transfusion red blood cells | |||||
| None | 2 | 9% | |||
| 13 units | 9 | 41% | |||
| 4+ units | 11 | 50% | |||
| Initial transfusion frozen plasma | |||||
| None | 10 | 45% | |||
| 14 units | 3 | 14% | |||
| 58 units | 6 | 27% | |||
| 9+ units | 4 | 18% | |||
| Initial transfusion platelets | |||||
| None | 13 | 59% | |||
| 14 units | 4 | 18% | |||
| 5+ units | 5 | 23% | |||
A total of 12 patients (55%) received 5000 units of UFH every 8 hours, 8 (36%) received 5000 units UFH every 12 hours, and 2 (9%) received LMWH. VTEP was initiated as early as day of admission and as late as day 19. Median VTEP start date was hospital day 4. Median duration of of VTEP was 5 days.
Only 1 patient (4.5%) rebled after VTEP initiation. The patient received UFH every 8 hours starting on hospital day 6, and rebleeding occurred on day 9. Repeat EGD showed ulcers at banding sites. The patient was restarted on VTEP on hospital day 13 without recurrence of rebleeding. This patient had a MELD score of 24, initial INR >2, hematocrit 25%, had grade 3 varices and stigmata of recent bleeding on EGD, and received 4 units of packed red cells. These values are similar to those of the cohort as a whole (Table 1). This patient also was diagnosed with DVT while receiving VTEP on hospital day 15. This patient's coagulopathy was in the setting of terminal illness; the patient expired on hospital day 25.
One additional patient rebled prior to VTEP initiation on day 3 with repeat EGD showing a bleeding varix. This patient was nevertheless started on VTEP 4 days after rebleeding. Despite use of VTEP, this patient was diagnosed with DVT on hospital day 9 (and may well have had the DVT at the time of VTEP initiation). The patient was transitioned to therapeutic dose heparin which was tolerated without recurrence of rebleeding.
There were no other confirmed cases of DVT in this series. One additional patient underwent angiogram that showed no pulmonary embolism; 2 other patients underwent lower extremity ultrasounds that were negative for DVT.
Discussion
At our medical center, only a few inpatients with ESLD admitted with variceal bleed received VTEP. These patients were seemingly at high risk for bleeding and rebleeding given high MELD scores, variceal bleeding, and presence of at least one clinical factor suggesting bleeding risk, and in several cases 3 or more such factors.13, 18 Despite this, only 1 patient rebled while receiving VTEP. We captured rebleeding rates only during the index hospitalization. We therefore may underestimate early rebleeding rates.1013 Nevertheless, our inpatient data included complete coverage of the earliest period after the index bleeds and the period during which patients were exposed to VTEP, which should be the time of highest rebleeding risk related to VTEP exposure. Interestingly the patient who rebled while on VTEP was also diagnosed with VTE while on VTEP. Two patients (9%) in our sample were diagnosed with VTE.
This case series is limited by its small sample size, retrospective nature, single center observation, and perhaps especially by possible selection bias. We were unable to specifically quantify rebleeding risk. Several authors have identified individual factors associated with rebleeding,1013 these were tabulated for patients in this case series (Table 1) and all patients had at least 1 of these factors. Concurrent infection and hepatic vein pressure gradient have been shown to predict rebleeding;9, 19 we were unable to identify these factors in our data.
There was considerable variability in this case series in timing of VTEP initiation relative to initial bleed. We were unable to characterize provider or patient characteristics that may have influenced the decision to initiate VTEP and timing. The sample size was also too small to comment upon factors associated with choice of UFH versus LMWH and any potential differences in rebleeding risk between the 2. We also did not look at outcomes postindex hospitalization so we can not comment on the extended risk of rebleeding with VTEP after discharge. However, the risk of rebleeding is highest within the first 96 hours13 and all patients in this series were hospitalized at least 4 days. Nonetheless, we captured all patients with ESLD and variceal bleeding exposed to VTEP at a large center over a three‐year period and found rebleeding rates less than what might be expected.
Conclusions
Our observations suggest that some inpatients with ESLD and variceal bleeding may tolerate pharmacologic VTEP. In this small group of patients, VTEP was associated with an unexpectedly low incidence of rebleeding. While this case series does not support broad use of VTEP in this population, the lower‐than‐expected rates of rebleeding suggest that further study of the safety and effectiveness of pharmacologic VTEP in inpatient populations with ESLD may be warranted, particularly given the recommendations of recent national VTE prophylaxis guidelines.4
- ,,, et al.Validation of a model to predict adverse outcomes in patients with pulmonary embolism.Eur Heart J.2006;27(4):476–481.
- .The epidemiology of venous thromboembolism.Circulation.2003;107(23 Suppl 1):I4–I8.
- ,,,,.The prevalence of risk factors for venous thromboembolism among hospital patients.Arch Intern Med.1992;152(8):1660–1664.
- ,,, et al.Prevention of venous thromboembolism: American College of Chest Physicians Evidence‐Based Clinical Practice Guidelines. 8th Edition.Chest.2008;133(6 Suppl):381S–453S.
- ,,, et al.Coagulopathy does not fully protect hospitalized cirrhosis patients from peripheral venous thromboembolism.Am J Gastroenterol.2006;101(7):1524–1528; quiz 680.
- ,,,.Coagulation disorders in liver disease.Semin Liver Dis.2002;22(1):83–96.
- ,,,,.Deep vein thrombosis and pulmonary embolism in cirrhosis patients.Dig Dis Sci.2008;53(11):3012–3017.
- ,,,,,.Risk of venous thromboembolism in patients with liver disease: a nationwide population‐based case‐control study.Am J Gastroenterol.2009;104(1):96–101.
- ,.Non‐invasive diagnosis of cirrhosis and the natural history of its complications.Best Pract Res Clin Gastroenterol.2007;21(1):3–18.
- ,,,et al.Improved patient survival after acute variceal bleeding: a multicenter, cohort study.Am J Gastroenterol.2003;98(3):653–659.
- ,,,,,.Improved survival after variceal bleeding in patients with cirrhosis over the past two decades.Hepatology.2004;40(3):652–659.
- ,.Upper digestive bleeding in cirrhosis. Post‐therapeutic outcome and prognostic indicators.Hepatology.2003;38(3):599–612.
- ,,,,,.Predictors of early re‐bleeding and mortality after acute variceal haemorrhage in patients with cirrhosis.Gut.2008;57(6):814–820.
- ,,,,,.Use of hospital administrative data to assess quality improvement initiatives.J Gen Intern Med.2007;22(Supplement).
- ,.UK guidelines on the management of variceal haemorrhage in cirrhotic patients.Gut.2000,year="2000"2000;46(90003):iii1–15.
- ,,,,,.Prognostic significance of the white nipple sign in variceal bleeding.Gastrointest Endosc.1991;37(1):51–55.
- ,,, et al.A model to predict survival in patients with end‐stage liver disease.Hepatology.2001;33(2):464–470.
- .Evolving consensus in portal hypertension. Report of the Baveno IV consensus workshop on methodology of diagnosis and therapy in portal hypertension.J Hepatol.2005;43(1):167–176.
- ,,, et al.Antibiotic prophylaxis after endoscopic therapy prevents rebleeding in acute variceal hemorrhage: a randomized trial.Hepatology.2004;39(3):746–753.
- ,,, et al.Validation of a model to predict adverse outcomes in patients with pulmonary embolism.Eur Heart J.2006;27(4):476–481.
- .The epidemiology of venous thromboembolism.Circulation.2003;107(23 Suppl 1):I4–I8.
- ,,,,.The prevalence of risk factors for venous thromboembolism among hospital patients.Arch Intern Med.1992;152(8):1660–1664.
- ,,, et al.Prevention of venous thromboembolism: American College of Chest Physicians Evidence‐Based Clinical Practice Guidelines. 8th Edition.Chest.2008;133(6 Suppl):381S–453S.
- ,,, et al.Coagulopathy does not fully protect hospitalized cirrhosis patients from peripheral venous thromboembolism.Am J Gastroenterol.2006;101(7):1524–1528; quiz 680.
- ,,,.Coagulation disorders in liver disease.Semin Liver Dis.2002;22(1):83–96.
- ,,,,.Deep vein thrombosis and pulmonary embolism in cirrhosis patients.Dig Dis Sci.2008;53(11):3012–3017.
- ,,,,,.Risk of venous thromboembolism in patients with liver disease: a nationwide population‐based case‐control study.Am J Gastroenterol.2009;104(1):96–101.
- ,.Non‐invasive diagnosis of cirrhosis and the natural history of its complications.Best Pract Res Clin Gastroenterol.2007;21(1):3–18.
- ,,,et al.Improved patient survival after acute variceal bleeding: a multicenter, cohort study.Am J Gastroenterol.2003;98(3):653–659.
- ,,,,,.Improved survival after variceal bleeding in patients with cirrhosis over the past two decades.Hepatology.2004;40(3):652–659.
- ,.Upper digestive bleeding in cirrhosis. Post‐therapeutic outcome and prognostic indicators.Hepatology.2003;38(3):599–612.
- ,,,,,.Predictors of early re‐bleeding and mortality after acute variceal haemorrhage in patients with cirrhosis.Gut.2008;57(6):814–820.
- ,,,,,.Use of hospital administrative data to assess quality improvement initiatives.J Gen Intern Med.2007;22(Supplement).
- ,.UK guidelines on the management of variceal haemorrhage in cirrhotic patients.Gut.2000,year="2000"2000;46(90003):iii1–15.
- ,,,,,.Prognostic significance of the white nipple sign in variceal bleeding.Gastrointest Endosc.1991;37(1):51–55.
- ,,, et al.A model to predict survival in patients with end‐stage liver disease.Hepatology.2001;33(2):464–470.
- .Evolving consensus in portal hypertension. Report of the Baveno IV consensus workshop on methodology of diagnosis and therapy in portal hypertension.J Hepatol.2005;43(1):167–176.
- ,,, et al.Antibiotic prophylaxis after endoscopic therapy prevents rebleeding in acute variceal hemorrhage: a randomized trial.Hepatology.2004;39(3):746–753.
Outcomes Discrepancy
A new study in the Journal of Hospital Medicine that reports insured hospitalized patients from ages 18-64 have 50% higher odds of surviving a heart attack or stroke than their uninsured counterparts should be a wake-up call to HM leaders looking to improve standards of care, one hospitalist says.
“It’s almost startling and embarrassing when you see the statistics on paper,” says Danielle Scheurer, MD, MSc, SFHM, assistant professor of medicine at Harvard Medical School and director of Boston-based Brigham and Women’s Hospital’s general medicine service. “If you’re going to assign a specialty to address the problem, it’s a hospital medicine problem.”
The researchers retrospectively analyzed 150,000 discharges among patients hospitalized for acute myocardial infarction (MI), stroke, or pneumonia (DOI: 10.1002/jhm.687). Compared with the privately insured, the study reported "in-hospital mortality among AMI and stroke patients was significantly higher for the uninsured (adjusted odds ratio [OR] 1.52, 95% confidence interval [CI], 1.24-1.85 for AMI and 1.49 OR, 1.29-1.72 for stroke) and among pneumonia patients was significantly higher for Medicaid recipients (1.21 OR, 1.01-1.45)." The lead author was Omar Hasan, MBBS, MPH, an instructor at Harvard Medical School and a hospitalist at Brigham and Women’s.
Dr. Scheurer cautions that the subject raised by her colleague is a multidimensional problem with no easy solution. Physicians may unconsciously make triage decisions that feed into the difference of care, she says, while insured patients who more actively engage their doctors could also skew the numbers.
She thinks, however, that “systematically creating protocols, policies, and procedures” could result in clinical-care delivery that helps reduce the disparity.
“Part of [the importance of the study] is having an open dialogue,” Dr. Scheurer says. “This is real. There is this disparity.”
A new study in the Journal of Hospital Medicine that reports insured hospitalized patients from ages 18-64 have 50% higher odds of surviving a heart attack or stroke than their uninsured counterparts should be a wake-up call to HM leaders looking to improve standards of care, one hospitalist says.
“It’s almost startling and embarrassing when you see the statistics on paper,” says Danielle Scheurer, MD, MSc, SFHM, assistant professor of medicine at Harvard Medical School and director of Boston-based Brigham and Women’s Hospital’s general medicine service. “If you’re going to assign a specialty to address the problem, it’s a hospital medicine problem.”
The researchers retrospectively analyzed 150,000 discharges among patients hospitalized for acute myocardial infarction (MI), stroke, or pneumonia (DOI: 10.1002/jhm.687). Compared with the privately insured, the study reported "in-hospital mortality among AMI and stroke patients was significantly higher for the uninsured (adjusted odds ratio [OR] 1.52, 95% confidence interval [CI], 1.24-1.85 for AMI and 1.49 OR, 1.29-1.72 for stroke) and among pneumonia patients was significantly higher for Medicaid recipients (1.21 OR, 1.01-1.45)." The lead author was Omar Hasan, MBBS, MPH, an instructor at Harvard Medical School and a hospitalist at Brigham and Women’s.
Dr. Scheurer cautions that the subject raised by her colleague is a multidimensional problem with no easy solution. Physicians may unconsciously make triage decisions that feed into the difference of care, she says, while insured patients who more actively engage their doctors could also skew the numbers.
She thinks, however, that “systematically creating protocols, policies, and procedures” could result in clinical-care delivery that helps reduce the disparity.
“Part of [the importance of the study] is having an open dialogue,” Dr. Scheurer says. “This is real. There is this disparity.”
A new study in the Journal of Hospital Medicine that reports insured hospitalized patients from ages 18-64 have 50% higher odds of surviving a heart attack or stroke than their uninsured counterparts should be a wake-up call to HM leaders looking to improve standards of care, one hospitalist says.
“It’s almost startling and embarrassing when you see the statistics on paper,” says Danielle Scheurer, MD, MSc, SFHM, assistant professor of medicine at Harvard Medical School and director of Boston-based Brigham and Women’s Hospital’s general medicine service. “If you’re going to assign a specialty to address the problem, it’s a hospital medicine problem.”
The researchers retrospectively analyzed 150,000 discharges among patients hospitalized for acute myocardial infarction (MI), stroke, or pneumonia (DOI: 10.1002/jhm.687). Compared with the privately insured, the study reported "in-hospital mortality among AMI and stroke patients was significantly higher for the uninsured (adjusted odds ratio [OR] 1.52, 95% confidence interval [CI], 1.24-1.85 for AMI and 1.49 OR, 1.29-1.72 for stroke) and among pneumonia patients was significantly higher for Medicaid recipients (1.21 OR, 1.01-1.45)." The lead author was Omar Hasan, MBBS, MPH, an instructor at Harvard Medical School and a hospitalist at Brigham and Women’s.
Dr. Scheurer cautions that the subject raised by her colleague is a multidimensional problem with no easy solution. Physicians may unconsciously make triage decisions that feed into the difference of care, she says, while insured patients who more actively engage their doctors could also skew the numbers.
She thinks, however, that “systematically creating protocols, policies, and procedures” could result in clinical-care delivery that helps reduce the disparity.
“Part of [the importance of the study] is having an open dialogue,” Dr. Scheurer says. “This is real. There is this disparity.”
In the Literature: Research You Need to Know
Clinical question: What is the prevalence of silent pulmonary embolism (PE) in patients with deep venous thrombosis (DVT)?
Background: Pulmonary embolism was undiagnosed or unsuspected in approximately 80% to 93% patients antemortem who were found to have a PE at autopsy. The extent to which silent pulmonary embolism explains the undiagnosed or unsuspected pulmonary emboli at autopsy is not certain. Prior studies have demonstrated the association of silent PE in living patients with DVT.
Study design: Systematic review.
Setting: Published trials performed worldwide.
Synopsis: A systematic review of published trials addressing the prevalence of silent pulmonary embolism in patients with deep vein thrombosis was performed. Studies were included if methods of diagnosis of PE were described, if it was an asymptomatic PE, and if raw data were presented. Twenty-eight studies were identified and were stratified according to how the PE was diagnosed (Tier 1: high-probability VQ scan based on PIOPED criteria, CTA, angiography; Tier 2: VQ scans based on non-PIOPED criteria).
Among Tier 1 studies, silent PE was detected among 27% of patients with DVT. Among Tier 2 studies, silent PE was detected among 37% of patients with DVT. Combined, silent PE was diagnosed in 1,665 of 5,233 patients (32%) with DVT. Further analysis showed that the prevalence of silent PE in patients with proximal DVT was higher in those with distal DVT, and that there was a trend toward increased prevalence of silent PE with increased age.
A limitation of this study includes the heterogeneity in the methods used for diagnosis of silent pulmonary embolism.
Bottom line: Silent pulmonary embolism occurs in one-third of patients with deep venous thrombosis, and routine screening should be considered.
Citation: Stein P, Matta F, Musani MH, Diaczok B. Silent pulmonary embolism in patients with deep venous thrombosis: a systematic review. Am J Med. 2010;123(5):426-431.
Reviewed for TH eWire by Alexander R. Carbo, MD, SFHM, Lauren Doctoroff, MD, John Fani Srour, MD, Matthew Hill, MD, Nancy Torres-Finnerty, MD, FHM, Anita Vanka, MD, Hospital Medicine Program, Beth Israel Deaconess Medical Center.
For more physician reviews of HM-related research, visit our website.
Clinical question: What is the prevalence of silent pulmonary embolism (PE) in patients with deep venous thrombosis (DVT)?
Background: Pulmonary embolism was undiagnosed or unsuspected in approximately 80% to 93% patients antemortem who were found to have a PE at autopsy. The extent to which silent pulmonary embolism explains the undiagnosed or unsuspected pulmonary emboli at autopsy is not certain. Prior studies have demonstrated the association of silent PE in living patients with DVT.
Study design: Systematic review.
Setting: Published trials performed worldwide.
Synopsis: A systematic review of published trials addressing the prevalence of silent pulmonary embolism in patients with deep vein thrombosis was performed. Studies were included if methods of diagnosis of PE were described, if it was an asymptomatic PE, and if raw data were presented. Twenty-eight studies were identified and were stratified according to how the PE was diagnosed (Tier 1: high-probability VQ scan based on PIOPED criteria, CTA, angiography; Tier 2: VQ scans based on non-PIOPED criteria).
Among Tier 1 studies, silent PE was detected among 27% of patients with DVT. Among Tier 2 studies, silent PE was detected among 37% of patients with DVT. Combined, silent PE was diagnosed in 1,665 of 5,233 patients (32%) with DVT. Further analysis showed that the prevalence of silent PE in patients with proximal DVT was higher in those with distal DVT, and that there was a trend toward increased prevalence of silent PE with increased age.
A limitation of this study includes the heterogeneity in the methods used for diagnosis of silent pulmonary embolism.
Bottom line: Silent pulmonary embolism occurs in one-third of patients with deep venous thrombosis, and routine screening should be considered.
Citation: Stein P, Matta F, Musani MH, Diaczok B. Silent pulmonary embolism in patients with deep venous thrombosis: a systematic review. Am J Med. 2010;123(5):426-431.
Reviewed for TH eWire by Alexander R. Carbo, MD, SFHM, Lauren Doctoroff, MD, John Fani Srour, MD, Matthew Hill, MD, Nancy Torres-Finnerty, MD, FHM, Anita Vanka, MD, Hospital Medicine Program, Beth Israel Deaconess Medical Center.
For more physician reviews of HM-related research, visit our website.
Clinical question: What is the prevalence of silent pulmonary embolism (PE) in patients with deep venous thrombosis (DVT)?
Background: Pulmonary embolism was undiagnosed or unsuspected in approximately 80% to 93% patients antemortem who were found to have a PE at autopsy. The extent to which silent pulmonary embolism explains the undiagnosed or unsuspected pulmonary emboli at autopsy is not certain. Prior studies have demonstrated the association of silent PE in living patients with DVT.
Study design: Systematic review.
Setting: Published trials performed worldwide.
Synopsis: A systematic review of published trials addressing the prevalence of silent pulmonary embolism in patients with deep vein thrombosis was performed. Studies were included if methods of diagnosis of PE were described, if it was an asymptomatic PE, and if raw data were presented. Twenty-eight studies were identified and were stratified according to how the PE was diagnosed (Tier 1: high-probability VQ scan based on PIOPED criteria, CTA, angiography; Tier 2: VQ scans based on non-PIOPED criteria).
Among Tier 1 studies, silent PE was detected among 27% of patients with DVT. Among Tier 2 studies, silent PE was detected among 37% of patients with DVT. Combined, silent PE was diagnosed in 1,665 of 5,233 patients (32%) with DVT. Further analysis showed that the prevalence of silent PE in patients with proximal DVT was higher in those with distal DVT, and that there was a trend toward increased prevalence of silent PE with increased age.
A limitation of this study includes the heterogeneity in the methods used for diagnosis of silent pulmonary embolism.
Bottom line: Silent pulmonary embolism occurs in one-third of patients with deep venous thrombosis, and routine screening should be considered.
Citation: Stein P, Matta F, Musani MH, Diaczok B. Silent pulmonary embolism in patients with deep venous thrombosis: a systematic review. Am J Med. 2010;123(5):426-431.
Reviewed for TH eWire by Alexander R. Carbo, MD, SFHM, Lauren Doctoroff, MD, John Fani Srour, MD, Matthew Hill, MD, Nancy Torres-Finnerty, MD, FHM, Anita Vanka, MD, Hospital Medicine Program, Beth Israel Deaconess Medical Center.
For more physician reviews of HM-related research, visit our website.