User login
Millions Available to Transitions-Focused Hospitalists
CMS clearly has care transitions on its radar, having made $500 million in grant opportunities available to help hospitals, their hospitalists, and community partners work collaboratively to improve transitions and prevent rehospitalizations, observes hospitalist Matthew Schreiber, MD, chief medical officer of Piedmont Hospital in Atlanta.
"But for me, there is little question that today's carrot will turn into tomorrow's stick, so now is the time to get this right," Dr. Schreiber says.
Piedmont was one of six initial sites for SHM's Project BOOST care transitions initiative, and the hospital also participated with a coalition of Atlanta-area community providers that served as one of 14 test sites for the Community-Based Care Transitions Program (CCTP) federal demonstration project. Based on the success of those demos, $500 million in funds were earmarked for CCTP through the Affordable Care Act to support care-transitions projects by community-based organizations partnering with hospitals and by eligible hospitals with community-based partners.
CCTP and its $500 million recently were rolled into a five-year, $1 billion federal reform initiative called Partnership for Patients, which was announced last month by Health and Human Services Secretary Kathleen Sebelius. Its goals are to save 63,000 lives and $35 billion in healthcare costs by reducing preventable hospital-associated injuries by 40% and reducing overall hospital readmissions by 20%, both targets to be achieved by the end of 2013.
In announcing the national Partnership for Patients, CMS administrator Donald Berwick, MD, pledged to "focus first on a set of well-established, evidence-based interventions.” Such interventions, which explicitly include Project BOOST and Boston University's Project RED (Re-Engineered Discharge), will be given preference in CCTP applications. That means hospitals that already are Project BOOST sites or participating in one of the other recognized care-transitions programs and collaborating with other health providers in their communities to enhance the care patients receive following hospital discharge will have a big leg up in qualifying for CCTP funding.
Hospitalists can't obtain these grants by themselves but can be major collaborators in the care-transitions coalitions that can. Long-awaited CCTP application criteria were made available last month.
Value-Based Purchasing Raises the Stakes

Mock scorecards, interactive blueprints, quality dashboards: Hospitals are frantically seeking out any advantage that might help them excel in a fast-approaching, mandatory competition with millions of dollars on the line. Value-based purchasing (VBP), a program authorized by the Patient Protection and Accountable Care Act of 2010, gives the Centers for Medicare & Medicaid Services (CMS) the power to base a portion of hospital reimbursement payments on how well hospitals perform in 25 core measures.
The move is intended to help CMS flex its muscles and move from being a passive bystander to an active buyer of what its officials have deemed higher-quality healthcare. Analysts and healthcare experts warn that if hospitalists aren’t paying attention, however, they could put themselves at unnecessary risk or lose out on a major opportunity to demonstrate their value in what Patrick Torcson, MD, SFHM, is calling a “team sport.”
Dr. Torcson, chair of SHM’s Performance and Standards Committee, says every hospitalist should be aware of the core-measures concept, which has been around since 2003 in what’s now called the Hospital Inpatient Quality Reporting (IQR) Program. “We’re not reinventing the wheel; we’re just transforming the program from pay-for-reporting to actual pay-for-performance,” he says. Value-based purchasing, though, is raising the stakes considerably. “It’s really significant because it marks the beginning of an era of accountability and true pay-for-performance at the hospital level.”
A major reason for the heightened concern is the structure of the program. In other quality demonstration projects, CMS has established a score to beat: “Anyone above that threshold is in the money. If you didn’t make it, there was no harm, no foul,” says Trent Haywood, MD, JD, chief medical officer of the Irving, Tex.-based for-profit healthcare cooperative VHA Inc.

—Laura Dietzel, PeaceHealth’s program director for High-Tech Meaningful Use
What’s different this time is that value-based purchasing is not a collaboration but a competition in which every hospital is pitted against the entire market, says Dr. Haywood, the former deputy chief medical officer at CMS. It’s also a zero-sum game. That means there will be winners and losers, with the entire cost-neutral program funded by extracting money from the worst performers to financially reward the best. “In this competition-type model, you need to know who you can beat,” he says.
Race to the Top
That new reality has set off a mad scramble among hospitals hoping to gain any edge they can and spawned a cottage industry of consultants, lawyers, and quality specialists advising them on how to maximize their points. The drive to achieve and maintain a high level of performance is also spurring hospitals to seek more individual accountability as they look to minimize their financial risk.
Hospitals’ baseline scores already have been set, and the initial nine-month performance evaluation period begins July 1. Beginning with discharges on Oct. 1, 2012 (fiscal year 2013), the payment phase will kick in. CMS will start by withholding 1% of the base DRG reimbursement paid to hospitals. That money can be earned back based on how well each hospital scores on the performance measures during the evaluation period. The amount initially withheld will rise by 0.25 percentage points per year until it is capped at 2% in 2017 and beyond.
Think of the competition as an annual decathlon with a pool of prize money funded by the participants, except that hospitals will be evaluated on far more measures. So far, the program includes 17 core Clinical Process of Care measures and eight measures based on Hospital Consumer Assessment of Healthcare Providers and Systems (HCAHPS) surveys. Twenty other potential measures are waiting in the wings, including ones related to hospital-acquired conditions, patient safety, inpatient quality, and mortality, some of which likely will be introduced in fiscal year 2014.
CMS intends to monitor and evaluate the program’s impact on access and quality of care, especially for “vulnerable populations,” the percentage of patients who receive appropriate care, the rates of hospital-acquired conditions, and the best practices of high-performing hospitals.
The complicated nature of the rules and scoring, and significant money attached to the competition, have generated deep concern. In October and again in February, healthcare providers bombarded CMS representatives with questions and suggestions during open phone forums, when the regulations were still in flux. Would the rules be fair? Would CMS provide an early warning of impending losses? Was the agency giving too much weight to patient satisfaction scores?
SHM supports the program, stating, “We believe that the Medicare reimbursement system must be changed to promote value, and we strongly support policies that link quality measurement to performance-based payment.”
Other observers, though, have warned of the potential for unintended consequences. If doctors avoid complicated medical cases in order to increase a hospital’s score, for example, are they really improving care? Will poorly performing hospitals get caught in a vicious circle due to declining financial resources?
Some critics have complained that by scoring on a curve rather than on an absolute point system, the value-based purchasing program might not be a quality initiative so much as an opportunity for CMS to reduce hospital payments. “I believe that this is largely a shell game played by the Centers for Medicare & Medicaid Services to give hospitals the idea that they can win at this game, when all but a few will lose,” wrote Richard Rohr, MD, FHM, in his Feb. 1 entry at the Medical Staff Leader blog (http://blogs.hcpro.com/medicalstaff/). Hospitalist subsidies could be a prime target as the cost-reduction pressures rise, wrote Dr. Rohr, who directs HM programs for Guthrie Healthcare System in Sayre, Pa. Enhancing productivity, he stressed, could be the best defense against a rollback in salaries.
Most experts agree that investing in a quality infrastructure will be essential for success, though other hospitalists differ on the potential effects that VBP might have on their profession. “I think a big part of a quality infrastructure is a hospital medicine program,” Dr. Torcson says. In fact, he recommends that hospitalists approach a hospital CFO or CEO and offer their assistance with the program. “I really think that’s the right direction and the right attitude, kind of the way the Samurai used to serve the Japanese emperor,” he explains.
A major reason for taking the initiative, he says, is that value-based purchasing could become the new business case for HM. In the 1990s, hospitalists could put a real number on how much they saved hospitals by reducing length of stay, sparking an investment in HM programs. “I think value-based purchasing is now in the same position,” Dr. Torcson says, “and the savings is actually going to be even more quantifiable for the hospital in terms of their success or failure.”
continued below...
Expectations on the Rise
SHM’s annual meeting this month in Grapevine, Texas (www.hospitalmedicine2011.org), will feature a session on improving HCAHPS scores, and Dr. Torcson has been working on a society task force educating members about how to be successful amid the coming changes. A Web-based toolkit in the works, he says, will highlight best practices for myocardial infarctions, heart failure, surgical care, pneumonia, and patient satisfaction to help hospitalists ensure they have the necessary skill sets. (SHM will offer a full platform of VBP courses by end of 2011.)
“At the individual hospitalist level, once you’ve decided to commit to serving that hospital-level performance agenda, we want SHM to be the place to turn to get the information on best practices and what you need,” Dr. Torcson says.
But first, says Bill Darling, a Washington, D.C., and Austin, Tex.-based partner with Strasburger Attorneys at Law, hospitalists will need a much stronger understanding of hospital expectations. Many hospital officials already are indicating that they’re leaning toward their own pay-for-performance programs to put individual doctors on the hook for negative financial incentives and penalties.
“Ultimately, in these value-based systems,” says Darling, a specialist in healthcare contracts and regulations, “the quality scores for physicians may affect their medical staff privileges or their membership in their group, or their ability to even move to another hospital.”
Moreover, hospital administrators are trying to instill a sense of shared responsibility in maintaining high value-based purchasing scores. “I cannot make a physician prescribe an ACE inhibitor when it’s appropriate to deal with heart failure, but the hospital takes a hit for that,” says Dee Rogers, RN, director of quality and risk management at Magnolia Regional Medical Center in Magnolia, Ark. “Not that I want to see people get their hands slapped—I want to see equal accountability.”
Like other hospitals, Rogers’ 49-bed rural facility is tracking doctors’ performance on quality measures and guidelines as part of its credentialing process. Many facilities are starting to include more comprehensive evaluations as part of their contract renegotiations. Magnolia has one weekend hospitalist and is conducting a feasibility study on whether to launch a full-time hospitalist program on weekdays. If the hospital pursues that program, Rogers says, she’d like to see upfront expectations built into the doctors’ contracts.
Seven Tips to Prepare for Value-Based Purchasing
- Pick your partners carefully. Lawyer Bill Darling says hospitalists must understand the terms of any contractual arrangement they enter and who their teammates will be for value-based purchasing. Are others likely to hold up their end of the bargain? If not, how much risk will fall upon hospitalists?
- Accept personal accountability. The reality is that more hospitals are demanding responsibility from individual physicians and posting their performance on key measures. Hospitalists might not be able to control how others respond, but embracing their own responsibility now will help ease the transition to an era of more public accountability. Become board-certified. Doing so, says Patrick Torcson, MD, will augment the disease-specific knowledge and quality-improvement skills necessary to be successful with value-based purchasing.
- Talk to your nurses. Not being on the same page can drag down both doctor-communication and nurse-communication scores in the eyes of patients who assume a medical team is regularly sharing information, says VHA Inc.’s Trent Haywood, MD.
- Make eye contact with your patients. If doctors sit with patients and make direct eye contact, even if only for five minutes, “it makes the patient feel like they’re being validated,” says Dee Rogers, RN. Satisfaction rates will “go through the roof,” she says.
- Establish upfront expectations. Remind-ing patients of what they should expect during their hospital stay, says Patricia Richardson, RN, RCP, director of quality and risk at Samaritan Hospital in Moses Lake, Wis., might help them put their experience in the proper context and not hold the facility to the same standards as their own homes.
- Pay attention to details and be adaptable. PeaceHealth’s Laura Dietzel says a two-sentence section in CMS’s proposed rules spurred her healthcare system to quickly adapt. PeaceHealth shifted away from several measures it had been focusing on after it became clear they would be retired from the competition “in the near future,” according to the rules.—BN


PeaceHealth, a faith-based nonprofit healthcare system that operates eight hospitals in Oregon, Washington, and Alaska, is moving in the same direction. “I think we’re getting pretty close—certainly within the next year, probably sooner—of creating a reliable mechanism for physician accountability related to the measures that are included in value-based purchasing,” says Laura Dietzel, PeaceHealth’s program director for High-Tech Meaningful Use. That mechanism will connect specific core measures with specific physicians, not just roles or departments.
“We are really honing in on that kind of a quality dashboard, and [VBP’s arrival] is definitely going to be a big boost toward doing that,” says Dietzel, the health system’s former program manager for core measures. “We are talking about making it part of our credentialing process, part of our privileging process, and part of our physician reimbursement and pay schedule process.”
Dietzel concedes that the health system will need to develop a valid method for ensuring that it correctly records who had the responsibility for key decisions. Apart from the concern over proper credit and blame, Darling warns that doctors who haven’t been paying attention could be left holding the bag.
If a hospitalist contract doesn’t discuss how payments will be handled with bundling, value-based purchasing, accountable care, and other models coming down the pike, Darling says, “it may be that you’ve bought a pig in a poke and that you’re just hoping for the kindness of strangers.” Likewise, if a hospital underperforms on its VBP scores due to a lack of investment or training, he asks, will its physicians also look bad on paper? The perceived guilt by association might hurt their chances at finding employment elsewhere if other hospital administrators fear that doctors from poorly performing facilities will hurt their scores as well.
To avoid the most dire “What if?” scenarios, hospitals are enlisting their staff and trying out new tools to help them identify and address trouble spots. At Dr. Torcson’s own hospital, 237-bed St. Tammany Parish Hospital in Covington, La., hospitalists and other staff members are scrutinizing the core measures and tweaking guidelines and best practices to make sure the facility is in top form. Based on initial modeling, the hospital expects to earn back all of its withheld reimbursements, though Dr. Torcson says the push is still on to increase the cushion.
A few QI organizations that contract with CMS, including Seattle-based Qualis Health, have developed interactive calculators or mock scorecards to help hospitals determine where they stand in the value-based purchasing scrum. Patricia Richardson, MA, RCP, director of quality and risk for 50-bed Samaritan Hospital in Moses Lake, Wash., says the hospital has worked with Qualis (www.qualishealth.org) on a scorecard to help staff understand which measures need attention and what the financial repercussions would be if the hospital doesn’t improve.
After earlier pushback from doctors on some core measures, quality-review specialist Rebecca Johnson says Samaritan began posting how individual doctors were performing. “And, over time, that motivated them,” she says. “Nobody wants to be the guy in the red.” Johnson says the hospital’s four hospitalists, though, have been fully engaged. “Our hospitalists are very interested in how we’re doing,” she says. “When I’m on the floor doing my reviews, they consistently ask—all of them—‘How are we doing on the core measures?’ ”
Although Richardson concedes that Samaritan still has work to do to increase its patient-satisfaction scores, she’s hopeful that more education and engagement of both patients and staff will begin to pay off. Initiatives that have recruited patients as active participants in helping the hospital improve might help boost patient satisfaction scores, and internal competitions could help motivate the medical staff.
Setting upfront expectations about the hospital stay during the admissions process also can help. Richardson says patients naturally compare a hospital’s noise level to that of their own homes unless a doctor or other staff member provides the proper context. Letting patients know what to expect and reminding them that they’ll likely have to be awakened a few times during the night can make a big difference in whether they rate the hospital as being sufficiently quiet, she says.
Competition Breeds Cooperation
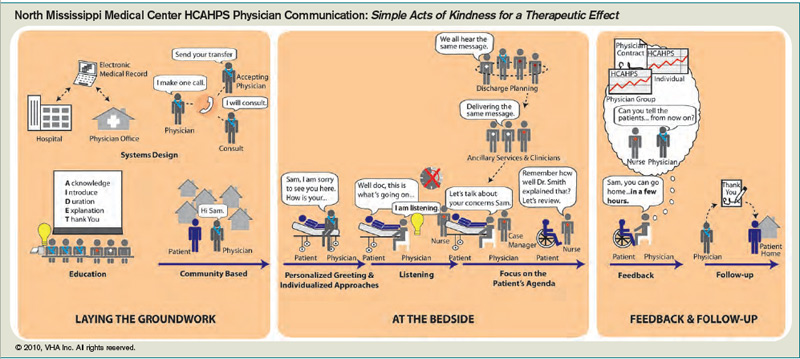
Hospitals likely will be able to differentiate themselves the most through the national competition’s patient perception of care scores, VHA Inc.’s Dr. Haywood says, largely because the contenders have had less time to prepare for them than for the clinical process-of-care measures. Among the eight HCAHPS measures, Dr. Haywood says, focusing on doctor communication, nurse communication, hospital staff responsiveness, and a quiet room might provide the biggest return on investment.
“If physicians don’t communicate effectively with the nurses, then the nurse communication score goes down because the patients assume that the nurses know the care plan,” he says. “A typical question that we see all the time is that the nurse will ask the patient, ‘Did the doctor come and see you today?’ And if the patient says yes, then the nurse will ask, ‘Well, what did the doctor say?’ because the nurse doesn’t know.”
With VBP in mind, Dr. Haywood’s health system repurposed part of its catalogue of Web-based blueprints designed to help hospitals improve their clinical practices (see Figure 2, below). The cooperative is now making its collection of more than 100 blueprints available to its members to help them prop up sagging core measure scores. All depict best-practice solutions in an easy-to-remember visual format, based on weeklong site visits to exemplary hospitals from a clinical team that includes a cultural anthropologist and graphic artist.
Arkansas’ Magnolia already exceeds the national average for every HCAHPS score except the overall rating, a score that will likely increase because most patient evaluations were conducted before a new facility replaced the previous, aging hospital in February 2010. Rogers says Magnolia’s weekend hospitalist has helped with continuity of care—an important factor for maintaining high satisfaction in a small, rural community where doctors tend to see the same elderly patients on a frequent basis. The patients know the hospitalist by name, she says, “so they almost have as much of a relationship to him as they do with their primary-care physician.”
Rogers says the weekend hospitalist also has helped improve some of the hospital’s lagging pneumonia-related scores by educating and communicating with other members of the medical staff about their respective responsibilities. Because he has gained the trust of his peers, Rogers says, he’s helped the hospital get more buy-in from them as well.
Embracing the role of VBP champion, Dr. Torcson says, could help further define the worth of hospitalists to their employers. And with a trend toward more individual physician accountability, rising to the occasion now could help hospitalists stay on top of their own game. TH
Bryn Nelson is a freelance medical writer in Seattle.
Scorecards and Price Tags: VBP’s Bottom Line
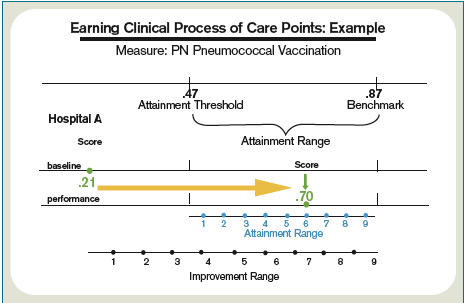
Hospitalists likely won’t be involved in calculating exactly how much hospitals stand to lose or gain with value-based purchasing. Nonetheless, knowing a little about how the scoring system works can help put your facility’s potential scores and their impact on the bottom line into perspective. Consider the example of patients’ perception of doctor communication, one of eight measures in the HCAHPS surveys.
In this case, Hospital A initially struggles with its baseline score, ranking only in the 42nd percentile among all hospitals. In order to receive any achievement points, the hospital would have to climb to at least the 50th percentile.
Fortunately, Hospital A improves to the 64th percentile during the performance period (which begins July 1). Based on the CMS scoring system, it would receive 3 achievement points or 4 improvement points. The latter score is higher, so the hospital gains 4 out of 10 possible points, giving it a final score of 40%.
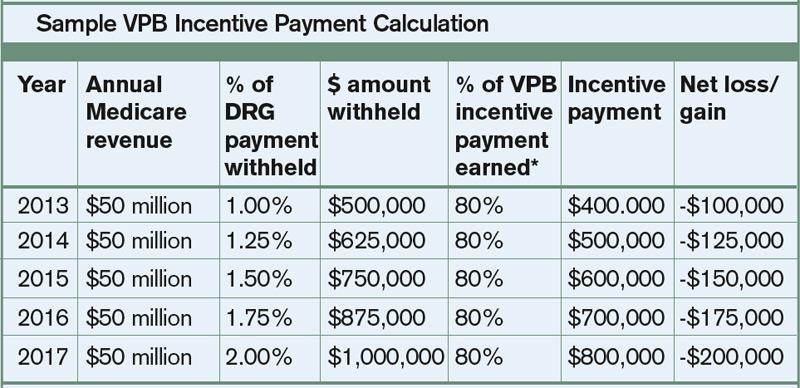
Let’s say this same hospital is eligible for 23 of the 25 measures, and gets a total performance average of 57% (or 5.7 out of 10 possible points on all measures). Based on the current exchange function, that hospital would get back about 80% of its withheld DRG reimbursements from CMS. What does that mean in terms of money? The table below offers a sample calculation, revealing that Hospital A could lose about $100,000 next year, and up to $200,000 in 2017.
Mock scorecards, interactive blueprints, quality dashboards: Hospitals are frantically seeking out any advantage that might help them excel in a fast-approaching, mandatory competition with millions of dollars on the line. Value-based purchasing (VBP), a program authorized by the Patient Protection and Accountable Care Act of 2010, gives the Centers for Medicare & Medicaid Services (CMS) the power to base a portion of hospital reimbursement payments on how well hospitals perform in 25 core measures.
The move is intended to help CMS flex its muscles and move from being a passive bystander to an active buyer of what its officials have deemed higher-quality healthcare. Analysts and healthcare experts warn that if hospitalists aren’t paying attention, however, they could put themselves at unnecessary risk or lose out on a major opportunity to demonstrate their value in what Patrick Torcson, MD, SFHM, is calling a “team sport.”
Dr. Torcson, chair of SHM’s Performance and Standards Committee, says every hospitalist should be aware of the core-measures concept, which has been around since 2003 in what’s now called the Hospital Inpatient Quality Reporting (IQR) Program. “We’re not reinventing the wheel; we’re just transforming the program from pay-for-reporting to actual pay-for-performance,” he says. Value-based purchasing, though, is raising the stakes considerably. “It’s really significant because it marks the beginning of an era of accountability and true pay-for-performance at the hospital level.”
A major reason for the heightened concern is the structure of the program. In other quality demonstration projects, CMS has established a score to beat: “Anyone above that threshold is in the money. If you didn’t make it, there was no harm, no foul,” says Trent Haywood, MD, JD, chief medical officer of the Irving, Tex.-based for-profit healthcare cooperative VHA Inc.
—Laura Dietzel, PeaceHealth’s program director for High-Tech Meaningful Use
What’s different this time is that value-based purchasing is not a collaboration but a competition in which every hospital is pitted against the entire market, says Dr. Haywood, the former deputy chief medical officer at CMS. It’s also a zero-sum game. That means there will be winners and losers, with the entire cost-neutral program funded by extracting money from the worst performers to financially reward the best. “In this competition-type model, you need to know who you can beat,” he says.
Race to the Top
That new reality has set off a mad scramble among hospitals hoping to gain any edge they can and spawned a cottage industry of consultants, lawyers, and quality specialists advising them on how to maximize their points. The drive to achieve and maintain a high level of performance is also spurring hospitals to seek more individual accountability as they look to minimize their financial risk.
Hospitals’ baseline scores already have been set, and the initial nine-month performance evaluation period begins July 1. Beginning with discharges on Oct. 1, 2012 (fiscal year 2013), the payment phase will kick in. CMS will start by withholding 1% of the base DRG reimbursement paid to hospitals. That money can be earned back based on how well each hospital scores on the performance measures during the evaluation period. The amount initially withheld will rise by 0.25 percentage points per year until it is capped at 2% in 2017 and beyond.
Think of the competition as an annual decathlon with a pool of prize money funded by the participants, except that hospitals will be evaluated on far more measures. So far, the program includes 17 core Clinical Process of Care measures and eight measures based on Hospital Consumer Assessment of Healthcare Providers and Systems (HCAHPS) surveys. Twenty other potential measures are waiting in the wings, including ones related to hospital-acquired conditions, patient safety, inpatient quality, and mortality, some of which likely will be introduced in fiscal year 2014.
CMS intends to monitor and evaluate the program’s impact on access and quality of care, especially for “vulnerable populations,” the percentage of patients who receive appropriate care, the rates of hospital-acquired conditions, and the best practices of high-performing hospitals.
The complicated nature of the rules and scoring, and significant money attached to the competition, have generated deep concern. In October and again in February, healthcare providers bombarded CMS representatives with questions and suggestions during open phone forums, when the regulations were still in flux. Would the rules be fair? Would CMS provide an early warning of impending losses? Was the agency giving too much weight to patient satisfaction scores?
SHM supports the program, stating, “We believe that the Medicare reimbursement system must be changed to promote value, and we strongly support policies that link quality measurement to performance-based payment.”
Other observers, though, have warned of the potential for unintended consequences. If doctors avoid complicated medical cases in order to increase a hospital’s score, for example, are they really improving care? Will poorly performing hospitals get caught in a vicious circle due to declining financial resources?
Some critics have complained that by scoring on a curve rather than on an absolute point system, the value-based purchasing program might not be a quality initiative so much as an opportunity for CMS to reduce hospital payments. “I believe that this is largely a shell game played by the Centers for Medicare & Medicaid Services to give hospitals the idea that they can win at this game, when all but a few will lose,” wrote Richard Rohr, MD, FHM, in his Feb. 1 entry at the Medical Staff Leader blog (http://blogs.hcpro.com/medicalstaff/). Hospitalist subsidies could be a prime target as the cost-reduction pressures rise, wrote Dr. Rohr, who directs HM programs for Guthrie Healthcare System in Sayre, Pa. Enhancing productivity, he stressed, could be the best defense against a rollback in salaries.
Most experts agree that investing in a quality infrastructure will be essential for success, though other hospitalists differ on the potential effects that VBP might have on their profession. “I think a big part of a quality infrastructure is a hospital medicine program,” Dr. Torcson says. In fact, he recommends that hospitalists approach a hospital CFO or CEO and offer their assistance with the program. “I really think that’s the right direction and the right attitude, kind of the way the Samurai used to serve the Japanese emperor,” he explains.
A major reason for taking the initiative, he says, is that value-based purchasing could become the new business case for HM. In the 1990s, hospitalists could put a real number on how much they saved hospitals by reducing length of stay, sparking an investment in HM programs. “I think value-based purchasing is now in the same position,” Dr. Torcson says, “and the savings is actually going to be even more quantifiable for the hospital in terms of their success or failure.”
continued below...
Expectations on the Rise
SHM’s annual meeting this month in Grapevine, Texas (www.hospitalmedicine2011.org), will feature a session on improving HCAHPS scores, and Dr. Torcson has been working on a society task force educating members about how to be successful amid the coming changes. A Web-based toolkit in the works, he says, will highlight best practices for myocardial infarctions, heart failure, surgical care, pneumonia, and patient satisfaction to help hospitalists ensure they have the necessary skill sets. (SHM will offer a full platform of VBP courses by end of 2011.)
“At the individual hospitalist level, once you’ve decided to commit to serving that hospital-level performance agenda, we want SHM to be the place to turn to get the information on best practices and what you need,” Dr. Torcson says.
But first, says Bill Darling, a Washington, D.C., and Austin, Tex.-based partner with Strasburger Attorneys at Law, hospitalists will need a much stronger understanding of hospital expectations. Many hospital officials already are indicating that they’re leaning toward their own pay-for-performance programs to put individual doctors on the hook for negative financial incentives and penalties.
“Ultimately, in these value-based systems,” says Darling, a specialist in healthcare contracts and regulations, “the quality scores for physicians may affect their medical staff privileges or their membership in their group, or their ability to even move to another hospital.”
Moreover, hospital administrators are trying to instill a sense of shared responsibility in maintaining high value-based purchasing scores. “I cannot make a physician prescribe an ACE inhibitor when it’s appropriate to deal with heart failure, but the hospital takes a hit for that,” says Dee Rogers, RN, director of quality and risk management at Magnolia Regional Medical Center in Magnolia, Ark. “Not that I want to see people get their hands slapped—I want to see equal accountability.”
Like other hospitals, Rogers’ 49-bed rural facility is tracking doctors’ performance on quality measures and guidelines as part of its credentialing process. Many facilities are starting to include more comprehensive evaluations as part of their contract renegotiations. Magnolia has one weekend hospitalist and is conducting a feasibility study on whether to launch a full-time hospitalist program on weekdays. If the hospital pursues that program, Rogers says, she’d like to see upfront expectations built into the doctors’ contracts.
Seven Tips to Prepare for Value-Based Purchasing
- Pick your partners carefully. Lawyer Bill Darling says hospitalists must understand the terms of any contractual arrangement they enter and who their teammates will be for value-based purchasing. Are others likely to hold up their end of the bargain? If not, how much risk will fall upon hospitalists?
- Accept personal accountability. The reality is that more hospitals are demanding responsibility from individual physicians and posting their performance on key measures. Hospitalists might not be able to control how others respond, but embracing their own responsibility now will help ease the transition to an era of more public accountability. Become board-certified. Doing so, says Patrick Torcson, MD, will augment the disease-specific knowledge and quality-improvement skills necessary to be successful with value-based purchasing.
- Talk to your nurses. Not being on the same page can drag down both doctor-communication and nurse-communication scores in the eyes of patients who assume a medical team is regularly sharing information, says VHA Inc.’s Trent Haywood, MD.
- Make eye contact with your patients. If doctors sit with patients and make direct eye contact, even if only for five minutes, “it makes the patient feel like they’re being validated,” says Dee Rogers, RN. Satisfaction rates will “go through the roof,” she says.
- Establish upfront expectations. Remind-ing patients of what they should expect during their hospital stay, says Patricia Richardson, RN, RCP, director of quality and risk at Samaritan Hospital in Moses Lake, Wis., might help them put their experience in the proper context and not hold the facility to the same standards as their own homes.
- Pay attention to details and be adaptable. PeaceHealth’s Laura Dietzel says a two-sentence section in CMS’s proposed rules spurred her healthcare system to quickly adapt. PeaceHealth shifted away from several measures it had been focusing on after it became clear they would be retired from the competition “in the near future,” according to the rules.—BN
PeaceHealth, a faith-based nonprofit healthcare system that operates eight hospitals in Oregon, Washington, and Alaska, is moving in the same direction. “I think we’re getting pretty close—certainly within the next year, probably sooner—of creating a reliable mechanism for physician accountability related to the measures that are included in value-based purchasing,” says Laura Dietzel, PeaceHealth’s program director for High-Tech Meaningful Use. That mechanism will connect specific core measures with specific physicians, not just roles or departments.
“We are really honing in on that kind of a quality dashboard, and [VBP’s arrival] is definitely going to be a big boost toward doing that,” says Dietzel, the health system’s former program manager for core measures. “We are talking about making it part of our credentialing process, part of our privileging process, and part of our physician reimbursement and pay schedule process.”
Dietzel concedes that the health system will need to develop a valid method for ensuring that it correctly records who had the responsibility for key decisions. Apart from the concern over proper credit and blame, Darling warns that doctors who haven’t been paying attention could be left holding the bag.
If a hospitalist contract doesn’t discuss how payments will be handled with bundling, value-based purchasing, accountable care, and other models coming down the pike, Darling says, “it may be that you’ve bought a pig in a poke and that you’re just hoping for the kindness of strangers.” Likewise, if a hospital underperforms on its VBP scores due to a lack of investment or training, he asks, will its physicians also look bad on paper? The perceived guilt by association might hurt their chances at finding employment elsewhere if other hospital administrators fear that doctors from poorly performing facilities will hurt their scores as well.
To avoid the most dire “What if?” scenarios, hospitals are enlisting their staff and trying out new tools to help them identify and address trouble spots. At Dr. Torcson’s own hospital, 237-bed St. Tammany Parish Hospital in Covington, La., hospitalists and other staff members are scrutinizing the core measures and tweaking guidelines and best practices to make sure the facility is in top form. Based on initial modeling, the hospital expects to earn back all of its withheld reimbursements, though Dr. Torcson says the push is still on to increase the cushion.
A few QI organizations that contract with CMS, including Seattle-based Qualis Health, have developed interactive calculators or mock scorecards to help hospitals determine where they stand in the value-based purchasing scrum. Patricia Richardson, MA, RCP, director of quality and risk for 50-bed Samaritan Hospital in Moses Lake, Wash., says the hospital has worked with Qualis (www.qualishealth.org) on a scorecard to help staff understand which measures need attention and what the financial repercussions would be if the hospital doesn’t improve.
After earlier pushback from doctors on some core measures, quality-review specialist Rebecca Johnson says Samaritan began posting how individual doctors were performing. “And, over time, that motivated them,” she says. “Nobody wants to be the guy in the red.” Johnson says the hospital’s four hospitalists, though, have been fully engaged. “Our hospitalists are very interested in how we’re doing,” she says. “When I’m on the floor doing my reviews, they consistently ask—all of them—‘How are we doing on the core measures?’ ”
Although Richardson concedes that Samaritan still has work to do to increase its patient-satisfaction scores, she’s hopeful that more education and engagement of both patients and staff will begin to pay off. Initiatives that have recruited patients as active participants in helping the hospital improve might help boost patient satisfaction scores, and internal competitions could help motivate the medical staff.
Setting upfront expectations about the hospital stay during the admissions process also can help. Richardson says patients naturally compare a hospital’s noise level to that of their own homes unless a doctor or other staff member provides the proper context. Letting patients know what to expect and reminding them that they’ll likely have to be awakened a few times during the night can make a big difference in whether they rate the hospital as being sufficiently quiet, she says.
Competition Breeds Cooperation
Hospitals likely will be able to differentiate themselves the most through the national competition’s patient perception of care scores, VHA Inc.’s Dr. Haywood says, largely because the contenders have had less time to prepare for them than for the clinical process-of-care measures. Among the eight HCAHPS measures, Dr. Haywood says, focusing on doctor communication, nurse communication, hospital staff responsiveness, and a quiet room might provide the biggest return on investment.
“If physicians don’t communicate effectively with the nurses, then the nurse communication score goes down because the patients assume that the nurses know the care plan,” he says. “A typical question that we see all the time is that the nurse will ask the patient, ‘Did the doctor come and see you today?’ And if the patient says yes, then the nurse will ask, ‘Well, what did the doctor say?’ because the nurse doesn’t know.”
With VBP in mind, Dr. Haywood’s health system repurposed part of its catalogue of Web-based blueprints designed to help hospitals improve their clinical practices (see Figure 2, below). The cooperative is now making its collection of more than 100 blueprints available to its members to help them prop up sagging core measure scores. All depict best-practice solutions in an easy-to-remember visual format, based on weeklong site visits to exemplary hospitals from a clinical team that includes a cultural anthropologist and graphic artist.
Arkansas’ Magnolia already exceeds the national average for every HCAHPS score except the overall rating, a score that will likely increase because most patient evaluations were conducted before a new facility replaced the previous, aging hospital in February 2010. Rogers says Magnolia’s weekend hospitalist has helped with continuity of care—an important factor for maintaining high satisfaction in a small, rural community where doctors tend to see the same elderly patients on a frequent basis. The patients know the hospitalist by name, she says, “so they almost have as much of a relationship to him as they do with their primary-care physician.”
Rogers says the weekend hospitalist also has helped improve some of the hospital’s lagging pneumonia-related scores by educating and communicating with other members of the medical staff about their respective responsibilities. Because he has gained the trust of his peers, Rogers says, he’s helped the hospital get more buy-in from them as well.
Embracing the role of VBP champion, Dr. Torcson says, could help further define the worth of hospitalists to their employers. And with a trend toward more individual physician accountability, rising to the occasion now could help hospitalists stay on top of their own game. TH
Bryn Nelson is a freelance medical writer in Seattle.
Scorecards and Price Tags: VBP’s Bottom Line
Hospitalists likely won’t be involved in calculating exactly how much hospitals stand to lose or gain with value-based purchasing. Nonetheless, knowing a little about how the scoring system works can help put your facility’s potential scores and their impact on the bottom line into perspective. Consider the example of patients’ perception of doctor communication, one of eight measures in the HCAHPS surveys.
In this case, Hospital A initially struggles with its baseline score, ranking only in the 42nd percentile among all hospitals. In order to receive any achievement points, the hospital would have to climb to at least the 50th percentile.
Fortunately, Hospital A improves to the 64th percentile during the performance period (which begins July 1). Based on the CMS scoring system, it would receive 3 achievement points or 4 improvement points. The latter score is higher, so the hospital gains 4 out of 10 possible points, giving it a final score of 40%.
Let’s say this same hospital is eligible for 23 of the 25 measures, and gets a total performance average of 57% (or 5.7 out of 10 possible points on all measures). Based on the current exchange function, that hospital would get back about 80% of its withheld DRG reimbursements from CMS. What does that mean in terms of money? The table below offers a sample calculation, revealing that Hospital A could lose about $100,000 next year, and up to $200,000 in 2017.
NEW DEPARTMENT: Innovations

No one becomes a doctor to make a fashion statement, but a new study (http://onlinelibrary.wiley.com/doi/10.1002/jhm.864/abstract) in the Journal of Hospital Medicine reports that the choice between long-sleeved white coats and freshly laundered scrubs might be a question of taste, not safety.
The report, “Newly Cleaned Physician Uniforms and Infrequently Washed White Coats Have Similar Rates of Bacterial Contamination After an 8-Hour Workday: A Randomized Controlled Trial,” found no statistically significant differences in bacterial or methicillin-resistant Staphylococcus aureus (MRSA) contamination of physicians’ white coats compared with scrubs or in contamination of the skin at the wrists of physicians wearing either garment.
In an email interview, Marisha Burden, MD, interim chief of hospital medicine at the Denver Health and Hospital Authority, says that the topic area came up during a review of research regarding MRSA and infection-control policies. Dr. Burden found references to the so-called “bare below the elbows” policy in the United Kingdom, a reference to 2007 rules from the British Department of Health banning long-sleeved coats in an attempt to stop nosocomial bacterial transmission.
“This policy was interesting to us secondary to the fact that there was no literature to support the measures being implemented,” Dr. Burden says. “ … Our data show that bacterial contamination of work clothes occurs within hours of putting them on, as well that at the end of an eight-hour workday, there is no difference in bacterial or MRSA contamination of either dress.”
Dr. Burden says the data do not support discarding white coats for uniforms that are changed on a daily basis, or for “requiring healthcare workers to avoid long-sleeved garments.” She also says that white coats have traditional lures as well as practical ones: Most of the physicians who declined to participate in the study did so because they refused to work without the pockets that came with their lab coats.
“I think we also have to consider the professional image that our physicians portray,” she adds. “Our patients expect their physicians to appear professional with clean, white coats.”—RQ
Technology
App Allows CT, MRI, PET Diagnoses Via iPhone, iPad
What can a hospitalist do the next time someone in the group has no immediate access to a work station but needs to make a medical diagnoses based on computed tomography (CT), magnetic resonance imaging (MRI), or positron emission tomography (PET)?
Grab the nearest iPhone.
The FDA recently approved an application from MIM Software Inc. of Cleveland to let doctors review medical images on the iPhone and iPad via a secure network transfer. The application, Mobile MIM, is the first with the FDA’s imprimatur. It allows hospitalists and other physicians to measure distance on the image and image intensity values and display measurement lines, annotations, and regions of interest, according to the FDA.
“Think of how cell phones were perceived a few decades ago; many dismissed ‘anytime access’ as not necessary,” MIM chief technology officer Mark Cain says in an email. “Yet now we know myriad of cases where the cell phone has proven immensely valuable. The same can be said of diagnostic medical image access. How many ways can this improve healthcare? More ways than I can predict.”—RQ
Quality Research
Research Confirms Benefits of ICU Safety Checklists
The value of checklists containing evidence-supported QI interventions to improve ICU outcomes, pioneered at Johns Hopkins in Baltimore, has been confirmed by several recent studies. The Keystone ICU Project, which sought to replicate the Hopkins experience in hospitals across Michigan, succeeded in nearly eliminating bloodstream infections and reducing mortality.1
Based on Medicare claims from 95 study hospitals and comparison data from 11 surrounding states, patients in hospitals using the checklist were significantly more likely to survive a hospital stay. The project was not, however, sufficiently powered to show a significant difference in length of stay.
A second Keystone Project study showed that five simple therapies aimed at lessening the time spent on ventilators, including elevating the head of the bed 30 degrees, giving anticoagulants, and lessening sedation, combined with education and a hospital culture supporting patient safety, reduced cases of ventilator-associated pneumonia by more than 70%.2
A comprehensive, video-conference-based intervention to support implementing six evidence-based quality practices in 15 community hospital ICUs in Canada improved the adoption of these practices. Expert-led forums and educational sessions promoted the sequential dissemination of treatment algorhythms, with a new practice targeted every four months.3—LB
References
- Lipitz-Snyderman A, Steinwachs D, Needham DM, Colantuoni E, Morlock LL, Pronovost PJ. Impact of a statewide intensive care unit quality improvement initiative on hospital mortality and length of stay: retrospective comparative analysis. BMJ. 2011;342:d219.
- Berenholtz SM, Pham JC, Thompson DA, Needhamm et al. Collaborative cohort study of an intervention to reduce ventilator-associated pneumonia in the intensive care unit. Infect Control Hosp Epidemiol. 2011;(4):305-314.
- Scales DC, Dainty K, Hales B. A multifaceted intervention for quality improvement in a network of intensive care units: a cluster randomized trial. JAMA. 2011;305:363-372.
HM-Based Quality Research
Homeless Respite Helps Avoid Rehospitalizations
Some readmissions come about because things fall apart when patients are discharged with a follow-up plan that is not realistic to their circumstances. This is especially true for homeless patients, says Audrey Kuang, MD, a hospitalist at Santa Clara Valley Medical Center (SCVMC) in San Jose, Calif., and medical director of the Santa Clara County Medical Respite Program, a shelter for homeless patients following discharge from seven San Jose area hospitals.
Dr. Kuang described the collaborative program in a plenary presentation for the Research, Innovations, and Clinical Vignettes competition at HM10.
SCVMC is a county safety net hospital, and Dr. Kuang says the hospitalists “see a fair amount of homeless patients with recurrent exacerbations.” Patients given prescriptions for medications they can’t afford, special diets, or instructions for bed rest are then discharged to the street; inevitably, they are readmitted.
Dr. Kuang began tracking patients who had prolonged hospital stays because of homelessness or unsafe social situations. Her presentation to administrators led to participating hospitals contributing $25,000 each to launch the program with a multidisciplinary team, which included Dr. Kuang.
In its first year, 200 referrals were made to the respite program; 60% were accepted. The most common diagnoses were foot fractures, foot infections, and cancer. Quantified clinical outcomes are still being compiled, Dr. Kuang said, although the participating hospitals have reported decreased rehospitalizations and bed days—results documented in other studies of respite programs.1
“The main idea is post-acute medical care and support for homeless patients in need,” she explained. “Hospitalists may feel this is beyond our scope of practice, but it is our responsibility to know what’s going on out there.”—LB
Reference
- Buchanan D, Doblin B, Sai T, Garcia P. The effects of respite care for homeless patients: a cohort study. Am J Public Health. 2006;96:1278-1281.
By The Numbers
$44,000, $46,659, $120,000: EHR Implementation Costs Higher than Medicare Reimbursement
A new study in Health Affairs on the first-year costs of implementing electronic health records (EHR) in a 450-physician North Texas primary-care network doesn’t translate directly to HM, but figures showing that the installation cost is more for an average five-physician practice than Medicare is offering in incentive pay might serve as a warning sign for HM groups looking to build EHR into their practice:
- EHR incentive payments from Medicare over five years: $44,000;
- EHR implementation cost per doctor after first year: $46,659;
- EHR adoption costs per physician, estimated: $120,000.—RQ TH
The Billing & Coding Bandwagon

It’s no secret that documenting and coding one’s work is not the average hospitalist’s favorite thing to do. It’s probably not even in the top 10 or 20. In fact, many consider the whole documentation process a “thorn in the side.”
“When I first started working, I couldn’t believe that I could get audited and fined just because I didn’t add ‘10-point’ or ‘12-point’ to my note of ‘review of systems: negative,’ ” says hospitalist Amaka Nweke, MD, assistant director with Hospitalists Management Group (HMG) at Kenosha Medical Center in Kenosha, Wis. “I had a lot of frustration, because I had to repackage and re-present my notes in a manner that makes sense to Medicare but makes no sense to physicians.”
Like it or not, healthcare providers live in a highly regulated world, says Richard D. Pinson, MD, FACP, CCS, who became a certified coding specialist and formed his own consulting company, Houston-based HCQ Consulting, to help hospitals and physicians achieve diagnostic accuracy for inpatient care. Documentation and coding have become a serious, high-stakes word game, he says. “Perfectly good clinical documentation, especially with some important diagnoses, may not correspond at all to what is required by the strict coding rules that govern code assignments,” he says.
A hospitalist’s documentation is at the heart of accurate coding, whether it’s for the hospital’s DRG reimbursement, quality and performance scores, or for assigning current procedural terminology (CPT) and evaluation and management (E/M) codes for billing for their own professional services. And if hospitalists don’t buy into the coding mindset, they risk decreased reimbursement for their services, monetary losses for the hospital, Medicare audits, compromised quality scores for both the hospital and themselves, and noncompliance.
“If your documentation is not up to par, then the hospital may get fined and lose money, and you can’t prove your worth as a hospitalist,” Dr. Nweke says.
What’s at Stake?

Inadequate documentation results in “undercoding” a patient’s condition and underpayment to your hospital (see Table 1, right). Undercoding also can result in inadequate representation of the severity of a patient’s illness, complexity, and cost of care. If a patient gets worse in the hospital, then that initial lower severity of illness might show up in poor performance scores on outcome measures. If a patient’s severity of illness is miscoded, Medicare might question the medical necessity for inpatient admission and deny payment.
On the other hand, if overcoding occurs because the clinical criteria for a specific diagnosis have not been met, Medicare will take action to recover the overpayment, leveling penalties and sanctions. (For more information on Medicare’s Recovery Audit Contractor program, dubbed “Medicare’s repo men” by Dr. Pinson, see “Take Proactive Approach to Recovery Audit Contractors,” p. 28.)
Lack of specificity also hampers reimbursement for professional fees, says Barb Pierce, CCS-P, ACS-EM, president of Barb Pierce Coding and Consulting Inc. of West Des Moines, Iowa. “Unfortunately,” she observes, “the code isn’t just based on decision-making, which is why physicians went to school for all those years. The guidelines [Documentation Guidelines for Evaluation and Management Services] mandate that if you forget one little bullet in history or examination, even if you’ve got the riskiest, highest-level, decision-making patient in front of you, that could pull down the whole code selection.”1
How costly might such small mistakes be for an HM group? According to the State of Hospital Medicine: 2010 Report Based on 2009 Data survey, internal-medicine hospitalists generate a median of 1.86 work relative value units (wRVUs) per encounter, and collect $45.57 per wRVU.2 If a hospitalist has 2,200 encounters per year and averages only 1.65 wRVUs per encounter, improving documentation and coding performance could add an additional 0.21 wRVUs, meeting the national average. Multiplying those 2,200 encounters by the national average of 1.86, the hospitalist could potentially add an additional 462 wRVUs for the year. Such documentation improvement—up to the national average—would equate to $21,053 in additional billed revenue without increasing the physician’s overall workload.
Dr. Pinson explains that physicians often perceive their time constraints as so severe that they’d be hard pressed to find the time to learn about documentation and coding. But he maintains that even short seminars yield “a huge amount of information that would astound [hospitalists], in terms of usefulness for their own clinical practices.”
Barriers to the Coding Mindset

Most hospitalists receive little or no training in documentation and coding during medical school or residency. The lack of education is further complicated because there are several coding sets healthcare providers must master, each with different rules governing assignment of diagnoses and levels of care (see “Coding Sets: Separate but Overlapping,” above).
Inexperience with coding guidelines can lead to mismatches. Nelly Leon-Chisen, RHIA, director of coding and classification for the American Hospital Association (AHA), gives one example: The ICD-9-CM Official Coding Guideline stipulates that coders cannot assign diagnosis codes based on lab results.3 So although it might appear intuitive to a physician that repeated blood sugars and monitoring of insulin levels indicate a patient has diabetes, the coder cannot assign the diagnosis unless it’s explicitly stated in the record.
Some physicians could simply be using outmoded terminology, such as “renal insufficiency” instead of “acute renal failure,” Dr. Pinson notes. If hospitalists learn to focus on evidence-based clinical criteria to support the codes, it leads to more effective care, he says.
The nature of hospitalist programs might not lend itself to efficient revenue-cycle processes for their own professional billing, says Jeri Leong, RN, CPC, CPC-H, president and CEO of Honolulu-based Healthcare Coding Consultants of Hawaii. If the HM group contracts with several hospitals, the hospitalists will be together rarely as a group, “so they don’t have the luxury of sitting down together with their billers to get important feedback and coding updates,” she says.
Leong’s company identifies missed charges, for instance, when charge tags from different shifts do not get married together (Hospitalist A might round on the patient in the morning and turn in a charge tag; Hospitalist B might do a procedure in the afternoon, but the two tags do not get combined). Examples such as these, she says, “can be an issue from a compliance perspective, and can leave money on the table.”
One of the problems Kathy DeVault, RHIA, CCS, CCS-P, manager of professional practice resources for the American Health Information Management Association (AHIMA), sees is a lack of continuity between initial admitting diagnosis and discharge summaries. For example, a hospitalist might admit a patient for acute renal failure—the correct diagnosis—and be able to reverse the condition fairly quickly, especially if the failure is due to dehydration.
The patient, whose issue is resolved, could be discharged by an attending physician who does not note the acute diagnosis in the summary. “That acute condition disappears, and the RAC auditor may then challenge the claim for payment,” DeVault says.
The Remedies
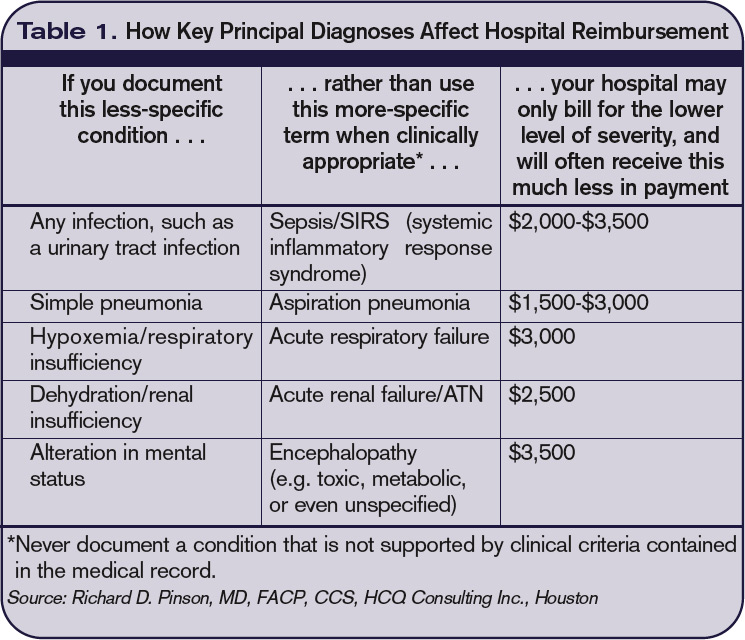
While physicians might think that they don’t have the time to acquire coding education, there could be other incentives coming down the pike. Dr. Pinson has noticed that hospitals are beginning to incorporate documentation accuracy into their contractual reimbursement formulas.
Documentation fixes vary according to domain. A hospital’s clinical documentation specialists can query physicians for clarity and detail in their notes; for instance, a diagnosis of congestive heart failure (CHF) must be accompanied by additional documentation stating whether the CHF is acute or chronic, and whether it is systolic or diastolic.
Many hospitals have instituted clinical documentation improvement (CDI) programs, sometimes called clinical documentation integrity programs, to address documentation discrepancies. CDI programs are essential to hospitals’ financial survival, Dr. Pinson says, and hospitalists are ideally positioned to join those efforts.
“[The hospitalists] are the most important people to the hospital in all of this,” he says. “They’re at the center of this whirlpool. If you have these skills, your value to the hospital and to your group is greatly enhanced.” (Visit the-hospitalist.org to listen to Dr. Pinson discuss HM’s role in documentation improvement.)
Leon-Chisen also says that the relationship between coders and physicians should be collaborative. “If it’s adversarial, nobody wins,” she points out, adding that CDI programs present an opportunity for mutual education.
Conducting audits of the practice’s documentation and coding can identify coding strengths and weaknesses, says Pierce, who is faculty for SHM’s billing and coding pre-course and regularly consults with hospitalist groups. Audits are helpful, she says, not just for increasing group revenue, but for compliance reasons as well. “You need to know what you’re doing well, and what you’re not doing quite so well, and get it fixed internally before an entity like Medicare discovers it,” she says.
It’s no doubt difficult for a busy HM group to stay on top of annual coding updates and changes to guidelines for reporting their services, Leong notes. Her company has worked with many hospitalist groups over the years, offering coding workshops, “back end” audits, and real-time feedback of E/M and CPT coding choices. If all of the hospitalists in a group cannot convene simultaneously, Leong provides the feedback (in the form of a scorecard) to the group’s physician champion, who becomes the lead contact to help those physicians who struggle more with their coding. (Leong talks more about real-time feedback and capturing CPT and E/M codes at the-hospitalist.org.)
In lieu of hiring professional coders, some HM groups use electronic coding devices. The software could be a standalone product, or it could interface with other products, such as electronic medical records (EMRs). These programs assist with a variety of coding-related activities, such as CPT or ICD-9 lookups, or calculation of E/M key components with assignment of an appropriate level of billing. Leong, however, cautions too much reliance on technology.
“While these devices can be accurate, compact, and convenient, it’s important to maintain a current [software] subscription to keep abreast of updates to the code sets, which occur sometimes as often as quarterly,” she says.
Pierce adds that coding tools should be double-checked against an audit tool. She has sometimes found discrepancies when auditing against an EMR product that assigns the E/M level.

Attitude Adjustment
Coding experts emphasize that physicians need not worry about mastering coding manuals, but they should forge relationships with both their hospital’s billers and the coders for their practice.
Dr. Nweke took advantage of coding and billing workshops offered by her group, HMG, and through the seminars began to understand what a DRG meant not just for her hospital but for her own evaluations and the expansion of her HM group, too. “Now, when I get questions from billers and coders, I try to answer them quickly,” she says. “I don’t look upon them as the enemy, but rather as people who are helping me document appropriately, so I don’t get audited by Medicare. I think the way you view the coders and billers definitely affects your willingness to learn.”
Dr. Nweke also takes a broader view of her role as a hospitalist. “You are there to take care of patients and assist with transitioning them in and out of the hospital, but you’re also there to ensure that the hospital remains afloat financially,” she says. “Your documentation plays a huge role in that. We have a huge contribution to make.”
The patient gains, too, says Leon-Chisen, who explains that documentation should be as accurate as possible “because someone else—the patient’s primary physician—will be taking over care of that patient and needs to understand what happened in the hospital.”
“The bottom line,” Dr. Pinson says, “is that we need accurate documentation that can be correctly coded to reflect the true complexity of care and severity of illness. If we do that, good things will follow.” TH
Gretchen Henkel is a freelance writer based in California.
References
- 1997 Documentation Guidelines for Evaluation and Management Services. Centers for Medicare & Medicaid Services website. Available at: www.cms.gov/MLNProducts/Downloads/MASTER1.pdf. Accessed April 11, 2011.
- State of Hospital Medicine: 2010 Report Based on 2009 Data. Society of Hospital Medicine and Medical Group Management Association; Philadelphia and Englewood, Colo.; 2010.
- ICD-9-CM Official Coding Guidelines. CMS and National Center for Health Statistics; Washington, D.C.; 2008. Available at: www.ama-assn.org/resources/doc/cpt/icd9cm_coding_guidelines_08_09_full.pdf. Accessed April 10, 2011.
Take Proactive Approach to Recovery Audit Contractors
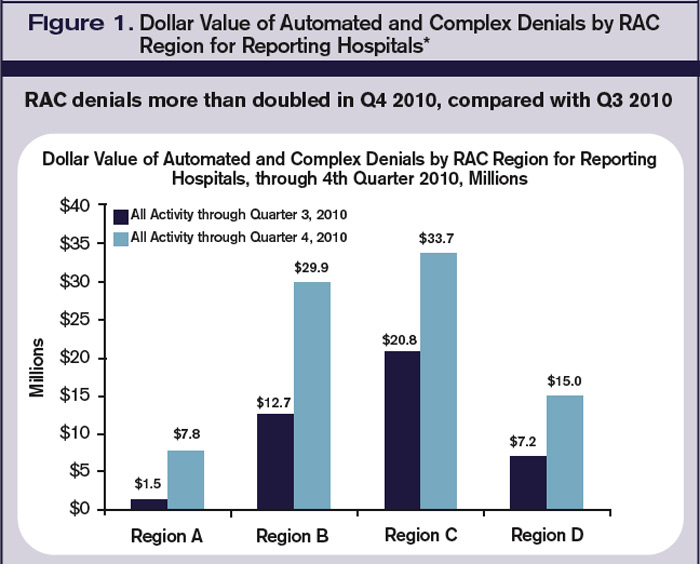
The congressionally authorized Medicare Recovery Audit Contractor (RAC) program began with a three-year demonstration pilot project in 2005. In August 2010, the program expanded to the entire country. The RAC’s main objective is to identify improper Medicare payments, both overpayments and underpayments, to providers. CMS, which administrates Medicare and the RAC program, has agreements with contractors who are authorized to audit and review claims that are up to three years old.
According to Elizabeth Baskett, senior associate director of policy at the AHA, medical necessity review was a big focus of the RAC demonstration project and now is “under way in the permanent RAC program. We are bracing ourselves for a significant amount of denials.”
The AHA has created a free, Web-based survey called RAC Trac (www.aha.org/aha/issues/RAC/ractrac.html) to assess the nationwide impact the RAC program has on U.S. hospitals. In a report released Feb. 24, the RAC Trac survey shows that $82 million in denials were reported, more than double the dollar amount of denials reported in the third quarter of 2010 (see Figure 1, below). It also shows 57% of the more than 1,850 participating hospitals cited “medically unnecessary” as a reason for a denial of a claim.
Nearly 80% of the participating hospitals reported RAC activity in 2010, with general medical and surgical hospitals reporting the most activity. Fifty percent of reporting hospitals noted that their administrative burden—in the form of hiring consultants, copying medical records, hiring legal counsel, and the like—had increased as a result of RAC activity.
Most importantly, the report shows the average dollar value of automated denials was $399. But when a complex review—one involving a human review of requested records—was conducted, the average value of the denial was $5,281. Additionally, inpatient facilities were most likely to experience complex denials, which account for 90% of the value of denied claims.
Leong says RAC audits are just one area of “exposure to review for hospitals and providers. Other third-party payers, including individual commercial insurance companies,” she says, “also do routine post-payment review and recoupment, several years after payment.”—GH
It’s no secret that documenting and coding one’s work is not the average hospitalist’s favorite thing to do. It’s probably not even in the top 10 or 20. In fact, many consider the whole documentation process a “thorn in the side.”
“When I first started working, I couldn’t believe that I could get audited and fined just because I didn’t add ‘10-point’ or ‘12-point’ to my note of ‘review of systems: negative,’ ” says hospitalist Amaka Nweke, MD, assistant director with Hospitalists Management Group (HMG) at Kenosha Medical Center in Kenosha, Wis. “I had a lot of frustration, because I had to repackage and re-present my notes in a manner that makes sense to Medicare but makes no sense to physicians.”
Like it or not, healthcare providers live in a highly regulated world, says Richard D. Pinson, MD, FACP, CCS, who became a certified coding specialist and formed his own consulting company, Houston-based HCQ Consulting, to help hospitals and physicians achieve diagnostic accuracy for inpatient care. Documentation and coding have become a serious, high-stakes word game, he says. “Perfectly good clinical documentation, especially with some important diagnoses, may not correspond at all to what is required by the strict coding rules that govern code assignments,” he says.
A hospitalist’s documentation is at the heart of accurate coding, whether it’s for the hospital’s DRG reimbursement, quality and performance scores, or for assigning current procedural terminology (CPT) and evaluation and management (E/M) codes for billing for their own professional services. And if hospitalists don’t buy into the coding mindset, they risk decreased reimbursement for their services, monetary losses for the hospital, Medicare audits, compromised quality scores for both the hospital and themselves, and noncompliance.
“If your documentation is not up to par, then the hospital may get fined and lose money, and you can’t prove your worth as a hospitalist,” Dr. Nweke says.
What’s at Stake?
Inadequate documentation results in “undercoding” a patient’s condition and underpayment to your hospital (see Table 1, right). Undercoding also can result in inadequate representation of the severity of a patient’s illness, complexity, and cost of care. If a patient gets worse in the hospital, then that initial lower severity of illness might show up in poor performance scores on outcome measures. If a patient’s severity of illness is miscoded, Medicare might question the medical necessity for inpatient admission and deny payment.
On the other hand, if overcoding occurs because the clinical criteria for a specific diagnosis have not been met, Medicare will take action to recover the overpayment, leveling penalties and sanctions. (For more information on Medicare’s Recovery Audit Contractor program, dubbed “Medicare’s repo men” by Dr. Pinson, see “Take Proactive Approach to Recovery Audit Contractors,” p. 28.)
Lack of specificity also hampers reimbursement for professional fees, says Barb Pierce, CCS-P, ACS-EM, president of Barb Pierce Coding and Consulting Inc. of West Des Moines, Iowa. “Unfortunately,” she observes, “the code isn’t just based on decision-making, which is why physicians went to school for all those years. The guidelines [Documentation Guidelines for Evaluation and Management Services] mandate that if you forget one little bullet in history or examination, even if you’ve got the riskiest, highest-level, decision-making patient in front of you, that could pull down the whole code selection.”1
How costly might such small mistakes be for an HM group? According to the State of Hospital Medicine: 2010 Report Based on 2009 Data survey, internal-medicine hospitalists generate a median of 1.86 work relative value units (wRVUs) per encounter, and collect $45.57 per wRVU.2 If a hospitalist has 2,200 encounters per year and averages only 1.65 wRVUs per encounter, improving documentation and coding performance could add an additional 0.21 wRVUs, meeting the national average. Multiplying those 2,200 encounters by the national average of 1.86, the hospitalist could potentially add an additional 462 wRVUs for the year. Such documentation improvement—up to the national average—would equate to $21,053 in additional billed revenue without increasing the physician’s overall workload.
Dr. Pinson explains that physicians often perceive their time constraints as so severe that they’d be hard pressed to find the time to learn about documentation and coding. But he maintains that even short seminars yield “a huge amount of information that would astound [hospitalists], in terms of usefulness for their own clinical practices.”
Barriers to the Coding Mindset
Most hospitalists receive little or no training in documentation and coding during medical school or residency. The lack of education is further complicated because there are several coding sets healthcare providers must master, each with different rules governing assignment of diagnoses and levels of care (see “Coding Sets: Separate but Overlapping,” above).
Inexperience with coding guidelines can lead to mismatches. Nelly Leon-Chisen, RHIA, director of coding and classification for the American Hospital Association (AHA), gives one example: The ICD-9-CM Official Coding Guideline stipulates that coders cannot assign diagnosis codes based on lab results.3 So although it might appear intuitive to a physician that repeated blood sugars and monitoring of insulin levels indicate a patient has diabetes, the coder cannot assign the diagnosis unless it’s explicitly stated in the record.
Some physicians could simply be using outmoded terminology, such as “renal insufficiency” instead of “acute renal failure,” Dr. Pinson notes. If hospitalists learn to focus on evidence-based clinical criteria to support the codes, it leads to more effective care, he says.
The nature of hospitalist programs might not lend itself to efficient revenue-cycle processes for their own professional billing, says Jeri Leong, RN, CPC, CPC-H, president and CEO of Honolulu-based Healthcare Coding Consultants of Hawaii. If the HM group contracts with several hospitals, the hospitalists will be together rarely as a group, “so they don’t have the luxury of sitting down together with their billers to get important feedback and coding updates,” she says.
Leong’s company identifies missed charges, for instance, when charge tags from different shifts do not get married together (Hospitalist A might round on the patient in the morning and turn in a charge tag; Hospitalist B might do a procedure in the afternoon, but the two tags do not get combined). Examples such as these, she says, “can be an issue from a compliance perspective, and can leave money on the table.”
One of the problems Kathy DeVault, RHIA, CCS, CCS-P, manager of professional practice resources for the American Health Information Management Association (AHIMA), sees is a lack of continuity between initial admitting diagnosis and discharge summaries. For example, a hospitalist might admit a patient for acute renal failure—the correct diagnosis—and be able to reverse the condition fairly quickly, especially if the failure is due to dehydration.
The patient, whose issue is resolved, could be discharged by an attending physician who does not note the acute diagnosis in the summary. “That acute condition disappears, and the RAC auditor may then challenge the claim for payment,” DeVault says.
The Remedies
While physicians might think that they don’t have the time to acquire coding education, there could be other incentives coming down the pike. Dr. Pinson has noticed that hospitals are beginning to incorporate documentation accuracy into their contractual reimbursement formulas.
Documentation fixes vary according to domain. A hospital’s clinical documentation specialists can query physicians for clarity and detail in their notes; for instance, a diagnosis of congestive heart failure (CHF) must be accompanied by additional documentation stating whether the CHF is acute or chronic, and whether it is systolic or diastolic.
Many hospitals have instituted clinical documentation improvement (CDI) programs, sometimes called clinical documentation integrity programs, to address documentation discrepancies. CDI programs are essential to hospitals’ financial survival, Dr. Pinson says, and hospitalists are ideally positioned to join those efforts.
“[The hospitalists] are the most important people to the hospital in all of this,” he says. “They’re at the center of this whirlpool. If you have these skills, your value to the hospital and to your group is greatly enhanced.” (Visit the-hospitalist.org to listen to Dr. Pinson discuss HM’s role in documentation improvement.)
Leon-Chisen also says that the relationship between coders and physicians should be collaborative. “If it’s adversarial, nobody wins,” she points out, adding that CDI programs present an opportunity for mutual education.
Conducting audits of the practice’s documentation and coding can identify coding strengths and weaknesses, says Pierce, who is faculty for SHM’s billing and coding pre-course and regularly consults with hospitalist groups. Audits are helpful, she says, not just for increasing group revenue, but for compliance reasons as well. “You need to know what you’re doing well, and what you’re not doing quite so well, and get it fixed internally before an entity like Medicare discovers it,” she says.
It’s no doubt difficult for a busy HM group to stay on top of annual coding updates and changes to guidelines for reporting their services, Leong notes. Her company has worked with many hospitalist groups over the years, offering coding workshops, “back end” audits, and real-time feedback of E/M and CPT coding choices. If all of the hospitalists in a group cannot convene simultaneously, Leong provides the feedback (in the form of a scorecard) to the group’s physician champion, who becomes the lead contact to help those physicians who struggle more with their coding. (Leong talks more about real-time feedback and capturing CPT and E/M codes at the-hospitalist.org.)
In lieu of hiring professional coders, some HM groups use electronic coding devices. The software could be a standalone product, or it could interface with other products, such as electronic medical records (EMRs). These programs assist with a variety of coding-related activities, such as CPT or ICD-9 lookups, or calculation of E/M key components with assignment of an appropriate level of billing. Leong, however, cautions too much reliance on technology.
“While these devices can be accurate, compact, and convenient, it’s important to maintain a current [software] subscription to keep abreast of updates to the code sets, which occur sometimes as often as quarterly,” she says.
Pierce adds that coding tools should be double-checked against an audit tool. She has sometimes found discrepancies when auditing against an EMR product that assigns the E/M level.
Attitude Adjustment
Coding experts emphasize that physicians need not worry about mastering coding manuals, but they should forge relationships with both their hospital’s billers and the coders for their practice.
Dr. Nweke took advantage of coding and billing workshops offered by her group, HMG, and through the seminars began to understand what a DRG meant not just for her hospital but for her own evaluations and the expansion of her HM group, too. “Now, when I get questions from billers and coders, I try to answer them quickly,” she says. “I don’t look upon them as the enemy, but rather as people who are helping me document appropriately, so I don’t get audited by Medicare. I think the way you view the coders and billers definitely affects your willingness to learn.”
Dr. Nweke also takes a broader view of her role as a hospitalist. “You are there to take care of patients and assist with transitioning them in and out of the hospital, but you’re also there to ensure that the hospital remains afloat financially,” she says. “Your documentation plays a huge role in that. We have a huge contribution to make.”
The patient gains, too, says Leon-Chisen, who explains that documentation should be as accurate as possible “because someone else—the patient’s primary physician—will be taking over care of that patient and needs to understand what happened in the hospital.”
“The bottom line,” Dr. Pinson says, “is that we need accurate documentation that can be correctly coded to reflect the true complexity of care and severity of illness. If we do that, good things will follow.” TH
Gretchen Henkel is a freelance writer based in California.
References
- 1997 Documentation Guidelines for Evaluation and Management Services. Centers for Medicare & Medicaid Services website. Available at: www.cms.gov/MLNProducts/Downloads/MASTER1.pdf. Accessed April 11, 2011.
- State of Hospital Medicine: 2010 Report Based on 2009 Data. Society of Hospital Medicine and Medical Group Management Association; Philadelphia and Englewood, Colo.; 2010.
- ICD-9-CM Official Coding Guidelines. CMS and National Center for Health Statistics; Washington, D.C.; 2008. Available at: www.ama-assn.org/resources/doc/cpt/icd9cm_coding_guidelines_08_09_full.pdf. Accessed April 10, 2011.
Take Proactive Approach to Recovery Audit Contractors
The congressionally authorized Medicare Recovery Audit Contractor (RAC) program began with a three-year demonstration pilot project in 2005. In August 2010, the program expanded to the entire country. The RAC’s main objective is to identify improper Medicare payments, both overpayments and underpayments, to providers. CMS, which administrates Medicare and the RAC program, has agreements with contractors who are authorized to audit and review claims that are up to three years old.
According to Elizabeth Baskett, senior associate director of policy at the AHA, medical necessity review was a big focus of the RAC demonstration project and now is “under way in the permanent RAC program. We are bracing ourselves for a significant amount of denials.”
The AHA has created a free, Web-based survey called RAC Trac (www.aha.org/aha/issues/RAC/ractrac.html) to assess the nationwide impact the RAC program has on U.S. hospitals. In a report released Feb. 24, the RAC Trac survey shows that $82 million in denials were reported, more than double the dollar amount of denials reported in the third quarter of 2010 (see Figure 1, below). It also shows 57% of the more than 1,850 participating hospitals cited “medically unnecessary” as a reason for a denial of a claim.
Nearly 80% of the participating hospitals reported RAC activity in 2010, with general medical and surgical hospitals reporting the most activity. Fifty percent of reporting hospitals noted that their administrative burden—in the form of hiring consultants, copying medical records, hiring legal counsel, and the like—had increased as a result of RAC activity.
Most importantly, the report shows the average dollar value of automated denials was $399. But when a complex review—one involving a human review of requested records—was conducted, the average value of the denial was $5,281. Additionally, inpatient facilities were most likely to experience complex denials, which account for 90% of the value of denied claims.
Leong says RAC audits are just one area of “exposure to review for hospitals and providers. Other third-party payers, including individual commercial insurance companies,” she says, “also do routine post-payment review and recoupment, several years after payment.”—GH
Rural Hospitals Choose ED-HM Combination
For 10-bed Carilion Tazewell Community Hospital in Tazewell, Va. (population 44,000), mounting financial pressure recently prompted staff redeployment, equipment upgrades, and other efforts to rebuild patient volume that had been siphoned by hospitals in communities 25 or more miles away.
Central to the reorganization, says John H. Burton, MD, chair of emergency medicine for Tazewell’s seven-hospital parent company, Carilion Clinic, was to combine the ED with HM. One physician now covers both the ED, which averages about a visit an hour, and HM, reducing the number of physician FTEs employed by the hospital.
“Traditionally, we think of the emergency department doctor and the hospitalist, who are both paid by the hospital on a fixed basis, as separate roles and separate skill sets,” Dr. Burton says. In larger hospitals, ED docs generally need to be board-certified. “But doctors from family medicine and internal medicine, if trained, can practice very good emergency medicine,” Dr. Burton says. “It dawned on us we could fuse the positions. Caseload has to be manageable; this wouldn’t work in larger hospitals. But for us, it’s easily manageable by one physician doing both roles with the support of a midlevel provider.”
—John H. Burton, MD, chair of emergency medicine, Carilion Tazewell (Va.) Community Hospital
The fused service was launched in February. Long-range plans include a small onsite clinic for post-discharge follow-up, also staffed by the ED/HM physician on duty. “Our dream candidate is internal-medicine-trained and -boarded, but has also practiced in emergency medicine,” Dr. Burton says. “Hospitalists in many settings don’t have the emergency medical skill set—particularly pediatrics. What makes this approach a good fit for us is we already had physicians able to do both.”
A similar approach—combining the ED and HM on a single shift—was implemented earlier this year at Broaddus Hospital in Philippi, W.Va. (population 3,000), which has 12 acute beds and about 8,000 ED visits per year. “We don’t exactly have an abundance of family practice doctors in this area,” says hospital CEO Jeff Powelson.
In many cases, the PCPs continue to round in the hospital, but the ED/HM is able to pick up those who can’t, as well as unassigned patients. Powelson says the new structure helps PCPs who practice at multiple hospitals and can’t be everywhere at once. But if the ED/hospitalist had to cover all of the inpatients, the volume would become unsustainable for a single physician, he admits.
Six physicians are filling the new combined role (four FTEs) and rotating through 24-hour or split shifts. Powelson says communication has improved. In cases where the admitting ED physician also is the hospitalist, there is one less handoff to manage.
“We had to tweak our physician personnel a bit,” hospitalist Randy Turner, DO, says. “Some are not interested in doing this; others are very comfortable wearing both hats, maybe because they’ve done both before. We had to make sure the type of patients we care for wasn’t more than we can handle, and did we have the right personnel.”
John Nelson, MD, MHM, a hospitalist group director, practice management consultant, co-founder of SHM, and columnist for The Hospitalist, sees combined positions as “great ideas” for very small, low-volume hospitals. “[It’s] probably very good for patient care in those facilities,” he says.
Dr. Burton considers his hospitals new plan “innovative.”
“Unfortunately, working at a rural hospital that doesn’t meet federal qualifications for a critical-access hospital, we’re increasingly challenged by changes in the healthcare system,” he says. “We don’t want rural hospitals to go away. We want to serve patients in the same way, with the same level of quality, as urban hospitals. But practical problems in the healthcare system make that difficult.
“This model achieves the best of what we could hope for in this community, enabling us to pay higher rates and attract better physicians,” he says.
Larry Beresford is a freelance writer based in Oakland, Calif.
All You Need Is Love
During their residency at Beth Israel Deaconess Medical Center in Boston, hospitalist Margaret Fang, MD, MPH, FHM, and her friends often talked about who they might want to marry: someone completely outside of the medical field? A violinist, perhaps? But when she interviewed for a faculty position at the University of California at San Francisco (UCSF), she met hospitalist Bradley Sharpe, MD, SFHM, then the chief resident in the Department of Medicine.
They married in 2010 and currently work as associate professors in the Department of Medicine at UCSF Medical Center—Margaret as a clinician-investigator and Brad as a clinician-educator and administrator. “I find that [being married to a hospitalist] makes many aspects of communication easier because you have a shared language,” she says.
A common language, a partner who “gets it” if you’re on service 16 days straight, a shared passion for the hospitalist movement: These are the advantages of being married to a fellow hospitalist, say five dual hospitalist couples.
“It is wonderful having a partner who understands where I’m coming from if I do have a rough day,” says Elizabeth “Liz” Gundersen, MD, FHM, who in 2004 tied the knot with hospitalist Jasen Gundersen, MD, MBA, CPE, SFHM.
Heather Wark, MD, who is married to SHM cofounder Win Whitcomb, MD, MHM, seconds that notion. “You don’t have to start from the beginning with anything,” says Dr. Wark, who works as a hospitalist (SNFist), at Farren Care Center, a skilled nursing facility in Turners Falls, Mass. “You can just launch right into whatever the crisis of the day is, and your partner completely understands.”
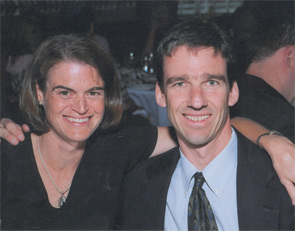
By and large, the advantages of marrying someone in the same profession outweigh the disadvantages, as a survey of female family physicians recently showed.1 But with those advantages come challenges. Among them:
- Aligning career and relationship goals;
- Juggling demanding schedules; and
- Carving out relationship and family time.
Threading through these issues requires transparent communication, flexibility, and mutual respect, according to these couples.
Career Negotiation
Liz Gundersen recently resigned her position as associate chief of the Division of Hospital Medicine at the University of Massachusetts (UMass) Medical School in Worcester, Mass. The reason? Jasen accepted a new job. As many hospitalists before them have done, the Gundersens pulled up roots and moved across the country, as Jasen started his new job as chief medical officer with TeamHealth Hospital Medicine in Fort Lauderdale, Fla.
“It was a pretty stressful job change,” Jasen says. Following the job offer from TeamHealth, the Gundersens spent “a couple of months” weighing all of their options. “My taking the job was a great promotion for me,” he says, “but Liz also had the opportunity for a great promotion at UMass. In the end, the decision came down to the fact that it was a great opportunity for me and a great opportunity for us, as a couple, to do something new. And I think we weathered it pretty well.”
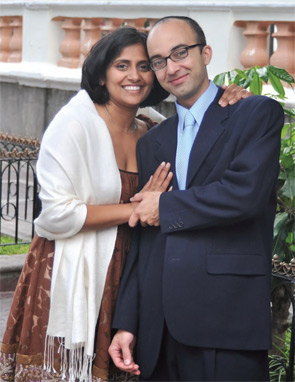
Liz, who is in the midst of securing her credentials to work in Florida, agrees. She is continuing to work with UMass long-distance, completing the physician schedule and training the new scheduler.
Dr. Whitcomb, who is medical director of healthcare quality at Baystate Medical Center in Springfield, Mass., and Dr. Wark married 15 years ago and have worked to configure their relationship to accommodate both career and family. “For most of our relationship,” she explains, “I’ve had a part-time job that has stayed steady.”
Dr. Wark’s professional flexibility allows her to function as a full-time mother to their two children, Maela, 13, and Nicholas, 10. “Although my career has been very successful, Win has been more the one who has undergone career changes and advancements,” she says. “My staying steady has allowed that space in our relationship.”
Drs. Fang and Sharpe haven’t had to cross the bridge of different job offerings yet. But Dr. Sharpe asserts that he’s a firm believer that there should be no difference in how their careers are valued. The couple has an ongoing “transparent conversation,” adds Dr. Fang, about what’s important to each of them and the relative impact of future opportunities. In addition, her job as a researcher is somewhat portable, so the chances of simultaneous job offers might increase. For now, though, they are happily committed to UCSF and love the city of San Francisco.
Madhavi Dandu, MD, MPH, assistant clinical professor and associate director of Pathways to Discovery in Global Health at UCSF, and her husband, Nima Afshar, MD, an ED/hospitalist at UCSF and at the Veterans Affairs Medical Center in San Francisco, have been lucky, she says, because “we were both drawn to medicine for similar reasons.” Together since their second year of medical school, they also both wanted, early on, to pursue careers in academic medicine. “We definitely went through some difficult times, but mostly, we were on the same page,” Dr. Dandu says.
When it came time to apply to a match program for residency, they both applied to UCSF, where they successfully completed their residencies and began their academic careers. They made a conscious decision to wait to have children until their training was finished.

Still, in the first year or so after their daughter’s birth in 2008, Dr. Dandu felt the pull between career and parenthood. “As a physician, you’re driven to make sure you’re not dropping the ball on anything, and there were many weekends that I was away from my daughter,” she says.
A supportive family helped with a flexible childcare arrangement, but this past year, Dr. Dandu decided to scale back her work schedule to 80% of regular shifts in order to spend more time with her daughter. Now, she says, “It’s pretty rare” that she will alter a commitment with her daughter for last-minute calls from work.
Shared and Diverse Interests
Even if they work in the same division, dual-hospitalist couples say they thrive when they also have independent career interests. David O. Meltzer, MD, PhD, FHM, chief of the Division of Hospital Medicine at the University of Chicago’s Department of Medicine and director of the Center for Health and the Social Sciences in Chicago, and his wife, Vineet Arora, MD, MPP, SFHM, assistant dean of Pritzker School of Medicine in Chicago and associate program director of the internal-medicine residency program, pursue independent spheres in addition to occasional collaborations as hospitalist-researchers.
They recently were on clinical service together during a blizzard. “We also co-mentor several trainees,” Dr. Arora says, “which is actually really fun. For example, I can refer trainees to David if they’re interested in economics, and if someone has a quality/safety interest, he could refer that person to me” (see “Keys to Thriving as a Dual-Hospitalist Couple,” above).
The Gundersens’ professional interests forked when Jasen found his niche in administrative work and started to pursue an MBA in 2007. Meanwhile, Liz was finding her own niche doing quality improvement (QI) and became one of the physician quality officers at UMass Memorial.
continued below...
Drs. Fang and Sharpe have experienced similar career divisions with their hospitalist roots. Dr. Sharpe is focused on medical education, while Dr. Fang’s focus predominantly is clinical research. “Between the two of us, we capture many of the elements of academic hospitalist practice,” she says. “I think having our diverse interests gives us a lot of knowledge and expertise about our respective fields. I’m able to learn a lot about how the hospital works and about clinical teaching from Brad, and, hopefully, he can come to me for research advice.”

Drs. Dandu and Afshar have branched out, too. He completed additional residency training in emergency medicine and she acquired an MPH at the University of California at Berkeley. Subsequently, she became associate director of Pathways to Discovery in Global Health, the global health elective program for medical students.
“If you follow your passion in your career, that will allow you to bring a happier individual to your relationship,” Dr. Whitcomb adds.
Schedule Time Together
Communication is a major factor when dual-hospitalist couples plan and execute their weekly schedules. “We try to have an organizing conversation at the end of each weekend,” says Dr. Wark, who also is the keeper of the family calendar and “the glue” that keeps her family of four on track.
Marriage and family therapist Catherine Hastings, PhD, who practices in Lancaster, Pa., says it’s important for dual-hospitalist couples to remember that the relationship needs attention, just as physician careers do.
“It’s very easy to talk about your job when you are in the same profession, but you can easily get consumed by that and let your personal relationships take a back seat,” Dr. Hastings explains. “Couples may look upon conversation about work as ‘brainstorming’ or problem-solving together, but that can also take over.” Hospitalist couples need to be aware that they should plan to be a couple as rigorously as they plan for their jobs, she adds.
Dr. Meltzer doesn’t think that he and his wife consciously delineate between work and personal conversation. “We certainly talk about things that don’t involve work, but we do not say, ‘We will absolutely not talk about work,’ ” he says. “That’s like saying there is not an elephant in the room.”
It didn’t bother the Gundersens that their work came home to a certain extent, says Liz. Even so, to avoid the temptation to “try and churn through all of our work over dinner,” she began scheduling meetings through Jasen’s secretary to discuss work issues.
“When we’re working, we’re doing so full-on,” Jasen says. “But then, we are definitely known for taking recovery time,” which includes skiing vacations and spending weekends on their boat in order to recharge.

Drs. Meltzer and Arora have traveled extensively together for both work and fun. On a trip last year, they traveled to China to a medical school partnered with their own to give talks. They even lengthened their stay to visit the Great Wall of China and toured Beijing and Shanghai.
Dr. Fang considers her husband the “uber-scheduler” in their relationship. “We very consciously build quality time with each other into our schedules,” she says. Without children, for the moment, they also have the free time to grab dinner spontaneously.
Parents First, Physicians Second
Time together as a couple is a scarcer commodity when a dual-hospitalist couple has children. With a pair of pre-teens who are involved in competitive swimming, Drs. Wark and Whitcomb have a two-hour block of time they need plan into their schedule three to four evenings a week.
“We’ve got a built-in babysitter called the YMCA swim team,” Dr. Wark jokes. They also run together several times a week, an activity they use to reconnect. “You have to figure out ways to grow together, to develop and have interests and activities that are specific to the relationship and not related to the kids,” Dr. Whitcomb says. “And if you don’t grow together, you’ll grow apart.”
Drs. Dandu and Afshar, who married in 2003, are just beginning to reacquaint themselves with their adult social lives, she says, now that their daughter is two and a half. “Sometimes we make time to have ‘date night,’ but sometimes it’s just us getting together with our adult friends,” she says.
With or without children, dual-hospitalist couples’ passion for their profession is intertwined with their successful marriages. “Being a physician,” Jasen Gundersen says, “is not just a vocation; it’s part of who you are.”
Dr. Dandu describes it this way: “Our life at home and our life at work are very melded.”
Like Dr. Wang, Dr. Dandu had contemplated a long-term relationship with someone who wasn’t in medicine. But being married to a physician-hospitalist, she says, “turned out to be great for me, because I have someone I can really talk to about everything.” TH
Gretchen Henkel is a freelance writer based in California.
Reference
- Schrager S, Kolan A, Dottl SL. Is that your pager or mine: a survey of women academic family physicians in dual physician families. WMJ. 2007;106 (5):251-255.
During their residency at Beth Israel Deaconess Medical Center in Boston, hospitalist Margaret Fang, MD, MPH, FHM, and her friends often talked about who they might want to marry: someone completely outside of the medical field? A violinist, perhaps? But when she interviewed for a faculty position at the University of California at San Francisco (UCSF), she met hospitalist Bradley Sharpe, MD, SFHM, then the chief resident in the Department of Medicine.
They married in 2010 and currently work as associate professors in the Department of Medicine at UCSF Medical Center—Margaret as a clinician-investigator and Brad as a clinician-educator and administrator. “I find that [being married to a hospitalist] makes many aspects of communication easier because you have a shared language,” she says.
A common language, a partner who “gets it” if you’re on service 16 days straight, a shared passion for the hospitalist movement: These are the advantages of being married to a fellow hospitalist, say five dual hospitalist couples.
“It is wonderful having a partner who understands where I’m coming from if I do have a rough day,” says Elizabeth “Liz” Gundersen, MD, FHM, who in 2004 tied the knot with hospitalist Jasen Gundersen, MD, MBA, CPE, SFHM.
Heather Wark, MD, who is married to SHM cofounder Win Whitcomb, MD, MHM, seconds that notion. “You don’t have to start from the beginning with anything,” says Dr. Wark, who works as a hospitalist (SNFist), at Farren Care Center, a skilled nursing facility in Turners Falls, Mass. “You can just launch right into whatever the crisis of the day is, and your partner completely understands.”
By and large, the advantages of marrying someone in the same profession outweigh the disadvantages, as a survey of female family physicians recently showed.1 But with those advantages come challenges. Among them:
- Aligning career and relationship goals;
- Juggling demanding schedules; and
- Carving out relationship and family time.
Threading through these issues requires transparent communication, flexibility, and mutual respect, according to these couples.
Career Negotiation
Liz Gundersen recently resigned her position as associate chief of the Division of Hospital Medicine at the University of Massachusetts (UMass) Medical School in Worcester, Mass. The reason? Jasen accepted a new job. As many hospitalists before them have done, the Gundersens pulled up roots and moved across the country, as Jasen started his new job as chief medical officer with TeamHealth Hospital Medicine in Fort Lauderdale, Fla.
“It was a pretty stressful job change,” Jasen says. Following the job offer from TeamHealth, the Gundersens spent “a couple of months” weighing all of their options. “My taking the job was a great promotion for me,” he says, “but Liz also had the opportunity for a great promotion at UMass. In the end, the decision came down to the fact that it was a great opportunity for me and a great opportunity for us, as a couple, to do something new. And I think we weathered it pretty well.”
Liz, who is in the midst of securing her credentials to work in Florida, agrees. She is continuing to work with UMass long-distance, completing the physician schedule and training the new scheduler.
Dr. Whitcomb, who is medical director of healthcare quality at Baystate Medical Center in Springfield, Mass., and Dr. Wark married 15 years ago and have worked to configure their relationship to accommodate both career and family. “For most of our relationship,” she explains, “I’ve had a part-time job that has stayed steady.”
Dr. Wark’s professional flexibility allows her to function as a full-time mother to their two children, Maela, 13, and Nicholas, 10. “Although my career has been very successful, Win has been more the one who has undergone career changes and advancements,” she says. “My staying steady has allowed that space in our relationship.”
Drs. Fang and Sharpe haven’t had to cross the bridge of different job offerings yet. But Dr. Sharpe asserts that he’s a firm believer that there should be no difference in how their careers are valued. The couple has an ongoing “transparent conversation,” adds Dr. Fang, about what’s important to each of them and the relative impact of future opportunities. In addition, her job as a researcher is somewhat portable, so the chances of simultaneous job offers might increase. For now, though, they are happily committed to UCSF and love the city of San Francisco.
Madhavi Dandu, MD, MPH, assistant clinical professor and associate director of Pathways to Discovery in Global Health at UCSF, and her husband, Nima Afshar, MD, an ED/hospitalist at UCSF and at the Veterans Affairs Medical Center in San Francisco, have been lucky, she says, because “we were both drawn to medicine for similar reasons.” Together since their second year of medical school, they also both wanted, early on, to pursue careers in academic medicine. “We definitely went through some difficult times, but mostly, we were on the same page,” Dr. Dandu says.
When it came time to apply to a match program for residency, they both applied to UCSF, where they successfully completed their residencies and began their academic careers. They made a conscious decision to wait to have children until their training was finished.
Still, in the first year or so after their daughter’s birth in 2008, Dr. Dandu felt the pull between career and parenthood. “As a physician, you’re driven to make sure you’re not dropping the ball on anything, and there were many weekends that I was away from my daughter,” she says.
A supportive family helped with a flexible childcare arrangement, but this past year, Dr. Dandu decided to scale back her work schedule to 80% of regular shifts in order to spend more time with her daughter. Now, she says, “It’s pretty rare” that she will alter a commitment with her daughter for last-minute calls from work.
Shared and Diverse Interests
Even if they work in the same division, dual-hospitalist couples say they thrive when they also have independent career interests. David O. Meltzer, MD, PhD, FHM, chief of the Division of Hospital Medicine at the University of Chicago’s Department of Medicine and director of the Center for Health and the Social Sciences in Chicago, and his wife, Vineet Arora, MD, MPP, SFHM, assistant dean of Pritzker School of Medicine in Chicago and associate program director of the internal-medicine residency program, pursue independent spheres in addition to occasional collaborations as hospitalist-researchers.
They recently were on clinical service together during a blizzard. “We also co-mentor several trainees,” Dr. Arora says, “which is actually really fun. For example, I can refer trainees to David if they’re interested in economics, and if someone has a quality/safety interest, he could refer that person to me” (see “Keys to Thriving as a Dual-Hospitalist Couple,” above).
The Gundersens’ professional interests forked when Jasen found his niche in administrative work and started to pursue an MBA in 2007. Meanwhile, Liz was finding her own niche doing quality improvement (QI) and became one of the physician quality officers at UMass Memorial.
continued below...
Drs. Fang and Sharpe have experienced similar career divisions with their hospitalist roots. Dr. Sharpe is focused on medical education, while Dr. Fang’s focus predominantly is clinical research. “Between the two of us, we capture many of the elements of academic hospitalist practice,” she says. “I think having our diverse interests gives us a lot of knowledge and expertise about our respective fields. I’m able to learn a lot about how the hospital works and about clinical teaching from Brad, and, hopefully, he can come to me for research advice.”
Drs. Dandu and Afshar have branched out, too. He completed additional residency training in emergency medicine and she acquired an MPH at the University of California at Berkeley. Subsequently, she became associate director of Pathways to Discovery in Global Health, the global health elective program for medical students.
“If you follow your passion in your career, that will allow you to bring a happier individual to your relationship,” Dr. Whitcomb adds.
Schedule Time Together
Communication is a major factor when dual-hospitalist couples plan and execute their weekly schedules. “We try to have an organizing conversation at the end of each weekend,” says Dr. Wark, who also is the keeper of the family calendar and “the glue” that keeps her family of four on track.
Marriage and family therapist Catherine Hastings, PhD, who practices in Lancaster, Pa., says it’s important for dual-hospitalist couples to remember that the relationship needs attention, just as physician careers do.
“It’s very easy to talk about your job when you are in the same profession, but you can easily get consumed by that and let your personal relationships take a back seat,” Dr. Hastings explains. “Couples may look upon conversation about work as ‘brainstorming’ or problem-solving together, but that can also take over.” Hospitalist couples need to be aware that they should plan to be a couple as rigorously as they plan for their jobs, she adds.
Dr. Meltzer doesn’t think that he and his wife consciously delineate between work and personal conversation. “We certainly talk about things that don’t involve work, but we do not say, ‘We will absolutely not talk about work,’ ” he says. “That’s like saying there is not an elephant in the room.”
It didn’t bother the Gundersens that their work came home to a certain extent, says Liz. Even so, to avoid the temptation to “try and churn through all of our work over dinner,” she began scheduling meetings through Jasen’s secretary to discuss work issues.
“When we’re working, we’re doing so full-on,” Jasen says. “But then, we are definitely known for taking recovery time,” which includes skiing vacations and spending weekends on their boat in order to recharge.
Drs. Meltzer and Arora have traveled extensively together for both work and fun. On a trip last year, they traveled to China to a medical school partnered with their own to give talks. They even lengthened their stay to visit the Great Wall of China and toured Beijing and Shanghai.
Dr. Fang considers her husband the “uber-scheduler” in their relationship. “We very consciously build quality time with each other into our schedules,” she says. Without children, for the moment, they also have the free time to grab dinner spontaneously.
Parents First, Physicians Second
Time together as a couple is a scarcer commodity when a dual-hospitalist couple has children. With a pair of pre-teens who are involved in competitive swimming, Drs. Wark and Whitcomb have a two-hour block of time they need plan into their schedule three to four evenings a week.
“We’ve got a built-in babysitter called the YMCA swim team,” Dr. Wark jokes. They also run together several times a week, an activity they use to reconnect. “You have to figure out ways to grow together, to develop and have interests and activities that are specific to the relationship and not related to the kids,” Dr. Whitcomb says. “And if you don’t grow together, you’ll grow apart.”
Drs. Dandu and Afshar, who married in 2003, are just beginning to reacquaint themselves with their adult social lives, she says, now that their daughter is two and a half. “Sometimes we make time to have ‘date night,’ but sometimes it’s just us getting together with our adult friends,” she says.
With or without children, dual-hospitalist couples’ passion for their profession is intertwined with their successful marriages. “Being a physician,” Jasen Gundersen says, “is not just a vocation; it’s part of who you are.”
Dr. Dandu describes it this way: “Our life at home and our life at work are very melded.”
Like Dr. Wang, Dr. Dandu had contemplated a long-term relationship with someone who wasn’t in medicine. But being married to a physician-hospitalist, she says, “turned out to be great for me, because I have someone I can really talk to about everything.” TH
Gretchen Henkel is a freelance writer based in California.
Reference
- Schrager S, Kolan A, Dottl SL. Is that your pager or mine: a survey of women academic family physicians in dual physician families. WMJ. 2007;106 (5):251-255.
Tablet technology benefits HM efficiency, patient satisfaction
During my training in the 1990s, my white coat pockets were stuffed with books. The Internet, in its relative infancy, was not easily accessible in the hospital and contained a tiny fraction of its current knowledge. Back then, information was only at your fingertips when it was committed to memory or in your pocket.
Now, the Internet is at every workstation in the hospital, and all orders are entered electronically. Questions about any clinical situation are answered online in a matter of seconds. As a result, I spend much of my time not with my patients but in front of a computer—entering orders, reviewing labs, writing notes, and reading and sending email.
There is tremendous interest in increasing quality of care, patient satisfaction, and improving communication between doctors, patients, and caregivers.
However, our reliance on technology encourages physicians to spend time at computers that might be better spent with the patient. It seems like we could do a better job of integrating technology into a patient-centric hospital environment.
A few years ago, our hospital installed wireless access to our internal computer network and the Internet. To provide computers to the staff on the wards, the hospital now provides two or three COWs (computers on wheels) to each ward. Unfortunately, their physical design leaves a lot to be desired. They are large and bulky, and they can be hard to move around. The physician must stand with these machines between them and the patient, and even taking a few minutes to find one can feel like a burden during a busy day.
In stark contrast, many patients bring their own laptops into the hospital. They are able to research their condition online, and can be more connected at times than the doctor who is expected to know all the answers.
Because I only have been able to access our hospital network while at a COW, nurses’ station, or my desk, I keep a “to do” list on a piece of paper. My desire to keep a short list and promptly enter orders encourages me to get to a computer as often as possible. While entering my username and password dozens of time each day or waiting in line for a workstation, I can't help but think how nice it would be to spend more time on direct patient care and less time dealing with IT logistics.
Recently, I heard about the value of the iPad in a hospital setting from one of my colleagues. Last week, I set off for my first stint on the wards with an iPad, my stethoscope, a pen, and some business cards. My white coat pockets were empty.
I carried this new lightweight computer like a clipboard. Because of its onscreen keyboard and other characteristics (lightweight, small size, lightning-quick Web browsing), I found that I was naturally sitting alongside each patient as I listened to their concerns. When we determined that a switch of medication or diet was appropriate, I made the change quickly and easily without getting up from my seat—never leaving the patient’s side. Email was available to update the patient’s PCP, social worker, or other care team member.
I spent more time with each patient than I could remember. I did not feel the pressure to hurry out of the room to enter orders as soon as possible. Although I did spend time at a computer during the visit, my patients were able to watch me modify their orders and communicate with their outpatient care team.
Much of the mystery that often surrounds the physician/patient relationship was discarded as we sat side by side. I was able to reconcile medications on the computer with the patient watching and helping make sure that no errors were made. Errors might have been prevented since I no longer had to write down the medications on a piece of paper, carry it down the hall, and enter it on to a computer. It certainly saved me time, enabled the correct list to be entered, and could have provided the patient some confidence that it was done right.
My view of the hospital bed is no longer at the foot, standing up, with weighted pockets. It’s seated, in a chair, at the bedside. I hope to soon master the art of maximizing the benefit of my time with the patient with technology more as a collaborative tool and less as an obstacle.
Melissa L.P. Mattison, MD, SFHM, FACP,
associate director of hospital medicine,
Beth Israel Deaconess Medical Center, Boston
NEW SHM MEMBERS: May 2011
Enter text here
Enter text here
Enter text here
Pediatric Palooza
As a specialty within the broader field of HM, pediatric HM (PHM) has a dedicated and active following. That devotion is apparent at its annual meeting, to be held this year July 27-31 in Kansas City, Mo. The conference is cosponsored by SHM, the American Academy of Pediatrics (AAP), the AAP Section on Hospital Medicine (SOHM), and the Academic Pediatric Association (APA).
Pediatric hospitalists can register though the “Events” section at www.hospitalmedicine.org. Fees for SHM, AAP, and APA members who register before June 30 are $650. After June 30, rates increase to $700. Discounts are available for residents.
Jack Percelay, MD, SFHM, has been to almost every PHM annual meeting since the event began in 1998. He continually is impressed with the increase in stature, quality, and community at each meeting.

“These meetings have been absolutely stupendous,” says Dr. Percelay, MD, SFHM, pediatric hospitalist at Hunterdon Medical Center in New York City. “This is our fifth consecutive year and each one has been bigger and better than the one before. Previous years have sold out early, so it’s important to register and book a hotel early. And I hear the barbecue is good in Kansas City, too.”
Whether it’s the opportunity to network with other hospitalists dedicated to caring for children, the importance of the discussions, or the smoked ribs, PHM has become a draw—not just for pediatric hospitalists, but also for high-profile speakers.
This year’s keynote speaker—Carolyn Clancy, MD, director of the Agency for Healthcare Research and Quality (AHRQ)—will be especially timely. With the continued public dialogue surrounding the role of hospitals—and hospitalists—in the Affordable Care Act (known widely as the health reform law), Dr. Clancy’s presentation will help link the day-to-day work of pediatric hospitalists to the long-term changes they can expect in their hospitals.
For Dr. Percelay, the annual meeting for pediatric hospitalists is still about the people who attend and helping each other in a growing specialty.
“We’re young enough as a field that this is a great way to make established personal connections,” he says. “You can approach people and connect a face to an email and get more involved.
“If you haven’t been to one of these before and your program is struggling with infectious-disease issues, or you don’t know what else is out there, networking helps to define the potential in terms of growing program. If you’re a growing program, it’s much easier to copy an example than to invent a program anew. We share very well, so there are opportunities at all levels.”
In addition to the people, of course, there are opportunities for educational and professional development, including two clinical tracks, a track for educators, and three separate tracks for practice management, quality, and research. The schedule also features a “potpourri” track, which will offer topics on PHM programs in community hospitals, ultrasound, and hunger, homelessness, and violence. TH
Brendon Shank is SHM’s assistant vice president of communications.
As a specialty within the broader field of HM, pediatric HM (PHM) has a dedicated and active following. That devotion is apparent at its annual meeting, to be held this year July 27-31 in Kansas City, Mo. The conference is cosponsored by SHM, the American Academy of Pediatrics (AAP), the AAP Section on Hospital Medicine (SOHM), and the Academic Pediatric Association (APA).
Pediatric hospitalists can register though the “Events” section at www.hospitalmedicine.org. Fees for SHM, AAP, and APA members who register before June 30 are $650. After June 30, rates increase to $700. Discounts are available for residents.
Jack Percelay, MD, SFHM, has been to almost every PHM annual meeting since the event began in 1998. He continually is impressed with the increase in stature, quality, and community at each meeting.
“These meetings have been absolutely stupendous,” says Dr. Percelay, MD, SFHM, pediatric hospitalist at Hunterdon Medical Center in New York City. “This is our fifth consecutive year and each one has been bigger and better than the one before. Previous years have sold out early, so it’s important to register and book a hotel early. And I hear the barbecue is good in Kansas City, too.”
Whether it’s the opportunity to network with other hospitalists dedicated to caring for children, the importance of the discussions, or the smoked ribs, PHM has become a draw—not just for pediatric hospitalists, but also for high-profile speakers.
This year’s keynote speaker—Carolyn Clancy, MD, director of the Agency for Healthcare Research and Quality (AHRQ)—will be especially timely. With the continued public dialogue surrounding the role of hospitals—and hospitalists—in the Affordable Care Act (known widely as the health reform law), Dr. Clancy’s presentation will help link the day-to-day work of pediatric hospitalists to the long-term changes they can expect in their hospitals.
For Dr. Percelay, the annual meeting for pediatric hospitalists is still about the people who attend and helping each other in a growing specialty.
“We’re young enough as a field that this is a great way to make established personal connections,” he says. “You can approach people and connect a face to an email and get more involved.
“If you haven’t been to one of these before and your program is struggling with infectious-disease issues, or you don’t know what else is out there, networking helps to define the potential in terms of growing program. If you’re a growing program, it’s much easier to copy an example than to invent a program anew. We share very well, so there are opportunities at all levels.”
In addition to the people, of course, there are opportunities for educational and professional development, including two clinical tracks, a track for educators, and three separate tracks for practice management, quality, and research. The schedule also features a “potpourri” track, which will offer topics on PHM programs in community hospitals, ultrasound, and hunger, homelessness, and violence. TH
Brendon Shank is SHM’s assistant vice president of communications.
ABIM Recognizes Hospitalists via Focused Practice Re-Certification

Congratulations are in order for the dozens of hospitalists who formally have been recognized by the American Board of Internal Medicine (ABIM) in the Recognition of Focused Practice in Hospital Medicine (FPHM) program.
“This is a monumental career step for any hospitalist and a significant move forward for the hospital medicine specialty,” says Jeff Wiese, MD, SFHM, SHM president. “We applaud all of the hospitalists who satisfied the requirements for this new program and encourage more hospitalists to begin this year’s application process now.”
Registration for the next FPHM exam ends Aug. 1. For more information, visit www.abim.org.
Among those hospitalists who have earned the Focused Practice in Hospital Medicine recognition:
- William Campbell, MD, SFHM, Pembroke Pines, Fla.
- Patrick Torcson, MD, MMM, FACP, SFHM, director of hospital medicine, St. Tammy Parish Hospital, Covington, La.
- Weston Chandler, MD, FACP, SFHM, president, CEO, Pacific Hospitalists Associates, Newport Beach, Calif.
- Natarajan Ravi, MD, Ellis Hospital Inpatient Medical Services, Schenectady, N.Y.
- Ilya Bilik, MD, director of community medicine, Beth Israel Medical Center, Brooklyn, N.Y., St. John’s Medical Center, Jackson Hole, Wy.
- Karim Godamunne, MD, MBA, FHM, medical director, Eagle Hospital Physicians, Roswell, Ga.
- Le Roi Hicks, MD, MPH, Saint Vincent Hospital, Boston
- Charles Knight, MD
- Anand Kartha, MD, VA, Boston Healthcare System, West Roxbury, Mass.
- Christine Lum Lung, MD, SFHM, medical director, Northern Colorado Hospitalists, Fort Collins
- Alokananda Bhattacharya, MD, New York Presbyterian Hospital, New York City
- Cathleen Ammann, MD, Director, Wentworth Douglas Hospital, Dover, N.H.
- Melinda Johnson, MD, associate professor, University of Iowa Hospitals & Clinics, Iowa City
- Michael Pistoria, DO, SFHM, medical director of hospitalist services, Lehigh Valley Health Network, Allentown, Pa.
- David Lauver, MD, Central Maine Inpatient Physicians, Lewistown
“This program also represents a groundbreaking partnership between SHM and ABIM,” Dr. Wiese says. “We look forward to working with ABIM to maintain public accountability for hospitalists, and to continually recognize hospitalists who choose to enhance their careers with this designation.”—BS