User login
Physician Noncompete Clauses
A hospitalist was recently offered a lucrative position in his community and was concerned that his previous employment agreement would prohibit him from accepting the new job opportunity. His former employment contract contained a noncompetition clause that made him and his prospective employer rightfully concerned. Upon a comprehensive review of his former employment contract, the noncompetition provision was not as restrictive as he and his prospective employer had previously thought. As it turned out, in his case, and in many others, the noncompetition clause was penetrable, and the physician accepted the new employment offer knowing he was not in violation of his previous contract.
What Is a Noncompetition Clause?
A noncompetition clause, also known as a covenant not to compete or a restrictive covenant, is a provision in a contract that precludes one party from engaging in competition with another party by working 1) in a particular field, 2) within a specific geographic area, and 3) for a stated period of time. A well-written noncompetition provision will prevent a physician from practicing within a certain geographical area surrounding the employer or the employer’s hospital relationships and for a prescribed period of time after the termination of the physician’s employment.
Often, the physician will be permitted to practice within the parameters of the restricted geographical area or time period if they (or the prospective employer) “buy out” of the clause. This is an especially good option when the reasonableness of the noncompetition is not black and white, and both parties want to avoid the expense of litigating the enforceability of the noncompetition clause. Otherwise, in the event the physician breaches the noncompetition clause, the former employer will usually first seek injunctive relief that prohibits the physician’s new employment, then follow with a request for monetary damages arising from the physician’s breach.
In states where noncompetition clauses for physicians are enforceable, the provision must: 1) protect the employer’s legitimate business interest, 2) be specific in geographical scope, and 3) have a narrowly tailored durational scope. Each of these factors is described below. If the language in the clause is vague or does not clearly describe the exact terms of the restrictions on practice, the clause might be unenforceable or open to greater interpretation than either party anticipated.
Do Employers Have a Legitimate Business Interest to Protect?
In order for a noncompetition clause to be enforceable, it must protect the employer’s legitimate business interest. Some examples of a legitimate business interest in the HM context are the employer’s goodwill and the retention of the employer’s clients (hospitals and medical practices). Moreover, since noncompetition clauses are not looked upon with favor by courts because they operate as a restraint of trade, the language needs to be narrowly tailored in order to protect the employer’s legitimate interests.
Is Geographical Scope Reasonable?
Noncompetition clauses must also specify the restricted geographical area where the physician is prohibited from practicing. However, whether a geographical scope is overly broad will not only depend on state law, but also the location of the employer and the surrounding community.
Typically, contracts will provide a radius in miles surrounding the employer’s location or locations as the restricted territory. But whether a geographic limitation is “reasonable” is a relative term. A five-mile radius in an urban area like New York City might be home to millions of people, whereas a five-mile radius in a suburb of New York might only be home to a few thousand people. For hospitalists, the geographic restriction might prohibit the physician from practicing at or for the employer’s clients (e.g. hospitals).
Although the following might seem obviously overly broad to some, a review of contracts with the following geographic restrictions should be considered red flags:
- Prohibition to practice anywhere in the U.S.;
- Prohibition to practice anywhere in a specific state;
- Prohibition to practice in a territory comprised of excessive miles from the employer’s location; and
- Prohibition to practice in certain counties.
Please note that exclusion to practice in certain counties might be overly broad in some situations but might be acceptable in others. For example, a hospitalist sold his ownership stake in his practice, and part of the deal required him to agree not to practice in Los Angeles County. This particular county restriction would be difficult, if not impossible, to enforce because Los Angeles County includes more than 80 cities and covers more than 4,000 square miles.
Is Durational Scope Reasonable?
A noncompetition clause should identify the length of time in which the physician is prohibited from practicing within the restricted geographic area. Whether the durational scope is reasonable will vary from state to state. As a general rule of thumb, if the restricted time frame is two years or less after termination of the contract, the time restriction will likely be considered “reasonable.” However, state laws vary on whether time restraints in excess of two years are enforceable.
A common pitfall with time restrictions is excessiveness based on the state’s laws and the specific circumstances of the physician and the employer. In negotiating the restricted length of time in a noncompetition clause, it is more common to have a longer time restriction when a physician is selling an ownership interest in a practice than for a physician entering into an employment relationship.
Prospective Employers: What You Need to Know
Great care must be taken when hiring a physician. States recognize the legal theory of interference with a contract. If an employer is recruiting a hospitalist who is subject to an employment agreement with a noncompetition clause, the prospective employer must be very careful in the recruiting process. It is recommended that the employment agreement include a representation by the physician-employee that he or she is not subject to any other agreement that would prohibit the physician from entering into the new employment relationship.
If a prospective employer is aware of an existing employment contract that contains practice restrictions on a recruited physician, the prospective employer could be held responsible for damages if a dispute arises between the parties.
It’s All in the Words
Although it might seem like semantics, a few words can change your future. Before you put pen to paper, be sure to have any contract containing a noncompetition clause reviewed by a lawyer who is well-versed in your state’s laws. If you have already signed an agreement with a noncompetition clause and you are considering your next career move, a lawyer can shed some light on a seemingly impenetrable clause.
Steven M. Harris, Esq., is a nationally recognized healthcare attorney and a member of the law firm McDonald Hopkins LLC in Chicago. Write to him at [email protected].
Interns Learn Ultrasound-Guided Procedures
Internal medicine (IM) interns at the University of Texas Health Sciences Center in San Antonio are learning how to perform ultrasound-guided procedures (e.g. thoracentesis, paracentesis, lumbar puncture), gaining confidence in procedural skills that they can then take into residency and beyond,
according to an innovation poster presented at HM12.1 The procedure service, which is a monthlong, mandatory rotation for IM interns, had its origins in funds allocated for an additional chief resident position that focused on quality and patient safety and the championing of procedures by one of the program’s directors, says David Schmit, MD, a chief resident and the abstract’s lead author.
Three chief residents, who lead the service, developed and teach its structured curriculum, which includes an instructional video, didactic presentations on indications, contraindications, risks and benefits, practice on a simulator, and instruction in obtaining appropriate consents from patients. Trainees perform each procedure under the chief residents’ supervision and complete competency checklists. Many participants complete the required five supervised procedures while still interns. “We since opened the service to second-year residents” so they can go back and master its curriculum, Dr. Schmit says.
Results in the first seven months of the service included 342 procedures performed by medical trainees, with 100% success for paracentesis and thoracentesis; slightly lower rates were seen for lumbar puncture. The rate of pneumothorax resulting from procedures declined to 4% from 12.5%, and the overall complication rate was 2.6%. Equally important, Dr. Schmit says, were 85 requests for procedures that were not performed because trainees recognized contraindications or safety considerations.
Reference
Guidelines Urge Transfer of Subarachnoid Hemorrhage Patients
The new “Guidelines for the Management of Aneurysmal Subarachnoid Hemorrhage,” published online May 3 in Stroke, call for hospitals treating fewer than 10 aneurysmal subarachnoid hemorrhage (aSAH) cases per year to consider their immediate transfer to facilities that handle at least 35 such cases annually.1 The recommendation is based on research suggesting that 30-day death rates were significantly higher in low-volume facilities (39%) vs. facilities treating more than 35 cases per year (27%), reflecting the latter’s greater access to cerebrovascular surgeons, endovascular specialists, and neuro-intensive-care services.
This type of hemorrhage accounts for 5% of all strokes and affects more than 30,000 Americans annually.
Reference
By the Numbers: 2024
The year Medicare becomes insolvent, according to the Medicare Trustees Report for 2012, released in April. The date is the same as in the prior year’s report but is eight years later than the trustees believe funds would expire without the provisions contained in the Affordable Care Act to reward efficient, quality care. The trustees, who include the secretaries of the Treasury, Labor, Health and Human Services, and Social Security departments, say Medicare is stable for now, and Medicare expenditures in 2011, at $549 billion, were lower than expected. But action is still needed to secure its long-term future.1 The report states that Medicare’s Supplementary Medical Insurance Trust Fund is financially balanced, although some critics have offered far less sanguine projections for the future of the Medicare program, based on its annual and cumulative cash shortfalls.
Reference
Transitioning Children with Complex Healthcare Needs to Home
A new clinical report from the American Academy of Pediatrics recommends ways to manage the home care and care transitions of special-needs pediatric patients.1 As many as 10 million U.S. children have special needs based on prematurity, congenital disorders, developmental needs, technology dependencies, and “medical complexity.” Although they often have prolonged hospitalizations, most will go home.
In addition to recommendations for providing home care to keep children safe at home, the report explores complexities of the transition from the hospital—how to send children home with appropriate support, the importance of connecting them with a medical home, ensuring that parents are adequately trained to provide care, and evaluating community support.
Two key issues that can be addressed while a child with complex needs is still in the hospital are involving the primary-care physician (PCP) in discharge planning and making a candid appraisal of the family’s desire and ability to provide complex care at home.
Reference
South Carolina Hospitals Reduce Mislabeled Blood
South Carolina hospitals have succeeded in reducing the incidence of mislabeled blood specimens, an error that occurs in 1 of every 1,000 blood draws in U.S. hospitals and carries potentially life-threatening consequences. The South Carolina Hospital Association has released a toolkit from the project, aimed at helping hospitals prevent specimens that are drawn at a hospitalized patient’s bedside from being labeled with another patient’s name.1 In initial pilots at Palmetto Health Richland Hospital in Columbia starting in May 2011, then expanding to five other South Carolina hospitals, mislabeling of blood specimens was reduced by 90% in less than three months.
Under the “final check,” which follows a hospital’s normal identification verification procedures, the last three digits of the medical record number from the patient’s armband are read aloud by a nurse at the bedside in front of the patient and reconciled with the last three digits on the blood specimen container. This final check was found to require only a small change in the specimen-collecting process, with no additional money or staff time required. The use of only three digits and the vocal confirmation were considered keys to success, as was emphasizing a “just” culture—providers were not punished for systemic failures.
At Regional Medical Center in Orangeburg, a final check was piloted in an ED nursing unit, according to Gary Ferguson, BSMT, MHA, director of pathology and laboratory medicine. “Several unique features of the final check immediately interested me as a laboratory director—the first being its low cost and low impact to existing procedures,” Dr. Ferguson says.
For hospitalists, an erroneous lab result can mean redundant or unnecessary testing, even mismanagement of the patient, Dr. Ferguson says. On the piloted unit, mislabeled blood samples decreased to zero from 3.5 per month over the first three months of the project. It will next be rolled out in intensive- and coronary-care units.
Larry Beresford is a freelance writer in Oakland, Calif.
Reference
Win Whitcomb: Staying ... and Paying

Take a minute to recall your last credit-card statement. On it, say, is the hotel charge from your last out-of-town CME excursion. Below the total charge you were expecting is a separate line-item charge of $75 for a “recreational fee.” Puzzled, you call the hotel. They inform you that because you used the gym and pool—accessed with your room key—they levied the fee. No signs, alerts, or postings to denote such a policy, you innocently expected inclusive use of the facilities in the price of your visit.
Capture the emotion of that moment. It is likely your heart will race and you will think to yourself, “Get me the manager!”
Out of vigilance for penalties and fraud from recovery audit contractor (RAC) investigations, as well attentiveness to unnecessary readmissions, hospitals increasingly are categorizing Medicare patients under observation, rather than inpatient, status. This is to avoid conflict with regulators. Beneficiaries are in the crosshairs because of this designation change and, much in the same way as with our hotel charge, they also experience sticker shock when they get their bills. It is leading to confusion among providers, and consternation within the Medicare recipient community.
Why is this occurring? The dilemma stems from Medicare payments and the key distinction between inpatient coverage (Part A) and outpatient coverage (Parts B and D). When a patient receives their discharge notification—without an “official” inpatient designation—sometimes staying greater than 24 to 48 hours in the ED or in a specially defined observation unit can mean that beneficiary charges are different. This could result in discrete and sometimes jolting copayments and deductibles for drugs and services.
Worse, if beneficiaries require a skilled nursing facility stay (the “three-day stay” inpatient requirement), Medicare will not pay because they never registered “official” hospital time. Patients and caregivers are not prepared for the unexpected bills, and, consequently, tempers are rising.
The rules for Medicare Advantage enrollees, who make up 25% of the program, differ from conventional Medicare. However, commercial plans often shadow traditional fee-for-service in their policies, and, consequently, no exemplar of success in this realm exits.
Hospitals have increased both the number of their observation stays, as well as their hourly lengths (>48 hours). Because the definition of “observation status” is vague, and even the one- to two-day window is inflating, hospitals and hospitalists are often left to navigate without a compass. Again, fear of fraud and penalties places hospitals—and, indirectly, hospitalists, who often make judgments on admission grade—in a precarious position.
The responsibility of hospitals to notify beneficiaries of their status hinges on this murky determination milieu, which might change in real time during the stay and makes for an unsatisfactory standard. Understandably, CMS is attempting to rectify this quandary, taking into account a hospital’s need to clarify its billing and designation practices as well as beneficiaries’ desire to obtain clear guidance on their responsibilities both during and after a stay.
Hospitalists, of course, want direction on coding and an understanding of the impact their decisions will have on patients and subspecialty colleagues. To that end, Patrick Conway, MD, SFHM, chief medical officer for the Centers for Medicare & Medicaid (CMS), offers some enlightenment on this matter:
Q: Is it tenable to keep the current system in place? However, as a fix, require payors and providers to inform beneficiaries of inpatient versus observation status at time zero in a more rigorous, yet-to-be determined manner?
A: Current regulations only require CMS to inform beneficiaries when they are admitted as an inpatient and not when they are an outpatient receiving observation services. There are important implications for coverage for beneficiaries post-hospital stay, coverage of self-administered drugs, and beneficiary coinsurance from this distinction. As a hospitalist, I think it is best to inform the patient of their status, especially if it has the potential to impact beneficiary liability, including coverage of post-acute care. CMS prepared a pamphlet in 2009, “Are You a Hospital Inpatient or Outpatient? If You Have Medicare, Ask!” to educate beneficiaries on this issue. The pamphlet can found at http://www.medicare.gov/Publications/Pubs/pdf/11435.pdf.
Q: Due to the nature of how hospital care is changing, are admission decisions potentially becoming too conflicted an endeavor for inpatient caregivers?
A: We want admission decisions to be based on clinical considerations. The decision to admit a patient should be based on the clinical judgment of the primary care, emergency medicine, and/or hospital medicine clinician.
Q: Before the U.S. healthcare system matures to a more integrated model with internalized risk, can you envision any near-term code changes that might simplify the difficulties all parties are facing, in a budget-neutral fashion?
A: CMS is currently investigating options to clarify when it is appropriate to admit the patient as an inpatient versus keeping the patient as an outpatient receiving observation services. We understand that this issue is of concern to hospitals, hospitalists, and patients, and we are considering carefully how to simplify the rules in a way that best meets the needs of patients and providers without increasing costs to the system.
I expect we will hear more from Medicare in the near-term on this matter. Stay tuned.
For more about the patient’s perspective on this issue, please see Brad’s blog: www.hospitalmedicine.org/pmblog.
Dr. Whitcomb is medical director of healthcare quality at Baystate Medical Center in Springfield, Mass. He is a co-founder and past president of SHM. Email him at [email protected].
Hospitalists Can Help Solve Residency Duty-Hour Issues
It’s been one year since the Accreditation Council for Graduate Medical Education’s (ACGME) most recent residency program regulations took effect, updating standards put into place in 2003. The regulations are the latest manifestation of an ongoing challenge in medical training: how to strike the right balance of optimal clinical training with patient safety, resident well-being, and other concerns.
Clearly the most controversial change in the latest regulations is the restriction of first-year residents to a work shift of no more than 16 hours and older residents to 24 hours, with an additional four hours to manage transitions in care (previously, 30-hour shifts were permitted for all residents). ACGME applied the 16-hour restriction after extensive discussions with members of an Institute of Medicine committee that drafted a report at the request of Congress that explored the dangers to patient care of sleep-deprived caregivers. The IOM report argued that revisions to medical residents’ workloads and duty-hours were necessary to better protect patients against fatigue-related errors and to ensure that residents get the best educational experience.1
This month, the ACGME begins its annual reviews of institutions to gauge the impact of the new regulations. While few expect the ACGME to find decisive answers regarding optimal work-hour regulations for residents, the 16-hour rule has both its opponents and supporters. On balance, HM appears to be well-positioned to benefit from the changes, having been given yet another opportunity to demonstrate value by helping their institutions weather the changes, enhance the residency training experience, and support the patient safety imperative.
Is 16 the Magic Number?
In defending the new rules last year, ACGME CEO Thomas J. Nasca, MD, acknowledged that the evidence linking long duty-hours and patient safety is mixed, while also explaining that another part of the rationale for limiting shifts for the youngest residents was to ease them into the profession. Older residents, he said, must be taught to recognize and manage the fatigue they will encounter regularly in their actual clinical practice, where hours are not regulated.
“It makes sense how ACGME has structured this—giving trainees the chance to learn in a more measured way, while recognizing that more experienced residents have more mature judgment,” says Daniel D. Dressler, MD, MSc, SFHM, FACP, hospital medicine associate division director for education, and associate program director for the J. Willis Hurst Internal Medicine Residency Program at Emory University School of Medicine in Atlanta. “I believe it’s an overall positive move, in terms of morale and work/life balance.”
Others disagree. Patient safety expert Lucian Leape, MD, adjunct professor at Harvard School of Public Health, decried that the ACGME rules did not apply to all residents, just those in their first year, and he rejected the assumption that one can learn to tolerate sleep deprivation.2 HM pioneer Bob Wachter, MD, MHM, professor, chief of the division of hospital medicine, and chief of the medical service at University of California San Francisco Medical Center, agrees the work-hour restrictions are here to stay—and are a good thing. At his blog Wachter’s World, he recently posted that research shows “prolonged wakefulness” degrades cognitive skills, and equates to a blood-alcohol level of 0.1, or “legally drunk in every state.”
“Even without strong evidence one way or the other, if it has improved safety, I think 16 hours is probably right for interns, and 24-plus-four hours for second-year residents and above. It’s the ACGME’s best guess, to date, of the right balance,” says Jeffrey G. Wiese, MD, SFHM, FACP, associate dean for graduate medical education, director of the internal medicine program at Tulane University School of Medicine in New Orleans, and former SHM president. “It’s no huge intellectual stretch to say that someone who’s been up for 32 hours is not in the best condition to make optimal patient-care decisions.”
While preserving optimal cognitive abilities is important for all physicians, ACGME’s new work-hour limits matter even more to specialties like surgery, which rely heavily on manual dexterity skills, Dr. Wiese suggests. Ironically, surgical specialty societies have been among the most critical of the new limits.
“My surgical colleagues have been particularly vocal critics of the new work-hour limit,” says Dr. Dressler, noting that Emory’s residency programs are smaller and have greater challenges in adjusting for fewer work hours as they rely more heavily on residents for certain clinical tasks than do other specialties.
Ideally, Dr. Wiese maintains, resident duty-hours should be increased gradually based on progressively demonstrated levels of ability and competence by individual residents, regardless of program year. Such milestone-based accountability is supported by SHM as well as several other medical societies.
Continuity of Care
A downside to the work-hour limit is its potential to disrupt both the continuity of care and the learning process, as fewer patients are likely to be followed by a single resident from admission to resolution of a case. Dr. Wachter, who is chair of the American Board of Internal Medicine (ABIM) and a former SHM president, acknowledges this sacrifice, noting that care teams at his hospital inherit nearly half their patients as handoffs from night admitters, and some never know handed-off patients as well as those they admitted themselves.
“In a system in which half the patients are cared for by two sets of doctors during these crucial stages [early assessment, data gathering, and initial patient response], neither group fully sees this arc play out, and their education suffers,” he wrote on his blog.
New limits means “less flexibility,” says Dr. Dressler, “and it can become a hindrance to completing the work-up of a patient—like not being able to put a central line in at 8:30 p.m. ... Some trainees feel they have less continuity with their patients because of the shorter hours.”

—Jeffrey G. Wiese, MD, SFHM, FACP, associate dean, graduate medical education, director, internal medicine program, Tulane University School of Medicine, New Orleans, former SHM president
Thoughtful management is required to minimize schedule disruption and maximize learning opportunities, he adds. “We’ve decided that our interns will have five overnight shifts over 10 days as part of one of their 30-day rotations. It’s important that interns get overnight experience before their second year,” Dr. Dressler says. “We had to incorporate three interns per team instead of two. Any way you slice it, you’re going to need additional manpower from other sources.”
Such workforce issues are hot topics in teaching hospitals across the country, Dr. Wiese says. He also warns that using hospitalists solely as “resident extenders” is not sustainable. “If an academic program is using hospitalists as stopgap labor, they do so at the risk of accelerating burnout,” he says.
Hospitalist Opportunity
Hospitalists can and should, however, take full advantage of a much-needed niche that the new ACGME regulations have called attention to: the need for expertise in minimizing patient-care disruptions resulting from more frequent patient handoffs.
“Hospitalists have an opportunity to get more involved in residency training programs by sharing their knowledge of effective patient handoff protocols,” Dr. Dressler says. “Hospitalists have treaded those waters for over a decade. We’ve learned a lot about structuring handoff information effectively, and we can inform training programs about those issues.”
The increased urgency of effective handoff management might even lead to an increased investment in HM programs, Dr. Dressler believes. “The expectation, of course, is that we are able to demonstrate effective patient handoffs—and show that we’re ‘walking the walk,’ and not just talking about it,” he says.
Christopher Guadagnino is a freelance medical writer in Philadelphia.
References
- Institute of Medicine. Resident duty hours: enhancing sleep, supervision, and safety. Institute of Medicine website. Available at: http://www.nap.edu/catalog.php?record_id=12508#toc. Accessed May 1, 2012.
- Krups C. Residency programs scramble to adopt changes. American Medical News website. Available at: http://www.ama-assn.org/amednews/2011/07/11/prsa0711.htm#s1. Accessed May 1, 2012.
It’s been one year since the Accreditation Council for Graduate Medical Education’s (ACGME) most recent residency program regulations took effect, updating standards put into place in 2003. The regulations are the latest manifestation of an ongoing challenge in medical training: how to strike the right balance of optimal clinical training with patient safety, resident well-being, and other concerns.
Clearly the most controversial change in the latest regulations is the restriction of first-year residents to a work shift of no more than 16 hours and older residents to 24 hours, with an additional four hours to manage transitions in care (previously, 30-hour shifts were permitted for all residents). ACGME applied the 16-hour restriction after extensive discussions with members of an Institute of Medicine committee that drafted a report at the request of Congress that explored the dangers to patient care of sleep-deprived caregivers. The IOM report argued that revisions to medical residents’ workloads and duty-hours were necessary to better protect patients against fatigue-related errors and to ensure that residents get the best educational experience.1
This month, the ACGME begins its annual reviews of institutions to gauge the impact of the new regulations. While few expect the ACGME to find decisive answers regarding optimal work-hour regulations for residents, the 16-hour rule has both its opponents and supporters. On balance, HM appears to be well-positioned to benefit from the changes, having been given yet another opportunity to demonstrate value by helping their institutions weather the changes, enhance the residency training experience, and support the patient safety imperative.
Is 16 the Magic Number?
In defending the new rules last year, ACGME CEO Thomas J. Nasca, MD, acknowledged that the evidence linking long duty-hours and patient safety is mixed, while also explaining that another part of the rationale for limiting shifts for the youngest residents was to ease them into the profession. Older residents, he said, must be taught to recognize and manage the fatigue they will encounter regularly in their actual clinical practice, where hours are not regulated.
“It makes sense how ACGME has structured this—giving trainees the chance to learn in a more measured way, while recognizing that more experienced residents have more mature judgment,” says Daniel D. Dressler, MD, MSc, SFHM, FACP, hospital medicine associate division director for education, and associate program director for the J. Willis Hurst Internal Medicine Residency Program at Emory University School of Medicine in Atlanta. “I believe it’s an overall positive move, in terms of morale and work/life balance.”
Others disagree. Patient safety expert Lucian Leape, MD, adjunct professor at Harvard School of Public Health, decried that the ACGME rules did not apply to all residents, just those in their first year, and he rejected the assumption that one can learn to tolerate sleep deprivation.2 HM pioneer Bob Wachter, MD, MHM, professor, chief of the division of hospital medicine, and chief of the medical service at University of California San Francisco Medical Center, agrees the work-hour restrictions are here to stay—and are a good thing. At his blog Wachter’s World, he recently posted that research shows “prolonged wakefulness” degrades cognitive skills, and equates to a blood-alcohol level of 0.1, or “legally drunk in every state.”
“Even without strong evidence one way or the other, if it has improved safety, I think 16 hours is probably right for interns, and 24-plus-four hours for second-year residents and above. It’s the ACGME’s best guess, to date, of the right balance,” says Jeffrey G. Wiese, MD, SFHM, FACP, associate dean for graduate medical education, director of the internal medicine program at Tulane University School of Medicine in New Orleans, and former SHM president. “It’s no huge intellectual stretch to say that someone who’s been up for 32 hours is not in the best condition to make optimal patient-care decisions.”
While preserving optimal cognitive abilities is important for all physicians, ACGME’s new work-hour limits matter even more to specialties like surgery, which rely heavily on manual dexterity skills, Dr. Wiese suggests. Ironically, surgical specialty societies have been among the most critical of the new limits.
“My surgical colleagues have been particularly vocal critics of the new work-hour limit,” says Dr. Dressler, noting that Emory’s residency programs are smaller and have greater challenges in adjusting for fewer work hours as they rely more heavily on residents for certain clinical tasks than do other specialties.
Ideally, Dr. Wiese maintains, resident duty-hours should be increased gradually based on progressively demonstrated levels of ability and competence by individual residents, regardless of program year. Such milestone-based accountability is supported by SHM as well as several other medical societies.
Continuity of Care
A downside to the work-hour limit is its potential to disrupt both the continuity of care and the learning process, as fewer patients are likely to be followed by a single resident from admission to resolution of a case. Dr. Wachter, who is chair of the American Board of Internal Medicine (ABIM) and a former SHM president, acknowledges this sacrifice, noting that care teams at his hospital inherit nearly half their patients as handoffs from night admitters, and some never know handed-off patients as well as those they admitted themselves.
“In a system in which half the patients are cared for by two sets of doctors during these crucial stages [early assessment, data gathering, and initial patient response], neither group fully sees this arc play out, and their education suffers,” he wrote on his blog.
New limits means “less flexibility,” says Dr. Dressler, “and it can become a hindrance to completing the work-up of a patient—like not being able to put a central line in at 8:30 p.m. ... Some trainees feel they have less continuity with their patients because of the shorter hours.”
—Jeffrey G. Wiese, MD, SFHM, FACP, associate dean, graduate medical education, director, internal medicine program, Tulane University School of Medicine, New Orleans, former SHM president
Thoughtful management is required to minimize schedule disruption and maximize learning opportunities, he adds. “We’ve decided that our interns will have five overnight shifts over 10 days as part of one of their 30-day rotations. It’s important that interns get overnight experience before their second year,” Dr. Dressler says. “We had to incorporate three interns per team instead of two. Any way you slice it, you’re going to need additional manpower from other sources.”
Such workforce issues are hot topics in teaching hospitals across the country, Dr. Wiese says. He also warns that using hospitalists solely as “resident extenders” is not sustainable. “If an academic program is using hospitalists as stopgap labor, they do so at the risk of accelerating burnout,” he says.
Hospitalist Opportunity
Hospitalists can and should, however, take full advantage of a much-needed niche that the new ACGME regulations have called attention to: the need for expertise in minimizing patient-care disruptions resulting from more frequent patient handoffs.
“Hospitalists have an opportunity to get more involved in residency training programs by sharing their knowledge of effective patient handoff protocols,” Dr. Dressler says. “Hospitalists have treaded those waters for over a decade. We’ve learned a lot about structuring handoff information effectively, and we can inform training programs about those issues.”
The increased urgency of effective handoff management might even lead to an increased investment in HM programs, Dr. Dressler believes. “The expectation, of course, is that we are able to demonstrate effective patient handoffs—and show that we’re ‘walking the walk,’ and not just talking about it,” he says.
Christopher Guadagnino is a freelance medical writer in Philadelphia.
References
- Institute of Medicine. Resident duty hours: enhancing sleep, supervision, and safety. Institute of Medicine website. Available at: http://www.nap.edu/catalog.php?record_id=12508#toc. Accessed May 1, 2012.
- Krups C. Residency programs scramble to adopt changes. American Medical News website. Available at: http://www.ama-assn.org/amednews/2011/07/11/prsa0711.htm#s1. Accessed May 1, 2012.
Unit-Based Rounding: A Holy Grail?
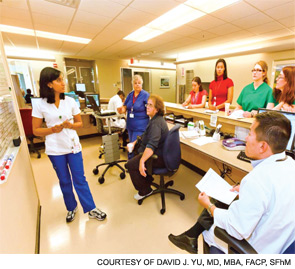
The adult inpatient medicine service at Presbyterian Medical Group (PMG) in Albuquerque, N.M, has been utilizing a unit-based care model (UBCM) with multidisciplinary rounding for the past two years. Due to the positive results, what initially started on two medicine floors telemetry and non-telemetry quickly spread to all of the medicine floors. With implementation of Unit Base 4 in April, all of the medicine beds at Presbyterian will be run using a UBCM.
Set within an inner-city hospital, the medicine service is one of the largest single-site HM programs in the country. The group has 46 FTE requirements and performed more than 15,000 admissions and consults in 2011.
Background
In early 2010, however, the HM service was in crisis. Daily starting census on a typical rounding team was 18 to 20 patients per day, and the average length of stay (LOS) for the group was close to five days. Morale among the hospitalists was low, mainly due to the patient load and multiple throughput issues. Simply stated, the program was at a tipping point.
It was at this time that a Lean Six Sigma Project was initiated to examine the throughput issues. This project expanded rapidly, with input from physicians, nurses, care coordinators, and ancillary staff, and eventually morphed into the UBCM.
The original UBCM premise was to have four geographically isolated hospitalists staff a telemetry floor, and four unit-based hospitalists staff a non-telemetry floor. The isolation guaranteed a lower starting average census for the rounding hospitalists. Each hospitalist on the UBCM would be assigned one specific care coordinator. The multidisciplinary round then occurred at the whiteboard with the hospitalists, nurses, care coordinators, and ancillary staff. The whiteboard had the floor’s census and pertinent care coordination information. The UBCM utilized several tools: visual management (white board), dedicated workspace for the hospitalist team members, standardization of work for team members, and self-regulating governance.
UBCM does not focus specifically on standardization of management of specific disease processes but on standardization of communication and interaction between various team members. For example, at multidisciplinary rounds, the charge nurses and care coordinators ask specific questions regarding estimated discharge date, level of care issues (i.e. observation vs. admission), downgrade to telemetry, and discharge issues. The new practice model had these original goals:
- Reduce average LOS, thereby increasing patient encounters through backfill;
- Improve patient satisfaction; and
- Improve financial outcomes.
The Financial Case for UBCM
The UBCM team worked closely with the finance department to create a business model with a net present value proposal for each unit-base rollout. This included the cost of hiring an additional FTE for each UBCM, but it meant each UBCM rounding team had a lower starting census.
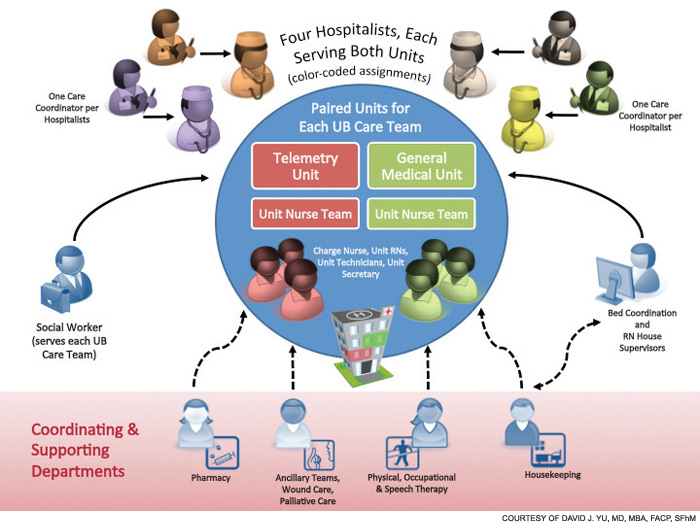
The results have been very exciting.
The average LOS dropped to 4.6 days from 5.06 days in 2011; in 2012, the group’s LOS is at 4.40 days. By lowering average LOS with available backfill population, the group was able to increase patient discharges 15% (to 14,411 in 2011 from 12,503 in 2010).
The financial modeling for Unit Base 1 was based on the addition of PMG’s inpatient medicine service to the contribution margin by increasing patient encounters; the model for Unit Base 2 was based on savings through variable expenditures by decreasing average LOS. After 21 months, Unit Base 1 added $2.2 million to the contribution margin; after 15 months, Unit Base 2 lowered variable expenditure of $1.3 million.
The significant drop in average LOS has allowed the hospital to close a nine-bed temporary holding floor, which was created in 2009 to relieve ED congestion. This was a realized savings of $800,000 of a fixed cost.
Other Key Measures
Patient satisfaction scores have been encouraging; however, the group is realizing that the same hospitalists are scoring lower on the medicine floor with the older physical plant than on the floor with the newer physical plant. The percentage of downgrades from telemetry to non-telemetry significantly improved.
Additionally, there was initially skepticism among the hospitalists and the nursing staff. The biggest concern was that multidisciplinary rounding could not be successfully implemented on a busy medicine or telemetry floor during one of the busiest times of the day, at 9 a.m. However, team members quickly discovered that multidisciplinary rounds were an efficient way of communicating and prioritizing their time and resources. They also quickly realized the benefit to their daily workflow, and now leverage this tool to increase efficiency.
Having hospitalists geographically isolated and creating an environment that encourages communication has changed the culture of the inpatient workplace. The relationship between the hospitalists, nurses, ancillary staff, and care coordinators has improved significantly.

Try It for Yourself
Having practiced traditional internal medicine for nine years prior to becoming a hospitalist, I realize that many hospitalists are still rounding based on traditional models. But with such a system, ask yourself:
- Does a busy hospitalist always communicate the plan of care with the nurse?
- Does a hospitalist communicate with the care coordinator or physical therapist for each patient?
- Does a hospitalist leverage the fact that he or she is hospital-based to the maximum efficiency?
The answer in the vast majority of HM groups is “no.” With a UBCM approach, the efficiencies, the quality, and the communication improvements are baked into the process. We did not admonish our staff to perform “quality,” nor did we “improve communication.” We feel that we have found the holy grail of hospital medicine. The UBCM approach solves many of our problems, allows us to hire more hospitalists, and benefits our hospital’s bottom line.
Dr. Yu is medical director of the adult inpatient medicine service at Presbyterian Medical Group, Albuquerque, N.M. He is a former member of Team Hospitalist.
The adult inpatient medicine service at Presbyterian Medical Group (PMG) in Albuquerque, N.M, has been utilizing a unit-based care model (UBCM) with multidisciplinary rounding for the past two years. Due to the positive results, what initially started on two medicine floors telemetry and non-telemetry quickly spread to all of the medicine floors. With implementation of Unit Base 4 in April, all of the medicine beds at Presbyterian will be run using a UBCM.
Set within an inner-city hospital, the medicine service is one of the largest single-site HM programs in the country. The group has 46 FTE requirements and performed more than 15,000 admissions and consults in 2011.
Background
In early 2010, however, the HM service was in crisis. Daily starting census on a typical rounding team was 18 to 20 patients per day, and the average length of stay (LOS) for the group was close to five days. Morale among the hospitalists was low, mainly due to the patient load and multiple throughput issues. Simply stated, the program was at a tipping point.
It was at this time that a Lean Six Sigma Project was initiated to examine the throughput issues. This project expanded rapidly, with input from physicians, nurses, care coordinators, and ancillary staff, and eventually morphed into the UBCM.
The original UBCM premise was to have four geographically isolated hospitalists staff a telemetry floor, and four unit-based hospitalists staff a non-telemetry floor. The isolation guaranteed a lower starting average census for the rounding hospitalists. Each hospitalist on the UBCM would be assigned one specific care coordinator. The multidisciplinary round then occurred at the whiteboard with the hospitalists, nurses, care coordinators, and ancillary staff. The whiteboard had the floor’s census and pertinent care coordination information. The UBCM utilized several tools: visual management (white board), dedicated workspace for the hospitalist team members, standardization of work for team members, and self-regulating governance.
UBCM does not focus specifically on standardization of management of specific disease processes but on standardization of communication and interaction between various team members. For example, at multidisciplinary rounds, the charge nurses and care coordinators ask specific questions regarding estimated discharge date, level of care issues (i.e. observation vs. admission), downgrade to telemetry, and discharge issues. The new practice model had these original goals:
- Reduce average LOS, thereby increasing patient encounters through backfill;
- Improve patient satisfaction; and
- Improve financial outcomes.
The Financial Case for UBCM
The UBCM team worked closely with the finance department to create a business model with a net present value proposal for each unit-base rollout. This included the cost of hiring an additional FTE for each UBCM, but it meant each UBCM rounding team had a lower starting census.
The results have been very exciting.
The average LOS dropped to 4.6 days from 5.06 days in 2011; in 2012, the group’s LOS is at 4.40 days. By lowering average LOS with available backfill population, the group was able to increase patient discharges 15% (to 14,411 in 2011 from 12,503 in 2010).
The financial modeling for Unit Base 1 was based on the addition of PMG’s inpatient medicine service to the contribution margin by increasing patient encounters; the model for Unit Base 2 was based on savings through variable expenditures by decreasing average LOS. After 21 months, Unit Base 1 added $2.2 million to the contribution margin; after 15 months, Unit Base 2 lowered variable expenditure of $1.3 million.
The significant drop in average LOS has allowed the hospital to close a nine-bed temporary holding floor, which was created in 2009 to relieve ED congestion. This was a realized savings of $800,000 of a fixed cost.
Other Key Measures
Patient satisfaction scores have been encouraging; however, the group is realizing that the same hospitalists are scoring lower on the medicine floor with the older physical plant than on the floor with the newer physical plant. The percentage of downgrades from telemetry to non-telemetry significantly improved.
Additionally, there was initially skepticism among the hospitalists and the nursing staff. The biggest concern was that multidisciplinary rounding could not be successfully implemented on a busy medicine or telemetry floor during one of the busiest times of the day, at 9 a.m. However, team members quickly discovered that multidisciplinary rounds were an efficient way of communicating and prioritizing their time and resources. They also quickly realized the benefit to their daily workflow, and now leverage this tool to increase efficiency.
Having hospitalists geographically isolated and creating an environment that encourages communication has changed the culture of the inpatient workplace. The relationship between the hospitalists, nurses, ancillary staff, and care coordinators has improved significantly.
Try It for Yourself
Having practiced traditional internal medicine for nine years prior to becoming a hospitalist, I realize that many hospitalists are still rounding based on traditional models. But with such a system, ask yourself:
- Does a busy hospitalist always communicate the plan of care with the nurse?
- Does a hospitalist communicate with the care coordinator or physical therapist for each patient?
- Does a hospitalist leverage the fact that he or she is hospital-based to the maximum efficiency?
The answer in the vast majority of HM groups is “no.” With a UBCM approach, the efficiencies, the quality, and the communication improvements are baked into the process. We did not admonish our staff to perform “quality,” nor did we “improve communication.” We feel that we have found the holy grail of hospital medicine. The UBCM approach solves many of our problems, allows us to hire more hospitalists, and benefits our hospital’s bottom line.
Dr. Yu is medical director of the adult inpatient medicine service at Presbyterian Medical Group, Albuquerque, N.M. He is a former member of Team Hospitalist.
How to Be Accountable in Hospital Medicine

In my last column, I outlined the “accountability imperative” facing the specialty of hospital medicine, and I discussed the need to hold ourselves accountable for delivering true, high-value healthcare. However, this is easier said than done; being accountable in the complex environments in which we work is difficult. The key to simplifying accountability rests in deconstructing the concept in a manner that allows us to consistently appeal to its fundamental tenets, so that applying these tenets in our everyday lives is easy. Understanding accountability begins with defining the term.
Accountability Defined
To be truly accountable, one must first appreciate what accountability is, and what it is not. This is beautifully articulated in a well-written book by Connors, Smith, and Hickman titled “The Oz Principle: Getting Results Through Individual and Organizational Accountability.”1 Connors and colleagues advise that we must conceive of accountability as forward-looking versus backward-looking judgment. All too often, society thinks of accountability as a historical or retrospective concept, that accountability is something to invoke when an individual has failed to meet expectations. Defining accountability in this manner casts the concept in a negative light by invoking fear and anxiety; accountability becomes synonymous with punishment, retribution, blame, humiliation, and scrutiny.
“The Oz Principle” suggests that “accountability is more than a confession,” and warns that people who narrowly define accountability in this manner become “obsessed with the past, and blissfully ignorant of the future.” This is sage advice for the profession of medicine. All too often, clinicians and healthcare professionals yearn for a past era in which it was supposedly easier to practice medicine because of independence from rules, regulations, protocols, pathways, performance measurement, and performance reporting. In lamenting the loss of a past era, people risk ignoring the present and thus fail to embrace healthcare reform initiatives that will soon establish new expectations. These new expectations must be met to ensure future success.
It behooves us─hospitalists─to define accountability in a more constructive and future-oriented manner. To this end, Connors and colleagues propose that accountability be conceived of as “a personal choice to rise above one’s circumstances and demonstrate ownership necessary for achieving results.” Such a definition empowers us to anticipate the future by acting proactively to avoid problems, rather than reactively, which forces us to explain why problems occurred. In so doing, we embrace our current situation, actively seek to understand new initiatives compelling us to alter our behavior, recognize the dangers in maintaining outdated status quos, and become actively engaged participants in obligatory change initiatives.
If this is our perspective, genuine, patient-centered care will become the norm, and we will avoid the temptation to dismiss problems as beyond the scope of our responsibility or control. If rising above our circumstances is the motivation, we will not blame poor patient satisfaction survey results on bad hospital food, avoidable hospital readmissions on unavailable post-discharge follow-up appointments, and unnecessary testing on the risk of malpractice litigation.
Furthermore, we must appreciate that our spheres of responsibility overlap those of others in healthcare. As such, success in meeting our expectations directly influences the ability of others to successfully meet theirs, which directly affects our collective ability to achieve healthcare improvement goals. For example, if hospitalists do not effectively communicate patient-care-plan information to nurses, nurses will not be best prepared to respond to patient questions, and patients will potentially be dissatisfied with their hospital experience. In such circumstances, it would be unfair for the hospitalist to blame poor patient satisfaction scores on nursing, because patient dissatisfaction could have been avoided had the hospitalist been accountable for sufficient communication of care-planning information.
Examples such as this turn the spotlight on healthcare professionals. We are jointly accountable for the delivery of high-value healthcare, and are interdependent on each other in this regard. According to “The Oz Principle,” “when people view their accountability for results as something larger than doing their own jobs, they find themselves feeling accountable for things beyond what a literal interpretation of their job description may suggest.”
Don’t Be a Victim
The key to maintaining a future-oriented and proactive view of accountability (pushing us to consistently rise above our circumstances) is to not fall trap to becoming a victim. Connors and colleagues caution that when confronted with poor results and suboptimal performance, there is a natural temptation to make excuses, point fingers at others, create arguments for why we are not to blame, and otherwise rationalize why we are not accountable. Unfortunately, this attitude only perpetuates the myopically negative view of accountability “as a confession,” to be invoked to scrutinize, blame, or punish. A victimization mentality leads to the creation of cultures in which “saving face” is more important than solving problems, and, according to “The Oz Principle,” “quick fixes are favored over long-term solutions, immediate gains are favored over enduring progress, and process is favored over results.”
The danger of favoring process over results seems particularly germane to healthcare quality improvement (QI). In the complex, fast-moving, and pressurized environment of the hospital, it is easy to become satisfied with creating and deploying processes to address such issues as glycemic control, VTE prevention, or safe transitions of care. These processes are surely necessary, but they are certainly not sufficient.
Results are what we are aiming to achieve—not processes. In order to achieve results, the process must be actively managed, and the participants engaged in the processes must hold themselves─and each other─accountable for achieving the results that the processes are designed to effect.
Connors and colleagues write that “accountability for results rests at the very core of continuous improvement....The essence of these programs boils down to getting people to rise above their circumstances to do whatever it takes to get the results they want.” In order for HM to rise above current healthcare circumstances, we must never play the victim role. Blaming others will only keep us mired in current dysfunctional situations, preventing us from breaking free of untenable status quos that prohibit the delivery of high-quality and cost-effective patient care.
Conclusion
Accountability is difficult, especially for hospitalists. The time, though, is now for each of us to embrace accountability, because we will be expected to perform at increasingly higher levels of sophistication in the future. The first step to embracing accountability is to understand the concept, and in my next column, I will further describe concepts that demystify accountability by making it easier to apply in our everyday experiences.
Dr. Frost is president of SHM.
Reference
In my last column, I outlined the “accountability imperative” facing the specialty of hospital medicine, and I discussed the need to hold ourselves accountable for delivering true, high-value healthcare. However, this is easier said than done; being accountable in the complex environments in which we work is difficult. The key to simplifying accountability rests in deconstructing the concept in a manner that allows us to consistently appeal to its fundamental tenets, so that applying these tenets in our everyday lives is easy. Understanding accountability begins with defining the term.
Accountability Defined
To be truly accountable, one must first appreciate what accountability is, and what it is not. This is beautifully articulated in a well-written book by Connors, Smith, and Hickman titled “The Oz Principle: Getting Results Through Individual and Organizational Accountability.”1 Connors and colleagues advise that we must conceive of accountability as forward-looking versus backward-looking judgment. All too often, society thinks of accountability as a historical or retrospective concept, that accountability is something to invoke when an individual has failed to meet expectations. Defining accountability in this manner casts the concept in a negative light by invoking fear and anxiety; accountability becomes synonymous with punishment, retribution, blame, humiliation, and scrutiny.
“The Oz Principle” suggests that “accountability is more than a confession,” and warns that people who narrowly define accountability in this manner become “obsessed with the past, and blissfully ignorant of the future.” This is sage advice for the profession of medicine. All too often, clinicians and healthcare professionals yearn for a past era in which it was supposedly easier to practice medicine because of independence from rules, regulations, protocols, pathways, performance measurement, and performance reporting. In lamenting the loss of a past era, people risk ignoring the present and thus fail to embrace healthcare reform initiatives that will soon establish new expectations. These new expectations must be met to ensure future success.
It behooves us─hospitalists─to define accountability in a more constructive and future-oriented manner. To this end, Connors and colleagues propose that accountability be conceived of as “a personal choice to rise above one’s circumstances and demonstrate ownership necessary for achieving results.” Such a definition empowers us to anticipate the future by acting proactively to avoid problems, rather than reactively, which forces us to explain why problems occurred. In so doing, we embrace our current situation, actively seek to understand new initiatives compelling us to alter our behavior, recognize the dangers in maintaining outdated status quos, and become actively engaged participants in obligatory change initiatives.
If this is our perspective, genuine, patient-centered care will become the norm, and we will avoid the temptation to dismiss problems as beyond the scope of our responsibility or control. If rising above our circumstances is the motivation, we will not blame poor patient satisfaction survey results on bad hospital food, avoidable hospital readmissions on unavailable post-discharge follow-up appointments, and unnecessary testing on the risk of malpractice litigation.
Furthermore, we must appreciate that our spheres of responsibility overlap those of others in healthcare. As such, success in meeting our expectations directly influences the ability of others to successfully meet theirs, which directly affects our collective ability to achieve healthcare improvement goals. For example, if hospitalists do not effectively communicate patient-care-plan information to nurses, nurses will not be best prepared to respond to patient questions, and patients will potentially be dissatisfied with their hospital experience. In such circumstances, it would be unfair for the hospitalist to blame poor patient satisfaction scores on nursing, because patient dissatisfaction could have been avoided had the hospitalist been accountable for sufficient communication of care-planning information.
Examples such as this turn the spotlight on healthcare professionals. We are jointly accountable for the delivery of high-value healthcare, and are interdependent on each other in this regard. According to “The Oz Principle,” “when people view their accountability for results as something larger than doing their own jobs, they find themselves feeling accountable for things beyond what a literal interpretation of their job description may suggest.”
Don’t Be a Victim
The key to maintaining a future-oriented and proactive view of accountability (pushing us to consistently rise above our circumstances) is to not fall trap to becoming a victim. Connors and colleagues caution that when confronted with poor results and suboptimal performance, there is a natural temptation to make excuses, point fingers at others, create arguments for why we are not to blame, and otherwise rationalize why we are not accountable. Unfortunately, this attitude only perpetuates the myopically negative view of accountability “as a confession,” to be invoked to scrutinize, blame, or punish. A victimization mentality leads to the creation of cultures in which “saving face” is more important than solving problems, and, according to “The Oz Principle,” “quick fixes are favored over long-term solutions, immediate gains are favored over enduring progress, and process is favored over results.”
The danger of favoring process over results seems particularly germane to healthcare quality improvement (QI). In the complex, fast-moving, and pressurized environment of the hospital, it is easy to become satisfied with creating and deploying processes to address such issues as glycemic control, VTE prevention, or safe transitions of care. These processes are surely necessary, but they are certainly not sufficient.
Results are what we are aiming to achieve—not processes. In order to achieve results, the process must be actively managed, and the participants engaged in the processes must hold themselves─and each other─accountable for achieving the results that the processes are designed to effect.
Connors and colleagues write that “accountability for results rests at the very core of continuous improvement....The essence of these programs boils down to getting people to rise above their circumstances to do whatever it takes to get the results they want.” In order for HM to rise above current healthcare circumstances, we must never play the victim role. Blaming others will only keep us mired in current dysfunctional situations, preventing us from breaking free of untenable status quos that prohibit the delivery of high-quality and cost-effective patient care.
Conclusion
Accountability is difficult, especially for hospitalists. The time, though, is now for each of us to embrace accountability, because we will be expected to perform at increasingly higher levels of sophistication in the future. The first step to embracing accountability is to understand the concept, and in my next column, I will further describe concepts that demystify accountability by making it easier to apply in our everyday experiences.
Dr. Frost is president of SHM.