User login
Increased Ordering of Diagnostic Tests Associated with Longer Lengths of Stay in Pediatric Pneumonia

Clinical question: What is the relationship between variation in resource utilization and outcomes in children with community-acquired pneumonia (CAP)?
Background: Variation in clinical care, particularly when driven by provider preferences, often highlights opportunities for improvement in the quality of our care. CAP is one of the most common reasons for hospitalization in children. The relationship between variation in care processes, utilization, and outcomes in pediatric CAP is not well defined.
Study design: Retrospective database review.
Setting: Twenty-nine freestanding children's hospitals.
Synopsis: The Pediatric Health Information System (PHIS) database was used to review utilization and outcomes data on 43,819 children admitted with nonsevere CAP during a five-year period. Substantial degrees of variation in test ordering, empiric antibiotic selection, length of stay (LOS), and 14-day readmissions were found. An association was noted between increased resource utilization—specifically, ordering of diagnostic tests—and longer LOS.
The association between increased resource utilization and LOS has been suggested in other work in respiratory illness in children. Although the retrospective nature of this work precludes detailed resolution of whether confounding by severity was an issue, this appears unlikely based on the relatively homogeneous patient populations and hospital types. Additional limitations of this work exist, and include an inability to further assess the appropriateness of the testing that was ordered—as well as relatively crude rankings of hospitals based on resource utilization. Nevertheless, in an era where a premium is placed on finding value in clinical medicine, these results should prompt further exploration of the link between testing and LOS in children hospitalized with CAP.
Bottom line: Unnecessary testing in children hospitalized with pneumonia may lead to longer LOS.
Citation: Brogan TV, Hall M, Williams DJ, et al. Variability in processes of care and outcomes among children hospitalized with community-acquired pneumonia. Ped Infect Dis J. 2012;31:1036-1041.
Reviewed by Pediatric Editor Mark Shen, MD, SFHM, medical director of hospital medicine at Dell Children's Medical Center, Austin, Texas.
How Hospitalists Can Improve the Care of Patients on Opioids
Pain is one of the chief complaints that results in patient admissions to the hospital. Hospitalists inevitably confront pain issues every day, says Joe A. Contreras, MD, FAAHPM, chair of the Pain and Palliative Medicine Institute at Hackensack University Medical Center in Hackensack, N.J. As a result, “it is expected that all physicians who take care of sick people have some baseline knowledge of opioids use,” Dr. Contreras says.
There is a preference on the public’s part and, consequently, from the physician’s perspective to treat pain with opioids, even though minor cases can be controlled without pharmacologic interventions, Dr. Contreras says. Patients might receive some relief from repositioning, hot or cold packs, extra pillows, Reiki therapy, and other soothing modalities. Additionally, hospitals can benefit from having a pain champion on staff to safely manage various situations.

A hospitalist should still obtain important and relevant information when a patient is admitted. This includes the pain medicine the patient is taking and how often, who prescribed it, whether it helps, and if the patient has experienced side effects.
“As the primary-care physician in the hospital,” Dr. Liao says, “the hospitalist is ultimately responsible.”
Special attention is needed during care transitions.
“This is when patients are most vulnerable,” says Beth B. Murinson, MS, MD, PhD, associate professor and director of pain education in the department of neurology at Johns Hopkins University School of Medicine in Baltimore.
These situations occur during transfers from the ED or recovery room to an inpatient unit, and from hospital to home or skilled nursing facility. Patients being discharged must be thoroughly informed about their opioid pain relievers, Dr. Murinson says, with instructions to store them in a secure place. TH
Susan Kreimer is a freelance writer in New York City.
Pain is one of the chief complaints that results in patient admissions to the hospital. Hospitalists inevitably confront pain issues every day, says Joe A. Contreras, MD, FAAHPM, chair of the Pain and Palliative Medicine Institute at Hackensack University Medical Center in Hackensack, N.J. As a result, “it is expected that all physicians who take care of sick people have some baseline knowledge of opioids use,” Dr. Contreras says.
There is a preference on the public’s part and, consequently, from the physician’s perspective to treat pain with opioids, even though minor cases can be controlled without pharmacologic interventions, Dr. Contreras says. Patients might receive some relief from repositioning, hot or cold packs, extra pillows, Reiki therapy, and other soothing modalities. Additionally, hospitals can benefit from having a pain champion on staff to safely manage various situations.
A hospitalist should still obtain important and relevant information when a patient is admitted. This includes the pain medicine the patient is taking and how often, who prescribed it, whether it helps, and if the patient has experienced side effects.
“As the primary-care physician in the hospital,” Dr. Liao says, “the hospitalist is ultimately responsible.”
Special attention is needed during care transitions.
“This is when patients are most vulnerable,” says Beth B. Murinson, MS, MD, PhD, associate professor and director of pain education in the department of neurology at Johns Hopkins University School of Medicine in Baltimore.
These situations occur during transfers from the ED or recovery room to an inpatient unit, and from hospital to home or skilled nursing facility. Patients being discharged must be thoroughly informed about their opioid pain relievers, Dr. Murinson says, with instructions to store them in a secure place. TH
Susan Kreimer is a freelance writer in New York City.
What Is the Best Treatment for an Adult Patient with Staphylococcus aureus Bacteremia?
Case
An 82-year-old man with non-Hodgkin’s lymphoma in remission and a history of congestive heart failure and hypertension presents with one week of generalized malaise and intermittent fevers. Vitals show a temperature of 101oF, blood pressure of 130/60 mmHg, and heart rate of 100. His exam is notable for an erythematous and tender chest port site, with no murmurs. Blood cultures drawn upon presentation show gram-positive cocci speciated to Staphylococcus aureus. What are the next steps in management of this patient?
Overview
S. aureus bacteremia (SAB) is a common infectious cause of morbidity and mortality worldwide, causing both community-acquired and hospital-acquired bacteremia. In the U.S. alone, it accounts for 23% of all bloodstream infections and is the bacterial pathogen most strongly associated with death.1 Mortality rates are approximately 42% in those with methicillin-resistant S. aureus (MRSA) bacteremia and 28% in those with methicillin-sensitive S. aureus (MSSA) bacteremia.2
Recognizing the severity of SAB, the Infectious Disease Society of America (IDSA) published treatment guidelines in 2011 to help direct the clinical care of this disease process.3 However, the majority of the recommendations are based on observational studies and expert opinion, as less than 1,500 patients have been enrolled in randomized controlled trials specifically targeted to investigate the treatment of SAB.4
Review of the Data
A clinically significant SAB usually is defined as the isolation of S. aureus from a venous blood culture with associated symptoms and signs of systemic infection.5 As SAB contamination is rare and can be associated with multiple complications, including metastatic infections, embolic stroke, recurrent infection, and death, any finding of a positive blood culture must be taken seriously.4
SAB treatment is multifaceted and should focus on the removal of any nidus of infection, such as a catheter or a prosthetic device, the use of prolonged antimicrobial therapy, and the evaluation of potential complications. In a retrospective study, Johnson et al showed that failure to remove the source is one of the strongest independent predictors of relapse in patients with SAB.6 However, 10% to 40% of patients have no identifiable focus, which increases the impetus to evaluate for complications.7-8 Overall, approximately one-third of patients with SAB develop metastatic complications, either from hematogenous seeding or local extension of infection.9
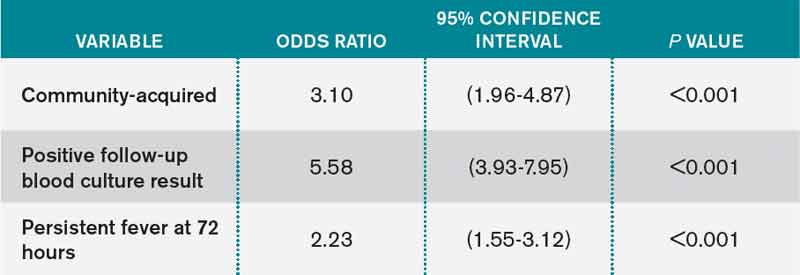
In addition to advanced age and such comorbid conditions as cirrhosis, the strongest predictor of complications is a positive blood culture at 48 to 96 hours after an initial positive blood culture, as shown in a large prospective cohort study by Fowler et al.7,10-11 Additional independent risk factors (see Table 1) include community acquisition (likely due to prolonged duration of bacteremia), skin examination suggesting the presence of acute systemic infection, and persistent fever at 72 hours after the first positive blood culture. Patients with even one of these risk factors are at high risk for a complicated course (which occurs in about 35%). In a case-control study, Chihara et al showed that S. aureus bacteruria in the absence of urinary tract pathology or recent urinary tract instrumentation might be associated with threefold increased mortality compared with those without bacteriuria, even after adjustment for comorbid conditions.12
Antimicrobial Treatment
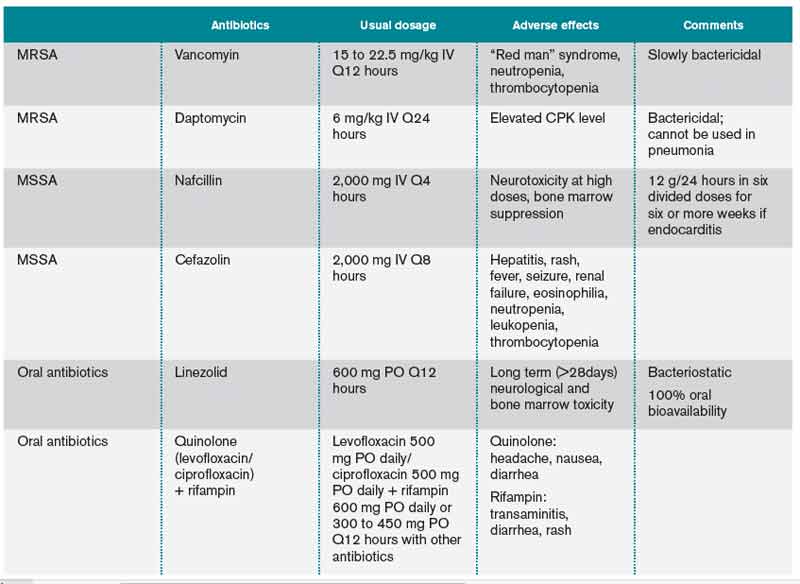
The initial choice of antibiotic therapy for SAB must take into account the MRSA prevalence in the community and hospital. If suspicion is high enough for MRSA, the IDSA’s 2011 guidelines suggest treatment with vancomycin or daptomycin.3 Although there are no published RCTs to support a particular antibiotic regimen, there are trials to suggest that a delay in treatment could be harmful. One study, by Lordis et al, showed that a delay in treatment, as defined by treatment after 44.75 hours, was associated with a longer hospital stay, with the delayed treatment group being hospitalized for 20.2 days and the early treatment group being hospitalized for 14.3 days.13 A delay in treatment was also found to be an independent predictor of mortality.13
Once susceptibilities are known, it is important to appropriately tailor antibiotics, as studies have shown lower treatment failure rates with the use of beta-lactam antibiotics when compared with empiric MRSA coverage.14-15 In one prospective study of 123 hemodialysis patients with MSSA bacteremia, Stryjewski et al showed that those treated with vancomycin were at higher risk of experiencing treatment failure than those treated with cefazolin.15 In another prospective observational study of 505 patients with SAB, Chang et al found that treatment with nafcillin was superior to vancomycin in preventing persistent bacteremia or relapse for MSSA bacteremia.14 These studies highlight the benefits of adjusting the empirically selected antibiotics, as narrowing the spectrum can result in less treatment failure.
If susceptibilities confirm MRSA, the IDSA recommends continued treatment with vancomycin or daptomycin.3 Although vancomycin is most commonly used, partly because of low cost and familiarity, Fowler et al published a study of 246 patients with SAB with or without endocarditis, assigning them to treatment with daptomycin, initial low-dose gentamicin plus vancomycin or an antistaphylococcal penicillin.16 The study found that daptomycin was not inferior to the other therapies, confirming that daptomycin is a reasonable choice in the treatment of MRSA infections.
Oral antibiotics are an option to treat SAB when necessary. A RCT by Heldman et al of 85 intravenous drug users with SAB (and suspected right-sided endocarditis, 65% of which had HIV) showed similar efficacy of ciprofloxacin plus rifampin versus standard intravenous therapy.17 A subsequent randomized trial of 104 patients with SAB comparing oral fleroxacin plus rifampin against conventional intravenous therapy also showed similar cure rates, with the added benefit of earlier discharge.18 Furthermore, in a meta-analysis of five randomized studies by Shorr et al (see Table 2), linezolid was found to have outcomes that were not inferior to vancomycin (clinical cure/microbiological success of 56%/69% in the linezolid group and 46%/73% in the vancomycin group).19
Treatment Duration
Recommendations for the duration of antibiotic treatment for SAB are mainly based on observational studies, which show mixed results. In one study done in the 1950s, about two-thirds of cases of SAB were associated with endocarditis, and longer courses of intravenous therapy (greater than four weeks) were recommended.20
More recently, with the increasing rates of catheter-related SAB and its relatively high rate of expeditious blood culture clearance, a shorter duration has been evaluated in several studies. In 1992, an analysis of published data and a retrospective case series concluded that fewer than 10 days of intravenous antibiotics might be associated with an increased risk of recurrence, but 10 to 14 days of intravenous therapy was effective for most cases of catheter-associated SAB.5 In another prospective study, Fowler et al found that a seven-day course of intravenous antibiotic therapy may be sufficient for simple, catheter-related infections.21 A subsequent prospective study by Jensen et al reported that a course of antibiotic therapy of less than 14 days might be associated with higher mortality compared to a longer course.9 A prospective study of 276 patients by Thomas et al found there was no relationship between relapse and duration of treatment (seven to 15 days) in catheter-related SAB, concluding that more than 14 days of antibiotic therapy was unnecessary.22
Per IDSA guidelines, uncomplicated SAB (no implanted prosthesis, negative blood cultures within two to four days, defervescence within 72 hours of initiating therapy, and lack of metastatic complication) can be treated with a two-week course of antibiotics, while complicated bacteremia (any of above criteria) should be treated within four to six weeks.3
Monitoring for Complications: Echos
Based on the IDSA guidelines, echocardiography is recommended in all patients with bacteremia, with a preference of transesophageal echocardiography (TEE) over transthoracic echocardiography (TTE).3 More recently, Kaasch et al developed simple criteria to identify patients with nosocomial SAB at low risk for infective endocarditis based on two prospective cohort studies.23 Lack of any of these criteria, which include prolonged bacteremia of more than four days’ duration, presence of a permanent intracardiac device, hemodialysis dependency, spinal infection and nonvertebral osteomyelitis, along with a negative TTE indicates that a TEE is not necessary (see Table 3). However, these patients need close follow-up to ensure that bacteremia clears and no new signs or symptoms concerning for metastatic infection develop.
ID Consultation
Several studies have shown that ID consultation not only improves adherence to evidence-based management of SAB, but it also reduces mortality.24-27 In a recent prospective cohort study in a tertiary-care center, even after adjusting for pre-existing comorbidities and severity of disease, an ID consult was associated with a 56% reduction in 28-day mortality.24 The patients who were followed by an ID consult service were more likely to receive appropriate duration of antibiotics (81% vs. 29%, respectively) and undergo appropriate workup for the evaluation of metastatic infections (34% and 8%, respectively). This study concluded that routine ID consult should be considered in patients with SAB, especially those with severe illness and multiple comorbid conditions.
Back to the Case
The patient was started on empiric therapy with vancomycin and serial blood cultures were obtained. He remained hemodynamically stable but febrile, with persistently positive blood and urine cultures. Given concern for the port being the source of his infection, his chest port was removed. A high-quality TTE was performed and was unremarkable.
ID was consulted. Blood cultures subsequently grew MSSA and vancomycin was switched to cefazolin 2g every eight hours. On hospital Day 5, his fever resolved and blood cultures turned negative. There were no clinical signs or symptoms for metastatic infections. A PICC line was placed after blood cultures remained negative for 48 hours. The decision was made to treat him with four weeks of antibiotics from his last positive blood culture, with follow-up in ID clinic.
Bottom Line
SAB is a common worldwide cause of morbidity and mortality. Treatment should include removing the nidus if present, finding and administering the appropriate antimicrobial therapy, evaluating for possible complications, and consulting with ID.
Dr. Ward is an assistant professor, Dr. Kim a clinical instructor, and Dr. Stojan a clinical lecturer at the University of Michigan Health System in Ann Arbor.
Acknowledgement
The authors would like to thank Dr. Jeffrey Rohde for reviewing the manuscript.
References
- Shorr AF, Tabak YP, Killian AD, et al. Healthcare-associated bloodstream infection: a distinct entity? Insights from a large U.S. database. Crit Care Med. 2006;34:3588-3595.
- Mylotte JM, McDermott C, Spooner JA. Prospective study of 114 consecutive episodes of Staphylococcus aureus bacteremia. Rev Infect Dis. 1987;9:891-907.
- Liu C, Bayer A, Cosgrove SE, et al. Clinical practice guidelines by the Infectious Diseases Society of America for the treatment of methicillin-resistant Staphylococcus aureus infections in adults and children. Clin Infect Dis. 2011;52(3).
- Naber CK, Baddour LM, Giamarellos-Bourboulis EJ, et al. Clinical consensus conference: survey on gram-positive bloodstream infections with a focus on Staphylococcus aureus. Clin Infect Dis. 2011;52(3):285-292.
- Thwaites GE, Edgeworth JD, Gkrania-Klotsas E, et al. Clinical management of Staphylococcus bacteremia. Lancet Infect Dis. 2011;11(3):208-222.
- Johnson LB, Almoujahed MO, Ilg K, et al. Staphylococcus aureus bacteremia: compliance with standard treatment, long-term outcome and predictors of relapse. Scand J Infec Dis. 2003;35(11-12):782-789.
- Fowler VG Jr., Olsen MK, Corey GR, et al. Clinical identifiers of complicated Staphylococcus aureus bacteremia. Arch Intern Med. 2003;163:2066-2072.
- Mylotte JM, Tayara A. Staphylococcus aureus bacteremia: predictors of 30-day mortality in a large cohort. Clin Infect Dis. 2000;31:1170-1174.
- Jensen AG, Wachmann CH, Espersen F, et al. Treatment and outcome of Staphylococcus aureus bacteremia: a prospective study of 278 cases. Arch Intern Med. 2002;162(1):25-32.
- Malani PN, Rana MM, Banerjee M, et al. Staphylococcus aureus bloodstream infections: the association between age and mortality and functional status. J Am Geriatr Soc. 2008;56(8):1485-1489.
- Kim SH, Park WB, Lee KD, et al. Outcome of Staphylococcus aureus bacteremia in patients with eradicable foci versus noneradicable foci. Clin Infect Dis. 2003;37(6):794-799.
- Chihara S. Popovich KJ, Weinstein RA, et al. Staphylococcus aureus bacteriuria as a prognosticator for outcome of Staphylococcus aureus bacteremia: a case control study. BMC Inf Dis. 2010;10:225.
- Lodise TP, McKinnon PS, Swiderski L, Rybak MJ. Outcomes analysis of delayed antibiotic treatment for hospital-acquired Staphylococcus aureus bacteremia. Clin Infect Dis. 2003;36:1418-1423.
- Chang FY, Peacock JE Jr., Musher DM, et al. Staphylococcus aureus bacteremia: recurrence and the impact of antibiotic treatment in a prospective multicenter study. Medicine (Baltimore). 2003;82:333.
- Stryjewski ME, Szczech LA, Benjamin DK Jr., et al. Use of vancomycin or first-generation cephalosporins for the treatment of hemodialysisdependent patients with methicillin-susceptible Staphylococcus aureus bacteremia. Clin Infect Dis. 2007;44:190-196.
- Fowler VG Jr., Boucher HW, Corey GR, et al. Daptomycin versus standard therapy for bacteremia and endocarditis caused by Staphylococcus aureus. N Engl J Med. 2006;355:653.
- Heldman AW, Hartert TV, Ray SC, et al. Oral antibiotic treatment of right-sided staphylococcal endocarditis in injection drug users: prospective randomized comparison with parenteral therapy. Am J Med. 1996;101:68-76.
- Schrenzel J, Harbarth S, Schockmel G, et al. A randomized clinical trial to compare fleroxacin-rifampicin with flucloxacillin or vancomycin for the treatment of Staphylococcal infection. Clin Infect Dis. 2004;39:1285-1292.
- Shorr AF, Kunkel MJ, Kollef M. Linezolid versus vancomycin for Staphylococcus aureus bacteraemia: pooled analysis of randomized studies. J Antimicrob Chemother. 2005;56:923-929.
- Wilson R, Hamburger M. Fifteen years’ experience with Staphylococcus septicemia in a large city hospital; analysis of fifty-five cases in the Cincinnati General Hospital 1940 to 1954. Am J Med. 1957;22:437-457.
- Fowler VG Jr., Sanders LL, Sexton DJ, et al. Outcome of Staphylococcus aureus bacteremia according to compliance with recommendation of infectious disease specialists: experience with 244 patients. Clin Infect Dis. 1998;27:478-486.
- Thomas MG, Morris AJ. Cannula-associated Staphylococcus aureus bacteremia: outcome in relation to treatment. Intern Med J. 2005;35:319-330.
- Kaasch AJ, Fowler VG Jr, Rieg S, et al. Use of a simple criteria set for guiding echocardiography in nosocomidal Staphylococcus aureus bacteremia. Clin Infect Dis. 2011;53:1-9.
- Honda H, Krauss MJ, Jones JC, et al. The value of infectious disease consultation in Staphylococcus aureus bacteremia. Am J Med. 2010;123:631-637.
- Nagao M, Iinuma Y, Saito T, et al. Close cooperation between infectious disease physicians and attending physicians can result in better management and outcome for patients with Staphylococcus aureus bacteremia. Euro Soc Clin Microbiology Infect Dis. 2010;16:1783-1788.
- Fowler VG Jr., Sanders LL, Sexton DJ, et al. Outcome of Staphylococcus aureus bacteremia according to compliance with recommendations of infectious diseases specialist: experience with 244 patients. Clin Infect Dis. 1998;27(3):478-486.
- Jenkins TC, Price CS, Sabel AL et al. Impact of routine infectious diseases service consultation on the evaluation, management, and outcome of Staphylococcus aureus bacteremia. Clin Infect Dis. 2008;46(7):1000-1008.
Case
An 82-year-old man with non-Hodgkin’s lymphoma in remission and a history of congestive heart failure and hypertension presents with one week of generalized malaise and intermittent fevers. Vitals show a temperature of 101oF, blood pressure of 130/60 mmHg, and heart rate of 100. His exam is notable for an erythematous and tender chest port site, with no murmurs. Blood cultures drawn upon presentation show gram-positive cocci speciated to Staphylococcus aureus. What are the next steps in management of this patient?
Overview
S. aureus bacteremia (SAB) is a common infectious cause of morbidity and mortality worldwide, causing both community-acquired and hospital-acquired bacteremia. In the U.S. alone, it accounts for 23% of all bloodstream infections and is the bacterial pathogen most strongly associated with death.1 Mortality rates are approximately 42% in those with methicillin-resistant S. aureus (MRSA) bacteremia and 28% in those with methicillin-sensitive S. aureus (MSSA) bacteremia.2
Recognizing the severity of SAB, the Infectious Disease Society of America (IDSA) published treatment guidelines in 2011 to help direct the clinical care of this disease process.3 However, the majority of the recommendations are based on observational studies and expert opinion, as less than 1,500 patients have been enrolled in randomized controlled trials specifically targeted to investigate the treatment of SAB.4
Review of the Data
A clinically significant SAB usually is defined as the isolation of S. aureus from a venous blood culture with associated symptoms and signs of systemic infection.5 As SAB contamination is rare and can be associated with multiple complications, including metastatic infections, embolic stroke, recurrent infection, and death, any finding of a positive blood culture must be taken seriously.4
SAB treatment is multifaceted and should focus on the removal of any nidus of infection, such as a catheter or a prosthetic device, the use of prolonged antimicrobial therapy, and the evaluation of potential complications. In a retrospective study, Johnson et al showed that failure to remove the source is one of the strongest independent predictors of relapse in patients with SAB.6 However, 10% to 40% of patients have no identifiable focus, which increases the impetus to evaluate for complications.7-8 Overall, approximately one-third of patients with SAB develop metastatic complications, either from hematogenous seeding or local extension of infection.9
In addition to advanced age and such comorbid conditions as cirrhosis, the strongest predictor of complications is a positive blood culture at 48 to 96 hours after an initial positive blood culture, as shown in a large prospective cohort study by Fowler et al.7,10-11 Additional independent risk factors (see Table 1) include community acquisition (likely due to prolonged duration of bacteremia), skin examination suggesting the presence of acute systemic infection, and persistent fever at 72 hours after the first positive blood culture. Patients with even one of these risk factors are at high risk for a complicated course (which occurs in about 35%). In a case-control study, Chihara et al showed that S. aureus bacteruria in the absence of urinary tract pathology or recent urinary tract instrumentation might be associated with threefold increased mortality compared with those without bacteriuria, even after adjustment for comorbid conditions.12
Antimicrobial Treatment
The initial choice of antibiotic therapy for SAB must take into account the MRSA prevalence in the community and hospital. If suspicion is high enough for MRSA, the IDSA’s 2011 guidelines suggest treatment with vancomycin or daptomycin.3 Although there are no published RCTs to support a particular antibiotic regimen, there are trials to suggest that a delay in treatment could be harmful. One study, by Lordis et al, showed that a delay in treatment, as defined by treatment after 44.75 hours, was associated with a longer hospital stay, with the delayed treatment group being hospitalized for 20.2 days and the early treatment group being hospitalized for 14.3 days.13 A delay in treatment was also found to be an independent predictor of mortality.13
Once susceptibilities are known, it is important to appropriately tailor antibiotics, as studies have shown lower treatment failure rates with the use of beta-lactam antibiotics when compared with empiric MRSA coverage.14-15 In one prospective study of 123 hemodialysis patients with MSSA bacteremia, Stryjewski et al showed that those treated with vancomycin were at higher risk of experiencing treatment failure than those treated with cefazolin.15 In another prospective observational study of 505 patients with SAB, Chang et al found that treatment with nafcillin was superior to vancomycin in preventing persistent bacteremia or relapse for MSSA bacteremia.14 These studies highlight the benefits of adjusting the empirically selected antibiotics, as narrowing the spectrum can result in less treatment failure.
If susceptibilities confirm MRSA, the IDSA recommends continued treatment with vancomycin or daptomycin.3 Although vancomycin is most commonly used, partly because of low cost and familiarity, Fowler et al published a study of 246 patients with SAB with or without endocarditis, assigning them to treatment with daptomycin, initial low-dose gentamicin plus vancomycin or an antistaphylococcal penicillin.16 The study found that daptomycin was not inferior to the other therapies, confirming that daptomycin is a reasonable choice in the treatment of MRSA infections.
Oral antibiotics are an option to treat SAB when necessary. A RCT by Heldman et al of 85 intravenous drug users with SAB (and suspected right-sided endocarditis, 65% of which had HIV) showed similar efficacy of ciprofloxacin plus rifampin versus standard intravenous therapy.17 A subsequent randomized trial of 104 patients with SAB comparing oral fleroxacin plus rifampin against conventional intravenous therapy also showed similar cure rates, with the added benefit of earlier discharge.18 Furthermore, in a meta-analysis of five randomized studies by Shorr et al (see Table 2), linezolid was found to have outcomes that were not inferior to vancomycin (clinical cure/microbiological success of 56%/69% in the linezolid group and 46%/73% in the vancomycin group).19
Treatment Duration
Recommendations for the duration of antibiotic treatment for SAB are mainly based on observational studies, which show mixed results. In one study done in the 1950s, about two-thirds of cases of SAB were associated with endocarditis, and longer courses of intravenous therapy (greater than four weeks) were recommended.20
More recently, with the increasing rates of catheter-related SAB and its relatively high rate of expeditious blood culture clearance, a shorter duration has been evaluated in several studies. In 1992, an analysis of published data and a retrospective case series concluded that fewer than 10 days of intravenous antibiotics might be associated with an increased risk of recurrence, but 10 to 14 days of intravenous therapy was effective for most cases of catheter-associated SAB.5 In another prospective study, Fowler et al found that a seven-day course of intravenous antibiotic therapy may be sufficient for simple, catheter-related infections.21 A subsequent prospective study by Jensen et al reported that a course of antibiotic therapy of less than 14 days might be associated with higher mortality compared to a longer course.9 A prospective study of 276 patients by Thomas et al found there was no relationship between relapse and duration of treatment (seven to 15 days) in catheter-related SAB, concluding that more than 14 days of antibiotic therapy was unnecessary.22
Per IDSA guidelines, uncomplicated SAB (no implanted prosthesis, negative blood cultures within two to four days, defervescence within 72 hours of initiating therapy, and lack of metastatic complication) can be treated with a two-week course of antibiotics, while complicated bacteremia (any of above criteria) should be treated within four to six weeks.3
Monitoring for Complications: Echos
Based on the IDSA guidelines, echocardiography is recommended in all patients with bacteremia, with a preference of transesophageal echocardiography (TEE) over transthoracic echocardiography (TTE).3 More recently, Kaasch et al developed simple criteria to identify patients with nosocomial SAB at low risk for infective endocarditis based on two prospective cohort studies.23 Lack of any of these criteria, which include prolonged bacteremia of more than four days’ duration, presence of a permanent intracardiac device, hemodialysis dependency, spinal infection and nonvertebral osteomyelitis, along with a negative TTE indicates that a TEE is not necessary (see Table 3). However, these patients need close follow-up to ensure that bacteremia clears and no new signs or symptoms concerning for metastatic infection develop.
ID Consultation
Several studies have shown that ID consultation not only improves adherence to evidence-based management of SAB, but it also reduces mortality.24-27 In a recent prospective cohort study in a tertiary-care center, even after adjusting for pre-existing comorbidities and severity of disease, an ID consult was associated with a 56% reduction in 28-day mortality.24 The patients who were followed by an ID consult service were more likely to receive appropriate duration of antibiotics (81% vs. 29%, respectively) and undergo appropriate workup for the evaluation of metastatic infections (34% and 8%, respectively). This study concluded that routine ID consult should be considered in patients with SAB, especially those with severe illness and multiple comorbid conditions.
Back to the Case
The patient was started on empiric therapy with vancomycin and serial blood cultures were obtained. He remained hemodynamically stable but febrile, with persistently positive blood and urine cultures. Given concern for the port being the source of his infection, his chest port was removed. A high-quality TTE was performed and was unremarkable.
ID was consulted. Blood cultures subsequently grew MSSA and vancomycin was switched to cefazolin 2g every eight hours. On hospital Day 5, his fever resolved and blood cultures turned negative. There were no clinical signs or symptoms for metastatic infections. A PICC line was placed after blood cultures remained negative for 48 hours. The decision was made to treat him with four weeks of antibiotics from his last positive blood culture, with follow-up in ID clinic.
Bottom Line
SAB is a common worldwide cause of morbidity and mortality. Treatment should include removing the nidus if present, finding and administering the appropriate antimicrobial therapy, evaluating for possible complications, and consulting with ID.
Dr. Ward is an assistant professor, Dr. Kim a clinical instructor, and Dr. Stojan a clinical lecturer at the University of Michigan Health System in Ann Arbor.
Acknowledgement
The authors would like to thank Dr. Jeffrey Rohde for reviewing the manuscript.
References
- Shorr AF, Tabak YP, Killian AD, et al. Healthcare-associated bloodstream infection: a distinct entity? Insights from a large U.S. database. Crit Care Med. 2006;34:3588-3595.
- Mylotte JM, McDermott C, Spooner JA. Prospective study of 114 consecutive episodes of Staphylococcus aureus bacteremia. Rev Infect Dis. 1987;9:891-907.
- Liu C, Bayer A, Cosgrove SE, et al. Clinical practice guidelines by the Infectious Diseases Society of America for the treatment of methicillin-resistant Staphylococcus aureus infections in adults and children. Clin Infect Dis. 2011;52(3).
- Naber CK, Baddour LM, Giamarellos-Bourboulis EJ, et al. Clinical consensus conference: survey on gram-positive bloodstream infections with a focus on Staphylococcus aureus. Clin Infect Dis. 2011;52(3):285-292.
- Thwaites GE, Edgeworth JD, Gkrania-Klotsas E, et al. Clinical management of Staphylococcus bacteremia. Lancet Infect Dis. 2011;11(3):208-222.
- Johnson LB, Almoujahed MO, Ilg K, et al. Staphylococcus aureus bacteremia: compliance with standard treatment, long-term outcome and predictors of relapse. Scand J Infec Dis. 2003;35(11-12):782-789.
- Fowler VG Jr., Olsen MK, Corey GR, et al. Clinical identifiers of complicated Staphylococcus aureus bacteremia. Arch Intern Med. 2003;163:2066-2072.
- Mylotte JM, Tayara A. Staphylococcus aureus bacteremia: predictors of 30-day mortality in a large cohort. Clin Infect Dis. 2000;31:1170-1174.
- Jensen AG, Wachmann CH, Espersen F, et al. Treatment and outcome of Staphylococcus aureus bacteremia: a prospective study of 278 cases. Arch Intern Med. 2002;162(1):25-32.
- Malani PN, Rana MM, Banerjee M, et al. Staphylococcus aureus bloodstream infections: the association between age and mortality and functional status. J Am Geriatr Soc. 2008;56(8):1485-1489.
- Kim SH, Park WB, Lee KD, et al. Outcome of Staphylococcus aureus bacteremia in patients with eradicable foci versus noneradicable foci. Clin Infect Dis. 2003;37(6):794-799.
- Chihara S. Popovich KJ, Weinstein RA, et al. Staphylococcus aureus bacteriuria as a prognosticator for outcome of Staphylococcus aureus bacteremia: a case control study. BMC Inf Dis. 2010;10:225.
- Lodise TP, McKinnon PS, Swiderski L, Rybak MJ. Outcomes analysis of delayed antibiotic treatment for hospital-acquired Staphylococcus aureus bacteremia. Clin Infect Dis. 2003;36:1418-1423.
- Chang FY, Peacock JE Jr., Musher DM, et al. Staphylococcus aureus bacteremia: recurrence and the impact of antibiotic treatment in a prospective multicenter study. Medicine (Baltimore). 2003;82:333.
- Stryjewski ME, Szczech LA, Benjamin DK Jr., et al. Use of vancomycin or first-generation cephalosporins for the treatment of hemodialysisdependent patients with methicillin-susceptible Staphylococcus aureus bacteremia. Clin Infect Dis. 2007;44:190-196.
- Fowler VG Jr., Boucher HW, Corey GR, et al. Daptomycin versus standard therapy for bacteremia and endocarditis caused by Staphylococcus aureus. N Engl J Med. 2006;355:653.
- Heldman AW, Hartert TV, Ray SC, et al. Oral antibiotic treatment of right-sided staphylococcal endocarditis in injection drug users: prospective randomized comparison with parenteral therapy. Am J Med. 1996;101:68-76.
- Schrenzel J, Harbarth S, Schockmel G, et al. A randomized clinical trial to compare fleroxacin-rifampicin with flucloxacillin or vancomycin for the treatment of Staphylococcal infection. Clin Infect Dis. 2004;39:1285-1292.
- Shorr AF, Kunkel MJ, Kollef M. Linezolid versus vancomycin for Staphylococcus aureus bacteraemia: pooled analysis of randomized studies. J Antimicrob Chemother. 2005;56:923-929.
- Wilson R, Hamburger M. Fifteen years’ experience with Staphylococcus septicemia in a large city hospital; analysis of fifty-five cases in the Cincinnati General Hospital 1940 to 1954. Am J Med. 1957;22:437-457.
- Fowler VG Jr., Sanders LL, Sexton DJ, et al. Outcome of Staphylococcus aureus bacteremia according to compliance with recommendation of infectious disease specialists: experience with 244 patients. Clin Infect Dis. 1998;27:478-486.
- Thomas MG, Morris AJ. Cannula-associated Staphylococcus aureus bacteremia: outcome in relation to treatment. Intern Med J. 2005;35:319-330.
- Kaasch AJ, Fowler VG Jr, Rieg S, et al. Use of a simple criteria set for guiding echocardiography in nosocomidal Staphylococcus aureus bacteremia. Clin Infect Dis. 2011;53:1-9.
- Honda H, Krauss MJ, Jones JC, et al. The value of infectious disease consultation in Staphylococcus aureus bacteremia. Am J Med. 2010;123:631-637.
- Nagao M, Iinuma Y, Saito T, et al. Close cooperation between infectious disease physicians and attending physicians can result in better management and outcome for patients with Staphylococcus aureus bacteremia. Euro Soc Clin Microbiology Infect Dis. 2010;16:1783-1788.
- Fowler VG Jr., Sanders LL, Sexton DJ, et al. Outcome of Staphylococcus aureus bacteremia according to compliance with recommendations of infectious diseases specialist: experience with 244 patients. Clin Infect Dis. 1998;27(3):478-486.
- Jenkins TC, Price CS, Sabel AL et al. Impact of routine infectious diseases service consultation on the evaluation, management, and outcome of Staphylococcus aureus bacteremia. Clin Infect Dis. 2008;46(7):1000-1008.
Hospitalists Get Answers to Tough Healthcare Questions
When it comes to Medicare, the Affordable Care Act, and a host of other healthcare-reform-related topics, hospitalists have lots of good questions, such as:
- When does the Physician Value-Based Payment Modifier (VBPM) take effect? And will I be included?
- Which primary-care services are covered by the increased Medicaid payments?
- Are hospitalists eligible to bill for Medicare’s new CPT Transitional Care Management (TCM) codes? (see “New Codes Bridge Billing Gap,”).
Now, SHM’s Public Policy Committee has answered all of the above—and many more—in a set of three “Frequently Asked Questions” documents available at www.hospitalmedicine.org/advocacy. Each document goes in-depth on the most cutting-edge policy issues that are top of mind for hospitalists and the hospitals they serve on these issues:
The Physician Value-Based Payment Modifier (VBPM): The VBPM seeks to connect cost and quality of services in order to begin reimbursement for the value, rather than the quantity, of care. It combines the quality measuring in the Physician Quality Reporting System (PQRS), cost measures, and a payment adjustment for physicians. Measurement begins this year, and many hospitalists will be included.
Medicaid/Medicare parity regulation: On Nov. 1, 2012, the Centers for Medicare & Medicaid Services (CMS) released the final regulations implementing Section 1202 of the Affordable Care Act, which increases Medicaid payments for specified primary-care services to 100% of Medicare levels in 2013 and 2014.
New CPT Transitional Care Management (TCM) codes 99495-99496: CMS has created two new CPT Transitional Care Management (TCM) codes designed to improve care coordination and provide better incentives to ensure patients are seen in a physician’s office, rather than be at risk for readmission.
New Action: Getting Involved Just Got Easier
SHM’s Legislative Action Center also makes getting involved easier with a new grassroots outreach tool called Voter Voice. SHM’s first action alert on Voter Voice was sent to members in December. Hospitalists’ willingness to take a few minutes and contact their congressional leaders using Voter Voice increased SHM’s visibility to Congress by nearly five times compared with prior similar alerts.
Getting involved is easy and only takes a few seconds. You can use either your ZIP code to look up your members of Congress or search active legislation by keyword. SHM members can sign up for SHM Legislative Action Center alerts by entering their email address.
To download the new SHM advocacy FAQs or use the improved Legislative Action Center, visit www.hospitalmedicine.org/advocacy.
Local Factors Play Major Role in Determining Compensation Rates for Pediatric Hospitalists
Although pediatricians make up less than 6% of the hospitalists surveyed by the Medical Group Management Association (MGMA), they represent a very different data profile from other specialties reported in SHM’s 2012 State of Hospital Medicine report.
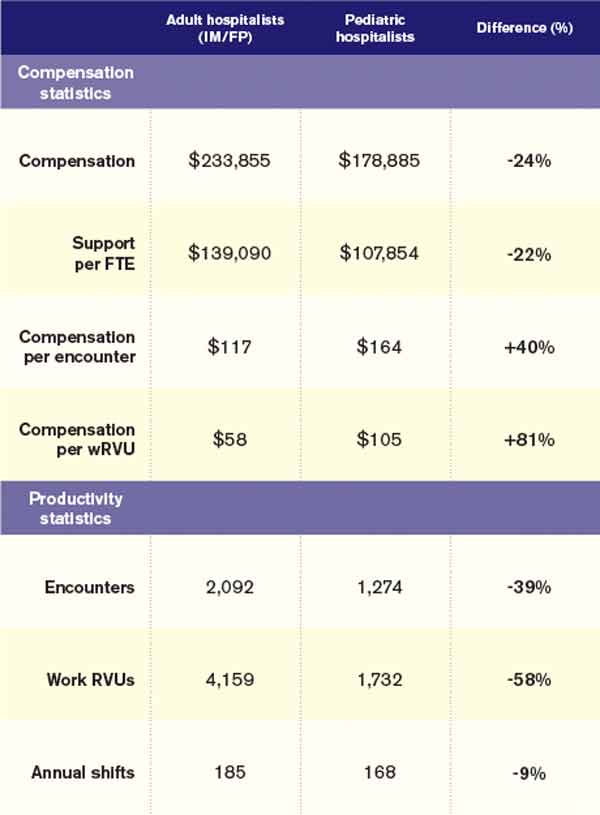
The nonpediatric HM specialties (internal medicine, family medicine, and med/peds) have similar data profiles with regard to productivity and compensation statistics. They are all within 2% of the $233,855 “all adult hospitalists” median compensation. Although there is a bit more variability in the productivity data, all three groups are clustered within 10% of each other. The key to understanding their similarity is that they all serve mostly adult inpatients. While some of these physicians may also care for hospitalized children, I suspect this population is a small proportion of their daily workload.
Pediatric hospitalists only treat pediatric patients and differ significantly from adult hospitalists, as summarized in Table 1.
Pediatricians remain among the lowest-earning specialties nationally, whether in the office or on children’s wards. The key to understanding the differences between adult and pediatric hospitalists is that they derive their compensation and productivity expectations from two separate and distinct physician marketplaces. Adult hospitalists benefit from more than a decade of rapidly growing demand for their services, as well as higher compensation for their office-based counterparts. Meanwhile, the market for pediatric hospitalists remains smaller and more segmented, allowing local factors to drive compensation more than a national demand for their services would.

Pediatric hospitalists appear to earn about a quarter less than their adult counterparts while receiving a similarly lower amount of hospital financial support per provider. Pediatric hospitalists also appear to work less than adult hospitalists, reflected in fewer shifts annually and fewer hours per shift; 75% of adult hospitalist groups report shift lengths of 12 hours or more, compared with 48% of pediatric hospitalist groups. This may stem from the frequent lulls in census common to a community hospital pediatrics service, in contrast to more consistent demand posed by geriatric populations. Although pediatric hospitalists receive more compensation per encounter or wRVU, they cannot generate those encounters or work RVUs at the same clip as adult hospitalists. Pediatricians must hold a family meeting for every single patient, and even something as seemingly simple as obtaining intravenous access might consume 45 minutes of a hospitalist’s time.
Thus, pediatric hospitalists find themselves caught in the same market as other pediatric specialists. These providers remain undervalued compared to virtually all other physicians. Those who seek to improve their financial prospects likely need to work more shifts or generate more workload relative to the expectations of their pediatrician peers.
Personally, I can’t help but wonder what attention pediatric care might enjoy if kids had a vote, a pension, an entitlement program, and a lobby on K Street like their grandparents do.
Dr. Ahlstrom is clinical director of Hospitalists of Northern Michigan and a member of SHM’s Practice Analysis Committee.
Although pediatricians make up less than 6% of the hospitalists surveyed by the Medical Group Management Association (MGMA), they represent a very different data profile from other specialties reported in SHM’s 2012 State of Hospital Medicine report.
The nonpediatric HM specialties (internal medicine, family medicine, and med/peds) have similar data profiles with regard to productivity and compensation statistics. They are all within 2% of the $233,855 “all adult hospitalists” median compensation. Although there is a bit more variability in the productivity data, all three groups are clustered within 10% of each other. The key to understanding their similarity is that they all serve mostly adult inpatients. While some of these physicians may also care for hospitalized children, I suspect this population is a small proportion of their daily workload.
Pediatric hospitalists only treat pediatric patients and differ significantly from adult hospitalists, as summarized in Table 1.
Pediatricians remain among the lowest-earning specialties nationally, whether in the office or on children’s wards. The key to understanding the differences between adult and pediatric hospitalists is that they derive their compensation and productivity expectations from two separate and distinct physician marketplaces. Adult hospitalists benefit from more than a decade of rapidly growing demand for their services, as well as higher compensation for their office-based counterparts. Meanwhile, the market for pediatric hospitalists remains smaller and more segmented, allowing local factors to drive compensation more than a national demand for their services would.
Pediatric hospitalists appear to earn about a quarter less than their adult counterparts while receiving a similarly lower amount of hospital financial support per provider. Pediatric hospitalists also appear to work less than adult hospitalists, reflected in fewer shifts annually and fewer hours per shift; 75% of adult hospitalist groups report shift lengths of 12 hours or more, compared with 48% of pediatric hospitalist groups. This may stem from the frequent lulls in census common to a community hospital pediatrics service, in contrast to more consistent demand posed by geriatric populations. Although pediatric hospitalists receive more compensation per encounter or wRVU, they cannot generate those encounters or work RVUs at the same clip as adult hospitalists. Pediatricians must hold a family meeting for every single patient, and even something as seemingly simple as obtaining intravenous access might consume 45 minutes of a hospitalist’s time.
Thus, pediatric hospitalists find themselves caught in the same market as other pediatric specialists. These providers remain undervalued compared to virtually all other physicians. Those who seek to improve their financial prospects likely need to work more shifts or generate more workload relative to the expectations of their pediatrician peers.
Personally, I can’t help but wonder what attention pediatric care might enjoy if kids had a vote, a pension, an entitlement program, and a lobby on K Street like their grandparents do.
Dr. Ahlstrom is clinical director of Hospitalists of Northern Michigan and a member of SHM’s Practice Analysis Committee.
The Journal of Hospital Medicine Honors Top Reviewers for 2012
Journal of Hospital Medicine editors are recognizing 39 peer reviewers for the “collegial and insightful nature of their reviews.” The editors congratulate the reviewers for their contributions and thank them for the important role they play in making JHM an important and useful resource for its authors and readers.
- Brian Harte, MD, SFHM, South Pointe Hospital
- Michael DeVita, MD, St. Vincent’s Medical Center
- Gurpreet Dhaliwal, MD, University of California at San Francisco
- Evan Fieldston, MD, MBA, MSHP, Children’s Hospital of Philadelphia, University of Pennsylvania
- S. Ryan Greysen, MD, MHS, MA, University of California at San Francisco
- Luke Hansen, MD, Northwestern Memorial Hospital
- Luci Leykum, MD, FHM, University of Texas HSC
- Andrew Masica, MD, SFHM, Baylor Health Care System
- James C. Pile, MD, FACP, SFHM, Cleveland Clinic
- Steven Belknap, MD, Northwestern Memorial Hospital
- Vincent Liu, MD, Santa Clara (Calif.) Medical Center
- Basem Abdelmalak, MD, Cleveland Clinic
- Marisha Burden, MD, Denver Health Medical Center
- James Burke, MD, University of Michigan Health System, Ann Arbor
- Roy Carr-Hill, PhD, University of Liverpool
- Lawrence Haber, MD, University of California at San Francisco
- Keiki Hinami, MD,Northwestern Memorial Hospital
- Michael Hwa, MD, University of California at San Francisco
- Michael Jangigian, MD, New York University
- Mansoor Khalid, MD, Saint Francis Hospitalists
- Hilary Mosher, MD, University of Iowa Carver College of Medicine, Iowa City
- Andrew Odden, MD, Ann Arbor VA Medical Center, University of Michigan
- Maria Raven, MD, MPH, MSc, University of California at San Francisco
- Kristin Salottolo, MPH, St. Anthony Hospital
- Jonathan Sevransky, MD, MHS, Emory Healthcare
- Kittane Vishnupriya, MD, MBBS, Johns Hopkins Bayview Medical Center
- Robert S. Young, MD, Northwestern University
- Melissa Mattison, MD, SFHM, Beth Israel Deaconess Medical Center, Boston
- Jeff Rohde, MD, University of Michigan Health System, Ann Arbor
- Henry Michtalik, MD, Johns Hopkins
- Mark Shen, MD, Dell Children’s Medical Center of Central Texas, Austin
- Sumant Ranji, MD, University of California at San Francisco
- Greg Maynard, MD, SFHM, University of California at San Diego
- Anand Kartha, MD, MSc, Boston University
- Christopher Roy, MD, FHM, Brigham & Women’s Hospital, Boston
- Zachary Goldberger, MD, MS, University of Washington School of Medicine
- Chase Coffey, MD, Henry Ford Health System
- Quinn Czosnowski, PharmD, University of the Sciences
- Kenataro Iwata, MD, MSc, FACP, FIDSA, Kobe University Hospital
Fellow in Hospital Medicine Spotlight: Danielle Smith, MD, SFHM

Dr. Smith is president of the Southeastern Wisconsin chapter of SHM, and is a member of SHM’s Physician in Training Committee, for which she promotes hospital medicine as a career.
Undergraduate education: University of Wisconsin at La Crosse.
Medical school: Medical College of Wisconsin, Milwaukee.
Notable: Dr. Smith has increased her hospital’s patient satisfaction levels to the 90th percentile from the 60th percentile by creating a program that keeps patients’ family members informed daily about their condition. She says the hardest part of keeping patients happy is bonding with them and building a rapport in a short amount of time; only after bonding with patients will they be aware of hospitalists as physicians. Dr. Smith also is a Six Sigma black belt.
FYI: When she was growing up, she wanted to be a Dallas Cowboys cheerleader. Today, she enjoys dance and gymnastics with her children. Dr. Smith is looking forward to receiving her MBA, which she plans to use to help fix parts of the healthcare system in a time of change.
Quotable: “To me, being an SHM fellow means a validation of the years of commitment I have to quality patient care, not only of the individual patient, but of the way we deliver healthcare as a society. I am honored to be an SHM Senior Fellow and privileged to be part of a group of hospitalists truly committed to providing quality patient care, lifelong learning, and improving the ways we deliver care.”
HMX Term of the Month: CMS 1500
Medical claim form established by CMS to submit paper claims to Medicare and Medicaid. Most commercial insurance carriers also require paper claims be submitted on CMS 1500s. The form is distinguished by its red ink.
Medical claim form established by CMS to submit paper claims to Medicare and Medicaid. Most commercial insurance carriers also require paper claims be submitted on CMS 1500s. The form is distinguished by its red ink.
Medical claim form established by CMS to submit paper claims to Medicare and Medicaid. Most commercial insurance carriers also require paper claims be submitted on CMS 1500s. The form is distinguished by its red ink.
Hospitalists Get Peek at Hospital Medicine 2013 Annual Meeting Schedule Online
After the welcomes and plenary sessions by leaders in healthcare, will you go to a breakout session called “More Non-Evidence-Based Medicine: Things We Do for No Reason” or the workshop on point-of-care evidence?
Now is the time to start deciding with the new HM13 “Day at a Glance” schedules, available at www.hospitalmedicine2013.org. With more than 100 events, sessions, and work groups, the schedule is a roadmap for hospitalists planning their annual meeting experience in advance.
This year, hospitalists will have extra help in planning their HM13 strategy digitally. For the first time, hospitalists will be able to use their smartphones and tablet devices to review the HM13 agenda and plan their own personal schedules before they arrive at the conference.
To download a printable PDF of the HM13 “Day at a Glance,” visit www.hospitalmedicine2013.org/pdf/At-A-Glance.pdf.