User login
Pathway may drive treatment resistance in T-ALL

Experiments in zebrafish have revealed a mechanism that may drive relapse in human T-cell acute lymphoblastic leukemia (T-ALL).
Researchers identified a subset of T-ALL cells that spontaneously acquired activation of the Akt pathway.
This increased the frequency of leukemia-propagating cells (LPCs) and mediated resistance to treatment with dexamethasone. However, adding an Akt inhibitor to treatment overcame this resistance.
“The Akt pathway appears to be a major driver of treatment resistance,” said study author David Langenau, PhD, of the Harvard Stem Cell Institute in Boston.
“We also show that this same pathway increases overall growth of leukemic cells and increases the fraction of cells capable of driving relapse.”
Dr Langenau and his colleagues described these findings in Cancer Cell.
Previous research had shown that, if LPCs are retained following treatment, they will initiate disease relapse. And LPC frequency can increase over time. However, it was not clear if this was the result of continued clonal evolution or if a clone with high LPC frequency out-competed other cells.
So Dr Langenau and his colleagues used zebrafish models to study T-ALL clones. The team observed functional variation within individual clones and identified clones that enhanced growth rate and leukemia-propagating potential with time.
A subset of these clones acquired Akt pathway activation, which increased the number of LPCs by activating mTORC1. The cells also exhibited an elevated growth rate, which may have resulted from stabilizing the Myc protein.
Furthermore, the LPCs proved resistant to treatment with dexamethasone. But the researchers were able to reverse this resistance by combining dexamethasone with the Akt inhibitor MK2206. This approach proved effective both in zebrafish models and in human T-ALL cells.
“Our work will likely help in identifying patients that are prone to relapse and would benefit from co-treatment with inhibitors of the Akt pathway and typical front-line cancer therapy,” said Jessica Blackburn, PhD, a member of Dr Langenau’s lab.
She and her colleagues are now hoping to identify other mutations that lead to relapse, thereby pinpointing potential drug targets for patients with aggressive leukemia. ![]()
RIT can improve transplant outcomes in NHL, CLL
GRAPEVINE, TEXAS—Administering radioimmunotherapy (RIT) prior to non-myeloablative allogeneic transplant (NMAT) can improve survival in patients with persistent disease, according to a speaker at the 2014 BMT Tandem Meetings.
Ryan Cassaday, MD, of the University of Washington in Seattle, noted that RIT-augmented NMAT can produce long-term remissions in patients with relapsed or refractory B-cell non-Hodgkin lymphoma (B-NHL) or chronic lymphocytic leukemia (CLL).
But outcomes for patients with persistent disease are “underdescribed.”
So he and his colleagues set out to describe outcomes of NMAT for patients with persistent indolent B-NHL or CLL and estimate the impact of RIT in these patients.
Treatment details
The researchers retrospectively analyzed data from 89 patients who underwent NMAT from December 1998 to April 2009 and were followed until September 2013. Eighteen of the patients had received RIT as part of a prospective study (AK Gopal et al, Blood 2011).
The remaining 71 patients did not receive RIT but met eligibility criteria for that study. Specifically, they had a CD20+ B-cell malignancy, an HLA-matched peripheral blood stem cell donor, and persistent disease at NMAT. These control subjects received fludarabine (30 mg/m2 on days -7, -6, and -5) and 2 Gy of total body irradiation prior to NMAT.
Patients in the RIT group received the same treatment following RIT. On day -21, they received 250 mg/m2 of rituximab before an imaging dose of 111In-ibritumomab tiuxetan. And on day -14, they received 250 mg/m2 of rituximab and 0.4 mCi/kg of 90Y-ibritumomab tiuxetan.
Patient characteristics
In the RIT group, 10 patients had CLL/small lymphocytic lymphoma (SLL), 6 had follicular lymphoma (FL), 1 had marginal zone lymphoma (MZL), and 1 had hairy cell leukemia. As for controls, 52 had CLL/SLL, 18 had FL, and 1 had MZL.
“The majority of patients were male [74%] and a relatively young age, given the diseases being treated [median of 56 years],” Dr Cassaday said. “The majority of patients had previously received rituximab [88%], and patients were heavily pretreated [median of 4 prior therapies, range 1-12].”
There were no significant differences between the 2 treatment groups with regard to the aforementioned characteristics. However, there were some “striking differences” between the 2 groups, Dr Cassaday said, including characteristics that portend worse prognosis.
Specifically, RIT-treated patients had more bulky disease (> 5 cm) than controls (61% vs 15%, P<0.001) and more chemoresistant disease (81% vs 39%, P=0.003). And RIT patients were more likely to have HCT comorbidity index scores of 3 or higher (72% vs 37%, P=0.006), as well as pre-NMAT platelet counts less than 25k/μL (33% vs 7%, P=0.002).
RIT improves PFS, OS
The researchers conducted a multivariate analysis including the factors that differed significantly between the 2 treatment groups. And they found that only RIT was significantly associated with both progression-free survival (PFS) and overall survival (OS).
When calculating survival curves, the researchers adjusted for the imbalance in covariates between the treatment groups.
“[The adjusted survival rate] is essentially what one might expect had the RIT group had similar baseline characteristics as the control group,” Dr Cassaday explained.
Control subjects had a 3-year OS of 55%. For the RIT-treated patients, the unadjusted 3-year OS was 78% (P=0.20), and the adjusted OS was 87% (P=0.008).
The 3-year PFS was 44% for controls. For the RIT group, the unadjusted 3-year PFS was 56% (P=0.36), and the adjusted PFS was 71% (P=0.02).
The researchers also found that RIT did not increase the rate of non-relapse mortality. The unadjusted hazard ratio was 0.5 (P=0.32), and the adjusted hazard ratio was 0.4 (P=0.18).
“This analysis does have some limitations,” Dr Cassaday conceded. “Clearly, it does not replace the strength of evidence that would come from a randomized, controlled trial. And the relatively small sample size does limit our ability to look at a lot of different subgroups.”
In addition, the findings may not apply to other non-myeloablative regimens. And, due to the time frame of the study, the researchers could not account for the potential impact of newer agents.
Nevertheless, Dr Cassaday said the data suggest that RIT can improve the outcome of NMAT in patients with persistent indolent B-NHL or CLL. And a prospective, randomized study evaluating this approach is warranted.
Dr Cassaday presented this research at the 2014 BMT Tandem Meetings as abstract 75. Information in the abstract differs from that presented. ![]()
The demise of renal artery stenting
The announcement from Medtronic in January has apparently brought down the curtain on the much-heralded approach to the treatment of refractory hypertension using radio-frequency renal artery sympathetic nerve ablation (RASNA) applied through the tip of the Symplicity catheter.
This technology is being used widely around the world for the treatment of refractory hypertensive patients. The enthusiasm for RASNA was generated by a series of reports suggesting that an amazing decrease in systolic blood pressure of more than 30 mm Hg can be obtained in patients with resistant hypertension taking three or more antihypertensive drugs. However, the SYMPLICITY HTN-3 trial (Clin. Cardiol. 2012;35:528-35), which enrolled 535 patients with refractory hypertension, failed to achieve the primary endpoint of a significant decrease in systolic pressure in the radio-frequency (RF)-treated patients compared with the sham-operated patients. In the study, blinding was rigorously managed by renal artery catheterization of all 535 patients, with RF ablation instituted in two-thirds of the patients, and a sham operation conducted in one-third.
As a result of the observations in SYMPLICITY HTN-3, Medtronic is suspending enrollment in current trials using the Symplicity device throughout the world, and will "continue to ensure patients access to the Symplicity technology at the discretion of their physicians in countries where the device is approved," according to its statement.
Enthusiasm for RF ablation of the sympathetic nerves accompanying the renal artery was generated by a series of publications describing the physiologic and therapeutic effects. The first publications in this series described the metabolic changes that occurred after RF ablation carried out in one patient who experienced a decrease in systolic pressure of 20 mm Hg associated with modulation of sympathetic activity 30 days and 12 months after the procedure (N. Engl. J. Med. 2009;361:932-4). This study was followed by two subsequent reports of patients in whom RASNA was carried out. A proof-of-concept trial (SYMPLICITY HTN-1) in 153 patients reported a substantial decrease in blood pressure over a 2-year period (Hypertension 2011;57:911-7). A second trial (SYMPLICITY HTN-2) randomized 106 patients to either RASNA or standard therapy. That trial reported that 84% of the patients receiving RASNA had a reduction of blood pressure greater than 10 mm Hg within 6 months, compared with 35% of the control group (Lancet 2010;376:1903-9). Both studies reported a profound decrease in blood pressure that ensued over a 6-month period in 80%-90% of patients undergoing the therapy. In light of these reports, it is difficult to explain the fact that SYMPLICITY HTN-3 was a negative study.
Modulation of the sympathetic nervous system for the treatment of hypertension is not new. More than 60 years ago, Smithwick and colleagues carried out both surgical lumbar and sympathetic splanchnicectomy for its treatment with uncertain results (JAMA 1952;153:1501-4). In an era when all that we could offer hypertensive patients was a low-salt diet, the procedure became rather popular. However, the surgical risks, adverse side effects, and uncertainty of benefit led to both procedures being discontinued. Recently, there have been studies of the effect of stimulation of the carotid sinus nerve for the treatment of hypertension.
The potential benefit of modulation of the arterial sympathetic nerves, and particularly those located in the renal artery, became the focus of this recent interest. Nevertheless, a number of questions have arisen in regard to the mechanism of RASNA. And why does it take 6 months to achieve the blood pressure response? In addition, there is very little published data in regard to the changes in the renal artery and its adjacent tissue as a result of the RF ablation.
At the present, Medtronic has not provided any information beyond its indicating the lack of benefit. Further information will be reported at the upcoming American College of Cardiology scientific sessions. In the meantime, speculation is rampant as to whether the initial reports were purely placebo effects or if there is something intrinsically flawed in the SYMPLICITY HTN -3 trial.
Dr. Goldstein, medical editor of Cardiology News, is professor of medicine at Wayne State University and division head emeritus of cardiovascular medicine at Henry Ford Hospital, both in Detroit. He is on data safety monitoring committees for the National Institutes of Health and several pharmaceutical companies.

Hyperglycemia and CV Complications
Hyperglycemia in hospitalized patients is frequently observed and is recognized as an important threat to the health of patients with varying levels of illness, independent of diabetes status.[1, 2, 3, 4] Previous studies have found that in‐hospital hyperglycemia is associated with higher short‐term mortality rates,[5, 6, 7] longer lengths of stay, and higher rates of admission to intensive care units.[4]
In‐hospital hyperglycemia may be the result of diabetes mellitus or stress associated with hospitalization. The mechanism of stress hyperglycemia differs from diabetic hyperglycemia and can occur independently of diabetes status.[8] Stress hyperglycemia is characterized by rapid onset of insulin resistance, which normally takes months or years in diabetes mellitus. It develops in association with or because of other stressor such as infection or inflammatory processes.[9]
To our knowledge, no long‐term follow‐up study on hospitalized patients with elevated glucose levels but without a diabetes diagnosis has ever been conducted. In this study, we measured the 1‐ and 5‐year risk of mortality and diabetes‐related diseases for hospitalized patients with a diabetes diagnosis compared with patients grouped according to their peak in‐hospital serum glucose level. Our primary comparison was between patients with diagnosed diabetes and those with peak serum glucose >200 mg/dL (11.1 mmol/L), but we also examined 4 other categories of peak serum glucose: 140 to 200 mg/dL (7.811.1 mmol/L), 108 to 140 mg/dL (6.07.8 mmol/L), and <108 mg/dL (<6.0 mmol/L).
METHODS
Study Base
The study included all adult patients (excluding patients admitted to psychiatry and obstetrics) admitted to The Ottawa Hospital (TOH) between January 1, 1996 and March 31, 2008 and discharged alive. Included patients were 18 years or older and had complete medical record abstracts. TOH is the primary hospital in Ottawa, Ontario, Canada, and the main tertiary hospital in the Champlain Local Health Integration Network, the public healthcare authority for the Ottawa region. This study was approved by The Ottawa Hospital Research Ethics Board.
Data Sources
The Ottawa Hospital Data Warehouse (OHDW) is a repository for data from the hospital's patient information systems. These systems include patient registration information, discharge abstract, and laboratory, pharmacy, and radiology results. OHDW was used to determine each patient's age, gender, diagnoses, pharmacy orders, laboratory test results, in‐hospital comorbidities, most responsible hospital service, and admission urgency.
This dataset was linked to 3 population‐based administrative datasets and 1 derived cohort. Ontario's Registered Persons Database (RPDB) is a population‐based registry containing date of death (if applicable) as well as eligibility status for the provincial universal health insurance program, the Ontario Health Insurance Plan (OHIP).[10] The OHIP database records billing claims submitted by approximately 95% of Ontario physicians. Each claim contains a fee code describing the type of service provided and a location denoting where the service had taken place. The Canadian Institute for Health Information Discharge Abstract Database (DAD) records clinical, demographic, and administrative data for all hospital admissions and same‐day surgeries for all Ontario acute care hospitals since April 1, 1988. The Ontario Myocardial Infarction Database (OMID) contains records of all patients with a most responsible diagnosis of acute myocardial infarction (AMI) (International Classification of Diseases, 9th Revision [ICD‐9] code 410 or International Classification of Diseases, 10th Revision [ICD‐10] code I21) identified from the DAD. Details on the creation of the OMID are provided in an earlier study.[10]
Variable Definitions
We identified the index admission of the TOH cohort in the DAD using a unique encrypted health insurance number, admission and discharge dates, and the institution number. To avoid double counting, patients with the same encrypted health insurance number who were discharged from an institution and admitted to another within 2 days were classified as transfers and counted as 1 hospitalization.
Diabetes and cardiovascular (CV) complications (acute myocardial infarction [AMI], congestive heart failure [CHF], cardiovascular disease [CVD], peripheral vascular disease [PVD], and end‐stage renal disease [ESRD]) were identified in the discharge abstract as the most responsible diagnosis for the admission as well as postadmission comorbidities. The discharge abstract records diagnostic codes according to ICD‐9 (April 1, 1988March 31, 2002) or ICD‐10 (April 1, 2002March 1, 2009).
Each hospitalization was classified into 1 of 6 mutually exclusive diabetes status categories based on diagnostic codes, serum glucose test results, and pharmacy records. The diagnosed diabetes group included hospitalizations with any diagnostic code of diabetes in the discharge abstract or any order for a diabetes medication during hospitalization. Eligible medications included acarbose, acetohexamide, chlorpropamide, glibenclamide, gliclazide, glimepiride, glipizide, glyburide, insulin, metformin, nateglinide, pioglitazone, repaglinide, rosiglitazone, and tolbutamide. A chart validation study showed excellent ascertainment of diabetes status using these methods (correct classification 88.8%; 95% confidence interval [CI]: 85.791.3 with weighted kappa=0.89; 95% CI: 0.85‐0.92).[11, 12] Patients without diagnosed diabetes were classified according to their peak serum glucose value during the index hospitalization: <108 mg/dL (<6.0 mmol/L), 108 to 140 mg/dL (6.07.8 mmol/L), 140 to 200 mg/dL (7.811.1 mmol/L), >200 mg/dL (>11.1 mmol/L); hospitalizations in which glucose levels were not obtained were classified as unknown. These peak serum glucose categories are based on the World Health Organization's definition of diabetes and poor glucose tolerance.[12]
Outcomes
The primary outcome was all‐cause postdischarge mortality determined by linking the index admission to the RPDB. Secondary outcomes were CV complications, including: AMI (determined by linking to the OMID); hospitalization for CHF (determined by linking to the DAD for primary diagnosis of 425, 428, 514, 518.4 or I50, I42.0, I42.6, I42.7, I42.8, I42.9, I43, J81), CVD (determined by linking to the DAD for primary diagnosis of 430, 431, 432, 434, 436 or I60, I61, I62, I63, I64, G46), PVD (determined by primary diagnosis of 96.11, 96.12, 96.13, 96.14, 96.15 [excluded if in conjunction with 170, 171, 213, 730, 740759, 800900, 901904, 940950], 50.18, 51.25, 51.29 [excluded if in conjunction with 414.1, 441, 44] or 1VC93, 1VG93, 1VQ93, 1WA93, 1WE93, 1WJ93, 1WL93, 1WM93 [excluded if in conjunction with C40, C41, C46.1, C47, C49, D160, M46.2, M86, M87, M89.6, M90.0‐M90.5, Q00, Q38‐Q40, S02.0, S09.0, S04.0, S15, S25, T26), and 1KG50, 1KG57, 1KG76, 1KG35HAC1, 1KG35HHC1 [excluded if in conjunction with I60, I67.1, I71, I72, 177.0, 179.0]), and ESRD (determined by 403.9, 404.9,584, 585, 586, 788.5 or I12, I13, N17, N18, N19, R34).
Analysis
We identified all encounters of cohort patients in any Ontario acute‐care hospital within 5 years following the index discharge. Patients not covered by provincial health insurance (OHIP) were excluded.
We first measured crude mortality and morbidity rates by patient category (diagnosed diabetes and glucose levels). Next, we compared the unadjusted outcomes and baseline characteristics (age, sex, previous inpatient and emergency admissions, and disease at admission) between groups using a [2] test for categorical variables and analysis of variance for continuous variables.
Due to the violation of proportional hazards, we used the Weibull accelerated failure time model to calculate the hazard of death associated with diabetes status or serum glucose level. Consistency of the probability plots confirmed appropriateness of using the Weibull function. Competing risk is defined as a type of failure that prevents the observation of the event of interest or fundamentally alters the probability of its occurrence.[13, 14] In the comorbidity analyses, death is a competing risk for all other outcomes. We calculated the multivariate competing risk hazard for each outcome of interest except death. Each model was adjusted for potential confounders: baseline risk of in‐hospital mortality, common comorbidities, most responsible hospital service, and the number of previous inpatient admissions and emergency department visits to TOH in the previous 6 months. The probability of dying during the admission was calculated using the Escobar model, which predicts the in‐hospital probability of dying using data available at the time of admission to the hospital.[15] The Escobar model has been validated in the study population.[16] The baseline probability of dying was based on age, sex, acuity of admission, primary condition, Charlson comorbidity score,[17] and the laboratory‐based acute physiology score.[15] The Charlson comorbidity score was calculated using weights from Schneeweiss et al.[17] Kaplan‐Meier survival curves were created for both adjusted and unadjusted models. Death was used as the main censoring variable when analyzing nonfatal outcomes at 1‐ and 5‐year follow‐up.
Adjusted models were constructed using a stepwise selection technique and compared with Akaike and Bayesian information criteria values. For all tests, significance was defined as a P value of 0.05 or less.
We recognize that the cohort may contain more than 1 index hospitalization per patient. However, repeated analyses using only the first or last encounter per patient produced nearly identical hazard ratios (HRs) and CIs.
RESULTS
Between January 1, 1996 and March 31, 2008, 194,641 nonpsychiatric and nonobstetric adults were admitted to TOH. Seventeen patients were excluded because they were ineligible for healthcare coverage and had no encounter with the Ontario healthcare system following discharge from hospital, and 11,175 of the admissions ended in death. The final cohort consisted of 114,764 unique individuals representing 183,449 encounters.
Patients had a mean age of 59.5 years (standard deviation: 18.0) and 48.9% were male. The baseline risk of dying during hospitalization was 4.8%.
Table 1 describes patients by diabetes and peak serum glucose status. Patients with diagnosed diabetes were more likely to be older and male. Patients with elevated peak serum glucose (>200 mg/dL; >11.1 mmol/L) were younger than the diagnosed diabetes group and had a higher baseline probability of in‐hospital death (9.4%, 95% CI: 9.09.7). Patients in these 2 groups had more inpatient admissions within the previous 6 months compared to the groups with other peak serum glucose values.
| Serum Glucose Level, mg/dL | ||||||
|---|---|---|---|---|---|---|
| Diagnosed Diabetes, n=32,774, 17.9% | >200, n=5,082, 2.8% | 140200, n=25,857, 14.1% | 108140, n=38,741, 21.1% | <108, n=27,603, 15.0% | Unknown, n=53,392, 29.1% | |
| ||||||
| Age, y, mean (SD) | 65.8 (14.1) | 64.3 (17.0)a | 63.9 (17.3)a | 60.9 (18.6)a | 54.3 (19.7)a | 54.8 (16.9)a |
| Risk‐adjusted mortality at admission, mean (SD) | 0.08 (0.12) | 0.09 (0.12)a | 0.07 (0.10)a | 0.05 (0.09)a | 0.04 (0.07)a | 0.01 (0.04)a |
| Sex, male, no. (%) | 18,200 (55.5) | 2,610 (51.4)a | 13,477 (52.1)a | 19,495 (50.3)a | 12,907 (46.8)a | 22,951 (43.0)a |
| No. of previous inpatient admissions, 6 months (%) | ||||||
| 0 | 22,780 (69.5) | 3,576 (70.4) | 19,118 (73.9)a | 28,827 (74.4)a | 20,354 (73.7)a | 43,317 (81.1)a |
| 1 | 6,470 (19.7) | 962 (18.9) | 4,484 (17.3)a | 6,526 (16.9)a | 4,744 (17.2)a | 7,360 (13.8)a |
| 2+ | 3,524 (10.8) | 544 (10.7) | 2,255 (8.7)a | 3,388 (9.1)a | 2,505 (9.1)a | 2,715 (5.1)a |
| No. of previous emergency admissions (6 months) (%) | ||||||
| 0 | 15,518 (47.4) | 2,638 (51.9)a | 12,681 (49.0)a | 16,584 (42.8)a | 13,039 (47.2) | 43,112 (80.8)a |
| 1 | 9,665 (29.5) | 1,490 (29.3)a | 8,339 (32.3)a | 13,829 (35.7)a | 8,709 (31.6) | 6,533 (12.2)a |
| 2+ | 7,591 (23.2) | 954 (18.8)a | 4,837 (18.7)a | 8,328 (21.5)a | 5,855 (21.2) | 3,747 (7.0)a |
| Emergency admission at index hospitalization (%) | 25,420 (77.6) | 4,178 (82.2)a | 20,284 (78.5)a | 33,282 (85.9)a | 23,598 (85.5)a | 15,039 (28.2)a |
| Length of stay, d (mean/SD) | 12.4 (22.3) | 15.8 (30.0)a | 11.9 (17.1)a | 8.5 (12.2)a | 6.3 (9.5)a | 3.4 (4.9)a |
| Disease at index hospitalization (%) | ||||||
| PVD | 2,783 (8.5) | 257 (5.1)a | 1,387 (5.4)a | 1,372 (3.5)a | 908 (3.3)a | 965 (1.8)a |
| Pneumonia | 3,308 (10.1) | 658 (13.0)a | 2,577 (10.0) | 2,809 (7.3)a | 1,220 (4.4)a | 399 (0.8)a |
| UTI | 3,549 (10.8) | 665 (13.1)a | 2,660 (10.3)a | 3,336 (8.6)a | 1,559 (5.7)a | 929 (1.7)a |
| IHD | 8,957 (27.3) | 1,086 (21.4)a | 4,714 (18.2)a | 5,306 (13.7)a | 3,100 (11.2)a | 2,842 (5.3)a |
| Hypertension | 10,864 (33.2) | 1,115 (21.9)a | 5,155 (19.9)a | 5,880 (15.2)a | 3,045 (11.0)a | 3,211 (6.0)a |
| Arrhythmia | 5,010 (15.3) | 823 (16.2) | 3,768 (14.6)a | 3,718 (9.6)a | 2,046 (7.4)a | 1,172 (2.2)a |
| CHF | 570 (17.5) | 763 (15.0)a | 2,761 (10.7)a | 2,449 (6.3)a | 1,121 (4.1)a | 386 (0.7)a |
| Diagnoses of diabetes in the next year (%) | 126 (2.5) | 368 (1.4) | 370 (1.0) | 215 (0.8) | 540 (1.0) | |
| Diagnoses of diabetes in the next 5 years (%) | 310 (6.1) | 981 (3.8) | 916 (2.4) | 434 (1.7) | 1,317 (2.5) | |
| First 3 most common primary discharge codes | AHD I251 (5.7%), HF I50 (3.1%), NSTEMI I214 (1.6%) | AHD I251 (2.7%), COPD J441 (2.1%), HF I50 (2.0%) | AHD I251 (4.0%), Pneumonia J189 (1.6%), HF I50 (1.5%) | AHD I251 (1.6%), Pneumonia J189 (1.5%), CA D700 (1.3%) | AHD I251 (1.8%), AA K359 (1.7%), UA I200 (1.2%) | OA M171 (2.3%), AHD I251 (2.2%), OA M170 (1.7%) |
Of the 5082 patients classified with a peak serum glucose measurement >200 mg/dL (11.1 mmol/L), 15% had 2 and 8% had more than 2 serum glucose measurements that exceeded this threshold. For the remaining patients (with 1 peak serum glucose measurement >200 mg/dL), 52% had additional serum glucose measurements over 140 mg/dL (7.8 mmol/L).
Table 2 presents crude 1‐ and 5‐year mortality and morbidity rates by patient group. The mortality rate is the percentage of patients who died within 1 year and 5 years of their index admission, with or without developing a CV complication. Morbidity rate describes the percentage who developed the complication among patients who survived after discharge or developed the complication prior to death within a 1‐year and 5‐year period. During the 1‐year follow‐up period, the crude mortality rate among patients with elevated peak serum glucose was higher than all other groups (25.4% vs 20.6% for diagnosed diabetes and 7.4% to 22.5% for other peak serum glucose levels; all P<0.0001). For the 5‐year follow‐up, the gap between patients with elevated peak serum glucose and those with diagnosed diabetes lessened but remained significant (45.1% vs 41.7%; P<0.0001). In the 1‐year follow‐up, patients with diagnosed diabetes had significantly higher morbidity rates than all other groups except for AMI. The difference in the rate of AMI for diagnosed diabetes and patients with elevated glucose was not statistically significant.
| Diagnosed Diabetes, n=32,774 | Serum Glucose Level (mg/dL) | |||||
|---|---|---|---|---|---|---|
| >200, n=5,082 | 140200, n=25,857 | 108140, n=38,741 | <108, n=27,603 | Unknown, n=53,392 | ||
| ||||||
| All‐cause death | ||||||
| 1 year | 6,762 (20.6) | 1,293 (25.4)a | 5,309 (20.5) | 7,212 (18.6)a | 4,178 (15)a | 3,969 (7.4)a |
| 5 years | 13,659 (41.7) | 2,292 (45.1)a | 9,871 (38.2)a | 13,256 (34.2)a | 7,606 (27.6)a | 98,614 (16.1)a |
| AMI | ||||||
| 1 year | 728 (2.8) | 104 (2.7) | 326 (1.6)a | 386 (1.2)a | 172 (0.7)a | 218 (0.4)a |
| 5 years | 1,687 (8.4) | 182 (6.3)a | 687 (4.2)a | 837 (3.2)a | 436 (2.2)a | 633 (1.4)a |
| CVD | ||||||
| 1 year | 582 (2.2) | 71 (1.9) | 306 (1.5)a | 403 (1.3)a | 251 (1.1)a | 195 (0.4)a |
| 5 years | 1,153 (5.8) | 143 (5.0) | 623 (3.8)a | 872 (3.4)a | 470 (2.3)a | 534 (1.2)a |
| CHF | ||||||
| 1 year | 2,260 (8.4) | 245 (6.3)a | 870 (4.2)a | 1,023 (3.2)a | 516 (2.2)a | 362 (0.7)a |
| 5 years | 3,830 (17.7) | 395 (12.9)a | 1,529 (9.0)a | 1,802 (6.8)a | 960 (4.7)a | 884 (2.0)a |
| PVD | ||||||
| 1 year | 795 (3.0) | 24 (0.6)a | 114 (0.6)a | 154 (0.5)a | 97 (0.4)a | 141 (0.3)a |
| 5 years | 1,547 (7.8) | 50 (1.8)a | 220 (1.4)a | 275 (1.1)a | 192 (1.0)a | 295 (0.7)a |
| ESRD | ||||||
| 1 year | 953 (3.6) | 104 (2.7)a | 403 (1.9)a | 457 (1.4)a | 311 (1.3)a | 329 (0.7)a |
| 5 years | 1,938 (9.5) | 183 (6.3)a | 807 (4.9)a | 995 (3.8)a | 611 (3.0)a | 771 (1.7)a |
The 1‐year adjusted hazard ratios for mortality and CV complications are presented in Figure 1. After adjustment for baseline demographics and clinical and hospital factors, having a peak serum glucose level above 200 mg/dL (11.1 mmol/L) was an independent predictor of death. The mortality risk for this group in the year following discharge was 31% higher than patients with diagnosed diabetes (adjusted HR: 1.31, 95% CI: 1.20‐1.43). There was no mortality risk difference between the group with diagnosed diabetes and the lower peak serum glucose levels (adjusted HR: 1.05, 95% CI: 0.99‐1.11), 108160 mg/dL (6.07.8 mmol/L) (adjusted HR: 1.02, 95% CI: 0.971.07); and <108 mg/dL (<6.0 mmol/L) (adjusted HR: 0.97, 95% CI: 0.921.03). Adjusted HRs, with 95% CIs and P values for 5‐year follow‐up are presented in Figure 2.
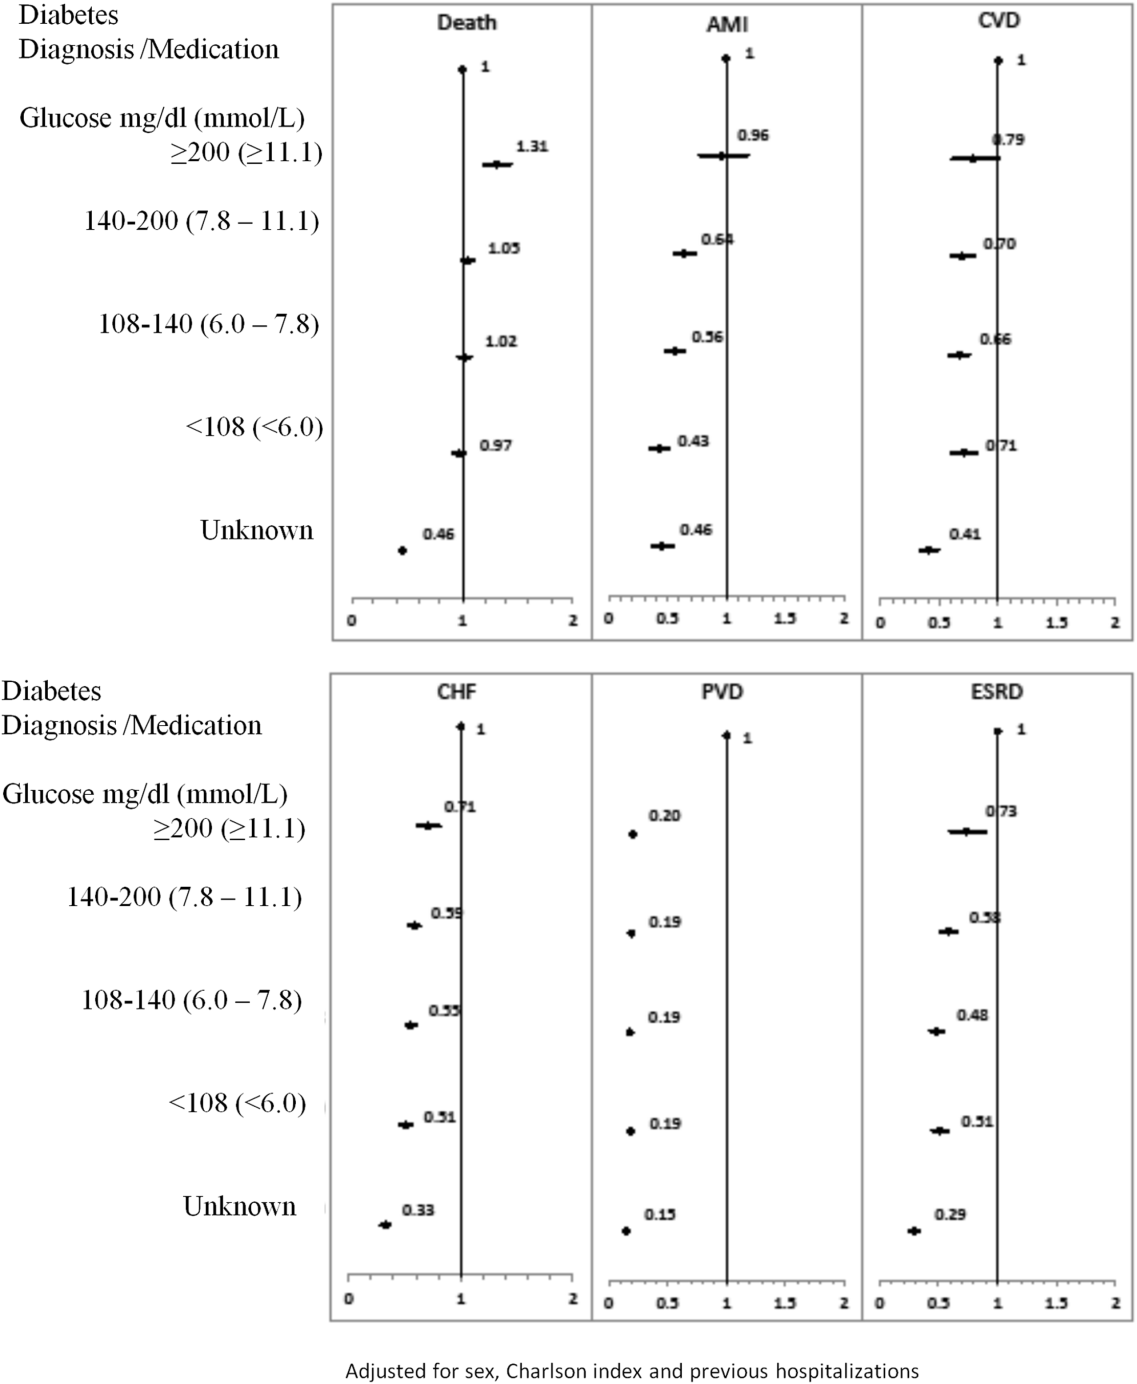
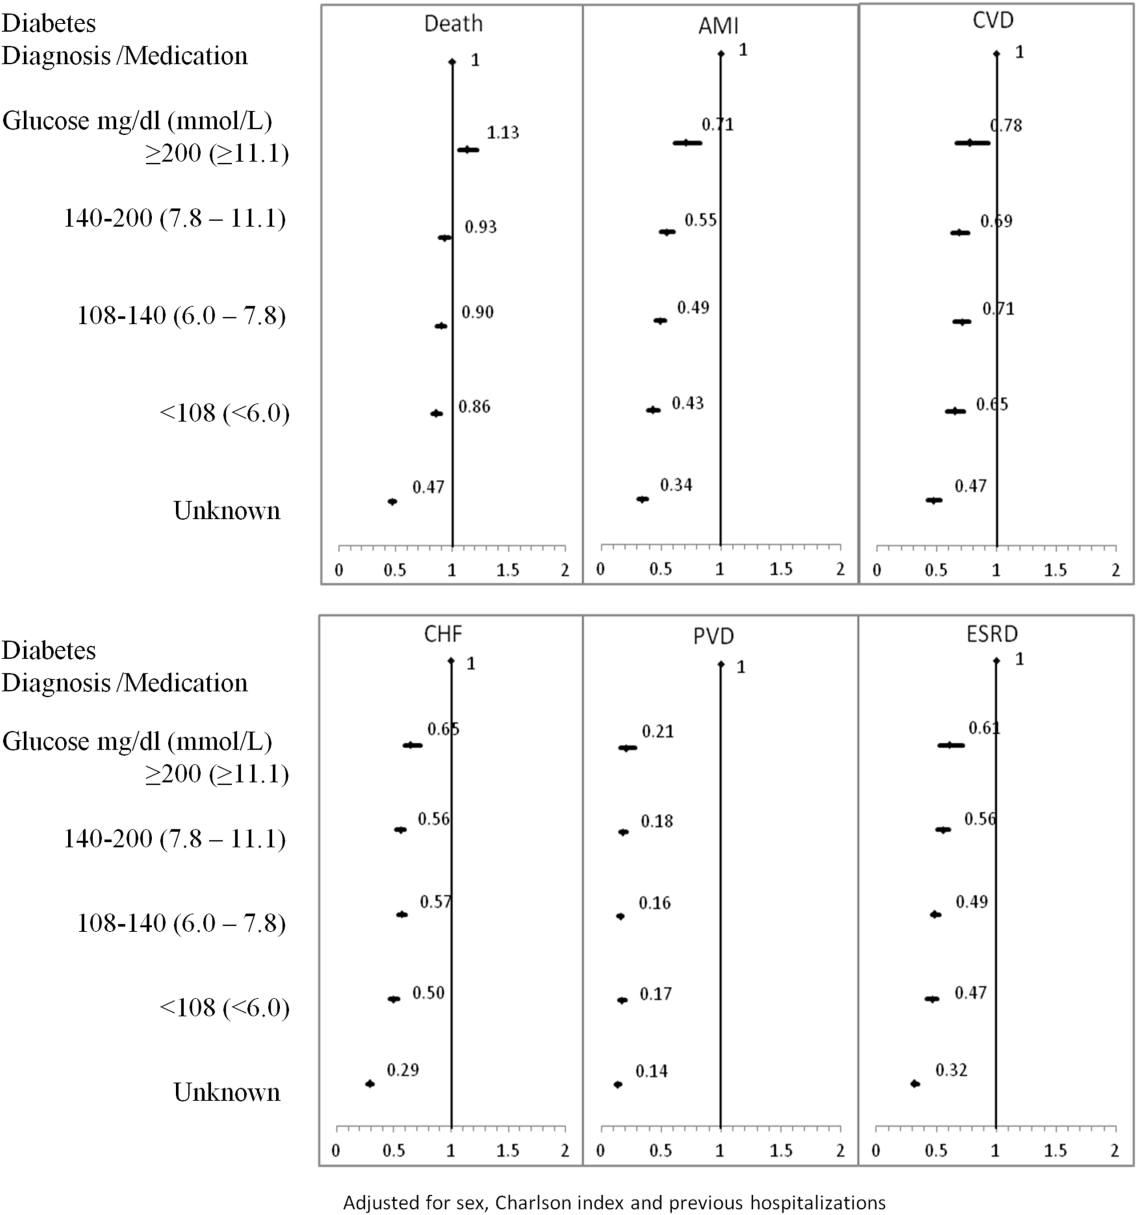
Adjusted hazard ratios for morbidity showed a different pattern. Patients with diagnosed diabetes had a higher risk of developing complications in the year following discharge from the hospital (Figure 1). After adjusting for potential confounders, we found that patients with diagnosed diabetes had the same risk of AMI and CVD as patients with peak serum glucose levels above 200 mg/dL (11.1 mmol/L) (AMI, adjusted HR: 0.96; 95% CI: 0.78‐1.18; CVD, adjusted HR: 0.79; 95% CI: 0.61‐1.00) but a 36% to 57% higher AMI risk and 29% to 34% higher CVD risk than other peak serum glucose level groups. Compared to all peak serum glucose groups, patients with diagnosed diabetes had a significantly higher risk of developing CHF, PVD, and ESRD (Figure 1). Similarly, the 5‐year risk of AMI, CVD, CHF, PVD, and ESRD was higher for patients with diagnosed diabetes compared to all peak serum glucose groups (Figure 2).
CONCLUSION/DISCUSSION
The study found that in‐hospital hyperglycemia was a strong predictor of mortality at 1‐ and 5‐years follow‐up, even after adjustment using well‐established and discriminating comorbidity measures. Extreme in‐hospital hyperglycemia was a stronger predictor of mortality than diagnosed diabetes.
Previous studies have shown that diabetes and stress hyperglycemia among hospitalized patients are important markers for poor clinical outcomes and in‐hospital mortality.[1, 2, 4] This study indicates that hospitalized patients with extreme hyperglycemia (peak serum glucose >200 mg/dL) were at a high risk of death for at least 5 years following discharge.
These findings, based on a large general sample of hospitalized patients, indicate that the extreme elevations in peak serum glucose convey a risk for all hospitalized patients, not only those with critical illness.[3, 18] Hyperglycemia appears to be an independent indicator of mortality risk and should be evaluated as a potential component within risk prediction tools. Further study is required to determine mechanisms for this risk association to identify what therapies, if any, might be used to minimize this risk.
The diagnosed diabetes group, which likely included some patients who also had extreme in‐hospital hyperglycemia, had a lower 1‐year risk of death than patients with hyperglycemia who did not have diabetes diagnosis. This may be an indication of the protective effect of blood glucose control, because patients with diabetes are more likely to receive therapy for hyperglycemia during and after hospitalization.
Classification of patients by several serum glucose levels (as opposed to a dichotomous classification, where hyperglycemia is either present or absent), showed that hyperglycemia constitutes a graded risk[5] for almost all outcomes examined, particularly mortality, AMI, and CVD.
Previous studies indicate that diabetes is observed in only 23% to 35% of hospitalized patients with hyperglycemia.[18, 19] We would expect higher risk for CV complications for patients with elevated glucose if the proportion of these patients who had undiagnosed diabetes was higher than the proportion estimated in the literature. However, we observed lower risk of CV complications (especially PVD and ESRD) for the elevated glucose group in the 1 and 5 years following discharge. In‐hospital hyperglycemia is not equivalent to undiagnosed diabetes.
There are several potential limitations in this study. The first is our method for ascertaining CV complications. Diverse disease definitions are used in medical literature, and similar studies using different definitions may yield different results, though we would not expect to find a wide range of variation. Second, our study did not include information about severity of diabetes and the persistence of elevated glucose; if available, this knowledge may provide better insight into patient experiences, especially in long‐term follow‐up. Third, results are also limited by the absence of data on cause of death, a potentially helpful means of identifying posthospitalization difficulties experienced by patients with hyperglycemia. Fourth, this study mainly compares experiences of patients with elevated peak serum glucose level to diabetes patients; it would be worthwhile to explore the impact of lower gradations of glucose levels.
We would like to emphasize that we did not confirm diabetes diagnosis following discharge for patients with hyperglycemia. However, we did not observe a high rate of complications at 5‐year follow‐up, particularly for ESRD. This may be because most patients with in‐hospital elevated glucose had early diabetes or transient hyperglycemia and therefore lower risk of long‐term diabetes‐specific consultations.
Hyperglycemia is an important independent indicator, carrying a greater risk for 1‐ and 5‐year mortality than diagnosed diabetes. However, it is unclear whether hospitalized patients with elevated peak serum glucose have early diabetes or their hyperglycemia reflects hospital stress or another comorbidity concept.
Acknowledgements
The authors are grateful to Amy Zierler and Allison Whalen O'Connor for their editorial assistance. This study was supported by the Institute for Clinical Evaluative Sciences (ICES), which is funded by an annual grant from the Ontario Ministry of Health and Long‐Term Care (MOHLTC). The opinions, results and conclusions reported in this paper are those of the authors and are independent from the funding sources. No endorsement by ICES or the Ontario MOHLTC is intended or should be inferred.
Disclosure: Nothing to report.
- , , , et al. Management of diabetes and hyperglycemia in hospitals. Diabetes Care. 2004;27(2):553–591.
- , , , et al. American Association of Clinical Endocrinologists and American Diabetes Association consensus statement on inpatient glycemic control. Diabetes Care. 2009;32(6):1119–1131.
- The NICE‐SUGAR Study Investigators. Intensive versus conventional glucose control in critically ill patients. N Engl J Med. 2009;360(13):1283–1297.
- , , , , , . Hyperglycemia: an independent marker of in‐hospital mortality in patients with undiagnosed diabetes. J Clin Endocrinol Metab. 2002;87(3):978–982.
- , , , , . Hyperglycemia‐related mortality in critically ill patients varies with admission diagnosis. Crit Care Med. 2009;37(12):3001–3009.
- , . Hospital management of hyperglycemia. Curr Opin Endocrinol Diabetes Obes. 2011;18(2):110–118.
- , , , et al. IScore: a risk score to predict death early after hospitalization for an acute ischemic stroke. Circulation. 2011;123(7):739–749.
- , . Does Stress‐induced hyperglycemia increase the risk of perioperative infectious complications in orthopaedic trauma patients? J Orthop Trauma. 2010;24(12):752–756.
- . Metabolic mechanisms of stress hyperglycemia. J Parenter Enteral Nutr. 2006;30(2):157–163.
- , , . Temporal changes in the outcomes of acute myocardial infarction in Ontario, 1992–1996. CMAJ. 1999;161(10):1257–1261.
- , , , et al. The accuracy of using integrated electronic health care data to identify patients with undiagnosed diabetes mellitus. J Eval Clin Pract. 2012;18(3):606–611.
- American Diabetes Association. Diagnosis and classification of diabetes mellitus. Diabetes Care. 2006;29(suppl 1):s43–s48.
- . Dealing with competing risks: testing covariates and calculating sample size. Stat Med. 2002;21(22):3317–3324.
- , , , . Competing risk analysis of events 10 years after revascularization. Scand Cardiovasc J. 2010;44(5):279–288.
- , , , , , . Risk‐adjusting hospital inpatient mortality using automated inpatient, outpatient, and laboratory databases. Med Care. 2008;46(3):232–239.
- , , , . The Kaiser Permanente inpatient risk adjustment methodology was valid in an external patient population. J Clin Epidemiol. 2010;63(7):798–803.
- , , , . Improved comorbidity adjustment for predicting mortality in medicare populations. Health Serv Res. 2003;38(4):1103–1120.
- , , , et al. Glucose metabolism in patients with acute myocardial infarction and no previous diagnosis of diabetes mellitus: a prospective study. Lancet. 2002;359(9324):2140–2144.
- , , , et al. Disorders of glucose metabolism in acute stroke patients: an underrecognized problem. Diabetes Care. 2006;29(4):792–797.
Hyperglycemia in hospitalized patients is frequently observed and is recognized as an important threat to the health of patients with varying levels of illness, independent of diabetes status.[1, 2, 3, 4] Previous studies have found that in‐hospital hyperglycemia is associated with higher short‐term mortality rates,[5, 6, 7] longer lengths of stay, and higher rates of admission to intensive care units.[4]
In‐hospital hyperglycemia may be the result of diabetes mellitus or stress associated with hospitalization. The mechanism of stress hyperglycemia differs from diabetic hyperglycemia and can occur independently of diabetes status.[8] Stress hyperglycemia is characterized by rapid onset of insulin resistance, which normally takes months or years in diabetes mellitus. It develops in association with or because of other stressor such as infection or inflammatory processes.[9]
To our knowledge, no long‐term follow‐up study on hospitalized patients with elevated glucose levels but without a diabetes diagnosis has ever been conducted. In this study, we measured the 1‐ and 5‐year risk of mortality and diabetes‐related diseases for hospitalized patients with a diabetes diagnosis compared with patients grouped according to their peak in‐hospital serum glucose level. Our primary comparison was between patients with diagnosed diabetes and those with peak serum glucose >200 mg/dL (11.1 mmol/L), but we also examined 4 other categories of peak serum glucose: 140 to 200 mg/dL (7.811.1 mmol/L), 108 to 140 mg/dL (6.07.8 mmol/L), and <108 mg/dL (<6.0 mmol/L).
METHODS
Study Base
The study included all adult patients (excluding patients admitted to psychiatry and obstetrics) admitted to The Ottawa Hospital (TOH) between January 1, 1996 and March 31, 2008 and discharged alive. Included patients were 18 years or older and had complete medical record abstracts. TOH is the primary hospital in Ottawa, Ontario, Canada, and the main tertiary hospital in the Champlain Local Health Integration Network, the public healthcare authority for the Ottawa region. This study was approved by The Ottawa Hospital Research Ethics Board.
Data Sources
The Ottawa Hospital Data Warehouse (OHDW) is a repository for data from the hospital's patient information systems. These systems include patient registration information, discharge abstract, and laboratory, pharmacy, and radiology results. OHDW was used to determine each patient's age, gender, diagnoses, pharmacy orders, laboratory test results, in‐hospital comorbidities, most responsible hospital service, and admission urgency.
This dataset was linked to 3 population‐based administrative datasets and 1 derived cohort. Ontario's Registered Persons Database (RPDB) is a population‐based registry containing date of death (if applicable) as well as eligibility status for the provincial universal health insurance program, the Ontario Health Insurance Plan (OHIP).[10] The OHIP database records billing claims submitted by approximately 95% of Ontario physicians. Each claim contains a fee code describing the type of service provided and a location denoting where the service had taken place. The Canadian Institute for Health Information Discharge Abstract Database (DAD) records clinical, demographic, and administrative data for all hospital admissions and same‐day surgeries for all Ontario acute care hospitals since April 1, 1988. The Ontario Myocardial Infarction Database (OMID) contains records of all patients with a most responsible diagnosis of acute myocardial infarction (AMI) (International Classification of Diseases, 9th Revision [ICD‐9] code 410 or International Classification of Diseases, 10th Revision [ICD‐10] code I21) identified from the DAD. Details on the creation of the OMID are provided in an earlier study.[10]
Variable Definitions
We identified the index admission of the TOH cohort in the DAD using a unique encrypted health insurance number, admission and discharge dates, and the institution number. To avoid double counting, patients with the same encrypted health insurance number who were discharged from an institution and admitted to another within 2 days were classified as transfers and counted as 1 hospitalization.
Diabetes and cardiovascular (CV) complications (acute myocardial infarction [AMI], congestive heart failure [CHF], cardiovascular disease [CVD], peripheral vascular disease [PVD], and end‐stage renal disease [ESRD]) were identified in the discharge abstract as the most responsible diagnosis for the admission as well as postadmission comorbidities. The discharge abstract records diagnostic codes according to ICD‐9 (April 1, 1988March 31, 2002) or ICD‐10 (April 1, 2002March 1, 2009).
Each hospitalization was classified into 1 of 6 mutually exclusive diabetes status categories based on diagnostic codes, serum glucose test results, and pharmacy records. The diagnosed diabetes group included hospitalizations with any diagnostic code of diabetes in the discharge abstract or any order for a diabetes medication during hospitalization. Eligible medications included acarbose, acetohexamide, chlorpropamide, glibenclamide, gliclazide, glimepiride, glipizide, glyburide, insulin, metformin, nateglinide, pioglitazone, repaglinide, rosiglitazone, and tolbutamide. A chart validation study showed excellent ascertainment of diabetes status using these methods (correct classification 88.8%; 95% confidence interval [CI]: 85.791.3 with weighted kappa=0.89; 95% CI: 0.85‐0.92).[11, 12] Patients without diagnosed diabetes were classified according to their peak serum glucose value during the index hospitalization: <108 mg/dL (<6.0 mmol/L), 108 to 140 mg/dL (6.07.8 mmol/L), 140 to 200 mg/dL (7.811.1 mmol/L), >200 mg/dL (>11.1 mmol/L); hospitalizations in which glucose levels were not obtained were classified as unknown. These peak serum glucose categories are based on the World Health Organization's definition of diabetes and poor glucose tolerance.[12]
Outcomes
The primary outcome was all‐cause postdischarge mortality determined by linking the index admission to the RPDB. Secondary outcomes were CV complications, including: AMI (determined by linking to the OMID); hospitalization for CHF (determined by linking to the DAD for primary diagnosis of 425, 428, 514, 518.4 or I50, I42.0, I42.6, I42.7, I42.8, I42.9, I43, J81), CVD (determined by linking to the DAD for primary diagnosis of 430, 431, 432, 434, 436 or I60, I61, I62, I63, I64, G46), PVD (determined by primary diagnosis of 96.11, 96.12, 96.13, 96.14, 96.15 [excluded if in conjunction with 170, 171, 213, 730, 740759, 800900, 901904, 940950], 50.18, 51.25, 51.29 [excluded if in conjunction with 414.1, 441, 44] or 1VC93, 1VG93, 1VQ93, 1WA93, 1WE93, 1WJ93, 1WL93, 1WM93 [excluded if in conjunction with C40, C41, C46.1, C47, C49, D160, M46.2, M86, M87, M89.6, M90.0‐M90.5, Q00, Q38‐Q40, S02.0, S09.0, S04.0, S15, S25, T26), and 1KG50, 1KG57, 1KG76, 1KG35HAC1, 1KG35HHC1 [excluded if in conjunction with I60, I67.1, I71, I72, 177.0, 179.0]), and ESRD (determined by 403.9, 404.9,584, 585, 586, 788.5 or I12, I13, N17, N18, N19, R34).
Analysis
We identified all encounters of cohort patients in any Ontario acute‐care hospital within 5 years following the index discharge. Patients not covered by provincial health insurance (OHIP) were excluded.
We first measured crude mortality and morbidity rates by patient category (diagnosed diabetes and glucose levels). Next, we compared the unadjusted outcomes and baseline characteristics (age, sex, previous inpatient and emergency admissions, and disease at admission) between groups using a [2] test for categorical variables and analysis of variance for continuous variables.
Due to the violation of proportional hazards, we used the Weibull accelerated failure time model to calculate the hazard of death associated with diabetes status or serum glucose level. Consistency of the probability plots confirmed appropriateness of using the Weibull function. Competing risk is defined as a type of failure that prevents the observation of the event of interest or fundamentally alters the probability of its occurrence.[13, 14] In the comorbidity analyses, death is a competing risk for all other outcomes. We calculated the multivariate competing risk hazard for each outcome of interest except death. Each model was adjusted for potential confounders: baseline risk of in‐hospital mortality, common comorbidities, most responsible hospital service, and the number of previous inpatient admissions and emergency department visits to TOH in the previous 6 months. The probability of dying during the admission was calculated using the Escobar model, which predicts the in‐hospital probability of dying using data available at the time of admission to the hospital.[15] The Escobar model has been validated in the study population.[16] The baseline probability of dying was based on age, sex, acuity of admission, primary condition, Charlson comorbidity score,[17] and the laboratory‐based acute physiology score.[15] The Charlson comorbidity score was calculated using weights from Schneeweiss et al.[17] Kaplan‐Meier survival curves were created for both adjusted and unadjusted models. Death was used as the main censoring variable when analyzing nonfatal outcomes at 1‐ and 5‐year follow‐up.
Adjusted models were constructed using a stepwise selection technique and compared with Akaike and Bayesian information criteria values. For all tests, significance was defined as a P value of 0.05 or less.
We recognize that the cohort may contain more than 1 index hospitalization per patient. However, repeated analyses using only the first or last encounter per patient produced nearly identical hazard ratios (HRs) and CIs.
RESULTS
Between January 1, 1996 and March 31, 2008, 194,641 nonpsychiatric and nonobstetric adults were admitted to TOH. Seventeen patients were excluded because they were ineligible for healthcare coverage and had no encounter with the Ontario healthcare system following discharge from hospital, and 11,175 of the admissions ended in death. The final cohort consisted of 114,764 unique individuals representing 183,449 encounters.
Patients had a mean age of 59.5 years (standard deviation: 18.0) and 48.9% were male. The baseline risk of dying during hospitalization was 4.8%.
Table 1 describes patients by diabetes and peak serum glucose status. Patients with diagnosed diabetes were more likely to be older and male. Patients with elevated peak serum glucose (>200 mg/dL; >11.1 mmol/L) were younger than the diagnosed diabetes group and had a higher baseline probability of in‐hospital death (9.4%, 95% CI: 9.09.7). Patients in these 2 groups had more inpatient admissions within the previous 6 months compared to the groups with other peak serum glucose values.
| Serum Glucose Level, mg/dL | ||||||
|---|---|---|---|---|---|---|
| Diagnosed Diabetes, n=32,774, 17.9% | >200, n=5,082, 2.8% | 140200, n=25,857, 14.1% | 108140, n=38,741, 21.1% | <108, n=27,603, 15.0% | Unknown, n=53,392, 29.1% | |
| ||||||
| Age, y, mean (SD) | 65.8 (14.1) | 64.3 (17.0)a | 63.9 (17.3)a | 60.9 (18.6)a | 54.3 (19.7)a | 54.8 (16.9)a |
| Risk‐adjusted mortality at admission, mean (SD) | 0.08 (0.12) | 0.09 (0.12)a | 0.07 (0.10)a | 0.05 (0.09)a | 0.04 (0.07)a | 0.01 (0.04)a |
| Sex, male, no. (%) | 18,200 (55.5) | 2,610 (51.4)a | 13,477 (52.1)a | 19,495 (50.3)a | 12,907 (46.8)a | 22,951 (43.0)a |
| No. of previous inpatient admissions, 6 months (%) | ||||||
| 0 | 22,780 (69.5) | 3,576 (70.4) | 19,118 (73.9)a | 28,827 (74.4)a | 20,354 (73.7)a | 43,317 (81.1)a |
| 1 | 6,470 (19.7) | 962 (18.9) | 4,484 (17.3)a | 6,526 (16.9)a | 4,744 (17.2)a | 7,360 (13.8)a |
| 2+ | 3,524 (10.8) | 544 (10.7) | 2,255 (8.7)a | 3,388 (9.1)a | 2,505 (9.1)a | 2,715 (5.1)a |
| No. of previous emergency admissions (6 months) (%) | ||||||
| 0 | 15,518 (47.4) | 2,638 (51.9)a | 12,681 (49.0)a | 16,584 (42.8)a | 13,039 (47.2) | 43,112 (80.8)a |
| 1 | 9,665 (29.5) | 1,490 (29.3)a | 8,339 (32.3)a | 13,829 (35.7)a | 8,709 (31.6) | 6,533 (12.2)a |
| 2+ | 7,591 (23.2) | 954 (18.8)a | 4,837 (18.7)a | 8,328 (21.5)a | 5,855 (21.2) | 3,747 (7.0)a |
| Emergency admission at index hospitalization (%) | 25,420 (77.6) | 4,178 (82.2)a | 20,284 (78.5)a | 33,282 (85.9)a | 23,598 (85.5)a | 15,039 (28.2)a |
| Length of stay, d (mean/SD) | 12.4 (22.3) | 15.8 (30.0)a | 11.9 (17.1)a | 8.5 (12.2)a | 6.3 (9.5)a | 3.4 (4.9)a |
| Disease at index hospitalization (%) | ||||||
| PVD | 2,783 (8.5) | 257 (5.1)a | 1,387 (5.4)a | 1,372 (3.5)a | 908 (3.3)a | 965 (1.8)a |
| Pneumonia | 3,308 (10.1) | 658 (13.0)a | 2,577 (10.0) | 2,809 (7.3)a | 1,220 (4.4)a | 399 (0.8)a |
| UTI | 3,549 (10.8) | 665 (13.1)a | 2,660 (10.3)a | 3,336 (8.6)a | 1,559 (5.7)a | 929 (1.7)a |
| IHD | 8,957 (27.3) | 1,086 (21.4)a | 4,714 (18.2)a | 5,306 (13.7)a | 3,100 (11.2)a | 2,842 (5.3)a |
| Hypertension | 10,864 (33.2) | 1,115 (21.9)a | 5,155 (19.9)a | 5,880 (15.2)a | 3,045 (11.0)a | 3,211 (6.0)a |
| Arrhythmia | 5,010 (15.3) | 823 (16.2) | 3,768 (14.6)a | 3,718 (9.6)a | 2,046 (7.4)a | 1,172 (2.2)a |
| CHF | 570 (17.5) | 763 (15.0)a | 2,761 (10.7)a | 2,449 (6.3)a | 1,121 (4.1)a | 386 (0.7)a |
| Diagnoses of diabetes in the next year (%) | 126 (2.5) | 368 (1.4) | 370 (1.0) | 215 (0.8) | 540 (1.0) | |
| Diagnoses of diabetes in the next 5 years (%) | 310 (6.1) | 981 (3.8) | 916 (2.4) | 434 (1.7) | 1,317 (2.5) | |
| First 3 most common primary discharge codes | AHD I251 (5.7%), HF I50 (3.1%), NSTEMI I214 (1.6%) | AHD I251 (2.7%), COPD J441 (2.1%), HF I50 (2.0%) | AHD I251 (4.0%), Pneumonia J189 (1.6%), HF I50 (1.5%) | AHD I251 (1.6%), Pneumonia J189 (1.5%), CA D700 (1.3%) | AHD I251 (1.8%), AA K359 (1.7%), UA I200 (1.2%) | OA M171 (2.3%), AHD I251 (2.2%), OA M170 (1.7%) |
Of the 5082 patients classified with a peak serum glucose measurement >200 mg/dL (11.1 mmol/L), 15% had 2 and 8% had more than 2 serum glucose measurements that exceeded this threshold. For the remaining patients (with 1 peak serum glucose measurement >200 mg/dL), 52% had additional serum glucose measurements over 140 mg/dL (7.8 mmol/L).
Table 2 presents crude 1‐ and 5‐year mortality and morbidity rates by patient group. The mortality rate is the percentage of patients who died within 1 year and 5 years of their index admission, with or without developing a CV complication. Morbidity rate describes the percentage who developed the complication among patients who survived after discharge or developed the complication prior to death within a 1‐year and 5‐year period. During the 1‐year follow‐up period, the crude mortality rate among patients with elevated peak serum glucose was higher than all other groups (25.4% vs 20.6% for diagnosed diabetes and 7.4% to 22.5% for other peak serum glucose levels; all P<0.0001). For the 5‐year follow‐up, the gap between patients with elevated peak serum glucose and those with diagnosed diabetes lessened but remained significant (45.1% vs 41.7%; P<0.0001). In the 1‐year follow‐up, patients with diagnosed diabetes had significantly higher morbidity rates than all other groups except for AMI. The difference in the rate of AMI for diagnosed diabetes and patients with elevated glucose was not statistically significant.
| Diagnosed Diabetes, n=32,774 | Serum Glucose Level (mg/dL) | |||||
|---|---|---|---|---|---|---|
| >200, n=5,082 | 140200, n=25,857 | 108140, n=38,741 | <108, n=27,603 | Unknown, n=53,392 | ||
| ||||||
| All‐cause death | ||||||
| 1 year | 6,762 (20.6) | 1,293 (25.4)a | 5,309 (20.5) | 7,212 (18.6)a | 4,178 (15)a | 3,969 (7.4)a |
| 5 years | 13,659 (41.7) | 2,292 (45.1)a | 9,871 (38.2)a | 13,256 (34.2)a | 7,606 (27.6)a | 98,614 (16.1)a |
| AMI | ||||||
| 1 year | 728 (2.8) | 104 (2.7) | 326 (1.6)a | 386 (1.2)a | 172 (0.7)a | 218 (0.4)a |
| 5 years | 1,687 (8.4) | 182 (6.3)a | 687 (4.2)a | 837 (3.2)a | 436 (2.2)a | 633 (1.4)a |
| CVD | ||||||
| 1 year | 582 (2.2) | 71 (1.9) | 306 (1.5)a | 403 (1.3)a | 251 (1.1)a | 195 (0.4)a |
| 5 years | 1,153 (5.8) | 143 (5.0) | 623 (3.8)a | 872 (3.4)a | 470 (2.3)a | 534 (1.2)a |
| CHF | ||||||
| 1 year | 2,260 (8.4) | 245 (6.3)a | 870 (4.2)a | 1,023 (3.2)a | 516 (2.2)a | 362 (0.7)a |
| 5 years | 3,830 (17.7) | 395 (12.9)a | 1,529 (9.0)a | 1,802 (6.8)a | 960 (4.7)a | 884 (2.0)a |
| PVD | ||||||
| 1 year | 795 (3.0) | 24 (0.6)a | 114 (0.6)a | 154 (0.5)a | 97 (0.4)a | 141 (0.3)a |
| 5 years | 1,547 (7.8) | 50 (1.8)a | 220 (1.4)a | 275 (1.1)a | 192 (1.0)a | 295 (0.7)a |
| ESRD | ||||||
| 1 year | 953 (3.6) | 104 (2.7)a | 403 (1.9)a | 457 (1.4)a | 311 (1.3)a | 329 (0.7)a |
| 5 years | 1,938 (9.5) | 183 (6.3)a | 807 (4.9)a | 995 (3.8)a | 611 (3.0)a | 771 (1.7)a |
The 1‐year adjusted hazard ratios for mortality and CV complications are presented in Figure 1. After adjustment for baseline demographics and clinical and hospital factors, having a peak serum glucose level above 200 mg/dL (11.1 mmol/L) was an independent predictor of death. The mortality risk for this group in the year following discharge was 31% higher than patients with diagnosed diabetes (adjusted HR: 1.31, 95% CI: 1.20‐1.43). There was no mortality risk difference between the group with diagnosed diabetes and the lower peak serum glucose levels (adjusted HR: 1.05, 95% CI: 0.99‐1.11), 108160 mg/dL (6.07.8 mmol/L) (adjusted HR: 1.02, 95% CI: 0.971.07); and <108 mg/dL (<6.0 mmol/L) (adjusted HR: 0.97, 95% CI: 0.921.03). Adjusted HRs, with 95% CIs and P values for 5‐year follow‐up are presented in Figure 2.
Adjusted hazard ratios for morbidity showed a different pattern. Patients with diagnosed diabetes had a higher risk of developing complications in the year following discharge from the hospital (Figure 1). After adjusting for potential confounders, we found that patients with diagnosed diabetes had the same risk of AMI and CVD as patients with peak serum glucose levels above 200 mg/dL (11.1 mmol/L) (AMI, adjusted HR: 0.96; 95% CI: 0.78‐1.18; CVD, adjusted HR: 0.79; 95% CI: 0.61‐1.00) but a 36% to 57% higher AMI risk and 29% to 34% higher CVD risk than other peak serum glucose level groups. Compared to all peak serum glucose groups, patients with diagnosed diabetes had a significantly higher risk of developing CHF, PVD, and ESRD (Figure 1). Similarly, the 5‐year risk of AMI, CVD, CHF, PVD, and ESRD was higher for patients with diagnosed diabetes compared to all peak serum glucose groups (Figure 2).
CONCLUSION/DISCUSSION
The study found that in‐hospital hyperglycemia was a strong predictor of mortality at 1‐ and 5‐years follow‐up, even after adjustment using well‐established and discriminating comorbidity measures. Extreme in‐hospital hyperglycemia was a stronger predictor of mortality than diagnosed diabetes.
Previous studies have shown that diabetes and stress hyperglycemia among hospitalized patients are important markers for poor clinical outcomes and in‐hospital mortality.[1, 2, 4] This study indicates that hospitalized patients with extreme hyperglycemia (peak serum glucose >200 mg/dL) were at a high risk of death for at least 5 years following discharge.
These findings, based on a large general sample of hospitalized patients, indicate that the extreme elevations in peak serum glucose convey a risk for all hospitalized patients, not only those with critical illness.[3, 18] Hyperglycemia appears to be an independent indicator of mortality risk and should be evaluated as a potential component within risk prediction tools. Further study is required to determine mechanisms for this risk association to identify what therapies, if any, might be used to minimize this risk.
The diagnosed diabetes group, which likely included some patients who also had extreme in‐hospital hyperglycemia, had a lower 1‐year risk of death than patients with hyperglycemia who did not have diabetes diagnosis. This may be an indication of the protective effect of blood glucose control, because patients with diabetes are more likely to receive therapy for hyperglycemia during and after hospitalization.
Classification of patients by several serum glucose levels (as opposed to a dichotomous classification, where hyperglycemia is either present or absent), showed that hyperglycemia constitutes a graded risk[5] for almost all outcomes examined, particularly mortality, AMI, and CVD.
Previous studies indicate that diabetes is observed in only 23% to 35% of hospitalized patients with hyperglycemia.[18, 19] We would expect higher risk for CV complications for patients with elevated glucose if the proportion of these patients who had undiagnosed diabetes was higher than the proportion estimated in the literature. However, we observed lower risk of CV complications (especially PVD and ESRD) for the elevated glucose group in the 1 and 5 years following discharge. In‐hospital hyperglycemia is not equivalent to undiagnosed diabetes.
There are several potential limitations in this study. The first is our method for ascertaining CV complications. Diverse disease definitions are used in medical literature, and similar studies using different definitions may yield different results, though we would not expect to find a wide range of variation. Second, our study did not include information about severity of diabetes and the persistence of elevated glucose; if available, this knowledge may provide better insight into patient experiences, especially in long‐term follow‐up. Third, results are also limited by the absence of data on cause of death, a potentially helpful means of identifying posthospitalization difficulties experienced by patients with hyperglycemia. Fourth, this study mainly compares experiences of patients with elevated peak serum glucose level to diabetes patients; it would be worthwhile to explore the impact of lower gradations of glucose levels.
We would like to emphasize that we did not confirm diabetes diagnosis following discharge for patients with hyperglycemia. However, we did not observe a high rate of complications at 5‐year follow‐up, particularly for ESRD. This may be because most patients with in‐hospital elevated glucose had early diabetes or transient hyperglycemia and therefore lower risk of long‐term diabetes‐specific consultations.
Hyperglycemia is an important independent indicator, carrying a greater risk for 1‐ and 5‐year mortality than diagnosed diabetes. However, it is unclear whether hospitalized patients with elevated peak serum glucose have early diabetes or their hyperglycemia reflects hospital stress or another comorbidity concept.
Acknowledgements
The authors are grateful to Amy Zierler and Allison Whalen O'Connor for their editorial assistance. This study was supported by the Institute for Clinical Evaluative Sciences (ICES), which is funded by an annual grant from the Ontario Ministry of Health and Long‐Term Care (MOHLTC). The opinions, results and conclusions reported in this paper are those of the authors and are independent from the funding sources. No endorsement by ICES or the Ontario MOHLTC is intended or should be inferred.
Disclosure: Nothing to report.
- , , , et al. Management of diabetes and hyperglycemia in hospitals. Diabetes Care. 2004;27(2):553–591.
- , , , et al. American Association of Clinical Endocrinologists and American Diabetes Association consensus statement on inpatient glycemic control. Diabetes Care. 2009;32(6):1119–1131.
- The NICE‐SUGAR Study Investigators. Intensive versus conventional glucose control in critically ill patients. N Engl J Med. 2009;360(13):1283–1297.
- , , , , , . Hyperglycemia: an independent marker of in‐hospital mortality in patients with undiagnosed diabetes. J Clin Endocrinol Metab. 2002;87(3):978–982.
- , , , , . Hyperglycemia‐related mortality in critically ill patients varies with admission diagnosis. Crit Care Med. 2009;37(12):3001–3009.
- , . Hospital management of hyperglycemia. Curr Opin Endocrinol Diabetes Obes. 2011;18(2):110–118.
- , , , et al. IScore: a risk score to predict death early after hospitalization for an acute ischemic stroke. Circulation. 2011;123(7):739–749.
- , . Does Stress‐induced hyperglycemia increase the risk of perioperative infectious complications in orthopaedic trauma patients? J Orthop Trauma. 2010;24(12):752–756.
- . Metabolic mechanisms of stress hyperglycemia. J Parenter Enteral Nutr. 2006;30(2):157–163.
- , , . Temporal changes in the outcomes of acute myocardial infarction in Ontario, 1992–1996. CMAJ. 1999;161(10):1257–1261.
- , , , et al. The accuracy of using integrated electronic health care data to identify patients with undiagnosed diabetes mellitus. J Eval Clin Pract. 2012;18(3):606–611.
- American Diabetes Association. Diagnosis and classification of diabetes mellitus. Diabetes Care. 2006;29(suppl 1):s43–s48.
- . Dealing with competing risks: testing covariates and calculating sample size. Stat Med. 2002;21(22):3317–3324.
- , , , . Competing risk analysis of events 10 years after revascularization. Scand Cardiovasc J. 2010;44(5):279–288.
- , , , , , . Risk‐adjusting hospital inpatient mortality using automated inpatient, outpatient, and laboratory databases. Med Care. 2008;46(3):232–239.
- , , , . The Kaiser Permanente inpatient risk adjustment methodology was valid in an external patient population. J Clin Epidemiol. 2010;63(7):798–803.
- , , , . Improved comorbidity adjustment for predicting mortality in medicare populations. Health Serv Res. 2003;38(4):1103–1120.
- , , , et al. Glucose metabolism in patients with acute myocardial infarction and no previous diagnosis of diabetes mellitus: a prospective study. Lancet. 2002;359(9324):2140–2144.
- , , , et al. Disorders of glucose metabolism in acute stroke patients: an underrecognized problem. Diabetes Care. 2006;29(4):792–797.
© 2014 Society of Hospital Medicine

Europe’s latest sarcoma guidelines increase emphasis on genetic profiling
MILAN – The 2014 update to the European Society of Medical Oncology’s sarcoma-management guidelines put unprecedented emphasis on genetic assessment and using the data to guide treatment.
"Molecular diagnosis is recommended as standard care" for patients with gastrointestinal stromal tumors (GIST), Dr. Jean-Yves Blay said at Sarcoma and GIST 2014, hosted by the European Society for Medical Oncology (ESMO). Identifying the genetic profile of a newly diagnosed GIST "is predictive and can guide treatment in the adjuvant setting and possibly also in the advanced phase," said Dr. Blay, professor and head of medical oncology at Claude Bernard University in Lyon, France. "Molecular characterization is increasingly an important diagnostic and prognostic tool and also helps select treatment."

The new update also strengthened the advice from past updates to centralize GIST and sarcoma management at reference centers. "What is clear from looking at past guidelines is that since 2008 we have moved toward increasingly stronger recommendations to centralize," although the panel remained unable to settle on a definition of a GIST and sarcoma reference center, Dr. Blay said.
The 2014 revision to ESMO’s guidelines for managing GIST and sarcomas is the fourth biannual revision since these guidelines first appeared in 2008. The new update will soon appear on ESMO’s website. A majority of the guidelines remain based on consensus opinion and not evidence, because the number of randomized controlled trials that have tested various aspects of management remains limited, Dr. Blay said. The lack of trials also leaves many questions unanswered, such as the best treatment for GIST that carry the D842V mutation in their PDGFRA gene or for the "wild-type" GIST that don’t have any of the described GIST mutations. "Everyone agrees we need more studies," he said.
For managing patients with advanced GIST, the new update noted that surgical removal of recurrent lesions has not been proven beneficial to patients, and that the benefit from monitoring trough levels of a tyrosine-kinase inhibitor drug also remains unproven. The new update also acknowledged a possible role for continued imatinib (Gleevec) treatment after relapse, based on results from the RIGHT (Resumption of Imatinib to Control Metastatic or Unresectable GIST After Failure of Imatinib and Sunitinib) trial (Lancet Oncol. 2013;14:1175-82). In addition, the update recognized the potential benefit of trying regorafenib (Stivarga) after patients progress on imatinib or sunitinib (Sutent) treatment, and strongly advised against treating patients with two or more tyrosine-kinase inhibitor drugs simultaneously, as this approach needs further study.
One other change to the GIST guidelines this year was a suggestion to increase the frequency of follow-up examinations during the 1-3 years following the end of adjuvant therapy, also based on consensus opinion and without firm evidence, Dr. Blay said.
The revised soft-tissue sarcoma (STS) guidelines included adoption of the bone and STS classification scheme issued by the World Health Organization last year, and endorsement of genetic analyses when the histologic diagnosis is uncertain or the tumor has an unusual presentation. The revision added stronger language promoting the need to individualize radiotherapy based on factors such as clinical presentation of the sarcoma, patient history, tumor site, and patient’s age. The revision panel could not reach a consensus on a recommended, standard adjuvant regimen.
This inability to recommend adjuvant therapies should be "no surprise because there are no data. We need to look at larger numbers of patients to identify those who would benefit from adjuvant therapy," Dr. Blay said.
For treatment of advanced STSs, the panel added pazopanib (Votrient) as a second-line treatment option, but not for patients with liposarcomas, who were not included in the trial that established pazopanib’s efficacy for metastatic STS (Lancet 2012;379:1879-86). The update also recommended identifying sarcoma subtypes genetically and matching drugs to these types using agents such as sunitinib, crizotinib (Xalkori), and cediranib (Recentin). In addition, the new update highlighted that a role for intensified follow-up of metastatic STS using computed tomography was not supported by the results of a recent randomized, controlled trial.
The 2014 guidelines also include sections for four specific STSs: retroperitoneal, uterine, desmoids, and breast. "The guidelines are expanding to organ-specific locations, something we will probably see more of" in future updates, Dr. Blay said.
Dr. Blay disclosed that he has received honoraria as a consultant to PharmaMar, and that he has received research grants from Roche, GlaxoSmithKline, and Novartis.
On Twitter @mitchelzoler
MILAN – The 2014 update to the European Society of Medical Oncology’s sarcoma-management guidelines put unprecedented emphasis on genetic assessment and using the data to guide treatment.
"Molecular diagnosis is recommended as standard care" for patients with gastrointestinal stromal tumors (GIST), Dr. Jean-Yves Blay said at Sarcoma and GIST 2014, hosted by the European Society for Medical Oncology (ESMO). Identifying the genetic profile of a newly diagnosed GIST "is predictive and can guide treatment in the adjuvant setting and possibly also in the advanced phase," said Dr. Blay, professor and head of medical oncology at Claude Bernard University in Lyon, France. "Molecular characterization is increasingly an important diagnostic and prognostic tool and also helps select treatment."
The new update also strengthened the advice from past updates to centralize GIST and sarcoma management at reference centers. "What is clear from looking at past guidelines is that since 2008 we have moved toward increasingly stronger recommendations to centralize," although the panel remained unable to settle on a definition of a GIST and sarcoma reference center, Dr. Blay said.
The 2014 revision to ESMO’s guidelines for managing GIST and sarcomas is the fourth biannual revision since these guidelines first appeared in 2008. The new update will soon appear on ESMO’s website. A majority of the guidelines remain based on consensus opinion and not evidence, because the number of randomized controlled trials that have tested various aspects of management remains limited, Dr. Blay said. The lack of trials also leaves many questions unanswered, such as the best treatment for GIST that carry the D842V mutation in their PDGFRA gene or for the "wild-type" GIST that don’t have any of the described GIST mutations. "Everyone agrees we need more studies," he said.
For managing patients with advanced GIST, the new update noted that surgical removal of recurrent lesions has not been proven beneficial to patients, and that the benefit from monitoring trough levels of a tyrosine-kinase inhibitor drug also remains unproven. The new update also acknowledged a possible role for continued imatinib (Gleevec) treatment after relapse, based on results from the RIGHT (Resumption of Imatinib to Control Metastatic or Unresectable GIST After Failure of Imatinib and Sunitinib) trial (Lancet Oncol. 2013;14:1175-82). In addition, the update recognized the potential benefit of trying regorafenib (Stivarga) after patients progress on imatinib or sunitinib (Sutent) treatment, and strongly advised against treating patients with two or more tyrosine-kinase inhibitor drugs simultaneously, as this approach needs further study.
One other change to the GIST guidelines this year was a suggestion to increase the frequency of follow-up examinations during the 1-3 years following the end of adjuvant therapy, also based on consensus opinion and without firm evidence, Dr. Blay said.
The revised soft-tissue sarcoma (STS) guidelines included adoption of the bone and STS classification scheme issued by the World Health Organization last year, and endorsement of genetic analyses when the histologic diagnosis is uncertain or the tumor has an unusual presentation. The revision added stronger language promoting the need to individualize radiotherapy based on factors such as clinical presentation of the sarcoma, patient history, tumor site, and patient’s age. The revision panel could not reach a consensus on a recommended, standard adjuvant regimen.
This inability to recommend adjuvant therapies should be "no surprise because there are no data. We need to look at larger numbers of patients to identify those who would benefit from adjuvant therapy," Dr. Blay said.
For treatment of advanced STSs, the panel added pazopanib (Votrient) as a second-line treatment option, but not for patients with liposarcomas, who were not included in the trial that established pazopanib’s efficacy for metastatic STS (Lancet 2012;379:1879-86). The update also recommended identifying sarcoma subtypes genetically and matching drugs to these types using agents such as sunitinib, crizotinib (Xalkori), and cediranib (Recentin). In addition, the new update highlighted that a role for intensified follow-up of metastatic STS using computed tomography was not supported by the results of a recent randomized, controlled trial.
The 2014 guidelines also include sections for four specific STSs: retroperitoneal, uterine, desmoids, and breast. "The guidelines are expanding to organ-specific locations, something we will probably see more of" in future updates, Dr. Blay said.
Dr. Blay disclosed that he has received honoraria as a consultant to PharmaMar, and that he has received research grants from Roche, GlaxoSmithKline, and Novartis.
On Twitter @mitchelzoler
EXPERT ANALYSIS FROM SARCOMA AND GIST 2014

Study links graft source to length of hospital stay
GRAPEVINE, TEXAS—Acute leukemia patients who undergo cord blood (CB) transplant have longer hospital stays than patients who receive other types of transplant, new research indicates.
The study also suggests the length of stay (LOS) is similar whether patients receive double or single CB grafts.
So it seems strategies are needed to decrease hospital stay after CB transplant, particularly as LOS drives the cost of care, said Karen K. Ballen, MD, of Massachusetts General Hospital in Boston.
Dr Ballen presented this research at the 2014 BMT Tandem Meetings as abstract 104.*
She and her colleagues studied patients diagnosed with acute leukemias who were transplanted at US centers and reported to the CIBMTR between 2008 and 2011.
Patients were eligible if they received an unrelated single or double CB transplant, an 8/8 matched unrelated donor (MUD) transplant with peripheral blood (PB) or bone marrow (BM), or a 7/8 MUD PB or BM graft.
In all, 1796 patients met these criteria. The researchers evaluated patients’ total hospital LOS in the first 100 days after transplant, compared LOS among graft sources, and looked for predictors of LOS in the first 100 days.
The team stratified patients according to age and conditioning regimen. Pediatric patients were classified as those aged 18 and younger, and they only received myeloablative conditioning (MAC). Adults received either MAC or reduced-intensity conditioning (RIC).
Pediatric patients
In a univariate analysis of the 368 pediatric patients, there was no significant difference in 100-day survival according to graft source (P=0.13).
However, patients who received single or double CB grafts had a significantly higher median total LOS by day 100 than patients who received 8/8 MUD BM, which was the only other graft source in this patient group (P=0.03).
Patients who received CB grafts also had significantly fewer days in which they were alive and not in the hospital (P=0.005).
“We wanted to account for patients whose length of stay was short because they actually died early after transplant,” Dr Ballen explained. “Therefore, we did an analysis of days alive and not in the hospital.”
In a multivariate analysis, pediatric patients who received CB grafts had significantly fewer days alive and out of the hospital than those who received 8/8 MUD BM (P=0.03).
Other factors associated with fewer days alive and out of the hospital were CMV positivity (P=0.01), black race (P=0.01), and a Karnofsky performance score of less than 80 (P=0.03).
Adults on MAC
In a univariate analysis of the 768 adults who received MAC, recipients of CB grafts had significantly worse 100-day survival than their peers (P<0.001), as well as a longer median LOS by day 100 (P<0.001) and fewer days alive and not in the hospital (P<0.001).
In a multivariate analysis, adults who received MAC had significantly fewer days alive and out of the hospital if they received CB grafts than if they received 8/8 MUD BM (P<0.001), 8/8 MUD PB (P<0.001), or 7/8 MUD PB (P=0.01), but not 7/8 MUD BM (P=0.49).
Other factors associated with fewer days alive and out of the hospital were black race (P=0.04), having acute lymphocytic leukemia rather than acute myeloid leukemia (P=0.01), and age 18-25 (P=0.01).
“We were a little surprised at these results—that the older patients actually spent more time alive and out of the hospital,” Dr Ballen said.
Adults on RIC
In a univariate analysis of the 660 adults who received RIC, recipients of CB grafts had significantly worse 100-day survival than their peers (P=0.017), as well as a longer median LOS by day 100 (P<0.001) and fewer days alive and not in the hospital (P<0.001).
In a multivariate analysis, adults who received RIC had significantly fewer days alive and out of the hospital if they received CB grafts than if they received 8/8 MUD PB (P<0.001) or 7/8 MUD PB (P<0.001).
No other factors were associated with the number of days these patients were alive and out of the hospital.
These results, when taken together, suggest that CB grafts are associated with longer hospital stays, independent of other factors.
“The majority of cost appears to be driven by the number of days in the hospital,” Dr Ballen noted. “So these data may be important for resource allocation, especially given the recent changes in the US healthcare system.” ![]()
*Information in the abstract differs from that presented at the meeting.
England’s Cancer Drugs Fund raises concerns

Credit: Rhoda Baer
Cancer patients in England are more likely to receive prescriptions for expensive drugs than patients in Wales, according to a study published in the British Journal of Cancer.
The research suggests this disparity is associated with the Cancer Drugs Fund (CDF), money set aside by the English government to pay for drugs that haven’t been approved by the National Institute for Health and Care Excellence (NICE) and aren’t available within the National Health Service (NHS).
The governments of Wales, Scotland, and Northern Ireland do not have access to the CDF or have similar programs of their own.
“There’s been much debate surrounding the Cancer Drugs Fund,” said study author Charlotte Chamberlain, MBBS, of the University of Bristol in the UK.
“The vast majority of Cancer Drugs Fund drugs do not cure the cancer but may extend life or improve symptoms in some people. The high cost of these drugs means that the NHS cannot afford other treatments, and, therefore, critics argue that public money is being spent inefficiently.”
To assess the impact of the CDF, Dr Chamberlain and her colleagues analyzed data from hospital pharmacies in England and Wales from August 2007 to December 2012. (The CDF was established in 2010, and the researchers wanted to capture data from before and after its introduction.)
The team evaluated 15 drugs that represent different categories of NICE approval—recommended, not recommended, and not yet appraised.
The results showed that, after the CDF was established, drugs recommended by NICE were not prescribed any more in England than in Wales.
However, drugs that were rejected by NICE because they were not cost-effective were prescribed up to 7 times more often in England than in Wales. For example, in the year before the CDF was introduced, prescription rates of imatinib (which is not recommended by NICE) were substantially higher in England than in Wales.
Immediately before the introduction of the CDF, following the first NICE rejection, imatinib prescribing declined in both countries. But it declined more slowly in England than in Wales, despite 2 additional NICE rejections. Regression analysis showed evidence of an association between the CDF and increased prescribing in England compared to Wales (P<0.001).
The research also revealed surprising information regarding the 3 most recently launched drugs—bendamustine, pazopanib, and abiraterone, which were awaiting NICE appraisal when the CDF was established but have since been approved.
These drugs were prescribed less often in England than in Wales. For instance, prescription rates of bendamustine were 25% lower in England.
This finding suggests that physicians in England have been slower to adopt newer drugs that are cost-effective, the researchers said.
“Our research has highlighted that the CDF has created an inequality between cancer sufferers in England and those in Wales,” Dr Chamberlain noted. “This raises ethical, moral, financial, and policy concerns.” ![]()
Nanoparticle therapy active in B-cell malignancies

An experimental nanoparticle therapy has shown preclinical activity against a range of B-cell malignancies, researchers have reported.
The therapy, SNS01-T, inhibited tumor growth and improved survival in mouse models of multiple myeloma, mantle cell lymphoma, and diffuse large B-cell lymphoma.
The treatment exhibited single-agent activity in these mice but also demonstrated synergy with lenalidomide and bortezomib.
Sarah Francis, PhD, of the University of Waterloo in Ontario, Canada, and her colleagues conducted this research and recounted the results in Molecular Therapy.
SNS01-T consists of 3 components: small interfering RNA targeting the native eukaryotic translation initiation factor 5A (eIF5A), plasmids expressing a pro-apoptotic mutant of elF5A under the control of a B-cell specific promoter, and a synthetic cationic polymer polyethylenimine, which serves as the delivery vehicle.
The small interfering RNA component of SNS01-T suppresses elF5A expression, thereby interfering with translation of eIF5A and reducing levels of hypusinated elF5A in cancer cells. This inhibits activation of NF-kB and induces apoptosis.
The B-cell specific plasmid component of SNS01-T expresses an arginine substituted form of eIF5A—eIF5AK50R—that cannot be hypusinated, which leads to selective induction of apoptosis in B cells.
Dr Francis and her colleagues found that SNS01-T is preferentially taken up by malignant B cells. In myeloma cells, uptake of SNS01-T was up to 5-fold higher than uptake by normal, naïve B cells.
Uptake into myeloma cells induced 45% cell death within 24 hours, but there was almost no measureable death of normal, naïve B cells.
SNS01-T also prompted dose-dependent inhibition of tumor growth in mouse models of multiple myeloma, mantle cell lymphoma, and diffuse large B-cell lymphoma, with up to 90% inhibition at the highest doses.
When administered at doses of 0.18 mg/kg or more, SNS01-T significantly extended the life span of treated mice. The researchers observed a reduction in the pro-survival form of the eIF5A protein in tumor tissue, which was consistent with drug activity.
SNS01-T also demonstrated synergy with bortezomib and lenalidomide. Mice that received SNS01-T and lenalidomide in combination had a 100% survival rate, compared to 60% for mice that received SNS01-T alone and 20% for mice that received lenalidomide alone.
A single 6-week cycle of SNS01-T and lenalidomide eradicated tumors in 67% of mice, and there was no regrowth after an additional 8 weeks without further treatment.
Similarly, combination SNS01-T and bortezomib inhibited tumor growth by 89%, compared to 59% for SNS01-T alone and 39% for bortezomib alone.
This research was supported by Senesco Technologies, Inc., the company developing SNS01-T.![]()
Care after MET‐Implemented DNR Orders
Approximately 15% to 20% of inpatients develop significant adverse events, which are often preceded by a change in the patient's condition.[1, 2] Many hospitals utilize medical emergency teams (METs) to deliver prompt care for deteriorating patients. METs have an emerging role in end‐of‐life care; up to 35% of patients who die in the hospital with a do not resuscitate (DNR) order have a MET activation during the admission.[3] Thus, METs are well positioned to discuss preferences for cardiopulmonary resuscitation in a population at high risk for cardiac arrest.[4]
MET activations involve a change in code status in approximately 3% to 10% of cases.[5, 6, 7, 8] However, previous studies primarily involved hospitals in Australia, making the results difficult to generalize to other countries.[3, 6, 7] There may be important cultural differences in patient and clinician attitudes toward end‐of‐life care among different countries.[9] In addition, little is known about METs and hospital resources utilized in patients with MET‐implemented changes in code status. Anecdotal evidence suggests that MET activations addressing code status are more time consuming.[3] Conversely, by identifying patients unlikely to benefit from restorative care, METs may facilitate end‐of‐life comfort care, thereby reducing unplanned intensive care unit (ICU) admissions and hospital length of stay. Finally, preliminary evidence suggests that METs may improve the quality of end‐of‐life care.[10] However, the use of end‐of‐life resources, including inpatient palliative care consultation and hospice care following MET activation has not been well studied.
The purpose of our study was to examine the role of a US MET in end‐of‐life care. First, we assessed the proportion of MET calls that resulted in a new DNR order in a US hospital and compared this to previous reports in other countries. We also examined MET and hospital resource utilization in MET activations involving changes in code status by evaluating the duration of MET activations, the need for telemetry or ICU transfer, and hospital length of stay following MET activation. Finally, we explored the quality of end‐of‐life care in patients with MET‐implemented DNR orders by assessing the utilization of inpatient palliative care consultation and hospice care compared to patients with a preexisting DNR order.
MATERIALS AND METHODS
We conducted this study at Lahey Clinic, a 350‐bed academic, tertiary care center. The institutional review board approved this study and waived the need for informed consent. We performed a retrospective review of a prospectively collected MET registry. We included consecutive, adult (>18 years old) inpatient MET activations and excluded nonhospitalized patients. Data were recorded in an intranet registry at the time of the event by the MET nurse, including preexisting code status (full code or DNR), any change to the patient's code status (full code to DNR or DNR to full code) during the MET event, date of the event, disposition after the event (no transfer, transferred to ICU, or transfer to telemetry), and a description of MET interventions. The primary reason for the event was also recorded, including cardiovascular (systolic blood pressure <90 mm Hg, pulse <40 or >130 bpm), respiratory (respiratory rate <10 or >24 breaths per minute, need for noninvasive positive pressure ventilation, oxygen saturation <90%), neurologic (loss of consciousness, change in mental status, seizure, or suspected stroke), or clinical deterioration causing staff to become worried. MET activation occurs at our institution by utilizing a text paging system that records the date and time of the call, along with the patient's location. The event start time was recorded from the paging system. We considered the event stop time to be the time at which the patient is transferred to a different level of care (ie, ICU) or the MET members leave the bedside and transfer care back to the primary service. MET nurses recorded the duration of MET activation in the intranet database immediately following the activation. Data were collected from the medical record, including age, gender, race, medical insurance, religion, admission source (home, assisted living, rehabilitation, or other hospital), admission team (internal medicine or surgery), admission date and time, discharge or death date and time, disposition at discharge (home, rehabilitation, death with or without a DNR order, or hospice care), and admission diagnosis. We categorized patients discharged to a hospice bridge program as being discharged with hospice care. We also recorded whether or not code status was discussed at the time of admission. Our hospital policy requires that an advanced directives order (either full code or DNR) must be placed on all patients at the time of admission. However, we only considered a code status discussion to have occurred if there was explicit documentation of a code status discussion in the medical record at the time of hospital admission. Data from the time of hospital admission were collected to calculate a Charlson Comorbidity Index, a well‐validated predictor of mortality that uses a weighted sum of 17 medical conditions, with scores ranging from 0 to 37.[11] Higher scores indicate a greater burden of illness. We also recorded whether or not the inpatient palliative care service was consulted following MET activation by examining the medical record for a consult note. The inpatient palliative care service at our institution was implemented in 2005 and receives over 700 new inpatient consults per year. The most common reason for consultation is to assist the primary service with discussing goals of care and code status.
Our MET was established in 2005 and responds to approximately 30 to 40 events per 1000 admissions. There are 4 members on our MET, including a critical care nurse, a nursing supervisor, a respiratory therapist, and a team leader who, depending on a predetermined schedule, is either an attending hospital medicine physician, an attending critical care physician, a critical care training physician, or a critical care physician assistant.
The data were transferred from the intranet registry to an Excel (Microsoft Corp., Redmond, WA) spreadsheet for statistical analysis. The primary outcome was the proportion of activations resulting in a MET‐implemented DNR order. Secondary outcomes included the duration of MET activation, need for transfer to telemetry or the ICU, hospital length of stay following MET activation (time from the end of the MET activation to hospital discharge or death), and the frequency with which inpatient palliative care consultation and outpatient hospice care were utilized. For repeat MET activations in a single patient, we considered each MET activation as a separate event as the code status could potentially change more than once. We used SAS version 9.2 for Windows (SAS Institute Inc., Cary, NC) statistical analysis software for data analysis. The 2 method was used for categorical variables, and either a 2‐sample t test or Wilcoxon rank sum test was utilized for continuous variables. A P value 0.05 was considered significant.
RESULTS
We observed 1156 MET activations in 998 patients. The mean age was 67 years and 57% (565/998) were male (Table 1). The mean Charlson Comorbidity Index was 5.4. Most patients were admitted from home (76%, 760/998), to a medical service (72%, 720/998), and to a teaching service (73%, 732/998). Sepsis (11%, 109/998) and trauma (11%, 105/998) were the most common admission diagnoses. A cardiovascular abnormality was the most common (35%, 399/1156) reason for activation. A code status discussion was documented on admission in 44% (440/998) of all patients.
| Variable | Total, n=998 | No Change in Code Status During MET Activation, n=926 | MET‐Implemented Change in Code Status, n=72a | P Valueb | DNR Prior to MET Activation, n=100 | MET‐Implemented DNR Order, n=58 | P Valuec |
|---|---|---|---|---|---|---|---|
| |||||||
| Gender, male | 565 (56.6) | 527 (56.9) | 38 (52.8) | 0.50 | 52 (52.0) | 34 (58.6) | 0.42 |
| Age, yr, meanSTD | 6717 | 6717 | 7115 | 0.08 | 8111 | 7016 | <0.0001 |
| Race | |||||||
| Caucasian | 927 (92.9) | 859 (92.8) | 68(94.4) | 0.59 | 99 (99) | 54 (93.1) | 0.04 |
| Minorityd | 71 (7.1) | 67 (7.2) | 4(5.6) | 1 (1.0) | 4 (6.9) | ||
| Insurance | |||||||
| Medicare | 694 (69.5) | 635 (68.6) | 59 (81.9) | 0.02 | 89 (89.0) | 45 (77.6) | 0.05 |
| Private | 244 (24.5) | 235 (25.4) | 9 (12.5) | 0.01 | 10 (10.0) | 9 (15.5) | 0.30 |
| Medicaid | 41 (4.1) | 39 (4.2) | 2 (2.8) | 0.55 | 1 (1.0) | 2 (3.5) | 0.27 |
| None | 18 (1.8) | 17 (1.8) | 1 (1.4) | 0.78 | 0 (0) | 1 (1.7) | 0.19 |
| Religion | |||||||
| Christian | 748 (75.0) | 691 (74.6) | 57 (79.2) | 0.39 | 82 (82.0) | 46 (79.3) | 0.68 |
| None specified | 226 (22.7) | 213 (23.0) | 13 (18.1) | 0.33 | 14 (14.0) | 10 (17.2) | 0.58 |
| Other religions | 24 (2.4) | 22 (2.4) | 2 (2.7) | 0.83 | 4 (4.0) | 2 (3.5) | 0.86 |
| Admission diagnosis | |||||||
| Sepsis | 109 (10.9) | 100 (10.8) | 9 (12.5) | 0.66 | 11 (11.0) | 8 (13.8) | 0.60 |
| Trauma/fall | 105 (10.5) | 100 (10.8) | 5 (6.9) | 0.30 | 6 (6.0) | 5 (8.6) | 0.53 |
| Malignancy related | 79 (7.9) | 73 (7.9) | 6 (8.3) | 0.89 | 7 (7.0) | 4 (6.9) | 0.98 |
| Stroke | 47 (4.7) | 43 (4.6) | 4 (5.6) | 0.73 | 6 (6.0) | 4 (6.9) | 0.82 |
| Pneumonia | 46 (4.6) | 41 (4.4) | 5 (6.9) | 0.33 | 11 (11.0) | 3 (5.2) | 0.21 |
| Altered mental status | 43 (4.3) | 40 (4.3) | 3 (4.2) | 0.95 | 5 (5.0) | 3 (5.2) | 0.96 |
| Myocardial infarct | 42 (4.2) | 40 (4.3) | 2 (2.8) | 0.53 | 1 (1.0) | 1 (1.7) | 0.69 |
| Respiratory failure | 40 (4.0) | 36 (3.9) | 4 (5.6) | 0.49 | 2 (2.0) | 3 (5.2) | 0.27 |
| Arrhythmia | 37 (3.7) | 33 (3.6) | 4 (5.6) | 0.39 | 2 (2.0) | 3 (5.2) | 0.27 |
| Heart failure | 35 (3.5) | 33 (3.6) | 2 (2.8) | 0.72 | 10 (10.0) | 2 (3.5) | 0.13 |
| Other | 415 (41.6) | 387 (41.8) | 28 (38.9) | 0.63 | 39 (39.0) | 22 (37.9) | 0.89 |
| Admission type | |||||||
| Medical | 720 (72.1) | 662 (71.5) | 58 (80.6) | 0.10 | 91 (91.0) | 46 (79.3) | 0.04 |
| Surgical | 278 (27.9) | 264 (28.5) | 14 (19.4) | 9 (9.0) | 12 (20.7) | ||
| Admission source | |||||||
| Home | 760 (76.2) | 706 (76.2) | 54 (75.0) | 0.81 | 60 (60.0) | 44 (75.9) | 0.04 |
| Assisted Living | 29 (2.9) | 28(3.0) | 1 (1.4) | 0.43 | 9 (9.0) | 1 (1.7) | 0.07 |
| Nursing Home | 69 (6.9) | 65(7.0) | 4 (5.6) | 0.64 | 19 (19.0) | 1 (1.7) | <0.01 |
| Outside hospital | 139 (13.9) | 126(13.6) | 13 (18.1) | 0.29 | 12 (12.0) | 12 (20.7) | 0.14 |
| Other | 1 (0.1) | 0(0) | 1 (0.1) | 0.78 | 0 (0) | 0 | |
| Teaching service | 732 (73.4) | 678 (73.2) | 54 (75.0) | 0.74 | 84 (84.0) | 41 (70.7) | 0.05 |
| Code status discussed on admission | 440(44.1) | 397 (42.9) | 43 (59.7) | 0.01 | 70 (70.0) | 32 (55.2) | 0.06 |
| CCI, meanSTDe | 5.43.0 | 5.43.0 | 5.83.0 | 0.21 | 7.72.4 | 5.73.0 | <0.001 |
| MI | 226 (22.7) | 210 (22.7) | 16 (22.2) | 0.93 | 36 (36.0) | 13 (22.4) | 0.08 |
| Heart failure | 138 (13.8) | 127 (13.7) | 11 (15.3) | 0.71 | 28 (28.0) | 8 (13.8) | 0.04 |
| PVD | 90 (9.0) | 85 (9.2) | 5 (6.9) | 0.52 | 14 (14.0) | 4(6.9) | 0.18 |
| Stroke | 131 (13.1) | 121 (13.1) | 10 (13.9) | 0.84 | 30 (30.0) | 9 (15.5) | 0.04 |
| Dementia | 58 (5.8) | 51(5.5) | 7 (9.7) | 0.14 | 19 (19.0) | 5 (8.6) | 0.08 |
| COPD | 173 (17.3) | 161 (17.4) | 12 (16.7) | 0.88 | 23 (23.0) | 8 (13.8) | 0.16 |
| CTD | 58 (5.8) | 56 (6.1) | 2 (2.8) | 0.25 | 6 (6.0) | 2 (3.5) | 0.48 |
| Peptic ulcer disease | 26 (2.6) | 25 (2.7) | 1 (1.4) | 0.50 | 2 (2.0) | 1 (1.7) | 0.90 |
| Mild liver disease | 33 (3.3) | 32 (3.5) | 1 (1.4) | 0.34 | 1 (1.0) | 1 (1.7) | 0.69 |
| DM | 213 (21.3) | 194 (21.0) | 19 (16.4) | 0.28 | 19 (19.0) | 15 (25.9) | 0.31 |
| Hemiplegia | 18 (1.8) | 17 (1.8) | 1 (1.4) | 0.78 | 2 (2.0) | 1 (1.7) | 0.90 |
| Renal disease | 131 (13.1) | 119 (12.9) | 12 (16.7) | 0.36 | 21 (21.0) | 9 (15.5) | 0.40 |
| DM+organ damage | 68 (6.8) | 64 (6.9) | 4 (5.6) | 0.66 | 7 (7.0) | 3 (5.2) | 0.65 |
| Any tumor | 188 (18.8) | 173 (18.7) | 15 (20.8) | 0.65 | 25 (25.0) | 14 (24.1) | 0.90 |
| Lymphoma | 21 (2.1) | 20 (2.2) | 1 (1.4) | 0.66 | 2 (2.0) | 1 (1.7) | 0.90 |
| Leukemia | 20 (2.0) | 18 (1.9) | 2 (2.8) | 0.63 | 1 (1.0) | 0 (0.0) | 0.45 |
| Moderate/severe liver disease | 45 (4.5) | 39 (4.2) | 6 (8.3) | 0.10 | 0 (0.0) | 6 (10.3) | 0.001 |
| Metastatic tumor | 61 (6.1) | 51 (5.5) | 10 (13.9) | 0.004 | 10 (10.0) | 8 (13.8) | 0.47 |
| AIDS | 4 (0.4) | 3 (0.3) | 1 (1.4) | 0.17 | 0 (0.0) | 1 (1.7) | 0.19 |
MET activation resulted in a DNR order in 5% (58/1156) of cases (Figure 1). In activations involving a change in code status, 21% (15/73) were changed from DNR to full code. When compared to patients with a preexisting DNR order, patients with a MET‐implemented DNR order where younger (70 vs 81 years, P<0.0001), more commonly admitted from home (60% vs 44%, P=0.04), less frequently from a nursing home (1% vs 9%, P<0.01), and had a lower Charlson index (5.7 vs 7.7, P<0.001) (Table 1). Moderate to severe liver disease was more common in patients with a MET‐implemented DNR order (10% vs 0%, P=0.001). Admission diagnoses were similar between patients with a preexisting DNR and a MET‐implemented DNR order (Table 1).

The median time spent on activations with a change in code status was significantly longer than activations without a change (66 vs 60 minutes, P=0.05). The rates of telemetry (6% vs 3%, P=0.24) and ICU transfer (40% vs 41%, P=0.8) were similar between patients with a change in code status and patients without a change (Table 2). Patients with a MET‐implemented DNR order were more frequently transferred to the ICU than patients with a preexisting DNR order (36% vs 17%, P<0.01). The median hospital length of stay following MET activation was shorter in patients with a change in code status compared to patients with no change (3 vs 5 days, P<0.0001).
| Variable | Total, N=1,156 | No Change in Code Status During MET Activation, n=1,083 | MET‐Implemented Change in Code Status, n=73a | PValuec | DNR Prior to MET Activation, n=115 | MET‐Implemented DNR Order, n=58 | P Valued |
|---|---|---|---|---|---|---|---|
| |||||||
| Reason for callb | |||||||
| Cardiovascular | 399 (34.5) | 379 (35.0) | 20 (27.4) | 0.19 | 39 (33.9) | 19 (32.8) | 0.88 |
| Respiratory | 319 (27.6) | 295 (27.2) | 2 (32.9) | 0.30 | 40 (34.8) | 18 (31.0) | 0.62 |
| Neurologic | 215 (18.6) | 196 (18.1) | 19 (26.0) | 0.09 | 21 (18.3) | 15 (25.9) | 0.25 |
| Other | 323 (27.9) | 303 (28.0) | 20 (27.4) | 0.92 | 22 (19.1) | 15 (25.9) | 0.31 |
| MET resources, call duration, min, median (IQR) | 60 (4090) | 60 (4090) | 66 (43100) | 0.05 | 50 (3075) | 67 (50100) | <0.001 |
| Hospital resources | |||||||
| Tele transfer | 68 (5.9) | 663 (6.1) | 2 (2.7) | 0.24 | 3 (2.6) | 2(3.5) | 0.76 |
| ICU transfer | 459 (39.7) | 429 (39.6) | 30 (41.1) | 0.8 | 19 (16.5) | 21 (36.2) | <0.01 |
| LOS after MET activation, d, median (IQR) | 5.2 (0.2510.7) | 5 (5.411.0) | 2.8 (0.66.7) | <0.0001 | 3.8 (1.56.5) | 2.9 (0.56.5) | 0.06 |
| End‐of‐life care | n=191e | n=157 | n=34 | n=41 | n=26 | ||
| Palliative care | 31 (16.2) | 27 (17.2) | 4 (11.8) | 0.44 | 8 (19.5) | 3 (11.5) | 0.39 |
| CMO orders | 159 (83.3) | 127 (80.9) | 32 (94.1) | 0.06 | 33 (80.5) | 25 (96.2) | 0.07 |
| Died full code | 10 (5.2) | 10 (6.4) | 0 (0) | 0.13 | 2 (4.9) | 0 (0) | 0.25 |
| Died DNR | 155 (81.2) | 123 (78.3) | 32 (94.1) | 0.03 | 27 (65.9) | 25 (96.2) | 0.004 |
| Hospice | 26 (13.6) | 24 (15.3) | 2 (5.9) | 0.15 | 12 (29.3) | 1 (3.9) | 0.01 |
The inpatient mortality was 17% (165/998). Most patients who died had the focus of care changed to comfort measures only (88%, 146/165). When examining the group of patients who died in the hospital with comfort care, we found that 58% (92/159) were transferred to the ICU following the MET call, 5% (8/159) were changed to comfort care during the MET call, and 18% (29/159) had a palliative care consult. We also observed that 16% (25/159) patients who died with comfort care were made DNR during MET activation. The inpatient mortality was significantly higher in patients with a change in code status compared to patients with no change in code status (44% vs 14%, 133/926, P<0.0001). Patients with a MET‐implemented DNR order had a higher inpatient mortality than patients with a preexisting DNR (43% vs 27%, P=0.04). Twenty‐five patients with a MET‐implemented DNR order died in the hospital. When examining a subgroup of patients who required end‐of‐life care (died or discharged from the hospital with hospice), we found patients with a MET‐implemented DNR order were less likely to be discharged with hospice care than patients with a preexisting DNR (4% vs 29%, P=0.01). There was no difference in the use of inpatient palliative care consultation at the end of life in patients with a preexisting DNR versus MET‐implemented DNR order (20% vs 12%, P=0.39). Patients with a MET‐implemented DNR order also had a significantly shorter median time from implementation of comfort care orders to death or discharge with hospice compared to patients with a preexisting DNR order (7 hours, interquartile range [IQR], 416 hours vs 22 hours, IQR 939 hours).
DISCUSSION
We observed a MET‐implemented DNR order in 5% of activations. Little is known about the role of METs in end‐of‐life discussions in the United States, and past experience has primarily come from Australian hospitals. Important differences in end‐of‐life care exist among different countries, particularly with regard to placing limitations on treatment.[9] Our observed rate is similar to the 3% to 10% rate of MET‐implemented DNR orders in previous reports worldwide.[3, 5, 8, 12, 13] Recent data from the United States suggest that METs initiate a DNR order in 28% of cases.[14] However, most DNR orders in that study were placed in the ICU days to weeks after MET activation, likely accounting for the high DNR rate. Our data add to the growing body of evidence that METs play an important role in end‐of‐life discussions among different countries throughout the world, including the United States.
To our knowledge, no prior study has evaluated the impact of code status discussions on MET resource utilization. Our MET spent 6 minutes longer on activations involving a change in code status when compared to activations with no changes made to code status. Presumably, some of this time was spent discussing goals of care. In our opinion, the additional time spent on these activations was invaluable, particularly when considering MET‐initiated end‐of‐life discussions may have prevented several unwanted resuscitations (25 patients died with a MET‐implemented DNR order). Interestingly, less than half of patients had code status discussions at the time of hospital admission. This finding suggests that clinicians could be more vigilant about discussing preferences for resuscitation at the time of admission in patients at risk for clinical deterioration. We suspect that in some cases code status discussions may have occurred between the patient and the primary service later in the patient's hospitalization, which were not captured in our study.
Surprisingly, when examining the use of hospital resources, we found no difference in the rate of unplanned ICU transfer in patients with a change in code status. In fact, we observed a higher rate of ICU transfer in patients with a MET‐implemented DNR order compared to those with a preexisting DNR order (36% vs 17%). These results were at odds with our hypothesis of a lower rate of ICU transfer in patients with MET‐implemented limitations in care. When compared to patients with a preexisting DNR order, patients with a MET‐implemented DNR order were younger, more commonly admitted from home, and had a lower Charlson index. Despite evidence of a lower burden of chronic illness and younger age, patients with a MET‐implemented DNR order had higher inpatient mortality than patients with a preexisting DNR order (43% vs 27%), suggesting an acute and rapidly progressive disease process. These observations may have compelled the MET to advocate for aggressive ICU‐level care in patients with a MET‐implemented DNR order. Another possible explanation for the relatively high rate of ICU transfer is that the MET is, in part, led by ICU staff. Thus, our MET may have made the decision to transfer the patient to the ICU and then subsequently initiated end‐of‐life discussions only after taking ownership of the patient. Furthermore, almost 20% of MET‐implemented changes to code status involved reversing status from DNR to full code. These data suggest that METs are not merely serving as a resource to review code status, but rather providing intensive treatment for acutely ill patients and simultaneously initiating end‐of‐life discussions in a population with a high inpatient mortality rate. The practice pattern observed in our study of transferring patients to the ICU for a trial of intensive therapy at the end of life is consistent with the overall trend in the United States for increased inpatient treatment intensity at the end of life.[14, 15, 16]
Our data suggest that the increased use of ICU resources in patients with a MET‐implemented DNR may be balanced by a shorter hospital length of stay following MET activation. In a multicenter observational study, Jones et al. found hospital length of stay to be similar in patients with and without a MET‐implemented limitation of medical therapy.[3] The authors did not examine length of stay specifically in patients with a DNR order, but rather examined patients with any limitation in medical therapy, including not for ICU admission. We suspect that the shorter length of stay following MET activation in our study was related to the fact that patients with a change in code status had a significantly higher inpatient mortality.
We observed several interesting findings with regard to end‐of‐life care following MET‐implemented DNR orders. First, the inpatient mortality in this population was remarkably high at 43%, compared to 27% in patients with a preexisting DNR order. Interestingly, there was no difference in the rate of palliative care consultation between the 2 groups despite the fact that all 25 patients who died following a MET‐implemented DNR order did so with a comfort measures only order. We also found that patients with a preexisting DNR also had a higher rate of discharge with hospice compared to patients with a MET‐implemented DNR order (29% vs 4%). Thus, our data suggest that inpatient palliative care consultation and hospice services are not resources that are routinely utilized in patients with MET‐initiated DNR orders. It may be the case that the acuity and severity of illness or patient preferences may have precluded the possibility of discharging some patients in our study home with hospice care or implementing comfort care earlier in the hospital course. Patients with MET‐implemented DNR orders were younger, had fewer comorbidities, and died sooner after comfort care orders were written. The overall rate of comfort care provided to patients who died was high at 88%. We have an inpatient comfort measures only order set at our hospital, which may account for the large proportion of patients receiving comfort care at the end of life. In addition, this order set may also help to improve the quality of end‐of‐life care and thus limit the need for palliative care consultation to some extent. However, we found that patients with a MET‐implemented DNR order had a shorter time from comfort care orders to death than patients with a preexisting DNR order. This finding suggests that patients with MET‐implemented DNR orders may have had comfort care implemented relatively late in the course of illness and had less‐than‐optimal end‐of‐life care. Vazquez et al. reported improved quality of end‐of‐life care after implementation of a MET.[10] However, an inpatient palliative care service was not available in that study, and it is not clear whether or not a comfort care order set was available. Evidence suggests that utilization of palliative care resources improves end‐of‐life care in the ICU.[17, 18, 19] We found that more than half of patients who died with comfort care in the hospital did so after being transferred to the ICU for a trial of aggressive care, suggesting that this population may have benefited from more involvement of our palliative care service. In summary, our data on end‐of‐life care following MET activation suggest that the METs are able to take advantage of an opportunity to identify patients who would not want resuscitation efforts because of personal preferences or futility of treatments. However, our surrogate measures of the quality of end‐of‐life care suggest that patients with MET‐implemented DNR orders may benefit from coordinated care with inpatient palliative care services, timelier implementation of comfort care orders, and possibly increased referrals for hospice care to help improve the quality of end‐of‐life care in this population.
Our study is subject to a number of limitations. This was a single‐center study, making the results difficult to generalize. The retrospective nature of our study makes it subject to the limitations inherent in this study design, including bias and confounding. The duration of MET activation was difficult to accurately and objectively measure and is subject to reporting bias. The event stop time, in particular, was subjectively measured by the MET nurse and is difficult to accurately assess, because MET members occasionally leave the bedside and return to reevaluate the response to therapy. We tried to account for this by clearly defining the MET stop time as the point at which MET members leave the bedside and transfer care back to the primary service or physically transfer the patient to a higher level of care. It also bears mentioning that the nurses performing data entry were not aware of the study hypothesis at the time of data entry. Despite including over 1100 MET calls in our analysis, the number of patients with a MET‐implemented DNR order was relatively small, which may have limited our ability to detect differences among subgroups during our analysis. We also did not document the clinical circumstances surrounding the MET‐implemented DNR order. Although we hypothesized that these patients had a higher mortality due to a higher acuity of illness, we were unable to support this hypothesis with the data available in our retrospective study. We did not record which providers were involved in code status discussions and the exact amount time spent on these discussions, making it difficult to accurately quantify the MET resources utilized on the calls. Our MET works closely with the patient's primary service, and it is possible that some of the changes to code status were implemented by the primary service and not MET providers. The patient's primary service may have a preexisting relationship with the patient and would be in a better position to discuss goals of care than MET providers who have had no prior relationship with the patient. However, even in this case, the clinical deterioration prompting MET activation was likely the event that triggered end‐of‐life discussions. Prospective studies would be helpful not only to identify the individuals involved in code status discussions during MET activations, but also to objectively measure the time spent on such discussions. Finally, our study population consisted primarily of Caucasian patients. Preferences for end‐of‐life care may differ among socioeconomic and ethnic groups, thus limiting the generalizability of our study findings.[20, 21]
In conclusion, we found the rate of MET‐implemented DNR orders in the United States to be similar to that of previous reports in other countries. MET events involving a change in code status are associated with increased utilization of MET and ICU resources, but a shorter hospital length of stay. Despite a high inpatient mortality rate, patients with a MET‐implemented DNR had a relatively low utilization of end‐of‐life resources, including palliative care and home hospice services. Coordinated care between METs and palliative care may help to improve of end‐of‐life care in patients with a change in code status following MET activation.
Acknowledgements
The authors acknowledge the hard work and dedication provided by Elizabeth Spellman during the data collection process.
Disclosures: This work was performed at Lahey Hospital and Medical Center. The authors report no conflicts of interest.
- , , , et al. The quality of health care delivered to adults in the United States. N Engl J Med. 2003;348(26):2635–2645.
- , , , et al. Antecedents to hospital deaths. Intern Med J. 2001;31(6):343–348.
- , , , et al. The role of the medical emergency team in end‐of‐life care: a multicenter, prospective, observational study. Crit Care Med. 2012;40(1):98–103.
- , , . Rapid‐response teams. N Engl J Med. 2011;365(2):139–146.
- , , , et al. The impact of Rapid Response System on delayed emergency team activation patient characteristics and outcomes—a follow‐up study. Resuscitation. 2010;81(1):31–35.
- , , , et al. Introduction of the medical emergency team (MET) system: a cluster‐randomised controlled trial. Lancet. 2005;365(9477):2091–2097.
- , , , et al. Effects of a medical emergency team on reduction of incidence of and mortality from unexpected cardiac arrests in hospital: preliminary study. BMJ. 2002;324(7334):387–390.
- , , , et al. The Medical Emergency Team System and not‐for‐resuscitation orders: results from the MERIT study. Resuscitation. 2008;79(3):391–397.
- . Cultural differences in end‐of‐life care. Crit Care Med. 2001;29(2 Suppl):N52–N55.
- , , , et al. Enhanced end‐of‐life care associated with deploying a rapid response team: a pilot study. J Hosp Med. 2009;4(7):449–452.
- , , , et al. A new method of classifying prognostic comorbidity in longitudinal studies: development and validation. J Chronic Dis. 1987;40(5):373–383.
- , , , et al. The medical emergency team and end‐of‐life care: a pilot study. Crit Care Resusc. 2007;9(2):151–156.
- , , , et al. A retrospective cohort study of the effect of medical emergency teams on documentation of advance care directives. Crit Care Resusc. 2011;13(3):167–174.
- , , , et al. The medical emergency team a call: a sentinel event that triggers goals of care discussion. Crit Care Med. 2014;42(2):322–327.
- , , , et al. Change in end‐of‐life care for Medicare beneficiaries: site of death, place of care, and healthcare transitions in 2000, 2005, and 2009. JAMA. 2013;309(5):470–477.
- , , , et al. Trends in inpatient treatment intensity among Medicare beneficiaries at the end of life. Health Serv Res. 2004;39(2):363–375.
- , , , et al. Proactive palliative care in the medical intensive care unit: effects on length of stay for selected high‐risk patients. Crit Care Med. 2007;35(6):1530–1535.
- , . Impact of a proactive approach to improve end‐of‐life care in a medical ICU. Chest. 2003;123(1):266–271.
- , , , et al. In their own words: patients and families define high‐quality palliative care in the intensive care unit. Crit Care Med. 2010;38(3):808–818.
- , , , et al. The influence of race/ethnicity and socioeconomic status on end‐of‐life care in the ICU. Chest. 2011;139(5):1025–1033.
- , , , et al. Racial and ethnic differences in advance care planning among patients with cancer: impact of terminal illness acknowledgment, religiousness, and treatment preferences. J Clin Oncol. 2008;26(25):4131–4137.
Approximately 15% to 20% of inpatients develop significant adverse events, which are often preceded by a change in the patient's condition.[1, 2] Many hospitals utilize medical emergency teams (METs) to deliver prompt care for deteriorating patients. METs have an emerging role in end‐of‐life care; up to 35% of patients who die in the hospital with a do not resuscitate (DNR) order have a MET activation during the admission.[3] Thus, METs are well positioned to discuss preferences for cardiopulmonary resuscitation in a population at high risk for cardiac arrest.[4]
MET activations involve a change in code status in approximately 3% to 10% of cases.[5, 6, 7, 8] However, previous studies primarily involved hospitals in Australia, making the results difficult to generalize to other countries.[3, 6, 7] There may be important cultural differences in patient and clinician attitudes toward end‐of‐life care among different countries.[9] In addition, little is known about METs and hospital resources utilized in patients with MET‐implemented changes in code status. Anecdotal evidence suggests that MET activations addressing code status are more time consuming.[3] Conversely, by identifying patients unlikely to benefit from restorative care, METs may facilitate end‐of‐life comfort care, thereby reducing unplanned intensive care unit (ICU) admissions and hospital length of stay. Finally, preliminary evidence suggests that METs may improve the quality of end‐of‐life care.[10] However, the use of end‐of‐life resources, including inpatient palliative care consultation and hospice care following MET activation has not been well studied.
The purpose of our study was to examine the role of a US MET in end‐of‐life care. First, we assessed the proportion of MET calls that resulted in a new DNR order in a US hospital and compared this to previous reports in other countries. We also examined MET and hospital resource utilization in MET activations involving changes in code status by evaluating the duration of MET activations, the need for telemetry or ICU transfer, and hospital length of stay following MET activation. Finally, we explored the quality of end‐of‐life care in patients with MET‐implemented DNR orders by assessing the utilization of inpatient palliative care consultation and hospice care compared to patients with a preexisting DNR order.
MATERIALS AND METHODS
We conducted this study at Lahey Clinic, a 350‐bed academic, tertiary care center. The institutional review board approved this study and waived the need for informed consent. We performed a retrospective review of a prospectively collected MET registry. We included consecutive, adult (>18 years old) inpatient MET activations and excluded nonhospitalized patients. Data were recorded in an intranet registry at the time of the event by the MET nurse, including preexisting code status (full code or DNR), any change to the patient's code status (full code to DNR or DNR to full code) during the MET event, date of the event, disposition after the event (no transfer, transferred to ICU, or transfer to telemetry), and a description of MET interventions. The primary reason for the event was also recorded, including cardiovascular (systolic blood pressure <90 mm Hg, pulse <40 or >130 bpm), respiratory (respiratory rate <10 or >24 breaths per minute, need for noninvasive positive pressure ventilation, oxygen saturation <90%), neurologic (loss of consciousness, change in mental status, seizure, or suspected stroke), or clinical deterioration causing staff to become worried. MET activation occurs at our institution by utilizing a text paging system that records the date and time of the call, along with the patient's location. The event start time was recorded from the paging system. We considered the event stop time to be the time at which the patient is transferred to a different level of care (ie, ICU) or the MET members leave the bedside and transfer care back to the primary service. MET nurses recorded the duration of MET activation in the intranet database immediately following the activation. Data were collected from the medical record, including age, gender, race, medical insurance, religion, admission source (home, assisted living, rehabilitation, or other hospital), admission team (internal medicine or surgery), admission date and time, discharge or death date and time, disposition at discharge (home, rehabilitation, death with or without a DNR order, or hospice care), and admission diagnosis. We categorized patients discharged to a hospice bridge program as being discharged with hospice care. We also recorded whether or not code status was discussed at the time of admission. Our hospital policy requires that an advanced directives order (either full code or DNR) must be placed on all patients at the time of admission. However, we only considered a code status discussion to have occurred if there was explicit documentation of a code status discussion in the medical record at the time of hospital admission. Data from the time of hospital admission were collected to calculate a Charlson Comorbidity Index, a well‐validated predictor of mortality that uses a weighted sum of 17 medical conditions, with scores ranging from 0 to 37.[11] Higher scores indicate a greater burden of illness. We also recorded whether or not the inpatient palliative care service was consulted following MET activation by examining the medical record for a consult note. The inpatient palliative care service at our institution was implemented in 2005 and receives over 700 new inpatient consults per year. The most common reason for consultation is to assist the primary service with discussing goals of care and code status.
Our MET was established in 2005 and responds to approximately 30 to 40 events per 1000 admissions. There are 4 members on our MET, including a critical care nurse, a nursing supervisor, a respiratory therapist, and a team leader who, depending on a predetermined schedule, is either an attending hospital medicine physician, an attending critical care physician, a critical care training physician, or a critical care physician assistant.
The data were transferred from the intranet registry to an Excel (Microsoft Corp., Redmond, WA) spreadsheet for statistical analysis. The primary outcome was the proportion of activations resulting in a MET‐implemented DNR order. Secondary outcomes included the duration of MET activation, need for transfer to telemetry or the ICU, hospital length of stay following MET activation (time from the end of the MET activation to hospital discharge or death), and the frequency with which inpatient palliative care consultation and outpatient hospice care were utilized. For repeat MET activations in a single patient, we considered each MET activation as a separate event as the code status could potentially change more than once. We used SAS version 9.2 for Windows (SAS Institute Inc., Cary, NC) statistical analysis software for data analysis. The 2 method was used for categorical variables, and either a 2‐sample t test or Wilcoxon rank sum test was utilized for continuous variables. A P value 0.05 was considered significant.
RESULTS
We observed 1156 MET activations in 998 patients. The mean age was 67 years and 57% (565/998) were male (Table 1). The mean Charlson Comorbidity Index was 5.4. Most patients were admitted from home (76%, 760/998), to a medical service (72%, 720/998), and to a teaching service (73%, 732/998). Sepsis (11%, 109/998) and trauma (11%, 105/998) were the most common admission diagnoses. A cardiovascular abnormality was the most common (35%, 399/1156) reason for activation. A code status discussion was documented on admission in 44% (440/998) of all patients.
| Variable | Total, n=998 | No Change in Code Status During MET Activation, n=926 | MET‐Implemented Change in Code Status, n=72a | P Valueb | DNR Prior to MET Activation, n=100 | MET‐Implemented DNR Order, n=58 | P Valuec |
|---|---|---|---|---|---|---|---|
| |||||||
| Gender, male | 565 (56.6) | 527 (56.9) | 38 (52.8) | 0.50 | 52 (52.0) | 34 (58.6) | 0.42 |
| Age, yr, meanSTD | 6717 | 6717 | 7115 | 0.08 | 8111 | 7016 | <0.0001 |
| Race | |||||||
| Caucasian | 927 (92.9) | 859 (92.8) | 68(94.4) | 0.59 | 99 (99) | 54 (93.1) | 0.04 |
| Minorityd | 71 (7.1) | 67 (7.2) | 4(5.6) | 1 (1.0) | 4 (6.9) | ||
| Insurance | |||||||
| Medicare | 694 (69.5) | 635 (68.6) | 59 (81.9) | 0.02 | 89 (89.0) | 45 (77.6) | 0.05 |
| Private | 244 (24.5) | 235 (25.4) | 9 (12.5) | 0.01 | 10 (10.0) | 9 (15.5) | 0.30 |
| Medicaid | 41 (4.1) | 39 (4.2) | 2 (2.8) | 0.55 | 1 (1.0) | 2 (3.5) | 0.27 |
| None | 18 (1.8) | 17 (1.8) | 1 (1.4) | 0.78 | 0 (0) | 1 (1.7) | 0.19 |
| Religion | |||||||
| Christian | 748 (75.0) | 691 (74.6) | 57 (79.2) | 0.39 | 82 (82.0) | 46 (79.3) | 0.68 |
| None specified | 226 (22.7) | 213 (23.0) | 13 (18.1) | 0.33 | 14 (14.0) | 10 (17.2) | 0.58 |
| Other religions | 24 (2.4) | 22 (2.4) | 2 (2.7) | 0.83 | 4 (4.0) | 2 (3.5) | 0.86 |
| Admission diagnosis | |||||||
| Sepsis | 109 (10.9) | 100 (10.8) | 9 (12.5) | 0.66 | 11 (11.0) | 8 (13.8) | 0.60 |
| Trauma/fall | 105 (10.5) | 100 (10.8) | 5 (6.9) | 0.30 | 6 (6.0) | 5 (8.6) | 0.53 |
| Malignancy related | 79 (7.9) | 73 (7.9) | 6 (8.3) | 0.89 | 7 (7.0) | 4 (6.9) | 0.98 |
| Stroke | 47 (4.7) | 43 (4.6) | 4 (5.6) | 0.73 | 6 (6.0) | 4 (6.9) | 0.82 |
| Pneumonia | 46 (4.6) | 41 (4.4) | 5 (6.9) | 0.33 | 11 (11.0) | 3 (5.2) | 0.21 |
| Altered mental status | 43 (4.3) | 40 (4.3) | 3 (4.2) | 0.95 | 5 (5.0) | 3 (5.2) | 0.96 |
| Myocardial infarct | 42 (4.2) | 40 (4.3) | 2 (2.8) | 0.53 | 1 (1.0) | 1 (1.7) | 0.69 |
| Respiratory failure | 40 (4.0) | 36 (3.9) | 4 (5.6) | 0.49 | 2 (2.0) | 3 (5.2) | 0.27 |
| Arrhythmia | 37 (3.7) | 33 (3.6) | 4 (5.6) | 0.39 | 2 (2.0) | 3 (5.2) | 0.27 |
| Heart failure | 35 (3.5) | 33 (3.6) | 2 (2.8) | 0.72 | 10 (10.0) | 2 (3.5) | 0.13 |
| Other | 415 (41.6) | 387 (41.8) | 28 (38.9) | 0.63 | 39 (39.0) | 22 (37.9) | 0.89 |
| Admission type | |||||||
| Medical | 720 (72.1) | 662 (71.5) | 58 (80.6) | 0.10 | 91 (91.0) | 46 (79.3) | 0.04 |
| Surgical | 278 (27.9) | 264 (28.5) | 14 (19.4) | 9 (9.0) | 12 (20.7) | ||
| Admission source | |||||||
| Home | 760 (76.2) | 706 (76.2) | 54 (75.0) | 0.81 | 60 (60.0) | 44 (75.9) | 0.04 |
| Assisted Living | 29 (2.9) | 28(3.0) | 1 (1.4) | 0.43 | 9 (9.0) | 1 (1.7) | 0.07 |
| Nursing Home | 69 (6.9) | 65(7.0) | 4 (5.6) | 0.64 | 19 (19.0) | 1 (1.7) | <0.01 |
| Outside hospital | 139 (13.9) | 126(13.6) | 13 (18.1) | 0.29 | 12 (12.0) | 12 (20.7) | 0.14 |
| Other | 1 (0.1) | 0(0) | 1 (0.1) | 0.78 | 0 (0) | 0 | |
| Teaching service | 732 (73.4) | 678 (73.2) | 54 (75.0) | 0.74 | 84 (84.0) | 41 (70.7) | 0.05 |
| Code status discussed on admission | 440(44.1) | 397 (42.9) | 43 (59.7) | 0.01 | 70 (70.0) | 32 (55.2) | 0.06 |
| CCI, meanSTDe | 5.43.0 | 5.43.0 | 5.83.0 | 0.21 | 7.72.4 | 5.73.0 | <0.001 |
| MI | 226 (22.7) | 210 (22.7) | 16 (22.2) | 0.93 | 36 (36.0) | 13 (22.4) | 0.08 |
| Heart failure | 138 (13.8) | 127 (13.7) | 11 (15.3) | 0.71 | 28 (28.0) | 8 (13.8) | 0.04 |
| PVD | 90 (9.0) | 85 (9.2) | 5 (6.9) | 0.52 | 14 (14.0) | 4(6.9) | 0.18 |
| Stroke | 131 (13.1) | 121 (13.1) | 10 (13.9) | 0.84 | 30 (30.0) | 9 (15.5) | 0.04 |
| Dementia | 58 (5.8) | 51(5.5) | 7 (9.7) | 0.14 | 19 (19.0) | 5 (8.6) | 0.08 |
| COPD | 173 (17.3) | 161 (17.4) | 12 (16.7) | 0.88 | 23 (23.0) | 8 (13.8) | 0.16 |
| CTD | 58 (5.8) | 56 (6.1) | 2 (2.8) | 0.25 | 6 (6.0) | 2 (3.5) | 0.48 |
| Peptic ulcer disease | 26 (2.6) | 25 (2.7) | 1 (1.4) | 0.50 | 2 (2.0) | 1 (1.7) | 0.90 |
| Mild liver disease | 33 (3.3) | 32 (3.5) | 1 (1.4) | 0.34 | 1 (1.0) | 1 (1.7) | 0.69 |
| DM | 213 (21.3) | 194 (21.0) | 19 (16.4) | 0.28 | 19 (19.0) | 15 (25.9) | 0.31 |
| Hemiplegia | 18 (1.8) | 17 (1.8) | 1 (1.4) | 0.78 | 2 (2.0) | 1 (1.7) | 0.90 |
| Renal disease | 131 (13.1) | 119 (12.9) | 12 (16.7) | 0.36 | 21 (21.0) | 9 (15.5) | 0.40 |
| DM+organ damage | 68 (6.8) | 64 (6.9) | 4 (5.6) | 0.66 | 7 (7.0) | 3 (5.2) | 0.65 |
| Any tumor | 188 (18.8) | 173 (18.7) | 15 (20.8) | 0.65 | 25 (25.0) | 14 (24.1) | 0.90 |
| Lymphoma | 21 (2.1) | 20 (2.2) | 1 (1.4) | 0.66 | 2 (2.0) | 1 (1.7) | 0.90 |
| Leukemia | 20 (2.0) | 18 (1.9) | 2 (2.8) | 0.63 | 1 (1.0) | 0 (0.0) | 0.45 |
| Moderate/severe liver disease | 45 (4.5) | 39 (4.2) | 6 (8.3) | 0.10 | 0 (0.0) | 6 (10.3) | 0.001 |
| Metastatic tumor | 61 (6.1) | 51 (5.5) | 10 (13.9) | 0.004 | 10 (10.0) | 8 (13.8) | 0.47 |
| AIDS | 4 (0.4) | 3 (0.3) | 1 (1.4) | 0.17 | 0 (0.0) | 1 (1.7) | 0.19 |
MET activation resulted in a DNR order in 5% (58/1156) of cases (Figure 1). In activations involving a change in code status, 21% (15/73) were changed from DNR to full code. When compared to patients with a preexisting DNR order, patients with a MET‐implemented DNR order where younger (70 vs 81 years, P<0.0001), more commonly admitted from home (60% vs 44%, P=0.04), less frequently from a nursing home (1% vs 9%, P<0.01), and had a lower Charlson index (5.7 vs 7.7, P<0.001) (Table 1). Moderate to severe liver disease was more common in patients with a MET‐implemented DNR order (10% vs 0%, P=0.001). Admission diagnoses were similar between patients with a preexisting DNR and a MET‐implemented DNR order (Table 1).
The median time spent on activations with a change in code status was significantly longer than activations without a change (66 vs 60 minutes, P=0.05). The rates of telemetry (6% vs 3%, P=0.24) and ICU transfer (40% vs 41%, P=0.8) were similar between patients with a change in code status and patients without a change (Table 2). Patients with a MET‐implemented DNR order were more frequently transferred to the ICU than patients with a preexisting DNR order (36% vs 17%, P<0.01). The median hospital length of stay following MET activation was shorter in patients with a change in code status compared to patients with no change (3 vs 5 days, P<0.0001).
| Variable | Total, N=1,156 | No Change in Code Status During MET Activation, n=1,083 | MET‐Implemented Change in Code Status, n=73a | PValuec | DNR Prior to MET Activation, n=115 | MET‐Implemented DNR Order, n=58 | P Valued |
|---|---|---|---|---|---|---|---|
| |||||||
| Reason for callb | |||||||
| Cardiovascular | 399 (34.5) | 379 (35.0) | 20 (27.4) | 0.19 | 39 (33.9) | 19 (32.8) | 0.88 |
| Respiratory | 319 (27.6) | 295 (27.2) | 2 (32.9) | 0.30 | 40 (34.8) | 18 (31.0) | 0.62 |
| Neurologic | 215 (18.6) | 196 (18.1) | 19 (26.0) | 0.09 | 21 (18.3) | 15 (25.9) | 0.25 |
| Other | 323 (27.9) | 303 (28.0) | 20 (27.4) | 0.92 | 22 (19.1) | 15 (25.9) | 0.31 |
| MET resources, call duration, min, median (IQR) | 60 (4090) | 60 (4090) | 66 (43100) | 0.05 | 50 (3075) | 67 (50100) | <0.001 |
| Hospital resources | |||||||
| Tele transfer | 68 (5.9) | 663 (6.1) | 2 (2.7) | 0.24 | 3 (2.6) | 2(3.5) | 0.76 |
| ICU transfer | 459 (39.7) | 429 (39.6) | 30 (41.1) | 0.8 | 19 (16.5) | 21 (36.2) | <0.01 |
| LOS after MET activation, d, median (IQR) | 5.2 (0.2510.7) | 5 (5.411.0) | 2.8 (0.66.7) | <0.0001 | 3.8 (1.56.5) | 2.9 (0.56.5) | 0.06 |
| End‐of‐life care | n=191e | n=157 | n=34 | n=41 | n=26 | ||
| Palliative care | 31 (16.2) | 27 (17.2) | 4 (11.8) | 0.44 | 8 (19.5) | 3 (11.5) | 0.39 |
| CMO orders | 159 (83.3) | 127 (80.9) | 32 (94.1) | 0.06 | 33 (80.5) | 25 (96.2) | 0.07 |
| Died full code | 10 (5.2) | 10 (6.4) | 0 (0) | 0.13 | 2 (4.9) | 0 (0) | 0.25 |
| Died DNR | 155 (81.2) | 123 (78.3) | 32 (94.1) | 0.03 | 27 (65.9) | 25 (96.2) | 0.004 |
| Hospice | 26 (13.6) | 24 (15.3) | 2 (5.9) | 0.15 | 12 (29.3) | 1 (3.9) | 0.01 |
The inpatient mortality was 17% (165/998). Most patients who died had the focus of care changed to comfort measures only (88%, 146/165). When examining the group of patients who died in the hospital with comfort care, we found that 58% (92/159) were transferred to the ICU following the MET call, 5% (8/159) were changed to comfort care during the MET call, and 18% (29/159) had a palliative care consult. We also observed that 16% (25/159) patients who died with comfort care were made DNR during MET activation. The inpatient mortality was significantly higher in patients with a change in code status compared to patients with no change in code status (44% vs 14%, 133/926, P<0.0001). Patients with a MET‐implemented DNR order had a higher inpatient mortality than patients with a preexisting DNR (43% vs 27%, P=0.04). Twenty‐five patients with a MET‐implemented DNR order died in the hospital. When examining a subgroup of patients who required end‐of‐life care (died or discharged from the hospital with hospice), we found patients with a MET‐implemented DNR order were less likely to be discharged with hospice care than patients with a preexisting DNR (4% vs 29%, P=0.01). There was no difference in the use of inpatient palliative care consultation at the end of life in patients with a preexisting DNR versus MET‐implemented DNR order (20% vs 12%, P=0.39). Patients with a MET‐implemented DNR order also had a significantly shorter median time from implementation of comfort care orders to death or discharge with hospice compared to patients with a preexisting DNR order (7 hours, interquartile range [IQR], 416 hours vs 22 hours, IQR 939 hours).
DISCUSSION
We observed a MET‐implemented DNR order in 5% of activations. Little is known about the role of METs in end‐of‐life discussions in the United States, and past experience has primarily come from Australian hospitals. Important differences in end‐of‐life care exist among different countries, particularly with regard to placing limitations on treatment.[9] Our observed rate is similar to the 3% to 10% rate of MET‐implemented DNR orders in previous reports worldwide.[3, 5, 8, 12, 13] Recent data from the United States suggest that METs initiate a DNR order in 28% of cases.[14] However, most DNR orders in that study were placed in the ICU days to weeks after MET activation, likely accounting for the high DNR rate. Our data add to the growing body of evidence that METs play an important role in end‐of‐life discussions among different countries throughout the world, including the United States.
To our knowledge, no prior study has evaluated the impact of code status discussions on MET resource utilization. Our MET spent 6 minutes longer on activations involving a change in code status when compared to activations with no changes made to code status. Presumably, some of this time was spent discussing goals of care. In our opinion, the additional time spent on these activations was invaluable, particularly when considering MET‐initiated end‐of‐life discussions may have prevented several unwanted resuscitations (25 patients died with a MET‐implemented DNR order). Interestingly, less than half of patients had code status discussions at the time of hospital admission. This finding suggests that clinicians could be more vigilant about discussing preferences for resuscitation at the time of admission in patients at risk for clinical deterioration. We suspect that in some cases code status discussions may have occurred between the patient and the primary service later in the patient's hospitalization, which were not captured in our study.
Surprisingly, when examining the use of hospital resources, we found no difference in the rate of unplanned ICU transfer in patients with a change in code status. In fact, we observed a higher rate of ICU transfer in patients with a MET‐implemented DNR order compared to those with a preexisting DNR order (36% vs 17%). These results were at odds with our hypothesis of a lower rate of ICU transfer in patients with MET‐implemented limitations in care. When compared to patients with a preexisting DNR order, patients with a MET‐implemented DNR order were younger, more commonly admitted from home, and had a lower Charlson index. Despite evidence of a lower burden of chronic illness and younger age, patients with a MET‐implemented DNR order had higher inpatient mortality than patients with a preexisting DNR order (43% vs 27%), suggesting an acute and rapidly progressive disease process. These observations may have compelled the MET to advocate for aggressive ICU‐level care in patients with a MET‐implemented DNR order. Another possible explanation for the relatively high rate of ICU transfer is that the MET is, in part, led by ICU staff. Thus, our MET may have made the decision to transfer the patient to the ICU and then subsequently initiated end‐of‐life discussions only after taking ownership of the patient. Furthermore, almost 20% of MET‐implemented changes to code status involved reversing status from DNR to full code. These data suggest that METs are not merely serving as a resource to review code status, but rather providing intensive treatment for acutely ill patients and simultaneously initiating end‐of‐life discussions in a population with a high inpatient mortality rate. The practice pattern observed in our study of transferring patients to the ICU for a trial of intensive therapy at the end of life is consistent with the overall trend in the United States for increased inpatient treatment intensity at the end of life.[14, 15, 16]
Our data suggest that the increased use of ICU resources in patients with a MET‐implemented DNR may be balanced by a shorter hospital length of stay following MET activation. In a multicenter observational study, Jones et al. found hospital length of stay to be similar in patients with and without a MET‐implemented limitation of medical therapy.[3] The authors did not examine length of stay specifically in patients with a DNR order, but rather examined patients with any limitation in medical therapy, including not for ICU admission. We suspect that the shorter length of stay following MET activation in our study was related to the fact that patients with a change in code status had a significantly higher inpatient mortality.
We observed several interesting findings with regard to end‐of‐life care following MET‐implemented DNR orders. First, the inpatient mortality in this population was remarkably high at 43%, compared to 27% in patients with a preexisting DNR order. Interestingly, there was no difference in the rate of palliative care consultation between the 2 groups despite the fact that all 25 patients who died following a MET‐implemented DNR order did so with a comfort measures only order. We also found that patients with a preexisting DNR also had a higher rate of discharge with hospice compared to patients with a MET‐implemented DNR order (29% vs 4%). Thus, our data suggest that inpatient palliative care consultation and hospice services are not resources that are routinely utilized in patients with MET‐initiated DNR orders. It may be the case that the acuity and severity of illness or patient preferences may have precluded the possibility of discharging some patients in our study home with hospice care or implementing comfort care earlier in the hospital course. Patients with MET‐implemented DNR orders were younger, had fewer comorbidities, and died sooner after comfort care orders were written. The overall rate of comfort care provided to patients who died was high at 88%. We have an inpatient comfort measures only order set at our hospital, which may account for the large proportion of patients receiving comfort care at the end of life. In addition, this order set may also help to improve the quality of end‐of‐life care and thus limit the need for palliative care consultation to some extent. However, we found that patients with a MET‐implemented DNR order had a shorter time from comfort care orders to death than patients with a preexisting DNR order. This finding suggests that patients with MET‐implemented DNR orders may have had comfort care implemented relatively late in the course of illness and had less‐than‐optimal end‐of‐life care. Vazquez et al. reported improved quality of end‐of‐life care after implementation of a MET.[10] However, an inpatient palliative care service was not available in that study, and it is not clear whether or not a comfort care order set was available. Evidence suggests that utilization of palliative care resources improves end‐of‐life care in the ICU.[17, 18, 19] We found that more than half of patients who died with comfort care in the hospital did so after being transferred to the ICU for a trial of aggressive care, suggesting that this population may have benefited from more involvement of our palliative care service. In summary, our data on end‐of‐life care following MET activation suggest that the METs are able to take advantage of an opportunity to identify patients who would not want resuscitation efforts because of personal preferences or futility of treatments. However, our surrogate measures of the quality of end‐of‐life care suggest that patients with MET‐implemented DNR orders may benefit from coordinated care with inpatient palliative care services, timelier implementation of comfort care orders, and possibly increased referrals for hospice care to help improve the quality of end‐of‐life care in this population.
Our study is subject to a number of limitations. This was a single‐center study, making the results difficult to generalize. The retrospective nature of our study makes it subject to the limitations inherent in this study design, including bias and confounding. The duration of MET activation was difficult to accurately and objectively measure and is subject to reporting bias. The event stop time, in particular, was subjectively measured by the MET nurse and is difficult to accurately assess, because MET members occasionally leave the bedside and return to reevaluate the response to therapy. We tried to account for this by clearly defining the MET stop time as the point at which MET members leave the bedside and transfer care back to the primary service or physically transfer the patient to a higher level of care. It also bears mentioning that the nurses performing data entry were not aware of the study hypothesis at the time of data entry. Despite including over 1100 MET calls in our analysis, the number of patients with a MET‐implemented DNR order was relatively small, which may have limited our ability to detect differences among subgroups during our analysis. We also did not document the clinical circumstances surrounding the MET‐implemented DNR order. Although we hypothesized that these patients had a higher mortality due to a higher acuity of illness, we were unable to support this hypothesis with the data available in our retrospective study. We did not record which providers were involved in code status discussions and the exact amount time spent on these discussions, making it difficult to accurately quantify the MET resources utilized on the calls. Our MET works closely with the patient's primary service, and it is possible that some of the changes to code status were implemented by the primary service and not MET providers. The patient's primary service may have a preexisting relationship with the patient and would be in a better position to discuss goals of care than MET providers who have had no prior relationship with the patient. However, even in this case, the clinical deterioration prompting MET activation was likely the event that triggered end‐of‐life discussions. Prospective studies would be helpful not only to identify the individuals involved in code status discussions during MET activations, but also to objectively measure the time spent on such discussions. Finally, our study population consisted primarily of Caucasian patients. Preferences for end‐of‐life care may differ among socioeconomic and ethnic groups, thus limiting the generalizability of our study findings.[20, 21]
In conclusion, we found the rate of MET‐implemented DNR orders in the United States to be similar to that of previous reports in other countries. MET events involving a change in code status are associated with increased utilization of MET and ICU resources, but a shorter hospital length of stay. Despite a high inpatient mortality rate, patients with a MET‐implemented DNR had a relatively low utilization of end‐of‐life resources, including palliative care and home hospice services. Coordinated care between METs and palliative care may help to improve of end‐of‐life care in patients with a change in code status following MET activation.
Acknowledgements
The authors acknowledge the hard work and dedication provided by Elizabeth Spellman during the data collection process.
Disclosures: This work was performed at Lahey Hospital and Medical Center. The authors report no conflicts of interest.
- , , , et al. The quality of health care delivered to adults in the United States. N Engl J Med. 2003;348(26):2635–2645.
- , , , et al. Antecedents to hospital deaths. Intern Med J. 2001;31(6):343–348.
- , , , et al. The role of the medical emergency team in end‐of‐life care: a multicenter, prospective, observational study. Crit Care Med. 2012;40(1):98–103.
- , , . Rapid‐response teams. N Engl J Med. 2011;365(2):139–146.
- , , , et al. The impact of Rapid Response System on delayed emergency team activation patient characteristics and outcomes—a follow‐up study. Resuscitation. 2010;81(1):31–35.
- , , , et al. Introduction of the medical emergency team (MET) system: a cluster‐randomised controlled trial. Lancet. 2005;365(9477):2091–2097.
- , , , et al. Effects of a medical emergency team on reduction of incidence of and mortality from unexpected cardiac arrests in hospital: preliminary study. BMJ. 2002;324(7334):387–390.
- , , , et al. The Medical Emergency Team System and not‐for‐resuscitation orders: results from the MERIT study. Resuscitation. 2008;79(3):391–397.
- . Cultural differences in end‐of‐life care. Crit Care Med. 2001;29(2 Suppl):N52–N55.
- , , , et al. Enhanced end‐of‐life care associated with deploying a rapid response team: a pilot study. J Hosp Med. 2009;4(7):449–452.
- , , , et al. A new method of classifying prognostic comorbidity in longitudinal studies: development and validation. J Chronic Dis. 1987;40(5):373–383.
- , , , et al. The medical emergency team and end‐of‐life care: a pilot study. Crit Care Resusc. 2007;9(2):151–156.
- , , , et al. A retrospective cohort study of the effect of medical emergency teams on documentation of advance care directives. Crit Care Resusc. 2011;13(3):167–174.
- , , , et al. The medical emergency team a call: a sentinel event that triggers goals of care discussion. Crit Care Med. 2014;42(2):322–327.
- , , , et al. Change in end‐of‐life care for Medicare beneficiaries: site of death, place of care, and healthcare transitions in 2000, 2005, and 2009. JAMA. 2013;309(5):470–477.
- , , , et al. Trends in inpatient treatment intensity among Medicare beneficiaries at the end of life. Health Serv Res. 2004;39(2):363–375.
- , , , et al. Proactive palliative care in the medical intensive care unit: effects on length of stay for selected high‐risk patients. Crit Care Med. 2007;35(6):1530–1535.
- , . Impact of a proactive approach to improve end‐of‐life care in a medical ICU. Chest. 2003;123(1):266–271.
- , , , et al. In their own words: patients and families define high‐quality palliative care in the intensive care unit. Crit Care Med. 2010;38(3):808–818.
- , , , et al. The influence of race/ethnicity and socioeconomic status on end‐of‐life care in the ICU. Chest. 2011;139(5):1025–1033.
- , , , et al. Racial and ethnic differences in advance care planning among patients with cancer: impact of terminal illness acknowledgment, religiousness, and treatment preferences. J Clin Oncol. 2008;26(25):4131–4137.
© 2014 Society of Hospital Medicine
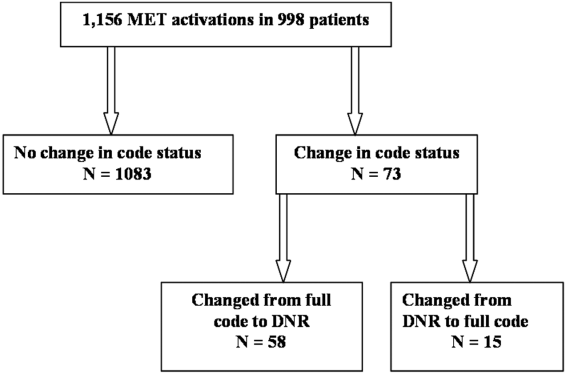
Depressive Symptoms and Readmission
Unplanned hospital readmission within 30 days is an important marker of the quality of care provided in the hospital and in the immediate posthospital setting.[1] In the United States, 1 in 5 Medicare patients is readmitted within 30 days, and related Medicare costs are estimated to be $17 billion annually.[2] Public policy is attempting to drive down healthcare costs in the United States via the Affordable Care Act by reducing payments to hospitals that have high 30‐day readmission rates.[3]
The prevalence of depression is 6.7% of adults,[4] and depressive symptomatology has been linked to hospital readmission.[5, 6] Depressive symptoms are associated with poor health outcomes and increased utilization. Patients with cardiac disease and depressive symptoms have worse outcomes.[7] Mild symptoms are associated with increased primary care and mental health care visits.[8] Both mild and moderate‐to‐severe depressive symptomatology are associated with symptom burden, physical limitation, quality of life, and overall health.[9] Importantly, many hospitalized patients, who do not have a diagnosis of depression, display depressive symptomatology.[10] A gap in knowledge exists as to the utility of stratifying depressive symptomatology between mild and moderate to severe in determining risk for hospital readmission.
Although the causal pathway to worse outcomes in patients with a diagnosis of depression has been studied,[11] the reasons for poor outcomes of patients with depressive symptomatology have not been well described, particularly in hospitalized general medical patients. Nonadherence to physician recommendations, decreased cognitive function, and poor adherence to self‐care recommendations[12, 13, 14] may explain increased healthcare utilization. Physiological models hypothesize heightened levels of proinflammatory markers[15, 16] and vascular depression[17] may play a role. There remains a gap in knowledge as to the postdischarge utilization of hospitalized patients with depressive symptomatology.
We studied the rate of hospital readmission among hospitalized adult patients with mild and moderate‐to‐severe depressive symptoms as defined by the 9‐Item Patient Health Questionnaire (PHQ‐9) depression screening tool.[18]
METHODS
Setting, Data, and Participants
Data from 2 Project Re‐Engineered Discharge (RED) clinical trials were included in a secondary analysis.[19, 20, 21] Depressive symptom screening data were available for 1418 participants originally randomized to the control and experimental groups in each trial.
The Project RED trials were a set of 2‐armed randomized controlled trials studying hospital utilization following a standardized hospital‐based discharge process. Inclusion criteria included English‐speaking patients who were 18 years or older and admitted to the adult medical service at Boston Medical Center, a large urban safety‐net hospital with an ethnically diverse patient population. Patients were required to have a telephone and have plans to return home after discharge. Patients were excluded if admitted from a skilled nursing facility or other hospital, transferred to a different hospital service before enrollment, admitted for a planned hospitalization, on hospital precautions, on suicide watch, or were deaf or blind. A full description of the methods has been described.[19] The second RED trial differed in that a health information technology system was used to teach the discharge plan to subjects at the time of discharge rather than a nurse.[20, 21]
The institutional review board of Boston University approved all study activities.
Outcome Variables
The primary end point for this analysis was the hospital readmission rate, defined as the total number of readmissions per subject within 30 days of the index discharge. Data were collected by hospital electronic medical record (EMR) review and by contacting subjects by telephone 30 days after discharge. Research staff collected data and were blinded to study group assignment. We examined emergency department (ED) utilization and primary care physician (PCP) follow‐up visit attendance rates within 30 days of discharge. Any ED or ambulatory visit resulting in hospital admission within 30 days of the index discharge date was counted as 1 readmission. Readmission and ED utilization dates occurring at Boston Medical Center were obtained from its EMR, whereas those at other hospitals were collected through subject report.
Primary Independent Variable
The primary independent variable was the PHQ‐9 screening questionnaire score, designed to identify patients with depressive symptoms. Data were collected at the time of enrollment during the index admission. Symptoms were categorized into 3 groups: no depression (PHQ‐9 score of 04, or less than a score of 2 on the first 2 questions of the PHQ‐9), mild depressive symptoms (PHQ‐9 score of 59), and moderate‐to‐severe symptoms (PHQ‐9 score of 1027).[18]
Statistical Analysis
Potential confounders were identified a priori from available literature on factors associated with hospital readmission. These included age,[22] race, gender,[23] marital status, health literacy (using the Rapid Estimate of Health Literacy in Adult Medicine [REALM] tool),[24] insurance type, employment status, income level,[25] Charlson Comorbidity Index,[26] homelessness within the past 3 months, hospital utilization within the 6 months before the index hospitalization,[27] educational attainment, length of hospital stay,[28] and study group assignment.
Demographic and other characteristics were compared by dichotomized healthcare reutilization outcomes using bivariate analysis to identify potential confounders of the relationship between depressive symptom severity and hospital readmission. [2] tests were used for categorical variables and t tests for continuous variables. Age (years) and length of stay (days) were used as continuous variables. Gender (male/female), frequent hospital admission within 6 months (01 vs 2 or more), homelessness, and presence of substance use disorder diagnosis (defined by the International Statistical Classification of Disease, 9th Revision [ICD‐9] diagnosis codes, which included 303.0 [alcohol dependence], 305.0 [alcohol abuse], 291.0 [alcohol‐induced mental disorders], 304.0 [drug dependence], 305.2305.7, 305.9 [drug abuse] and 292.0 [drug‐induced mental disorders]) were treated as dichotomous variables. Categorical variables were created for marital status (single, married, divorced/widowed), educational attainment (less than or incomplete high school, high school graduate, some college, college graduate), insurance type (Medicare, Medicaid, private insurance, or Free Care), income level (<$19,999 per year, $20,00039,000, $40,00074,999, >$75,000, or unknown/refused to answer), employment status (working full time, working part time, not working, or no answer), and health literacy level according to REALM score (044 [grade 6 or below], 4560 [grade 78], or 6166 [grade 9 or above]).
The readmission rate reflects the number of hospital readmission events per subject within 30 days of discharge. The PCP follow‐up rate reflects the number of subjects attending a posthospital PCP visit within 30 days of discharge. The incidence rate ratio (IRR) was calculated to compare the rates of readmission between those with mild, moderate to severe, and no depressive symptoms. Readmission data at 30 days are cumulative. Poisson models were used to test for significant differences between the predicted and observed number of events at 30 days. A stepwise selection process (with =0.2 as entry and exit criteria) was conducted to identify relevant confounders and to construct the final model for the association between depressive symptom screen severity and readmission. Using sensitivity analysis, we tested a model including substance abuse as a variable. This did not substantially change our final model, and therefore we did not include this variable in the final model.
A Kaplan‐Meier hazard curve was generated for time from the index discharge to the first hospital readmission within 30 days. The hazard of readmission was compared among the 3 depressive symptom screen categories using Cox proportional hazards. Two‐sided significance tests were used. P values <0.05 were considered to indicate statistical significance. All data were analyzed with SAS 9.3 (SAS Institute, Cary, NC).
Adjusted Poisson regression results identified individuals with readmission and/or ED utilization rates much higher than the sample mean. Data points with 5 or more hospital readmissions or 7 or more combined readmissions and ED utilizations were removed from analysis.
RESULTS
Of the total study population, 15.9% (225/1418) demonstrated mild depressive symptoms, and 23.7% (336/1418) demonstrated moderate‐to‐severe symptoms. Of those in our study, 38.9% (551/1418) self‐reported being told by a healthcare professional that they had depression. Of those self‐reporting depression, 27.9% (273/540) were currently taking antidepressant medication at the time of the index hospitalization. Table 1 shows baseline characteristics by dichotomized utilization outcome. Mean age, marital status, health insurance, employment status, mean length of stay, admissions in the previous 6 months, mean Charlson score, and substance abuse were significantly associated with hospital readmission. Of these characteristics, all but mean length of stay and previous history of substance abuse were significantly associated with ED utilization.
| Hospital Readmission | ED Utilization | |||
|---|---|---|---|---|
| No, n=1,240 | Yes, n=193 | No, n=1,231 | Yes, n=202 | |
| ||||
| Male, n (%) | 602 (48.6) | 105 (54.4) | 606 (49.3) | 101 (50.0) |
| Mean age, y (SD) | 49.14 (14.21)a | 52.24 (14.69)a | 50.06 (14.57)a | 46.45 (12.19)a |
| Race, n (%) | ||||
| White non‐Hispanic | 332 (26.8) | 73 (37.8) | 357 (29.0) | 48 (23.8) |
| Black non‐Hispanic | 666 (53.7) | 89 (46.1) | 646 (52.5) | 109 (54.0) |
| Hispanic | 135 (10.9) | 19 (9.8) | 124 (10.1) | 30 (14.9) |
| Other or mixed race | 59 (4.8) | 7 (3.6) | 56 (4.6) | 10 (5.0) |
| Unknown | 48 (3.9) | 5 (2.6) | 48 (3.9) | 5 (2.5) |
| Marital status, n (%) | ||||
| Single | 593 (47.8)a | 74 (38.3)a | 552 (44.8)a | 115 (56.9)a |
| Married | 286 (23.1)a | 42 (21.8)a | 296 (24.1)a | 32 (15.8)a |
| Divorced/widowed | 346 (27.9)a | 74 (38.3)a | 369 (20.0)a | 51 (25.3)a |
| Unknown | 15 (1.2)a | 3 (1.6)a | 14 (1.1)a | 4 (2.0)a |
| Annual personal income, n (%) | ||||
| <$19,999 | 511 (41.2) | 88 (45.6) | 509 (41.4) | 90 (44.6) |
| $20,000$39,999 | 184 (14.8) | 22 (11.4) | 175 (14.2) | 31 (15.4) |
| $40,000$74,999 | 107 (8.6) | 14 (7.3) | 111 (9.0) | 10 (5.0) |
| >$75,000 | 41 (3.3) | 8 (4.2) | 44 (3.6) | 5 (2.5) |
| Unknown/refused | 397 (32.0) | 61 (31.6) | 392 (31.8) | 66 (32.7) |
| Health insurance, n (%) | ||||
| Private | 321 (25.9)a | 34 (17.6)a | 316 (25.7)a | 39 (19.3)a |
| Medicaid | 510 (41.1)a | 90 (46.6)a | 485 (39.4)a | 115 (56.9)a |
| Medicare | 138 (11.1)a | 43 (22.3)a | 170 (13.8)a | 11 (5.5)a |
| Free Care | 207 (16.7)a | 14 (7.3)a | 190 (15.4)a | 31 (15.4)a |
| Other/unknown | 64 (5.2)a | 12 (6.2)a | 70 (5.7)a | 6 (3.0)a |
| Education level, n (%) | ||||
| Incomplete high school | 290 (23.4) | 45 (23.3) | 288 (23.4) | 47 (23.3) |
| High school graduate/GED | 492 (39.7) | 87 (45.1) | 489 (39.7) | 90 (44.6) |
| Some college | 257 (20.7) | 34 (17.6) | 255 (20.7) | 36 (17.8) |
| College degree | 183 (14.8) | 25 (13.0) | 183 (14.9) | 25 (12.4) |
| Unknown | 18 (1.5) | 2 (1.0) | 16 (1.3) | 4 (2.0) |
| Employment status, n (%) | ||||
| Full time | 322 (26.4)a | 31 (16.6)a | 316 (26.2)a | 37 (18.7)a |
| Part time | 136 (11.2)a | 11 (5.9)a | 124 (10.3)a | 23 (11.6)a |
| Retired | 172 (14.1)a | 37 (19.8)a | 196 (16.2)a | 13 (6.6)a |
| Disabled | 278 (22.8)a | 72 (38.5)a | 287 (23.8)a | 63 (31.8)a |
| Unemployed | 286 (23.5)a | 31 (16.6)a | 258 (21.4)a | 59 (29.8)a |
| Student | 24 (2.0)a | 5 (2.7)a | 26 (2.2)a | 3 (1.5)a |
| Homeless in past 6 months, n (%) | 143 (11.6) | 24 (12.5) | 126 (10.3) | 41 (20.4) |
| Health literacy, n (%)b | ||||
| 6th‐grade level | 230 (19.2) | 41 (22.4) | 228 (19.2) | 43 (22.4) |
| 7th8th‐grade level | 342 (28.5) | 60 (32.8) | 342 (28.7) | 60 (31.3) |
| 9th‐grade level | 627 (52.3) | 82 (44.8) | 620 (52.1) | 89 (46.4) |
| Mean length of stay, d (SD) | 2.69 (2.60)a | 3.57 (3.50)a | 2.81 (2.80) | 2.84 (2.18) |
| PCP at enrollment, n (%)c | 1,005 (81.1) | 166 (86.0) | 1,005 (81.7) | 166 (82.2) |
| 2 Admissions in past 6 months, n (%) | 300 (24.2)a | 81 (42.0)a | 292 (23.7)a | 89 (44.1)a |
| Mean Charlson score (SD)d | 2.19 (2.53)a | 2.85 (2.78)a | 2.34 (2.60)a | 1.92 (2.18)a |
| Substance abuse, n (%)e | 138 (12.0)a | 36 (19.7)a | 151 (13.1) | 23 (12.6) |
Table 2 shows the unadjusted 30 day hospital readmission, ED utilization, and PCP follow‐up rates. Participants with mild symptoms had higher readmission rates than those without symptoms (0.20 vs 0.13). In other words, 20 readmissions occurred per 100 subjects with mild symptoms, compared with 13 readmissions per 100 subjects without symptoms (P<0.001). The readmission rate was 0.21 for subjects with moderate‐to‐severe depression. The rate of ED utilization for subjects with mild symptoms was 0.18. This was significantly different from ED utilization rates of those with no depression and those with moderate‐to‐severe symptoms, which were 0.16 and 0.28, respectively (P<0.001). The postdischarge follow‐up rates were different for those without depression compared to those with mild and moderate‐to‐severe symptoms (58.7, 49.5, and 51.1, respectively), but this did not reach statistical significance (P=0.06).
| Depressive Symptom Severity Based on PHQ‐9 Score, N=1,418 | P Value | |||
|---|---|---|---|---|
| No Depression, n=857 | Mild Depressive Symptoms, n=225 | Moderate‐to‐Severe Depressive Symptoms, n=336 | ||
| ||||
| Hospital readmission, n (rate per 100) | 108 (12.6) | 44 (19.6) | 71 (21.1) | <0.001 |
| ED utilization, n (rate per 100) | 133 (15.5) | 41 (18.2) | 94 (28.0) | <0.001 |
| PCP follow‐up, n (rate per 100) | 420 (58.7) | 103 (49.5) | 157 (51.1) | 0.06 |
Poisson analyses were conducted to control for potential confounding in the relationship between symptom severity and readmission or ED utilization (Table 3). Compared to subjects with no depression, the association between mild symptoms and readmission remained significant (adjusted IRR: 1.49; 95% confidence interval [CI]: 1.11‐2.00) after controlling for relevant confounders. For those with moderate‐to‐severe symptoms, the adjusted IRR was 1.96 (95% CI: 1.51‐2.49). When compared to those without depression, the adjusted IRR for ED reutilization was not found to be significant for those with mild symptoms (1.30; 95% CI: 0.96‐1.76) and significant for those participants with moderate‐to‐severe symptoms (1.48; 95% CI: 1.16‐1.89).
| Depressive Symptom Severity Based on PHQ‐9 Score, N=1418 | P Value | |||
|---|---|---|---|---|
| No Depression, n=857 | Mild Depressive Symptoms, n=225 | Moderate‐to‐Severe Depressive Symptoms, n=336 | ||
| ||||
| Hospital readmission, n (rate per 100) | 96 (11.9) | 36 (17.1) | 67 (21.1) | <0.001 |
| Hospital readmission IRR (95% CI) | Ref | 1.49 (1.11‐2.00) | 1.96 (1.51‐2.49) | |
| ED utilization, n (rate per 100) | 124 (15.2) | 40 (19.0) | 85 (26.7) | 0.007 |
| ED utilization IRR (95% CI) | Ref | 1.30 (0.96‐1.76) | 1.48 (1.16‐1.89) | |
Figure 1 depicts the hazard curve generated for the time to first hospital readmission, stratified by depressive symptom severity. A readmission within 30 days following an index discharge date occurred in 10% of participants without depression, 14% of those with mild symptoms, and 19% of those with moderate‐to‐severe symptoms (P=0.03).
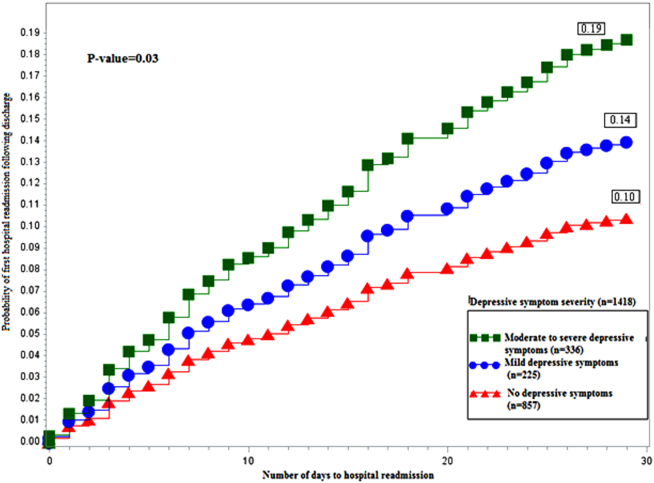
DISCUSSION
Our study shows hospitalized medical patients at an urban academic hospital with a positive screen for depressive symptoms are significantly more likely to be readmitted within 30 days of discharge as compared to those who do not screen positive. The significant association of depressive symptoms and readmission remains even after stratifying by severity and controlling for relevant confounders. Further, there appears to be a dose‐response relationship between depressive symptom severity and readmission. This graded effect makes the distinction between mild and moderate‐to‐severe depressive symptoms a better instrument at predicting rehospitalization than a diagnostic code for depression. Few studies have analyzed the readmission of general medical patients stratified by depressive symptomatology, and even fewer have addressed the presence of mild depressive symptomatology as it relates to readmission. A diagnosis of mild depression is associated with similar though less severe outcomes as compared to major depression, including negative effects on quality of life, functional disability, health status, and mortality.[29] Patients with heart failure and mild depressive symptoms have higher rates of readmission at 3 months and 1 year as compared with those without depressive symptoms, but these findings were not found to be significant.[30] Mild depressive symptoms may contribute to readmission, accrued medical cost, and burden of disease.
We extend previous research[5, 31, 32] by showing that, compared to those without and those with mild symptoms, the readmission risk is even greater for those who screen positive for moderate‐to‐severe symptoms. The mechanism linking depressive symptoms and readmission is not well understood. Behavioral mechanisms such as physical symptom amplification or anxiety about symptoms link depressive symptoms to healthcare utilization after discharge.[33] Depressive symptoms among patients with diabetes, asthma, hypertension, or human immunodeficiency virus (HIV) impairs medication adherence and self‐care behavior.[14, 34, 35, 36] Depressed patients might have reduced social support leading to increased stress, worsened symptoms, and prolonged recovery.[37] These mechanisms may prompt patients to present to hospitals for reevaluation. The direct physiologic consequences of depressive symptoms may be similar to that of the diagnosis of depression. Patients with cardiovascular disease and depression have poor outcomes, which may be related to decreased heart rate variability, hypercoagulability, high burden of inflammatory markers, and severity of left ventricular dysfunction.[38, 39] Among patients with HIV/acquired immunodeficiency syndrome and coronary artery disease, depression is linked to increased proinflammatory marker levels and less favorable outcomes, which may signal a more severe form of the disease or an impaired response to treatment.[15, 16]
Our data have several implications. Though disease burden may play a role in the presence of depressive symptomatology in hospitalized patients, screen‐positive patients still experienced more readmission events as compared to those without depressive symptoms after controlling for relevant confounders. Further, there appears to be a dose‐dependent relationship between depressive symptom severity and rate of readmission. Use of a categorical ICD‐9 code often implies that the diagnosis of depression has been confirmed. Rather than using administrative ICD‐9 codes to account for readmission risk, hospitals may consider screening patients for depressive symptoms during hospitalizations to both identify and risk‐stratify patients at high risk for readmission. Procedures should be implemented to address barriers to safe transitions in care in the screen‐positive population. The relationship between symptom severity and readmission rate may aid in the decision to devote resources to those at highest risk of readmission. Lastly, though research on the treatment of depressive symptoms in medical inpatients has been inconclusive in determining whether this approach is better than usual care or structured pharmacotherapies,[40] further study is needed to determine whether treatment of mild and moderate‐to‐severe depressive symptoms during an acute medical hospitalization will decrease readmission.
Strengths of the current study include the large dataset, the broad range of covariates available for analyses, and the inclusive nature of the sample, which was not restricted to factors such as age or medical condition.
Several limitations should be noted. We did not conduct a psychiatric evaluation to evaluate screen‐positive patients who met diagnostic criteria for minor or major depressive disorder, nor did we reconfirm the presence of symptoms at the time of or following hospital discharge. Our data, then, may not reflect patients' depressive symptomatology prior to the index hospitalization or at the time of discharge. Although such data might further refine the use of depressive symptomatology in identifying patients at high risk for readmission, our findings demonstrate that simply screening positive for depressive symptomatology at time of admission is associated with increased risk of readmission. We do not know the direction of the reported associations. If depressive symptoms are the consequence of higher disease burden, treatment of the underlying disease may be the most important intervention. Although this is possible, our model does include variables (eg, length of stay, Charlson Comorbidity Index), which are likely to adjust for disease severity, pointing to the likelihood that depressive symptoms truly predict hospital readmission independent of disease severity. Data on utilization outside Boston Medical Center (about 9% of outcomes) were determined by patient self‐report and not confirmed by document review. Our results may not be generalizable to populations other than those served by an urban safety‐net hospital or other populations excluded from analysis (eg, nonEnglish‐speaking patients, patients from nursing homes). Finally, social factors such as social support may residually confound the relationship between depressive symptom severity and readmission.
Our finding linking both mild and moderate‐to‐severe depressive symptoms to increased readmission when compared to those without depressive symptoms is significant for future policy. If future studies demonstrate that the initiation of treatment of patients who screen positive for depressive symptoms during an acute hospitalization leads to reduced readmission, policymakers should increase support for mental health screening and programming as an integral portion of general medical patient management.
In conclusion, screening positive for mild or moderate‐to‐severe depressive symptoms is associated with an increased rate of early hospital readmission as compared to those without depressive symptoms, even after controlling for relevant confounders. The rate and hazard of hospital readmission increase with symptom severity. This finding has important implications for future research for hospital screening programming and interventions for patients who screen positive for depressive symptoms.
Disclosures: This research was funded in part by grants from the Agency for Healthcare Research and Quality (NCT00252057) and the National Heart, Lung, and Blood Institute (NCT00217867). Dr. Cancino has been paid for consulting work for PracticeUpdate, a subsidiary of Elsevier. Dr. Culpepper has been paid for participation in advisory boards by AstraZeneca, Eli Lilly and Co., Boehringer Ingelheim Pharmaceuticals Inc., Forest Labs, Janssen Pharmaceuticals, Inc., Jazz Pharmaceuticals plc, H. Lundbeck A/S, Merck & Co., Pfizer Inc., Reckitt Benckiser Pharmaceuticals Inc., Sunovion Pharmaceuticals Inc., and Takeda Pharmaceuticals Inc. He has received payment for educational presentations regarding hospital readmission without mention of any pharmaceutical or other products from Merck. Dr. Mitchell has received honoraria from Merck for lectures on health behavior counseling. Trial registration: NCT00252057, NCT00217867.
- , , , , . The association between the quality of inpatient care and early readmission: a meta‐analysis of the evidence. Med Care. 1997;35(10):1044–1059.
- , , . Rehospitalizations among patients in the Medicare fee‐for‐service program. N Engl J Med. 2009;360(14):1418–1428.
- Medicare program. Final rule. Fed Regist. 2012;77(170):53257–53750.
- , , , , . Prevalence, severity, and comorbidity of 12‐month DSM‐IV disorders in the National Comorbidity Survey Replication. Arch Gen Psychiatry. 2005;62(6):617–627.
- , , , et al. Post‐discharge hospital utilization among adult medical inpatients with depressive symptoms. J Hosp Med. 2010;5(7):378–384.
- , , , , . The association between depressive symptoms and non‐psychiatric hospitalisation in older adults. PLoS One. 2012;7(4):e34821.
- , , , . Depressive symptoms and risk of functional decline and death in patients with heart failure. J Am Coll Cardiol. 2001;38(1):199–205.
- , , , . Mental health conditions are associated with increased health care utilization among urban family medicine patients. J Am Board Fam Med. 2008;21(5):398–407.
- , , , , , . Depressive symptoms and health‐related quality of life: the heart and soul study. JAMA. 2003;290(2):215–221.
- , , , , , . Major depressive disorder in hospitalized medically ill patients: an examination of young and elderly male veterans. J Am Geriatr Soc. 1991;39(9):881–890.
- , . Single item on positive affect is associated with 1‐year survival in consecutive medical inpatients. Gen Hosp Psychiatry. 2009;31(1):8–13.
- , , . The effect of depression on self‐care behaviors and quality of care in a national sample of adults with diabetes. Gen Hosp Psychiatry. 2009;31(5):422–427.
- , , , et al. The prevalence and correlates of major and minor depression in older medical inpatients. J Am Geriatr Soc. 2005;53(8):1344–1353.
- , , , , . Depression is an important contributor to low medication adherence in hemodialyzed patients and transplant recipients. Kidney Int. 2009;75(11):1223–1229.
- , . Depression and immunity: inflammation and depressive symptoms in multiple sclerosis. Neurol Clin. 2006;24(3):507–519.
- , , , et al. Synergistic effects of psychological and immune stressors on inflammatory cytokine and sickness responses in humans. Brain Behav Immun. 2009;23(2):217–224.
- , , , et al. Relationship between baseline white‐matter changes and development of late‐life depressive symptoms: 3‐year results from the LADIS study. Psychol Med. 2010;40(4):603–610.
- , , . The PHQ‐9: validity of a brief depression severity measure. J Gen Intern Med. 2001;16(9):606–613.
- , , , et al. A reengineered hospital discharge program to decrease rehospitalization: a randomized trial. Ann Intern Med. 2009;150(3):178–187.
- , , . Taking the time to care: empowering low health literacy hospital patients with virtual nurse agents. In: Proceedings of the SIGCHI Conference on Human Factors in Computing Systems. New York, NY: Association for Computing Machinery; 2009:1265–1274.
- , , , et al. Usability of conversational agents by patients with inadequate health literacy: evidence from two clinical trials. J Health Commun. 2010;15(suppl 2):197–210.
- , , , , , . Factors associated with unplanned hospital readmission among patients 65 years of age and older in a Medicare managed care plan. Am J Med. 1999;107(1):13–17.
- , , , et al. Gender as risk factor for 30 days post‐discharge hospital utilisation: a secondary data analysis. BMJ Open. 2012;2(2):e000428.
- , , , et al. Rapid estimate of adult literacy in medicine: a shortened screening instrument. Fam Med. 1993;25(6):391–395.
- , , . The impact of patient socioeconomic status and other social factors on readmission: a prospective study in four Massachusetts hospitals. Inquiry. 1994;31(2):163–172.
- , , , . A new method of classifying prognostic comorbidity in longitudinal studies: development and validation. J Chronic Dis. 1987;40(5):373–383.
- , , , . Continuity of care and patient outcomes after hospital discharge. J Gen Intern Med. 2004;19(6):624–631.
- , , , et al. Readmission after hospitalization for congestive heart failure among Medicare beneficiaries. Arch Intern Med. 1997;157(1):99–104.
- , , . Minor depression: risk profiles, functional disability, health care use and risk of developing major depression. J Affect Disord. 2004;79(1‐3):71–79.
- , , , et al. Relationship of depression to increased risk of mortality and rehospitalization in patients with congestive heart failure. Arch Intern Med. 2001;161(15):1849–1856.
- , , , et al. Antidepressant drug effects and depression severity: a patient‐level meta‐analysis. JAMA. 2010;303(1):47–53.
- , , , et al. Depression is a risk factor for rehospitalization in medical inpatients. Prim Care Companion J Clin Psychiatry. 2007;9(4):256–262.
- , , , et al. Adverse drug reactions as cause of admission to hospital: prospective analysis of 18 820 patients. BMJ. 2004;329(7456):15–19.
- , , , et al. The effect of adherence on the association between depressive symptoms and mortality among HIV‐infected individuals first initiating HAART. AIDS. 2007;21(9):1175–1183.
- , , , et al. Symptoms of depression prospectively predict poorer self‐care in patients with Type 2 diabetes. Diabet Med. 2008;25(9):1102–1107.
- , , . Self‐efficacy mediates the relationship between depressive symptoms and medication adherence among hypertensive African Americans. Health Educ Behav. 2009;36(1):127–137.
- , . The impact of depression on social skills. J Nerv Ment Dis. 2004;192(4):260–268.
- , , , et al. Relationship between left ventricular dysfunction and depression following myocardial infarction: data from the MIND‐IT. Eur Heart J. 2005;26(24):2650–2656.
- , , , et al. Platelet/endothelial biomarkers in depressed patients treated with the selective serotonin reuptake inhibitor sertraline after acute coronary events: the Sertraline AntiDepressant Heart Attack Randomized Trial (SADHART) Platelet Substudy. Circulation. 2003;108(8):939–944.
- , , , , , . Psychological treatment of depression in inpatients: a systematic review and meta‐analysis. Clin Psychol Rev. 2011;31(3):353–360.
Unplanned hospital readmission within 30 days is an important marker of the quality of care provided in the hospital and in the immediate posthospital setting.[1] In the United States, 1 in 5 Medicare patients is readmitted within 30 days, and related Medicare costs are estimated to be $17 billion annually.[2] Public policy is attempting to drive down healthcare costs in the United States via the Affordable Care Act by reducing payments to hospitals that have high 30‐day readmission rates.[3]
The prevalence of depression is 6.7% of adults,[4] and depressive symptomatology has been linked to hospital readmission.[5, 6] Depressive symptoms are associated with poor health outcomes and increased utilization. Patients with cardiac disease and depressive symptoms have worse outcomes.[7] Mild symptoms are associated with increased primary care and mental health care visits.[8] Both mild and moderate‐to‐severe depressive symptomatology are associated with symptom burden, physical limitation, quality of life, and overall health.[9] Importantly, many hospitalized patients, who do not have a diagnosis of depression, display depressive symptomatology.[10] A gap in knowledge exists as to the utility of stratifying depressive symptomatology between mild and moderate to severe in determining risk for hospital readmission.
Although the causal pathway to worse outcomes in patients with a diagnosis of depression has been studied,[11] the reasons for poor outcomes of patients with depressive symptomatology have not been well described, particularly in hospitalized general medical patients. Nonadherence to physician recommendations, decreased cognitive function, and poor adherence to self‐care recommendations[12, 13, 14] may explain increased healthcare utilization. Physiological models hypothesize heightened levels of proinflammatory markers[15, 16] and vascular depression[17] may play a role. There remains a gap in knowledge as to the postdischarge utilization of hospitalized patients with depressive symptomatology.
We studied the rate of hospital readmission among hospitalized adult patients with mild and moderate‐to‐severe depressive symptoms as defined by the 9‐Item Patient Health Questionnaire (PHQ‐9) depression screening tool.[18]
METHODS
Setting, Data, and Participants
Data from 2 Project Re‐Engineered Discharge (RED) clinical trials were included in a secondary analysis.[19, 20, 21] Depressive symptom screening data were available for 1418 participants originally randomized to the control and experimental groups in each trial.
The Project RED trials were a set of 2‐armed randomized controlled trials studying hospital utilization following a standardized hospital‐based discharge process. Inclusion criteria included English‐speaking patients who were 18 years or older and admitted to the adult medical service at Boston Medical Center, a large urban safety‐net hospital with an ethnically diverse patient population. Patients were required to have a telephone and have plans to return home after discharge. Patients were excluded if admitted from a skilled nursing facility or other hospital, transferred to a different hospital service before enrollment, admitted for a planned hospitalization, on hospital precautions, on suicide watch, or were deaf or blind. A full description of the methods has been described.[19] The second RED trial differed in that a health information technology system was used to teach the discharge plan to subjects at the time of discharge rather than a nurse.[20, 21]
The institutional review board of Boston University approved all study activities.
Outcome Variables
The primary end point for this analysis was the hospital readmission rate, defined as the total number of readmissions per subject within 30 days of the index discharge. Data were collected by hospital electronic medical record (EMR) review and by contacting subjects by telephone 30 days after discharge. Research staff collected data and were blinded to study group assignment. We examined emergency department (ED) utilization and primary care physician (PCP) follow‐up visit attendance rates within 30 days of discharge. Any ED or ambulatory visit resulting in hospital admission within 30 days of the index discharge date was counted as 1 readmission. Readmission and ED utilization dates occurring at Boston Medical Center were obtained from its EMR, whereas those at other hospitals were collected through subject report.
Primary Independent Variable
The primary independent variable was the PHQ‐9 screening questionnaire score, designed to identify patients with depressive symptoms. Data were collected at the time of enrollment during the index admission. Symptoms were categorized into 3 groups: no depression (PHQ‐9 score of 04, or less than a score of 2 on the first 2 questions of the PHQ‐9), mild depressive symptoms (PHQ‐9 score of 59), and moderate‐to‐severe symptoms (PHQ‐9 score of 1027).[18]
Statistical Analysis
Potential confounders were identified a priori from available literature on factors associated with hospital readmission. These included age,[22] race, gender,[23] marital status, health literacy (using the Rapid Estimate of Health Literacy in Adult Medicine [REALM] tool),[24] insurance type, employment status, income level,[25] Charlson Comorbidity Index,[26] homelessness within the past 3 months, hospital utilization within the 6 months before the index hospitalization,[27] educational attainment, length of hospital stay,[28] and study group assignment.
Demographic and other characteristics were compared by dichotomized healthcare reutilization outcomes using bivariate analysis to identify potential confounders of the relationship between depressive symptom severity and hospital readmission. [2] tests were used for categorical variables and t tests for continuous variables. Age (years) and length of stay (days) were used as continuous variables. Gender (male/female), frequent hospital admission within 6 months (01 vs 2 or more), homelessness, and presence of substance use disorder diagnosis (defined by the International Statistical Classification of Disease, 9th Revision [ICD‐9] diagnosis codes, which included 303.0 [alcohol dependence], 305.0 [alcohol abuse], 291.0 [alcohol‐induced mental disorders], 304.0 [drug dependence], 305.2305.7, 305.9 [drug abuse] and 292.0 [drug‐induced mental disorders]) were treated as dichotomous variables. Categorical variables were created for marital status (single, married, divorced/widowed), educational attainment (less than or incomplete high school, high school graduate, some college, college graduate), insurance type (Medicare, Medicaid, private insurance, or Free Care), income level (<$19,999 per year, $20,00039,000, $40,00074,999, >$75,000, or unknown/refused to answer), employment status (working full time, working part time, not working, or no answer), and health literacy level according to REALM score (044 [grade 6 or below], 4560 [grade 78], or 6166 [grade 9 or above]).
The readmission rate reflects the number of hospital readmission events per subject within 30 days of discharge. The PCP follow‐up rate reflects the number of subjects attending a posthospital PCP visit within 30 days of discharge. The incidence rate ratio (IRR) was calculated to compare the rates of readmission between those with mild, moderate to severe, and no depressive symptoms. Readmission data at 30 days are cumulative. Poisson models were used to test for significant differences between the predicted and observed number of events at 30 days. A stepwise selection process (with =0.2 as entry and exit criteria) was conducted to identify relevant confounders and to construct the final model for the association between depressive symptom screen severity and readmission. Using sensitivity analysis, we tested a model including substance abuse as a variable. This did not substantially change our final model, and therefore we did not include this variable in the final model.
A Kaplan‐Meier hazard curve was generated for time from the index discharge to the first hospital readmission within 30 days. The hazard of readmission was compared among the 3 depressive symptom screen categories using Cox proportional hazards. Two‐sided significance tests were used. P values <0.05 were considered to indicate statistical significance. All data were analyzed with SAS 9.3 (SAS Institute, Cary, NC).
Adjusted Poisson regression results identified individuals with readmission and/or ED utilization rates much higher than the sample mean. Data points with 5 or more hospital readmissions or 7 or more combined readmissions and ED utilizations were removed from analysis.
RESULTS
Of the total study population, 15.9% (225/1418) demonstrated mild depressive symptoms, and 23.7% (336/1418) demonstrated moderate‐to‐severe symptoms. Of those in our study, 38.9% (551/1418) self‐reported being told by a healthcare professional that they had depression. Of those self‐reporting depression, 27.9% (273/540) were currently taking antidepressant medication at the time of the index hospitalization. Table 1 shows baseline characteristics by dichotomized utilization outcome. Mean age, marital status, health insurance, employment status, mean length of stay, admissions in the previous 6 months, mean Charlson score, and substance abuse were significantly associated with hospital readmission. Of these characteristics, all but mean length of stay and previous history of substance abuse were significantly associated with ED utilization.
| Hospital Readmission | ED Utilization | |||
|---|---|---|---|---|
| No, n=1,240 | Yes, n=193 | No, n=1,231 | Yes, n=202 | |
| ||||
| Male, n (%) | 602 (48.6) | 105 (54.4) | 606 (49.3) | 101 (50.0) |
| Mean age, y (SD) | 49.14 (14.21)a | 52.24 (14.69)a | 50.06 (14.57)a | 46.45 (12.19)a |
| Race, n (%) | ||||
| White non‐Hispanic | 332 (26.8) | 73 (37.8) | 357 (29.0) | 48 (23.8) |
| Black non‐Hispanic | 666 (53.7) | 89 (46.1) | 646 (52.5) | 109 (54.0) |
| Hispanic | 135 (10.9) | 19 (9.8) | 124 (10.1) | 30 (14.9) |
| Other or mixed race | 59 (4.8) | 7 (3.6) | 56 (4.6) | 10 (5.0) |
| Unknown | 48 (3.9) | 5 (2.6) | 48 (3.9) | 5 (2.5) |
| Marital status, n (%) | ||||
| Single | 593 (47.8)a | 74 (38.3)a | 552 (44.8)a | 115 (56.9)a |
| Married | 286 (23.1)a | 42 (21.8)a | 296 (24.1)a | 32 (15.8)a |
| Divorced/widowed | 346 (27.9)a | 74 (38.3)a | 369 (20.0)a | 51 (25.3)a |
| Unknown | 15 (1.2)a | 3 (1.6)a | 14 (1.1)a | 4 (2.0)a |
| Annual personal income, n (%) | ||||
| <$19,999 | 511 (41.2) | 88 (45.6) | 509 (41.4) | 90 (44.6) |
| $20,000$39,999 | 184 (14.8) | 22 (11.4) | 175 (14.2) | 31 (15.4) |
| $40,000$74,999 | 107 (8.6) | 14 (7.3) | 111 (9.0) | 10 (5.0) |
| >$75,000 | 41 (3.3) | 8 (4.2) | 44 (3.6) | 5 (2.5) |
| Unknown/refused | 397 (32.0) | 61 (31.6) | 392 (31.8) | 66 (32.7) |
| Health insurance, n (%) | ||||
| Private | 321 (25.9)a | 34 (17.6)a | 316 (25.7)a | 39 (19.3)a |
| Medicaid | 510 (41.1)a | 90 (46.6)a | 485 (39.4)a | 115 (56.9)a |
| Medicare | 138 (11.1)a | 43 (22.3)a | 170 (13.8)a | 11 (5.5)a |
| Free Care | 207 (16.7)a | 14 (7.3)a | 190 (15.4)a | 31 (15.4)a |
| Other/unknown | 64 (5.2)a | 12 (6.2)a | 70 (5.7)a | 6 (3.0)a |
| Education level, n (%) | ||||
| Incomplete high school | 290 (23.4) | 45 (23.3) | 288 (23.4) | 47 (23.3) |
| High school graduate/GED | 492 (39.7) | 87 (45.1) | 489 (39.7) | 90 (44.6) |
| Some college | 257 (20.7) | 34 (17.6) | 255 (20.7) | 36 (17.8) |
| College degree | 183 (14.8) | 25 (13.0) | 183 (14.9) | 25 (12.4) |
| Unknown | 18 (1.5) | 2 (1.0) | 16 (1.3) | 4 (2.0) |
| Employment status, n (%) | ||||
| Full time | 322 (26.4)a | 31 (16.6)a | 316 (26.2)a | 37 (18.7)a |
| Part time | 136 (11.2)a | 11 (5.9)a | 124 (10.3)a | 23 (11.6)a |
| Retired | 172 (14.1)a | 37 (19.8)a | 196 (16.2)a | 13 (6.6)a |
| Disabled | 278 (22.8)a | 72 (38.5)a | 287 (23.8)a | 63 (31.8)a |
| Unemployed | 286 (23.5)a | 31 (16.6)a | 258 (21.4)a | 59 (29.8)a |
| Student | 24 (2.0)a | 5 (2.7)a | 26 (2.2)a | 3 (1.5)a |
| Homeless in past 6 months, n (%) | 143 (11.6) | 24 (12.5) | 126 (10.3) | 41 (20.4) |
| Health literacy, n (%)b | ||||
| 6th‐grade level | 230 (19.2) | 41 (22.4) | 228 (19.2) | 43 (22.4) |
| 7th8th‐grade level | 342 (28.5) | 60 (32.8) | 342 (28.7) | 60 (31.3) |
| 9th‐grade level | 627 (52.3) | 82 (44.8) | 620 (52.1) | 89 (46.4) |
| Mean length of stay, d (SD) | 2.69 (2.60)a | 3.57 (3.50)a | 2.81 (2.80) | 2.84 (2.18) |
| PCP at enrollment, n (%)c | 1,005 (81.1) | 166 (86.0) | 1,005 (81.7) | 166 (82.2) |
| 2 Admissions in past 6 months, n (%) | 300 (24.2)a | 81 (42.0)a | 292 (23.7)a | 89 (44.1)a |
| Mean Charlson score (SD)d | 2.19 (2.53)a | 2.85 (2.78)a | 2.34 (2.60)a | 1.92 (2.18)a |
| Substance abuse, n (%)e | 138 (12.0)a | 36 (19.7)a | 151 (13.1) | 23 (12.6) |
Table 2 shows the unadjusted 30 day hospital readmission, ED utilization, and PCP follow‐up rates. Participants with mild symptoms had higher readmission rates than those without symptoms (0.20 vs 0.13). In other words, 20 readmissions occurred per 100 subjects with mild symptoms, compared with 13 readmissions per 100 subjects without symptoms (P<0.001). The readmission rate was 0.21 for subjects with moderate‐to‐severe depression. The rate of ED utilization for subjects with mild symptoms was 0.18. This was significantly different from ED utilization rates of those with no depression and those with moderate‐to‐severe symptoms, which were 0.16 and 0.28, respectively (P<0.001). The postdischarge follow‐up rates were different for those without depression compared to those with mild and moderate‐to‐severe symptoms (58.7, 49.5, and 51.1, respectively), but this did not reach statistical significance (P=0.06).
| Depressive Symptom Severity Based on PHQ‐9 Score, N=1,418 | P Value | |||
|---|---|---|---|---|
| No Depression, n=857 | Mild Depressive Symptoms, n=225 | Moderate‐to‐Severe Depressive Symptoms, n=336 | ||
| ||||
| Hospital readmission, n (rate per 100) | 108 (12.6) | 44 (19.6) | 71 (21.1) | <0.001 |
| ED utilization, n (rate per 100) | 133 (15.5) | 41 (18.2) | 94 (28.0) | <0.001 |
| PCP follow‐up, n (rate per 100) | 420 (58.7) | 103 (49.5) | 157 (51.1) | 0.06 |
Poisson analyses were conducted to control for potential confounding in the relationship between symptom severity and readmission or ED utilization (Table 3). Compared to subjects with no depression, the association between mild symptoms and readmission remained significant (adjusted IRR: 1.49; 95% confidence interval [CI]: 1.11‐2.00) after controlling for relevant confounders. For those with moderate‐to‐severe symptoms, the adjusted IRR was 1.96 (95% CI: 1.51‐2.49). When compared to those without depression, the adjusted IRR for ED reutilization was not found to be significant for those with mild symptoms (1.30; 95% CI: 0.96‐1.76) and significant for those participants with moderate‐to‐severe symptoms (1.48; 95% CI: 1.16‐1.89).
| Depressive Symptom Severity Based on PHQ‐9 Score, N=1418 | P Value | |||
|---|---|---|---|---|
| No Depression, n=857 | Mild Depressive Symptoms, n=225 | Moderate‐to‐Severe Depressive Symptoms, n=336 | ||
| ||||
| Hospital readmission, n (rate per 100) | 96 (11.9) | 36 (17.1) | 67 (21.1) | <0.001 |
| Hospital readmission IRR (95% CI) | Ref | 1.49 (1.11‐2.00) | 1.96 (1.51‐2.49) | |
| ED utilization, n (rate per 100) | 124 (15.2) | 40 (19.0) | 85 (26.7) | 0.007 |
| ED utilization IRR (95% CI) | Ref | 1.30 (0.96‐1.76) | 1.48 (1.16‐1.89) | |
Figure 1 depicts the hazard curve generated for the time to first hospital readmission, stratified by depressive symptom severity. A readmission within 30 days following an index discharge date occurred in 10% of participants without depression, 14% of those with mild symptoms, and 19% of those with moderate‐to‐severe symptoms (P=0.03).
DISCUSSION
Our study shows hospitalized medical patients at an urban academic hospital with a positive screen for depressive symptoms are significantly more likely to be readmitted within 30 days of discharge as compared to those who do not screen positive. The significant association of depressive symptoms and readmission remains even after stratifying by severity and controlling for relevant confounders. Further, there appears to be a dose‐response relationship between depressive symptom severity and readmission. This graded effect makes the distinction between mild and moderate‐to‐severe depressive symptoms a better instrument at predicting rehospitalization than a diagnostic code for depression. Few studies have analyzed the readmission of general medical patients stratified by depressive symptomatology, and even fewer have addressed the presence of mild depressive symptomatology as it relates to readmission. A diagnosis of mild depression is associated with similar though less severe outcomes as compared to major depression, including negative effects on quality of life, functional disability, health status, and mortality.[29] Patients with heart failure and mild depressive symptoms have higher rates of readmission at 3 months and 1 year as compared with those without depressive symptoms, but these findings were not found to be significant.[30] Mild depressive symptoms may contribute to readmission, accrued medical cost, and burden of disease.
We extend previous research[5, 31, 32] by showing that, compared to those without and those with mild symptoms, the readmission risk is even greater for those who screen positive for moderate‐to‐severe symptoms. The mechanism linking depressive symptoms and readmission is not well understood. Behavioral mechanisms such as physical symptom amplification or anxiety about symptoms link depressive symptoms to healthcare utilization after discharge.[33] Depressive symptoms among patients with diabetes, asthma, hypertension, or human immunodeficiency virus (HIV) impairs medication adherence and self‐care behavior.[14, 34, 35, 36] Depressed patients might have reduced social support leading to increased stress, worsened symptoms, and prolonged recovery.[37] These mechanisms may prompt patients to present to hospitals for reevaluation. The direct physiologic consequences of depressive symptoms may be similar to that of the diagnosis of depression. Patients with cardiovascular disease and depression have poor outcomes, which may be related to decreased heart rate variability, hypercoagulability, high burden of inflammatory markers, and severity of left ventricular dysfunction.[38, 39] Among patients with HIV/acquired immunodeficiency syndrome and coronary artery disease, depression is linked to increased proinflammatory marker levels and less favorable outcomes, which may signal a more severe form of the disease or an impaired response to treatment.[15, 16]
Our data have several implications. Though disease burden may play a role in the presence of depressive symptomatology in hospitalized patients, screen‐positive patients still experienced more readmission events as compared to those without depressive symptoms after controlling for relevant confounders. Further, there appears to be a dose‐dependent relationship between depressive symptom severity and rate of readmission. Use of a categorical ICD‐9 code often implies that the diagnosis of depression has been confirmed. Rather than using administrative ICD‐9 codes to account for readmission risk, hospitals may consider screening patients for depressive symptoms during hospitalizations to both identify and risk‐stratify patients at high risk for readmission. Procedures should be implemented to address barriers to safe transitions in care in the screen‐positive population. The relationship between symptom severity and readmission rate may aid in the decision to devote resources to those at highest risk of readmission. Lastly, though research on the treatment of depressive symptoms in medical inpatients has been inconclusive in determining whether this approach is better than usual care or structured pharmacotherapies,[40] further study is needed to determine whether treatment of mild and moderate‐to‐severe depressive symptoms during an acute medical hospitalization will decrease readmission.
Strengths of the current study include the large dataset, the broad range of covariates available for analyses, and the inclusive nature of the sample, which was not restricted to factors such as age or medical condition.
Several limitations should be noted. We did not conduct a psychiatric evaluation to evaluate screen‐positive patients who met diagnostic criteria for minor or major depressive disorder, nor did we reconfirm the presence of symptoms at the time of or following hospital discharge. Our data, then, may not reflect patients' depressive symptomatology prior to the index hospitalization or at the time of discharge. Although such data might further refine the use of depressive symptomatology in identifying patients at high risk for readmission, our findings demonstrate that simply screening positive for depressive symptomatology at time of admission is associated with increased risk of readmission. We do not know the direction of the reported associations. If depressive symptoms are the consequence of higher disease burden, treatment of the underlying disease may be the most important intervention. Although this is possible, our model does include variables (eg, length of stay, Charlson Comorbidity Index), which are likely to adjust for disease severity, pointing to the likelihood that depressive symptoms truly predict hospital readmission independent of disease severity. Data on utilization outside Boston Medical Center (about 9% of outcomes) were determined by patient self‐report and not confirmed by document review. Our results may not be generalizable to populations other than those served by an urban safety‐net hospital or other populations excluded from analysis (eg, nonEnglish‐speaking patients, patients from nursing homes). Finally, social factors such as social support may residually confound the relationship between depressive symptom severity and readmission.
Our finding linking both mild and moderate‐to‐severe depressive symptoms to increased readmission when compared to those without depressive symptoms is significant for future policy. If future studies demonstrate that the initiation of treatment of patients who screen positive for depressive symptoms during an acute hospitalization leads to reduced readmission, policymakers should increase support for mental health screening and programming as an integral portion of general medical patient management.
In conclusion, screening positive for mild or moderate‐to‐severe depressive symptoms is associated with an increased rate of early hospital readmission as compared to those without depressive symptoms, even after controlling for relevant confounders. The rate and hazard of hospital readmission increase with symptom severity. This finding has important implications for future research for hospital screening programming and interventions for patients who screen positive for depressive symptoms.
Disclosures: This research was funded in part by grants from the Agency for Healthcare Research and Quality (NCT00252057) and the National Heart, Lung, and Blood Institute (NCT00217867). Dr. Cancino has been paid for consulting work for PracticeUpdate, a subsidiary of Elsevier. Dr. Culpepper has been paid for participation in advisory boards by AstraZeneca, Eli Lilly and Co., Boehringer Ingelheim Pharmaceuticals Inc., Forest Labs, Janssen Pharmaceuticals, Inc., Jazz Pharmaceuticals plc, H. Lundbeck A/S, Merck & Co., Pfizer Inc., Reckitt Benckiser Pharmaceuticals Inc., Sunovion Pharmaceuticals Inc., and Takeda Pharmaceuticals Inc. He has received payment for educational presentations regarding hospital readmission without mention of any pharmaceutical or other products from Merck. Dr. Mitchell has received honoraria from Merck for lectures on health behavior counseling. Trial registration: NCT00252057, NCT00217867.
- , , , , . The association between the quality of inpatient care and early readmission: a meta‐analysis of the evidence. Med Care. 1997;35(10):1044–1059.
- , , . Rehospitalizations among patients in the Medicare fee‐for‐service program. N Engl J Med. 2009;360(14):1418–1428.
- Medicare program. Final rule. Fed Regist. 2012;77(170):53257–53750.
- , , , , . Prevalence, severity, and comorbidity of 12‐month DSM‐IV disorders in the National Comorbidity Survey Replication. Arch Gen Psychiatry. 2005;62(6):617–627.
- , , , et al. Post‐discharge hospital utilization among adult medical inpatients with depressive symptoms. J Hosp Med. 2010;5(7):378–384.
- , , , , . The association between depressive symptoms and non‐psychiatric hospitalisation in older adults. PLoS One. 2012;7(4):e34821.
- , , , . Depressive symptoms and risk of functional decline and death in patients with heart failure. J Am Coll Cardiol. 2001;38(1):199–205.
- , , , . Mental health conditions are associated with increased health care utilization among urban family medicine patients. J Am Board Fam Med. 2008;21(5):398–407.
- , , , , , . Depressive symptoms and health‐related quality of life: the heart and soul study. JAMA. 2003;290(2):215–221.
- , , , , , . Major depressive disorder in hospitalized medically ill patients: an examination of young and elderly male veterans. J Am Geriatr Soc. 1991;39(9):881–890.
- , . Single item on positive affect is associated with 1‐year survival in consecutive medical inpatients. Gen Hosp Psychiatry. 2009;31(1):8–13.
- , , . The effect of depression on self‐care behaviors and quality of care in a national sample of adults with diabetes. Gen Hosp Psychiatry. 2009;31(5):422–427.
- , , , et al. The prevalence and correlates of major and minor depression in older medical inpatients. J Am Geriatr Soc. 2005;53(8):1344–1353.
- , , , , . Depression is an important contributor to low medication adherence in hemodialyzed patients and transplant recipients. Kidney Int. 2009;75(11):1223–1229.
- , . Depression and immunity: inflammation and depressive symptoms in multiple sclerosis. Neurol Clin. 2006;24(3):507–519.
- , , , et al. Synergistic effects of psychological and immune stressors on inflammatory cytokine and sickness responses in humans. Brain Behav Immun. 2009;23(2):217–224.
- , , , et al. Relationship between baseline white‐matter changes and development of late‐life depressive symptoms: 3‐year results from the LADIS study. Psychol Med. 2010;40(4):603–610.
- , , . The PHQ‐9: validity of a brief depression severity measure. J Gen Intern Med. 2001;16(9):606–613.
- , , , et al. A reengineered hospital discharge program to decrease rehospitalization: a randomized trial. Ann Intern Med. 2009;150(3):178–187.
- , , . Taking the time to care: empowering low health literacy hospital patients with virtual nurse agents. In: Proceedings of the SIGCHI Conference on Human Factors in Computing Systems. New York, NY: Association for Computing Machinery; 2009:1265–1274.
- , , , et al. Usability of conversational agents by patients with inadequate health literacy: evidence from two clinical trials. J Health Commun. 2010;15(suppl 2):197–210.
- , , , , , . Factors associated with unplanned hospital readmission among patients 65 years of age and older in a Medicare managed care plan. Am J Med. 1999;107(1):13–17.
- , , , et al. Gender as risk factor for 30 days post‐discharge hospital utilisation: a secondary data analysis. BMJ Open. 2012;2(2):e000428.
- , , , et al. Rapid estimate of adult literacy in medicine: a shortened screening instrument. Fam Med. 1993;25(6):391–395.
- , , . The impact of patient socioeconomic status and other social factors on readmission: a prospective study in four Massachusetts hospitals. Inquiry. 1994;31(2):163–172.
- , , , . A new method of classifying prognostic comorbidity in longitudinal studies: development and validation. J Chronic Dis. 1987;40(5):373–383.
- , , , . Continuity of care and patient outcomes after hospital discharge. J Gen Intern Med. 2004;19(6):624–631.
- , , , et al. Readmission after hospitalization for congestive heart failure among Medicare beneficiaries. Arch Intern Med. 1997;157(1):99–104.
- , , . Minor depression: risk profiles, functional disability, health care use and risk of developing major depression. J Affect Disord. 2004;79(1‐3):71–79.
- , , , et al. Relationship of depression to increased risk of mortality and rehospitalization in patients with congestive heart failure. Arch Intern Med. 2001;161(15):1849–1856.
- , , , et al. Antidepressant drug effects and depression severity: a patient‐level meta‐analysis. JAMA. 2010;303(1):47–53.
- , , , et al. Depression is a risk factor for rehospitalization in medical inpatients. Prim Care Companion J Clin Psychiatry. 2007;9(4):256–262.
- , , , et al. Adverse drug reactions as cause of admission to hospital: prospective analysis of 18 820 patients. BMJ. 2004;329(7456):15–19.
- , , , et al. The effect of adherence on the association between depressive symptoms and mortality among HIV‐infected individuals first initiating HAART. AIDS. 2007;21(9):1175–1183.
- , , , et al. Symptoms of depression prospectively predict poorer self‐care in patients with Type 2 diabetes. Diabet Med. 2008;25(9):1102–1107.
- , , . Self‐efficacy mediates the relationship between depressive symptoms and medication adherence among hypertensive African Americans. Health Educ Behav. 2009;36(1):127–137.
- , . The impact of depression on social skills. J Nerv Ment Dis. 2004;192(4):260–268.
- , , , et al. Relationship between left ventricular dysfunction and depression following myocardial infarction: data from the MIND‐IT. Eur Heart J. 2005;26(24):2650–2656.
- , , , et al. Platelet/endothelial biomarkers in depressed patients treated with the selective serotonin reuptake inhibitor sertraline after acute coronary events: the Sertraline AntiDepressant Heart Attack Randomized Trial (SADHART) Platelet Substudy. Circulation. 2003;108(8):939–944.
- , , , , , . Psychological treatment of depression in inpatients: a systematic review and meta‐analysis. Clin Psychol Rev. 2011;31(3):353–360.
© 2014 Society of Hospital Medicine
