User login
Link Between PTSD and TBI Is Only the Beginning for MRS Study
April 25, 2014
A fundamental challenge for any study examining the impact of military service on the health of military personnel is establishing a baseline. Whether heart disease or posttraumatic stress disorder (PTSD), the symptoms often appear after (sometimes long after) the service has ended. The longitudinal Marine Resiliency Study (MRS I) and its successor MRS II are seeking to resolve that issue in a novel approach that brings together the Department of Veterans Affairs, U.S. Marine Corps, and Navy Medicine.
In the MRS study, a cohort of about 2,600 Marines (MRS-I) in 4 battalions and about 1,300 Marines (MRS-II) in 2 battalions deployed to Iraq or Afghanistan underwent a scientifically rigorous examination a month prior to deployment. This baseline was established using self-reported questionnaires, clinical interviews, and laboratory examinations. Follow-up examinations were repeated at 3 months (MRS-I and MRS-II) and again at 6 months post-deployment (MRS-I).

The program is ambitious, Dr. Dewleen Baker of the VA San Diego Health Care System told Federal Practitioner. “MRS was designed to provide broad-based (psychosocial, psychophysiological, and biological) prospective, longitudinal data, with a goal toward ultimate integrated analyses of variables, to determine risk and resilience for post-deployment mental health outcomes, i.e,. PTSD and co-occurring disorders,” she explained. “Analyses have just begun, and we are working our way through aspects of the data toward more integrated approaches.”
In one of the first of many reports to come out of MRS, the researchers found that the probability of developing PTSD was highest for participants with severe pre-deployment symptoms, high combat intensity, and deployment-related traumatic brain injury (TBI). Most significant, the researchers found that TBI doubled or nearly doubled the PTSD rates for participants with less severe pre-deployment PTSD symptoms. According to Baker:
By contrast, deployment-related mild TBI increases post-deployment symptom scores by 23%, and moderate-to-severe injuries increase scores by 71%. Our findings suggest that TBI may be a very important risk factor of PTSD, even when accounting for preexisting symptoms and combat intensity.
Our study focused on the impact of pre-deployment symptoms, combat intensity and TBI; however, it is important to consider other factors of psychological risk and resilience. Genes, coping style, and social support are just a few of the many other factors that may influence an individual’s response to stress.
Creating a rigorous cross-agency research study required tact, diligence, and patience from the MRS team. “Each agency has their own unique culture and institutional rules, regulations, and bureaucracy, so ideas, programs, etc, must be vetted across all agencies and reconciled—the various cultures/agencies to be reconciled include DoD, VA and academia.” Baker explained. “In addition in regards to initiation of studies for MRS II, for the past couple years, we also interface with NIMH as well as Headquarters Marine Corps; NIMH has the role of scientific review of MRS-II studies carried out under Headquarters Marine Corps/BUMED funding.”
The MRS-I and II studies may very well provide a template for future studies. The MRS team included a military liaison to work with the active duty Marines and attached Sailors, gather data, schedule meetings, and to report findings. “This study has a lot of experience working within and across these agencies,” Baker noted, “It’s an excellent model for future VA/DOD joint projects.”
April 25, 2014
A fundamental challenge for any study examining the impact of military service on the health of military personnel is establishing a baseline. Whether heart disease or posttraumatic stress disorder (PTSD), the symptoms often appear after (sometimes long after) the service has ended. The longitudinal Marine Resiliency Study (MRS I) and its successor MRS II are seeking to resolve that issue in a novel approach that brings together the Department of Veterans Affairs, U.S. Marine Corps, and Navy Medicine.
In the MRS study, a cohort of about 2,600 Marines (MRS-I) in 4 battalions and about 1,300 Marines (MRS-II) in 2 battalions deployed to Iraq or Afghanistan underwent a scientifically rigorous examination a month prior to deployment. This baseline was established using self-reported questionnaires, clinical interviews, and laboratory examinations. Follow-up examinations were repeated at 3 months (MRS-I and MRS-II) and again at 6 months post-deployment (MRS-I).
The program is ambitious, Dr. Dewleen Baker of the VA San Diego Health Care System told Federal Practitioner. “MRS was designed to provide broad-based (psychosocial, psychophysiological, and biological) prospective, longitudinal data, with a goal toward ultimate integrated analyses of variables, to determine risk and resilience for post-deployment mental health outcomes, i.e,. PTSD and co-occurring disorders,” she explained. “Analyses have just begun, and we are working our way through aspects of the data toward more integrated approaches.”
In one of the first of many reports to come out of MRS, the researchers found that the probability of developing PTSD was highest for participants with severe pre-deployment symptoms, high combat intensity, and deployment-related traumatic brain injury (TBI). Most significant, the researchers found that TBI doubled or nearly doubled the PTSD rates for participants with less severe pre-deployment PTSD symptoms. According to Baker:
By contrast, deployment-related mild TBI increases post-deployment symptom scores by 23%, and moderate-to-severe injuries increase scores by 71%. Our findings suggest that TBI may be a very important risk factor of PTSD, even when accounting for preexisting symptoms and combat intensity.
Our study focused on the impact of pre-deployment symptoms, combat intensity and TBI; however, it is important to consider other factors of psychological risk and resilience. Genes, coping style, and social support are just a few of the many other factors that may influence an individual’s response to stress.
Creating a rigorous cross-agency research study required tact, diligence, and patience from the MRS team. “Each agency has their own unique culture and institutional rules, regulations, and bureaucracy, so ideas, programs, etc, must be vetted across all agencies and reconciled—the various cultures/agencies to be reconciled include DoD, VA and academia.” Baker explained. “In addition in regards to initiation of studies for MRS II, for the past couple years, we also interface with NIMH as well as Headquarters Marine Corps; NIMH has the role of scientific review of MRS-II studies carried out under Headquarters Marine Corps/BUMED funding.”
The MRS-I and II studies may very well provide a template for future studies. The MRS team included a military liaison to work with the active duty Marines and attached Sailors, gather data, schedule meetings, and to report findings. “This study has a lot of experience working within and across these agencies,” Baker noted, “It’s an excellent model for future VA/DOD joint projects.”

Drug confers benefits for subset of AML patients

Credit: Rhoda Baer
A drug that combines 2 chemotherapy agents into 1 can be more effective than treatment with the individual agents in combination, results of a phase 2 study suggest.
The drug, CPX-351, is a fixed-ratio combination of cytarabine and daunorubicin inside a lipid vesicle.
In older patients with acute myeloid leukemia (AML), CPX-351 elicited a higher response rate than combination treatment with cytarabine and daunorubicin, although the difference was not significant.
Likewise, there were no significant differences in event-free survival (EFS) or overall survival (OS) between the 2 treatment groups.
However, CPX-351 conferred a significant response benefit among patients with poor cytogenetics and a significant survival benefit in patients with secondary AML (sAML).
Jeffrey Lancet, MD, of the Moffitt Cancer Center in Tampa, Florida, and his colleagues reported these results in Blood. The study was funded by Celator Pharmaceuticals, the company developing CPX-351.
Treatment details
The researchers analyzed 126 newly diagnosed AML patients who were 60 to 75 years of age.
Patients were randomized to receive CPX-351 (n=85) or “control” treatment consisting of cytarabine and daunorubicin (n=41). The 2 treatment groups were well-balanced for disease and patient characteristics at baseline.
As induction, patients in the CPX-351 arm received a 90-minute infusion of the drug at 100 units/m2 on days 1, 3, and 5 (delivering 100 mg/m2 cytarabine and 44 mg/m2 daunorubicin with each dose). Second induction and consolidation courses were given at 100 units/m2 on days 1 and 3.
Patients in the control arm received induction therapy consisting of cytarabine at 100 mg/m2/day by 7-day continuous infusion and daunorubicin at 60 mg/m2/day on days 1, 2, and 3. Daunorubicin could be reduced to 45 mg/m2/day at the investigator’s discretion for patients with advanced age, poor performance status, or reduced liver/kidney function.
The choice of consolidation therapy was at the investigator’s discretion as well. The recommended regimens included cytarabine at 100 to 200 mg/m2 for 5 to 7 days, with or without daunorubicin or intermediate-dose cytarabine (1.0 to 1.5 g/m2/dose).
Response and survival
The response rate was higher in the CPX-351 arm than in the control arm—66.7% and 51.2%, respectively (P=0.07), which met the predefined criterion for success (P<0.1). Response was defined as a complete response (CR) or a complete response with incomplete blood count recovery (CRi).
CRs occurred in 48.8% of patients in both arms. But CRis favored the CPX-351 arm over the control arm—17.9% and 2.4%, respectively.
Likewise, response rates favoring CPX-351 occurred in patients with adverse cytogenetics and sAML.
Among patients with adverse cytogenetics, the response rate was 77.3% in the CPX-351 arm and 38.5% in the control arm (P=0.03). And among patients with sAML, the response rate was 57.6% in the CPX-351 arm and 31.6% in the control arm (P=0.06).
The median OS was 14.7 months in the CPX-351 arm and 12.9 months in the control arm. The median EFS was 6.5 months and 2.0 months, respectively. These differences were not statistically significant.
However, sAML patients treated with CPX-351 had significantly better OS than sAML patients in the control arm. The median OS was 12.1 months and 6.1 months, respectively (P=0.01). And the median EFS was 4.5 months and 1.3 months, respectively (P=0.08).
Safety results
By day 60, 4.7% of patients in the CPX-351 arm and 14.6% of patients in the control arm had died. All of these deaths occurred in high-risk patients, particularly those with sAML.
Two patients died of intracranial hemorrhage during CPX-351 consolidation. One of these deaths was associated with head trauma and relapsed AML, and the other was from chemotherapy-induced thrombocytopenia.
For many of the most common adverse events, there were minimal differences between the treatment arms. These events included febrile neutropenia, infection, rash, diarrhea, nausea, edema, and constipation.
Patients in the CPX-351 arm had a higher incidence of grade 3-4 infection than controls—70.6% and 43.9%, respectively—but not infection-related deaths—3.5% and 7.3%, respectively.
The median time to neutrophil recovery (to ≥ 1000/μL) was longer in the CPX-351 arm than the control arm—36 days and 32 days, respectively. The same was true for platelet recovery (to ≥ 100,000/μL)—37 days and 28 days, respectively.
Researchers are now conducting a phase 3 trial of CPX-351, which is open and recruiting patients. ![]()
Team reprograms blood cells into HSCs in mice

Researchers have found a way to reprogram mature blood cells from mice into hematopoietic stem cells (HSCs), according to a paper published in Cell.
The team used 8 transcription factors to reprogram blood progenitor cells and mature mouse myeloid cells into HSCs.
These cells, called induced HSCs (iHSCs), have the functional hallmarks of natural HSCs, are able to self-renew like natural HSCs, and can give rise to all of the cellular components of the blood.
“Blood cell production invariably goes in one direction—from stem cells, to progenitors, to mature effector cells,” said study author Derrick J. Rossi, PhD, of Boston Children’s Hospital in Massachusetts.
“We wanted to reverse the process and derive HSCs from differentiated blood cells using transcription factors that we found were specific to HSCs.”
To that end, Dr Rossi and his colleagues screened gene expression in 40 different types of blood and blood progenitor cells from mice. From this screen, the team identified 36 transcription factors that are expressed in HSCs but not in the cells that arise from them.
In a series of mouse transplantation experiments, the researchers found that 6 of the 36 transcription factors—Hlf, Runx1t1, Pbx1, Lmo2, Zfp37, and Prdm5—plus 2 additional factors not originally identified in their screen—Mycn and Meis1—were sufficient to reprogram 2 kinds of blood progenitor cells—pro/pre-B cells and common myeloid progenitor cells—into iHSCs.
The team reprogrammed their source cells by exposing them to viruses containing the genes for all 8 transcription factors and a molecular switch that turned the factor genes on in the presence of doxycycline. They then transplanted the exposed cells into recipient mice and activated the genes by giving the mice doxycycline.
The resulting iHSCs were capable of generating the entire blood cell repertoire in the transplanted mice, showing they had gained the ability to differentiate into all blood lineages. Stem cells collected from those recipients were capable of reconstituting the blood of secondary transplant recipients, proving that the 8-factor cocktail could instill the capacity for self-renewal.
Taking the work a step further, the researchers treated mature mouse myeloid cells with the same 8-factor cocktail. The resulting iHSCs produced all of the blood lineages and could regenerate the blood of secondary transplant recipients.
Study author Stuart Orkin, MD, of the Dana-Farber Cancer Institute in Boston, noted that the use of mice as a kind of reactor for reprogramming marks a novel direction in HSC research.
“In the blood research field, no one has the conditions to expand HSCs in the tissue culture dish,” he said. “Instead, by letting the reprogramming occur in mice, Rossi takes advantage of the signaling and environmental cues HSCs would normally experience.”
Dr Orkin added that iHSCs are nearly indistinguishable from normal HSCs at the transcriptional level. Unfortunately, though, these findings are far from translation to the clinic.
Researchers must still ascertain the precise contribution each of the 8 transcription factors makes in the reprogramming process and determine whether approaches that do not rely on viruses and transcription factors can have similar success.
In addition, studies are needed to test whether these results can be achieved using human cells and if other, non-blood cells can be reprogrammed to iHSCs. ![]()
A new method for measuring DNA repair

Credit: NIGMS
Cells have several major repair systems that can fix DNA damage, which may lead to cancer and other diseases if not mended.
Unfortunately, the effectiveness of these repair systems varies greatly from person to person.
Now, researchers have developed a test that can rapidly assess several of these repair systems, which could potentially help us determine an individual’s risk of developing cancer and predict how a patient might respond to chemotherapy.
The new test, described in Proceedings of the National Academy of Sciences, can analyze 4 types of DNA repair capacity simultaneously, in less than 24 hours. Previous tests have only been able to evaluate a single system at a time.
“All of the repair pathways work differently, and the existing technology to measure each of those pathways is very different for each one,” said study author Zachary Nagel, PhD, of the Massachusetts Institute of Technology in Cambridge.
“What we wanted to do was come up with one way of measuring all DNA repair pathways at the same time so you have a single readout that’s easy to measure.”
The researchers used this approach to measure DNA repair in lymphoblastoid cells taken from 24 healthy subjects. The team found a huge range of variability, especially in one repair system, where some subjects’ cells were more than 10 times more efficient than others.
“None of the cells came out looking the same,” said study author Leona Samson, PhD, also of MIT. “They each have their own spectrum of what they can repair well and what they don’t repair well. It’s like a fingerprint for each person.”
Measuring repair
With the new test, the team can measure how well cells repair the most common DNA lesions, including single-strand breaks, double-strand breaks, mismatches, and the introduction of alkyl groups caused by pollutants such as fuel exhaust and tobacco smoke.
To achieve this, the researchers created 5 different circular pieces of DNA, 4 of which carry DNA lesions. Each of these circular DNA strands, or plasmids, also carries a gene for a different colored fluorescent protein.
In some cases, the DNA lesions prevent those genes from being expressed, so when the DNA is successfully repaired, the cell begins to produce the fluorescent protein. In others, repairing the DNA lesion turns the fluorescent gene off.
By introducing these plasmids into cells and reading the fluorescent output, scientists can determine how efficiently each kind of lesion has been repaired. In theory, more than 5 plasmids could go into each cell, but the researchers limited each experiment to 5 reporter plasmids to avoid potential overlap among colors.
To overcome that limitation, the researchers are also developing an alternative tactic that involves sequencing the messenger RNA produced by cells when they copy the plasmid genes, instead of measuring fluorescence.
In this study, the team tested the sequencing approach with just one type of DNA repair, but it could allow for unlimited tests at one time. And the researchers could customize the target DNA sequence to reveal information about which type of lesion the plasmid carries, as well as information about which patient’s cells are being tested.
This would provide the ability for many different patient samples to be tested in the same batch, making the test more cost-effective.
Making predictions
Previous studies have shown that many different types of DNA repair capacity can vary greatly among apparently healthy individuals. Some of these differences have been linked with cancer vulnerability.
Scientists have also identified links between DNA repair and neurological, developmental, and immunological disorders. But useful predictive DNA-repair-based tests have not been developed, largely because it has been impossible to rapidly analyze several different types of DNA repair capacity at once.
Dr Samson’s lab is now working on adapting the new test so it can be used with blood samples taken from patients, allowing researchers to identify patients who are at higher risk of disease and potentially enabling prevention or earlier diagnosis of diseases linked to DNA repair.
Such a test could also be used to predict a patient’s response to chemotherapy or to determine how much radiation treatment a patient can tolerate.
The researchers also believe this test could be exploited to screen for new drugs that inhibit or enhance DNA repair. Inhibitors could be targeted to tumors to make them more susceptible to chemotherapy, while enhancers could help protect people who have been accidentally exposed to DNA-damaging agents, such as radiation. ![]()
Group maps B-cell development
New technology has allowed scientists to create the most comprehensive map of B-cell development to date, according to a paper published in Cell.
The team combined emerging technologies for studying single cells with an advanced computational algorithm to map human B-cell development.
They believe their approach could improve researchers’ ability to investigate development in all cells and make it possible to identify rare aberrations that lead to disease.
“There are so many diseases that result from malfunctions in the molecular programs that control the development of our cell repertoire and so many rare, yet important, regulatory cell types that we have yet to discover,” said study author Dana Pe’er, PhD, of Columbia University in New York.
“We can only truly understand what goes wrong in these diseases if we have a complete map of the progression in normal development.”
Combining technologies
Dr Pe’er and her colleagues used mass cytology to observe cells in a bone marrow sample. In a single experiment, mass cytology can measure 44 molecular markers simultaneously in millions of individual cells. This provides data that can be used to compare, categorize, and order cells, as well as identify the molecular systems responsible for development.
Taking advantage of this data required the researchers to develop new mathematical and computational methods for interpreting it. Just as one can represent a physical object in 3 dimensions, the Pe’er lab’s approach involved thinking of the 44 measurements as a 44-dimensional geometric object.
So they created a new computational algorithm called Wanderlust, which uses mathematical concepts from a field called graph theory to reduce this high-dimensional data into a simple form that is easier to interpret. Wanderlust converts the developmental marker measurements in each cell into a single, 1-dimensional value that corresponds to the cell’s place within the chronology of development.
“Our body has trillions of cells of countless different types, each type bearing different molecular features and behavior,” Dr Pe’er noted. “This complexity expands from a single cell in a carefully regulated process called development.”
“This regulation creates patterns and shapes in the high-dimensional data we measure. By using Wanderlust to analyze these data, we can find the pattern and trace the trajectory that cellular development follows.”
Mapping B-cell development
To test their approach, the researchers studied development in human B cells. The team used mass cytometry to profile 44 markers in a cohort of approximately 200,000 healthy immune cells that were gathered from a single bone marrow sample.
In each cell, they measured surface markers that help identify cell type, as well as markers inside the cell that can reveal what the cell is doing, including markers for signaling, the cell cycle, apoptosis, and genome rearrangement.
Using Wanderlust to analyze the high-dimensional data provided by mass cytometry, the researchers accurately ordered the entire trajectory of 200,000 cells according to their developmental chronology. Wanderlust captured and correctly ordered all of the primary molecular landmarks known to be present in human B-cell development.
The algorithm also pinpointed a number of previously unknown regulatory signaling checkpoints that are required for human B-cell development, as well as uncharacterized subtypes of B-cell progenitors that correspond to developmental stages.
The researchers identified rare, previously unknown signaling events involving STAT5 that occurred in just 7 out of 10,000 cells. The team found that disrupting these signaling events using kinase inhibitors fully stalled the development of B cells.
Identifying and characterizing the regulatory checkpoints that control and monitor cell fate can have many practical applications, the researchers said, including the development of new diagnostics and therapeutics.
Furthermore, the team’s mapping process can be applied to any type of cell. They believe their method offers the possibility of studying normal development as well as the processes responsible for any kind of developmental disease.
“This current project is a landmark, both in the study of development and in single-cell research, and has completely changed the way I think about science,” Dr Pe’er said. “A fire has been lit, and these findings are just the tip of the iceberg of what is now possible.” ![]()
Better Medication Adherence with Intervention; Clinical Outcomes Unchanged
Clinical question
Does an intervention consisting of increased pharmacist involvement and education increase long-term medication adherence in patients after hospitalization for acute coronary syndrome?
Bottom line
Following hospitalization for acute coronary syndrome (ACS), an intervention that emphasizes medication reconciliation, pharmacist-led education, collaboration between pharmacists and physicians, and automated reminders increases patients’ adherence to cardiac medications. However, there was no significant effect seen on clinical outcomes after 1 year. (LOE = 1b)
Reference
Ho PM, Lambert-Kerzner A, Carey EP, et al. Multifaceted intervention to improve medication adherence and secondary prevention measures after acute coronary syndrome hospital discharge: A randomized clinical trial. JAMA Intern Med 2014;174(2):186-193.
Study design
Randomized controlled trial (nonblinded)
Funding source
Government
Allocation
Concealed
Setting
Inpatient (any location) with outpatient follow-up
Synopsis
In this study performed at 4 Veteran Affairs (VA) medical centers, investigators enrolled 253 patients who were hospitalized with a primary diagnosis of ACS, had an anticipated discharge to home, and used the VA as their primary source of medical and pharmaceutical care. Using concealed allocation, patients were randomized to receive usual care or the intervention. Both groups received standard discharge instructions, discharge medication lists, and education on cardiac medications prior to discharge. The intervention group also received the following: (1) two sessions of medication reconciliation and education by a pharmacist within one month of discharge; (2) automated educational voice messages about medications, as well as access to pharmacists upon request throughout the study; (3) collaboration between the patient’s primary care physician and/or cardiologist; and (4) regular voice messages with reminders to take medications and refill medications for the remainder of the year. All patients were scheduled for a 12-month clinic visit. Baseline characteristics of the 2 groups were similar (mean age = 64 years; all but 5 of the patients were men). Patients in the intervention group received an average of 4 hours of additional pharmacist time. For the primary outcome of adherence to 4 classes of cardioprotective medications (beta-blockers, statins, clopidogrel, and angiotensin-converting enzyme inhibitors or angiotensin receptor blockers), more patients in the intervention group were adherent compared with the usual care group (89% vs 74%; P = .003). The high adherence in the usual care group reflects a self-selection bias since enrolled patients were those who had volunteered for the study. Despite greater medication adherence in the intervention group, there were no significant differences in the proportion of patients reaching blood pressure and LDL cholesterol goals between the 2 groups. Additionally, tertiary outcomes -- including rehospitalization for myocardial infarction, revascularization, and mortality -- were similar in the 2 groups. The estimated cost for the intervention was approximately $360 per patient, mainly because of additional pharmacist and cardiologist time. No significant differences in costs due to medication prescriptions were noted in the study.
Dr. Kulkarni is an assistant professor of hospital medicine at Northwestern University in Chicago.
Improved Mortality with CABG vs PCI in Multivessel Disease
Clinical question
For patients with multivessel disease, which is the better approach for reducing long-term mortality: coronary artery bypass grafting or percutaneous coronary intervention?
Bottom line
When compared with percutaneous coronary intervention (PCI), coronary artery bypass grafting (CABG) reduces overall mortality and myocardial infarctions (MIs) in patients with multivessel disease. You would need to treat 37 patients with CABG to prevent one death, and 26 patients with CABG to prevent one MI over an average follow-up of 4 years. This is compared with a number needed to treat to harm of 105 to cause one additional stroke with CABG. (LOE = 1a)
Reference
Sipahi I, Akay H, Dagdelen S, Blitz A, Alhan C. Coronary artery bypass grafting vs percutaneous coronary intervention and long-term mortality and morbidity in multivessel disease: meta-analysis of randomized clinical trials of the arterial grafting and stenting era. JAMA Intern Med 2014;174(2):223-230.
Study design
Meta-analysis (randomized controlled trials)
Funding source
Unknown/not stated
Allocation
Uncertain
Setting
Various (meta-analysis)
Synopsis
Existing trials that compare CABG with PCI are underpowered to detect a difference in long-term mortality or MI. To study these outcomes, these investigators searched multiple databases, including MEDLINE and the Cochrane Central Register of Controlled Trials, to find randomized controlled trials that compared the 2 approaches over an average follow-up of at least 1 year in patients with multivessel disease. To ensure that these trials reflected contemporary practice, the authors only included trials in which arterial grafts were used in 90% of the CABG cases and trials in which stents were used in 70% of the PCI cases. Two investigators independently extracted data from the 6 included trials. No formal quality assessment was performed. No publication bias was detected. When taken together, data from the 6 trials (N = 6055) showed that the use of CABG as compared with PCI resulted in a 27% reduction in mortality (relative risk [RR] = 0.73; 95% CI, 0.62-0.86) and a 42% reduction in MI (RR = 0.58; 0.48-0.72). Although there was a nonsignificant trend toward increased strokes in the CABG group (likely related to periprocedural events), this approach also led to fewer repeat revascularizations (number needed to treat [NNT] = 7), as well as fewer overall major adverse cardiac and cerebrovascular events (NNT = 10).
Dr. Kulkarni is an assistant professor of hospital medicine at Northwestern University in Chicago.
2014 Update on cervical disease
Advances in cervical cancer screening continue apace. We are fortunate that these advances are based on a substantial amount of high-quality prospective evidence. Many of these advances are designed to target the women who have clinically relevant disease while minimizing harm and anxiety caused by unnecessary procedures related to cervical screening test abnormalities that have little clinical relevance.
With clinicians being regularly judged on performance and outcomes, adoption of advances and new guidelines should be considered relatively quickly by women’s health providers.
In this article, I focus on two significant advances of the past (and coming) year:
- recent application and unanimous approval by a Food and Drug Administration (FDA) expert panel for the use of the cobas human papillomavirus (HPV) DNA test as a primary cervical cancer screen
- the latest update of guidelines on the management of abnormal cervical screening tests from the American Society for Colposcopy and Cervical Pathology (ASCCP).
cobas HPV TEST IS POISED FOR FDA APPROVAL AS A PRIMARY SCREEN FOR CERVICAL CANCER
Wright TC Jr, Stoler MH, Behrens CM, Apple R, Derion T, Wright TL. The ATHENA human papillomavirus study: design, methods, and baseline results. Am J Obstet Gynecol. 2012;206(1):46.e1–e11.
An FDA expert panel unanimously approved the cobas (Roche Molecular Diagnostics; Pleasanton, California) HPV DNA test on March 12, 2014. The FDA will decide on potential approval within the coming months. Although the FDA sometimes reaches a different decision from one of its advisory committees when it comes to a final vote on a product or device, most often the FDA concurs with the committee’s judgment. Therefore, approval of the cobas HPV test as a primary screen is likely.
Related article: FDA Advisory Committee recommends HPV test as primary screening tool for cervical cancer Deborah Reale (News for your Practice, March 2014)
The cobas HPV test yields a pooled result for 12 high-risk HPV types (hrHPV 31, 33, 35, 39, 45, 51, 52, 56, 58, 59, 66, and 68), as well as individual results for types 16 and 18; it also has an internal control for specimen adequacy. HPV 16 and 18 account for roughly 70% of all cases of cervical cancer, and infection with both types are known to place women at high risk for having clinically relevant disease—more so than the other hrHPV types.
COMMITTEE REVIEWED DATA FROM ATHENA IN VOTING FOR APPROVAL
In considering the cobas HPV test, the advisory committee reviewed data from the Addressing the Need for Advanced HPV Diagnostics (ATHENA) trial, a prospective, multicenter, US-based study of 47,208 women aged 21 and older. These women were recruited at the time of undergoing routine screening for cervical cancer; only 2.6% had been vaccinated against HPV. All were screened by liquid-based cytology and an HPV test. Those who had abnormal cytology or a positive test for a high-risk HPV type underwent colposcopy, as did a randomly selected group of women aged 25 or older who tested negative on both tests.
The prevalence of abnormal findings was:
- 7.1% for liquid-based cytology
- 12.6% for pooled high-risk HPV
- 2.8% for HPV 16
- 1.0% for HPV 18.
As expected, cytologic abnormalities and infection with high-risk HPV types declined with increasing age. The adjusted prevalence of cervical intraepithelial neoplasia (CIN) grade 2 or higher in women aged 25 to 34 years was 2.3%; it declined to 1.5% among women older than age 34. Of note, approximately 500,000 US women are given a diagnosis of CIN 2 or CIN 3 each year in the United States.
WHY ATHENA IS IMPORTANT
This US-based trial was designed to assess the medical utility of pooled high-risk HPV DNA in addition to genotyping for HPV 16 and 18 in three populations:
- women aged 21 and older with a cytologic finding of atypical squamous cells of undetermined significance (ASC-US)
- women aged 30 and older with normal cytology
- women aged 25 and older in the overall screening population with any cytologic finding.
Investigators were particularly interested in the use of the HPV test as:
- a triage for women with abnormal cytologic findings
- an adjunct to guide clinical management of women with negative cytology results
- a potential front-line test in the screening of women aged 25 and older.
Related article: Endometrial cancer update: The move toward personalized cancer care Lindsay M. Kuroki, MD, and David G. Mutch, MD (October 2013)
The participants of the ATHENA trial were representative of women undergoing screening for cervical cancer in the United States—both in terms of demographics and in the distribution of cytologic findings. For example, recent US census data indicate that the female population is 79% white, 13% black, and 16% Hispanic or Latino—figures comparable to the breakdown of race/ethnicity in the ATHENA trial.
The trial was conducted in a baseline phase (published in 2012) and a 3-year follow-up phase (not yet published). The 3-year data were reviewed by the FDA advisory committee during its consideration of the cobas HPV test as a primary screen.
DESPITE PROBABLE APPROVAL, INCREMENTAL CHANGE IS LIKELY
Although a move to the HPV test as the primary screen is a definite paradigm shift for what has been cytology-based screening since the initiation of cervical cancer screening, the changeover from primary cytology to primary HPV testing likely will be slow. It will require education of clinicians as well as patients, and a shift in many internal procedures for pathology laboratories.
The ATHENA trial also leaves some intriguing questions unanswered:
- How do we transition women into the new screening strategy? Many women today still undergo cytology screening with reflex HPV testing, as appropriate, and an increasing number of women aged 30 and older undergo cotesting with both cytology and HPV testing. When should they begin screening in a primary HPV testing setting? And what screening intervals will be recommended? If a woman already has been screened with cytology, how should she transition into and at what interval should she begin primary HPV screening?
- How should we manage women’s care after the first round of primary HPV testing? The ATHENA trial so far only has outcomes data after one round of HPV testing. While some data are available from Europe, we do not know what happens after two or three rounds of screening with primary HPV testing in a large US-based cohort. We clearly will be identifying and treating many women with preinvasive disease from screening after one round of testing, at a rate likely higher than with cytology alone—a good thing. We also likely will be reducing the number of unnecessary colposcopies for cytology that are not related to hrHPV.
What this EVIDENCE means for practice
Screening women using the cobas HPV test as a primary screen will require considerable education of providers and patients to explain how this change will affect how a woman will be managed after being screened for cervical cancer. Though much remains to be determined about this new cervical cancer screening paradigm (eg, logistics, timing, use of secondary tests), it should reduce the number of screening tests and colposcopies necessary to detect clinically relevant disease.
UPDATED ASCCP GUIDELINES EMPHASIZE EQUAL MANAGEMENT FOR EQUAL RISK
Massad LS, Einstein MH, Huh WK, et al; 2012 ASCCP Consensus Guidelines Conference. 2012 updated consensus guidelines for the management of abnormal cervical cancer screening tests and cancer precursors. J Low Genit Tract Dis. 2013;17(5 Suppl 1):S1–S27.
In formulating this latest set of guidelines for the management of abnormal cervical cancer screening tests and cancer precursors, the ASCCP led a conference consisting of scientific stakeholders to perform a comprehensive review of the literature. Also, with study investigators at Kaiser Permanente Northern California (KPNC) and the National Cancer Institute, the guidelines panel also modeled and assessed data on risk after abnormal tests from almost 1.4 million women followed over 8 years in the KPNC Medical Care Plan—this cohort has provided us with “big data.”
The sheer size of the Kaiser Permanente population made it possible for the ASCCP-led panel to validate its previous guidelines or to modify them, where needed. It also made risk-based stratification possible for even rare abnormalities and clinical outcomes.
Although findings from the KPNC population may not be fully generalizable to the US population as a whole, they enhance our understanding of the optimal management of abnormal cervical cancer screening tests and cancer precursors. More widely dispersed study cohorts on a similar scale in the United States are unlikely in the near future.
Related article: Update on cervical disease Mark H. Einstein, MD, MS, and J. Thomas Cox, MD (May 2013)
SEVERAL SIGNIFICANT MODIFICATIONS
Although the ASCCP reaffirmed most elements of its 2006 consensus management guidelines, it did make a number of changes:
- Women who have ASC-US cytology but test HPV-negative now should be followed with cotesting at 3 years rather than 5 years before they return to routine screening.
- Women near age 65 who have a negative finding on ASC-US cytology and HPV testing should not exit screening.
- Women who have ASC-US cytology and test HPV-positive should go to immediate colposcopy, regardless of hrHPV results, including genotyping.
- Women who test positive for HPV 16 or 18 but have negative cytology should undergo immediate colposcopy.
- Women aged 21 to 24 years should be managed as conservatively and minimally invasively as possible, especially when an abnormality is minor.
- Endocervical curettage reported as CIN 1 should be managed as CIN 1, not as a positive endocervical curettage.
- When a cytologic sample is unsatisfactory, sampling usually should be repeated, even when HPV cotesting results are known. However, negative cytology that lacks sufficient endocervical cells or a transformation zone component usually can be managed without frequent follow-up.
Related article: New cervical Ca screening guidelines recommend less frequent assessment Janelle Yates (News for your Practice; April 2012)
EQUAL MANAGEMENT SHOULD BE PERFORMED FOR ABNORMAL TESTS THAT INDICATE EQUAL RISK
The ASCCP-led management panel unanimously agreed to several basic assumptions in formulating the updated guidelines. For example, they concurred that achieving zero risk for cancer is impossible and that attempts to achieve zero risk (which typically means more frequent testing) may cause harm. They also cited the 2011 American Cancer Society/ASCCP/American Society for Clinical Pathology consensus screening document, which stated: “Optimal prevention strategies should identify those HPV-related abnormalities likely to progress to invasive cancers while avoiding destructive treatment of abnormalities not destined to become cancerous.”1
The panel also agreed that CIN 3+ is a “reasonable proxy for cancer risk.” When calculating risk, the KPNC data were modeled for all combinations of cytology and HPV testing, using CIN 3+ for many of the outcomes, and when outcomes were rare, using CIN 2+. The theme of equal management for equal risk was the rationale behind the management approaches detailed in the TABLE. Risks were deemed to be low and return to normal screening was recommended when the risks were similar to the rate of CIN 3+ 3 years after negative cytology or 5 years after negative cotesting. However, immediate colposcopy was recommended when the 5-year risk of CIN 3+ for the combination of cytology and hrHPV testing, when indicated, exceeded 5%. A 6-month to 12-month return (intermediate risk) is indicated with a risk of CIN3+ of 2% to 5%.
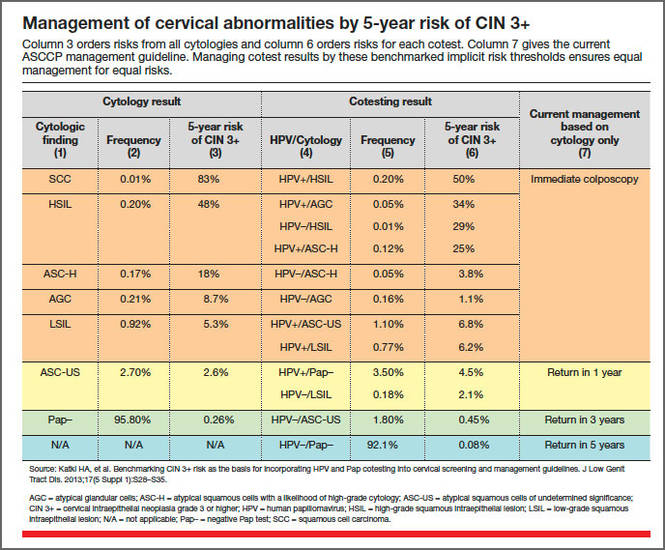
An emphasis on avoiding harms
Abnormal findings at the time of cervical cancer screening can lead to a number of harms for the patient, including anxiety and emotional distress, particularly when colposcopy is necessary, as well as time lost from home and work life. For this reason, the guidelines panel emphasized that colposcopy and other interventions should be avoided when the risk of CIN 3+ is low and when the cervical screening abnormalities are likely to resolve without treatment.
However, women who experience postcoital bleeding, unexplained abnormal vaginal bleeding, pelvic pain, abnormal discharge, or a visible lesion should be managed promptly on an individualized basis.
Long-term effects of HPV vaccination are unknown
Among the areas that remain to be addressed are the unknown effects of widespread prophylactic HPV vaccination over the long term. We also lack full understanding of whether and how HPV vaccination will alter the incidence and management of cytologic and histologic abnormalities. Given the low rates of vaccination against HPV in the United States at present, this will need to be re-evaluated in the future.
What this EVIDENCE means for practice
The updated ASCCP guidelines are inherently complex, but their complexity arises from a large body of high-quality prospective data from a large population of women. Equal risk should result in equal management of cervical screening test abnormalities. Practitioners need not feel obligated to memorize the guidelines, owing to the availability of algorithms for specific findings in specific populations at the ASCCP Web site (www.asccp.org/consensus2012). Apps also are available for the iPhone, iPad, and Android.
WE WANT TO HEAR FROM YOU!
Share your thoughts on this article or on any topic relevant to ObGyns and women’s health practitioners. Tell us which topics you’d like to see covered in future issues, and what challenges you face in daily practice. We will consider publishing your letter and in a future issue. Send your letter to: [email protected] Please include the city and state in which you practice. Stay in touch! Your feedback is important to us!
Reference
- Saslow D, Solomon D, Lawson HW, et al;ACS-ASCCP-ASCP Cervical Cancer Guideline Committee. American Cancer Society, American Society for Colposcopy and Cervical Pathology, and American Society for Clinical Pathology screening guidelines for the prevention and early detection of cervical cancer. CA Cancer J Clin. 2012;62(3):147–172.

Mark H. Einstein, MD, MS, is Professor of Obstetrics & Gynecology and Women’s Health and Professor of Epidemiology and Population Health at Albert Einstein College of Medicine and Montefiore Medical Center, Bronx, New York. He is also Vice Chair for Research in the Department of Obstetrics & Gynecology and Women’s Health.
Dr. Einstein reports that the hospital where he is employed, Montefiore Medical Center, has received research support from Roche, Hologic, and BD.
Advances in cervical cancer screening continue apace. We are fortunate that these advances are based on a substantial amount of high-quality prospective evidence. Many of these advances are designed to target the women who have clinically relevant disease while minimizing harm and anxiety caused by unnecessary procedures related to cervical screening test abnormalities that have little clinical relevance.
With clinicians being regularly judged on performance and outcomes, adoption of advances and new guidelines should be considered relatively quickly by women’s health providers.
In this article, I focus on two significant advances of the past (and coming) year:
- recent application and unanimous approval by a Food and Drug Administration (FDA) expert panel for the use of the cobas human papillomavirus (HPV) DNA test as a primary cervical cancer screen
- the latest update of guidelines on the management of abnormal cervical screening tests from the American Society for Colposcopy and Cervical Pathology (ASCCP).
cobas HPV TEST IS POISED FOR FDA APPROVAL AS A PRIMARY SCREEN FOR CERVICAL CANCER
Wright TC Jr, Stoler MH, Behrens CM, Apple R, Derion T, Wright TL. The ATHENA human papillomavirus study: design, methods, and baseline results. Am J Obstet Gynecol. 2012;206(1):46.e1–e11.
An FDA expert panel unanimously approved the cobas (Roche Molecular Diagnostics; Pleasanton, California) HPV DNA test on March 12, 2014. The FDA will decide on potential approval within the coming months. Although the FDA sometimes reaches a different decision from one of its advisory committees when it comes to a final vote on a product or device, most often the FDA concurs with the committee’s judgment. Therefore, approval of the cobas HPV test as a primary screen is likely.
Related article: FDA Advisory Committee recommends HPV test as primary screening tool for cervical cancer Deborah Reale (News for your Practice, March 2014)
The cobas HPV test yields a pooled result for 12 high-risk HPV types (hrHPV 31, 33, 35, 39, 45, 51, 52, 56, 58, 59, 66, and 68), as well as individual results for types 16 and 18; it also has an internal control for specimen adequacy. HPV 16 and 18 account for roughly 70% of all cases of cervical cancer, and infection with both types are known to place women at high risk for having clinically relevant disease—more so than the other hrHPV types.
COMMITTEE REVIEWED DATA FROM ATHENA IN VOTING FOR APPROVAL
In considering the cobas HPV test, the advisory committee reviewed data from the Addressing the Need for Advanced HPV Diagnostics (ATHENA) trial, a prospective, multicenter, US-based study of 47,208 women aged 21 and older. These women were recruited at the time of undergoing routine screening for cervical cancer; only 2.6% had been vaccinated against HPV. All were screened by liquid-based cytology and an HPV test. Those who had abnormal cytology or a positive test for a high-risk HPV type underwent colposcopy, as did a randomly selected group of women aged 25 or older who tested negative on both tests.
The prevalence of abnormal findings was:
- 7.1% for liquid-based cytology
- 12.6% for pooled high-risk HPV
- 2.8% for HPV 16
- 1.0% for HPV 18.
As expected, cytologic abnormalities and infection with high-risk HPV types declined with increasing age. The adjusted prevalence of cervical intraepithelial neoplasia (CIN) grade 2 or higher in women aged 25 to 34 years was 2.3%; it declined to 1.5% among women older than age 34. Of note, approximately 500,000 US women are given a diagnosis of CIN 2 or CIN 3 each year in the United States.
WHY ATHENA IS IMPORTANT
This US-based trial was designed to assess the medical utility of pooled high-risk HPV DNA in addition to genotyping for HPV 16 and 18 in three populations:
- women aged 21 and older with a cytologic finding of atypical squamous cells of undetermined significance (ASC-US)
- women aged 30 and older with normal cytology
- women aged 25 and older in the overall screening population with any cytologic finding.
Investigators were particularly interested in the use of the HPV test as:
- a triage for women with abnormal cytologic findings
- an adjunct to guide clinical management of women with negative cytology results
- a potential front-line test in the screening of women aged 25 and older.
Related article: Endometrial cancer update: The move toward personalized cancer care Lindsay M. Kuroki, MD, and David G. Mutch, MD (October 2013)
The participants of the ATHENA trial were representative of women undergoing screening for cervical cancer in the United States—both in terms of demographics and in the distribution of cytologic findings. For example, recent US census data indicate that the female population is 79% white, 13% black, and 16% Hispanic or Latino—figures comparable to the breakdown of race/ethnicity in the ATHENA trial.
The trial was conducted in a baseline phase (published in 2012) and a 3-year follow-up phase (not yet published). The 3-year data were reviewed by the FDA advisory committee during its consideration of the cobas HPV test as a primary screen.
DESPITE PROBABLE APPROVAL, INCREMENTAL CHANGE IS LIKELY
Although a move to the HPV test as the primary screen is a definite paradigm shift for what has been cytology-based screening since the initiation of cervical cancer screening, the changeover from primary cytology to primary HPV testing likely will be slow. It will require education of clinicians as well as patients, and a shift in many internal procedures for pathology laboratories.
The ATHENA trial also leaves some intriguing questions unanswered:
- How do we transition women into the new screening strategy? Many women today still undergo cytology screening with reflex HPV testing, as appropriate, and an increasing number of women aged 30 and older undergo cotesting with both cytology and HPV testing. When should they begin screening in a primary HPV testing setting? And what screening intervals will be recommended? If a woman already has been screened with cytology, how should she transition into and at what interval should she begin primary HPV screening?
- How should we manage women’s care after the first round of primary HPV testing? The ATHENA trial so far only has outcomes data after one round of HPV testing. While some data are available from Europe, we do not know what happens after two or three rounds of screening with primary HPV testing in a large US-based cohort. We clearly will be identifying and treating many women with preinvasive disease from screening after one round of testing, at a rate likely higher than with cytology alone—a good thing. We also likely will be reducing the number of unnecessary colposcopies for cytology that are not related to hrHPV.
What this EVIDENCE means for practice
Screening women using the cobas HPV test as a primary screen will require considerable education of providers and patients to explain how this change will affect how a woman will be managed after being screened for cervical cancer. Though much remains to be determined about this new cervical cancer screening paradigm (eg, logistics, timing, use of secondary tests), it should reduce the number of screening tests and colposcopies necessary to detect clinically relevant disease.
UPDATED ASCCP GUIDELINES EMPHASIZE EQUAL MANAGEMENT FOR EQUAL RISK
Massad LS, Einstein MH, Huh WK, et al; 2012 ASCCP Consensus Guidelines Conference. 2012 updated consensus guidelines for the management of abnormal cervical cancer screening tests and cancer precursors. J Low Genit Tract Dis. 2013;17(5 Suppl 1):S1–S27.
In formulating this latest set of guidelines for the management of abnormal cervical cancer screening tests and cancer precursors, the ASCCP led a conference consisting of scientific stakeholders to perform a comprehensive review of the literature. Also, with study investigators at Kaiser Permanente Northern California (KPNC) and the National Cancer Institute, the guidelines panel also modeled and assessed data on risk after abnormal tests from almost 1.4 million women followed over 8 years in the KPNC Medical Care Plan—this cohort has provided us with “big data.”
The sheer size of the Kaiser Permanente population made it possible for the ASCCP-led panel to validate its previous guidelines or to modify them, where needed. It also made risk-based stratification possible for even rare abnormalities and clinical outcomes.
Although findings from the KPNC population may not be fully generalizable to the US population as a whole, they enhance our understanding of the optimal management of abnormal cervical cancer screening tests and cancer precursors. More widely dispersed study cohorts on a similar scale in the United States are unlikely in the near future.
Related article: Update on cervical disease Mark H. Einstein, MD, MS, and J. Thomas Cox, MD (May 2013)
SEVERAL SIGNIFICANT MODIFICATIONS
Although the ASCCP reaffirmed most elements of its 2006 consensus management guidelines, it did make a number of changes:
- Women who have ASC-US cytology but test HPV-negative now should be followed with cotesting at 3 years rather than 5 years before they return to routine screening.
- Women near age 65 who have a negative finding on ASC-US cytology and HPV testing should not exit screening.
- Women who have ASC-US cytology and test HPV-positive should go to immediate colposcopy, regardless of hrHPV results, including genotyping.
- Women who test positive for HPV 16 or 18 but have negative cytology should undergo immediate colposcopy.
- Women aged 21 to 24 years should be managed as conservatively and minimally invasively as possible, especially when an abnormality is minor.
- Endocervical curettage reported as CIN 1 should be managed as CIN 1, not as a positive endocervical curettage.
- When a cytologic sample is unsatisfactory, sampling usually should be repeated, even when HPV cotesting results are known. However, negative cytology that lacks sufficient endocervical cells or a transformation zone component usually can be managed without frequent follow-up.
Related article: New cervical Ca screening guidelines recommend less frequent assessment Janelle Yates (News for your Practice; April 2012)
EQUAL MANAGEMENT SHOULD BE PERFORMED FOR ABNORMAL TESTS THAT INDICATE EQUAL RISK
The ASCCP-led management panel unanimously agreed to several basic assumptions in formulating the updated guidelines. For example, they concurred that achieving zero risk for cancer is impossible and that attempts to achieve zero risk (which typically means more frequent testing) may cause harm. They also cited the 2011 American Cancer Society/ASCCP/American Society for Clinical Pathology consensus screening document, which stated: “Optimal prevention strategies should identify those HPV-related abnormalities likely to progress to invasive cancers while avoiding destructive treatment of abnormalities not destined to become cancerous.”1
The panel also agreed that CIN 3+ is a “reasonable proxy for cancer risk.” When calculating risk, the KPNC data were modeled for all combinations of cytology and HPV testing, using CIN 3+ for many of the outcomes, and when outcomes were rare, using CIN 2+. The theme of equal management for equal risk was the rationale behind the management approaches detailed in the TABLE. Risks were deemed to be low and return to normal screening was recommended when the risks were similar to the rate of CIN 3+ 3 years after negative cytology or 5 years after negative cotesting. However, immediate colposcopy was recommended when the 5-year risk of CIN 3+ for the combination of cytology and hrHPV testing, when indicated, exceeded 5%. A 6-month to 12-month return (intermediate risk) is indicated with a risk of CIN3+ of 2% to 5%.
An emphasis on avoiding harms
Abnormal findings at the time of cervical cancer screening can lead to a number of harms for the patient, including anxiety and emotional distress, particularly when colposcopy is necessary, as well as time lost from home and work life. For this reason, the guidelines panel emphasized that colposcopy and other interventions should be avoided when the risk of CIN 3+ is low and when the cervical screening abnormalities are likely to resolve without treatment.
However, women who experience postcoital bleeding, unexplained abnormal vaginal bleeding, pelvic pain, abnormal discharge, or a visible lesion should be managed promptly on an individualized basis.
Long-term effects of HPV vaccination are unknown
Among the areas that remain to be addressed are the unknown effects of widespread prophylactic HPV vaccination over the long term. We also lack full understanding of whether and how HPV vaccination will alter the incidence and management of cytologic and histologic abnormalities. Given the low rates of vaccination against HPV in the United States at present, this will need to be re-evaluated in the future.
What this EVIDENCE means for practice
The updated ASCCP guidelines are inherently complex, but their complexity arises from a large body of high-quality prospective data from a large population of women. Equal risk should result in equal management of cervical screening test abnormalities. Practitioners need not feel obligated to memorize the guidelines, owing to the availability of algorithms for specific findings in specific populations at the ASCCP Web site (www.asccp.org/consensus2012). Apps also are available for the iPhone, iPad, and Android.
WE WANT TO HEAR FROM YOU!
Share your thoughts on this article or on any topic relevant to ObGyns and women’s health practitioners. Tell us which topics you’d like to see covered in future issues, and what challenges you face in daily practice. We will consider publishing your letter and in a future issue. Send your letter to: [email protected] Please include the city and state in which you practice. Stay in touch! Your feedback is important to us!
Reference
- Saslow D, Solomon D, Lawson HW, et al;ACS-ASCCP-ASCP Cervical Cancer Guideline Committee. American Cancer Society, American Society for Colposcopy and Cervical Pathology, and American Society for Clinical Pathology screening guidelines for the prevention and early detection of cervical cancer. CA Cancer J Clin. 2012;62(3):147–172.
Dr. Mark Einstein anticipated final FDA approval of the first HPV test for primary cervical cancer screening and, in this UPDATE ON CERVICAL DISEASE, expands on the data behind the approval and how your practice could change
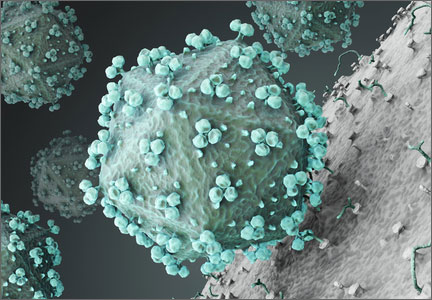
VIDEO: Laser's novel effect improves restrictive burn scars
PHOENIX – New techniques using very-low-density, very-high-energy ablative fractional carbon dioxide laser are helping thousands of patients – mostly soldiers – with restrictive scars from bombs or burns.
It’s a treatment to which the far larger number of civilian burn patients should have access, but few do, explained Dr. Nathan S. Uebelhoer, who received an award and a standing ovation at the annual meeting of the American Society for Laser Medicine and Surgery for his work in this area.
In an interview, Dr. Uebelhoer of Aroostook Medical Center, Presque Isle, Maine, describes the techniques used to achieve such promising results with restrictive scars, and he discusses what might be necessary to make the treatment more widely available.
The video associated with this article is no longer available on this site. Please view all of our videos on the MDedge YouTube channel
On Twitter @sherryboschert
AT LASER 2014

Potential for flawed research prompts new guidelines

Credit: Rhoda Baer
Worried about the potential for false conclusions in genomics research, a group of scientists created guidelines for distinguishing disease-causing sequence variants from potentially functional variants in the human genome.
In addition to helping researchers confirm variant-disease causality, the guidelines provide recommendations pertaining to genomic study design, databases, and disease diagnosis.
The guidelines are published in Nature.
They were born out of discussions at a 2012 workshop sponsored by the National Human Genome Research Institute.
“Several of us had noticed that studies were coming out with wrong conclusions about the relationship between a specific sequence and disease, and we were extremely concerned that this would translate into inappropriate clinical decisions,” said guideline author Chris Gunter, PhD, of Marcus Autism Center in Atlanta.
In other words, the authors were worried that, based on flawed results, physicians might order additional testing or treatments that are not truly supported by a link between a genetic variant and disease.
As an example, Dr Gunter and her colleagues cited autism research. Investigators found 4 independent variations in the gene TTN when they compared genomes between individuals with and without autism.
However, the TTN gene encodes titin, the largest known protein. So variations are simply more likely in TTN than in other genes. Without applying the proper statistical corrections, researchers may have falsely concluded that TTN was worthy of further investigation in autism studies.
But Dr Gunter believes the new guidelines could help prevent such false conclusions and, therefore, inappropriate medical decisions.
She and her colleagues proposed that researchers do 2 things before concluding that a genetic variation causes a disease. First, they should perform detailed statistical analyses. Then, they should assess evidence from all sources supporting a role for the variant in that specific disease or condition.
The authors said many DNA variants “may suggest a potentially convincing story about how the variant may influence the trait,” but few will actually have causal effects. So using evidence-based guidelines is crucial.
The authors’ guidelines also highlight priorities for research and infrastructure development, including added incentives for researchers to share genetic and clinical data.
“We believe that these guidelines will be particularly useful to scientists and clinicians in other areas who want to do human genomic studies and need a defined starting point for investigating genetic effects,” Dr Gunter said. ![]()