User login
Diabetes therapy and cancer risk: Where do we stand when treating patients?
In the last quarter century, many new drugs have become available for treating type 2 diabetes mellitus. The American Association of Clinical Endocrinologists incorporated these new agents in its updated glycemic control algorithm in 2013.1 Because diabetes affects 25.8 million Americans and can lead to blindness, renal failure, cardiovascular disease, and amputation, agents that help us treat it more effectively are valuable.2
One of the barriers to effective treatment is the side effects of the agents. Because some of these drugs have been in use for only a short time, concerns of potential adverse effects have arisen. Cancer is one such concern, especially since type 2 diabetes mellitus by itself increases the risk of cancer by 20% to 50% compared with no diabetes.3
Type 2 diabetes has been linked to risk of cancers of the pancreas,4 colorectum,5,6 liver,7 kidney,8,9 breast,10 bladder,11 and endometri-um,12 as well as to hematologic malignancies such as non-Hodgkin lymphoma.13 The risk of bladder cancer appears to depend on how long the patient has had type 2 diabetes. Newton et al,14 in a prospective cohort study, found that those who had diabetes for more than 15 years and used insulin had the highest risk of bladder cancer. On the other hand, the risk of prostate cancer is actually lower in people with diabetes,15 particularly in those who have had diabetes for longer than 4 years.16
Cancer and type 2 diabetes share many risk factors and underlying pathophysiologic mechanisms. Nonmodifiable risk factors for both diseases include advanced age, male sex, ethnicity (African American men appear to be most vulnerable to both cancer and diabetes),17,18 and family history. Modifiable risk factors include lower socioeconomic status, obesity, and alcohol consumption. These common risk factors lead to hyperinsulinemia and insulin resistance, changes in mitochondrial function, low-grade inflammation, and oxidative stress,3 which promote both diabetes and cancer. Diabetes therapy may influence several of these processes.
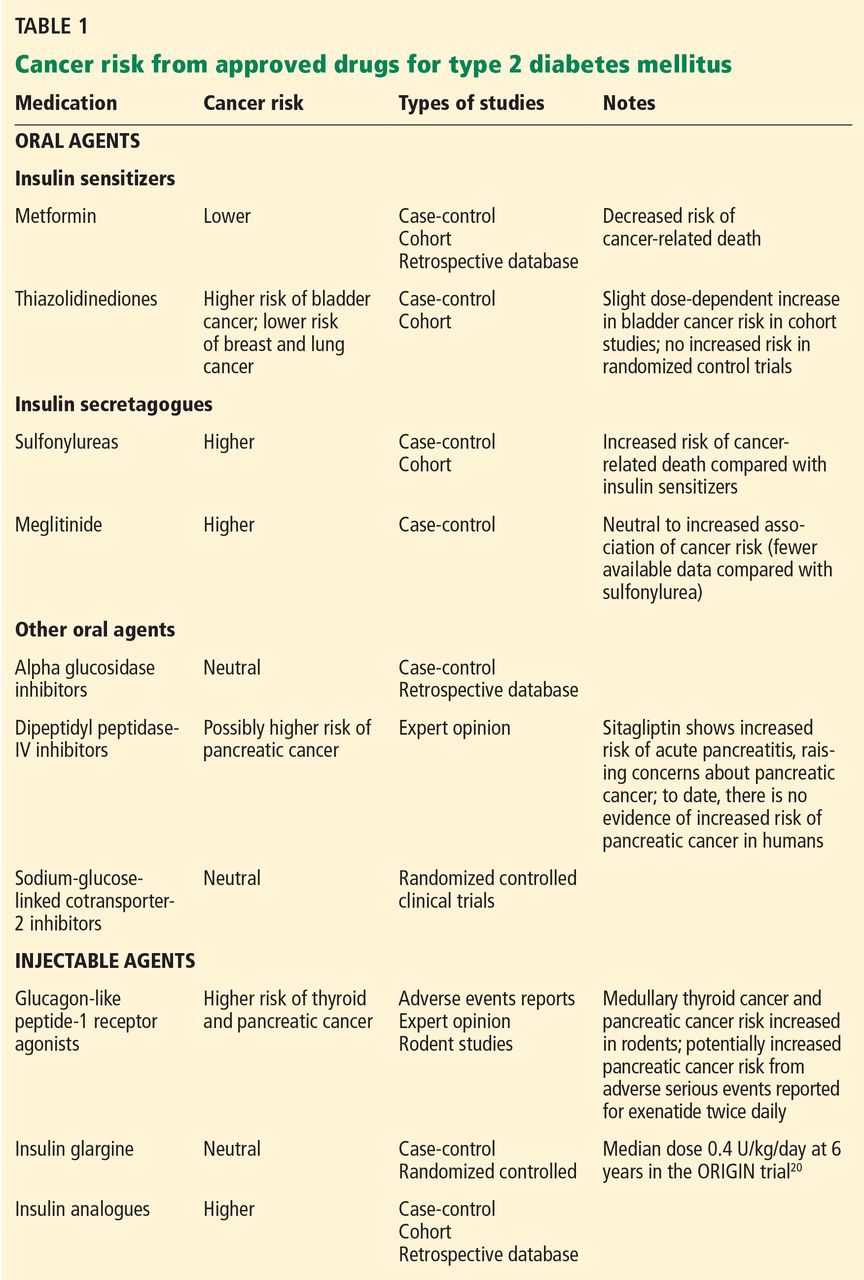
Several classes of diabetes drugs, including exogenous insulin,19–22 insulin secretagogues,23–25 and incretin-based therapies,26–28 have been under scrutiny because of their potential influences on cancer development in a population already at risk (Table 1).
INSULIN ANALOGUES: MIXED EVIDENCE
Insulin promotes cell division by binding to insulin receptor isoform A and insulin-like growth factor 1 receptors.29 Because endogenous hyperinsulinemia has been linked to cancer risk, growth, and proliferation, some speculate that exogenous insulin may also increase cancer risk.
In 2009, a retrospective study by Hemkens et al linked the long-acting insulin analogue glargine to risk of cancer.19 This finding set off a tumult of controversy within the medical community and concern among patients. Several limitations of the study were brought to light, including a short duration of follow-up, and several other studies have refuted the study’s findings.20,21
More recently, the Outcome Reduction With Initial Glargine Intervention (ORIGIN) trial22 found no higher cancer risk with glargine use than with placebo. This study enrolled 12,537 participants from 573 sites in 40 countries. Specifically, risks with glargine use were as follows:
- Any cancer—hazard ratio 1.00, 95% confidence interval (CI) 0.88–1.13, P = .97
- Cancer death—hazard ratio 0.94, 95% CI 0.77–1.15, P = .52.
However, the study was designed to assess cardiovascular outcomes, not cancer risk. Furthermore, the participants were not typical of patients seen in clinical practice: their insulin doses were lower (the median insulin dose was 0.4 units/kg/day by year 6, whereas in clinical practice, those with type 2 diabetes mellitus often use more than 1 unit/kg/day, depending on duration of diabetes, diet, and exercise regimen), and their baseline median hemoglobin A1c level was only 6.4%. And one may argue that the median follow-up of 6.2 years was too short for cancer to develop.22
In vitro studies indicate that long-acting analogue insulin therapy may promote cancer cell growth more than endogenous insulin,30 but epidemiologic data have not unequivocally substantiated this.20–22 There is no clear evidence that analogue insulin therapy raises cancer risk above that of human recombinant insulin, and starting insulin therapy should not be delayed because of concerns about cancer risk, particularly in uncontrolled diabetes.
INSULIN SECRETAGOGUES
Sulfonylureas: Higher risk
Before 1995, only two classes of diabetes drugs were approved by the US Food and Drug Administration (FDA)—insulin and sulfonylureas.
Sulfonylureas lower blood sugar levels by binding to sulfonylurea receptors and inhibiting adenosine triphosphate-dependent potassium channels. The resulting change in resting potential causes an influx of calcium, ultimately leading to insulin secretion.
Sulfonylureas are effective, and because of their low cost, physicians often pick them as a second-line agent after metformin.
The main disadvantage of sulfonylureas is the risk of hypoglycemia, particularly in patients with renal failure, the elderly, and diabetic patients who are unaware of when they are hypoglycemic. Other potential drawbacks are that they impair cardiac ischemic preconditioning31 and possibly increase cancer risk.21,32 (Ischemic preconditioning is the process in which transient episodes of ischemia “condition” the myocardium so that it better withstands future episodes with minimal anginal pain and tissue injury.33) Of the sulfonylureas, glyburide has been most implicated in cardiovascular risk.32
In a retrospective cohort study of 62,809 patients from a general-practice database in the United Kingdom, Currie et al21 found that sulfonylurea monotherapy was associated with a 36% higher risk of cancer (95% CI 1.19–1.54, P < .001) than metformin monotherapy. Prescribing bias may have influenced the results: practitioners are more likely to prescribe sulfonylureas to leaner patients, who have a greater likelihood of occult cancer. However, other studies also found that the cancer death rate is higher in those who take a sulfonylurea alone than in those who use metformin alone.23,24
Some evidence indicates that long-acting sulfonylurea formulations (eg, glyburide) likely hold the most danger, certainly in regard to hypoglycemia, but it is less clear if this translates to cancer concerns.31
Meglitinides: Limited evidence
Meglitinides, the other class of insulin secretagogues, are less commonly used but are similar to sulfonylureas in the way they increase endogenous insulin levels. The data are limited regarding cancer risk and meglitinide therapy, but the magnitude of the association is similar to that with sulfonylurea therapy.25
INSULIN SENSITIZERS
There are currently two classes of insulin sensitizers: biguanides and thiazolidinediones (TZDs, also known as glitazones). These drugs show less risk of both cancer incidence and cancer death than insulin secretagogues such as sulfonylureas.21,23,24 In fact, they may decrease cancer potential by alteration of signaling via the AKT/mTOR (v-akt murine thymoma viral oncogene homolog 1/mammalian target of rapamycin) pathway.34
Metformin, a biguanide, is the oral drug of choice
Metformin is the only biguanide currently available in the United States. It was approved by the FDA in 1995, although it had been in clinical use since the 1950s. Inexpensive and familiar, it is the oral antihyperglycemic of choice if there are no contraindications to it, such as renal dysfunction (creatinine ≥ 1.4 mg/dL in women and ≥ 1.5 mg/dL in men), acute decompensated heart failure, or pulmonary or hepatic insufficiency, all of which may lead to an increased risk of lactic acidosis.1
Metformin lowers blood sugar levels primarily by inhibiting hepatic glucose production (gluconeogenesis) and by improving peripheral insulin sensitivity. It directly activates AMP-activated protein kinase (AMPK), which affects insulin signaling and glucose and fat metabolism.35 It may exert further beneficial effects by acutely increasing glucagon-like peptide-1 (GLP-1) levels and inducing islet incretin-receptor gene expression.36 Although the exact mechanisms have not been fully elucidated, metformin’s insulin-sensitizing properties are likely from favorable effects on insulin receptor expression, tyrosine kinase activity, and influences on the incretin pathway.36,37 These effects also mitigate carcinogenesis, both directly (via AMPK and liver kinase B1, a tumor-suppressor gene) and indirectly (via reduction of hyperinsulinemia).35
Overall, biguanide therapy is associated with a lower cancer incidence or, at worst, no effect on cancer incidence. In vitro studies demonstrate that metformin both suppresses cancer cell growth and induces apoptosis, resulting in fewer live cancer cells.34 Several retrospective studies found lower cancer risk in metformin users than in patients receiving antidiabetes drugs other than insulin-sensitizing agents,21,23,25,38–40 while others have shown no effect.41 Use of metformin was specifically associated with lower risk of cancers of the liver, colon and rectum, and lung.42 Further, metformin users have a lower cancer mortality rate than nonusers.24,43
Thiazolidinediones
TZDs, such as pioglitazone, work by binding to peroxisome proliferator-activated gamma receptors in the cell nucleus, altering gene transcription.44 They reduce insulin resistance and levels of endogenous insulin levels and free fatty acids.44
Concern over bladder cancer risk with TZD use, particularly with pioglitazone, has increased in the last few years, as various cohort studies found a statistically significant increased risk with this agent.44 The risk appears to rise with cumulative dose.45,46
Randomized controlled trials also found an increased risk of bladder cancer with TZD therapy, although the difference was not statistically significant.47–49 In a mean follow-up of 8.7 years, the Prospective Pioglitazone Clinical Trial in Macrovascular Events reported 23 cases of bladder cancer in the pioglitazone group vs 22 cases in the placebo group, for rates of 0.9% vs 0.8% (relative risk [RR] 1.06, 95% CI 0.59–1.89).49
On the other hand, the risk of cancer of the breast, colon, and lung has been found to be lower with TZD use.47 In vitro studies support the clinical data, showing that TZDs inhibit growth of human cancer cells derived from cancers of the lung, colon, breast, stomach, ovary, and prostate.50–53
Home et al54 compared rosiglitazone against a sulfonylurea in patients already taking metformin in the Rosiglitazone Evaluated for Cardiovascular Outcomes in Oral Agent Combination Therapy for Type 2 Diabetes (RECORD) trial. Malignancies developed in 6.7% of the sulfonylurea group compared with 5.1% of the rosiglitazone group, for a hazard ratio of 1.33 (95% CI 0.94–1.88).
Both ADOPT (A Diabetes Outcome Progression Trial) and the RECORD trial found rosiglitazone comparable to metformin in terms of cancer risk.54
Colmers et al47 pooled data from four randomized controlled trials, seven cohort studies, and nine case-control studies to assess the risk of cancer with TZD use in type 2 diabetes. Both the randomized and observational data showed neutral overall cancer risk with TZDs. However, pooled data from observational studies showed significantly lower risk with TZD use in terms of:
- Colorectal cancer RR 0.93, 95% CI 0.87–1.00
- Lung cancer RR 0.91, 95% CI 0.84–0.98
- Breast cancer RR 0.89, 95% CI 0.81–0.98.
INCRETIN-BASED THERAPIES
Incretins are hormones released from the gut in response to food ingestion, triggering release of insulin before blood glucose levels rise. Their action explains why insulin secretion increases more after an oral glucose load than after an intravenous glucose load, a phenomenon called the incretin effect.55
There are two incretin hormones: glucose-dependent insulinotropic polypeptide (GIP) and glucagon-like peptide 1 (GLP-1). They have short a half-life because they are rapidly degraded by dipeptidyl peptidase-IV (DPP-IV).55 Available incretin-based therapies are GLP-1 receptor agonists and DPP-IV inhibitors.
When used as monotherapy, incretin-based therapies do not cause hypoglycemia because their effect is glucose-dependent.55 GLP-1 receptor antagonists have the added benefit of inducing weight loss, but DPP-IV inhibitors are considered to be weight-neutral.
GLP-1 receptor agonists
Exenatide, the first of the GLP-1 receptor agonists, was approved in 2005. The original formulation (Byetta) is taken by injection twice daily, and timing in conjunction with food intake is important: it should be taken within 60 minutes before the morning and evening meals. Extended-release exenatide (Bydureon) is a once-weekly formulation taken without regard to timing of food intake. Exenatide (either twice-daily Byetta or once-weekly Bydureon) should not be used in those with creatinine clearance less than 30 mL/min or end-stage renal disease and should be used with caution in patients with renal transplantation.
Liraglutide (Victoza), a once-daily formulation, can be injected irrespective of food intake. The dose does not have to be adjusted for renal function, although it should be used with caution in those with renal impairment, including end-stage renal disease. Approval for a 3-mg formulation is pending with the FDA as a weight-loss drug on the basis of promising results in a randomized phase 3 trial.56
Albiglutide (Tanzeum), a once-weekly GLP-1 receptor antagonist, was recently approved by the FDA.
DPP-IV inhibitors
Whereas GLP-1 receptor agonists are injected, the DPP-IV inhibitors have the advantage of being oral agents.
Sitagliptin (Januvia), the first DPP-IV inhibitor, became available in the United States in 2006. Since then, three more have become available: saxagliptin (Onglyza), linagliptin (Tradjenta), and alogliptin (Nesina).
Concerns about thyroid cancer with incretin drugs
Concerns of increased risk of cancer, particularly of the thyroid and pancreas, have been raised since GLP-1 receptor agonists and DPP-IV inhibitors became available.
Studies in rodents have shown C-cell hyperplasia, sometimes resulting in increased incidence of thyroid carcinoma, and dose-dependent rises in serum calcitonin, particularly with liraglutide.26 This has raised concern about an increased risk of medullary thyroid carcinoma in humans. However, the density of C cells in rodents is up to 45 times greater than in humans, and C cells also express functional GLP-1 receptors.26
Gier et al27 assessed the expression of calcitonin and human GLP-1 receptors in normal C cells, C cell hyperplasia, and medullary cancer. In this study, calcitonin and GLP-1 receptor were co-expressed in medullary thyroid cancer (10 of 12 cases) and C-cell hyperplasia (9 of 9 cases) more commonly than in normal C cells (5 of 15 cases). Further, GLP-1 receptor was expressed in 3 of 17 cases of papillary thyroid cancer.
Calcitonin, a polypeptide hormone produced by thyroid C cells and used as a medullary thyroid cancer biomarker, was increased in a slightly higher percentage of patients treated with liraglutide than in controls, without an increase above the normal range.57
A meta-analysis by Alves et al58 of 25 studies found that neither exenatide (no cases reported) nor liraglutide (odds ratio 1.54, 95% CI 0.40–6.02) was associated with increased thyroid cancer risk.
MacConell et al59 pooled the results of 19 placebo-controlled trials of twice-daily exenatide and found a thyroid cancer incidence rate of 0.3 per 100 patient-years (< 0.1%) vs 0 per 100 patient-years in pooled comparators.
Concerns about pancreatic cancer with incretin drugs
Increased risk of acute pancreatitis is a potential side effect of both DPP-IV inhibitors and GLP-1 receptor agonists and has led to speculation that this translates to an increased risk of pancreatic cancer.
In a point-counterpoint debate, Butler et al28 argued that incretin-based medications have questionable safety, with increased rates of pancreatitis possibly leading to pancreatic cancer. In counterpoint, Nauck60 argued that the risk of pancreatitis or cancer is extremely low, and clinical cases are unsubstantiated.
Bailey61 outlined the complexities and difficulties in drawing firm conclusions from individual clinical trials regarding possible adverse effects of diabetes drugs. The trials are typically designed to assess hemoglobin A1c reduction at varying doses and are typically restricted in patient selection, patient numbers, and drug-exposure duration, which may introduce allocation and ascertainment biases. The attempt to draw firm conclusions from such trials can be problematic and can lead to increased alarm, warranted or not.
Type 2 diabetes mellitus itself is associated with an increased incidence of pancreatic cancer, and whether incretin therapy enhances this risk is still controversial. Whether more episodes of acute pancreatitis without chronic pancreatitis can be extrapolated to an increased incidence of pancreatic cancer is doubtful. A normal pancreatic duct cell may take up to 12 years to become a tumor cell from which pancreatic carcinoma develops, another 7 years to develop metastatic capacity, and another 3 years before a diagnosis is made from clinical symptoms (which are usually accompanied by metastases).62
The risks and benefits of incretin therapies remain a contentious issue, and there are no clear prospective data at this time on increased pancreatic cancer incidence. Long-term prospective studies designed to analyze these specific outcomes (pancreatitis, pancreatic cancer, and medullary thyroid cancer) need to be undertaken.63
OTHER DIABETES THERAPIES
Alpha glucosidase inhibitors
Oral glucosidase inhibitors ameliorate hyperglycemia by inhibiting alpha glucosidase enzymes in the brush border of the small intestines, preventing conversion of polysaccharides to monosaccharides.64 This slows digestion of carbohydrates and glucose release into the bloodstream and blunts the postprandial hyperglycemic excursion.
The two alpha glucosidase inhibitors currently available in the United States are acarbose and miglitol, and although data are limited, they do not appear to increase the risk of cancer.65,66
Sodium-glucose-linked cotransporter 2 inhibitors
The newest class of oral diabetes agents to be approved are the sodium-glucose-linked cotransporter 2 (SGLT2) inhibitors canagliflozin (Invokana) and dapagliflozin (Farxiga).
SGLT2 is a protein in the S1 segment of the proximal renal tubules responsible for over 90% of renal glucose reabsorption. SGLT2 inhibitors lower serum glucose levels by promoting glycosuria and have also been shown to have favorable effects on blood pressure and weight.67,68
Canagliflozin was the first of its class to gain FDA approval in the United States. It has not been found to be associated with increased cancer risk.68
Dapagliflozin, originally approved in Europe, was approved in the United States on January 8, 2014. Because of a possible increased incidence of breast and bladder malignancies, the FDA advisory committee initially recommended against approval and required further data. In those who were treated, nine cases of bladder cancer and nine cases of breast cancer were reported, compared with one case of bladder cancer and no cases of breast cancer in the control group; however, the difference was not statistically significant.68
Since SGLT2 inhibitors are still new, data on long-term outcomes are lacking. Early clinical data do not show a significant increase in cancer risk.
WHAT THIS MEANS IN PRACTICE
Many studies have found associations between diabetes, obesity, hyperinsulinemia, and cancer risk. In the last decade, concerns implicating antihyperglycemic agents in cancer development have arisen but have not been well substantiated. At this time, there are no definitive prospective data indicating that the currently available type 2 diabetes therapies increase the incidence of cancer beyond the inherent increased risk in this population. What, then, is one to do?
Educate. Lifestyle modification, including weight management, should continue to be emphasized in diabetes education, as no therapy is completely effective without adjunct modifications in diet and physical activity. Epidemiologic studies have shown the benefits of lifestyle modifications, which ameliorate many of the adverse metabolic conditions that coexist in type 2 diabetes and cancer.
Screen for cancer. Given the associations between diabetes and malignancy, cancer screening is especially important in this high-risk population.
Customize therapy to individual patients. Those with a personal history of bladder cancer should avoid pioglitazone, and those who have had pancreatic cancer should avoid sitagliptin until definitive clinical data become available.
Moreover, patients with a personal or family history of medullary thyroid cancer should not receive GLP-1 receptor agonists. These agents should also probably be avoided in patients with a personal history of differentiated thyroid carcinoma or a history of familial nonmedullary thyroid carcinoma. Until we have further elucidating data, it is not possible to say whether a family history of any of the other types of cancer should represent a contraindication to the use of any of these agents.
Discuss. The multitude of diabetes therapies warrants physician-patient discussions that carefully weigh the risks and benefits of additional agents to optimize glycemic control and metabolic factors in individual patients.
- Garber AJ, Abrahamson MJ, Barzilay JI, et al; American Association of Clinical Endocrinologists. AACE comprehensive diabetes management algorithm 2013. Endocr Pract 2013; 19:327–336.
- Centers for Disease Control and Prevention (CDC). Diabetes data and trends. www.cdc.gov/diabetes/statistics/. Accessed April 8, 2014.
- Vigneri P, Frasca F, Sciacca L, Pandini G, Vigneri R. Diabetes and cancer. Endocr Relat Cancer 2009; 16:1103–1123.
- Huxley R, Ansary-Moghaddam A, Berrington de González A, Barzi F, Woodward M. Type-II diabetes and pancreatic cancer: a meta-analysis of 36 studies. Br J Cancer 2005; 92:2076–2083.
- Larsson SC, Orsini N, Wolk A. Diabetes mellitus and risk of colorectal cancer: a meta-analysis. J Natl Cancer Inst 2005; 97:1679–1687.
- Limburg PJ, Vierkant RA, Fredericksen ZS, et al. Clinically confirmed type 2 diabetes mellitus and colorectal cancer risk: a population-based, retrospective cohort study. Am J Gastroenterol 2006; 101:1872–1879.
- El-Serag HB, Hampel H, Javadi F. The association between diabetes and hepatocellular carcinoma: a systematic review of epidemiologic evidence. Clin Gastroenterol Hepatol 2006; 4:369–380.
- Lindblad P, Chow WH, Chan J, et al. The role of diabetes mellitus in the aetiology of renal cell cancer. Diabetologia 1999; 42:107–112.
- Washio M, Mori M, Khan M, et al; JACC Study Group. Diabetes mellitus and kidney cancer risk: the results of Japan Collaborative Cohort Study for Evaluation of Cancer Risk (JACC Study). Int J Urol 2007; 14:393–397.
- Larsson SC, Mantzoros CS, Wolk A. Diabetes mellitus and risk of breast cancer: a meta-analysis. Int J Cancer 2007; 121:856–862.
- Larsson SC, Orsini N, Brismar K, Wolk A. Diabetes mellitus and risk of bladder cancer: a meta-analysis. Diabetologia 2006; 49:2819–2823.
- Friberg E, Orsini N, Mantzoros CS, Wolk A. Diabetes mellitus and risk of endometrial cancer: a meta-analysis. Diabetologia 2007; 50:1365–1374.
- Mitri J, Castillo J, Pittas AG. Diabetes and risk of non-Hodgkin’s lymphoma: a meta-analysis of observational studies. Diabetes Care 2008; 31:2391–2397.
- Newton CC, Gapstur SM, Campbell PT, Jacobs EJ. Type 2 diabetes mellitus, insulin-use and risk of bladder cancer in a large cohort study. Int J Cancer 2013; 132:2186–2191.
- Kasper JS, Giovannucci E. A meta-analysis of diabetes mellitus and the risk of prostate cancer. Cancer Epidemiol Biomarkers Prev 2006; 15:2056–2062.
- Rodriguez C, Patel AV, Mondul AM, Jacobs EJ, Thun MJ, Calle EE. Diabetes and risk of prostate cancer in a prospective cohort of US men. Am J Epidemiol 2005; 161:147–152.
- Centers for Disease Control and Prevention. Diabetes public health resource. National diabetes statistics report, 2014. Estimates of diabetes and its burden in the United States. www.cdc.gov/diabetes/pubs/estimates14.htm. Accessed August 12, 2014.
- Centers for Disease Control and Prevention. Cancer prevention and control cancer rates by race and ethnicity. www.cdc.gov/cancer/dcpc/data/race.htm. Accessed August 12, 2014.
- Hemkens LG, Grouven U, Bender R, et al. Risk of malignancies in patients with diabetes treated with human insulin or insulin analogues: a cohort study. Diabetologia 2009; 52:1732–1744.
- Colhoun HMSDRN Epidemiology Group. Use of insulin glargine and cancer incidence in Scotland: a study from the Scottish Diabetes Research Network Epidemiology Group. Diabetologia 2009; 52:1755–1765.
- Currie CJ, Poole CD, Gale EA. The influence of glucose-lowering therapies on cancer risk in type 2 diabetes. Diabetologia 2009; 52:1766–1777.
- ORIGIN Trial Investigators; Gerstein HC, Bosch J, Dagenais GR, et al. Basal insulin and cardiovascular and other outcomes in dysglycemia. N Engl J Med 2012; 367:319–328.
- Baur DM, Klotsche J, Hamnvik OP, et al. Type 2 diabetes mellitus and medications for type 2 diabetes mellitus are associated with risk for and mortality from cancer in a German primary care cohort. Metabolism 2011; 60:1363–1371.
- Bowker SL, Majumdar SR, Veugelers P, Johnson JA. Increased cancer-related mortality for patients with type 2 diabetes who use sulfonylureas or insulin. Diabetes Care 2006; 29:254–258.
- Li D, Yeung SC, Hassan MM, Konopleva M, Abbruzzese JL. Antidiabetic therapies affect risk of pancreatic cancer. Gastroenterology 2009; 137:482–488.
- Bjerre Knudsen L, Madsen LW, Andersen S, et al. Glucagon-like peptide-1 receptor agonists activate rodent thyroid C-cells causing calcitonin release and C-cell proliferation. Endocrinology 2010; 151:1473–1486.
- Gier B, Butler PC, Lai CK, Kirakossian D, DeNicola MM, Yeh MW. Glucagon like peptide-1 receptor expression in the human thyroid gland. J Clin Endocrinol Metab 2012; 97:121–131.
- Butler PC, Elashoff M, Elashoff R, Gale EA. A critical analysis of the clinical use of incretin-based therapies: are the GLP-1 therapies safe? Diabetes Care 2013; 36:2118–2125.
- Belfiore A, Malaguarnera R. Insulin receptor and cancer. Endocr Relat Cancer 2011; 18:R125–R147.
- Weinstein D, Simon M, Yehezkel E, Laron Z, Werner H. Insulin analogues display IGF-I-like mitogenic and anti-apoptotic activities in cultured cancer cells. Diabetes Metab Res Rev 2009; 25:41–49.
- Riddle MC. Editorial: sulfonylureas differ in effects on ischemic preconditioning—is it time to retire glyburide? J Clin Endocrinol Metab 2003; 88:528–530.
- Bodmer M, Becker C, Meier C, Jick SS, Meier CR. Use of antidiabetic agents and the risk of pancreatic cancer: a case-control analysis. Am J Gastroenterol 2012; 107:620–626.
- Deutsch E, Berger M, Kussmaul WG, Hirshfeld JW, Herrmann HC, Laskey WK. Adaptation to ischemia during percutaneous transluminal coronary angioplasty. Clinical, hemodynamic, and metabolic features. Circulation 1990; 82:2044–2051.
- Feng YH, Velazquez-Torres G, Gully C, Chen J, Lee MH, Yeung SC. The impact of type 2 diabetes and antidiabetic drugs on cancer cell growth. J Cell Mol Med 2011; 15:825–836.
- Viollet B, Guigas B, Sanz Garcia N, Leclerc J, Foretz M, Andreelli F. Cellular and molecular mechanisms of metformin: an overview. Clin Sci (Lond) 2012; 122:253–270.
- Maida A, Lamont BJ, Cao X, Drucker DJ. Metformin regulates the incretin receptor axis via a pathway dependent on peroxisome proliferator-activated receptor-α in mice. Diabetologia 2011; 54:339–349.
- Gunton JE, Delhanty PJ, Takahashi S, Baxter RC. Metformin rapidly increases insulin receptor activation in human liver and signals preferentially through insulin-receptor substrate-2. J Clin Endocrinol Metab 2003; 88:1323–1332.
- Ruiter R, Visser LE, van Herk-Sukel MP, et al. Lower risk of cancer in patients on metformin in comparison with those on sulfonylurea derivatives: results from a large population-based follow-up study. Diabetes Care 2012; 35:119–124.
- Libby G, Donnelly LA, Donnan PT, Alessi DR, Morris AD, Evans JM. New users of metformin are at low risk of incident cancer: a cohort study among people with type 2 diabetes. Diabetes Care 2009; 32:1620–1625.
- Bodmer M, Becker C, Meier C, Jick SS, Meier CR. Use of metformin and the risk of ovarian cancer: a case-control analysis. Gynecol Oncol 2011; 123:200–204.
- Azoulay L, Dell’Aniello S, Gagnon B, Pollak M, Suissa S. Metformin and the incidence of prostate cancer in patients with type 2 diabetes. Cancer Epidemiol Biomarkers Prev 2011; 20:337–344.
- Noto H, Goto A, Tsujimoto T, Noda M. Cancer risk in diabetic patients treated with metformin: a systematic review and meta-analysis. PLoS One 2012; 7:e33411.
- Currie CJ, Poole CD, Jenkins-Jones S, Gale EA, Johnson JA, Morgan CL. Mortality after incident cancer in people with and without type 2 diabetes: impact of metformin on survival. Diabetes Care 2012; 35:299–304.
- Yki-Järvinen H. Thiazolidinediones. N Engl J Med 2004; 351:1106–1118.
- Azoulay L, Yin H, Filion KB, et al. The use of pioglitazone and the risk of bladder cancer in people with type 2 diabetes: nested case-control study. BMJ 2012; 344:e3645.
- Lewis JD, Ferrara A, Peng T, et al. Risk of bladder cancer among diabetic patients treated with pioglitazone: interim report of a longitudinal cohort study. Diabetes Care 2011; 34:916–922.
- Colmers IN, Bowker SL, Johnson JA. Thiazolidinedione use and cancer incidence in type 2 diabetes: a systematic review and meta-analysis. Diabetes Metab 2012; 38:475–484.
- Dormandy J, Bhattacharya M, van Troostenburg de Bruyn AR; PROactive investigators. Safety and tolerability of pioglitazone in high-risk patients with type 2 diabetes: an overview of data from PROactive. Drug Saf 2009; 32:187–202.
- Erdmann E, Song E, Spanheimer R, van Troostenburg de Bruyn A, Perez A. Pioglitazone and bladder malignancy during observational follow-up of PROactive: 6-year update. Abstract presented at the 72nd Scientific Sessions of the American Diabetes Association; June 8–12, 2012; Philadelphia, PA.
- Akinyeke TO, Stewart LV. Troglitazone suppresses c-Myc levels in human prostate cancer cells via a PPARγ-independent mechanism. Cancer Biol Ther 2011; 11:1046–1058.
- Ban JO, Oh JH, Son SM, et al. Troglitazone, a PPAR agonist, inhibits human prostate cancer cell growth through inactivation of NFKB via suppression of GSK-3B expression. Cancer Biol Ther 2011; 12:288–296.
- Yan KH, Yao CJ, Chang HY, Lai GM, Cheng AL, Chuang SE. The synergistic anticancer effect of troglitazone combined with aspirin causes cell cycle arrest and apoptosis in human lung cancer cells. Mol Carcinog 2010; 49:235–246.
- Rashid-Kolvear F, Taboski MA, Nguyen J, Wang DY, Harrington LA, Done SJ. Troglitazone suppresses telomerase activity independently of PPARgamma in estrogen-receptor negative breast cancer cells. BMC Cancer 2010; 10:390.
- Home PD, Kahn SE, Jones NP, Noronha D, Beck-Nielsen H, Viberti GADOPT Study Group; RECORD Steering Committee. Experience of malignancies with oral glucose-lowering drugs in the randomised controlled ADOPT (A Diabetes Outcome Progression Trial) and RECORD (Rosiglitazone Evaluated for Cardiovascular Outcomes and Regulation of Glycaemia in Diabetes) clinical trials. Diabetologia 2010; 53:1838–1845.
- Martin JH, Deacon CF, Gorrell MD, Prins JB. Incretin-based therapies—review of the physiology, pharmacology and emerging clinical experience. Intern Med J 2011; 41:299–307.
- Wadden TA, Hollander P, Klein S, et al; NN8022-1923 Investigators. Weight maintenance and additional weight loss with liraglutide after low-calorie-diet-induced weight loss: the SCALE Maintenance randomized study. Int J Obes (Lond) 2013; 37:1443–1451.
- Hegedüs L, Moses AC, Zdravkovic M, Le Thi T, Daniels GH. GLP-1 and calcitonin concentration in humans: lack of evidence of calcitonin release from sequential screening in over 5,000 subjects with type 2 diabetes or nondiabetic obese subjects treated with the human GLP-1 analog, liraglutide. J Clin Endocrinol Metab 2011; 96:853–860.
- Alves C, Batel-Marques F, Macedo AF. A meta-analysis of serious adverse events reported with exenatide and liraglutide: acute pancreatitis and cancer. Diabetes Res Clin Pract 2012; 98:271–284.
- MacConell L, Brown C, Gurney K, Han J. Safety and tolerability of exenatide twice daily in patients with type 2 diabetes: integrated analysis of 5,594 patients from 19 placebo-controlled and comparator-controlled clinical trials. Diabetes Metab Syndr Obes 2012; 5:29–41.
- Nauck MA. A critical analysis of the clinical use of incretin-based therapies: The benefits by far outweigh the potential risks. Diabetes Care 2013; 36:2126–2132.
- Bailey CJ. Interpreting adverse signals in diabetes drug development programs. Diabetes Care 2013; 36:2098–2106.
- Yachida S, Jones S, Bozic I, et al. Distant metastasis occurs late during the genetic evolution of pancreatic cancer. Nature 2010; 467:1114–1117.
- Egan AG, Blind E, Dunder K, et al. Pancreatic safety of incretin-based drugs—FDA and EMA assessment. N Engl J Med 2014; 370:794–797.
- Bischoff H. The mechanism of alpha-glucosidase inhibition in the management of diabetes. Clin Invest Med 1995; 18:303–311.
- Monami M, Lamanna C, Balzi D, Marchionni N, Mannucci E. Sulphonylureas and cancer: a case-control study. Acta Diabetol 2009; 46:279–284.
- Tseng CH. Diabetes and risk of bladder cancer: a study using the National Health Insurance database in Taiwan. Diabetologia 2011; 54:2009–2015.
- Vallon V. The proximal tubule in the pathophysiology of the diabetic kidney. Am J Physiol Regul Integr Comp Physiol 2011; 300:R1009–R1022.
- Kim Y, Babu AR. Clinical potential of sodium-glucose cotransporter 2 inhibitors in the management of type 2 diabetes. Diabetes Metab Syndr Obes 2012; 5:313–527.
In the last quarter century, many new drugs have become available for treating type 2 diabetes mellitus. The American Association of Clinical Endocrinologists incorporated these new agents in its updated glycemic control algorithm in 2013.1 Because diabetes affects 25.8 million Americans and can lead to blindness, renal failure, cardiovascular disease, and amputation, agents that help us treat it more effectively are valuable.2
One of the barriers to effective treatment is the side effects of the agents. Because some of these drugs have been in use for only a short time, concerns of potential adverse effects have arisen. Cancer is one such concern, especially since type 2 diabetes mellitus by itself increases the risk of cancer by 20% to 50% compared with no diabetes.3
Type 2 diabetes has been linked to risk of cancers of the pancreas,4 colorectum,5,6 liver,7 kidney,8,9 breast,10 bladder,11 and endometri-um,12 as well as to hematologic malignancies such as non-Hodgkin lymphoma.13 The risk of bladder cancer appears to depend on how long the patient has had type 2 diabetes. Newton et al,14 in a prospective cohort study, found that those who had diabetes for more than 15 years and used insulin had the highest risk of bladder cancer. On the other hand, the risk of prostate cancer is actually lower in people with diabetes,15 particularly in those who have had diabetes for longer than 4 years.16
Cancer and type 2 diabetes share many risk factors and underlying pathophysiologic mechanisms. Nonmodifiable risk factors for both diseases include advanced age, male sex, ethnicity (African American men appear to be most vulnerable to both cancer and diabetes),17,18 and family history. Modifiable risk factors include lower socioeconomic status, obesity, and alcohol consumption. These common risk factors lead to hyperinsulinemia and insulin resistance, changes in mitochondrial function, low-grade inflammation, and oxidative stress,3 which promote both diabetes and cancer. Diabetes therapy may influence several of these processes.
Several classes of diabetes drugs, including exogenous insulin,19–22 insulin secretagogues,23–25 and incretin-based therapies,26–28 have been under scrutiny because of their potential influences on cancer development in a population already at risk (Table 1).
INSULIN ANALOGUES: MIXED EVIDENCE
Insulin promotes cell division by binding to insulin receptor isoform A and insulin-like growth factor 1 receptors.29 Because endogenous hyperinsulinemia has been linked to cancer risk, growth, and proliferation, some speculate that exogenous insulin may also increase cancer risk.
In 2009, a retrospective study by Hemkens et al linked the long-acting insulin analogue glargine to risk of cancer.19 This finding set off a tumult of controversy within the medical community and concern among patients. Several limitations of the study were brought to light, including a short duration of follow-up, and several other studies have refuted the study’s findings.20,21
More recently, the Outcome Reduction With Initial Glargine Intervention (ORIGIN) trial22 found no higher cancer risk with glargine use than with placebo. This study enrolled 12,537 participants from 573 sites in 40 countries. Specifically, risks with glargine use were as follows:
- Any cancer—hazard ratio 1.00, 95% confidence interval (CI) 0.88–1.13, P = .97
- Cancer death—hazard ratio 0.94, 95% CI 0.77–1.15, P = .52.
However, the study was designed to assess cardiovascular outcomes, not cancer risk. Furthermore, the participants were not typical of patients seen in clinical practice: their insulin doses were lower (the median insulin dose was 0.4 units/kg/day by year 6, whereas in clinical practice, those with type 2 diabetes mellitus often use more than 1 unit/kg/day, depending on duration of diabetes, diet, and exercise regimen), and their baseline median hemoglobin A1c level was only 6.4%. And one may argue that the median follow-up of 6.2 years was too short for cancer to develop.22
In vitro studies indicate that long-acting analogue insulin therapy may promote cancer cell growth more than endogenous insulin,30 but epidemiologic data have not unequivocally substantiated this.20–22 There is no clear evidence that analogue insulin therapy raises cancer risk above that of human recombinant insulin, and starting insulin therapy should not be delayed because of concerns about cancer risk, particularly in uncontrolled diabetes.
INSULIN SECRETAGOGUES
Sulfonylureas: Higher risk
Before 1995, only two classes of diabetes drugs were approved by the US Food and Drug Administration (FDA)—insulin and sulfonylureas.
Sulfonylureas lower blood sugar levels by binding to sulfonylurea receptors and inhibiting adenosine triphosphate-dependent potassium channels. The resulting change in resting potential causes an influx of calcium, ultimately leading to insulin secretion.
Sulfonylureas are effective, and because of their low cost, physicians often pick them as a second-line agent after metformin.
The main disadvantage of sulfonylureas is the risk of hypoglycemia, particularly in patients with renal failure, the elderly, and diabetic patients who are unaware of when they are hypoglycemic. Other potential drawbacks are that they impair cardiac ischemic preconditioning31 and possibly increase cancer risk.21,32 (Ischemic preconditioning is the process in which transient episodes of ischemia “condition” the myocardium so that it better withstands future episodes with minimal anginal pain and tissue injury.33) Of the sulfonylureas, glyburide has been most implicated in cardiovascular risk.32
In a retrospective cohort study of 62,809 patients from a general-practice database in the United Kingdom, Currie et al21 found that sulfonylurea monotherapy was associated with a 36% higher risk of cancer (95% CI 1.19–1.54, P < .001) than metformin monotherapy. Prescribing bias may have influenced the results: practitioners are more likely to prescribe sulfonylureas to leaner patients, who have a greater likelihood of occult cancer. However, other studies also found that the cancer death rate is higher in those who take a sulfonylurea alone than in those who use metformin alone.23,24
Some evidence indicates that long-acting sulfonylurea formulations (eg, glyburide) likely hold the most danger, certainly in regard to hypoglycemia, but it is less clear if this translates to cancer concerns.31
Meglitinides: Limited evidence
Meglitinides, the other class of insulin secretagogues, are less commonly used but are similar to sulfonylureas in the way they increase endogenous insulin levels. The data are limited regarding cancer risk and meglitinide therapy, but the magnitude of the association is similar to that with sulfonylurea therapy.25
INSULIN SENSITIZERS
There are currently two classes of insulin sensitizers: biguanides and thiazolidinediones (TZDs, also known as glitazones). These drugs show less risk of both cancer incidence and cancer death than insulin secretagogues such as sulfonylureas.21,23,24 In fact, they may decrease cancer potential by alteration of signaling via the AKT/mTOR (v-akt murine thymoma viral oncogene homolog 1/mammalian target of rapamycin) pathway.34
Metformin, a biguanide, is the oral drug of choice
Metformin is the only biguanide currently available in the United States. It was approved by the FDA in 1995, although it had been in clinical use since the 1950s. Inexpensive and familiar, it is the oral antihyperglycemic of choice if there are no contraindications to it, such as renal dysfunction (creatinine ≥ 1.4 mg/dL in women and ≥ 1.5 mg/dL in men), acute decompensated heart failure, or pulmonary or hepatic insufficiency, all of which may lead to an increased risk of lactic acidosis.1
Metformin lowers blood sugar levels primarily by inhibiting hepatic glucose production (gluconeogenesis) and by improving peripheral insulin sensitivity. It directly activates AMP-activated protein kinase (AMPK), which affects insulin signaling and glucose and fat metabolism.35 It may exert further beneficial effects by acutely increasing glucagon-like peptide-1 (GLP-1) levels and inducing islet incretin-receptor gene expression.36 Although the exact mechanisms have not been fully elucidated, metformin’s insulin-sensitizing properties are likely from favorable effects on insulin receptor expression, tyrosine kinase activity, and influences on the incretin pathway.36,37 These effects also mitigate carcinogenesis, both directly (via AMPK and liver kinase B1, a tumor-suppressor gene) and indirectly (via reduction of hyperinsulinemia).35
Overall, biguanide therapy is associated with a lower cancer incidence or, at worst, no effect on cancer incidence. In vitro studies demonstrate that metformin both suppresses cancer cell growth and induces apoptosis, resulting in fewer live cancer cells.34 Several retrospective studies found lower cancer risk in metformin users than in patients receiving antidiabetes drugs other than insulin-sensitizing agents,21,23,25,38–40 while others have shown no effect.41 Use of metformin was specifically associated with lower risk of cancers of the liver, colon and rectum, and lung.42 Further, metformin users have a lower cancer mortality rate than nonusers.24,43
Thiazolidinediones
TZDs, such as pioglitazone, work by binding to peroxisome proliferator-activated gamma receptors in the cell nucleus, altering gene transcription.44 They reduce insulin resistance and levels of endogenous insulin levels and free fatty acids.44
Concern over bladder cancer risk with TZD use, particularly with pioglitazone, has increased in the last few years, as various cohort studies found a statistically significant increased risk with this agent.44 The risk appears to rise with cumulative dose.45,46
Randomized controlled trials also found an increased risk of bladder cancer with TZD therapy, although the difference was not statistically significant.47–49 In a mean follow-up of 8.7 years, the Prospective Pioglitazone Clinical Trial in Macrovascular Events reported 23 cases of bladder cancer in the pioglitazone group vs 22 cases in the placebo group, for rates of 0.9% vs 0.8% (relative risk [RR] 1.06, 95% CI 0.59–1.89).49
On the other hand, the risk of cancer of the breast, colon, and lung has been found to be lower with TZD use.47 In vitro studies support the clinical data, showing that TZDs inhibit growth of human cancer cells derived from cancers of the lung, colon, breast, stomach, ovary, and prostate.50–53
Home et al54 compared rosiglitazone against a sulfonylurea in patients already taking metformin in the Rosiglitazone Evaluated for Cardiovascular Outcomes in Oral Agent Combination Therapy for Type 2 Diabetes (RECORD) trial. Malignancies developed in 6.7% of the sulfonylurea group compared with 5.1% of the rosiglitazone group, for a hazard ratio of 1.33 (95% CI 0.94–1.88).
Both ADOPT (A Diabetes Outcome Progression Trial) and the RECORD trial found rosiglitazone comparable to metformin in terms of cancer risk.54
Colmers et al47 pooled data from four randomized controlled trials, seven cohort studies, and nine case-control studies to assess the risk of cancer with TZD use in type 2 diabetes. Both the randomized and observational data showed neutral overall cancer risk with TZDs. However, pooled data from observational studies showed significantly lower risk with TZD use in terms of:
- Colorectal cancer RR 0.93, 95% CI 0.87–1.00
- Lung cancer RR 0.91, 95% CI 0.84–0.98
- Breast cancer RR 0.89, 95% CI 0.81–0.98.
INCRETIN-BASED THERAPIES
Incretins are hormones released from the gut in response to food ingestion, triggering release of insulin before blood glucose levels rise. Their action explains why insulin secretion increases more after an oral glucose load than after an intravenous glucose load, a phenomenon called the incretin effect.55
There are two incretin hormones: glucose-dependent insulinotropic polypeptide (GIP) and glucagon-like peptide 1 (GLP-1). They have short a half-life because they are rapidly degraded by dipeptidyl peptidase-IV (DPP-IV).55 Available incretin-based therapies are GLP-1 receptor agonists and DPP-IV inhibitors.
When used as monotherapy, incretin-based therapies do not cause hypoglycemia because their effect is glucose-dependent.55 GLP-1 receptor antagonists have the added benefit of inducing weight loss, but DPP-IV inhibitors are considered to be weight-neutral.
GLP-1 receptor agonists
Exenatide, the first of the GLP-1 receptor agonists, was approved in 2005. The original formulation (Byetta) is taken by injection twice daily, and timing in conjunction with food intake is important: it should be taken within 60 minutes before the morning and evening meals. Extended-release exenatide (Bydureon) is a once-weekly formulation taken without regard to timing of food intake. Exenatide (either twice-daily Byetta or once-weekly Bydureon) should not be used in those with creatinine clearance less than 30 mL/min or end-stage renal disease and should be used with caution in patients with renal transplantation.
Liraglutide (Victoza), a once-daily formulation, can be injected irrespective of food intake. The dose does not have to be adjusted for renal function, although it should be used with caution in those with renal impairment, including end-stage renal disease. Approval for a 3-mg formulation is pending with the FDA as a weight-loss drug on the basis of promising results in a randomized phase 3 trial.56
Albiglutide (Tanzeum), a once-weekly GLP-1 receptor antagonist, was recently approved by the FDA.
DPP-IV inhibitors
Whereas GLP-1 receptor agonists are injected, the DPP-IV inhibitors have the advantage of being oral agents.
Sitagliptin (Januvia), the first DPP-IV inhibitor, became available in the United States in 2006. Since then, three more have become available: saxagliptin (Onglyza), linagliptin (Tradjenta), and alogliptin (Nesina).
Concerns about thyroid cancer with incretin drugs
Concerns of increased risk of cancer, particularly of the thyroid and pancreas, have been raised since GLP-1 receptor agonists and DPP-IV inhibitors became available.
Studies in rodents have shown C-cell hyperplasia, sometimes resulting in increased incidence of thyroid carcinoma, and dose-dependent rises in serum calcitonin, particularly with liraglutide.26 This has raised concern about an increased risk of medullary thyroid carcinoma in humans. However, the density of C cells in rodents is up to 45 times greater than in humans, and C cells also express functional GLP-1 receptors.26
Gier et al27 assessed the expression of calcitonin and human GLP-1 receptors in normal C cells, C cell hyperplasia, and medullary cancer. In this study, calcitonin and GLP-1 receptor were co-expressed in medullary thyroid cancer (10 of 12 cases) and C-cell hyperplasia (9 of 9 cases) more commonly than in normal C cells (5 of 15 cases). Further, GLP-1 receptor was expressed in 3 of 17 cases of papillary thyroid cancer.
Calcitonin, a polypeptide hormone produced by thyroid C cells and used as a medullary thyroid cancer biomarker, was increased in a slightly higher percentage of patients treated with liraglutide than in controls, without an increase above the normal range.57
A meta-analysis by Alves et al58 of 25 studies found that neither exenatide (no cases reported) nor liraglutide (odds ratio 1.54, 95% CI 0.40–6.02) was associated with increased thyroid cancer risk.
MacConell et al59 pooled the results of 19 placebo-controlled trials of twice-daily exenatide and found a thyroid cancer incidence rate of 0.3 per 100 patient-years (< 0.1%) vs 0 per 100 patient-years in pooled comparators.
Concerns about pancreatic cancer with incretin drugs
Increased risk of acute pancreatitis is a potential side effect of both DPP-IV inhibitors and GLP-1 receptor agonists and has led to speculation that this translates to an increased risk of pancreatic cancer.
In a point-counterpoint debate, Butler et al28 argued that incretin-based medications have questionable safety, with increased rates of pancreatitis possibly leading to pancreatic cancer. In counterpoint, Nauck60 argued that the risk of pancreatitis or cancer is extremely low, and clinical cases are unsubstantiated.
Bailey61 outlined the complexities and difficulties in drawing firm conclusions from individual clinical trials regarding possible adverse effects of diabetes drugs. The trials are typically designed to assess hemoglobin A1c reduction at varying doses and are typically restricted in patient selection, patient numbers, and drug-exposure duration, which may introduce allocation and ascertainment biases. The attempt to draw firm conclusions from such trials can be problematic and can lead to increased alarm, warranted or not.
Type 2 diabetes mellitus itself is associated with an increased incidence of pancreatic cancer, and whether incretin therapy enhances this risk is still controversial. Whether more episodes of acute pancreatitis without chronic pancreatitis can be extrapolated to an increased incidence of pancreatic cancer is doubtful. A normal pancreatic duct cell may take up to 12 years to become a tumor cell from which pancreatic carcinoma develops, another 7 years to develop metastatic capacity, and another 3 years before a diagnosis is made from clinical symptoms (which are usually accompanied by metastases).62
The risks and benefits of incretin therapies remain a contentious issue, and there are no clear prospective data at this time on increased pancreatic cancer incidence. Long-term prospective studies designed to analyze these specific outcomes (pancreatitis, pancreatic cancer, and medullary thyroid cancer) need to be undertaken.63
OTHER DIABETES THERAPIES
Alpha glucosidase inhibitors
Oral glucosidase inhibitors ameliorate hyperglycemia by inhibiting alpha glucosidase enzymes in the brush border of the small intestines, preventing conversion of polysaccharides to monosaccharides.64 This slows digestion of carbohydrates and glucose release into the bloodstream and blunts the postprandial hyperglycemic excursion.
The two alpha glucosidase inhibitors currently available in the United States are acarbose and miglitol, and although data are limited, they do not appear to increase the risk of cancer.65,66
Sodium-glucose-linked cotransporter 2 inhibitors
The newest class of oral diabetes agents to be approved are the sodium-glucose-linked cotransporter 2 (SGLT2) inhibitors canagliflozin (Invokana) and dapagliflozin (Farxiga).
SGLT2 is a protein in the S1 segment of the proximal renal tubules responsible for over 90% of renal glucose reabsorption. SGLT2 inhibitors lower serum glucose levels by promoting glycosuria and have also been shown to have favorable effects on blood pressure and weight.67,68
Canagliflozin was the first of its class to gain FDA approval in the United States. It has not been found to be associated with increased cancer risk.68
Dapagliflozin, originally approved in Europe, was approved in the United States on January 8, 2014. Because of a possible increased incidence of breast and bladder malignancies, the FDA advisory committee initially recommended against approval and required further data. In those who were treated, nine cases of bladder cancer and nine cases of breast cancer were reported, compared with one case of bladder cancer and no cases of breast cancer in the control group; however, the difference was not statistically significant.68
Since SGLT2 inhibitors are still new, data on long-term outcomes are lacking. Early clinical data do not show a significant increase in cancer risk.
WHAT THIS MEANS IN PRACTICE
Many studies have found associations between diabetes, obesity, hyperinsulinemia, and cancer risk. In the last decade, concerns implicating antihyperglycemic agents in cancer development have arisen but have not been well substantiated. At this time, there are no definitive prospective data indicating that the currently available type 2 diabetes therapies increase the incidence of cancer beyond the inherent increased risk in this population. What, then, is one to do?
Educate. Lifestyle modification, including weight management, should continue to be emphasized in diabetes education, as no therapy is completely effective without adjunct modifications in diet and physical activity. Epidemiologic studies have shown the benefits of lifestyle modifications, which ameliorate many of the adverse metabolic conditions that coexist in type 2 diabetes and cancer.
Screen for cancer. Given the associations between diabetes and malignancy, cancer screening is especially important in this high-risk population.
Customize therapy to individual patients. Those with a personal history of bladder cancer should avoid pioglitazone, and those who have had pancreatic cancer should avoid sitagliptin until definitive clinical data become available.
Moreover, patients with a personal or family history of medullary thyroid cancer should not receive GLP-1 receptor agonists. These agents should also probably be avoided in patients with a personal history of differentiated thyroid carcinoma or a history of familial nonmedullary thyroid carcinoma. Until we have further elucidating data, it is not possible to say whether a family history of any of the other types of cancer should represent a contraindication to the use of any of these agents.
Discuss. The multitude of diabetes therapies warrants physician-patient discussions that carefully weigh the risks and benefits of additional agents to optimize glycemic control and metabolic factors in individual patients.
- Garber AJ, Abrahamson MJ, Barzilay JI, et al; American Association of Clinical Endocrinologists. AACE comprehensive diabetes management algorithm 2013. Endocr Pract 2013; 19:327–336.
- Centers for Disease Control and Prevention (CDC). Diabetes data and trends. www.cdc.gov/diabetes/statistics/. Accessed April 8, 2014.
- Vigneri P, Frasca F, Sciacca L, Pandini G, Vigneri R. Diabetes and cancer. Endocr Relat Cancer 2009; 16:1103–1123.
- Huxley R, Ansary-Moghaddam A, Berrington de González A, Barzi F, Woodward M. Type-II diabetes and pancreatic cancer: a meta-analysis of 36 studies. Br J Cancer 2005; 92:2076–2083.
- Larsson SC, Orsini N, Wolk A. Diabetes mellitus and risk of colorectal cancer: a meta-analysis. J Natl Cancer Inst 2005; 97:1679–1687.
- Limburg PJ, Vierkant RA, Fredericksen ZS, et al. Clinically confirmed type 2 diabetes mellitus and colorectal cancer risk: a population-based, retrospective cohort study. Am J Gastroenterol 2006; 101:1872–1879.
- El-Serag HB, Hampel H, Javadi F. The association between diabetes and hepatocellular carcinoma: a systematic review of epidemiologic evidence. Clin Gastroenterol Hepatol 2006; 4:369–380.
- Lindblad P, Chow WH, Chan J, et al. The role of diabetes mellitus in the aetiology of renal cell cancer. Diabetologia 1999; 42:107–112.
- Washio M, Mori M, Khan M, et al; JACC Study Group. Diabetes mellitus and kidney cancer risk: the results of Japan Collaborative Cohort Study for Evaluation of Cancer Risk (JACC Study). Int J Urol 2007; 14:393–397.
- Larsson SC, Mantzoros CS, Wolk A. Diabetes mellitus and risk of breast cancer: a meta-analysis. Int J Cancer 2007; 121:856–862.
- Larsson SC, Orsini N, Brismar K, Wolk A. Diabetes mellitus and risk of bladder cancer: a meta-analysis. Diabetologia 2006; 49:2819–2823.
- Friberg E, Orsini N, Mantzoros CS, Wolk A. Diabetes mellitus and risk of endometrial cancer: a meta-analysis. Diabetologia 2007; 50:1365–1374.
- Mitri J, Castillo J, Pittas AG. Diabetes and risk of non-Hodgkin’s lymphoma: a meta-analysis of observational studies. Diabetes Care 2008; 31:2391–2397.
- Newton CC, Gapstur SM, Campbell PT, Jacobs EJ. Type 2 diabetes mellitus, insulin-use and risk of bladder cancer in a large cohort study. Int J Cancer 2013; 132:2186–2191.
- Kasper JS, Giovannucci E. A meta-analysis of diabetes mellitus and the risk of prostate cancer. Cancer Epidemiol Biomarkers Prev 2006; 15:2056–2062.
- Rodriguez C, Patel AV, Mondul AM, Jacobs EJ, Thun MJ, Calle EE. Diabetes and risk of prostate cancer in a prospective cohort of US men. Am J Epidemiol 2005; 161:147–152.
- Centers for Disease Control and Prevention. Diabetes public health resource. National diabetes statistics report, 2014. Estimates of diabetes and its burden in the United States. www.cdc.gov/diabetes/pubs/estimates14.htm. Accessed August 12, 2014.
- Centers for Disease Control and Prevention. Cancer prevention and control cancer rates by race and ethnicity. www.cdc.gov/cancer/dcpc/data/race.htm. Accessed August 12, 2014.
- Hemkens LG, Grouven U, Bender R, et al. Risk of malignancies in patients with diabetes treated with human insulin or insulin analogues: a cohort study. Diabetologia 2009; 52:1732–1744.
- Colhoun HMSDRN Epidemiology Group. Use of insulin glargine and cancer incidence in Scotland: a study from the Scottish Diabetes Research Network Epidemiology Group. Diabetologia 2009; 52:1755–1765.
- Currie CJ, Poole CD, Gale EA. The influence of glucose-lowering therapies on cancer risk in type 2 diabetes. Diabetologia 2009; 52:1766–1777.
- ORIGIN Trial Investigators; Gerstein HC, Bosch J, Dagenais GR, et al. Basal insulin and cardiovascular and other outcomes in dysglycemia. N Engl J Med 2012; 367:319–328.
- Baur DM, Klotsche J, Hamnvik OP, et al. Type 2 diabetes mellitus and medications for type 2 diabetes mellitus are associated with risk for and mortality from cancer in a German primary care cohort. Metabolism 2011; 60:1363–1371.
- Bowker SL, Majumdar SR, Veugelers P, Johnson JA. Increased cancer-related mortality for patients with type 2 diabetes who use sulfonylureas or insulin. Diabetes Care 2006; 29:254–258.
- Li D, Yeung SC, Hassan MM, Konopleva M, Abbruzzese JL. Antidiabetic therapies affect risk of pancreatic cancer. Gastroenterology 2009; 137:482–488.
- Bjerre Knudsen L, Madsen LW, Andersen S, et al. Glucagon-like peptide-1 receptor agonists activate rodent thyroid C-cells causing calcitonin release and C-cell proliferation. Endocrinology 2010; 151:1473–1486.
- Gier B, Butler PC, Lai CK, Kirakossian D, DeNicola MM, Yeh MW. Glucagon like peptide-1 receptor expression in the human thyroid gland. J Clin Endocrinol Metab 2012; 97:121–131.
- Butler PC, Elashoff M, Elashoff R, Gale EA. A critical analysis of the clinical use of incretin-based therapies: are the GLP-1 therapies safe? Diabetes Care 2013; 36:2118–2125.
- Belfiore A, Malaguarnera R. Insulin receptor and cancer. Endocr Relat Cancer 2011; 18:R125–R147.
- Weinstein D, Simon M, Yehezkel E, Laron Z, Werner H. Insulin analogues display IGF-I-like mitogenic and anti-apoptotic activities in cultured cancer cells. Diabetes Metab Res Rev 2009; 25:41–49.
- Riddle MC. Editorial: sulfonylureas differ in effects on ischemic preconditioning—is it time to retire glyburide? J Clin Endocrinol Metab 2003; 88:528–530.
- Bodmer M, Becker C, Meier C, Jick SS, Meier CR. Use of antidiabetic agents and the risk of pancreatic cancer: a case-control analysis. Am J Gastroenterol 2012; 107:620–626.
- Deutsch E, Berger M, Kussmaul WG, Hirshfeld JW, Herrmann HC, Laskey WK. Adaptation to ischemia during percutaneous transluminal coronary angioplasty. Clinical, hemodynamic, and metabolic features. Circulation 1990; 82:2044–2051.
- Feng YH, Velazquez-Torres G, Gully C, Chen J, Lee MH, Yeung SC. The impact of type 2 diabetes and antidiabetic drugs on cancer cell growth. J Cell Mol Med 2011; 15:825–836.
- Viollet B, Guigas B, Sanz Garcia N, Leclerc J, Foretz M, Andreelli F. Cellular and molecular mechanisms of metformin: an overview. Clin Sci (Lond) 2012; 122:253–270.
- Maida A, Lamont BJ, Cao X, Drucker DJ. Metformin regulates the incretin receptor axis via a pathway dependent on peroxisome proliferator-activated receptor-α in mice. Diabetologia 2011; 54:339–349.
- Gunton JE, Delhanty PJ, Takahashi S, Baxter RC. Metformin rapidly increases insulin receptor activation in human liver and signals preferentially through insulin-receptor substrate-2. J Clin Endocrinol Metab 2003; 88:1323–1332.
- Ruiter R, Visser LE, van Herk-Sukel MP, et al. Lower risk of cancer in patients on metformin in comparison with those on sulfonylurea derivatives: results from a large population-based follow-up study. Diabetes Care 2012; 35:119–124.
- Libby G, Donnelly LA, Donnan PT, Alessi DR, Morris AD, Evans JM. New users of metformin are at low risk of incident cancer: a cohort study among people with type 2 diabetes. Diabetes Care 2009; 32:1620–1625.
- Bodmer M, Becker C, Meier C, Jick SS, Meier CR. Use of metformin and the risk of ovarian cancer: a case-control analysis. Gynecol Oncol 2011; 123:200–204.
- Azoulay L, Dell’Aniello S, Gagnon B, Pollak M, Suissa S. Metformin and the incidence of prostate cancer in patients with type 2 diabetes. Cancer Epidemiol Biomarkers Prev 2011; 20:337–344.
- Noto H, Goto A, Tsujimoto T, Noda M. Cancer risk in diabetic patients treated with metformin: a systematic review and meta-analysis. PLoS One 2012; 7:e33411.
- Currie CJ, Poole CD, Jenkins-Jones S, Gale EA, Johnson JA, Morgan CL. Mortality after incident cancer in people with and without type 2 diabetes: impact of metformin on survival. Diabetes Care 2012; 35:299–304.
- Yki-Järvinen H. Thiazolidinediones. N Engl J Med 2004; 351:1106–1118.
- Azoulay L, Yin H, Filion KB, et al. The use of pioglitazone and the risk of bladder cancer in people with type 2 diabetes: nested case-control study. BMJ 2012; 344:e3645.
- Lewis JD, Ferrara A, Peng T, et al. Risk of bladder cancer among diabetic patients treated with pioglitazone: interim report of a longitudinal cohort study. Diabetes Care 2011; 34:916–922.
- Colmers IN, Bowker SL, Johnson JA. Thiazolidinedione use and cancer incidence in type 2 diabetes: a systematic review and meta-analysis. Diabetes Metab 2012; 38:475–484.
- Dormandy J, Bhattacharya M, van Troostenburg de Bruyn AR; PROactive investigators. Safety and tolerability of pioglitazone in high-risk patients with type 2 diabetes: an overview of data from PROactive. Drug Saf 2009; 32:187–202.
- Erdmann E, Song E, Spanheimer R, van Troostenburg de Bruyn A, Perez A. Pioglitazone and bladder malignancy during observational follow-up of PROactive: 6-year update. Abstract presented at the 72nd Scientific Sessions of the American Diabetes Association; June 8–12, 2012; Philadelphia, PA.
- Akinyeke TO, Stewart LV. Troglitazone suppresses c-Myc levels in human prostate cancer cells via a PPARγ-independent mechanism. Cancer Biol Ther 2011; 11:1046–1058.
- Ban JO, Oh JH, Son SM, et al. Troglitazone, a PPAR agonist, inhibits human prostate cancer cell growth through inactivation of NFKB via suppression of GSK-3B expression. Cancer Biol Ther 2011; 12:288–296.
- Yan KH, Yao CJ, Chang HY, Lai GM, Cheng AL, Chuang SE. The synergistic anticancer effect of troglitazone combined with aspirin causes cell cycle arrest and apoptosis in human lung cancer cells. Mol Carcinog 2010; 49:235–246.
- Rashid-Kolvear F, Taboski MA, Nguyen J, Wang DY, Harrington LA, Done SJ. Troglitazone suppresses telomerase activity independently of PPARgamma in estrogen-receptor negative breast cancer cells. BMC Cancer 2010; 10:390.
- Home PD, Kahn SE, Jones NP, Noronha D, Beck-Nielsen H, Viberti GADOPT Study Group; RECORD Steering Committee. Experience of malignancies with oral glucose-lowering drugs in the randomised controlled ADOPT (A Diabetes Outcome Progression Trial) and RECORD (Rosiglitazone Evaluated for Cardiovascular Outcomes and Regulation of Glycaemia in Diabetes) clinical trials. Diabetologia 2010; 53:1838–1845.
- Martin JH, Deacon CF, Gorrell MD, Prins JB. Incretin-based therapies—review of the physiology, pharmacology and emerging clinical experience. Intern Med J 2011; 41:299–307.
- Wadden TA, Hollander P, Klein S, et al; NN8022-1923 Investigators. Weight maintenance and additional weight loss with liraglutide after low-calorie-diet-induced weight loss: the SCALE Maintenance randomized study. Int J Obes (Lond) 2013; 37:1443–1451.
- Hegedüs L, Moses AC, Zdravkovic M, Le Thi T, Daniels GH. GLP-1 and calcitonin concentration in humans: lack of evidence of calcitonin release from sequential screening in over 5,000 subjects with type 2 diabetes or nondiabetic obese subjects treated with the human GLP-1 analog, liraglutide. J Clin Endocrinol Metab 2011; 96:853–860.
- Alves C, Batel-Marques F, Macedo AF. A meta-analysis of serious adverse events reported with exenatide and liraglutide: acute pancreatitis and cancer. Diabetes Res Clin Pract 2012; 98:271–284.
- MacConell L, Brown C, Gurney K, Han J. Safety and tolerability of exenatide twice daily in patients with type 2 diabetes: integrated analysis of 5,594 patients from 19 placebo-controlled and comparator-controlled clinical trials. Diabetes Metab Syndr Obes 2012; 5:29–41.
- Nauck MA. A critical analysis of the clinical use of incretin-based therapies: The benefits by far outweigh the potential risks. Diabetes Care 2013; 36:2126–2132.
- Bailey CJ. Interpreting adverse signals in diabetes drug development programs. Diabetes Care 2013; 36:2098–2106.
- Yachida S, Jones S, Bozic I, et al. Distant metastasis occurs late during the genetic evolution of pancreatic cancer. Nature 2010; 467:1114–1117.
- Egan AG, Blind E, Dunder K, et al. Pancreatic safety of incretin-based drugs—FDA and EMA assessment. N Engl J Med 2014; 370:794–797.
- Bischoff H. The mechanism of alpha-glucosidase inhibition in the management of diabetes. Clin Invest Med 1995; 18:303–311.
- Monami M, Lamanna C, Balzi D, Marchionni N, Mannucci E. Sulphonylureas and cancer: a case-control study. Acta Diabetol 2009; 46:279–284.
- Tseng CH. Diabetes and risk of bladder cancer: a study using the National Health Insurance database in Taiwan. Diabetologia 2011; 54:2009–2015.
- Vallon V. The proximal tubule in the pathophysiology of the diabetic kidney. Am J Physiol Regul Integr Comp Physiol 2011; 300:R1009–R1022.
- Kim Y, Babu AR. Clinical potential of sodium-glucose cotransporter 2 inhibitors in the management of type 2 diabetes. Diabetes Metab Syndr Obes 2012; 5:313–527.
KEY POINTS
- Exogenous insulin, insulin secretagogues, and incretin-based therapies are under scrutiny because of their potential influences on cancer development in a population already at risk.
- At present, we lack adequate prospective data on the cancer risk from diabetes drugs.
- Patients with a personal history of bladder cancer should avoid pioglitazone, and those who have had pancreatic cancer should avoid incretin therapies until definitive clinical data become available.
- Patients with a personal or family history of medullary thyroid cancer or multiple endocrine neoplasia type 2 should not receive glucagon-like peptide-1 receptor agonists. These agents should also probably be avoided in patients with a personal history of differentiated thyroid carcinoma or a history of familial nonmedullary thyroid carcinoma.
- Given the associations between diabetes and malignancy, cancer screening is especially important.
When patients on target-specific oral anticoagulants need surgery
More then 2.5 million patients in the United States are on long-term anticoagulation therapy for atrial fibrillation, venous thromboembolic disease, or mechanical heart valves,1 and the number is expected to rise as the population ages. Each year, about 10% of these patients undergo an invasive procedure or surgery that requires temporary interruption of anticoagulation.2
Most physicians are familiar with the perioperative management of warfarin, a vitamin K antagonist, since for decades it has been the sole oral anticoagulant available. However, many physicians lack experience with the three target-specific oral anticoagulants (TSOACs; also known as “novel” oral anticoagulants) approved so far: the direct thrombin inhibitor dabigatran (Pradaxa) and the direct factor Xa inhibitors rivaroxaban (Xarelto) and apixaban (Eliquis).
With their rapid onset of action, predictable pharmacokinetics, relatively short half-lives, and fewer drug-drug interactions than warfarin, TSOACs overcome many of the limitations of the older oral anticoagulant warfarin. In many ways, these qualities simplify the perioperative management of anticoagulation. At the same time, these new drugs also bring new challenges: caution is needed in patients with renal impairment; the level of anticoagulation is difficult to assess; and there is no specific antidote or standardized procedure to reverse their anticoagulant effect. While various periprocedural protocols for TSOAC therapy have been proposed, evidence-based guidelines are still to come.
This article first discusses the pharmacology of dabigatran, rivaroxaban, and apixaban that is pertinent to the perioperative period. It then briefly reviews the general principles of perioperative management of anticoagulation. The final section provides specific recommendations for the perioperative management of TSOACs.
PHARMACOLOGY OF TARGET-SPECIFIC ORAL ANTICOAGULANTS
Dabigatran, a factor IIa inhibitor
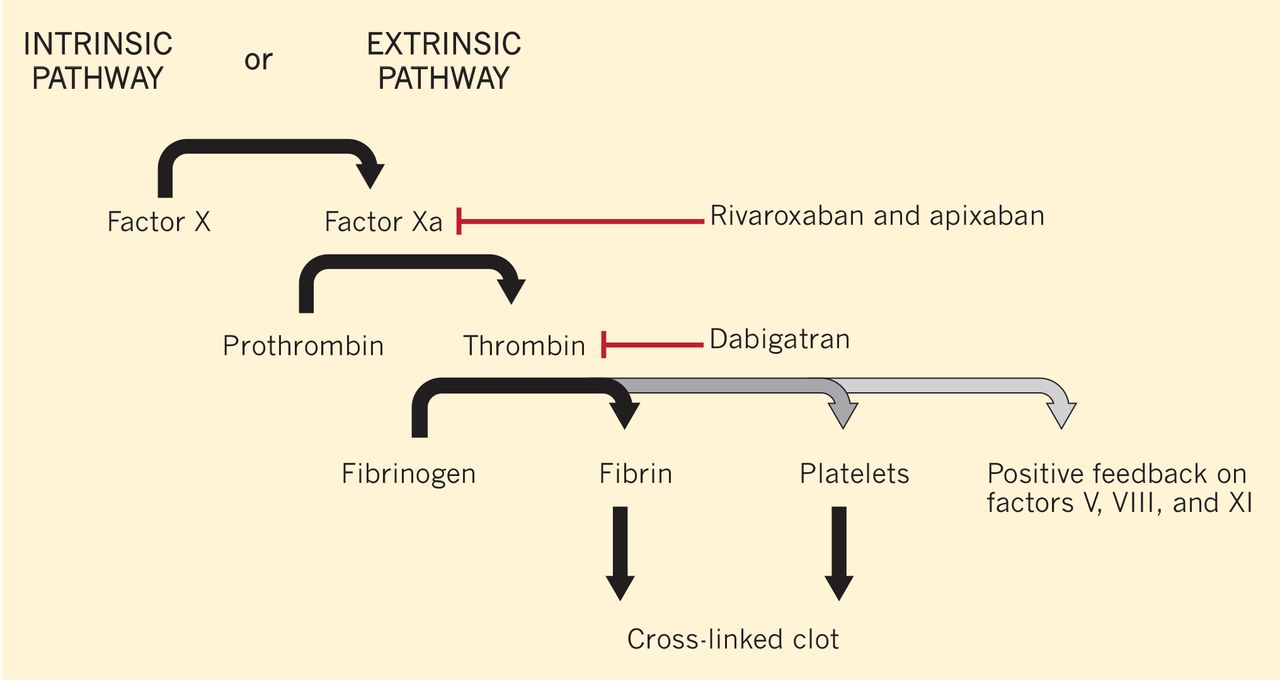
Dabigatran is an oral direct thrombin (factor IIa) inhibitor. It exerts its anticoagulant effect by blocking the generation of fibrin, inhibiting platelet aggregation, and dampening the activity of factors V, VIII, and XI (Figure 1).3,4 From its introduction in October 2010 through August 2012, nearly 3.7 million prescriptions were dispensed to 725,000 patients in the United States.5
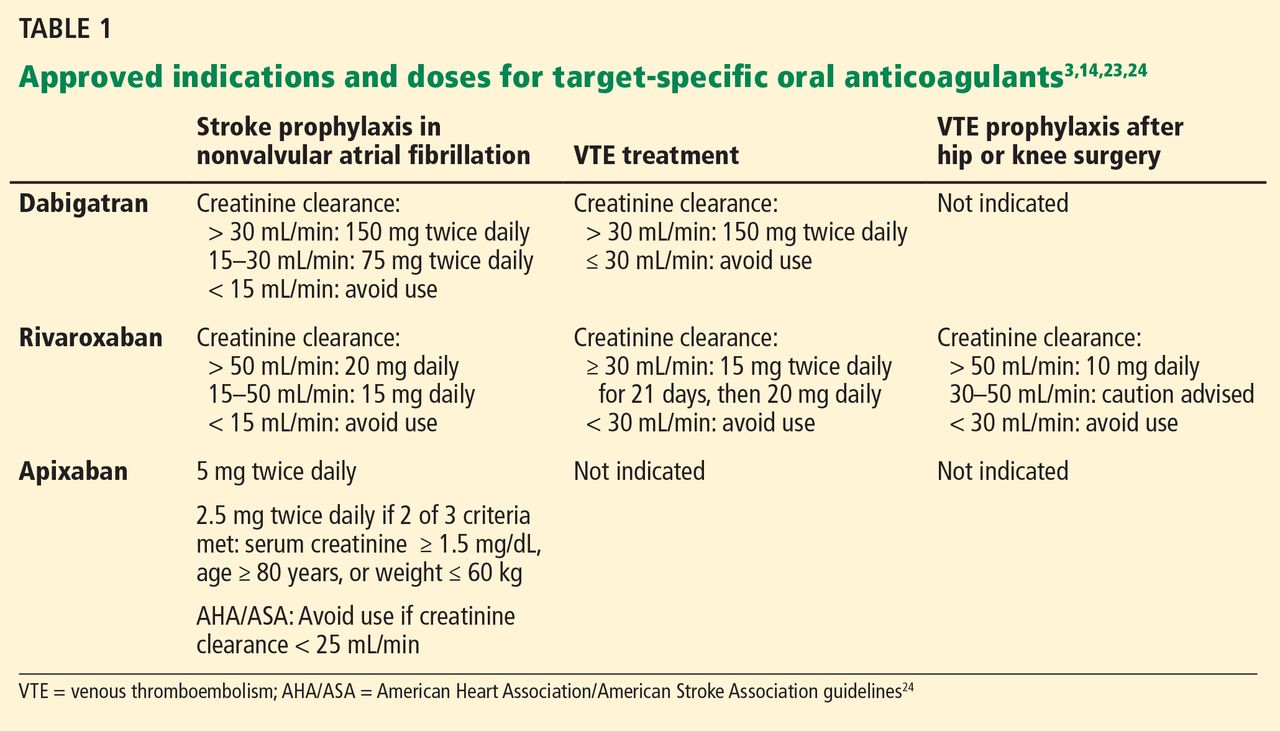
Indications for dabigatran. Dabigatran is approved in the United States and Canada for preventing stroke in nonvalvular atrial fibrillation (Table 1).6 More recently, it received US approval for treating deep vein thrombosis or pulmonary embolism after 5 to 10 days of a parenteral anticoagulant.7,8 It is also approved in Europe and Canada for preventing venous thromboembolism (VTE) after total hip replacement and knee arthroplasty.9,10
Dabigatran is contraindicated in patients with a mechanical heart valve, based on a phase 2 study in which it conferred a higher risk of thromboembolism and bleeding than warfarin.3,11
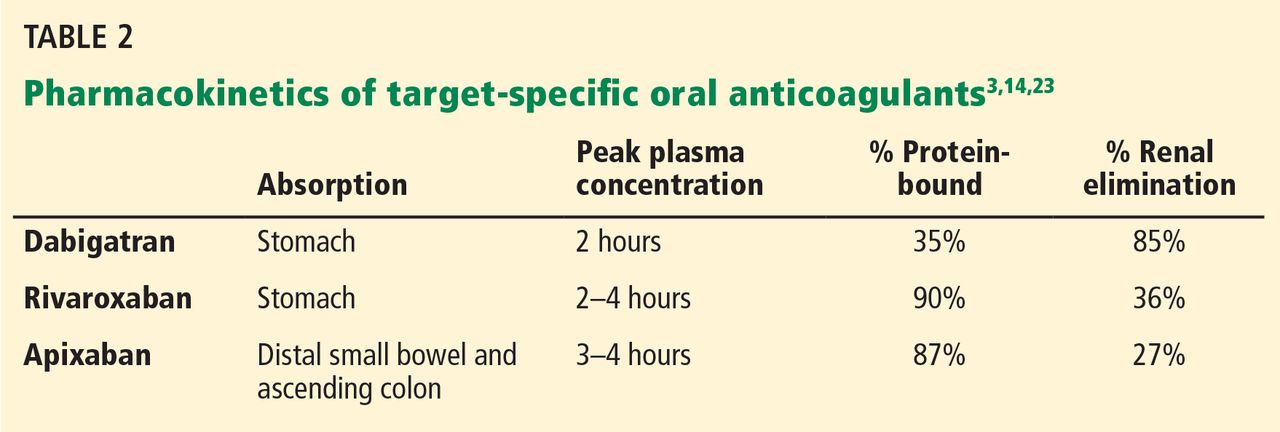
Pharmacokinetics of dabigatran. Dabigatran is formulated as a prodrug, dabigatran etexilate, in a capsule containing multiple small pellets.12 The capsules should not be crushed, as this significantly increases oral bioavailability. The prodrug is absorbed across the gastric mucosa and is then rapidly converted to the active form (Table 2).
Plasma concentrations peak within 2 hours of ingestion, which means that therapeutic anticoagulation is achieved shortly after taking the drug.
Only 35% of dabigatran is protein-bound, which allows it to be removed by hemodialysis. Nearly 85% of the drug is eliminated in the urine. It has a half-life of 13 to 15 hours in patients with normal renal function.3 However, its half-life increases to about 27 hours in patients whose creatinine clearance is less than 30 mL/min. As a result, the dose must be reduced in patients with renal impairment (Table 1).
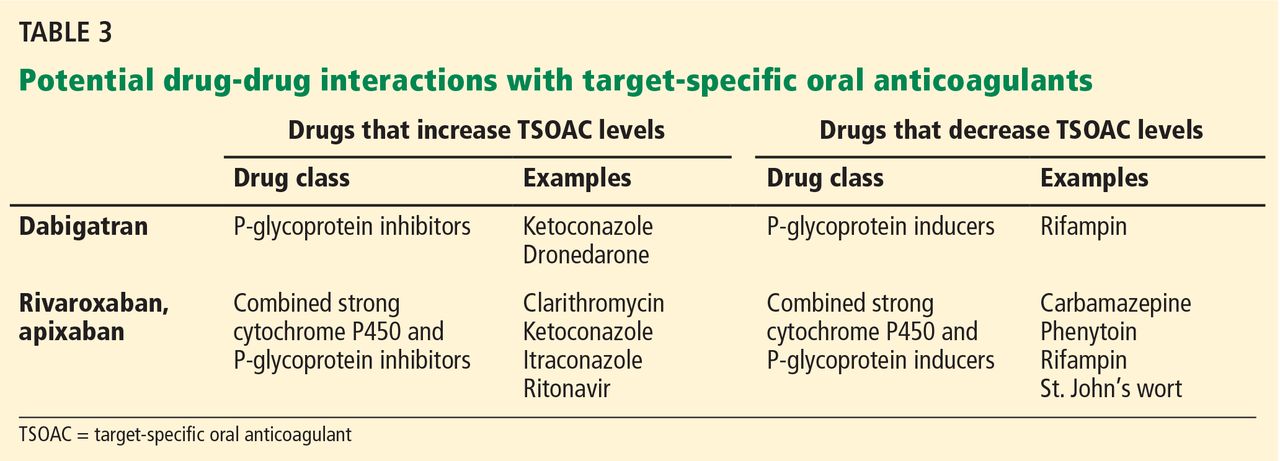
Dabigatran is not metabolized by the cytochrome P450 enzymes, but it is a substrate for P-glycoprotein, so it still has the potential for drug-drug interactions.3 Practitioners should be familiar with these potential interactions (Table 3), as they can result in higher- or lower-than-expected plasma concentrations of dabigatran in the perioperative period.13
Rivaroxaban, a factor Xa inhibitor
Rivaroxaban is an oral direct factor Xa inhibitor. It has been approved by the US Food and Drug Administration (FDA) for the prevention of stroke in nonvalvular atrial fibrillation, for VTE treatment, and for VTE prophylaxis after hip replacement or knee replacement (Table 1).14–20 It has not yet been studied in patients with hip fracture.
Pharmacokinetics of rivaroxaban. Rivaroxaban is manufactured as a tablet that is best absorbed in the stomach (Table 2).14 In contrast to dabigatran, it can be crushed and, for example, mixed with applesauce for patients who have trouble swallowing. It can also be mixed with water and given via nasogastric tube; however, postpyloric administration should be avoided.
Plasma concentrations peak within a few hours after ingestion. Rivaroxaban is highly protein-bound, so it cannot be eliminated by hemodialysis.
The drug relies on renal elimination to a smaller degree than dabigatran, with one-third of the dose eliminated unchanged in the urine, one-third eliminated in the urine as inactive metabolite, and the remaining one-third eliminated in the feces. However, enough parent compound is cleared through the kidneys that the half-life of rivaroxaban increases from 8.3 hours in healthy individuals to 9.5 hours in patients whose creatinine clearance is less than 30 mL/min.21 As with dabigatran, the dose must be adjusted for renal impairment (Table 1).
Rivaroxaban has significant liver metabolism, specifically through the cytochrome P450 3A4 enzyme, and it is also a substrate of P-glycoprotein. Therefore, potential drug-drug interactions must be taken into account, as they may lead to important alterations in plasma concentrations (Table 3).
Apixaban, a factor Xa inhibitor
Apixaban is also an oral direct factor Xa inhibitor. It is the newest of the oral anticoagulants to be approved in the United States, specifically for preventing stroke in nonvalvular atrial fibrillation (Table 1).22
Pharmacokinetics of apixaban. Apixaban is produced as a tablet that is absorbed slowly through the gastrointestinal tract, mainly the distal small bowel and ascending colon (Table 2).23
Peak plasma concentrations are reached a few hours after ingestion. Like rivaroxaban, apixaban is highly protein-bound, so it cannot be removed by hemodialysis.
Apixaban is similar to rivaroxaban in that 27% of the parent compound is cleared through the kidneys, it undergoes significant hepatic metabolism through cytochrome P450 3A4, and it is a substrate for P-glycoprotein.
Drug-drug interactions must be considered as a potential source of altered drug exposure and clearance (Table 3).
Unlike dabigatran and rivaroxaban, dose reduction is not based on the calculated creatinine clearance. Instead, a reduced dose is required if the patient meets two of the following three criteria:
- Serum creatinine level ≥ 1.5 mg/dL
- Age ≥ 80
- Weight ≤ 60 kg (Table 1).
The American Heart Association/American Stroke Association guidelines further recommend against using apixaban in patients with a creatinine clearance less than 25 mL/min.24
Edoxaban, a factor Xa inhibitor in development
Edoxaban (Savaysa), another factor Xa inhibitor, is available in Japan and has been submitted for approval in the United States for treating VTE and for preventing stroke in patients with
PERIOPERATIVE CONSIDERATIONS IN ANTICOAGULATION
Before addressing the perioperative management of TSOACs, let us review the evidence guiding the perioperative management of any chronic anticoagulant.
In fact, no large prospective randomized trial has clearly defined the risks and benefits of using or withholding a bridging anticoagulation strategy around surgery and other procedures, though the PERIOP 2 and BRIDGE trials are currently ongoing.25,26 There are some data regarding continuing anticoagulation without interruption, but they have mainly been derived from specific groups (eg, patients on warfarin undergoing cardiac pacemaker or defibrillator placement) and in procedures that pose a very low risk of bleeding complications (eg, minor dental extractions, cataract surgery, dermatologic procedures).2,27 Recommendations are, therefore, necessarily based on small perioperative trials and data gleaned from cohort review and from studies that did not involve surgical patients.
Ultimately, the decisions whether to discontinue oral anticoagulants and whether to employ bridging anticoagulation are based on assumptions about the risks of bleeding and the risk of thrombotic events, with similar assumptions regarding the effects of anticoagulants on both outcomes. In addition, the relative acceptance of bleeding vs thrombotic risks implicitly guides these complex decisions.
Perioperative bleeding risk
Many risk factors specific to the patient and to the type of surgery affect the rates and severity of perioperative bleeding.28
As for patient-specific risk factors, a small retrospective cohort analysis revealed that a HAS-BLED score of 3 or higher was highly discriminating in predicting perioperative bleeding in atrial fibrillation patients receiving anticoagulation.29 (The HAS-BLED score is based on hypertension, abnormal renal or liver function, stroke, bleeding, labile international normalized ratio [INR], elderly [age > 65] and drug therapy.30) However, there are no widely validated tools that incorporate patient-specific factors to accurately predict bleeding risk in an individual patient.
Therefore, the American College of Chest Physicians (ACCP) guidelines suggest coarsely categorizing bleeding risk as either low or high solely on the basis of the type of procedure.2 Procedures considered “high-risk” have a risk greater than 1.5% to 2% and include urologic surgery involving the prostate or kidney, colonic polyp resections, surgeries involving highly vascular organs such as the liver or spleen, joint replacements, cancer surgeries, and cardiac or neurosurgical procedures.
Perioperative thrombotic risk
The ACCP guidelines2 place patients with atrial fibrillation, VTE, or mechanical heart valves in three risk groups for perioperative thromboembolism without anticoagulation, based on their annual risk of a thrombotic event:
- High risk—annual risk of a thrombotic event > 10%
- Moderate risk—5% to 10%
- Low risk—< 5%.
Comparing the risks calculated by these methods with the real-world risk of perioperative thrombosis highlights the problem of applying nonperioperative risk calculations: the perioperative period exposes patients to a higher risk than these models would predict.31 Nonetheless, these risk categorizations likely have some validity in stratifying patients into risk groups, even if the absolute risks are inaccurate.
Perioperative bridging for patients taking warfarin
Many patients with atrial fibrillation, VTE, or a mechanical heart valve need to interrupt their warfarin therapy because of the bleeding risk of an upcoming procedure.
The perioperative management of warfarin and other vitamin K antagonists is challenging because of the pharmacokinetics and pharmacodynamics of these drugs. Because it has a long half-life, warfarin usually must be stopped 4 to 5 days before a procedure in order to allow not only adequate clearance of the drug itself, but also restoration of functional clotting factors to normal or near-normal levels.12 Warfarin can generally be resumed 12 to 24 hours after surgery, assuming adequate hemostasis has been achieved, and it will again take several days for the INR to reach the therapeutic range.
The ACCP guidelines recommend using the perioperative risk of thromboembolism to make decisions about the need for bridging anticoagulation during warfarin interruption.2 They suggest that patients at high risk of thrombosis receive bridging with an alternative anticoagulant such as low-molecular-weight heparin or unfractionated heparin, because of the prolonged duration of subtherapeutic anticoagulation.
There has been clinical interest in using a TSOAC instead of low-molecular-weight or unfractionated heparin for bridging in the perioperative setting. Although this approach may be attractive from a cost and convenience perspective, it cannot be endorsed as yet because of the lack of information on the pros and cons of such an approach.
Patients at low thrombotic risk do not require bridging. In patients at moderate risk, the decision to bridge or not to bridge is based on careful consideration of patient-specific and surgery-specific factors.
PERIOPERATIVE MANAGEMENT OF TARGET-SPECIFIC ORAL ANTICOAGULANTS
As summarized above, the perioperative management strategy for chronic anticoagulation is based on limited evidence, even for drugs as well established as warfarin.
The most recent ACCP guidelines on the perioperative management of antithrombotic therapy do not mention TSOACs.2 For now, the management strategy must be based on the pharmacokinetics of the drugs, package inserts from the manufacturers, and expert recommendations.3,14,23,32–34 Fortunately, because TSOACs have a more favorable pharmacokinetic profile than that of warfarin, their perioperative uses should be more streamlined. As always, the goal is to minimize the risk of both periprocedural bleeding and thromboembolism.
Timing of cessation of anticoagulation
The timing of cessation of TSOACs before an elective procedure depends primarily on two factors: the bleeding risk of the procedure and the patient’s renal function. Complete clearance of the medication is not necessary in all circumstances.
TSOACs should be stopped four to five half-lives before a procedure with a high bleeding risk, so that there is no or only minimal residual anticoagulant effect. The drug can be stopped two to three half-lives before a procedure with a low bleeding risk. Remember: the half-life increases as creatinine clearance decreases.
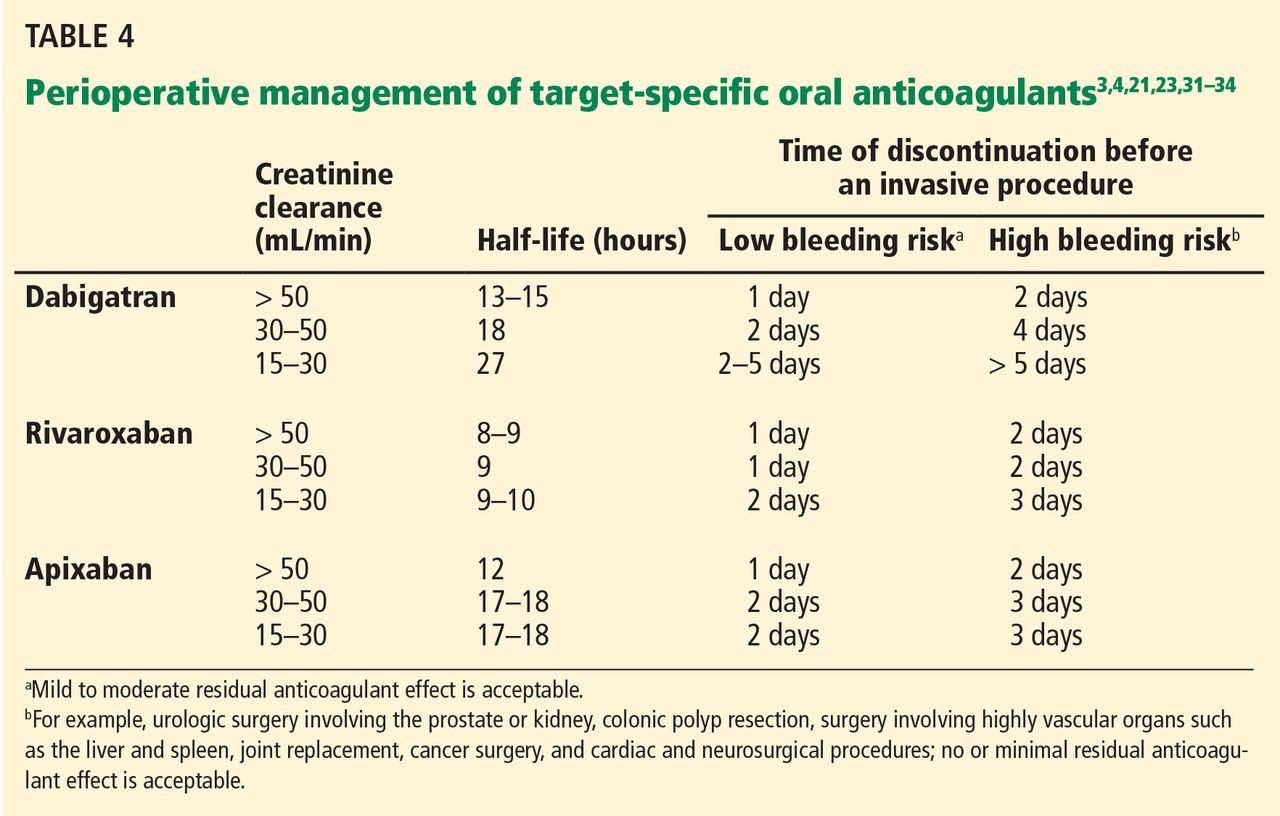
Specific recommendations may vary across institutions, but a suggested strategy is shown in Table 4.3,4,21,23,32–35 For the small subset of patients on P-glycoprotein or cytochrome P450 inhibitors or inducers, further adjustment in the time of discontinuation may be required.
Therapy does not need to be interrupted for procedures with a very low bleeding risk, as defined above.33,34 There is also preliminary evidence that TSOACs, similar to warfarin, may be continued during cardiac pacemaker or defibrillator placement.36
Evidence from clinical trials of perioperative TSOAC management
While the above recommendations are logical, studies are needed to prospectively evaluate perioperative management strategies.
The RE-LY trial (Randomized Evaluation of Long-Term Anticoagulation Therapy), which compared the effects of dabigatran and warfarin in preventing stroke in patients with atrial fibrillation, is one of the few clinical trials that also looked at periprocedural bleeding.37 About a quarter of the RE-LY participants required interruption of anticoagulation for a procedure.
Warfarin was managed according to local practices. For most of the study, the protocol required that dabigatran be discontinued 24 hours before a procedure, regardless of renal function or procedure type. The protocol was later amended and closely mirrored the management plan outlined in Table 4.
With either protocol, there was no statistically significant difference between dabigatran and warfarin in the rates of bleeding and thrombotic complications in the 7 days before or 30 days after the procedure.
A major limitation of the study was that most patients underwent a procedure with a low bleeding risk, so the analysis was likely underpowered to evaluate rates of bleeding in higher-risk procedures.
The ROCKET-AF trial (Rivaroxaban Once-daily Oral Direct Factor Xa Inhibition Compared With Vitamin K Antagonism for Prevention of Stroke and Embolism Trial in Atrial Fibrillation) also shed light on periprocedural bleeding.15 About 15% of the participants required temporary interruption of anticoagulation for a surgical or invasive procedure.38
The study protocol called for discontinuing rivaroxaban 2 days before any procedure. Warfarin was to be held for 4 days to achieve a goal INR of 1.5 or less.15
Rates of major and nonmajor clinically significant bleeding at 30 days were similar with rivaroxaban and with warfarin.38 As with the RE-LY trial, the retrospective analysis was probably underpowered for assessing rates of bleeding in procedures with higher risk.
Perioperative bridging
While stopping a TSOAC in the perioperative period decreases the risk of bleeding, it naturally increases the risk of thromboembolism. However, patients on TSOACs should not routinely require perioperative bridging with an alternative anticoagulant, regardless of thrombotic risk.
Of note, dabigatran, rivaroxaban, and apixaban carry black-box warnings that discontinuation places patients at higher risk of thrombotic events.3,14,23 These warnings further state that coverage with an alternative anticoagulant should be strongly considered during interruption of therapy for reasons other than pathologic bleeding.
However, it does not necessarily follow that perioperative bridging is required. For example, the warning for rivaroxaban is based on the finding in the ROCKET-AF trial that patients in the rivaroxaban group had higher rates of stroke than those in the warfarin group after the study drugs were stopped at the end of the trial.39 While there was initial concern that this could represent a prothrombotic rebound effect, the authors subsequently showed that patients in the rivaroxaban group were more likely to have had a subtherapeutic INR when transitioning to open-label vitamin-K-antagonist therapy.39,40 There was no difference in the rate of stroke or systemic embolism between the rivaroxaban and warfarin groups when anticoagulation was temporarily interrupted for a procedure.38
The risks and benefits of perioperative bridging with TSOACs are difficult to evaluate, given the dearth of trial data. In the RE-LY trial, only 17% of patients on dabigatran and 28% of patients on warfarin underwent periprocedural bridging.37 The selection criteria and protocol for bridging were not reported. In the ROCKET-AF trial, only 9% of patients received bridging therapy despite a mean CHADS2 score of 3.4.38 (The CHADS2 score is calculated as 1 point each for congestive heart failure, hypertension, age ≥ 75, and diabetes; 2 points for stroke or transient ischemic attack.) The decision to bridge or not was left to the individual investigator. As a result, the literature offers diverse opinions about the appropriateness of transitioning to an alternative anticoagulant.41–43
Bridging does not make sense in most instances, since anticoagulants such as low-molecular-weight heparin have pharmacokinetics similar to those of the available TSOACs and also depend on renal clearance.41 However, there may be situations in which patients must be switched to a parenteral anticoagulant such as unfractionated or low-molecular-weight heparin. For example, if a TSOAC has to be held, the patient has acute renal failure, and a needed procedure is still several days away, it would be reasonable to start a heparin drip for an inpatient at increased thrombotic risk.
In patients with normal renal function, these alternative anticoagulants should be started at the time the next TSOAC dose would have been due.3,14,23 In patients with reduced renal function, initiation of an alternative anticoagulant may need to be delayed 12 to 48 hours depending on which TSOAC is being used, as well as on the degree of renal dysfunction. This delay would help ensure that the onset of anticoagulation with the alternative anticoagulant is timed with the offset of therapeutic anticoagulation with the TSOAC.
Although limited, information from available coagulation assays may assist with the timing of initiation of an alternative anticoagulant (see the following section on laboratory monitoring). Serial testing with appropriate coagulation assays may help identify when most of a TSOAC has been cleared from a patient.
Laboratory monitoring
Inevitably, some patients on TSOACs require urgent or emergency surgery. In certain situations, such as before an orthopedic spine procedure, in which the complications of bleeding could be devastating, it may be necessary to know if any residual anticoagulant effect is present.
Monitoring dabigatran. As one might expect, direct thrombin inhibitors such as dabigatran can prolong the prothrombin time and activated partial thromboplastin time (aPTT).44–47 However, the prothrombin time is not recommended for assessing the level of anticoagulation from dabigatran. Many institutions may be using a normal aPTT to rule out therapeutic concentrations of dabigatran, based on results from early in vitro and ex vivo studies.46 While appealing from a practical standpoint, practitioners should exercise caution when relying on the aPTT to assess the risk of perioperative bleeding. A more recent investigation in patients treated with dabigatran found that up to 35% of patients with a normal aPTT still had a plasma concentration in the therapeutic range.48
The thrombin time and ecarin clotting time are more sensitive tests for dabigatran. A normal thrombin time or ecarin clotting time indicates that no or only minimal dabigatran is present.48 Unfortunately, these two tests often are either unavailable or are associated with long turnaround times, which limits their usefulness in the perioperative setting.
Monitoring rivaroxaban and apixaban. Factor Xa inhibitors such as rivaroxaban and apixaban can also influence the prothrombin time and aPTT (Figure 1).44–47,49,50 The aPTT is relatively insensitive to these drugs at low concentrations. It has been suggested that a normal prothrombin time can reasonably exclude therapeutic concentrations of rivaroxaban.45,46 However, the effects on the prothrombin time are highly variable, changing with the reagent used.49,50 In addition, apixaban appears to have less impact on the prothrombin time overall. The INR is not recommended for monitoring the effect of factor Xa inhibitors.
Anti-factor Xa assays likely represent the best option to provide true quantitative information on the level of anticoagulation with either rivaroxaban or apixaban. However, the assays must be specifically calibrated for each drug for results to be useful. (Anti-factor Xa assays cannot be used for heparin or low-molecular-weight heparin.) Further, most institutions do not yet have this capability. When appropriately calibrated, normal anti-factor Xa levels would exclude any effect of rivaroxaban or apixaban.
Reversal of anticoagulation
If patients on TSOACs require emergency surgery or present with significant bleeding in the setting of persistent anticoagulation, it may be necessary to try to reverse the anticoagulation.
Unlike warfarin or heparin, TSOACS do not have specific reversal agents, though specific antidotes are being developed. For example, researchers are evaluating antibodies capable of neutralizing dabigatran, as well as recombinant thrombin and factor Xa molecules that could antagonize dabigatran and rivaroxaban, respectively.51–53
Reversal can be attempted by neutralizing or removing the offending drug. Activated charcoal may be able to reduce absorption of TSOACs that were recently ingested,44 and dabigatran can be removed by hemodialysis.
However, certain practical considerations may limit the use of dialysis in the perioperative period. Insertion of a temporary dialysis line in an anticoagulated patient poses additional bleeding risks. A standard 4-hour hemodialysis session may remove only about 70% of dabigatran from the plasma, which may not be enough to prevent perioperative bleeding.54 Dabigatran also tends to redistribute from adipose tissue back into plasma after each dialysis session.55 Serial sessions of high-flux intermittent hemodialysis or continuous renal replacement therapy may therefore be needed to counteract rebound elevations in the dabigatran concentration.
Reversal can also be attempted through activation of the coagulation cascade via other mechanisms. Fresh-frozen plasma is unlikely to be a practical solution for reversal.44 Although it can readily replace the clotting factors depleted by vitamin K antagonists, large volumes of fresh-frozen plasma would be needed to overwhelm thrombin or factor Xa inhibition by TSOACs.
There are limited data on the use of prothrombin complex concentrates or recombinant activated factor VIIa in patients on TSOACs, though their use can be considered.56 In a trial in 12 healthy participants, a nonactivated four-factor prothrombin complex concentrate containing factors II, VII, IX, and X immediately and completely reversed the anticoagulant effect of rivaroxaban but had no effect on dabigatran.57 Before 2013, there were no nonactivated four-factor prothrombin complex concentrates available in the United States. The FDA has since approved Kcentra for the urgent reversal of vitamin K antagonists, meaning that the reversal of TSOACs in major bleeding events would still be off-label.58 Giving any of the clotting factors carries a risk of thromboembolism.
Resumption of anticoagulation
TSOACs have a rapid onset of action, and therapeutic levels are reached within a few hours of administration.
Extrapolating from the ACCP guidelines, TSOACs can generally be restarted at therapeutic doses 24 hours after low-bleeding-risk procedures.2 Therapeutic dosing should be delayed 48 to 72 hours after a procedure with a high bleeding risk, assuming adequate hemostasis has been achieved. Prophylactic unfractionated heparin or low-molecular-weight heparin therapy can be given in the interim if deemed safe. Alternatively, for orthopedic patients ultimately transitioning back to therapeutic rivaroxaban after hip or knee arthroplasty, prophylactic rivaroxaban doses can be started 6 to 10 hours after surgery.14
There are numerous reasons why the resumption of TSOACs may have to be delayed after surgery, including nothing-by-mouth status, postoperative nausea and vomiting, ileus, gastric or bowel resection, and the anticipated need for future procedures. Since dabigatran capsules cannot be crushed, they cannot be given via nasogastric tube in patients with postoperative dysphagia. Parenteral anticoagulants should be used until these issues resolve.
Unfractionated heparin is still the preferred anticoagulant in unstable or potentially unstable patients, given its ease of monitoring, quick offset of action, and reversibility. When patients have stabilized, TSOACs can be resumed when the next dose of low-molecular-weight heparin would have been due or when the unfractionated heparin drip is discontinued.3,14,23
UNTIL EVIDENCE-BASED GUIDELINES ARE DEVELOPED
The development of TSOACs has ushered in an exciting new era for anticoagulant therapy. Providers involved in perioperative medicine will increasingly encounter patients on dabigatran, rivaroxaban, and apixaban. However, until evidence-based guidelines are developed for these new anticoagulants, clinicians will have to apply their knowledge of pharmacology and critically evaluate expert recommendations in order to manage patients safely throughout the perioperative period.
- Douketis JD, Berger PB, Dunn AS, et al; American College of Chest Physicians. The perioperative management of antithrombotic therapy: American College of Chest Physicians Evidence-Based Clinical Practice Guidelines (8th Edition). Chest 2008; 133(suppl 6):299S–339S.
- Douketis JD, Spyropoulos AC, Spencer FA, et al; American College of Chest Physicians. Perioperative management of antithrombotic therapy: Antithrombotic Therapy and Prevention of Thrombosis, 9th ed: American College of Chest Physicians Evidence-Based Clinical Practice Guidelines. Chest 2012; 141(suppl 2):e326S–e350S.
- Boehringer Ingelheim Pharmaceuticals, Inc. PRADAXA (dabigatran) package insert. http://bidocs.boehringer-ingelheim.com/BIWebAc-cess/ViewServlet.ser?docBase=renetnt&folderPath=/Prescribing%20Information/PIs/Pradaxa/Pradaxa.pdf. Accessed August 6, 2014.
- Levy JH, Faraoni D, Spring JL, Douketis JD, Samama CM. Managing new oral anticoagulants in the perioperative and intensive care unit setting. Anesthesiology 2013; 118:1466–1474.
- US Food and Drug Administration (FDA). FDA drug safety communication: update on the risk for serious bleeding events with the anticoagulant Pradaxa (dabigatran). www.fda.gov/drugs/drugsafety/ucm326580.htm. Accessed August 6, 2014.
- Connolly SJ, Ezekowitz MD, Yusuf S, et al; RE-LY Steering Committee and Investigators. Dabigatran versus warfarin in patients with atrial fibrillation. N Engl J Med 2009; 361:1139–1151.
- Schulman S, Kearon C, Kakkar AK, et al; RE-COVER Study Group. Dabigatran versus warfarin in the treatment of acute venous thromboembolism. N Engl J Med 2009; 361:2342–2352.
- Schulman S, Kearon C, Kakkar AK, et al; RE-MEDY Trial Investigators. Extended use of dabigatran, warfarin, or placebo in venous thromboembolism. N Engl J Med 2013; 368:709–718.
- Eriksson BI, Dahl OE, Rosencher N, Büller HR, et al; RE-NOVATE Study Group. Dabigatran etexilate versus enoxaparin for prevention of venous thromboembolism after total hip replacement: a randomised, double-blind, non-inferiority trial. Lancet 2007; 370:949–956.
- Eriksson BI, Dahl OE, Rosencher N, et al; RE-MODEL Study Group. Oral dabigatran etexilate vs subcutaneous enoxaparin for the prevention of venous thromboembolism after total knee replacement: the RE-MODEL randomized trial. J Thromb Haemost 2007; 5:2178–2185.
- Eikelboom JW, Connolly SJ, Brueckmann M, et al; RE-ALIGN Investigators. Dabigatran versus warfarin in patients with mechanical heart valves. N Engl J Med 2013; 369:1206–1214.
- Ageno W, Gallus AS, Wittkowsky A, Crowther M, Hylek EM, Palareti G; American College of Chest Physicians. Oral anticoagulant therapy: Antithrombotic Therapy and Prevention of Thrombosis, 9th ed: American College of Chest Physicians Evidence-Based Clinical Practice Guidelines. Chest 2012; 141(suppl 2):e44S–e88S.
- Blech S, Ebner T, Ludwig-Schwellinger E, Stangier J, Roth W. The metabolism and disposition of the oral direct thrombin inhibitor, dabigatran, in humans. Drug Metab Dispos 2008; 36:386–399.
- Janssen Pharmaceuticals, Inc. XARELTO (rivaroxaban) package insert. www.xareltohcp.com/about-xarelto/about-xarelto.html?utm_source=google&utm_medium=cpc&utm_campaign=Branded+-+Broad&utm_term=xarelto%20rivaroxaban&utm_content=Xarelto+Rivaroxaban|mkwid|sxSDxPb4m_dc|pcrid|34667840494. Accessed August 6, 2014.
- Patel MR, Mahaffey KW, Garg J, et al; ROCKET AF Investigators. Rivaroxaban versus warfarin in nonvalvular atrial fibrillation. N Engl J Med 2011; 365:883–391.
- EINSTEIN Investigators; Bauersachs R, Berkowitz SD, Brenner B, et al. Oral rivaroxaban for symptomatic venous thromboembolism. N Engl J Med 2010; 363:2499–2510.
- EINSTEIN–PE Investigators; Büller HR, Prins MH, Lensin AW, et al. Oral rivaroxaban for the treatment of symptomatic pulmonary embolism. N Engl J Med 2012; 366:1287–1297.
- Eriksson BI, Borris LC, Friedman RJ, et al; RECORD1 Study Group. Rivaroxaban versus enoxaparin for thromboprophylaxis after hip arthroplasty. N Engl J Med 2008; 358:2765–2775.
- Kakkar AK, Brenner B, Dahl OE, et al; RECORD2 Investigators. Extended duration rivaroxaban versus short-term enoxaparin for the prevention of venous thromboembolism after total hip arthroplasty: a double-blind, randomised controlled trial. Lancet 2008; 372:31–39.
- Lassen MR, Ageno W, Borris LC, et al; RECORD3 Investigators. Rivaroxaban versus enoxaparin for thromboprophylaxis after total knee arthroplasty. N Engl J Med 2008; 358:2776–2786.
- Kubitza D, Becka M, Mueck W, et al. Effects of renal impairment on the pharmacokinetics, pharmacodynamics and safety of rivaroxaban, an oral, direct factor Xa inhibitor. Br J Clin Pharmacol 2010; 70:703–712.
- Granger CB, Alexander JH, McMurray JJ, et al; ARISTOTLE Committees and Investigators. Apixaban versus warfarin in patients with atrial fibrillation. N Engl J Med 2011; 365:981–992.
- Bristol-Myers Squibb Company. ELIQUIS (apixaban) package insert. www.eliquis.com/index.aspx. Accessed August 6, 2014.
- Furie KL, Goldstein LB, Albers GW, et al; American Heart Association Stroke Council. Oral antithrombotic agents for the prevention of stroke in nonvalvular atrial fibrillation: a science advisory for healthcare professionals from the American Heart Association/American Stroke Association. Stroke 2012; 43:3442–3453.
- ClinicalTrials.gov, US National Institutes of Health. PERIOP 2 - A Safety and Effectiveness Study of LMWH Bridging Therapy Versus Placebo Bridging Therapy for Patients on Long Term Warfarin and Require Temporary Interruption of Their Warfarin. http://clinicaltri-als.gov/show/NCT00432796. Accessed August 6, 2014.
- ClinicalTrials.gov, US National Institutes of Health. Effectiveness of Bridging Anticoagulation for Surgery (The BRIDGE Study). http://clinicaltrials.gov/ct2/show/NCT00786474. Accessed August 6, 2014.
- Birnie DH, Healey JS, Wells GA, et al; BRUISE CONTROL Investigators. Pacemaker or defibrillator surgery without interruption of anticoagulation. N Engl J Med 2013; 368:2084–2093.
- Oberweis BS, Nukala S, Rosenberg A, et al. Thrombotic and bleeding complications after orthopedic surgery. Am Heart J 2013; 165:427.e1–433.e1.
- Omran H, Bauersachs R, Rübenacker S, Goss F, Hammerstingl C. The HAS-BLED score predicts bleedings during bridging of chronic oral anticoagulation. Results from the national multicentre BNK Online bRiDging REgistRy (BORDER). Thromb Haemost 2012; 108:65–73.
- Pisters R, Lane DA, Nieuwlaaat R, de Vos CB, Crijns HJGM, Lip GYH. A novel user-friendly score (HAS-BLED) to assess 1-year risk of major bleeding in patients with atrial fibrillation. The Euro Heart Survey. Chest 2010; 138:1093–1100.
- Kaatz S, Douketis JD, Zhou H, Gage BF, White RH. Risk of stroke after surgery in patients with and without chronic atrial fibrillation. J Thromb Haemost 2010; 8:884–890.
- van Ryn J, Stangier J, Haertter S, et al. Dabigatran etexilate—a novel, reversible, oral direct thrombin inhibitor: interpretation of coagulation assays and reversal of anticoagulant activity. Thromb Haemost 2010; 103:1116–1127.
- Connolly G, Spyropoulos AC. Practical issues, limitations, and periprocedural management of the NOAC’s. J Thromb Thrombolysis 2013; 36:212–222.
- Spyropoulos AC, Douketis JD. How I treat anticoagulated patients undergoing an elective procedure or surgery. Blood 2012; 120:2954–2962.
- Kaatz S, Kouides PA, Garcia DA, et al. Guidance on the emergent reversal of oral thrombin and factor Xa inhibitors. Am J Hematol 2012; 87(suppl 1):S141–S145.
- Rowley CP, Bernard ML, Brabham WW, et al. Safety of continuous anticoagulation with dabigatran during implantation of cardiac rhythm devices. Am J Cardiol 2013; 111:1165–1168.
- Healey JS, Eikelboom J, Douketis J, et al; RE-LY Investigators. Periprocedural bleeding and thromboembolic events with dabigatran compared with warfarin: results from the Randomized Evaluation of Long-Term Anticoagulation Therapy (RE-LY) randomized trial. Circulation 2012; 126:343–348.
- Sherwood MW, Douketis JD, Patel MR, et al; on behalf of the ROCKET AF Investigators. Outcomes of temporary interruption of rivaroxaban compared with warfarin in patients with nonvalvular atrial fibrillation: results from the Rivaroxaban Once Daily, Oral, Direct Factor Xa Inhibition Compared with Vitamin K Antagonism for Prevention of Stroke and Embolism Trial in Atrial Fibrillation (ROCKET AF). Circulation 2014; 129:1850–1859.
- Patel MR, Hellkamp AS, Lokhnygina Y, et al. Outcomes of discontinuing rivaroxaban compared with warfarin in patients with nonvalvular atrial fibrillation: analysis from the ROCKET AF trial (Rivaroxaban Once-Daily, Oral, Direct Factor Xa Inhibition Compared With Vitamin K Antagonism for Prevention of Stroke and Embolism Trial in Atrial Fibrillation). J Am Coll Cardiol 2013; 61:651–658.
- Reynolds MR. Discontinuation of rivaroxaban: filling in the gaps. J Am Coll Cardiol 2013; 61:659–660.
- Turpie AG, Kreutz R, Llau J, Norrving B, Haas S. Management consensus guidance for the use of rivaroxaban—an oral, direct factor Xa inhibitor. Thromb Haemost 2012; 108:876–886.
- Gallego P, Apostolakis S, Lip GY. Bridging evidence-based practice and practice-based evidence in periprocedural anticoagulation. Circulation 2012; 126:1573–1576.
- Sié P, Samama CM, Godier A, et al; Working Group on Perioperative Haemostasis. Surgery and invasive procedures in patients on long-term treatment with direct oral anticoagulants: thrombin or factor-Xa inhibitors. Recommendations of the Working Group on Perioperative Haemostasis and the French Study Group on Thrombosis and Haemostasis. Arch Cardiovasc Dis 2011; 104:669–676.
- King CS, Holley AB, Moores LK. Moving toward a more ideal anticoagulant: the oral direct thrombin and factor Xa inhibitors. Chest 2013; 143:1106–1116.
- Baglin T, Hillarp A, Tripodi A, Elalamy I, Buller H, Ageno W. Measuring oral direct inhibitors (ODIs) of thrombin and factor Xa: a recommendation from the Subcommittee on Control of Anticoagulation of the Scientific and Standardisation Committee of the International Society on Thrombosis and Haemostasis. J Thromb Haemost 2013; 11:756–760.
- Baglin T, Keeling D, Kitchen S; British Committee for Standards in Haematology. Effects on routine coagulation screens and assessment of anticoagulant intensity in patients taking oral dabigatran or rivaroxaban: guidance from the British Committee for Standards in Haematology. Br J Haematol 2012; 159:427–429.
- Mani H, Kasper A, Lindhoff-Last E. Measuring the anticoagulant effects of target specific oral anticoagulants—reasons, methods and current limitations. J Thromb Thrombolysis 2013; 36:187–194.
- Hawes EM, Deal AM, Funk-Adcock D, et al. Performance of coagulation tests in patients on therapeutic doses of dabigatran: a cross-sectional pharmacodynamic study based on peak and trough plasma levels. J Thromb Haemost 2013; 11:1493–1502.
- Barrett YC, Wang Z, Frost C, Shenker A. Clinical laboratory measurement of direct factor Xa inhibitors: anti-Xa assay is preferable to prothrombin time assay. Thromb Haemost 2010; 104:1263–1271.
- Smythe MA, Fanikos J, Gulseth MP, et al. Rivaroxaban: practical considerations for ensuring safety and efficacy. Pharmacotherapy 2013; 33:1223–1245.
- Van Ryn J, Litzenburger T, Waterman A, et al. Dabigatran anticoagulant activity is neutralized by an antibody selective to dabigatran in in vitro and in vivo models. J Am Coll Cardiol 2011; 57:E1130.
- Sheffield W, Lambourne M, Bhakta V, Eltringham-Smith L, Arnold D, Crowther M. Active site-mutated thrombin S195A but not active site-blocked thrombin counteracts the anticoagulant activity of dabigatran in plasma. Abstract presented at the International Society of Thrombosis and Haemostasis 2013 Congress. http://onlinelibrary.wiley.com/doi/10.1111/jth.2013.11.issue-s2/issuetoc. Accessed August 6, 2014.
- Lu G, Luan P, Hollenbach SJ, et al. Reconstructed recombinant factor Xa as an antidote to reverse anticoagulation by factor Xa inhibitors (abstract). J Thromb Haemost 2009; 7(suppl 2):abstract OC-TH-107.
- Stangier J, Rathgen K, Stähle H, Mazur D. Influence of renal impairment on the pharmacokinetics and pharmacodynamics of oral dabigatran etexilate: an open-label, parallel-group, single-centre study. Clin Pharmacokinet 2010; 49:259–268.
- Singh T, Maw TT, Henry BL, et al. Extracorporeal therapy for dabigatran removal in the treatment of acute bleeding: a single center experience. Clin J Am Soc Nephrol 2013; 8:1533–1539.
- Kaatz S, Crowther M. Reversal of target-specific oral anticoagulants. J Thromb Thrombolysis 2013; 36:195–202.
- Eerenberg ES, Kamphuisen PW, Sijpkens MK, Meijers JC, Buller HR, Levi M. Reversal of rivaroxaban and dabigatran by prothrombin complex concentrate: a randomized, placebo-controlled, crossover study in healthy subjects. Circulation 2011; 124:1573–1579.
- Sarode R, Milling TJ, Refaai MA, et al. Efficacy and safety of a 4-factor prothrombin complex concentrate in patients on vitamin K antagonists presenting with major bleeding: a randomized, plasma-controlled, phase IIIb study. Circulation 2013; 128:1234–1243.
More then 2.5 million patients in the United States are on long-term anticoagulation therapy for atrial fibrillation, venous thromboembolic disease, or mechanical heart valves,1 and the number is expected to rise as the population ages. Each year, about 10% of these patients undergo an invasive procedure or surgery that requires temporary interruption of anticoagulation.2
Most physicians are familiar with the perioperative management of warfarin, a vitamin K antagonist, since for decades it has been the sole oral anticoagulant available. However, many physicians lack experience with the three target-specific oral anticoagulants (TSOACs; also known as “novel” oral anticoagulants) approved so far: the direct thrombin inhibitor dabigatran (Pradaxa) and the direct factor Xa inhibitors rivaroxaban (Xarelto) and apixaban (Eliquis).
With their rapid onset of action, predictable pharmacokinetics, relatively short half-lives, and fewer drug-drug interactions than warfarin, TSOACs overcome many of the limitations of the older oral anticoagulant warfarin. In many ways, these qualities simplify the perioperative management of anticoagulation. At the same time, these new drugs also bring new challenges: caution is needed in patients with renal impairment; the level of anticoagulation is difficult to assess; and there is no specific antidote or standardized procedure to reverse their anticoagulant effect. While various periprocedural protocols for TSOAC therapy have been proposed, evidence-based guidelines are still to come.
This article first discusses the pharmacology of dabigatran, rivaroxaban, and apixaban that is pertinent to the perioperative period. It then briefly reviews the general principles of perioperative management of anticoagulation. The final section provides specific recommendations for the perioperative management of TSOACs.
PHARMACOLOGY OF TARGET-SPECIFIC ORAL ANTICOAGULANTS
Dabigatran, a factor IIa inhibitor
Dabigatran is an oral direct thrombin (factor IIa) inhibitor. It exerts its anticoagulant effect by blocking the generation of fibrin, inhibiting platelet aggregation, and dampening the activity of factors V, VIII, and XI (Figure 1).3,4 From its introduction in October 2010 through August 2012, nearly 3.7 million prescriptions were dispensed to 725,000 patients in the United States.5
Indications for dabigatran. Dabigatran is approved in the United States and Canada for preventing stroke in nonvalvular atrial fibrillation (Table 1).6 More recently, it received US approval for treating deep vein thrombosis or pulmonary embolism after 5 to 10 days of a parenteral anticoagulant.7,8 It is also approved in Europe and Canada for preventing venous thromboembolism (VTE) after total hip replacement and knee arthroplasty.9,10
Dabigatran is contraindicated in patients with a mechanical heart valve, based on a phase 2 study in which it conferred a higher risk of thromboembolism and bleeding than warfarin.3,11
Pharmacokinetics of dabigatran. Dabigatran is formulated as a prodrug, dabigatran etexilate, in a capsule containing multiple small pellets.12 The capsules should not be crushed, as this significantly increases oral bioavailability. The prodrug is absorbed across the gastric mucosa and is then rapidly converted to the active form (Table 2).
Plasma concentrations peak within 2 hours of ingestion, which means that therapeutic anticoagulation is achieved shortly after taking the drug.
Only 35% of dabigatran is protein-bound, which allows it to be removed by hemodialysis. Nearly 85% of the drug is eliminated in the urine. It has a half-life of 13 to 15 hours in patients with normal renal function.3 However, its half-life increases to about 27 hours in patients whose creatinine clearance is less than 30 mL/min. As a result, the dose must be reduced in patients with renal impairment (Table 1).
Dabigatran is not metabolized by the cytochrome P450 enzymes, but it is a substrate for P-glycoprotein, so it still has the potential for drug-drug interactions.3 Practitioners should be familiar with these potential interactions (Table 3), as they can result in higher- or lower-than-expected plasma concentrations of dabigatran in the perioperative period.13
Rivaroxaban, a factor Xa inhibitor
Rivaroxaban is an oral direct factor Xa inhibitor. It has been approved by the US Food and Drug Administration (FDA) for the prevention of stroke in nonvalvular atrial fibrillation, for VTE treatment, and for VTE prophylaxis after hip replacement or knee replacement (Table 1).14–20 It has not yet been studied in patients with hip fracture.
Pharmacokinetics of rivaroxaban. Rivaroxaban is manufactured as a tablet that is best absorbed in the stomach (Table 2).14 In contrast to dabigatran, it can be crushed and, for example, mixed with applesauce for patients who have trouble swallowing. It can also be mixed with water and given via nasogastric tube; however, postpyloric administration should be avoided.
Plasma concentrations peak within a few hours after ingestion. Rivaroxaban is highly protein-bound, so it cannot be eliminated by hemodialysis.
The drug relies on renal elimination to a smaller degree than dabigatran, with one-third of the dose eliminated unchanged in the urine, one-third eliminated in the urine as inactive metabolite, and the remaining one-third eliminated in the feces. However, enough parent compound is cleared through the kidneys that the half-life of rivaroxaban increases from 8.3 hours in healthy individuals to 9.5 hours in patients whose creatinine clearance is less than 30 mL/min.21 As with dabigatran, the dose must be adjusted for renal impairment (Table 1).
Rivaroxaban has significant liver metabolism, specifically through the cytochrome P450 3A4 enzyme, and it is also a substrate of P-glycoprotein. Therefore, potential drug-drug interactions must be taken into account, as they may lead to important alterations in plasma concentrations (Table 3).
Apixaban, a factor Xa inhibitor
Apixaban is also an oral direct factor Xa inhibitor. It is the newest of the oral anticoagulants to be approved in the United States, specifically for preventing stroke in nonvalvular atrial fibrillation (Table 1).22
Pharmacokinetics of apixaban. Apixaban is produced as a tablet that is absorbed slowly through the gastrointestinal tract, mainly the distal small bowel and ascending colon (Table 2).23
Peak plasma concentrations are reached a few hours after ingestion. Like rivaroxaban, apixaban is highly protein-bound, so it cannot be removed by hemodialysis.
Apixaban is similar to rivaroxaban in that 27% of the parent compound is cleared through the kidneys, it undergoes significant hepatic metabolism through cytochrome P450 3A4, and it is a substrate for P-glycoprotein.
Drug-drug interactions must be considered as a potential source of altered drug exposure and clearance (Table 3).
Unlike dabigatran and rivaroxaban, dose reduction is not based on the calculated creatinine clearance. Instead, a reduced dose is required if the patient meets two of the following three criteria:
- Serum creatinine level ≥ 1.5 mg/dL
- Age ≥ 80
- Weight ≤ 60 kg (Table 1).
The American Heart Association/American Stroke Association guidelines further recommend against using apixaban in patients with a creatinine clearance less than 25 mL/min.24
Edoxaban, a factor Xa inhibitor in development
Edoxaban (Savaysa), another factor Xa inhibitor, is available in Japan and has been submitted for approval in the United States for treating VTE and for preventing stroke in patients with
PERIOPERATIVE CONSIDERATIONS IN ANTICOAGULATION
Before addressing the perioperative management of TSOACs, let us review the evidence guiding the perioperative management of any chronic anticoagulant.
In fact, no large prospective randomized trial has clearly defined the risks and benefits of using or withholding a bridging anticoagulation strategy around surgery and other procedures, though the PERIOP 2 and BRIDGE trials are currently ongoing.25,26 There are some data regarding continuing anticoagulation without interruption, but they have mainly been derived from specific groups (eg, patients on warfarin undergoing cardiac pacemaker or defibrillator placement) and in procedures that pose a very low risk of bleeding complications (eg, minor dental extractions, cataract surgery, dermatologic procedures).2,27 Recommendations are, therefore, necessarily based on small perioperative trials and data gleaned from cohort review and from studies that did not involve surgical patients.
Ultimately, the decisions whether to discontinue oral anticoagulants and whether to employ bridging anticoagulation are based on assumptions about the risks of bleeding and the risk of thrombotic events, with similar assumptions regarding the effects of anticoagulants on both outcomes. In addition, the relative acceptance of bleeding vs thrombotic risks implicitly guides these complex decisions.
Perioperative bleeding risk
Many risk factors specific to the patient and to the type of surgery affect the rates and severity of perioperative bleeding.28
As for patient-specific risk factors, a small retrospective cohort analysis revealed that a HAS-BLED score of 3 or higher was highly discriminating in predicting perioperative bleeding in atrial fibrillation patients receiving anticoagulation.29 (The HAS-BLED score is based on hypertension, abnormal renal or liver function, stroke, bleeding, labile international normalized ratio [INR], elderly [age > 65] and drug therapy.30) However, there are no widely validated tools that incorporate patient-specific factors to accurately predict bleeding risk in an individual patient.
Therefore, the American College of Chest Physicians (ACCP) guidelines suggest coarsely categorizing bleeding risk as either low or high solely on the basis of the type of procedure.2 Procedures considered “high-risk” have a risk greater than 1.5% to 2% and include urologic surgery involving the prostate or kidney, colonic polyp resections, surgeries involving highly vascular organs such as the liver or spleen, joint replacements, cancer surgeries, and cardiac or neurosurgical procedures.
Perioperative thrombotic risk
The ACCP guidelines2 place patients with atrial fibrillation, VTE, or mechanical heart valves in three risk groups for perioperative thromboembolism without anticoagulation, based on their annual risk of a thrombotic event:
- High risk—annual risk of a thrombotic event > 10%
- Moderate risk—5% to 10%
- Low risk—< 5%.
Comparing the risks calculated by these methods with the real-world risk of perioperative thrombosis highlights the problem of applying nonperioperative risk calculations: the perioperative period exposes patients to a higher risk than these models would predict.31 Nonetheless, these risk categorizations likely have some validity in stratifying patients into risk groups, even if the absolute risks are inaccurate.
Perioperative bridging for patients taking warfarin
Many patients with atrial fibrillation, VTE, or a mechanical heart valve need to interrupt their warfarin therapy because of the bleeding risk of an upcoming procedure.
The perioperative management of warfarin and other vitamin K antagonists is challenging because of the pharmacokinetics and pharmacodynamics of these drugs. Because it has a long half-life, warfarin usually must be stopped 4 to 5 days before a procedure in order to allow not only adequate clearance of the drug itself, but also restoration of functional clotting factors to normal or near-normal levels.12 Warfarin can generally be resumed 12 to 24 hours after surgery, assuming adequate hemostasis has been achieved, and it will again take several days for the INR to reach the therapeutic range.
The ACCP guidelines recommend using the perioperative risk of thromboembolism to make decisions about the need for bridging anticoagulation during warfarin interruption.2 They suggest that patients at high risk of thrombosis receive bridging with an alternative anticoagulant such as low-molecular-weight heparin or unfractionated heparin, because of the prolonged duration of subtherapeutic anticoagulation.
There has been clinical interest in using a TSOAC instead of low-molecular-weight or unfractionated heparin for bridging in the perioperative setting. Although this approach may be attractive from a cost and convenience perspective, it cannot be endorsed as yet because of the lack of information on the pros and cons of such an approach.
Patients at low thrombotic risk do not require bridging. In patients at moderate risk, the decision to bridge or not to bridge is based on careful consideration of patient-specific and surgery-specific factors.
PERIOPERATIVE MANAGEMENT OF TARGET-SPECIFIC ORAL ANTICOAGULANTS
As summarized above, the perioperative management strategy for chronic anticoagulation is based on limited evidence, even for drugs as well established as warfarin.
The most recent ACCP guidelines on the perioperative management of antithrombotic therapy do not mention TSOACs.2 For now, the management strategy must be based on the pharmacokinetics of the drugs, package inserts from the manufacturers, and expert recommendations.3,14,23,32–34 Fortunately, because TSOACs have a more favorable pharmacokinetic profile than that of warfarin, their perioperative uses should be more streamlined. As always, the goal is to minimize the risk of both periprocedural bleeding and thromboembolism.
Timing of cessation of anticoagulation
The timing of cessation of TSOACs before an elective procedure depends primarily on two factors: the bleeding risk of the procedure and the patient’s renal function. Complete clearance of the medication is not necessary in all circumstances.
TSOACs should be stopped four to five half-lives before a procedure with a high bleeding risk, so that there is no or only minimal residual anticoagulant effect. The drug can be stopped two to three half-lives before a procedure with a low bleeding risk. Remember: the half-life increases as creatinine clearance decreases.
Specific recommendations may vary across institutions, but a suggested strategy is shown in Table 4.3,4,21,23,32–35 For the small subset of patients on P-glycoprotein or cytochrome P450 inhibitors or inducers, further adjustment in the time of discontinuation may be required.
Therapy does not need to be interrupted for procedures with a very low bleeding risk, as defined above.33,34 There is also preliminary evidence that TSOACs, similar to warfarin, may be continued during cardiac pacemaker or defibrillator placement.36
Evidence from clinical trials of perioperative TSOAC management
While the above recommendations are logical, studies are needed to prospectively evaluate perioperative management strategies.
The RE-LY trial (Randomized Evaluation of Long-Term Anticoagulation Therapy), which compared the effects of dabigatran and warfarin in preventing stroke in patients with atrial fibrillation, is one of the few clinical trials that also looked at periprocedural bleeding.37 About a quarter of the RE-LY participants required interruption of anticoagulation for a procedure.
Warfarin was managed according to local practices. For most of the study, the protocol required that dabigatran be discontinued 24 hours before a procedure, regardless of renal function or procedure type. The protocol was later amended and closely mirrored the management plan outlined in Table 4.
With either protocol, there was no statistically significant difference between dabigatran and warfarin in the rates of bleeding and thrombotic complications in the 7 days before or 30 days after the procedure.
A major limitation of the study was that most patients underwent a procedure with a low bleeding risk, so the analysis was likely underpowered to evaluate rates of bleeding in higher-risk procedures.
The ROCKET-AF trial (Rivaroxaban Once-daily Oral Direct Factor Xa Inhibition Compared With Vitamin K Antagonism for Prevention of Stroke and Embolism Trial in Atrial Fibrillation) also shed light on periprocedural bleeding.15 About 15% of the participants required temporary interruption of anticoagulation for a surgical or invasive procedure.38
The study protocol called for discontinuing rivaroxaban 2 days before any procedure. Warfarin was to be held for 4 days to achieve a goal INR of 1.5 or less.15
Rates of major and nonmajor clinically significant bleeding at 30 days were similar with rivaroxaban and with warfarin.38 As with the RE-LY trial, the retrospective analysis was probably underpowered for assessing rates of bleeding in procedures with higher risk.
Perioperative bridging
While stopping a TSOAC in the perioperative period decreases the risk of bleeding, it naturally increases the risk of thromboembolism. However, patients on TSOACs should not routinely require perioperative bridging with an alternative anticoagulant, regardless of thrombotic risk.
Of note, dabigatran, rivaroxaban, and apixaban carry black-box warnings that discontinuation places patients at higher risk of thrombotic events.3,14,23 These warnings further state that coverage with an alternative anticoagulant should be strongly considered during interruption of therapy for reasons other than pathologic bleeding.
However, it does not necessarily follow that perioperative bridging is required. For example, the warning for rivaroxaban is based on the finding in the ROCKET-AF trial that patients in the rivaroxaban group had higher rates of stroke than those in the warfarin group after the study drugs were stopped at the end of the trial.39 While there was initial concern that this could represent a prothrombotic rebound effect, the authors subsequently showed that patients in the rivaroxaban group were more likely to have had a subtherapeutic INR when transitioning to open-label vitamin-K-antagonist therapy.39,40 There was no difference in the rate of stroke or systemic embolism between the rivaroxaban and warfarin groups when anticoagulation was temporarily interrupted for a procedure.38
The risks and benefits of perioperative bridging with TSOACs are difficult to evaluate, given the dearth of trial data. In the RE-LY trial, only 17% of patients on dabigatran and 28% of patients on warfarin underwent periprocedural bridging.37 The selection criteria and protocol for bridging were not reported. In the ROCKET-AF trial, only 9% of patients received bridging therapy despite a mean CHADS2 score of 3.4.38 (The CHADS2 score is calculated as 1 point each for congestive heart failure, hypertension, age ≥ 75, and diabetes; 2 points for stroke or transient ischemic attack.) The decision to bridge or not was left to the individual investigator. As a result, the literature offers diverse opinions about the appropriateness of transitioning to an alternative anticoagulant.41–43
Bridging does not make sense in most instances, since anticoagulants such as low-molecular-weight heparin have pharmacokinetics similar to those of the available TSOACs and also depend on renal clearance.41 However, there may be situations in which patients must be switched to a parenteral anticoagulant such as unfractionated or low-molecular-weight heparin. For example, if a TSOAC has to be held, the patient has acute renal failure, and a needed procedure is still several days away, it would be reasonable to start a heparin drip for an inpatient at increased thrombotic risk.
In patients with normal renal function, these alternative anticoagulants should be started at the time the next TSOAC dose would have been due.3,14,23 In patients with reduced renal function, initiation of an alternative anticoagulant may need to be delayed 12 to 48 hours depending on which TSOAC is being used, as well as on the degree of renal dysfunction. This delay would help ensure that the onset of anticoagulation with the alternative anticoagulant is timed with the offset of therapeutic anticoagulation with the TSOAC.
Although limited, information from available coagulation assays may assist with the timing of initiation of an alternative anticoagulant (see the following section on laboratory monitoring). Serial testing with appropriate coagulation assays may help identify when most of a TSOAC has been cleared from a patient.
Laboratory monitoring
Inevitably, some patients on TSOACs require urgent or emergency surgery. In certain situations, such as before an orthopedic spine procedure, in which the complications of bleeding could be devastating, it may be necessary to know if any residual anticoagulant effect is present.
Monitoring dabigatran. As one might expect, direct thrombin inhibitors such as dabigatran can prolong the prothrombin time and activated partial thromboplastin time (aPTT).44–47 However, the prothrombin time is not recommended for assessing the level of anticoagulation from dabigatran. Many institutions may be using a normal aPTT to rule out therapeutic concentrations of dabigatran, based on results from early in vitro and ex vivo studies.46 While appealing from a practical standpoint, practitioners should exercise caution when relying on the aPTT to assess the risk of perioperative bleeding. A more recent investigation in patients treated with dabigatran found that up to 35% of patients with a normal aPTT still had a plasma concentration in the therapeutic range.48
The thrombin time and ecarin clotting time are more sensitive tests for dabigatran. A normal thrombin time or ecarin clotting time indicates that no or only minimal dabigatran is present.48 Unfortunately, these two tests often are either unavailable or are associated with long turnaround times, which limits their usefulness in the perioperative setting.
Monitoring rivaroxaban and apixaban. Factor Xa inhibitors such as rivaroxaban and apixaban can also influence the prothrombin time and aPTT (Figure 1).44–47,49,50 The aPTT is relatively insensitive to these drugs at low concentrations. It has been suggested that a normal prothrombin time can reasonably exclude therapeutic concentrations of rivaroxaban.45,46 However, the effects on the prothrombin time are highly variable, changing with the reagent used.49,50 In addition, apixaban appears to have less impact on the prothrombin time overall. The INR is not recommended for monitoring the effect of factor Xa inhibitors.
Anti-factor Xa assays likely represent the best option to provide true quantitative information on the level of anticoagulation with either rivaroxaban or apixaban. However, the assays must be specifically calibrated for each drug for results to be useful. (Anti-factor Xa assays cannot be used for heparin or low-molecular-weight heparin.) Further, most institutions do not yet have this capability. When appropriately calibrated, normal anti-factor Xa levels would exclude any effect of rivaroxaban or apixaban.
Reversal of anticoagulation
If patients on TSOACs require emergency surgery or present with significant bleeding in the setting of persistent anticoagulation, it may be necessary to try to reverse the anticoagulation.
Unlike warfarin or heparin, TSOACS do not have specific reversal agents, though specific antidotes are being developed. For example, researchers are evaluating antibodies capable of neutralizing dabigatran, as well as recombinant thrombin and factor Xa molecules that could antagonize dabigatran and rivaroxaban, respectively.51–53
Reversal can be attempted by neutralizing or removing the offending drug. Activated charcoal may be able to reduce absorption of TSOACs that were recently ingested,44 and dabigatran can be removed by hemodialysis.
However, certain practical considerations may limit the use of dialysis in the perioperative period. Insertion of a temporary dialysis line in an anticoagulated patient poses additional bleeding risks. A standard 4-hour hemodialysis session may remove only about 70% of dabigatran from the plasma, which may not be enough to prevent perioperative bleeding.54 Dabigatran also tends to redistribute from adipose tissue back into plasma after each dialysis session.55 Serial sessions of high-flux intermittent hemodialysis or continuous renal replacement therapy may therefore be needed to counteract rebound elevations in the dabigatran concentration.
Reversal can also be attempted through activation of the coagulation cascade via other mechanisms. Fresh-frozen plasma is unlikely to be a practical solution for reversal.44 Although it can readily replace the clotting factors depleted by vitamin K antagonists, large volumes of fresh-frozen plasma would be needed to overwhelm thrombin or factor Xa inhibition by TSOACs.
There are limited data on the use of prothrombin complex concentrates or recombinant activated factor VIIa in patients on TSOACs, though their use can be considered.56 In a trial in 12 healthy participants, a nonactivated four-factor prothrombin complex concentrate containing factors II, VII, IX, and X immediately and completely reversed the anticoagulant effect of rivaroxaban but had no effect on dabigatran.57 Before 2013, there were no nonactivated four-factor prothrombin complex concentrates available in the United States. The FDA has since approved Kcentra for the urgent reversal of vitamin K antagonists, meaning that the reversal of TSOACs in major bleeding events would still be off-label.58 Giving any of the clotting factors carries a risk of thromboembolism.
Resumption of anticoagulation
TSOACs have a rapid onset of action, and therapeutic levels are reached within a few hours of administration.
Extrapolating from the ACCP guidelines, TSOACs can generally be restarted at therapeutic doses 24 hours after low-bleeding-risk procedures.2 Therapeutic dosing should be delayed 48 to 72 hours after a procedure with a high bleeding risk, assuming adequate hemostasis has been achieved. Prophylactic unfractionated heparin or low-molecular-weight heparin therapy can be given in the interim if deemed safe. Alternatively, for orthopedic patients ultimately transitioning back to therapeutic rivaroxaban after hip or knee arthroplasty, prophylactic rivaroxaban doses can be started 6 to 10 hours after surgery.14
There are numerous reasons why the resumption of TSOACs may have to be delayed after surgery, including nothing-by-mouth status, postoperative nausea and vomiting, ileus, gastric or bowel resection, and the anticipated need for future procedures. Since dabigatran capsules cannot be crushed, they cannot be given via nasogastric tube in patients with postoperative dysphagia. Parenteral anticoagulants should be used until these issues resolve.
Unfractionated heparin is still the preferred anticoagulant in unstable or potentially unstable patients, given its ease of monitoring, quick offset of action, and reversibility. When patients have stabilized, TSOACs can be resumed when the next dose of low-molecular-weight heparin would have been due or when the unfractionated heparin drip is discontinued.3,14,23
UNTIL EVIDENCE-BASED GUIDELINES ARE DEVELOPED
The development of TSOACs has ushered in an exciting new era for anticoagulant therapy. Providers involved in perioperative medicine will increasingly encounter patients on dabigatran, rivaroxaban, and apixaban. However, until evidence-based guidelines are developed for these new anticoagulants, clinicians will have to apply their knowledge of pharmacology and critically evaluate expert recommendations in order to manage patients safely throughout the perioperative period.
- Douketis JD, Berger PB, Dunn AS, et al; American College of Chest Physicians. The perioperative management of antithrombotic therapy: American College of Chest Physicians Evidence-Based Clinical Practice Guidelines (8th Edition). Chest 2008; 133(suppl 6):299S–339S.
- Douketis JD, Spyropoulos AC, Spencer FA, et al; American College of Chest Physicians. Perioperative management of antithrombotic therapy: Antithrombotic Therapy and Prevention of Thrombosis, 9th ed: American College of Chest Physicians Evidence-Based Clinical Practice Guidelines. Chest 2012; 141(suppl 2):e326S–e350S.
- Boehringer Ingelheim Pharmaceuticals, Inc. PRADAXA (dabigatran) package insert. http://bidocs.boehringer-ingelheim.com/BIWebAc-cess/ViewServlet.ser?docBase=renetnt&folderPath=/Prescribing%20Information/PIs/Pradaxa/Pradaxa.pdf. Accessed August 6, 2014.
- Levy JH, Faraoni D, Spring JL, Douketis JD, Samama CM. Managing new oral anticoagulants in the perioperative and intensive care unit setting. Anesthesiology 2013; 118:1466–1474.
- US Food and Drug Administration (FDA). FDA drug safety communication: update on the risk for serious bleeding events with the anticoagulant Pradaxa (dabigatran). www.fda.gov/drugs/drugsafety/ucm326580.htm. Accessed August 6, 2014.
- Connolly SJ, Ezekowitz MD, Yusuf S, et al; RE-LY Steering Committee and Investigators. Dabigatran versus warfarin in patients with atrial fibrillation. N Engl J Med 2009; 361:1139–1151.
- Schulman S, Kearon C, Kakkar AK, et al; RE-COVER Study Group. Dabigatran versus warfarin in the treatment of acute venous thromboembolism. N Engl J Med 2009; 361:2342–2352.
- Schulman S, Kearon C, Kakkar AK, et al; RE-MEDY Trial Investigators. Extended use of dabigatran, warfarin, or placebo in venous thromboembolism. N Engl J Med 2013; 368:709–718.
- Eriksson BI, Dahl OE, Rosencher N, Büller HR, et al; RE-NOVATE Study Group. Dabigatran etexilate versus enoxaparin for prevention of venous thromboembolism after total hip replacement: a randomised, double-blind, non-inferiority trial. Lancet 2007; 370:949–956.
- Eriksson BI, Dahl OE, Rosencher N, et al; RE-MODEL Study Group. Oral dabigatran etexilate vs subcutaneous enoxaparin for the prevention of venous thromboembolism after total knee replacement: the RE-MODEL randomized trial. J Thromb Haemost 2007; 5:2178–2185.
- Eikelboom JW, Connolly SJ, Brueckmann M, et al; RE-ALIGN Investigators. Dabigatran versus warfarin in patients with mechanical heart valves. N Engl J Med 2013; 369:1206–1214.
- Ageno W, Gallus AS, Wittkowsky A, Crowther M, Hylek EM, Palareti G; American College of Chest Physicians. Oral anticoagulant therapy: Antithrombotic Therapy and Prevention of Thrombosis, 9th ed: American College of Chest Physicians Evidence-Based Clinical Practice Guidelines. Chest 2012; 141(suppl 2):e44S–e88S.
- Blech S, Ebner T, Ludwig-Schwellinger E, Stangier J, Roth W. The metabolism and disposition of the oral direct thrombin inhibitor, dabigatran, in humans. Drug Metab Dispos 2008; 36:386–399.
- Janssen Pharmaceuticals, Inc. XARELTO (rivaroxaban) package insert. www.xareltohcp.com/about-xarelto/about-xarelto.html?utm_source=google&utm_medium=cpc&utm_campaign=Branded+-+Broad&utm_term=xarelto%20rivaroxaban&utm_content=Xarelto+Rivaroxaban|mkwid|sxSDxPb4m_dc|pcrid|34667840494. Accessed August 6, 2014.
- Patel MR, Mahaffey KW, Garg J, et al; ROCKET AF Investigators. Rivaroxaban versus warfarin in nonvalvular atrial fibrillation. N Engl J Med 2011; 365:883–391.
- EINSTEIN Investigators; Bauersachs R, Berkowitz SD, Brenner B, et al. Oral rivaroxaban for symptomatic venous thromboembolism. N Engl J Med 2010; 363:2499–2510.
- EINSTEIN–PE Investigators; Büller HR, Prins MH, Lensin AW, et al. Oral rivaroxaban for the treatment of symptomatic pulmonary embolism. N Engl J Med 2012; 366:1287–1297.
- Eriksson BI, Borris LC, Friedman RJ, et al; RECORD1 Study Group. Rivaroxaban versus enoxaparin for thromboprophylaxis after hip arthroplasty. N Engl J Med 2008; 358:2765–2775.
- Kakkar AK, Brenner B, Dahl OE, et al; RECORD2 Investigators. Extended duration rivaroxaban versus short-term enoxaparin for the prevention of venous thromboembolism after total hip arthroplasty: a double-blind, randomised controlled trial. Lancet 2008; 372:31–39.
- Lassen MR, Ageno W, Borris LC, et al; RECORD3 Investigators. Rivaroxaban versus enoxaparin for thromboprophylaxis after total knee arthroplasty. N Engl J Med 2008; 358:2776–2786.
- Kubitza D, Becka M, Mueck W, et al. Effects of renal impairment on the pharmacokinetics, pharmacodynamics and safety of rivaroxaban, an oral, direct factor Xa inhibitor. Br J Clin Pharmacol 2010; 70:703–712.
- Granger CB, Alexander JH, McMurray JJ, et al; ARISTOTLE Committees and Investigators. Apixaban versus warfarin in patients with atrial fibrillation. N Engl J Med 2011; 365:981–992.
- Bristol-Myers Squibb Company. ELIQUIS (apixaban) package insert. www.eliquis.com/index.aspx. Accessed August 6, 2014.
- Furie KL, Goldstein LB, Albers GW, et al; American Heart Association Stroke Council. Oral antithrombotic agents for the prevention of stroke in nonvalvular atrial fibrillation: a science advisory for healthcare professionals from the American Heart Association/American Stroke Association. Stroke 2012; 43:3442–3453.
- ClinicalTrials.gov, US National Institutes of Health. PERIOP 2 - A Safety and Effectiveness Study of LMWH Bridging Therapy Versus Placebo Bridging Therapy for Patients on Long Term Warfarin and Require Temporary Interruption of Their Warfarin. http://clinicaltri-als.gov/show/NCT00432796. Accessed August 6, 2014.
- ClinicalTrials.gov, US National Institutes of Health. Effectiveness of Bridging Anticoagulation for Surgery (The BRIDGE Study). http://clinicaltrials.gov/ct2/show/NCT00786474. Accessed August 6, 2014.
- Birnie DH, Healey JS, Wells GA, et al; BRUISE CONTROL Investigators. Pacemaker or defibrillator surgery without interruption of anticoagulation. N Engl J Med 2013; 368:2084–2093.
- Oberweis BS, Nukala S, Rosenberg A, et al. Thrombotic and bleeding complications after orthopedic surgery. Am Heart J 2013; 165:427.e1–433.e1.
- Omran H, Bauersachs R, Rübenacker S, Goss F, Hammerstingl C. The HAS-BLED score predicts bleedings during bridging of chronic oral anticoagulation. Results from the national multicentre BNK Online bRiDging REgistRy (BORDER). Thromb Haemost 2012; 108:65–73.
- Pisters R, Lane DA, Nieuwlaaat R, de Vos CB, Crijns HJGM, Lip GYH. A novel user-friendly score (HAS-BLED) to assess 1-year risk of major bleeding in patients with atrial fibrillation. The Euro Heart Survey. Chest 2010; 138:1093–1100.
- Kaatz S, Douketis JD, Zhou H, Gage BF, White RH. Risk of stroke after surgery in patients with and without chronic atrial fibrillation. J Thromb Haemost 2010; 8:884–890.
- van Ryn J, Stangier J, Haertter S, et al. Dabigatran etexilate—a novel, reversible, oral direct thrombin inhibitor: interpretation of coagulation assays and reversal of anticoagulant activity. Thromb Haemost 2010; 103:1116–1127.
- Connolly G, Spyropoulos AC. Practical issues, limitations, and periprocedural management of the NOAC’s. J Thromb Thrombolysis 2013; 36:212–222.
- Spyropoulos AC, Douketis JD. How I treat anticoagulated patients undergoing an elective procedure or surgery. Blood 2012; 120:2954–2962.
- Kaatz S, Kouides PA, Garcia DA, et al. Guidance on the emergent reversal of oral thrombin and factor Xa inhibitors. Am J Hematol 2012; 87(suppl 1):S141–S145.
- Rowley CP, Bernard ML, Brabham WW, et al. Safety of continuous anticoagulation with dabigatran during implantation of cardiac rhythm devices. Am J Cardiol 2013; 111:1165–1168.
- Healey JS, Eikelboom J, Douketis J, et al; RE-LY Investigators. Periprocedural bleeding and thromboembolic events with dabigatran compared with warfarin: results from the Randomized Evaluation of Long-Term Anticoagulation Therapy (RE-LY) randomized trial. Circulation 2012; 126:343–348.
- Sherwood MW, Douketis JD, Patel MR, et al; on behalf of the ROCKET AF Investigators. Outcomes of temporary interruption of rivaroxaban compared with warfarin in patients with nonvalvular atrial fibrillation: results from the Rivaroxaban Once Daily, Oral, Direct Factor Xa Inhibition Compared with Vitamin K Antagonism for Prevention of Stroke and Embolism Trial in Atrial Fibrillation (ROCKET AF). Circulation 2014; 129:1850–1859.
- Patel MR, Hellkamp AS, Lokhnygina Y, et al. Outcomes of discontinuing rivaroxaban compared with warfarin in patients with nonvalvular atrial fibrillation: analysis from the ROCKET AF trial (Rivaroxaban Once-Daily, Oral, Direct Factor Xa Inhibition Compared With Vitamin K Antagonism for Prevention of Stroke and Embolism Trial in Atrial Fibrillation). J Am Coll Cardiol 2013; 61:651–658.
- Reynolds MR. Discontinuation of rivaroxaban: filling in the gaps. J Am Coll Cardiol 2013; 61:659–660.
- Turpie AG, Kreutz R, Llau J, Norrving B, Haas S. Management consensus guidance for the use of rivaroxaban—an oral, direct factor Xa inhibitor. Thromb Haemost 2012; 108:876–886.
- Gallego P, Apostolakis S, Lip GY. Bridging evidence-based practice and practice-based evidence in periprocedural anticoagulation. Circulation 2012; 126:1573–1576.
- Sié P, Samama CM, Godier A, et al; Working Group on Perioperative Haemostasis. Surgery and invasive procedures in patients on long-term treatment with direct oral anticoagulants: thrombin or factor-Xa inhibitors. Recommendations of the Working Group on Perioperative Haemostasis and the French Study Group on Thrombosis and Haemostasis. Arch Cardiovasc Dis 2011; 104:669–676.
- King CS, Holley AB, Moores LK. Moving toward a more ideal anticoagulant: the oral direct thrombin and factor Xa inhibitors. Chest 2013; 143:1106–1116.
- Baglin T, Hillarp A, Tripodi A, Elalamy I, Buller H, Ageno W. Measuring oral direct inhibitors (ODIs) of thrombin and factor Xa: a recommendation from the Subcommittee on Control of Anticoagulation of the Scientific and Standardisation Committee of the International Society on Thrombosis and Haemostasis. J Thromb Haemost 2013; 11:756–760.
- Baglin T, Keeling D, Kitchen S; British Committee for Standards in Haematology. Effects on routine coagulation screens and assessment of anticoagulant intensity in patients taking oral dabigatran or rivaroxaban: guidance from the British Committee for Standards in Haematology. Br J Haematol 2012; 159:427–429.
- Mani H, Kasper A, Lindhoff-Last E. Measuring the anticoagulant effects of target specific oral anticoagulants—reasons, methods and current limitations. J Thromb Thrombolysis 2013; 36:187–194.
- Hawes EM, Deal AM, Funk-Adcock D, et al. Performance of coagulation tests in patients on therapeutic doses of dabigatran: a cross-sectional pharmacodynamic study based on peak and trough plasma levels. J Thromb Haemost 2013; 11:1493–1502.
- Barrett YC, Wang Z, Frost C, Shenker A. Clinical laboratory measurement of direct factor Xa inhibitors: anti-Xa assay is preferable to prothrombin time assay. Thromb Haemost 2010; 104:1263–1271.
- Smythe MA, Fanikos J, Gulseth MP, et al. Rivaroxaban: practical considerations for ensuring safety and efficacy. Pharmacotherapy 2013; 33:1223–1245.
- Van Ryn J, Litzenburger T, Waterman A, et al. Dabigatran anticoagulant activity is neutralized by an antibody selective to dabigatran in in vitro and in vivo models. J Am Coll Cardiol 2011; 57:E1130.
- Sheffield W, Lambourne M, Bhakta V, Eltringham-Smith L, Arnold D, Crowther M. Active site-mutated thrombin S195A but not active site-blocked thrombin counteracts the anticoagulant activity of dabigatran in plasma. Abstract presented at the International Society of Thrombosis and Haemostasis 2013 Congress. http://onlinelibrary.wiley.com/doi/10.1111/jth.2013.11.issue-s2/issuetoc. Accessed August 6, 2014.
- Lu G, Luan P, Hollenbach SJ, et al. Reconstructed recombinant factor Xa as an antidote to reverse anticoagulation by factor Xa inhibitors (abstract). J Thromb Haemost 2009; 7(suppl 2):abstract OC-TH-107.
- Stangier J, Rathgen K, Stähle H, Mazur D. Influence of renal impairment on the pharmacokinetics and pharmacodynamics of oral dabigatran etexilate: an open-label, parallel-group, single-centre study. Clin Pharmacokinet 2010; 49:259–268.
- Singh T, Maw TT, Henry BL, et al. Extracorporeal therapy for dabigatran removal in the treatment of acute bleeding: a single center experience. Clin J Am Soc Nephrol 2013; 8:1533–1539.
- Kaatz S, Crowther M. Reversal of target-specific oral anticoagulants. J Thromb Thrombolysis 2013; 36:195–202.
- Eerenberg ES, Kamphuisen PW, Sijpkens MK, Meijers JC, Buller HR, Levi M. Reversal of rivaroxaban and dabigatran by prothrombin complex concentrate: a randomized, placebo-controlled, crossover study in healthy subjects. Circulation 2011; 124:1573–1579.
- Sarode R, Milling TJ, Refaai MA, et al. Efficacy and safety of a 4-factor prothrombin complex concentrate in patients on vitamin K antagonists presenting with major bleeding: a randomized, plasma-controlled, phase IIIb study. Circulation 2013; 128:1234–1243.
KEY POINTS
- How long before surgery to stop a TSOAC depends on the bleeding risk of the procedure and the patient’s renal function.
- Perioperative bridging is generally unnecessary for patients on TSOACs.
- Routine coagulation assays such as the prothrombin time and activated partial thromboplastin time do not reliably reflect the degree of anticoagulation with TSOACs.
- There are no specific antidotes or standardized reversal strategies for TSOACs.
- TSOACs have a rapid onset of action and should only be restarted postoperatively once hemostasis has been confirmed.
A summary of the new ACOG report on neonatal brachial plexus palsy. Part 2: Pathophysiology and causation
Obstetricians are often blamed for causing neonatal brachial plexus palsy (NBPP). For that reason, understanding the true pathophysiology and causation of this birth-related entity is of extreme importance.
In Part 1 of this two-part series, I summarized findings from the new report on NBPP from the American College of Obstetricians and Gynecologists (ACOG), focusing on whether the phenomenon of shoulder dystocia and NBPP can be predicted or prevented.1 Here, in Part 2, I focus on ACOG’s conclusions concerning pathophysiology and causation of NBPP, as well as the College’s recommendations for applying that knowledge to practice.
Some infants are more susceptible than others to the forces of labor and delivery
Babies emerge from the uterus and maternal pelvis by a combination of uterine contractions and maternal pushing (endogenous forces) aided by the traction forces applied by the birth attendant (exogenous forces). Research over the past 2 decades has shown that endogenous forces play a significant—if not dominant—role in the causation of NBPP.
Stretching and potential injury to the brachial plexus occur when the long axis of the fetus is pushed down the birth canal while either the maternal symphysis pubis or sacral promontory catches and holds either the anterior or posterior shoulder of the fetus, respectively. This conjunction of events generates a stretching force on the tissues that connect the fetal trunk and head—the neck—under which lies the brachial plexus. The same anatomic relationships and labor forces also vigorously compress the fetal neck against the maternal symphysis pubis or sacral promontory and may cause compression injury. Any traction applied by the clinician accentuates these stretching and pressure forces acting on the nerves of the brachial plexus.
How the neonate responds to these forces depends on the tensile strength of its tissues, the metabolic condition of the fetus after a potentially long labor (as measured by acid-base status), the degree of protective muscle tone around the fetal shoulder and neck, and other fluctuating conditions. In other words, because of the many variables involved, some fetuses are more or less susceptible to injury than others.
Maternal forces alone can cause NBPP
The ACOG report1 makes an important statement:
Some plaintiff attorneys and their expert witnesses have tried to make the case that, although endogenous forces can cause temporary brachial plexus injuries, they cannot cause permanent brachial plexus injuries. However, as the ACOG report goes on to state:
The report acknowledges that the clinician can increase brachial plexus stretch by applying downward lateral traction to the neonate’s head during delivery efforts. However, contrary to claims often made by the plaintiff bar, in the presence of shoulder dystocia, even properly applied axial traction will necessarily increase the stretching of the brachial plexus. The report also notes that traction applied in the plane of the fetal cervicothoracic spine typically is along a vector estimated to be 25° to 45° below the horizontal plane of a woman in lithotomy position, not in an exact straight line with the maternal trunk. This degree of delivery force below the horizon is defined as normal “axial traction.”
Exogenous forces have yet to be definitively measured
Multiple attempts have been made to quantify the amount of force applied by clinicians in various delivery scenarios. However, in the published studies in which this force has been “measured,” the accuracy of the findings has not been validated. The three studies in which delivery force was directly measured in a clinical setting “provide a limited assessment of exogenous forces” and “do not address the angle at which forces were applied.”3–5 All other studies used artificial models.
As a result, few conclusions from such studies are directly applicable to the clinical arena. Moreover, in other studies using simulated birth scenarios, there was no feedback to participating clinicians as to whether the force they applied would have been sufficient to deliver the “fetus.” It was therefore difficult for participants in such studies to “determine how the situation corresponds with the force they would apply clinically.”1
Cadaver studies have been inadequate to assess the in situ response of the brachial plexus
Many plaintiff claims regarding the cause of brachial plexus injury use cadaver studies as evidence. However, most such studies were conducted between 98 and 140 years ago. In these older studies, quantitative evaluation was rare. And in the few more recent studies, there are several reasons why the data obtained are problematic:
- the nerves being studied were dissected free from supporting tissues
- nerve tissue deteriorates quickly postmortem
- some studies used adult tissues; there may be significant differences between adult and newborn nerve tissue that obscure comparison.
The ACOG report concludes the section on cadaver studies by stating:
Physical models also fall short
The problem with the use of physical models in evaluating NBPP centers on the need to find materials that have the same or similar properties as the tissues of interest. These sorts of bioengineering limitations generally do not allow for findings that have direct clinical applicability.
Of interest, however, is the finding of at least two groups of investigators that less traction is required when simulating delivery of a model infant when rotational maneuvers (Rubin’s) are employed rather than after McRoberts repositioning.
Computer models have yielded data on the relative effects of endogenous and exogenous forces
Sophisticated computer analysis has been used to investigate both endogenous and exogenous delivery forces. Results of such studies have shown that maternal endogenous forces exert twice as much pressure on the base of the fetal neck against the maternal symphysis pubis as do deliverer-induced exogenous forces.
Is there a threshold of force?
Data that include measurement of the force applied to the brachial plexus nerves of a live infant during a real delivery are almost nonexistent. One group—on the basis of a single case of transient NBPP and potentially flawed pressure measurements—has suggested that the threshold for NBPP in the human is 100 Newtons.3 However, other studies have shown that physician-applied forces in routine deliveries commonly exceed this hypothesized cutoff—yet the rate of NBPP remains low. In measuring delivery forces it must be remembered that significant variation exists between individual neonates, both in terms of mechanical properties and anatomy. Because of this variation—and the nonlinear behavior of nerve tissues—the specific force needed to cause a nerve injury or rupture in a given neonate has not been established.
Chapter 3 of the ACOG report closes with a statement:
NBPP and shoulder dystocia
Shoulder dystocia is defined as a delivery that requires additional obstetric maneuvers after gentle downward traction on the fetal head fails to deliver the fetal shoulders. The ACOG report makes the important point that shoulder dystocia is not formally diagnosed until a trial of downward axial traction has been unsuccessful in delivering the anterior shoulder. This point is a refutation of the frequent plaintiff claim that, once a shoulder dystocia is thought to be present, no traction whatsoever should be applied by the clinician at any time during the remainder of the delivery.
Shoulder dystocia incidence is rising
The reported incidence of shoulder dystocia has increased over the past several decades. It is unclear whether this increase is related to maternal obesity, fetal macrosomia, or more widespread reporting. However, paradoxes exist in the relationship among risk factors, shoulder dystocia, and brachial plexus injury:
- although there is an increased incidence of shoulder dystocia with increased birth weight, the mean birth weight of neonates with recognized shoulder dystocia is not significantly higher than the mean birth weight of all term infants
- strategies to reduce NBPP by preventing shoulder dystocia—including early induction of labor and prophylactic use of McRoberts maneuver and suprapubic pressure—have not been effective in reducing the incidence of NBPP.
The ACOG report makes the statement: “Maternal and fetal factors associated with shoulder dystocia do not allow for reliable prediction of persistent NBPP.”1
What is optimal management of shoulder dystocia?
The last obstetric part of the ACOG report takes as its focus the management of shoulder dystocia. It discusses the importance of communication among members of the delivery team and with the mother whose neonate is experiencing a shoulder dystocia. The report states:
This statement contrasts with claims frequently made by plaintiff medical expert witnesses that the woman experiencing a shoulder dystocia should absolutely cease from pushing.
In a section on team training, the report describes the delivery team’s priorities:
- resolving the shoulder dystocia
- avoiding neonatal hypoxic-ischemic central nervous system injury
- minimizing strain on the neonatal brachial plexus.
Studies evaluating process standardization, the use of checklists, teamwork training, crew resource management, and evidence-based medicine have shown that these tools improve neonatal and maternal outcomes.
Simulation training also has been shown to help reduce transient NBPP (see the box below for more on simulation programs for shoulder dystocia). Whether it also can lower the rate of permanent NBPP is unclear.1
Can simulation training reduce the rate of neonatal brachial plexus injury after shoulder dystocia?
In the new ACOG report on neonatal brachial plexus injury, simulation training is discussed as one solution to the dilemma of how clinicians can gain experience in managing obstetric events that occur infrequently.1 Simulation training also has the potential to improve teamwork, communication, and the situational awareness of the health-care team as a whole. Several studies over the past few years have shown that, in some units, the implementation of simulation training actually has decreased the number of cases of neonatal brachial plexus palsy (NBPP), compared with no simulation training.
For example, Draycott and colleagues explored the rate of neonatal injury associated with shoulder dystocia before and after implementation of a mandatory 1-day simulation training program at Southmead Hospital in Bristol, United Kingdom.2 The program consisted of practice on a shoulder dystocia training mannequin and covered risk factors, recognition of shoulder dystocia, maneuvers, and documentation. The training used a stepwise approach, beginning with a call for help and continuing through McRoberts’ positioning, suprapubic pressure, and internal maneuvers such as delivery of the posterior arm (Figure).

There were 15,908 births in the pretraining period and 13,117 in the posttraining period, with shoulder dystocia rates comparable between the two periods. Not only did clinical management of shoulder dystocia improve after training, but there was a significant reduction in neonatal injury at birth after shoulder dystocia (30 injuries of 324 shoulder dystocia cases [9.3%] before training vs six injuries of 262 shoulder dystocia cases [2.3%] afterward).2
In another study of obstetric brachial plexus injury before and after implementation of simulation training for shoulder dystocia, Inglis and colleagues found a decline in the rate of such injury from 30% to 10.67% (P<.01).3 Shoulder dystocia training remained associated with reduced obstetric brachial plexus injury after logistic-regression analysis.3
Shoulder dystocia training is now recommended by the Joint Commission on Accreditation of Healthcare Organizations in the United States. However, in its report, ACOG concludes—despite studies from Draycott and colleagues and others—that, owing to “limited data,” “there remains no evidence that introduction of simulation can reduce the frequency of persistent NBPP.”1
References
- American College of Obstetricians and Gynecologists. Executive summary: neonatal brachial plexus palsy. Report of the American College of Obstetricians and Gynecologists’ Task Force on neonatal brachial plexus palsy. Obstet Gynecol. 2014;123(4):902–904.
- Draycott TJ, Crofts FJ, Ash JP, et al. Improving neonatal outcome through practical shoulder dystocia training. Obstet Gynecol. 2008;112(1):14–20.
- Inglis SR, Feier N, Chetiyaar JB, et al. Effects of shoulder dystocia training on the incidence of brachial plexus palsy. Am J Obstet Gynecol. 2011;204(4):322.e1–e6.
Delivery of the posterior arm
The report reaffirms the previous statement from the ACOG practice bulletin on shoulder dystocia, which asserts that no specific sequence of maneuvers for resolving shoulder dystocia has been shown to be superior to any other.6 It does note, however, that recent studies seem to demonstrate a benefit when delivery of the posterior arm is prioritized over the usual first-line maneuvers of McRoberts positioning and the application of suprapubic pressure. If confirmed, such findings may alter the standard of care for shoulder dystocia resolution and result in a change in ACOG recommendations.
Documentation may be enhanced by use of a checklist
The ACOG report stresses the importance of accurate, contemporaneous documentation of the management of shoulder dystocia, observing that checklists and documentation reminders help ensure the completeness and relevance of notes after shoulder dystocia deliveries and NBPP. ACOG has produced such a checklist, which can be found in the appendix of the report itself.1
How long before central neurologic injury occurs?
Another issue covered in the report is how long a clinician has to resolve a shoulder dystocia before central neurologic damage occurs. Studies have shown that permanent neurologic injury can occur as soon as 2 minutes after shoulder impaction, although the risk of acidosis or severe hypoxic-ischemic encephalopathy remains low until impaction has lasted at least 5 minutes.
Other issues covered in the report
The last chapters of the ACOG report focus on orthopedic aspects of brachial plexus injury, including diagnosis, treatment, and prognosis.
The report concludes with a glossary and three appendices:
- Royal College of Obstetricians and Gynecologists Green Top Guidebook #42 on shoulder dystocia
- ACOG Practice Bulletin #40 on shoulder dystocia
- ACOG Patient Safety Checklist #6 on the documentation of shoulder dystocia.
Why the ACOG report is foundational
The ACOG report on NBPP is an important and much-needed document. It includes a comprehensive review of the literature on brachial plexus injury and shoulder dystocia, written by nationally recognized experts in the field. Most important, it makes definitive statements that counteract false and dubious claims often made by the plaintiff bar in brachial plexus injury cases and provides evidence to back those statements.
The report:
- disproves the claim that “excessive” physician traction is the only etiology of brachial plexus injuries
- demonstrates that no differentiation can be made between the etiology of permanent versus temporary brachial plexus injuries
- describes how brachial plexus injuries can occur in the absence of physician traction or even of shoulder dystocia
- provides a summary of scientific information about brachial plexus injuries that will benefit obstetric clinicians
- provides a wealth of literature documentation that will enable physician defendants to counteract many of the claims plaintiffs and their expert witnesses make in brachial plexus injury cases.
The report is—and will remain—a foundational document in obstetrics for many years to come.
Share your thoughts on this article! Send your Letter to the Editor to [email protected].
1. American College of Obstetricians and Gynecologists. Executive summary: neonatal brachial plexus palsy. Report of the American College of Obstetricians and Gynecologists’ Task Force on neonatal brachial plexus palsy. Obstet Gynecol. 2014;123(4):902–904.
2. Lerner HM, Salamon E. Permanent brachial plexus injury following vaginal delivery without physician traction or shoulder dystocia. Am J Obstet Gynecol. 2008;198(3):e.7–e.8.
3. Allen R, Sorab J, Gonik B. Risk factors for shoulder dystocia: an engineering study of clinician-applied forces. Obstet Gynecol. 1991;77(3):352–355.
4. Poggi SH, Allen RH, Patel CR, Ghidini A, Pezzullo JC, Spong CY. Randomized trial of McRoberts versus lithotomy positioning to decrease the force that is applied to the fetus during delivery. Am J Obstet Gynecol. 2004;191(3):874–878.
5. Poggi SH, Allen RH, Patel C, et al. Effect of epidural anaesthesia on clinician-applied force during vaginal delivery. Am J Obstet Gynecol. 2004;191(3):903–906.
6. American College of Obstetricians and Gynecologists. Practice bulletin #40: shoulder dystocia. Obstet Gynecol. 2002;100(5 pt 1):1045–1050.

Henry M. Lerner, MD
Dr. Lerner is Assistant Clinical Professor of Obstetrics and Gynecology at Harvard Medical School in Boston, Massachusetts.
Dr. Lerner reports that he has been a consultant to the Sullivan Group, which provides patient safety services to labor and delivery units and obstetric practices.
Obstetricians are often blamed for causing neonatal brachial plexus palsy (NBPP). For that reason, understanding the true pathophysiology and causation of this birth-related entity is of extreme importance.
In Part 1 of this two-part series, I summarized findings from the new report on NBPP from the American College of Obstetricians and Gynecologists (ACOG), focusing on whether the phenomenon of shoulder dystocia and NBPP can be predicted or prevented.1 Here, in Part 2, I focus on ACOG’s conclusions concerning pathophysiology and causation of NBPP, as well as the College’s recommendations for applying that knowledge to practice.
Some infants are more susceptible than others to the forces of labor and delivery
Babies emerge from the uterus and maternal pelvis by a combination of uterine contractions and maternal pushing (endogenous forces) aided by the traction forces applied by the birth attendant (exogenous forces). Research over the past 2 decades has shown that endogenous forces play a significant—if not dominant—role in the causation of NBPP.
Stretching and potential injury to the brachial plexus occur when the long axis of the fetus is pushed down the birth canal while either the maternal symphysis pubis or sacral promontory catches and holds either the anterior or posterior shoulder of the fetus, respectively. This conjunction of events generates a stretching force on the tissues that connect the fetal trunk and head—the neck—under which lies the brachial plexus. The same anatomic relationships and labor forces also vigorously compress the fetal neck against the maternal symphysis pubis or sacral promontory and may cause compression injury. Any traction applied by the clinician accentuates these stretching and pressure forces acting on the nerves of the brachial plexus.
How the neonate responds to these forces depends on the tensile strength of its tissues, the metabolic condition of the fetus after a potentially long labor (as measured by acid-base status), the degree of protective muscle tone around the fetal shoulder and neck, and other fluctuating conditions. In other words, because of the many variables involved, some fetuses are more or less susceptible to injury than others.
Maternal forces alone can cause NBPP
The ACOG report1 makes an important statement:
Some plaintiff attorneys and their expert witnesses have tried to make the case that, although endogenous forces can cause temporary brachial plexus injuries, they cannot cause permanent brachial plexus injuries. However, as the ACOG report goes on to state:
The report acknowledges that the clinician can increase brachial plexus stretch by applying downward lateral traction to the neonate’s head during delivery efforts. However, contrary to claims often made by the plaintiff bar, in the presence of shoulder dystocia, even properly applied axial traction will necessarily increase the stretching of the brachial plexus. The report also notes that traction applied in the plane of the fetal cervicothoracic spine typically is along a vector estimated to be 25° to 45° below the horizontal plane of a woman in lithotomy position, not in an exact straight line with the maternal trunk. This degree of delivery force below the horizon is defined as normal “axial traction.”
Exogenous forces have yet to be definitively measured
Multiple attempts have been made to quantify the amount of force applied by clinicians in various delivery scenarios. However, in the published studies in which this force has been “measured,” the accuracy of the findings has not been validated. The three studies in which delivery force was directly measured in a clinical setting “provide a limited assessment of exogenous forces” and “do not address the angle at which forces were applied.”3–5 All other studies used artificial models.
As a result, few conclusions from such studies are directly applicable to the clinical arena. Moreover, in other studies using simulated birth scenarios, there was no feedback to participating clinicians as to whether the force they applied would have been sufficient to deliver the “fetus.” It was therefore difficult for participants in such studies to “determine how the situation corresponds with the force they would apply clinically.”1
Cadaver studies have been inadequate to assess the in situ response of the brachial plexus
Many plaintiff claims regarding the cause of brachial plexus injury use cadaver studies as evidence. However, most such studies were conducted between 98 and 140 years ago. In these older studies, quantitative evaluation was rare. And in the few more recent studies, there are several reasons why the data obtained are problematic:
- the nerves being studied were dissected free from supporting tissues
- nerve tissue deteriorates quickly postmortem
- some studies used adult tissues; there may be significant differences between adult and newborn nerve tissue that obscure comparison.
The ACOG report concludes the section on cadaver studies by stating:
Physical models also fall short
The problem with the use of physical models in evaluating NBPP centers on the need to find materials that have the same or similar properties as the tissues of interest. These sorts of bioengineering limitations generally do not allow for findings that have direct clinical applicability.
Of interest, however, is the finding of at least two groups of investigators that less traction is required when simulating delivery of a model infant when rotational maneuvers (Rubin’s) are employed rather than after McRoberts repositioning.
Computer models have yielded data on the relative effects of endogenous and exogenous forces
Sophisticated computer analysis has been used to investigate both endogenous and exogenous delivery forces. Results of such studies have shown that maternal endogenous forces exert twice as much pressure on the base of the fetal neck against the maternal symphysis pubis as do deliverer-induced exogenous forces.
Is there a threshold of force?
Data that include measurement of the force applied to the brachial plexus nerves of a live infant during a real delivery are almost nonexistent. One group—on the basis of a single case of transient NBPP and potentially flawed pressure measurements—has suggested that the threshold for NBPP in the human is 100 Newtons.3 However, other studies have shown that physician-applied forces in routine deliveries commonly exceed this hypothesized cutoff—yet the rate of NBPP remains low. In measuring delivery forces it must be remembered that significant variation exists between individual neonates, both in terms of mechanical properties and anatomy. Because of this variation—and the nonlinear behavior of nerve tissues—the specific force needed to cause a nerve injury or rupture in a given neonate has not been established.
Chapter 3 of the ACOG report closes with a statement:
NBPP and shoulder dystocia
Shoulder dystocia is defined as a delivery that requires additional obstetric maneuvers after gentle downward traction on the fetal head fails to deliver the fetal shoulders. The ACOG report makes the important point that shoulder dystocia is not formally diagnosed until a trial of downward axial traction has been unsuccessful in delivering the anterior shoulder. This point is a refutation of the frequent plaintiff claim that, once a shoulder dystocia is thought to be present, no traction whatsoever should be applied by the clinician at any time during the remainder of the delivery.
Shoulder dystocia incidence is rising
The reported incidence of shoulder dystocia has increased over the past several decades. It is unclear whether this increase is related to maternal obesity, fetal macrosomia, or more widespread reporting. However, paradoxes exist in the relationship among risk factors, shoulder dystocia, and brachial plexus injury:
- although there is an increased incidence of shoulder dystocia with increased birth weight, the mean birth weight of neonates with recognized shoulder dystocia is not significantly higher than the mean birth weight of all term infants
- strategies to reduce NBPP by preventing shoulder dystocia—including early induction of labor and prophylactic use of McRoberts maneuver and suprapubic pressure—have not been effective in reducing the incidence of NBPP.
The ACOG report makes the statement: “Maternal and fetal factors associated with shoulder dystocia do not allow for reliable prediction of persistent NBPP.”1
What is optimal management of shoulder dystocia?
The last obstetric part of the ACOG report takes as its focus the management of shoulder dystocia. It discusses the importance of communication among members of the delivery team and with the mother whose neonate is experiencing a shoulder dystocia. The report states:
This statement contrasts with claims frequently made by plaintiff medical expert witnesses that the woman experiencing a shoulder dystocia should absolutely cease from pushing.
In a section on team training, the report describes the delivery team’s priorities:
- resolving the shoulder dystocia
- avoiding neonatal hypoxic-ischemic central nervous system injury
- minimizing strain on the neonatal brachial plexus.
Studies evaluating process standardization, the use of checklists, teamwork training, crew resource management, and evidence-based medicine have shown that these tools improve neonatal and maternal outcomes.
Simulation training also has been shown to help reduce transient NBPP (see the box below for more on simulation programs for shoulder dystocia). Whether it also can lower the rate of permanent NBPP is unclear.1
Can simulation training reduce the rate of neonatal brachial plexus injury after shoulder dystocia?
In the new ACOG report on neonatal brachial plexus injury, simulation training is discussed as one solution to the dilemma of how clinicians can gain experience in managing obstetric events that occur infrequently.1 Simulation training also has the potential to improve teamwork, communication, and the situational awareness of the health-care team as a whole. Several studies over the past few years have shown that, in some units, the implementation of simulation training actually has decreased the number of cases of neonatal brachial plexus palsy (NBPP), compared with no simulation training.
For example, Draycott and colleagues explored the rate of neonatal injury associated with shoulder dystocia before and after implementation of a mandatory 1-day simulation training program at Southmead Hospital in Bristol, United Kingdom.2 The program consisted of practice on a shoulder dystocia training mannequin and covered risk factors, recognition of shoulder dystocia, maneuvers, and documentation. The training used a stepwise approach, beginning with a call for help and continuing through McRoberts’ positioning, suprapubic pressure, and internal maneuvers such as delivery of the posterior arm (Figure).
There were 15,908 births in the pretraining period and 13,117 in the posttraining period, with shoulder dystocia rates comparable between the two periods. Not only did clinical management of shoulder dystocia improve after training, but there was a significant reduction in neonatal injury at birth after shoulder dystocia (30 injuries of 324 shoulder dystocia cases [9.3%] before training vs six injuries of 262 shoulder dystocia cases [2.3%] afterward).2
In another study of obstetric brachial plexus injury before and after implementation of simulation training for shoulder dystocia, Inglis and colleagues found a decline in the rate of such injury from 30% to 10.67% (P<.01).3 Shoulder dystocia training remained associated with reduced obstetric brachial plexus injury after logistic-regression analysis.3
Shoulder dystocia training is now recommended by the Joint Commission on Accreditation of Healthcare Organizations in the United States. However, in its report, ACOG concludes—despite studies from Draycott and colleagues and others—that, owing to “limited data,” “there remains no evidence that introduction of simulation can reduce the frequency of persistent NBPP.”1
References
- American College of Obstetricians and Gynecologists. Executive summary: neonatal brachial plexus palsy. Report of the American College of Obstetricians and Gynecologists’ Task Force on neonatal brachial plexus palsy. Obstet Gynecol. 2014;123(4):902–904.
- Draycott TJ, Crofts FJ, Ash JP, et al. Improving neonatal outcome through practical shoulder dystocia training. Obstet Gynecol. 2008;112(1):14–20.
- Inglis SR, Feier N, Chetiyaar JB, et al. Effects of shoulder dystocia training on the incidence of brachial plexus palsy. Am J Obstet Gynecol. 2011;204(4):322.e1–e6.
Delivery of the posterior arm
The report reaffirms the previous statement from the ACOG practice bulletin on shoulder dystocia, which asserts that no specific sequence of maneuvers for resolving shoulder dystocia has been shown to be superior to any other.6 It does note, however, that recent studies seem to demonstrate a benefit when delivery of the posterior arm is prioritized over the usual first-line maneuvers of McRoberts positioning and the application of suprapubic pressure. If confirmed, such findings may alter the standard of care for shoulder dystocia resolution and result in a change in ACOG recommendations.
Documentation may be enhanced by use of a checklist
The ACOG report stresses the importance of accurate, contemporaneous documentation of the management of shoulder dystocia, observing that checklists and documentation reminders help ensure the completeness and relevance of notes after shoulder dystocia deliveries and NBPP. ACOG has produced such a checklist, which can be found in the appendix of the report itself.1
How long before central neurologic injury occurs?
Another issue covered in the report is how long a clinician has to resolve a shoulder dystocia before central neurologic damage occurs. Studies have shown that permanent neurologic injury can occur as soon as 2 minutes after shoulder impaction, although the risk of acidosis or severe hypoxic-ischemic encephalopathy remains low until impaction has lasted at least 5 minutes.
Other issues covered in the report
The last chapters of the ACOG report focus on orthopedic aspects of brachial plexus injury, including diagnosis, treatment, and prognosis.
The report concludes with a glossary and three appendices:
- Royal College of Obstetricians and Gynecologists Green Top Guidebook #42 on shoulder dystocia
- ACOG Practice Bulletin #40 on shoulder dystocia
- ACOG Patient Safety Checklist #6 on the documentation of shoulder dystocia.
Why the ACOG report is foundational
The ACOG report on NBPP is an important and much-needed document. It includes a comprehensive review of the literature on brachial plexus injury and shoulder dystocia, written by nationally recognized experts in the field. Most important, it makes definitive statements that counteract false and dubious claims often made by the plaintiff bar in brachial plexus injury cases and provides evidence to back those statements.
The report:
- disproves the claim that “excessive” physician traction is the only etiology of brachial plexus injuries
- demonstrates that no differentiation can be made between the etiology of permanent versus temporary brachial plexus injuries
- describes how brachial plexus injuries can occur in the absence of physician traction or even of shoulder dystocia
- provides a summary of scientific information about brachial plexus injuries that will benefit obstetric clinicians
- provides a wealth of literature documentation that will enable physician defendants to counteract many of the claims plaintiffs and their expert witnesses make in brachial plexus injury cases.
The report is—and will remain—a foundational document in obstetrics for many years to come.
Share your thoughts on this article! Send your Letter to the Editor to [email protected].
1. American College of Obstetricians and Gynecologists. Executive summary: neonatal brachial plexus palsy. Report of the American College of Obstetricians and Gynecologists’ Task Force on neonatal brachial plexus palsy. Obstet Gynecol. 2014;123(4):902–904.
2. Lerner HM, Salamon E. Permanent brachial plexus injury following vaginal delivery without physician traction or shoulder dystocia. Am J Obstet Gynecol. 2008;198(3):e.7–e.8.
3. Allen R, Sorab J, Gonik B. Risk factors for shoulder dystocia: an engineering study of clinician-applied forces. Obstet Gynecol. 1991;77(3):352–355.
4. Poggi SH, Allen RH, Patel CR, Ghidini A, Pezzullo JC, Spong CY. Randomized trial of McRoberts versus lithotomy positioning to decrease the force that is applied to the fetus during delivery. Am J Obstet Gynecol. 2004;191(3):874–878.
5. Poggi SH, Allen RH, Patel C, et al. Effect of epidural anaesthesia on clinician-applied force during vaginal delivery. Am J Obstet Gynecol. 2004;191(3):903–906.
6. American College of Obstetricians and Gynecologists. Practice bulletin #40: shoulder dystocia. Obstet Gynecol. 2002;100(5 pt 1):1045–1050.

Someone should have told me…
In a casual conversation I was having with a marriage counselor, he mentioned that a growing number of young couples are struggling with impotence. The main cause is watching too much pornography.
Now, it is no surprise that adolescents would watch pornography. Since the dawn of time young men have been seeking arousal from pornographic images. With the advent of the Internet, the availability and variety of images is endless. Teens are able to access pornography on their phones, tablets, computers, and cable. It’s next to impossible for parents to block all access because every adolescent has one form of technology or another; if he doesn’t have access at home, it surely can be seen at a friend’s house.
The physiologic effect of pornography is an excessive release of dopamine that binds to dopamine receptors and causes a maximal state of arousal. These receptors over time become less and less sensitive, so when these young men engage in intercourse, the stimulation is much less, and they are unable to have an erection. Many men do not make the connection between the pornography and their erectile dysfunction, so they may go years without seeking help.
There is a growing trend among younger men to use Viagra and Cialis, according to statistics (Int. J. Impot. Res. 2004;16:313-8). Most are using them for sexual enhancement, but others are seeking them for performance anxiety which may be related to their dysfunction associated with pornography. The problem is, pornography-induced erectile dysfunction is not an issue of blood flow, so these drugs are not helpful in most cases. Since the issue is the sensitivity of the dopamine receptors, the only treatment is to reduce or stop watching pornography, thus allowing the dopamine receptors to become more sensitive.
Now, as a physician, this clearly is an awkward topic to bring up during a routine health physical. But if left unsaid, this behavior could clearly lead to years of dysfunction. What I have found to be a simple solution to the “not so popular topics” is to present a handout with a topic simply stated and easy to read. This allows you to give patients the information without the embarrassment. The purpose is just to identify what is normal and what is not so normal so a patient knows to seek help if the problem occurs. Quick fixes also should be listed if known, especially if the quick fix is just to stop the behavior.
Other topics – such as bacterial vaginosis, the morning after pill, acne, and gynecomastia – can be addressed similarly because teens don’t know what they don’t know, so they may not even consider asking. Many women don’t realize that bacterial vaginosis requires a prescription medication and so may remain symptomatic for long periods of time.
Education is key. As pediatricians, arming our patients with knowledge allows them to at least ask the appropriate questions, which hopefully will get them the right answer.
Dr. Pearce is a pediatrician in Frankfort, Ill. E-mail her at [email protected].

David Henry's JCSO podcast, September 2014
Among the items featured in Dr David Henry’s monthly podcast for The Journal of Community and Supportive Oncology, is a report on bacteremia in adult cancer patients with apparently stable febrile neutropenia and another on practice gaps and barriers optimal care in patients with CML, ALL, or B-cell lymphomas. Also featured is a report on treatment patterns and clinical effectiveness in patients who are treated in the community setting for metastatic castrate-resistant prostate cancer after first-line docetaxel, as well as a Case Report on a patient with metastatic melanoma presenting as disseminated sporotrichosis.
Among the items featured in Dr David Henry’s monthly podcast for The Journal of Community and Supportive Oncology, is a report on bacteremia in adult cancer patients with apparently stable febrile neutropenia and another on practice gaps and barriers optimal care in patients with CML, ALL, or B-cell lymphomas. Also featured is a report on treatment patterns and clinical effectiveness in patients who are treated in the community setting for metastatic castrate-resistant prostate cancer after first-line docetaxel, as well as a Case Report on a patient with metastatic melanoma presenting as disseminated sporotrichosis.
Among the items featured in Dr David Henry’s monthly podcast for The Journal of Community and Supportive Oncology, is a report on bacteremia in adult cancer patients with apparently stable febrile neutropenia and another on practice gaps and barriers optimal care in patients with CML, ALL, or B-cell lymphomas. Also featured is a report on treatment patterns and clinical effectiveness in patients who are treated in the community setting for metastatic castrate-resistant prostate cancer after first-line docetaxel, as well as a Case Report on a patient with metastatic melanoma presenting as disseminated sporotrichosis.
Multifocal Intraosseous Ganglioneuroma
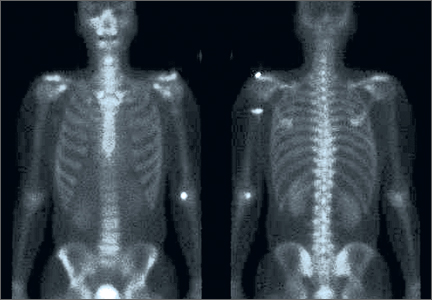
Acute Achilles Tendon Ruptures: A Comparison of Minimally Invasive and Open Approach Repairs Followed by Early Rehabilitation
VIDEO: CLEOPATRA combo extends survival in HER2-positive metastatic breast cancer
MADRID – The final overall survival analysis of the CLEOPATRA trial showed an unprecedented 15.7-month increase in overall survival for women with HER2-positive metastatic breast cancer.
The results were achieved by adding pertuzumab to first-line trastuzumab and docetaxel chemotherapy (56.5 months vs. 40.8 months; hazard ratio, 0.68; P = .0002).
Importantly, the survival improvement came without excessive toxicity, including cardiac events, lead author Dr. Sandra Swain reported during a presidential symposium at the European Society for Medical Oncology Congress.
The results, now with a median follow-up of 50 months, build on those previously reported from CLEOPATRA, showing a survival trend favoring the combination of two targeted agents with chemotherapy in the first interim analysis and a statistically significant overall survival advantage at 30 months in a second interim analysis.
In a video interview at the meeting, Dr. Swain, medical director of the Washington Cancer Institute, Medstar Washington Hospital Center, discusses the results and their implications for care.
The video associated with this article is no longer available on this site. Please view all of our videos on the MDedge YouTube channel
AT ESMO 2014
Key clinical point: CLEOPATRA establishes pertuzumab and trastuzumab plus chemotherapy as the standard of care in metastatic HER2-positive breast cancer.
Major finding: Overall survival was 40.8 months with trastuzumab plus chemotherapy, and 56.5 months with the addition of pertuzumab.
Data source: Phase III double-blind trial in 808 women with HER2-positive metastatic breast cancer.
Disclosures: The study was funded by Hoffman-La Roche, Genentech. Dr. Swain reported serving as an uncompensated consultant for Genentech/Roche. Her institution has received research funding from Genentech/Roche, Pfizer, Puma, Sanofi-Aventis, and Bristol-Myers Squibb. Several of her coauthors reported financial relationships with several drug firms.

Combo shows potential as frontline therapy in PTCL

Credit: NIH
MADRID—Follow-up data from a phase 1 trial suggest brentuximab vedotin plus chemotherapy may be a feasible frontline option for patients with peripheral T-cell lymphoma (PTCL).
At the ESMO 2014 Congress, investigators presented a 2-year durability analysis from a trial of brentuximab vedotin plus cyclophosphamide, doxorubicin, and prednisone (BV+CHP) in patients newly diagnosed with PTCL.
The estimated 2-year overall survival rate was 80% in these patients. And the median progression-free survival was not reached.
Michelle Fanale, MD, of The University of Texas MD Anderson Cancer Center in Houston, and her colleagues reported these results as abstract 944O.
The research was sponsored by Seattle Genetics Inc. and Takeda Pharmaceuticals International, the companies co-developing brentuximab vedotin (Adcetris).
In this trial, patients received 1 of 2 treatment regimens. The first was sequential treatment (once every 3 weeks) with brentuximab vedotin at 1.8 mg/kg for 2 cycles, followed by cyclophosphamide, doxorubicin, vincristine, and prednisone (CHOP) for 6 cycles.
The second was combination BV+CHP every 3 weeks for 6 cycles. Patients who achieved at least a partial response after 6 cycles of treatment were eligible to receive continued single-agent brentuximab vedotin for up to 10 additional 3-week cycles.
Earlier results with both treatment regimens were published in the Journal of Clinical Oncology. At ESMO, Dr Fanale presented 2-year results among the 26 patients who received BV+CHP.
The median patient age was 56 years. Nineteen patients had systemic anaplastic large-cell lymphoma (sALCL), including 16 patients (62%) with ALK-negative disease.
Two patients had PTCL not otherwise specified, 2 had angioimmunoblastic T-cell lymphoma, 2 had adult T-cell leukemia/lymphoma, and 1 had enteropathy-associated T-cell lymphoma. The majority of patients had advanced-stage disease and/or were considered high risk.
All 26 patients had an objective response to BV+CHP, including 23 patients (88%) with a complete response. All 23 patients who achieved a complete remission demonstrated normalized glucose uptake by PET.
The median observation time was 27.1 months from the first dose of therapy. The estimated 2-year progression-free survival rate was 54%, with no patients receiving a consolidative stem cell transplant. And the estimated 2-year overall survival rate was 80%.
The most common treatment-emergent adverse events of any grade occurring in more than 40% of patients were peripheral sensory neuropathy, nausea, fatigue, hair loss, diarrhea, and shortness of breath.
Based on the results of this study, Seattle Genetics and Takeda initiated a global phase 3 study called ECHELON-2. This randomized, double-blind, placebo-controlled, multicenter trial was designed to investigate BV+CHP vs CHOP as frontline therapy in patients with CD30-positive PTCL.
The study is currently enrolling patients. It is expected to enroll 300 patients, who will be randomized to receive either treatment every 3 weeks for 6 to 8 cycles. ![]()
Drug can prevent chemo-induced nausea, vomiting

Credit: Rhoda Baer
MADRID—A small molecule called rolapitant can prevent nausea and vomiting in patients receiving cisplatin-based chemotherapy, results of a phase 3 trial suggest.
When given prior to chemotherapy, rolapitant induced a complete response in about 70% of patients.
These patients had no emesis after chemotherapy and did not require any rescue medication.
“This agent makes a significant difference in the way people tolerate their chemotherapy,” said Martin Chasen, MD, of Ottawa Hospital Cancer Centre in Canada.
“Patients experienced no loss in quality of life, and, in fact, many saw meaningful improvements. One of the patients in the rolapitant cohort reported that he had just finished 18 holes of golf one week after receiving chemotherapy. This is in sharp contrast to many patients on current standard anti-emetics that are too ill to get out of bed within a week after each cycle of cisplatin.”
Dr Chasen and his colleagues reported these results at the ESMO 2014 Congress (abstract LBA47_PR).
The team had set out to evaluate rolapitant, a novel antagonist of the NK-1 receptor, for the prevention of severe nausea and vomiting often experienced by patients receiving cisplatin-based chemotherapy, which may cause dose reductions and treatment discontinuation.
The trial included 532 patients who were randomized 1:1 to receive rolapitant plus granisetron/dexamethasone or placebo plus granisetron/dexamethasone prior to chemotherapy.
The primary endpoint was complete response (defined as the patient having no emesis and not requiring any rescue medication) in the delayed phase (>24-120 hours) post-chemotherapy. Key secondary endpoints included complete response during the acute phase (0-24 hours) and overall (0-120 hours).
The trial met its primary endpoint, with 72.7% of patients receiving rolapitant achieving a complete response in the delayed phase, compared to 58.4% of those receiving placebo (P<0.001).
Rolapitant also improved the complete response rate compared to placebo in the acute phase—83.7% and 73.7%, respectively (P=0.005).
Overall, the complete response rates were 70.1% and 56.5%, respectively (P=0.001).
Patients receiving rolapitant tended to report that chemotherapy had less of an impact on their daily quality of life, although the difference between the treatment arms was not significant—72.8% vs 67.8% (P=0.231).
“Rolapitant demonstrated a significant effect in both the acute and delayed phases,” Dr Chasen noted. “Our primary endpoint was achieved in the delayed phase—an incredible result.”
“We know that the NK-1 receptor in the brain must be blocked to control nausea and vomiting. Rolapitant is an exceptionally long-term receptor blocker that binds to the receptor and remains in place for up to 120 hours, therefore not allowing the chemotherapy to induce nausea and vomiting.”
Dr Chasen added that rolapitant may prove effective in patients receiving less emetogenic cancer treatments as well. ![]()