User login
ETBs prove effective against lymphoma and myeloma

Credit: Rhoda Baer
PHILADELPHIA—A pair of engineered toxin bodies (ETBs) can successfully treat Burkitt lymphoma and multiple myeloma, according to preclinical research presented at the AACR conference Hematologic Malignancies: Translating Discoveries to Novel Therapies.
The ETBs, known as MT-4007 and MT-4007-D, work by targeting CD38.
They greatly reduced tumor burden and improved survival in mouse models. And they were well-tolerated, even at the highest doses administered.
“In this study, we found that the growth of human cancer cells in mice was substantially decreased, or the cells were even eliminated, following treatment with our investigational CD38-targeted therapy,” said Erin K. Willert, PhD, of Molecular Templates Inc., in Georgetown, Texas.
Dr Willert and her colleagues explained that ETBs are derived from the ribosome-inactivating alpha subunit of Shiga-like toxin 1 (SLT-1A). They have been engineered to contain a target binding domain fused to a modified SLT-1A protein, which allows for delivery to a cell surface target—in this case, CD38.
Upon binding to a CD38-expressing cell, the ETB enters the cell, routes to the cytosol, halts protein synthesis, and kills the cell.
The researchers first tested MT-4007 and MT-4007-D in a range of human cell lines. The agents exhibited cytotoxicity in CD38+ Burkitt lymphoma and multiple myeloma cell lines (H929, Daudi, ST486, and Raji). But neither agent proved cytotoxic in CD38- cell lines (U266, SKBR3, and HCC1954).
The team then moved on to test MT-4007 in a mouse model of Burkitt lymphoma. Following injection with Daudi-Luc cells, mice received no treatment or MT-4007 at 0.05 mg/kg, 0.5 mg/kg, or 2 mg/kg on days 3, 5, 8, 10, and 12.
Treated mice exhibited significantly reduced tumor burden compared to controls. The mean tumor burden for mice that received MT-4007 at 0.05 mg/kg was 29% of the control tumor burden (P<0.0001). It was 0.4% for mice that received 0.50 mg/kg (P<0.0001) and 0.02% for mice that received 2 mg/kg (P<0.0001).
In a model of multiple myeloma, MT-4007-D provided a dose-dependent delay in tumor growth. After receiving injections of H929 cells, mice received no treatment or MT-4007-D at 0.5 mg/kg, 2 mg/kg, or 3 mg/kg on days 1, 3, 5, 8, 10, and 12.
The researchers assessed efficacy by measuring the time to endpoint, which was a tumor volume of 2000 mm3. The median time to endpoint was 22.3 days in controls, 21.2 days in the 0.5 mg/kg arm (not significant), 24.5 days in the 2 mg/kg arm (P=0.004), and 26.2 days in the 3 mg/kg arm (P=0.04).
The team assessed safety using body weight. They found that all treated groups of mice maintained a stable weight, suggesting MT-4007-D is well-tolerated.
The researchers also noted that, in a previous dose-finding study, the maximum-tolerated dose of MT-4007 was not reached at the highest dose administered to mice (2 mg/kg), which suggests MT-4007 is well tolerated as well.
Finally, Dr Willert and her colleagues found that MT-4007 extends survival in models of Burkitt lymphoma. The team euthanized mice if they had a greater than 20% loss in body weight or symptoms such as hind limb paralysis.
In the control group, all 10 mice died, and the median survival was 34 days. In the 0.5 mg/kg treatment group, 5 mice died, and the median survival was 59.5 days (P=0.0002).
One mouse died in the 0.5 mg/kg group (P<0.0001), and none of the mice died in the 2 mg/kg group (P<0.0001). The median survival was undefined for both groups.
Dr Willert said these results suggest the ETBs should be moved forward to clinical trials in CD38+ B-cell malignancies such as multiple myeloma. And because the ETBs work differently from other treatments, they might prove effective in relapsed or refractory patients.
However, more preclinical research is needed before the ETBs can be tested in patients. MT-4007-D is under investigation in preclinical studies now.
This research was funded by Molecular Templates Inc., makers of MT-4007 and MT-4007-D. ![]()
Platelets respond to their surroundings, study shows

Credit: Andre E.X. Brown
Platelets can sense and respond to their surroundings, according to research published in PNAS.
Researchers reported that platelets can detect mechanical aspects of their environment and transduce those cues into biological signals.
Experiments showed that platelets could sense the stiffness of a fibrin/fibrinogen substrate, and increasing stiffness was associated with increased platelet adhesion, spreading, and activation.
“Platelets are smarter than we give them credit for, in that they are able to sense the physical characteristics of their environment and respond in a graduated way,” said study author Wilbur Lam, MD, PhD, of the Emory University School of Medicine in Atlanta, Georgia.
He and his colleagues were able to separate physical and biochemical effects on platelet behavior by forming polymer gels with different degrees of stiffness and then overlaying each with the same coating of fibrinogen.
With stiffer gels, the researchers observed an increase in platelet adhesion, spreading, and activation. This behavior was most pronounced when the concentration of fibrinogen was relatively low.
“This variability helps to explain platelet behavior in the 3D context of a clot in the body, which can be quite heterogenous in makeup,” Dr Lam said.
The researchers were also able to dissect platelet biochemistry by allowing the platelets to adhere and then spread on the various gels under the influence of drugs that interfere with different biochemical steps.
The team found that integrins, which engage the fibrinogen, and the protein Rac1 are involved in the initial mechanical sensing during adhesion. Myosin and actin, components of the cytoskeleton, are responsible for platelet spreading.
“We found that the initial adhesion and later spreading are separable, because different biochemical pathways are involved in each step,” Dr Lam said. “Our data show that mechanosensing can occur and plays important roles even when the cellular structural building blocks are fairly basic, even when the nucleus is absent.”
The researchers believe these findings could influence the design of medical devices, as modifying the stiffness of materials used in these devices might reduce the formation of blood clots. The results could also guide the refinement of anticoagulant therapy. ![]()
Team tracks cell therapy using MRI
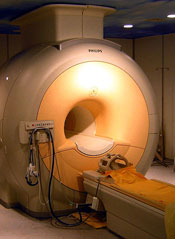
Scientists say they have devised a way to track the movements, destination, and persistence of a broad range of cellular therapies, without resorting to invasive procedures.
In Magnetic Resonance in Medicine, the researchers described the first human tests using a perfluorocarbon (PFC) tracer in combination with non-invasive magnetic resonance imaging (MRI) to track therapeutic immune cells injected into patients with colorectal cancer.
“Initially, we see this technique used for clinical trials that involve tests of new cell therapies,” said study author Eric T. Ahrens, PhD, of the University of California, San Diego.
“Clinical development of cell therapies can be accelerated by providing feedback regarding cell motility, optimal delivery routes, individual therapeutic doses, and engraftment success.”
Currently, there is no accepted way to image cells in the human body that covers a broad range of cell types and diseases. Earlier techniques have used metal ion-based vascular MRI contrast agents and radioisotopes.
The former have proven difficult to differentiate in vivo. The latter raise concerns about radiation toxicity and do not provide the anatomical detail available with MRIs.
“This is the first human PFC cell tracking agent, which is a new way to do MRI cell tracking,” Dr Ahrens said. “It’s the first example of a clinical MRI agent designed specifically for cell tracking.”
He and his colleagues used a PFC tracer agent and an MRI technique that directly detects fluorine atoms in labeled cells. Fluorine atoms naturally occur in extremely low concentrations in the body, making it easier to observe cells labeled with fluorine using MRI.
In this case, the modified and labeled dendritic cells were first prepared from white blood cells extracted from the patient. The cells were then injected into patients with stage 4 metastatic colorectal cancer to stimulate an anticancer T-cell immune response.
The researchers did not assess the efficacy of the cell therapy, only their ability to detect the labeled cells and monitor what happened to them. Dr Ahrens said the technique worked as expected, with the surprising finding that only half of the delivered cell vaccine remained at the inoculation site after 24 hours.
“The imaging agent technology has been shown to be able to tag any cell type that is of interest,” Dr Ahrens said. “It is a platform imaging technology for a wide range of diseases and applications.”
“Non-invasive cell tracking may help lower regulatory barriers,” he added. “For example, new stem cell therapies can be slow to obtain regulatory approvals, in part, because it is difficult, if not impossible, with current approaches to verify survival and location of transplanted cells.”
“And cell therapy trials generally have a high cost per patient. Tools that allow the investigator to gain a ‘richer’ data set from individual patients mean it may be possible to reduce patient numbers enrolled in a trial, thus reducing total trial cost.” ![]()
Drugs demonstrate inconsistent synergy in CLL, MCL

PHILADELPHIA—The Bcl-2 inhibitor ABT-199 and the Bruton tyrosine kinase inhibitor ibrutinib can have a synergistic effect against mantle cell lymphoma (MCL) and chronic lymphocytic leukemia (CLL), preclinical data suggest.
In one set of experiments with MCL and CLL samples, the drugs induced apoptosis at a much higher rate when used together than when used alone.
However, in other experiments with CLL samples, ABT-199 and ibrutinib did not consistently display synergistic cytoxicity.
The researchers said this indicates substantial patient heterogeneity in response to the combination that may be due to variations in the genetic landscape.
Michael J. Weber, PhD, of the University of Virginia School of Medicine in Charlottesville, and his colleagues presented this research at the AACR conference Hematologic Malignancies: Translating Discoveries to Novel Therapies.
“We took an empirical but systematic approach to identify combinations of drugs that might improve the ability of ibrutinib to kill cancer cells,” Dr Weber said. “The combination of ibrutinib and ABT-199 was, by far, the most effective in our assays, and we are in the very earliest stages of planning a clinical trial to test this combination in the clinic.”
In previous studies, Dr Weber and his colleagues found that ibrutinib synergized with both ABT-199 and the proteasome inhibitor carfilzomib to kill MCL cell lines. In this study, the team assessed the effects of exposure to these 2 combinations on samples from patients with MCL or CLL.
The researchers found that apoptosis occurred in 23% of cells exposed to ABT-199 and ibrutinib in combination, compared to 3.8% of cells exposed to ibrutinib and 3% exposed to ABT-199.
The combination of ibrutinib and carfilzomib also increased apoptosis in MCL and CLL cells compared to either agent alone, though to a lesser degree than the ABT-199 combination. Apoptosis occurred in 5.5% of cells exposed to ibrutinib and carfilzomib, 3.8% exposed to ibrutinib, and 1.7% exposed to carfilzomib.
The researchers observed minimal apoptosis in normal T cells, both with the single agents and the combinations.
Further analysis showed that ibrutinib and ABT-199 worked synergistically to cause apoptosis in leukemic cells from 5 of 9 patients with CLL.
According to Dr Weber, the variable response to this combination points to the importance of understanding how these combinations work, so we can match the treatments with the most appropriate patients.
“Ibrutinib and ABT-199 target different pathways involved in promoting cancer cell survival and growth,” Dr Weber said.
“This is very intriguing because, in most instances where cancer cells are resistant to a particular molecularly targeted drug, we find that cancer cells adapt and find new ways to reactivate the pathway being targeted by the drug and that combinations of drugs targeting this pathway in different ways can improve outcomes. Here, we found that targeting a pathway outside the primary pathway was effective.”
This study was funded by the University of Virginia Cancer Center. Dr Weber declared no conflicts of interest. ![]()
Closing large dermal defects much like a Victorian corset
EDINBURGH – Barbed absorbable sutures are a useful new tool to facilitate dermal closure of facial and nonfacial defects following tumor resection.
“These are not the bad old sutures that you might of heard about before, that were nonabsorbable sutures and attempted for use in cosmetic procedures,” Dr. John Strasswimmer said at the 15th World Congress on Cancers of the Skin.
Last year, Dr. Strasswimmer, medical director of melanoma and cutaneous oncology at the Lynn Cancer Institute in Boca Raton, Fla., reported his initial experience using a procedure he calls “Corseta” to close a large Mohs defect on the trunk of an 83-year-old man (JAMA Dermatol. 2013;149:853-4).

The procedure employs a barbed, bioabsorbable suture (Ethicon’s Stratafix and Covidien’s V-Loc) that is run in a continuous vertical looping manner in the subcutaneous layer, with minimal to no undermining of the wound. Undermining is typically used in cutaneous surgery to relieve tension or provide structure around anatomical landmarks, but it can increase the risk of bleeding, swelling, and patient discomfort, he said.
Instead, the first suture pass is placed in the deepest portion of the subcutaneous tissue and brought out within the more superficial subcutaneous layer. Each bite of the barbed suture extends peripherally at least 2.0 cm from the edge of the wound, so the point of tension is lateral to the wound margins. At every two passes, tension is placed evenly across the sutures to close the deepest layer of tissue and to engage the barbs, much like closing of a Victorian corset, Dr. Strasswimmer said.
The second arm of the suture is passed in a similar manner in the subcutaneous plane, superficial to the first pass.
“This is a lacing, not a suturing technique,” he said. “You get tissue approximation, but more importantly, because we’re bringing in all that deep tissue, you automatically get beautiful wound-edge eversion and very nice cosmetic results.”
Because the sutures have barbs cut into them, however, a 0-0 weight polydioxane or other absorbable material suture can have a breaking strength of a #2-0 suture. “You have to look very carefully at the manufacturer’s sizing and strength requirements,” Dr. Strasswimmer cautioned.
Since their initial case report, Dr. Strasswimmer and his colleagues have expanded use of the Corseta technique to more than 600 facial and nonfacial reconstructions. The Corseta procedure is not as helpful for curved topography such as the central face or scalp, he said in an interview. Still, of the 600 or so cases, none required conversion to another closure technique.
“The traditional closure technique would not have worked in those challenging cases,” Dr. Strasswimmer said. “In the most difficult situations, such as older patients with severely atrophic skin, even the best suturing won’t work. In that case, the Corseta at least produces a partial closure, thereby reducing the wound and accelerating healing.” The Corseta procedure is often coupled with tumescent anesthesia to decrease the risk of bleeding, particularly in patients on anticoagulation, he noted.
The conference was sponsored by the Skin Cancer Foundation.
EDINBURGH – Barbed absorbable sutures are a useful new tool to facilitate dermal closure of facial and nonfacial defects following tumor resection.
“These are not the bad old sutures that you might of heard about before, that were nonabsorbable sutures and attempted for use in cosmetic procedures,” Dr. John Strasswimmer said at the 15th World Congress on Cancers of the Skin.
Last year, Dr. Strasswimmer, medical director of melanoma and cutaneous oncology at the Lynn Cancer Institute in Boca Raton, Fla., reported his initial experience using a procedure he calls “Corseta” to close a large Mohs defect on the trunk of an 83-year-old man (JAMA Dermatol. 2013;149:853-4).
The procedure employs a barbed, bioabsorbable suture (Ethicon’s Stratafix and Covidien’s V-Loc) that is run in a continuous vertical looping manner in the subcutaneous layer, with minimal to no undermining of the wound. Undermining is typically used in cutaneous surgery to relieve tension or provide structure around anatomical landmarks, but it can increase the risk of bleeding, swelling, and patient discomfort, he said.
Instead, the first suture pass is placed in the deepest portion of the subcutaneous tissue and brought out within the more superficial subcutaneous layer. Each bite of the barbed suture extends peripherally at least 2.0 cm from the edge of the wound, so the point of tension is lateral to the wound margins. At every two passes, tension is placed evenly across the sutures to close the deepest layer of tissue and to engage the barbs, much like closing of a Victorian corset, Dr. Strasswimmer said.
The second arm of the suture is passed in a similar manner in the subcutaneous plane, superficial to the first pass.
“This is a lacing, not a suturing technique,” he said. “You get tissue approximation, but more importantly, because we’re bringing in all that deep tissue, you automatically get beautiful wound-edge eversion and very nice cosmetic results.”
Because the sutures have barbs cut into them, however, a 0-0 weight polydioxane or other absorbable material suture can have a breaking strength of a #2-0 suture. “You have to look very carefully at the manufacturer’s sizing and strength requirements,” Dr. Strasswimmer cautioned.
Since their initial case report, Dr. Strasswimmer and his colleagues have expanded use of the Corseta technique to more than 600 facial and nonfacial reconstructions. The Corseta procedure is not as helpful for curved topography such as the central face or scalp, he said in an interview. Still, of the 600 or so cases, none required conversion to another closure technique.
“The traditional closure technique would not have worked in those challenging cases,” Dr. Strasswimmer said. “In the most difficult situations, such as older patients with severely atrophic skin, even the best suturing won’t work. In that case, the Corseta at least produces a partial closure, thereby reducing the wound and accelerating healing.” The Corseta procedure is often coupled with tumescent anesthesia to decrease the risk of bleeding, particularly in patients on anticoagulation, he noted.
The conference was sponsored by the Skin Cancer Foundation.
EXPERT ANALYSIS FROM WCCS 2014

Durable responses in metastatic melanoma, improved PFS in advanced colorectal cancer
High rate of durable responses to pembrolizumab in metastatic melanoma
Maintenance improves PFS in patients with metastatic colorectal cancer
Key clinical point Patients with metastatic colorectal cancer who have at least stable disease after induction chemotherapy may benefit from maintenance therapy with capecitabine and bevacizumab, though further studies on quality of life are needed. Major finding The median time to second progression (PFS2) for patients with metastatic colorectal cancer following induction and re-treatment was a median of 8.5 months for observation, compared with 11.7 months for maintenance with capecitabine and bevacizumab. Data source Randomized controlled trial of 588 patients from 64 hospitals in the Netherlands.
Click on the PDF icon at the top of this introduction to read the full article.
Total laparoscopic versus laparoscopic supracervical hysterectomy
It gives me great pleasure to introduce this month’s surgical video. The following feature presentation was produced by my third-year fellow, Mireille Truong, MD, and my third-year resident, Sarah Horvath, MD. The focus of this surgical video is to compare and contrast total laparoscopic hysterectomy (TLH) with laparoscopic supracervical hysterectomy (LSH). The indication for the TLH case was refractory dysmenorrhea and for the LSH case was as part of a concomitant sacrocervicopexy. The particular methods for specimen removal demonstrated include through the colpotomy for TLH and cold knife manual morcellation within a bag using an Alexis retractor for LSH.
The objectives of this surgical video are to:
- Highlight the clinical advantages and disadvantages between cervical removal or retention at the time of a minimally invasive laparoscopic hysterectomy
- Demonstrate the surgical nuances between TLH and LSH
- Provide a potential resource for patient counseling as well as medical student and resident education.
I encourage you to share this video as an educational resource with your colleagues, residents, students, and patients alike.

I hope to see you at the AAGL Global Congress on Minimally Invasive Gynecology in Vancouver, November 17–21, 2014. Visit www.aagl.org/globalcongress for more information.
— Dr. Arnold Advincula, AAGL 2014 Scientific Program Chair
Share your thoughts on this video! Send your Letter to the Editor to [email protected]. Please include your name and the city and state in which you practice.
It gives me great pleasure to introduce this month’s surgical video. The following feature presentation was produced by my third-year fellow, Mireille Truong, MD, and my third-year resident, Sarah Horvath, MD. The focus of this surgical video is to compare and contrast total laparoscopic hysterectomy (TLH) with laparoscopic supracervical hysterectomy (LSH). The indication for the TLH case was refractory dysmenorrhea and for the LSH case was as part of a concomitant sacrocervicopexy. The particular methods for specimen removal demonstrated include through the colpotomy for TLH and cold knife manual morcellation within a bag using an Alexis retractor for LSH.
The objectives of this surgical video are to:
- Highlight the clinical advantages and disadvantages between cervical removal or retention at the time of a minimally invasive laparoscopic hysterectomy
- Demonstrate the surgical nuances between TLH and LSH
- Provide a potential resource for patient counseling as well as medical student and resident education.
I encourage you to share this video as an educational resource with your colleagues, residents, students, and patients alike.
I hope to see you at the AAGL Global Congress on Minimally Invasive Gynecology in Vancouver, November 17–21, 2014. Visit www.aagl.org/globalcongress for more information.
— Dr. Arnold Advincula, AAGL 2014 Scientific Program Chair
Share your thoughts on this video! Send your Letter to the Editor to [email protected]. Please include your name and the city and state in which you practice.

Acne and rosacea management for men
In a report released March 2014 by the American Society of Aesthetic Plastic Surgery, the top five surgical procedures for men were liposuction, eyelid surgery, rhinoplasty, male breast reduction, and ear surgery. However, the rate of noninvasive cosmetic procedures and sales of men’s grooming products is one of the leading segments of the beauty industry.
Although most scientific research and media are focused on the female aesthetic, understanding the specific needs of your male patients is key to patient satisfaction. Most men are generally less aware than are women of the treatment options and risks and benefits of procedures. Men also prefer treatments with less downtime and natural-looking results. This column continues our miniseries on aesthetic dermatology for the male patient.
In a general dermatology practice, there are several skin concerns often identified by male patients, and acne and rosacea are among them.
Acne: Men generally have thicker, more sebaceous skin than that of women. Although acne is a very common problem in teens and young men, there is a growing trend of cases of cystic acne in adult men who consume popular protein meal replacement or muscle enhancing shakes that contain whey protein. Whey is a protein derived from cow’s milk. Milk and dairy products act by increasing insulin-like growth factor 1, which has been linked to acne. Although few case reports have shown a link between dietary whey supplementation and acne, in my practice, men with cystic acne who report using whey supplementation products have had almost complete resolution of their acne without medical intervention after discontinuing these products.
Rosacea: Men have a higher density of facial blood vessels than women do, and often seek treatment for telangiectasias and overall facial erythema. For papulopustular rosacea, common treatments include oral antibiotics, topical antibiotics, topical azaleic acid, and topical anti-inflammatory medications. For erythematotelangiectatic rosacea, Mirvaso (brimonidine), a topical vasoconstrictor, can be applied to the skin for 8-12 hours of marked reduction in facial erythema. Although theoretically a great option for patients suffering from erythema, the effects of topical brimonidine are transient, and the gel requires daily application with no long-term benefit. Vascular laser treatments are effective for telangiectasias for both men and women. However, men with more granulomatous or phymatous rosacea often need a combination of treatments including antibiotics, oral isotretinoin and fractional ablative lasers.
Resources:
American Society for Plastic Surgery 2012 statistics.
“Whey protein precipitating moderate to severe acne flares in 5 teenaged athletes,” Cutis 2012;90:70-2.
Dr. Talakoub and Dr. Wesley are cocontributors to a monthly Aesthetic Dermatology column in Skin & Allergy News. Dr. Talakoub is in private practice in McLean, Va. Dr. Wesley practices dermatology in Beverly Hills, Calif. This month’s column is by Dr. Talakoub.

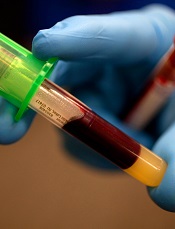
Proper transfusion practice prevents CMV

Credit: Vera Kratochvil
New research confirms that transfusing leukoreduced, cytomegalovirus (CMV)-seronegative blood products prevents CMV transmission in very-low-birth-weight (VLBW) infants.
The study showed that, with this approach, maternal breast milk becomes the primary source of postnatal CMV infection.
“Previously, the risk of CMV infection from blood transfusion of seronegative or leukoreduced transfusions was estimated to be 1% to 3%,” said Cassandra Josephson, MD, of Emory University School of Medicine in Atlanta, Georgia.
“We showed that, using blood components that are both CMV-seronegative and leukoreduced, we can effectively prevent the transfusion-transmission of CMV. Therefore, we believe that this is the safest approach to reduce the risk of CMV infection when giving transfusions to VLBW infants.”
Dr Josephson and her colleagues described this research in JAMA Pediatrics.
The researchers evaluated 462 mothers and 539 VLBW infants who were admitted to 3 neonatal intensive care units between January 2010 and June 2013.
A majority of mothers had a history of CMV infection prior to delivery (CMV sero-prevalence of 76.2%). The infants were enrolled in the study within 5 days of birth and had not received a blood transfusion at that time.
The infants were tested for congenital infection at birth and again at 5 additional intervals between birth and 90 days, discharge, or death.
Twenty-nine of the infants had CMV infection (cumulative incidence of 6.9% at 12 weeks). Five infants with CMV infection developed severe disease or died.
Although 2061 transfusions were administered to 310 of the infants (57.5%), the blood products were CMV-seronegative and leukoreduced, and none of the CMV infections was linked to transfusion.
Twenty-seven of 28 infections acquired after birth occurred among infants fed CMV-positive breast milk.
Dr Josephson and her colleagues estimate that between 1 in 5 and 1 in 10 VLBW infants who are fed CMV-positive breast milk from mothers with a history of CMV infection will develop postnatal CMV infection.
The American Academy of Pediatrics currently states that the value of routinely feeding breast milk from CMV-seropositive mothers to preterm infants outweighs the risks of clinical disease from CMV.
But the researchers noted that new strategies to prevent breast milk transmission of CMV are needed because freezing and thawing breast milk did not completely prevent transmission in this study.
The team said alternative approaches to prevent breast milk transmission of CMV could include routine CMV-serologic testing of pregnant mothers to enable counseling regarding the risk of infection, closer surveillance of infants with CMV-positive mothers, and pasteurization of breast milk until a corrected gestational age of 34 weeks (as recommended by the Austrian Society of Pediatrics).
In addition, routine screening for postnatal CMV infection may help identify infants who are likely to develop symptomatic disease.
The researchers also said the frequency of CMV infection in this study raises significant concern about the potential consequences of CMV infection among VLBW infants and points to the need for large, long-term follow-up studies of neurological outcomes in infants with postnatal CMV infection. ![]()
Blood testing system wins marketing authorization in US
Credit: Juan D. Alfonso
The US Food and Drug Administration (FDA) has granted marketing authorization for the T2Candida® Panel and the T2Dx® Instrument, a system that provides direct detection of 5 yeast pathogens in whole blood samples.
The system can detect Candida albicans, Candida tropicalis, Candida parapsilosis, Candida glabrata, and Candida krusei in patients with symptoms of, or medical conditions predisposing them to, invasive fungal infections.
It can take up to 6 days to detect yeast pathogens using blood culture, and even more time to identify the specific type of yeast present.
The T2Candida system can identify specific Candida pathogens from a single blood sample within 3 to 5 hours.
However, false positive results are possible with this system, so physicians should perform blood cultures to confirm T2Candida results, according to the FDA. Still, a negative test result may provide timely data that allows physicians to avoid or suspend unnecessary antifungal treatment.
“By testing 1 blood sample for 5 yeast pathogens—and getting results within a few hours—physicians can initiate appropriate antifungal treatment earlier and potentially reduce patient illness and decrease the risk of dying from these infections,” said Alberto Gutierrez, director of the Office of In Vitro Diagnostics and Radiological Health at the FDA’s Center for Devices and Radiological Health.
How the system works
The T2Candida panel and T2Dx instrument are powered by T2MR, a miniaturized, magnetic-resonance-based diagnostic approach that measures how water molecules react in the presence of magnetic fields.
The system uses blood-compatible polymerase chain reaction to amplify Candida DNA, which then binds to superparamagnetic nanoparticles coated with a complementary DNA strand. The binding event causes the nanoparticles to cluster, which changes the sample’s T2 magnetic resonance signal.
If the system detects yeast DNA, it can then determine the species category to which the DNA belongs, which helps point healthcare providers to the appropriate treatment.
T2Dx is a fully automated, bench-top instrument. To perform a test, the patient sample is snapped onto a disposable test cartridge, which is preloaded with the necessary reagents. The cartridge is then inserted into T2Dx, which processes the sample and delivers a diagnostic test result.
Studies and FDA review
The FDA reviewed the T2Candida panel and the T2Dx instrument through the agency’s de novo classification process, a regulatory pathway for certain novel, low- to moderate-risk medical devices.
The FDA based its review on a clinical study of 1500 patients, in which the T2Candida system correctly categorized nearly 100% of the negative specimens as negative for the presence of yeast.
In a separate study of 300 blood samples with specific concentrations of yeast, the system correctly identified the organism in 84% to 96% of the positive specimens.
The T2Candida panel and T2Dx instrument are manufactured by T2 Biosystems, Inc. ![]()