User login
Retroperitoneal cyst hemorrhage in polycystic kidney disease
A 59-year-old man with autosomal dominant polycystic kidney disease (ADPKD), end-stage renal disease on hemodialysis, hypertension, and diverticulosis presented with acute pain in the left lower abdomen. The pain began 4 days previously, was dull and nonradiating, was relieved partially with hydrocodone-acetaminophen, and had no clear exacerbating factors. Two days before presentation, he developed a fever with chills. He reported no recent dysuria, diarrhea, hematuria, hematochezia, or melena. He had not been taking anticoagulants or nonsteroidal anti-inflammatory drugs, and he had no history of heavy lifting or trauma.
His temperature was 38.5˚C (101.3˚F), blood pressure 141/60 mm Hg (normal for this patient). On examination, his left lower quadrant was tender with voluntary guarding. Also present was a reducible ventral hernia, which was not new.
His hemoglobin level was 10.6 g/dL (reference range 13.0–17.0), which had dropped from a previous value of 13.7 g/dL.
Computed tomography of the abdomen and pelvis revealed a ruptured retroperitoneal hemorrhagic cyst (Figure 1) in the inferior aspect of the left kidney extending into the fascia of Gerota.
Since his vital signs were stable, he was managed supportively during his hospitalization with intravenous fluids, serial hemoglobin checks, and analgesia. He was eventually discharged home in good condition.
CYST HEMORRHAGE IN POLYCYSTIC KIDNEY DISEASE
ADPKD is a relatively common, inherited systemic disease that leads to cyst formation, primarily in the kidneys but also in the liver (94%), seminal vesicles (40%), pancreas (9%), arachnoid membrane (8%), and spinal meningeal area (2%).1
In addition to cyst formation in multiple organs, ADPKD can have extrarenal manifestations such as connective-tissue abnormalities (including mitral valve prolapse) (25%), abdominal hernia (10%), and intracranial aneurysm (8%).1 Management of extrarenal complications of ADPKD is discussed in detail elsewhere.2
The estimated prevalence of ADPKD is 1 of every 400 to 1,000 live births. However, given that ADPKD is often clinically silent, it is diagnosed during the lifetime of fewer than half of people who have it.3
Most ADPKD cases are caused by mutations in either the PKD1 or PKD2 gene.4,5 Although the mechanism of cyst formation in ADPKD is still unclear, it is known that PKD1 and PKD2 encode proteins called polycystin-1 and polycystin-2, respectively. Polycystin-1 is a membrane protein found in renal tubular epithelia, hepatic bile ductules, and pancreatic ducts. Polycystin-2 is involved in cell calcium signaling and has been identified in the renal distal tubules, collecting duct, and thick ascending limb. Mutations in PKD1 and PKD2 are thought to contribute to cyst formation, with PKD1 mutations associated with earlier onset and more severe development of renal and extrarenal cysts.
Cyst hemorrhage
Hemorrhage of renal cysts is a well-known complication, occurring in up to 70% of patients with ADPKD.6 Renal cyst hemorrhage often presents clinically as flank pain with point tenderness or hematuria, or both. Flank pain results from hemorrhage into a cyst with consequent distention of the renal capsule, whereas hematuria results from rupture of a cyst into the collecting system.
Spontaneous nonfatal retroperitoneal cyst hemorrhage, as in our patient, is rare. Indeed, in one series reviewing the abdominal computed tomographic findings of 66 patients with ADPKD, only 2 patients (3%) had perinephric hematomas in the absence of recent trauma.6
Management of cyst hemorrhage is primarily conservative. Pain associated with cyst hemorrhage is managed conservatively with bed rest, intravenous hydration, and analgesics (but not nonsteroidal anti-inflammatory drugs).
Hematuria is also managed conservatively with bedrest and intravenous hydration, and most episodes of hematuria are self-limiting and last 2 to 7 days. However, if excessive bleeding occurs, the patient may be at risk of urinary tract obstruction from clot formation. If obstruction occurs and persists beyond 2 weeks, then ureteral stenting may be necessary. In rare cases of prolonged, severe bleeding with extensive subcapsular or retroperitoneal hematomas, patients require hospitalization, transfusion, or percutaneous transcatheter embolization of the renal artery. If such efforts are not successful, surgery, including nephrectomy, may be required to control the hemorrhage.2
Other causes of abdominal pain
In addition to renal cyst hemorrhage, the differential diagnosis of abdominal pain in a patient with ADPKD includes cyst enlargement causing stretching of the renal capsule or traction on the renal pedicle, cyst infection, nephrolithiasis, pyelonephritis, and rarely, tumors including renal cell carcinoma.
Unlike cyst rupture and hemorrhage, which are associated with point tenderness, cyst infection often manifests as diffuse, usually unilateral flank pain with associated fever, nausea, malaise, and leukocytosis. Our patient had none of these except for fever, which can also occur in cyst hemorrhage.
Nephrolithiasis occurs in up to 35% of patients with ADPKD,7 but no kidney stones were seen on computed tomography in our patient.
Pyelonephritis was unlikely in our patient, given that he had no significant white blood cells in his urinalysis and no leukocytosis.
Abdominal and pelvic imaging did not reveal any tumors in our patient.
- Pirson Y. Extrarenal manifestations of autosomal dominant polycystic kidney disease. Adv Chronic Kidney Dis 2010; 17:173–180.
- Harris PC, Torres VE. Polycystic kidney disease, autosomal dominant. In: Pagon RA, Adam MP, Bird TD, et al, editors. GeneReviews. Seattle, WA: University of Washington, Seattle; 1993–2014.
- Grantham JJ. Clinical practice. Autosomal dominant polycystic kidney disease. N Engl J Med 2008; 359:1477–1485.
- Peters DJ, Spruit L, Saris JJ, et al. Chromosome 4 localization of a second gene for autosomal dominant polycystic kidney disease. Nat Genet 1993; 5:359–362.
- Rossetti S, Consugar MB, Chapman AB, et al; CRISP Consortium. Comprehensive molecular diagnostics in autosomal dominant polycystic kidney disease. J Am Soc Nephrol 2007; 18:2143–2160.
- Levine E, Grantham JJ. Perinephric hemorrhage in autosomal dominant polycystic kidney disease: CT and MR findings. J Comput Assist Tomogr 1987; 11:108–111.
- Delaney VB, Adler S, Bruns FJ, Licinia M, Segel DP, Fraley DS. Autosomal dominant polycystic kidney disease: presentation, complications, and prognosis. Am J Kidney Dis 1985; 5:104–111.
A 59-year-old man with autosomal dominant polycystic kidney disease (ADPKD), end-stage renal disease on hemodialysis, hypertension, and diverticulosis presented with acute pain in the left lower abdomen. The pain began 4 days previously, was dull and nonradiating, was relieved partially with hydrocodone-acetaminophen, and had no clear exacerbating factors. Two days before presentation, he developed a fever with chills. He reported no recent dysuria, diarrhea, hematuria, hematochezia, or melena. He had not been taking anticoagulants or nonsteroidal anti-inflammatory drugs, and he had no history of heavy lifting or trauma.
His temperature was 38.5˚C (101.3˚F), blood pressure 141/60 mm Hg (normal for this patient). On examination, his left lower quadrant was tender with voluntary guarding. Also present was a reducible ventral hernia, which was not new.
His hemoglobin level was 10.6 g/dL (reference range 13.0–17.0), which had dropped from a previous value of 13.7 g/dL.
Computed tomography of the abdomen and pelvis revealed a ruptured retroperitoneal hemorrhagic cyst (Figure 1) in the inferior aspect of the left kidney extending into the fascia of Gerota.
Since his vital signs were stable, he was managed supportively during his hospitalization with intravenous fluids, serial hemoglobin checks, and analgesia. He was eventually discharged home in good condition.
CYST HEMORRHAGE IN POLYCYSTIC KIDNEY DISEASE
ADPKD is a relatively common, inherited systemic disease that leads to cyst formation, primarily in the kidneys but also in the liver (94%), seminal vesicles (40%), pancreas (9%), arachnoid membrane (8%), and spinal meningeal area (2%).1
In addition to cyst formation in multiple organs, ADPKD can have extrarenal manifestations such as connective-tissue abnormalities (including mitral valve prolapse) (25%), abdominal hernia (10%), and intracranial aneurysm (8%).1 Management of extrarenal complications of ADPKD is discussed in detail elsewhere.2
The estimated prevalence of ADPKD is 1 of every 400 to 1,000 live births. However, given that ADPKD is often clinically silent, it is diagnosed during the lifetime of fewer than half of people who have it.3
Most ADPKD cases are caused by mutations in either the PKD1 or PKD2 gene.4,5 Although the mechanism of cyst formation in ADPKD is still unclear, it is known that PKD1 and PKD2 encode proteins called polycystin-1 and polycystin-2, respectively. Polycystin-1 is a membrane protein found in renal tubular epithelia, hepatic bile ductules, and pancreatic ducts. Polycystin-2 is involved in cell calcium signaling and has been identified in the renal distal tubules, collecting duct, and thick ascending limb. Mutations in PKD1 and PKD2 are thought to contribute to cyst formation, with PKD1 mutations associated with earlier onset and more severe development of renal and extrarenal cysts.
Cyst hemorrhage
Hemorrhage of renal cysts is a well-known complication, occurring in up to 70% of patients with ADPKD.6 Renal cyst hemorrhage often presents clinically as flank pain with point tenderness or hematuria, or both. Flank pain results from hemorrhage into a cyst with consequent distention of the renal capsule, whereas hematuria results from rupture of a cyst into the collecting system.
Spontaneous nonfatal retroperitoneal cyst hemorrhage, as in our patient, is rare. Indeed, in one series reviewing the abdominal computed tomographic findings of 66 patients with ADPKD, only 2 patients (3%) had perinephric hematomas in the absence of recent trauma.6
Management of cyst hemorrhage is primarily conservative. Pain associated with cyst hemorrhage is managed conservatively with bed rest, intravenous hydration, and analgesics (but not nonsteroidal anti-inflammatory drugs).
Hematuria is also managed conservatively with bedrest and intravenous hydration, and most episodes of hematuria are self-limiting and last 2 to 7 days. However, if excessive bleeding occurs, the patient may be at risk of urinary tract obstruction from clot formation. If obstruction occurs and persists beyond 2 weeks, then ureteral stenting may be necessary. In rare cases of prolonged, severe bleeding with extensive subcapsular or retroperitoneal hematomas, patients require hospitalization, transfusion, or percutaneous transcatheter embolization of the renal artery. If such efforts are not successful, surgery, including nephrectomy, may be required to control the hemorrhage.2
Other causes of abdominal pain
In addition to renal cyst hemorrhage, the differential diagnosis of abdominal pain in a patient with ADPKD includes cyst enlargement causing stretching of the renal capsule or traction on the renal pedicle, cyst infection, nephrolithiasis, pyelonephritis, and rarely, tumors including renal cell carcinoma.
Unlike cyst rupture and hemorrhage, which are associated with point tenderness, cyst infection often manifests as diffuse, usually unilateral flank pain with associated fever, nausea, malaise, and leukocytosis. Our patient had none of these except for fever, which can also occur in cyst hemorrhage.
Nephrolithiasis occurs in up to 35% of patients with ADPKD,7 but no kidney stones were seen on computed tomography in our patient.
Pyelonephritis was unlikely in our patient, given that he had no significant white blood cells in his urinalysis and no leukocytosis.
Abdominal and pelvic imaging did not reveal any tumors in our patient.
- Pirson Y. Extrarenal manifestations of autosomal dominant polycystic kidney disease. Adv Chronic Kidney Dis 2010; 17:173–180.
- Harris PC, Torres VE. Polycystic kidney disease, autosomal dominant. In: Pagon RA, Adam MP, Bird TD, et al, editors. GeneReviews. Seattle, WA: University of Washington, Seattle; 1993–2014.
- Grantham JJ. Clinical practice. Autosomal dominant polycystic kidney disease. N Engl J Med 2008; 359:1477–1485.
- Peters DJ, Spruit L, Saris JJ, et al. Chromosome 4 localization of a second gene for autosomal dominant polycystic kidney disease. Nat Genet 1993; 5:359–362.
- Rossetti S, Consugar MB, Chapman AB, et al; CRISP Consortium. Comprehensive molecular diagnostics in autosomal dominant polycystic kidney disease. J Am Soc Nephrol 2007; 18:2143–2160.
- Levine E, Grantham JJ. Perinephric hemorrhage in autosomal dominant polycystic kidney disease: CT and MR findings. J Comput Assist Tomogr 1987; 11:108–111.
- Delaney VB, Adler S, Bruns FJ, Licinia M, Segel DP, Fraley DS. Autosomal dominant polycystic kidney disease: presentation, complications, and prognosis. Am J Kidney Dis 1985; 5:104–111.
Joint pain in a man with lung cancer
A 46-year-old man with a 50-pack-year smoking history, hepatitis C, and polysubstance abuse presented with worsening joint pain over the past 2 months involving both knees, ankles, wrists, and hands. On examination, along with clubbing of the fingers and toes, he had tenderness and restriction in range of motion in all the affected joints. A fixed, nontender, hard mass was noted in the left axilla extending into the infraclavicular and supraclavicular regions.
Computed tomography (CT) with contrast revealed a mass in the left upper lobe of the lung, eroding the ribs and extending into the axilla, consistent with a suspected diagnosis of lung cancer (Figure 1). Radiography of the hands and feet showed thickening of the periosteal membrane and periosteal formation of new bone (Figure 2). A bone scan revealed diffuse increased uptake in the affected joints with no metastases (Figure 3). A workup for brain and adrenal metastases was negative. CT-guided needle biopsy confirmed adenocarcinoma of the lung.
The final diagnosis was hypertrophic pulmonary osteoarthropathy (HPOA) secondary to stage IIIB: T4N2M0 adenocarcinoma of the lung. Resection of the lung mass was deemed difficult, so the patient was scheduled for neoadjuvant concurrent chemoradiation therapy before resection. Ibuprofen and intravenous pamidronate provided symptom relief.
HYPERTROPHIC PULMONARY OSTEOARTHROPATHY
HPOA is characterized by abnormal proliferation of the skin and periosteal formation of new bone at the distal ends of long bones, metatarsals, metacarpals, and proximal phalanges.
Primary HPOA is genetically inherited and accounts for 5% of cases, while secondary HPOA, accounting for the other 95%, is a paraneoplastic syndrome.1 Secondary HPOA is most commonly associated with lung cancer, usually stage III or IV adenocarcinoma.1 However, only 1% of lung cancer patients develop HPOA.1
Other conditions linked to secondary HPOA are mesothelioma, renal cell carcinoma, gastrointestinal cancers, melanoma, thymic cancer, nasopharyngeal cancers, and Hodgkin lymphoma. HPOA is also associated with pulmonary infection, cystic fibrosis, and right-to-left cardiac shunt. Risk factors associated with secondary HPOA are smoking, male sex, and age greater than 55.
Patients often present with unremitting pain, edema, and erythema in the extremities. Radiography reveals periosteal membrane thickening and periosteal new bone formation.1 Findings on bone scintigraphy that confirm the diagnosis include diffuse increased uptake and bracelet-like uptake.
The prognosis and treatment of secondary HPOA are directly related to the underlying disease. Symptoms can be relieved with nonsteroidal anti-inflammatory drugs, bisphosphonates, and octreotide. Unilateral vagotomy is an option in refractory cases.1,2
- Ito T, Goto K, Yoh K, et al. Hypertrophic pulmonary osteoarthropathy as a paraneoplastic manifestation of lung cancer. J Thorac Oncol 2010; 5:976–980.
- Davis MC, Sherry V. Hypertrophic osteoarthropathy as a clinical manifestation of lung cancer. Clin J Oncol Nurs 2011; 15:561–563.
A 46-year-old man with a 50-pack-year smoking history, hepatitis C, and polysubstance abuse presented with worsening joint pain over the past 2 months involving both knees, ankles, wrists, and hands. On examination, along with clubbing of the fingers and toes, he had tenderness and restriction in range of motion in all the affected joints. A fixed, nontender, hard mass was noted in the left axilla extending into the infraclavicular and supraclavicular regions.
Computed tomography (CT) with contrast revealed a mass in the left upper lobe of the lung, eroding the ribs and extending into the axilla, consistent with a suspected diagnosis of lung cancer (Figure 1). Radiography of the hands and feet showed thickening of the periosteal membrane and periosteal formation of new bone (Figure 2). A bone scan revealed diffuse increased uptake in the affected joints with no metastases (Figure 3). A workup for brain and adrenal metastases was negative. CT-guided needle biopsy confirmed adenocarcinoma of the lung.
The final diagnosis was hypertrophic pulmonary osteoarthropathy (HPOA) secondary to stage IIIB: T4N2M0 adenocarcinoma of the lung. Resection of the lung mass was deemed difficult, so the patient was scheduled for neoadjuvant concurrent chemoradiation therapy before resection. Ibuprofen and intravenous pamidronate provided symptom relief.
HYPERTROPHIC PULMONARY OSTEOARTHROPATHY
HPOA is characterized by abnormal proliferation of the skin and periosteal formation of new bone at the distal ends of long bones, metatarsals, metacarpals, and proximal phalanges.
Primary HPOA is genetically inherited and accounts for 5% of cases, while secondary HPOA, accounting for the other 95%, is a paraneoplastic syndrome.1 Secondary HPOA is most commonly associated with lung cancer, usually stage III or IV adenocarcinoma.1 However, only 1% of lung cancer patients develop HPOA.1
Other conditions linked to secondary HPOA are mesothelioma, renal cell carcinoma, gastrointestinal cancers, melanoma, thymic cancer, nasopharyngeal cancers, and Hodgkin lymphoma. HPOA is also associated with pulmonary infection, cystic fibrosis, and right-to-left cardiac shunt. Risk factors associated with secondary HPOA are smoking, male sex, and age greater than 55.
Patients often present with unremitting pain, edema, and erythema in the extremities. Radiography reveals periosteal membrane thickening and periosteal new bone formation.1 Findings on bone scintigraphy that confirm the diagnosis include diffuse increased uptake and bracelet-like uptake.
The prognosis and treatment of secondary HPOA are directly related to the underlying disease. Symptoms can be relieved with nonsteroidal anti-inflammatory drugs, bisphosphonates, and octreotide. Unilateral vagotomy is an option in refractory cases.1,2
- Ito T, Goto K, Yoh K, et al. Hypertrophic pulmonary osteoarthropathy as a paraneoplastic manifestation of lung cancer. J Thorac Oncol 2010; 5:976–980.
- Davis MC, Sherry V. Hypertrophic osteoarthropathy as a clinical manifestation of lung cancer. Clin J Oncol Nurs 2011; 15:561–563.
- Ito T, Goto K, Yoh K, et al. Hypertrophic pulmonary osteoarthropathy as a paraneoplastic manifestation of lung cancer. J Thorac Oncol 2010; 5:976–980.
- Davis MC, Sherry V. Hypertrophic osteoarthropathy as a clinical manifestation of lung cancer. Clin J Oncol Nurs 2011; 15:561–563.
Short and sweet: Writing better consult notes in the era of the electronic medical record
After 4 decades of clinical practice in a teaching hospital, I believe that the notes we write to document medical consultations are too long. When I review them for my own patients, the only part I read is the consultant’s assessment and diagnostic and therapeutic recommendations. Many of my colleagues and trainees do the same.
In the old days, when medical records were handwritten, the first three pages of my hospital’s four-page consultation form were for the history, review of systems, physical examination, and test results. The top two-thirds of the last page was for diagnostic impressions and recommendations for additional testing and treatment, to be completed by the trainee performing the consultation.
This left only the bottom third of this page for attestation and additional remarks from the senior consultant. Often, this last (but most used) page was just a bullet list of diagnostic possibilities and suggested tests and treatments, with nothing about the critical reasoning underlying the differential diagnosis and recommendations. This was probably the result of fatigue from having to fill in the first three pages by hand, and then having only limited space on the final page.
Even though the written record has been replaced by the electronic medical record in my hospital, consult notes continue to be at least as long as before, without any change in the length of the assessment and recommendations section. I would guess this is true in most institutions and practices that have switched to an electronic record system.
WHY ARE CONSULT NOTES SO LONG?
The main factor contributing to the lengthy consultation document is that the Center for Medicare and Medicaid Services, with other third-party payers following suit, ties the level of reimbursement to detailed documentation of the history (present, past medical, past surgical, medications, allergies, social, and family), review of systems, and physical examination in the consultation.1 Physicians are under constant pressure from professional fee-coders to meet these requirements.
Since most of this information is already in the medical record, to require that it be documented again in the consultation note is unnecessary duplication. I believe that consultants comply with this requirement mainly to ensure adequate reimbursement, even though they know that the referring medical team will probably not read the repeated information.
Electronic medical record systems, which focus disproportionately on meeting insurers’ requirements governing reimbursement,2–5 have made it easier to create a lengthy consult note by checking boxes in templates and copying and pasting from other parts of the electronic record.2,6–12 Although verbatim copying and pasting may result in punitive audits by insurers, this practice remains common,13 including, in my experience, in consultations.
WHAT ARE THE NEGATIVE EFFECTS OF A NEEDLESSLY LONG CONSULT NOTE?
Time spent on repeating information—even if less time is required when using an electronic system—is clearly time wasted, since this part of the consult note is hardly ever read. Equally bad, the assessment and recommendations section in consult notes continues to be very short, probably because long-standing physician practices change slowly.
An ideal consult note has been described as one that, in addition to addressing the patient care issues, is as brief as possible, avoids duplication of already documented information, and has educational value to the person requesting it.14,15 The educational value of the consultation is especially important in teaching hospitals.
If the only part of the consultation perused in depth consists merely of lists of diagnoses, recommended tests, and therapy and does not include the consultant’s critical reasoning underlying them, the educational value of the consultation is lost.
HOW CAN THE FORMAT BE MADE SHORTER, YET MORE USEFUL?
The note should begin by briefly documenting the reason the consultation was requested. Ideally, institutions should train their staff to state this very specifically. For example, instead of “clearance for surgery,” it is better to ask, “Please identify risks involved in proposed surgery and suggest ways to reduce them.” The former steers the consultant to merely say “cleared for surgery, but with increased risk,” whereas the latter ensures a more specific and detailed response.
The consulting team must review in detail and verify the accuracy of all available information in the patient’s record. Once this is done, instead of repeating it, a statement that all existing information has been thoroughly reviewed should suffice, with mention in a separate paragraph of only the additional relevant positive or negative points in the history related to the issue the consultant has been asked to address.
The consultant shares with all users of the medical record the responsibility of pointing out and correcting any errors in the previously recorded information, thereby decreasing perpetuation of erroneous “chart lore,” an undesirable consequence of copying and pasting. If only previously unrecorded data and corrections to existing information are documented, the referring team is more likely to read the note because it points out relevant information that has been overlooked.
The main part of the document should consist of a detailed assessment and recommendations section, which should include not only a list of diagnoses and recommendations for testing and treatment, but also the consultant’s reasoning behind them, the results of tests already obtained that support the consultant’s conclusions, and information of value for teaching and cost-effective practice. A critically reasoned assessment and recommendation section not only will prove very educational, but by challenging the consultant to justify his or her choices, may discourage unnecessary testing and questionable therapy4,14 and thereby contribute to cost-saving.
My suggestions would not shorten the time spent by the consulting team in evaluating the patient, but only eliminate redundant documentation. I believe the consultation document will be shorter but adequate for patient care, the referring team will read and use the entire document, its educational value will be enhanced, and the time spent on redundant documentation will be saved.
A CASE VIGNETTE
The following vignette (from my own subspecialty) of a patient with acute kidney injury illustrates how a consult note can be made shorter but more useful and educational.
A 78-year-old man had a history of long-standing insulin-requiring diabetes mellitus, hypertension (treated with lisinopril and amlodipine), and benign prostatic hypertrophy. One month earlier, his blood urea nitrogen level had been 15 mg/dL and his serum creatinine had been 1.2 mg/dL.
He presented with a 3-day history of vomiting, diarrhea, and fever, presumed to be viral gastroenteritis. His blood urea nitrogen level was 100 mg, serum creatinine 2.5 mg, and blood glucose 450 mg/dL. Urinalysis revealed 2+ albuminuria, 3+ glucosuria, and 6 red blood cells per high-power field.
In the emergency department he received 2 L of normal saline and regular insulin intravenously, and an indwelling bladder catheter was inserted. He was admitted after 6 hours.
Tests obtained on arrival on the inpatient floor revealed a urinary fractional excretion of sodium of 2.5% and a blood glucose level of 295 mg/dL. His admission history and physical listed his home medications as insulin glargine, amlodipine, lisinopril, and tamsulosin. It also listed the differential diagnosis for acute kidney injury as:
- Prerenal azotemia due to volume depletion
- Rapidly progressive glomerulonephritis to be ruled out in view of proteinuria and microhematuria
- Obstructive uropathy to be ruled out.
Ultrasonography the morning after admission showed normal kidneys and no hydronephrosis. The absence of hydronephrosis was interpreted by the primary team as ruling out obstruction secondary to benign prostatic hypertrophy. The nephrology team saw the patient in consultation the day after admission and discovered the following additional information: urinalysis done 6 months earlier had also shown albuminuria and microhematuria, and the patient had been taking over-the-counter ibuprofen 400 mg three times daily for several days prior to admission.
Table 1 compares consultation documentation in the usual format and in the format I am suggesting. The revised format has much more information of educational value (eg, the importance of reviewing past urinalysis results, asking about over-the-counter medications, factors affecting fractional excretion of sodium, effect of bladder catheterization on hydronephrosis due to benign prostatic hypertrophy, and measuring urine protein only after acute kidney injury resolves). It also encourages cost-effective care (ultrasonography could have been delayed or avoided, and the patient could have been cautioned about ibuprofen-like drugs to decrease the risk of recurrent acute kidney injury).
FINAL THOUGHTS
The modifications I have suggested in consult notes will be accepted only if they are reimbursement-neutral. I hope insurers will not equate a shorter note with an opportunity to lower reimbursement and will see the value in not paying for things almost never read. I hope they will recognize and pay for the effort that went into creating a shorter document that contributes adequately to patient care, provides greater educational value, and may promote cost-effective medical practice. Also, not requiring redundant documentation may reduce or even eliminate undesirable copying and pasting.
Accountable-care organizations are an important part of the Affordable Care Act,16 which went into effect in 2014. Many organizations had already come into existence in the United States before the act became effective, and their numbers and the number of patients covered by them are projected to grow enormously over the next few years.17
Since the accountable-care organization model will rely heavily on capitated reimbursement to contain costs, these organizations are likely to scrutinize and curtail the use of consultations. I believe that a shorter consultation note—yet one that is more useful for patient care, education, and cost-containment—is more likely to pass such scrutiny, especially if it decreases time spent on documentation. Furthermore, unlike the fee-for-service model, in a capitated-payment system it may not be necessary to lengthen consultation documentation just to ensure adequate reimbursement.
- Department of Health and Human Services; Office of Inspector General. Consultations in Medicare: coding and reimbursement. http://oig.hhs.gov/oei/reports/oei-09-02-00030.pdf. Accessed November 24, 2014.
- Hartzband P, Groopman J. Off the record—avoiding the pitfalls of going electronic. N Engl J Med 2008; 358:1656–1658.
- O’Malley AS, Grossman JM, Cohen GR, Kemper NM, Pham HH. Are electronic medical records helpful for care coordination? Experiences of physician practices. J Gen Intern Med 2010; 25:177–185.
- The Center for Public Integrity; Schulte F. Electronic medical records probed for over-billing. Critics question credibility of federal panel charged with investigating. www.publicintegrity.org/2013/02/14/12208/electronic-medical-records-probed-over-billing. Accessed November 24, 2014.
- Li B. Cracking the codes: do electronic medical records facilitate hospital revenue enhancement? www.kellogg.northwestern.edu/faculty/b-li/JMP.pdf. Accessed November 24, 2014.
- Hirschtick RE. A piece of my mind. Copy-and-paste. JAMA 2006; 295:2335–2336.
- Thielke S, Hammond K, Helbig S. Copying and pasting of examinations within the electronic medical record. Int J Med Inform 2007; 76(suppl 1):S122–S128.
- Hanlon JT. The electronic medical record: diving into a shallow pool? Cleve Clin J Med 2010; 77:408–411.
- Fitzgerald FT. The emperor’s new clothes. Ann Intern Med 2012; 156:396–397.
- Bernat JL. Ethical and quality pitfalls in electronic health records. Neurology 2013; 80:1057–1061.
- Thornton JD, Schold JD, Venkateshaiah L, Lander B. Prevalence of copied information by attendings and residents in critical care progress notes. Crit Care Med 2013; 41:382–388.
- Foote RS. The challenge to the medical record. JAMA Intern Med 2013; 173:1171–1172.
- Tamburello LM. The road to EMR noncompliance and fraud is paved with cut and paste. MD Advis 2013; 6:24–30.
- Goldman L, Lee T, Rudd P. Ten commandments for effective consultations. Arch Intern Med 1983; 143:1753–1755.
- Salerno SM, Hurst FP, Halvorson S, Mercado DL. Principles of effective consultation: an update for the 21st-century consultant. Arch Intern Med 2007; 167:271–275.
- Longworth DL. Accountable care organizations, the patient-centered medical home, and health care reform: what does it all mean? Cleve Clin J Med 2011; 78:571–582.
- Meyer H. Many accountable care organizations are now up and running, if not off to the races. Health Aff (Millwood) 2012; 31:2363–2367.
After 4 decades of clinical practice in a teaching hospital, I believe that the notes we write to document medical consultations are too long. When I review them for my own patients, the only part I read is the consultant’s assessment and diagnostic and therapeutic recommendations. Many of my colleagues and trainees do the same.
In the old days, when medical records were handwritten, the first three pages of my hospital’s four-page consultation form were for the history, review of systems, physical examination, and test results. The top two-thirds of the last page was for diagnostic impressions and recommendations for additional testing and treatment, to be completed by the trainee performing the consultation.
This left only the bottom third of this page for attestation and additional remarks from the senior consultant. Often, this last (but most used) page was just a bullet list of diagnostic possibilities and suggested tests and treatments, with nothing about the critical reasoning underlying the differential diagnosis and recommendations. This was probably the result of fatigue from having to fill in the first three pages by hand, and then having only limited space on the final page.
Even though the written record has been replaced by the electronic medical record in my hospital, consult notes continue to be at least as long as before, without any change in the length of the assessment and recommendations section. I would guess this is true in most institutions and practices that have switched to an electronic record system.
WHY ARE CONSULT NOTES SO LONG?
The main factor contributing to the lengthy consultation document is that the Center for Medicare and Medicaid Services, with other third-party payers following suit, ties the level of reimbursement to detailed documentation of the history (present, past medical, past surgical, medications, allergies, social, and family), review of systems, and physical examination in the consultation.1 Physicians are under constant pressure from professional fee-coders to meet these requirements.
Since most of this information is already in the medical record, to require that it be documented again in the consultation note is unnecessary duplication. I believe that consultants comply with this requirement mainly to ensure adequate reimbursement, even though they know that the referring medical team will probably not read the repeated information.
Electronic medical record systems, which focus disproportionately on meeting insurers’ requirements governing reimbursement,2–5 have made it easier to create a lengthy consult note by checking boxes in templates and copying and pasting from other parts of the electronic record.2,6–12 Although verbatim copying and pasting may result in punitive audits by insurers, this practice remains common,13 including, in my experience, in consultations.
WHAT ARE THE NEGATIVE EFFECTS OF A NEEDLESSLY LONG CONSULT NOTE?
Time spent on repeating information—even if less time is required when using an electronic system—is clearly time wasted, since this part of the consult note is hardly ever read. Equally bad, the assessment and recommendations section in consult notes continues to be very short, probably because long-standing physician practices change slowly.
An ideal consult note has been described as one that, in addition to addressing the patient care issues, is as brief as possible, avoids duplication of already documented information, and has educational value to the person requesting it.14,15 The educational value of the consultation is especially important in teaching hospitals.
If the only part of the consultation perused in depth consists merely of lists of diagnoses, recommended tests, and therapy and does not include the consultant’s critical reasoning underlying them, the educational value of the consultation is lost.
HOW CAN THE FORMAT BE MADE SHORTER, YET MORE USEFUL?
The note should begin by briefly documenting the reason the consultation was requested. Ideally, institutions should train their staff to state this very specifically. For example, instead of “clearance for surgery,” it is better to ask, “Please identify risks involved in proposed surgery and suggest ways to reduce them.” The former steers the consultant to merely say “cleared for surgery, but with increased risk,” whereas the latter ensures a more specific and detailed response.
The consulting team must review in detail and verify the accuracy of all available information in the patient’s record. Once this is done, instead of repeating it, a statement that all existing information has been thoroughly reviewed should suffice, with mention in a separate paragraph of only the additional relevant positive or negative points in the history related to the issue the consultant has been asked to address.
The consultant shares with all users of the medical record the responsibility of pointing out and correcting any errors in the previously recorded information, thereby decreasing perpetuation of erroneous “chart lore,” an undesirable consequence of copying and pasting. If only previously unrecorded data and corrections to existing information are documented, the referring team is more likely to read the note because it points out relevant information that has been overlooked.
The main part of the document should consist of a detailed assessment and recommendations section, which should include not only a list of diagnoses and recommendations for testing and treatment, but also the consultant’s reasoning behind them, the results of tests already obtained that support the consultant’s conclusions, and information of value for teaching and cost-effective practice. A critically reasoned assessment and recommendation section not only will prove very educational, but by challenging the consultant to justify his or her choices, may discourage unnecessary testing and questionable therapy4,14 and thereby contribute to cost-saving.
My suggestions would not shorten the time spent by the consulting team in evaluating the patient, but only eliminate redundant documentation. I believe the consultation document will be shorter but adequate for patient care, the referring team will read and use the entire document, its educational value will be enhanced, and the time spent on redundant documentation will be saved.
A CASE VIGNETTE
The following vignette (from my own subspecialty) of a patient with acute kidney injury illustrates how a consult note can be made shorter but more useful and educational.
A 78-year-old man had a history of long-standing insulin-requiring diabetes mellitus, hypertension (treated with lisinopril and amlodipine), and benign prostatic hypertrophy. One month earlier, his blood urea nitrogen level had been 15 mg/dL and his serum creatinine had been 1.2 mg/dL.
He presented with a 3-day history of vomiting, diarrhea, and fever, presumed to be viral gastroenteritis. His blood urea nitrogen level was 100 mg, serum creatinine 2.5 mg, and blood glucose 450 mg/dL. Urinalysis revealed 2+ albuminuria, 3+ glucosuria, and 6 red blood cells per high-power field.
In the emergency department he received 2 L of normal saline and regular insulin intravenously, and an indwelling bladder catheter was inserted. He was admitted after 6 hours.
Tests obtained on arrival on the inpatient floor revealed a urinary fractional excretion of sodium of 2.5% and a blood glucose level of 295 mg/dL. His admission history and physical listed his home medications as insulin glargine, amlodipine, lisinopril, and tamsulosin. It also listed the differential diagnosis for acute kidney injury as:
- Prerenal azotemia due to volume depletion
- Rapidly progressive glomerulonephritis to be ruled out in view of proteinuria and microhematuria
- Obstructive uropathy to be ruled out.
Ultrasonography the morning after admission showed normal kidneys and no hydronephrosis. The absence of hydronephrosis was interpreted by the primary team as ruling out obstruction secondary to benign prostatic hypertrophy. The nephrology team saw the patient in consultation the day after admission and discovered the following additional information: urinalysis done 6 months earlier had also shown albuminuria and microhematuria, and the patient had been taking over-the-counter ibuprofen 400 mg three times daily for several days prior to admission.
Table 1 compares consultation documentation in the usual format and in the format I am suggesting. The revised format has much more information of educational value (eg, the importance of reviewing past urinalysis results, asking about over-the-counter medications, factors affecting fractional excretion of sodium, effect of bladder catheterization on hydronephrosis due to benign prostatic hypertrophy, and measuring urine protein only after acute kidney injury resolves). It also encourages cost-effective care (ultrasonography could have been delayed or avoided, and the patient could have been cautioned about ibuprofen-like drugs to decrease the risk of recurrent acute kidney injury).
FINAL THOUGHTS
The modifications I have suggested in consult notes will be accepted only if they are reimbursement-neutral. I hope insurers will not equate a shorter note with an opportunity to lower reimbursement and will see the value in not paying for things almost never read. I hope they will recognize and pay for the effort that went into creating a shorter document that contributes adequately to patient care, provides greater educational value, and may promote cost-effective medical practice. Also, not requiring redundant documentation may reduce or even eliminate undesirable copying and pasting.
Accountable-care organizations are an important part of the Affordable Care Act,16 which went into effect in 2014. Many organizations had already come into existence in the United States before the act became effective, and their numbers and the number of patients covered by them are projected to grow enormously over the next few years.17
Since the accountable-care organization model will rely heavily on capitated reimbursement to contain costs, these organizations are likely to scrutinize and curtail the use of consultations. I believe that a shorter consultation note—yet one that is more useful for patient care, education, and cost-containment—is more likely to pass such scrutiny, especially if it decreases time spent on documentation. Furthermore, unlike the fee-for-service model, in a capitated-payment system it may not be necessary to lengthen consultation documentation just to ensure adequate reimbursement.
- Department of Health and Human Services; Office of Inspector General. Consultations in Medicare: coding and reimbursement. http://oig.hhs.gov/oei/reports/oei-09-02-00030.pdf. Accessed November 24, 2014.
- Hartzband P, Groopman J. Off the record—avoiding the pitfalls of going electronic. N Engl J Med 2008; 358:1656–1658.
- O’Malley AS, Grossman JM, Cohen GR, Kemper NM, Pham HH. Are electronic medical records helpful for care coordination? Experiences of physician practices. J Gen Intern Med 2010; 25:177–185.
- The Center for Public Integrity; Schulte F. Electronic medical records probed for over-billing. Critics question credibility of federal panel charged with investigating. www.publicintegrity.org/2013/02/14/12208/electronic-medical-records-probed-over-billing. Accessed November 24, 2014.
- Li B. Cracking the codes: do electronic medical records facilitate hospital revenue enhancement? www.kellogg.northwestern.edu/faculty/b-li/JMP.pdf. Accessed November 24, 2014.
- Hirschtick RE. A piece of my mind. Copy-and-paste. JAMA 2006; 295:2335–2336.
- Thielke S, Hammond K, Helbig S. Copying and pasting of examinations within the electronic medical record. Int J Med Inform 2007; 76(suppl 1):S122–S128.
- Hanlon JT. The electronic medical record: diving into a shallow pool? Cleve Clin J Med 2010; 77:408–411.
- Fitzgerald FT. The emperor’s new clothes. Ann Intern Med 2012; 156:396–397.
- Bernat JL. Ethical and quality pitfalls in electronic health records. Neurology 2013; 80:1057–1061.
- Thornton JD, Schold JD, Venkateshaiah L, Lander B. Prevalence of copied information by attendings and residents in critical care progress notes. Crit Care Med 2013; 41:382–388.
- Foote RS. The challenge to the medical record. JAMA Intern Med 2013; 173:1171–1172.
- Tamburello LM. The road to EMR noncompliance and fraud is paved with cut and paste. MD Advis 2013; 6:24–30.
- Goldman L, Lee T, Rudd P. Ten commandments for effective consultations. Arch Intern Med 1983; 143:1753–1755.
- Salerno SM, Hurst FP, Halvorson S, Mercado DL. Principles of effective consultation: an update for the 21st-century consultant. Arch Intern Med 2007; 167:271–275.
- Longworth DL. Accountable care organizations, the patient-centered medical home, and health care reform: what does it all mean? Cleve Clin J Med 2011; 78:571–582.
- Meyer H. Many accountable care organizations are now up and running, if not off to the races. Health Aff (Millwood) 2012; 31:2363–2367.
A new year and a new face for www.ccjm.org

Bob Dylan’s song “The Times They Are a-Changin’” was released in January 1964. As with many things Dylan, the song’s true intent is a bit unclear, but it remains one of the most invoked lyrical symbols of change 51 years later. In 2015, the Journal, planning to “heed the call,” is changing its online visage. I hope that our intent will not be viewed as unclear.
Our mission is unchanged: to provide our readers with free access to credible, relevant, readable information, and the opportunity to earn free CME credit. So why change the website? Innovations in digital publishing, the ability to offer a broader landscape of medical information—and the chance to more effectively solicit advertising to pay for it all—prompted us to collaborate with another publisher, Frontline Medical Communications.
Frontline describes itself as health care’s largest medical communications company and as a leader in digital, print, and live events. You likely have encountered their products, which include Internal Medicine News, Cardiology News, and Clinical Endocrinology News, and CME courses such as Perspectives in Rheumatic Diseases, which I codirect. Our collaboration will allow us to offer you links to new and, we hope, interesting material. For example, our online readers will have access to MD-IQ, a popular interactive self-test, as well as brief reports and timely commentaries from specialty scientific meetings.
But even though www.ccjm.org has a new look, everything on it remains open to all and free of charge. You will still have easy access to other educational and clinical information offered by Cleveland Clinic, including information about Clinic authors. At your first visit to our revamped site you will be asked to register, but your subsequent visits will be unencumbered except for a request to sign in using your e-mail address if you log in from a different device. The e-mail address is used for identification purposes only, as site sponsors want to know the (depersonalized) demographics of our readership. You will receive occasional e-mails with links to clinical content that may interest you. If you do not wish to receive these e-mails, just follow the instructions to opt out of them. Our goal is to be unobtrusive.
Our free CME process is the same. Each CME article includes a link to the Cleveland Clinic Center for Continuing Education site with instructions on how to complete the activity. Plus, the CME pull-down menu at the top of our home page will provide easy access to all currently active journal CME offerings. We hope the transition glitches will be few and the benefits many. And the option remains for you to read, download, and print our articles in PDF format, just as you always have.
As we start the new year, we at the Journal wish you our readers a happy, healthy, peaceful, and educational 2015.
David Henry's JCSO podcast, December 2014
In his monthly podcast for The Journal of Community and Supportive Oncology, Dr David Henry discusses articles on the recent approval of ramucirumab for advanced gastric or GEJ adenocarcinoma in previously treated patients with disease progression and the “small victories” in honing new therapies for hard-to-treat cancers such as ovarian, melanoma, and pancreatic. Quality of care and patient quality of life are the basis for the 3 Original Reports that Dr Henry addresses: one study looks at the impact of patient navigation on diagnostic resolution in women with abnormal screenings for breast or cervical cancer; a second examines how the information and communication needs of Chinese American women with breast cancer can be channeled into improving quality of life after treatment for cancer; and a third reports on how dignity therapy as an intervention in patients with advanced colorectal cancer can positively affect the quality of end-of-life care, treatment choices, and cost efficiency.
In his monthly podcast for The Journal of Community and Supportive Oncology, Dr David Henry discusses articles on the recent approval of ramucirumab for advanced gastric or GEJ adenocarcinoma in previously treated patients with disease progression and the “small victories” in honing new therapies for hard-to-treat cancers such as ovarian, melanoma, and pancreatic. Quality of care and patient quality of life are the basis for the 3 Original Reports that Dr Henry addresses: one study looks at the impact of patient navigation on diagnostic resolution in women with abnormal screenings for breast or cervical cancer; a second examines how the information and communication needs of Chinese American women with breast cancer can be channeled into improving quality of life after treatment for cancer; and a third reports on how dignity therapy as an intervention in patients with advanced colorectal cancer can positively affect the quality of end-of-life care, treatment choices, and cost efficiency.
In his monthly podcast for The Journal of Community and Supportive Oncology, Dr David Henry discusses articles on the recent approval of ramucirumab for advanced gastric or GEJ adenocarcinoma in previously treated patients with disease progression and the “small victories” in honing new therapies for hard-to-treat cancers such as ovarian, melanoma, and pancreatic. Quality of care and patient quality of life are the basis for the 3 Original Reports that Dr Henry addresses: one study looks at the impact of patient navigation on diagnostic resolution in women with abnormal screenings for breast or cervical cancer; a second examines how the information and communication needs of Chinese American women with breast cancer can be channeled into improving quality of life after treatment for cancer; and a third reports on how dignity therapy as an intervention in patients with advanced colorectal cancer can positively affect the quality of end-of-life care, treatment choices, and cost efficiency.
Extended anticoagulation offers transient benefit

SAN FRANCISCO—New research indicates that extending anticoagulant therapy to 2 years can reduce the risk of recurrent venous thromboembolism (VTE) without increasing major bleeding, but this benefit only lasts while patients are receiving the therapy.
In the PADIS-PE study, patients with a first episode of symptomatic, unprovoked pulmonary embolism (PE) received 6 months of treatment with a vitamin K antagonist (VKA), followed by 18 months of warfarin or placebo.
Patients who received warfarin had a 77% reduction in the relative risk of recurrent VTE or major bleeding while they received treatment. But an additional 2 years of follow-up showed that this benefit was lost once patients stopped anticoagulation.
Francis Couturaud, MD, PhD, of the Brest University Hospital Center in Brest, France, presented these data at the 2014 ASH Annual Meeting as LBA-3.*
He and his colleagues randomized patients to receive warfarin (n=184) or placebo (n=187) for 18 months after their intial VKA treatment. Patients were followed for an additional 24 months after treatment ended.
Most baseline characteristics were similar between the treatment arms, although there was a significantly higher percentage of females in the warfarin arm.
“[Overall,] the mean age was below 60, [and] the mean BMI [body mass index] was below 30,” Dr Couturaud noted. “About 4% of patients had previous cancer [that had been] resolved for more than 2 years, 8% had previous distal DVT [deep vein thrombosis] or superficial venous thrombosis, a quarter of women were on estrogen-containing pills, and about one-third had an associated proximal DVT at the time of PE diagnosis.”
“Before the randomization, the mean duration of VKA [therapy] was 6 months, and the mean percentage of time within the therapeutic range was 70. At inclusion, about one-third of patients had residual perfusion defect, about 15% had residual DVT, the mean D-dimer level was below 500 μg/L, and about 27% had thrombophilia.”
Results
The study’s primary outcome was the composite of recurrent VTE or major bleeding during the 18-month treatment period. Significantly fewer patients met this endpoint in the warfarin arm than in the placebo arm—6 (3.3%) and 25 (13.5%), respectively (hazard ratio [HR]=0.23, P=0.0004).
Likewise, the number of patients with recurrent VTE at 18 months was significantly lower in the warfarin arm than in the placebo arm—3 (1.7%) and 25 (13.5%), respectively (HR=0.11, P<0.0001).
On the other hand, there was no significant difference in the rate of major bleeding between the treatment arms at 18 months. Four patients (2.2%) had major bleeding in the warfarin arm, as did 1 (0.5%) in the placebo arm (HR=4.07, P=0.18).
At 42 months, there was no significant difference between the treatment arms with regard to the composite outcome, the rate of recurrent VTE, or the rate of major bleeding.
The composite outcome occurred in 33 (20.8%) patients in the warfarin arm and 42 (24%) in the placebo arm (HR=0.74, P=0.19). Recurrent VTE occurred in 28 (17.9%) and 39 patients (22.1%), respectively (HR=0.67, P=0.10). And major bleeding occurred in 6 (3.5%) and 5 patients (3%), respectively (HR=1.12, P=0.71).
“[E]xtending anticoagulation for 18 additional months was associated with a major relative risk reduction of 77% of recurrent VTE or major bleeding during the treatment period,” Dr Couturaud said in summary. “However, this benefit was lost during a long-term follow-up of 2 years after stopping anticoagulation.”
“In addition, recurrent VTE occurred in 80% of cases as recurrent PE and in 90% of cases as unprovoked VTE. So additional investigations are needed to identify subgroups of patients at lower risk who may not need indefinite anticoagulation.”
This study was sponsored by Brest University Hospital. Investigators received research funding from Actelion Pharmaceuticals, GlaxoSmithKline, Bristol-Myers Squibb, Boehringer Ingelheim, Sanofi, LEO Pharma, and Bayer. ![]()
*Information in the abstract differs from that presented at the meeting.
FDA releases warning about IV solutions

The US Food and Drug Administration (FDA) is alerting healthcare professionals not to use Wallcur, LLC, simulated intravenous (IV) products in human or animal patients, as the products are for training purposes only.
The FDA has become aware that some Wallcur training IV products have been distributed to healthcare facilities and administered to patients.
There have been reports of serious adverse events associated with some of these products, such as Practi IV Solution Bags.
Before administering IV solutions to patients, healthcare providers should carefully check the labels to ensure that products are not training products.
Wallcur’s training products, which may bear the words “for clinical simulation,” are not to be administered to patients.
If you suspect that any Wallcur training IV products may have been administered to a patient, whether or not the incident has resulted in an adverse event, please report the incident to the FDA’s MedWatch Adverse Event Reporting Program.
The FDA said it will continue to investigate and monitor this issue. The agency is also working with the Centers for Disease Control and Prevention to inform healthcare professionals and state health departments. ![]()
Inpatient vs Outpatient Hospitalization
Status determinations (outpatient versus inpatient) for hospitalized patients have become a routine part of patient care in the United States. Under the guidance provided by the Medicare Benefits Policy Manual, hospitalized Medicare beneficiaries are assigned 1 of these 2 statuses. The status assignment does not affect the care a patient can receive, but rather how the hospital services provided are billed to Medicare. Hospital services provided under inpatient status are billed under Medicare Part A. Hospital services provided under outpatient status, which includes all patients receiving observation services (commonly referred to as under observation), are billed under Medicare Part B. Whether hospital services are billed under Part A or Part B is important to hospitals and Medicare beneficiaries, as both the hospital reimbursement and beneficiary liability can vary greatly depending on whether services are billed under Part A versus Part B. Hospitals are generally reimbursed at a higher rate for services provided as an inpatient (Part A). The Office of the Inspector General (OIG) recently found that Medicare paid nearly three times more for a short inpatient stay than an [outpatient] stay for the same condition.[1] Medicare beneficiary liability also varies based on status. First, beneficiaries hospitalized as inpatients are subject to a deductible under Part A ($1,216 in 2014) for hospital services associated with that hospitalization and any future inpatient hospitalization beyond 60 days of discharge.[2] Beneficiaries hospitalized as outpatients are subject to the Medicare Part B deductible ($147 in 2014), and then a 20% copay on each individual outpatient hospital service, with no cumulative limit.[2, 3] In addition, hospital pharmacy charges for Medicare beneficiaries hospitalized as inpatients are covered under Medicare A. However, for Medicare patients hospitalized as outpatients, many medications are not covered by Medicare Part B benefits. Finally, time spent hospitalized as an outpatient does not count toward the Medicare 3‐day medically necessary inpatient stay requirement to qualify for the skilled nursing facility care benefit following discharge.
HISTORY AND INTENT OF INPATIENT AND OUTPATIENT STATUS DETERMINATIONS
Prior to October 1, 2013, the Centers for Medicare & Medicaid Services (CMS) stated that physician judgment and an expectation of at least an overnight hospitalization should determine inpatient status of hospitalized Medicare beneficiaries. Guidance as to when inpatient services were covered was found in the Medicare Benefits Policy Manual (MBPM)[4]:
An inpatient is a person who has been admitted to a hospital for bed occupancy for purposes of receiving inpatient hospital services. Generally, a patient is considered an inpatient if formally admitted as inpatient with the expectation that he or she will remain at least overnight and occupy a bed even though it later develops that the patient can be discharged or transferred to another hospital and not actually use a hospital bed overnight. The physician or other practitioner responsible for a patient's care at the hospital is also responsible for deciding whether the patient should be admitted as an inpatient. Physicians should use a 24‐hour period as a benchmark, i.e., they should order admission for patients who are expected to need hospital care for 24 hours or more, and treat other patients on an outpatient basis. However, the decision to admit a patient is a complex medical judgment that can be made only after the physician has considered a number of factors, including the patient's medical history and current medical needs, the types of facilities available to inpatients and to outpatients, the hospital's by‐laws and admissions policies, and the relative appropriateness of treatment in each setting.
For a subset of patients who are hospitalized under outpatient status, billing for observation services is allowed. CMS defines observation as a well defined set of services, that should last less than 24 hours and in only rare and exceptional casesspan more than 48 hours.[5] Many providers recognize the utility of a few additional hours of hospital care and/or testing in a hospital setting to determine whether a patient can go home or needs additional evaluation, monitoring, and/or treatment that can only be provided in a hospital, consistent with the CMS definition of observation.[6] It is important to note that although observation and outpatient are frequently used interchangeably, only outpatient is technically a CMS status. Patients in observation or under observation are, in fact, a subset of patients who are hospitalized under an outpatient status.
Outpatient status may also be appropriate for patients who require hospitalization for routine and expected overnight monitoring following a procedure. These patients are often not eligible for billing of observation services or as an inpatient because alternative methods of billing for the recovery time following the procedure exist. When determining the appropriate status of a Medicare beneficiary for a hospitalization following a procedure, physicians need to be aware of whether a specific procedure appears on the Medicare inpatient‐only procedures list.[7] Per CMS, procedures designated as inpatient only are reimbursed only when the patient is admitted as an inpatient at the time the procedure is performed.[8] Conversely, outpatient status for an overnight hospitalization associated with a procedure not on the inpatient‐only list is generally appropriate. Therefore, patients hospitalized for a procedure that appears on this list should always be hospitalized under inpatient status, regardless of the amount of time that the patient is expected to be hospitalized following the procedure, including those cases for which the hospitalization is expected to be only overnight.[7, 8] Only a limited number of Current Procedural Technology (CPT) codes, mostly surgical, automatically qualify for inpatient status and do not have outpatient prospective payment system eligibility. Although most procedures on the inpatient‐only list are associated with a hospitalization that commonly span at least 2 midnights, such as coronary artery bypass grafting, some potentially overnight stay cases, such as cholecystectomy (CPT 47600) appear on the 2014 inpatient‐only list.[9]
As noted above, prior to October 1, 2013, the Medicare definitions governing outpatient versus inpatient status included a 24‐hour benchmark. However, the MBPM also notes that: Admissions of particular patients are not covered or non‐covered solely on the basis of the length of time the patient actually spends in the hospital.[10]
In practice, status determination was ultimately dependent on physician or other practitioner's complex medical judgment as specified by CMS. To validate this judgment, CMS recommended that reviewers use a screening tool as part of their medical review. This screening tool could include practice guidelines that are well accepted by the medical community but did not require or identify a specific criteria set.[11] Not surprisingly, there was and continues to be great variability in the application of outpatient versus inpatient status across hospitals in actual practice.[1, 12, 13] The ambiguity in the definition of a hospitalized patient's status helped spawn commercial clinical decision tools, such as InterQual (McKesson Corporation, San Francisco, CA) and MCG (formally known as Milliman Care Guidelines; MCG Health, LLC, Seattle, WA), to help define inpatients versus outpatients.[14, 15] However, these guidelines are complex, can be difficult to interpret and apply, and have been criticized for poor predictive value and attempting to replace physician judgment.[16, 17, 18] Furthermore, CMS has never formally endorsed any specific decision tool.
INPATIENT AND OUTPATIENT PAYMENTS AND THE RECOVERY AUDIT CONTRACTOR PROGRAM
In 2000, CMS started using Ambulatory Payment Classifications for hospital services, which made inpatient care more financially favorable for hospitals. In response to concerns that hospitals would be incentivized to overuse inpatient status, CMS made a number of changes to their payment system, including the creation of the Recovery Audit Program in 2003. This program was originally called the Recovery Audit Contractor (RAC) Program and continues to be most commonly referred to as the RAC program. The RAC program, tasked with finding and correcting improper claims to the Medicare program, began as a demonstration required in the Medicare Prescription Drug Improvement and Modernization Act of 2003 (MMA), and subsequently became a nationwide audit program under the Tax Relief and Health Care Act of 2006. Under this program, private contractors review hospital and billing records of Medicare patients and are paid on a contingency fee (8%12.5%) for all underpayments and overpayments that are identified and corrected.[19] Importantly, the RACs are not subject to any financial penalties for cases improperly denied.
RACs initially targeted many overnight inpatient stays for recoupment. These cases were attractive audit targets because the RACs could argue that the inpatient hospital services were delivered in the improper status based solely on the length of stay, without having to consider in their audit the complexity of decision making or medical necessity of the services provided. However, it is worth noting that with improvement in efficiency and advancements in medical technology, hospitals and physicians have been increasingly able to safely evaluate and treat medically complex and severely ill patients quickly, sometimes with just an overnight stay. As perspective, in 1965, the average length of stay for a Medicare patient was 13 days; in 2010, it was 5.4 days, with over one‐third of hospitalizations lasting 3 days.[20]
Concurrent with the increased RAC denials for services provided in an inpatient status, the use of observation services changed significantly from 2007 to 2012. The average length of stay for Medicare patients under outpatient status with observation services exceeded 24 hours in 2007, was 28.2 hours by 2009,[21] and grew to 29 hours by 2012.[22] Between July 2010 and December 2011, at the University of Wisconsin Hospital, 1 in 6 observation stays lasted longer than 48 hours, suggesting that long observation stays were no longer rare and exceptional as stated in CMS' own definition.[23] This same University of Wisconsin study also found that observation services were not well defined, with 1141 distinct diagnosis codes used for these services.[23]
Additionally, a Medicare Payment Advisory Commission (MedPAC; described on their website,
Hospitals have also expressed concern that the RAC contingency fee payment model and a lack of penalty for improper denials promotes overzealous auditing.[24, 25] RAC recoupment has increased from approximately $939 million in 2011, to $2.4 billion in 2012, to $3.8 billion in 2013.[26, 27, 28] Given the money now at stake, it is not surprising that hospitals have become very active in appealing RAC denials. Self‐reported data submitted to the American Hospital Association (AHA) for the months January 2014 to March of 2014 show that hospitals now appeal 50% of RAC denials and win 66% of these appeals.[29] The AHA data also show that 69% of self‐reporting hospitals spent over $10,000 to manage their audit and appeals process over this same 3‐month time period, with 11% spending more than $100,000.
This appeals process is not only costly to hospitals, it is also lengthy. As of January 2014, the average wait time for an appeal hearing with an administrative law judge (level 3 appeal) exceeded 16 months.[30] In fact, the appeals process has become so backlogged that hospitals' rights to assignment of level 3 (administrative law judge) appeals have been temporarily suspended.[30] In August 2014, CMS offered a $0.68 on the dollar partial payment for hospitals willing to settle all eligible outstanding appeals in an attempt to relieve the appeals backlog.[31] In addition, the AHA currently has a suit against the US Department of Health & Human Services over the RAC appeals backlog.[32]
Increased use of outpatient status may be driven by pressures from the RAC program and, potentially, by improvements in the efficiency of care. Because hospitals are paid less for care provided under outpatient status than they are for the identical care provided under inpatient status, hospitals faced both potential financial penalty for improvements in efficiency and the threat of RAC audits.
THE 2‐MIDNIGHT RULE: A FIX?
Given the challenges in defining inpatient versus outpatient hospitalization, the increasing use of outpatient status and the increasing length of stay of outpatient hospitalizations with observation services, in 2013, CMS responded with new policies to define the visit status for hospitalized patients. On August 2, 2013, CMS announced the fiscal year 2014 hospital Inpatient Prospective Payment System final rule (IPPS‐2014) to become effective October 1, 2013. This document was formally issued as part of the Federal Register on August 19, 2013.[33] Central to the CMS IPPS‐2014 was a 2‐midnight benchmark that offered a major change in how physicians were to determine the status (inpatient vs outpatient) of hospitalized patients. With this 2‐midnight benchmark, now informally known as the 2‐midnight rule, CMS finalized its proposal to generally consider patients that are expected by a practitioner (with knowledge of the case and with admitting privileges) to need hospitalization that will span 2 or more midnights as inpatient. The IPPS‐2014 also finalized the converse of this: hospitalizations expected to span 2 midnights are to be regarded as outpatient with 2 exceptions:
- If the hospitalization is associated with a procedure appearing on the previously described Medicare inpatient‐only procedures list, or
- A rare and unusual circumstance in which an inpatient admission would be reasonable regardless of length of stay. Currently, unanticipated mechanical ventilation initiated during the hospitalization visit is the only rare and unusual circumstance that qualifies as such an exception.[7]
CMS' stated goals and expectations for the 2‐midnight benchmark were:
- Reduce the growing number of prolonged hospitalizations (>48 hours) for Medicare beneficiaries under outpatient status.
- Decrease billing disputes between hospitals and Medicare auditors, especially RACs, by establishing more clearly defined, time‐based status criteria.
- Reduce the number of outpatient encounters overall. Because CMS expected the rule to convert a net increase of cases from outpatient to inpatient, resulting in higher payments to hospitals, CMS included a 0.2% payment cut in hospital reimbursement in the IPPS‐2014 as an offset.[33, 34]
Although unrelated to the goals and expectations above, the IPPS‐2014 also included a requirement that:
[T]he order [for inpatient admission] must be furnished by a qualified and licensed practitioner who has admitting privileges at the hospital as permitted by State law, and who is knowledgeable about the patient's hospital course, medical plan of care and current condition.
CMS allowed for an authentication (generally regarded as a cosignature that is timed and dated) of the inpatient admission order by an attending physician with admitting privileges, done prior to discharge, in cases where the inpatient order had been placed by a practitioner (such as a resident, fellow, or physician assistant) without admitting privileges. Attending physician authentication of the inpatient admission order must be done prior to discharge [a]s a condition of payment for hospital inpatient services under Medicare Part A.[35]
From the August 2, 2013 announcement until the effective date of October 1, 2013, hospitals had just 2 months to interpret and comply with the IPPS‐2014, a complex 546‐page document that required hospitals to make extensive changes to admission procedures, workflows, and electronic health records (EHRs). In addition, extensive physician, provider, and administrator education was needed. During these 2 months, hospitals continued to request additional information and clarification from CMS regarding many aspects of the IPPS‐2014, including basic questions that included (1) how to apply the 2‐midnight benchmark to patients who were transferred from 1 hospital to another and (2) when the clock started for hospital services in determining a patient's expected length of hospitalization.
Despite concerns voiced by Congress and medical organizations, the new policy went into effect as scheduled.[36, 37] However, just days prior to October 1, 2013, CMS issued a 3‐month limited suspension of auditing and enforcement of the 2‐midnight rule by the RACs that was subsequently extended by CMS 2 more times, first through March 31, 2014 and then again through September 30, 2014. Other audits to be performed by RACs and all other government audits, including those performed by Medicare Administrative Contractors (MACs) were allowed to continue.[38] In particular, the MACs were instructed to conduct patient status reviews using a probe and educate strategy, which, via educational outreach efforts, would instruct hospitals how to adapt to the new rule. On April 1, 2014, the Protecting Access to Medicare Act of 2014 was signed into law, which, under section 111 of this law, permitted CMS to continue medical review activities under the MAC probe and educate process through March of 2015, and prohibited CMS from allowing RACs to conduct inpatient hospital status reviews on claims with these same dates of admission, October 1, 2013 through March 31, 2015.
The MACs were created by the MMA of 2003, which mandated that the Secretary of Health & Human Services replace Part A Fiscal Intermediaries and Part B carriers with Medicare Administrative Contractors (MACs).[39] As established by CMS, MACs are multi‐state, regional contractors responsible for administering both Medicare Part A and Medicare Part B claims and serve as the primary operational contact between the Medicare Fee‐For‐Service program, and approximately 1.5 million health care providers enrolled in the program.[39]
THE IPPS‐2014 AND CMS' STATED GOALS AND EXPECTATIONS
In the analysis that accompanied the IPPS‐2014, Medicare expected the use of outpatient services to decrease overall, as the new rules would effectively eliminate almost all outpatient hospitalizations >48 hours. Although no official data are yet available from CMS, our early experience under the 2‐midnight rule has suggested that long observation stays have declined in frequency, a favorable outcome of the new policy. However, as designed, the new 2‐midnight IPPS rule most predominately affects 1‐day stays, or more accurately, 1‐midnight stays. This is because many hospitalizations that previously met inpatient criteria (as defined by commercially available products such as MCG or InterQual), but spanned 2 midnights would have been classified as inpatient prior to October 1, 2013. However, since October 1, 2013, these same hospitalizations are now classified as outpatient. An example of such a case is a patient who presents to an emergency department with symptoms of a transient ischemic attack and has a high ABCD (age 60 years, blood pressure 140/90 mm Hg at initial evaluation, clinical features, duration of symptoms, diabetes score).[40] Prior to the 2‐midnight rule, this patient, based on the severity of the signs and symptoms upon presentation, could have been appropriately hospitalized as an inpatient.
Now, under the current IPPS and the ability of many hospitals to efficiently evaluate and treat such patient in 2 midnights, the patient should be categorized as an outpatient, at least initially, despite the severity and high risk of his/her presentation. In fiscal year 2013, The Johns Hopkins Hospital had 1791, 1‐day inpatient stays for Medicare beneficiaries, representing 15.2% of all Medicare admissions. Similarly, in the 12 months just prior to the 2‐midnight rule (October 1, 2012 to September 30, 2013), 10.4% (1280) of all Medicare encounters at the University of Wisconsin were 1‐day inpatient stays under previous criteria. Because of implementation of the 2‐midnight rule in October 2013, Medicare outpatient hospitalization for 1‐day stays at The Johns Hopkins Hospital increased by 49%, from an average of 117 patients/month to 174 patients/month. Nationally, it is possible that a reduction in long observation stays could be offset by an increase in 1‐day‐stay outpatient hospitalization encounters.
A second key expectation and goal of IPPS‐2014 was, by shifting to a more concrete, time‐based definition of inpatient, to decrease the disagreement between hospitals and auditors regarding patient status (inpatient vs outpatient). As noted earlier, many disputes with auditors for hospitalizations prior to October 2013 did not involve the need or type of hospital services provided, but rather the status under which the care was provided. However, the new time‐based criterion hinges not on actual length of hospitalization, but the expected length of hospitalization as determined by a practitioner with admitting privileges and knowledge of the patient. Accurately and consistently predicting the length of hospitalization has proven to be challenging, even for the most experienced practitioners. Since October 2013, for patients hospitalized at The Johns Hopkins Hospital through its emergency department, the admitting physicians' expectation of whether a patient would require 1 versus 2 or more midnights of necessary hospitalization was correct only half of the time. Given past experience, the RACs may challenge the medical judgment that lead practitioners to expect a hospitalization of 2 or more midnights without having to challenge whether the care provided was medically necessary.
Further, the IPPS‐2014 has not been accompanied by any significant changes to the payment scheme for auditors. RACs continue to be paid a percentage of any monies they determine to have been improperly paid by CMS, but with no penalty for cases that are overturned on appeal. Historically, the vast majority of RAC recovery fees have been due to determination of overpayments by CMS.[41, 42] Despite the 2‐midnight rule, RACs will continue to have a financial incentive to allege overpayment. In the initial probe and educate audits by MACs under the new 2014‐IPPS, despite inpatient admission orders being authenticated and certified by an attending physician, claims are being denied because the documentation does not support an expectation for a 2‐midnight hospitalization. Namely, auditors are continuing to challenge not the medical necessity of the services that hospitals provide, but rather the status in which those services were provided. Thus far, the IPPS‐2014 does not appear to fully remedy the auditing conflict that existed prior to October 2013.
As noted above, the IPPS‐2014 also requires, as of October 1, 2013, as a condition of payment for hospital services under Part A, that the inpatient admission order must be either entered by a practitioner with admitting privileges or authenticated prior to discharge by an attending physician involved in the care of the patient in cases in which the inpatient admission order was entered by a practitioner without admitting privileges (eg, resident, physician assistant, or fellow).[43] The requirement of an attending physician's cosignature has involved major changes to physician workflow and the electronic heath record (EHR) framework at The Johns Hopkins and the University of Wisconsin Hospitals, and does not keep up with modern healthcare systems in which patients are admitted 24 hours a day by a variety of providers (eg, residents, nurse practitioners) who otherwise may write stand‐alone orders. These changes have proven to be time‐consuming, costly, and have not, to our knowledge, improved patient care or utilization of resources.
The new visit status rules have also led to confusion among clinicians. A recent large survey of hospitalists conducted by the Society of Hospital Medicine demonstrated that more than half of respondents disagreed that the 2‐midnight rule improved hospitalist workflow compared to prior observation policy.[44] In addition, only 40% of hospitalists reported confidence in how to apply the rule.[44] Thus, the intent to clarify visit status policy with the IPPS‐2014 has not translated to clear and useful rules for frontline clinicians.
FUTURE DIRECTIONS
After over a year under the 2‐midnight rule, although long observation stays may be reduced, it seems unlikely these new regulations will achieve 2 of CMS' stated goals: (1) decreasing the use of outpatient status for hospitalizations and (2) resolving status disputes between auditors and hospitals. In addition, attempts at compliance with the new rules and regulations have diverted large amounts of physician time and hospital resources away from patient care. There is a clear need to reform both the hospitalization status policy and the RAC programs that enforce these rules.
One path Congress and CMS could consider is to reform the current Medicare reimbursement paradigm for hospital services to eliminate the need to distinguish inpatient from outpatient status. For example, H.R. 1179Improving Access to Medicare Coverage Act of 2013,[45] of the 113th Congress, if reintroduced, would decouple the link between the qualification for skilled nursing facility benefits from visit status by allowing time spent hospitalized as an outpatient to count toward the 3‐day benchmark. The overarching goals of any visit status policy reform should be to: (1) simplify or eliminate the 2‐track status process for hospitalized patients, (2) stop or minimize the threat of audits based on status, and (3) maintain budget neutrality. Two additional options for consideration would be to: (1) create a low‐acuity modifier for use with patients anticipated to have short stays and low resource use and (2) preselect specific Diagnosis Related Groups based on historical data and create designations for those diagnoses of lesser intensity. Accountable care organizations contracts, a new model for healthcare payment, could potentially be structured to eliminate or simplify payment based on visit status for hospitalized patients. With bundled payments on the horizon and the possible phase‐out of fee‐for‐service reimbursement, the issue may become less paramount in the coming years. No solution will be perfect and must balance costs, ease of administration, and beneficiary protection.
There are reasons to be optimistic that change may soon be realized. CMS is currently considering significant hospitalization status policy reform. In the proposed IPPS‐2015, CMS asked for input on payment for short‐stay hospitalizations and, in the final IPPS‐2015 released August 4, 2014, CMS indicated its willingness to continue to work with stakeholders in revising these policies.[46] Additionally, CMS has responded to hospitals on 3 separate occasions by delaying RAC audits pertaining to the 2‐midnight rule. Further, the current MAC probe and educate audits focus on education with respect to 2‐midnight rule implementation rather than threatening hospitals with major financial penalties.[47] Congress has also been responsive in this area. In addition to the 3 delays announced by CMS, Congress passed legislation that mandated an additional delay to RAC audits that pertain to the 2‐midnight rule. Moreover, the Subcommittee on Health of the House Ways and Means Committee held hearings that included the 2‐midnight rule and RAC reform in May 2014, and the Senate Special Committee on Aging held hearings on the impact of visit status on Medicare beneficiaries in July 2014.[48, 49] Additionally, the House Ways and Means Health Subcommittee recently issued a draft bill to address Medicare hospital issues.[50] The OIG has also been responsive to hospital concerns regarding the current RAC program with a recent report recommending that CMS develop additional performance evaluation metrics to improve RAC performance and ensure that RACs are evaluated on all contract requirements.[51] Additionally, MedPAC has been considering several short‐stay payment reform options, modifying the need for a 3‐day inpatient hospitalization to qualify for postdischarge skilled nursing facility benefits and adjusting RAC contingency fees based on overturn rates.[52, 53] These actions by CMS, Congress, and the OIG, as well as the options under consideration by MedPAC, demonstrate a degree of regulatory and legislative responsiveness to hospital and provider concerns in the area of visit status determination.
The Medicare program is vital to tens of millions of disabled and elderly Americans. Fraud and abuse of the Medicare program should not be tolerated. Yet, the current system of assigning, monitoring, and auditing outpatient versus inpatient hospital care is in need of reform. It will be up to CMS and Congress to continue to work with hospitals and physicians to find an improved way to appropriately and fairly compensate hospitals for hospital services in a way that that does not depend on a poorly defined and contentious status of a patient. Such reform must include the RAC program. It is our hope that both CMS and Congress will prioritize status determination and payment reform so that Medicare beneficiaries, physicians, and hospitals all have a sustainable, fair, and transparent process.
- Testimony of Jodi D Nudelman, Regional Inspector General for the Office of Evaluation and Inspections, Office of the Inspector General, US Department of Health and Human Services, Hearing: Current Hospital Issues in the Medicare Program, House Committee on Ways and Means, Subcommittee on Health, May 20, 2014. Available at: https://oig.hhs.gov/newsroom/testimony‐and‐speeches/index.asp. Accessed November 24, 2014.
- Centers for Medicare 173:1999–2000.
- US Department of Health 49:893–909.
- US Department of Health 28:95–111.
- . The price of admission: increasing use of decision‐support technology draws criticism for changing roles in hospital‐admissions process. Modern Healthcare website. Available at: http://www.modernhealthcare.com/article/20121117/MAGAZINE/311179951. Published November 17, 2012. Accessed November 9, 2014.
- , , , et al. The accuracy of interqual criteria in determining the need for observation versus hospitalization in emergency department patients with chronic heart failure. Crit Pathw Cardiol. 2013;12:192–196.
- US Department of Health 31:1251–1259.
- MedPAC March 2104 Report to the Congress, Medicare Payment Policy. Available at: http://www.medpac.gov/documents/reports/mar14_entirereport.pdf?sfvrsn=0. Accessed on December 22, 2014.
- , , , et al, Hospitalized but not admitted: characteristics of patients with “observation status” at an academic medical center. JAMA Intern Med. 2013;173:1991–1998.
- . The recovery audit contractor program and observation status for hospitalized Medicare beneficiaries. JAMA Internal Medicine blog. Available at: http://internalmedicineblog.jamainternalmed.com/2014/02/04/the‐recovery‐audit‐contractor‐program‐and‐observation‐status‐for‐hospitalized‐medicare‐beneficiaries. Published February 4, 2014. Accessed June 15, 2014.
- . Broken RAC system continues to hurt patients, providers. The Hospital Leader blog. Available at: http://blogs.hospitalmedicine.org/Blog/broken‐rac‐system‐continues‐to‐hurt‐patients‐providers. Published April 22, 2014. Accessed June 15, 2014.
- US Department of Health 78(160). Available at: http://www.gpo.gov/fdsys/pkg/FR‐2013‐08‐19/pdf/2013‐18956.pdf. Accessed August 4, 2014.
- US Department of Health use of observation and inpatient stays for Medicare beneficiaries, OEI‐02‐12‐00040. Available at: http://oig.hhs.gov/oei/reports/oei‐02‐12‐00040.pdf. Accessed June 15, 2014.
- US Department of Health
Status determinations (outpatient versus inpatient) for hospitalized patients have become a routine part of patient care in the United States. Under the guidance provided by the Medicare Benefits Policy Manual, hospitalized Medicare beneficiaries are assigned 1 of these 2 statuses. The status assignment does not affect the care a patient can receive, but rather how the hospital services provided are billed to Medicare. Hospital services provided under inpatient status are billed under Medicare Part A. Hospital services provided under outpatient status, which includes all patients receiving observation services (commonly referred to as under observation), are billed under Medicare Part B. Whether hospital services are billed under Part A or Part B is important to hospitals and Medicare beneficiaries, as both the hospital reimbursement and beneficiary liability can vary greatly depending on whether services are billed under Part A versus Part B. Hospitals are generally reimbursed at a higher rate for services provided as an inpatient (Part A). The Office of the Inspector General (OIG) recently found that Medicare paid nearly three times more for a short inpatient stay than an [outpatient] stay for the same condition.[1] Medicare beneficiary liability also varies based on status. First, beneficiaries hospitalized as inpatients are subject to a deductible under Part A ($1,216 in 2014) for hospital services associated with that hospitalization and any future inpatient hospitalization beyond 60 days of discharge.[2] Beneficiaries hospitalized as outpatients are subject to the Medicare Part B deductible ($147 in 2014), and then a 20% copay on each individual outpatient hospital service, with no cumulative limit.[2, 3] In addition, hospital pharmacy charges for Medicare beneficiaries hospitalized as inpatients are covered under Medicare A. However, for Medicare patients hospitalized as outpatients, many medications are not covered by Medicare Part B benefits. Finally, time spent hospitalized as an outpatient does not count toward the Medicare 3‐day medically necessary inpatient stay requirement to qualify for the skilled nursing facility care benefit following discharge.
HISTORY AND INTENT OF INPATIENT AND OUTPATIENT STATUS DETERMINATIONS
Prior to October 1, 2013, the Centers for Medicare & Medicaid Services (CMS) stated that physician judgment and an expectation of at least an overnight hospitalization should determine inpatient status of hospitalized Medicare beneficiaries. Guidance as to when inpatient services were covered was found in the Medicare Benefits Policy Manual (MBPM)[4]:
An inpatient is a person who has been admitted to a hospital for bed occupancy for purposes of receiving inpatient hospital services. Generally, a patient is considered an inpatient if formally admitted as inpatient with the expectation that he or she will remain at least overnight and occupy a bed even though it later develops that the patient can be discharged or transferred to another hospital and not actually use a hospital bed overnight. The physician or other practitioner responsible for a patient's care at the hospital is also responsible for deciding whether the patient should be admitted as an inpatient. Physicians should use a 24‐hour period as a benchmark, i.e., they should order admission for patients who are expected to need hospital care for 24 hours or more, and treat other patients on an outpatient basis. However, the decision to admit a patient is a complex medical judgment that can be made only after the physician has considered a number of factors, including the patient's medical history and current medical needs, the types of facilities available to inpatients and to outpatients, the hospital's by‐laws and admissions policies, and the relative appropriateness of treatment in each setting.
For a subset of patients who are hospitalized under outpatient status, billing for observation services is allowed. CMS defines observation as a well defined set of services, that should last less than 24 hours and in only rare and exceptional casesspan more than 48 hours.[5] Many providers recognize the utility of a few additional hours of hospital care and/or testing in a hospital setting to determine whether a patient can go home or needs additional evaluation, monitoring, and/or treatment that can only be provided in a hospital, consistent with the CMS definition of observation.[6] It is important to note that although observation and outpatient are frequently used interchangeably, only outpatient is technically a CMS status. Patients in observation or under observation are, in fact, a subset of patients who are hospitalized under an outpatient status.
Outpatient status may also be appropriate for patients who require hospitalization for routine and expected overnight monitoring following a procedure. These patients are often not eligible for billing of observation services or as an inpatient because alternative methods of billing for the recovery time following the procedure exist. When determining the appropriate status of a Medicare beneficiary for a hospitalization following a procedure, physicians need to be aware of whether a specific procedure appears on the Medicare inpatient‐only procedures list.[7] Per CMS, procedures designated as inpatient only are reimbursed only when the patient is admitted as an inpatient at the time the procedure is performed.[8] Conversely, outpatient status for an overnight hospitalization associated with a procedure not on the inpatient‐only list is generally appropriate. Therefore, patients hospitalized for a procedure that appears on this list should always be hospitalized under inpatient status, regardless of the amount of time that the patient is expected to be hospitalized following the procedure, including those cases for which the hospitalization is expected to be only overnight.[7, 8] Only a limited number of Current Procedural Technology (CPT) codes, mostly surgical, automatically qualify for inpatient status and do not have outpatient prospective payment system eligibility. Although most procedures on the inpatient‐only list are associated with a hospitalization that commonly span at least 2 midnights, such as coronary artery bypass grafting, some potentially overnight stay cases, such as cholecystectomy (CPT 47600) appear on the 2014 inpatient‐only list.[9]
As noted above, prior to October 1, 2013, the Medicare definitions governing outpatient versus inpatient status included a 24‐hour benchmark. However, the MBPM also notes that: Admissions of particular patients are not covered or non‐covered solely on the basis of the length of time the patient actually spends in the hospital.[10]
In practice, status determination was ultimately dependent on physician or other practitioner's complex medical judgment as specified by CMS. To validate this judgment, CMS recommended that reviewers use a screening tool as part of their medical review. This screening tool could include practice guidelines that are well accepted by the medical community but did not require or identify a specific criteria set.[11] Not surprisingly, there was and continues to be great variability in the application of outpatient versus inpatient status across hospitals in actual practice.[1, 12, 13] The ambiguity in the definition of a hospitalized patient's status helped spawn commercial clinical decision tools, such as InterQual (McKesson Corporation, San Francisco, CA) and MCG (formally known as Milliman Care Guidelines; MCG Health, LLC, Seattle, WA), to help define inpatients versus outpatients.[14, 15] However, these guidelines are complex, can be difficult to interpret and apply, and have been criticized for poor predictive value and attempting to replace physician judgment.[16, 17, 18] Furthermore, CMS has never formally endorsed any specific decision tool.
INPATIENT AND OUTPATIENT PAYMENTS AND THE RECOVERY AUDIT CONTRACTOR PROGRAM
In 2000, CMS started using Ambulatory Payment Classifications for hospital services, which made inpatient care more financially favorable for hospitals. In response to concerns that hospitals would be incentivized to overuse inpatient status, CMS made a number of changes to their payment system, including the creation of the Recovery Audit Program in 2003. This program was originally called the Recovery Audit Contractor (RAC) Program and continues to be most commonly referred to as the RAC program. The RAC program, tasked with finding and correcting improper claims to the Medicare program, began as a demonstration required in the Medicare Prescription Drug Improvement and Modernization Act of 2003 (MMA), and subsequently became a nationwide audit program under the Tax Relief and Health Care Act of 2006. Under this program, private contractors review hospital and billing records of Medicare patients and are paid on a contingency fee (8%12.5%) for all underpayments and overpayments that are identified and corrected.[19] Importantly, the RACs are not subject to any financial penalties for cases improperly denied.
RACs initially targeted many overnight inpatient stays for recoupment. These cases were attractive audit targets because the RACs could argue that the inpatient hospital services were delivered in the improper status based solely on the length of stay, without having to consider in their audit the complexity of decision making or medical necessity of the services provided. However, it is worth noting that with improvement in efficiency and advancements in medical technology, hospitals and physicians have been increasingly able to safely evaluate and treat medically complex and severely ill patients quickly, sometimes with just an overnight stay. As perspective, in 1965, the average length of stay for a Medicare patient was 13 days; in 2010, it was 5.4 days, with over one‐third of hospitalizations lasting 3 days.[20]
Concurrent with the increased RAC denials for services provided in an inpatient status, the use of observation services changed significantly from 2007 to 2012. The average length of stay for Medicare patients under outpatient status with observation services exceeded 24 hours in 2007, was 28.2 hours by 2009,[21] and grew to 29 hours by 2012.[22] Between July 2010 and December 2011, at the University of Wisconsin Hospital, 1 in 6 observation stays lasted longer than 48 hours, suggesting that long observation stays were no longer rare and exceptional as stated in CMS' own definition.[23] This same University of Wisconsin study also found that observation services were not well defined, with 1141 distinct diagnosis codes used for these services.[23]
Additionally, a Medicare Payment Advisory Commission (MedPAC; described on their website,
Hospitals have also expressed concern that the RAC contingency fee payment model and a lack of penalty for improper denials promotes overzealous auditing.[24, 25] RAC recoupment has increased from approximately $939 million in 2011, to $2.4 billion in 2012, to $3.8 billion in 2013.[26, 27, 28] Given the money now at stake, it is not surprising that hospitals have become very active in appealing RAC denials. Self‐reported data submitted to the American Hospital Association (AHA) for the months January 2014 to March of 2014 show that hospitals now appeal 50% of RAC denials and win 66% of these appeals.[29] The AHA data also show that 69% of self‐reporting hospitals spent over $10,000 to manage their audit and appeals process over this same 3‐month time period, with 11% spending more than $100,000.
This appeals process is not only costly to hospitals, it is also lengthy. As of January 2014, the average wait time for an appeal hearing with an administrative law judge (level 3 appeal) exceeded 16 months.[30] In fact, the appeals process has become so backlogged that hospitals' rights to assignment of level 3 (administrative law judge) appeals have been temporarily suspended.[30] In August 2014, CMS offered a $0.68 on the dollar partial payment for hospitals willing to settle all eligible outstanding appeals in an attempt to relieve the appeals backlog.[31] In addition, the AHA currently has a suit against the US Department of Health & Human Services over the RAC appeals backlog.[32]
Increased use of outpatient status may be driven by pressures from the RAC program and, potentially, by improvements in the efficiency of care. Because hospitals are paid less for care provided under outpatient status than they are for the identical care provided under inpatient status, hospitals faced both potential financial penalty for improvements in efficiency and the threat of RAC audits.
THE 2‐MIDNIGHT RULE: A FIX?
Given the challenges in defining inpatient versus outpatient hospitalization, the increasing use of outpatient status and the increasing length of stay of outpatient hospitalizations with observation services, in 2013, CMS responded with new policies to define the visit status for hospitalized patients. On August 2, 2013, CMS announced the fiscal year 2014 hospital Inpatient Prospective Payment System final rule (IPPS‐2014) to become effective October 1, 2013. This document was formally issued as part of the Federal Register on August 19, 2013.[33] Central to the CMS IPPS‐2014 was a 2‐midnight benchmark that offered a major change in how physicians were to determine the status (inpatient vs outpatient) of hospitalized patients. With this 2‐midnight benchmark, now informally known as the 2‐midnight rule, CMS finalized its proposal to generally consider patients that are expected by a practitioner (with knowledge of the case and with admitting privileges) to need hospitalization that will span 2 or more midnights as inpatient. The IPPS‐2014 also finalized the converse of this: hospitalizations expected to span 2 midnights are to be regarded as outpatient with 2 exceptions:
- If the hospitalization is associated with a procedure appearing on the previously described Medicare inpatient‐only procedures list, or
- A rare and unusual circumstance in which an inpatient admission would be reasonable regardless of length of stay. Currently, unanticipated mechanical ventilation initiated during the hospitalization visit is the only rare and unusual circumstance that qualifies as such an exception.[7]
CMS' stated goals and expectations for the 2‐midnight benchmark were:
- Reduce the growing number of prolonged hospitalizations (>48 hours) for Medicare beneficiaries under outpatient status.
- Decrease billing disputes between hospitals and Medicare auditors, especially RACs, by establishing more clearly defined, time‐based status criteria.
- Reduce the number of outpatient encounters overall. Because CMS expected the rule to convert a net increase of cases from outpatient to inpatient, resulting in higher payments to hospitals, CMS included a 0.2% payment cut in hospital reimbursement in the IPPS‐2014 as an offset.[33, 34]
Although unrelated to the goals and expectations above, the IPPS‐2014 also included a requirement that:
[T]he order [for inpatient admission] must be furnished by a qualified and licensed practitioner who has admitting privileges at the hospital as permitted by State law, and who is knowledgeable about the patient's hospital course, medical plan of care and current condition.
CMS allowed for an authentication (generally regarded as a cosignature that is timed and dated) of the inpatient admission order by an attending physician with admitting privileges, done prior to discharge, in cases where the inpatient order had been placed by a practitioner (such as a resident, fellow, or physician assistant) without admitting privileges. Attending physician authentication of the inpatient admission order must be done prior to discharge [a]s a condition of payment for hospital inpatient services under Medicare Part A.[35]
From the August 2, 2013 announcement until the effective date of October 1, 2013, hospitals had just 2 months to interpret and comply with the IPPS‐2014, a complex 546‐page document that required hospitals to make extensive changes to admission procedures, workflows, and electronic health records (EHRs). In addition, extensive physician, provider, and administrator education was needed. During these 2 months, hospitals continued to request additional information and clarification from CMS regarding many aspects of the IPPS‐2014, including basic questions that included (1) how to apply the 2‐midnight benchmark to patients who were transferred from 1 hospital to another and (2) when the clock started for hospital services in determining a patient's expected length of hospitalization.
Despite concerns voiced by Congress and medical organizations, the new policy went into effect as scheduled.[36, 37] However, just days prior to October 1, 2013, CMS issued a 3‐month limited suspension of auditing and enforcement of the 2‐midnight rule by the RACs that was subsequently extended by CMS 2 more times, first through March 31, 2014 and then again through September 30, 2014. Other audits to be performed by RACs and all other government audits, including those performed by Medicare Administrative Contractors (MACs) were allowed to continue.[38] In particular, the MACs were instructed to conduct patient status reviews using a probe and educate strategy, which, via educational outreach efforts, would instruct hospitals how to adapt to the new rule. On April 1, 2014, the Protecting Access to Medicare Act of 2014 was signed into law, which, under section 111 of this law, permitted CMS to continue medical review activities under the MAC probe and educate process through March of 2015, and prohibited CMS from allowing RACs to conduct inpatient hospital status reviews on claims with these same dates of admission, October 1, 2013 through March 31, 2015.
The MACs were created by the MMA of 2003, which mandated that the Secretary of Health & Human Services replace Part A Fiscal Intermediaries and Part B carriers with Medicare Administrative Contractors (MACs).[39] As established by CMS, MACs are multi‐state, regional contractors responsible for administering both Medicare Part A and Medicare Part B claims and serve as the primary operational contact between the Medicare Fee‐For‐Service program, and approximately 1.5 million health care providers enrolled in the program.[39]
THE IPPS‐2014 AND CMS' STATED GOALS AND EXPECTATIONS
In the analysis that accompanied the IPPS‐2014, Medicare expected the use of outpatient services to decrease overall, as the new rules would effectively eliminate almost all outpatient hospitalizations >48 hours. Although no official data are yet available from CMS, our early experience under the 2‐midnight rule has suggested that long observation stays have declined in frequency, a favorable outcome of the new policy. However, as designed, the new 2‐midnight IPPS rule most predominately affects 1‐day stays, or more accurately, 1‐midnight stays. This is because many hospitalizations that previously met inpatient criteria (as defined by commercially available products such as MCG or InterQual), but spanned 2 midnights would have been classified as inpatient prior to October 1, 2013. However, since October 1, 2013, these same hospitalizations are now classified as outpatient. An example of such a case is a patient who presents to an emergency department with symptoms of a transient ischemic attack and has a high ABCD (age 60 years, blood pressure 140/90 mm Hg at initial evaluation, clinical features, duration of symptoms, diabetes score).[40] Prior to the 2‐midnight rule, this patient, based on the severity of the signs and symptoms upon presentation, could have been appropriately hospitalized as an inpatient.
Now, under the current IPPS and the ability of many hospitals to efficiently evaluate and treat such patient in 2 midnights, the patient should be categorized as an outpatient, at least initially, despite the severity and high risk of his/her presentation. In fiscal year 2013, The Johns Hopkins Hospital had 1791, 1‐day inpatient stays for Medicare beneficiaries, representing 15.2% of all Medicare admissions. Similarly, in the 12 months just prior to the 2‐midnight rule (October 1, 2012 to September 30, 2013), 10.4% (1280) of all Medicare encounters at the University of Wisconsin were 1‐day inpatient stays under previous criteria. Because of implementation of the 2‐midnight rule in October 2013, Medicare outpatient hospitalization for 1‐day stays at The Johns Hopkins Hospital increased by 49%, from an average of 117 patients/month to 174 patients/month. Nationally, it is possible that a reduction in long observation stays could be offset by an increase in 1‐day‐stay outpatient hospitalization encounters.
A second key expectation and goal of IPPS‐2014 was, by shifting to a more concrete, time‐based definition of inpatient, to decrease the disagreement between hospitals and auditors regarding patient status (inpatient vs outpatient). As noted earlier, many disputes with auditors for hospitalizations prior to October 2013 did not involve the need or type of hospital services provided, but rather the status under which the care was provided. However, the new time‐based criterion hinges not on actual length of hospitalization, but the expected length of hospitalization as determined by a practitioner with admitting privileges and knowledge of the patient. Accurately and consistently predicting the length of hospitalization has proven to be challenging, even for the most experienced practitioners. Since October 2013, for patients hospitalized at The Johns Hopkins Hospital through its emergency department, the admitting physicians' expectation of whether a patient would require 1 versus 2 or more midnights of necessary hospitalization was correct only half of the time. Given past experience, the RACs may challenge the medical judgment that lead practitioners to expect a hospitalization of 2 or more midnights without having to challenge whether the care provided was medically necessary.
Further, the IPPS‐2014 has not been accompanied by any significant changes to the payment scheme for auditors. RACs continue to be paid a percentage of any monies they determine to have been improperly paid by CMS, but with no penalty for cases that are overturned on appeal. Historically, the vast majority of RAC recovery fees have been due to determination of overpayments by CMS.[41, 42] Despite the 2‐midnight rule, RACs will continue to have a financial incentive to allege overpayment. In the initial probe and educate audits by MACs under the new 2014‐IPPS, despite inpatient admission orders being authenticated and certified by an attending physician, claims are being denied because the documentation does not support an expectation for a 2‐midnight hospitalization. Namely, auditors are continuing to challenge not the medical necessity of the services that hospitals provide, but rather the status in which those services were provided. Thus far, the IPPS‐2014 does not appear to fully remedy the auditing conflict that existed prior to October 2013.
As noted above, the IPPS‐2014 also requires, as of October 1, 2013, as a condition of payment for hospital services under Part A, that the inpatient admission order must be either entered by a practitioner with admitting privileges or authenticated prior to discharge by an attending physician involved in the care of the patient in cases in which the inpatient admission order was entered by a practitioner without admitting privileges (eg, resident, physician assistant, or fellow).[43] The requirement of an attending physician's cosignature has involved major changes to physician workflow and the electronic heath record (EHR) framework at The Johns Hopkins and the University of Wisconsin Hospitals, and does not keep up with modern healthcare systems in which patients are admitted 24 hours a day by a variety of providers (eg, residents, nurse practitioners) who otherwise may write stand‐alone orders. These changes have proven to be time‐consuming, costly, and have not, to our knowledge, improved patient care or utilization of resources.
The new visit status rules have also led to confusion among clinicians. A recent large survey of hospitalists conducted by the Society of Hospital Medicine demonstrated that more than half of respondents disagreed that the 2‐midnight rule improved hospitalist workflow compared to prior observation policy.[44] In addition, only 40% of hospitalists reported confidence in how to apply the rule.[44] Thus, the intent to clarify visit status policy with the IPPS‐2014 has not translated to clear and useful rules for frontline clinicians.
FUTURE DIRECTIONS
After over a year under the 2‐midnight rule, although long observation stays may be reduced, it seems unlikely these new regulations will achieve 2 of CMS' stated goals: (1) decreasing the use of outpatient status for hospitalizations and (2) resolving status disputes between auditors and hospitals. In addition, attempts at compliance with the new rules and regulations have diverted large amounts of physician time and hospital resources away from patient care. There is a clear need to reform both the hospitalization status policy and the RAC programs that enforce these rules.
One path Congress and CMS could consider is to reform the current Medicare reimbursement paradigm for hospital services to eliminate the need to distinguish inpatient from outpatient status. For example, H.R. 1179Improving Access to Medicare Coverage Act of 2013,[45] of the 113th Congress, if reintroduced, would decouple the link between the qualification for skilled nursing facility benefits from visit status by allowing time spent hospitalized as an outpatient to count toward the 3‐day benchmark. The overarching goals of any visit status policy reform should be to: (1) simplify or eliminate the 2‐track status process for hospitalized patients, (2) stop or minimize the threat of audits based on status, and (3) maintain budget neutrality. Two additional options for consideration would be to: (1) create a low‐acuity modifier for use with patients anticipated to have short stays and low resource use and (2) preselect specific Diagnosis Related Groups based on historical data and create designations for those diagnoses of lesser intensity. Accountable care organizations contracts, a new model for healthcare payment, could potentially be structured to eliminate or simplify payment based on visit status for hospitalized patients. With bundled payments on the horizon and the possible phase‐out of fee‐for‐service reimbursement, the issue may become less paramount in the coming years. No solution will be perfect and must balance costs, ease of administration, and beneficiary protection.
There are reasons to be optimistic that change may soon be realized. CMS is currently considering significant hospitalization status policy reform. In the proposed IPPS‐2015, CMS asked for input on payment for short‐stay hospitalizations and, in the final IPPS‐2015 released August 4, 2014, CMS indicated its willingness to continue to work with stakeholders in revising these policies.[46] Additionally, CMS has responded to hospitals on 3 separate occasions by delaying RAC audits pertaining to the 2‐midnight rule. Further, the current MAC probe and educate audits focus on education with respect to 2‐midnight rule implementation rather than threatening hospitals with major financial penalties.[47] Congress has also been responsive in this area. In addition to the 3 delays announced by CMS, Congress passed legislation that mandated an additional delay to RAC audits that pertain to the 2‐midnight rule. Moreover, the Subcommittee on Health of the House Ways and Means Committee held hearings that included the 2‐midnight rule and RAC reform in May 2014, and the Senate Special Committee on Aging held hearings on the impact of visit status on Medicare beneficiaries in July 2014.[48, 49] Additionally, the House Ways and Means Health Subcommittee recently issued a draft bill to address Medicare hospital issues.[50] The OIG has also been responsive to hospital concerns regarding the current RAC program with a recent report recommending that CMS develop additional performance evaluation metrics to improve RAC performance and ensure that RACs are evaluated on all contract requirements.[51] Additionally, MedPAC has been considering several short‐stay payment reform options, modifying the need for a 3‐day inpatient hospitalization to qualify for postdischarge skilled nursing facility benefits and adjusting RAC contingency fees based on overturn rates.[52, 53] These actions by CMS, Congress, and the OIG, as well as the options under consideration by MedPAC, demonstrate a degree of regulatory and legislative responsiveness to hospital and provider concerns in the area of visit status determination.
The Medicare program is vital to tens of millions of disabled and elderly Americans. Fraud and abuse of the Medicare program should not be tolerated. Yet, the current system of assigning, monitoring, and auditing outpatient versus inpatient hospital care is in need of reform. It will be up to CMS and Congress to continue to work with hospitals and physicians to find an improved way to appropriately and fairly compensate hospitals for hospital services in a way that that does not depend on a poorly defined and contentious status of a patient. Such reform must include the RAC program. It is our hope that both CMS and Congress will prioritize status determination and payment reform so that Medicare beneficiaries, physicians, and hospitals all have a sustainable, fair, and transparent process.
- Testimony of Jodi D Nudelman, Regional Inspector General for the Office of Evaluation and Inspections, Office of the Inspector General, US Department of Health and Human Services, Hearing: Current Hospital Issues in the Medicare Program, House Committee on Ways and Means, Subcommittee on Health, May 20, 2014. Available at: https://oig.hhs.gov/newsroom/testimony‐and‐speeches/index.asp. Accessed November 24, 2014.
- Centers for Medicare 173:1999–2000.
- US Department of Health 49:893–909.
- US Department of Health 28:95–111.
- . The price of admission: increasing use of decision‐support technology draws criticism for changing roles in hospital‐admissions process. Modern Healthcare website. Available at: http://www.modernhealthcare.com/article/20121117/MAGAZINE/311179951. Published November 17, 2012. Accessed November 9, 2014.
- , , , et al. The accuracy of interqual criteria in determining the need for observation versus hospitalization in emergency department patients with chronic heart failure. Crit Pathw Cardiol. 2013;12:192–196.
- US Department of Health 31:1251–1259.
- MedPAC March 2104 Report to the Congress, Medicare Payment Policy. Available at: http://www.medpac.gov/documents/reports/mar14_entirereport.pdf?sfvrsn=0. Accessed on December 22, 2014.
- , , , et al, Hospitalized but not admitted: characteristics of patients with “observation status” at an academic medical center. JAMA Intern Med. 2013;173:1991–1998.
- . The recovery audit contractor program and observation status for hospitalized Medicare beneficiaries. JAMA Internal Medicine blog. Available at: http://internalmedicineblog.jamainternalmed.com/2014/02/04/the‐recovery‐audit‐contractor‐program‐and‐observation‐status‐for‐hospitalized‐medicare‐beneficiaries. Published February 4, 2014. Accessed June 15, 2014.
- . Broken RAC system continues to hurt patients, providers. The Hospital Leader blog. Available at: http://blogs.hospitalmedicine.org/Blog/broken‐rac‐system‐continues‐to‐hurt‐patients‐providers. Published April 22, 2014. Accessed June 15, 2014.
- US Department of Health 78(160). Available at: http://www.gpo.gov/fdsys/pkg/FR‐2013‐08‐19/pdf/2013‐18956.pdf. Accessed August 4, 2014.
- US Department of Health use of observation and inpatient stays for Medicare beneficiaries, OEI‐02‐12‐00040. Available at: http://oig.hhs.gov/oei/reports/oei‐02‐12‐00040.pdf. Accessed June 15, 2014.
- US Department of Health
A disease that strikes close to home

Besides caring for these patients, many of us also have a parent, spouse, or a close relative with dementia. My 90-year-old mother has multi-infarct dementia from her diabetes and vascular disease, but is still able to live in an apartment with my 91-year-old father, with assistance from wonderful home aides. Despite her profound dementia, she can still play the piano and read music.
Menchola and Weiss are to be congratulated for their excellent, evidence-based review of the diagnosis, treatment, and prevention of Alzheimer’s disease (AD). (See "Addressing Alzheimer’s: A pragmatic approach.") They do not get caught up in unjustified enthusiasm for screening and drug treatment. Some of their important recommendations bear repeating here:
Do not routinely screen for AD. This may seem like heresy in these days of early detection and prevention. But for screening to be useful, there must be effective early interventions, and so far, early treatments for AD have been disappointing. Cholinesterase inhibitors and N-methyl-D-aspartate glutamate receptor blockers provide very small improvements in cognitive function and have significant adverse effects. Some behavioral interventions to delay onset of cognitive decline show promise—but are unproven.
Although routine screening is not recommended, “case finding” remains important. We need to be alert to signs and symptoms that suggest early dementia in our patients, and we need to evaluate these patients carefully or refer them for neurologic testing if the diagnosis is in doubt.
Use drugs sparingly, especially when treating behavioral problems. They have serious adverse effects, and behavioral interventions should always be used first. Encourage caregivers to seek out social support. My father attends an Alzheimer’s support group each month, and this has lifted some of the burden.
Address prognosis and end-of-life care, and avoid unnecessary and aggressive treatments that are likely to cause more harm than benefit. Hospice care is suitable and beneficial for those with late-stage Alzheimer’s, but feeding tubes are not.
With many new advances in research techniques, it is likely that investigators will develop better methods of diagnosis and treatment of AD. In the meantime, there is already much we can do to alleviate the suffering of these patients and support their caregivers. This knowledge will likely serve us at home, as well.
ObGyn Medicare and CPT coding changes that could affect your income in 2015

At least one, if not many, of the coding changes highlighted below is likely to modify the incomes of ObGyns in the upcoming year. Here, I outline the 2015 changes that are most likely to affect your practice to some degree.
Medicare changes kick off a melancholy 2015
Surgical global periods: A move to eliminate them is underway
I begin this article not with a new or revised code, but with an active proposal, which, if implemented, could adversely affect your surgical income in a few short years.
Starting in 2017, the Centers for Medicare and Medicaid Services (CMS) has indicated that it will change all surgical codes to 0-day global periods. They plan on starting by converting 10-day global codes to 0-day codes in 2017, and then move on to the conversion of 90-day global codes in 2018. This is being proposed because of an Office of Inspector General (OIG) finding that many surgeons are not providing the evaluation and management (E/M) services included in the surgical code; therefore, Medicare is reimbursing for surgical procedures at a higher rate than warranted. In addition, the number of assigned visits may no longer reflect current care protocols, which again may mean that Medicare is not paying appropriately.
The immediate effect of this proposal—which has been adopted in the final rule published in the November 13, 2014, Federal Register—would be a reduction in payment for the converted codes due to a decrease in the assigned relative value units (RVUs). In addition, surgeons would need to document and provide the level of service for all preoperative and postoperative care, which may lead some payers to begin scrutinizing both levels of service billed and frequency of visits before and after surgical procedures.
CMS is still looking for any additional comments from physicians on this conversion process and such comments can be submitted electronically through a link at www.regulations.gov. Reference the final rule as CMS-1612-FC in your reply.
Medicare reimbursements poised to decrease in April
The calendar year 2015 conversion factor will remain at $35.80 from January 1 through March 31, 2015, as mandated by section 101 of the Protecting Access to Medicare Act of 2014. This represents the amount that will be multiplied by the geographically adjusted RVU for a code to determine the final Medicare allowable per procedure or service billed. Effective April 1, 2015, the conversion factor based on the sustainable growth rate (SGR) formula will be only $28.22—representing a 21.2% decrease—unless Congress acts to override this mandate.
Code bundling leads to lost Medicare compensation
Hysterectomy bundling. Effective October 1, 2014, CMS began permanently bundling anterior/posterior colporrhaphy and colpopexy procedures into all vaginal and laparoscopic-assisted hysterectomy codes. By permanently, CMS means that no modifier can be used to report Current Procedural Terminology (CPT) code 57260 (anterior and posterior [A&P] repair) or codes 57280, 57282, 57283 (abdominal, and vaginal approach colpopexy procedures) separately when performed with a vaginal or laparoscopic-assisted hysterectomy.
The American Congress of Obstetricians and Gynecologists (ACOG) and the American Urogynecologic Society (AUGS) wrote to CMS in May with regard to these edits and objected to them strongly. These organizations will continue to work with CMS to get them removed. Until then, physicians who perform anterior/posterior colporrhaphy and colpopexy procedures with a vaginal or laparoscopic-assisted hysterectomy will need to clearly make a case in the operative report for the need to perform the additional procedures in order to add a modifier -22 (Increased procedural services) to the hysterectomy code for consideration of additional payment. If an A&P repair is performed, it would not be appropriate to bill only an anterior repair (CPT code 57240) or a posterior repair (CPT code 57250) to obtain some separate reimbursement as this would represent inaccurate coding.
Hysteroscopy bundling. Another edit that will affect ObGyns is the bundling of CPT code 58558 (Hysteroscopy, surgical; with sampling [biopsy] of endometrium and/or poly-pectomy, with or without D&C) into codes for hysteroscopic removal of a fibroid (58561) and the removal of an impacted foreign body (58562).
Previously, these codes could have been billed together, but now only the addition of a modifier -22 to the primary procedure (myomectomy or foreign body removal) presents any chance for additional reimbursement. In order to report the modifier, Medicare has indicated that the documentation must clearly support the additional work in accomplishing the primary procedure, including a statement of how much time it added to the normal procedure.
Awareness of new or revised CPT codes could benefit your earnings
The 2015 CPT code set includes several changes, including laboratory and vaccination codes, which may be of interest to your practice. Because of Health Insurance Portability and Accountability Act (HIPAA) requirements, insurers were required to accept new codes on January 1, 2015.
Added: Fetal chromosomal aneuploidy code for genomic sequencing
On January 1, 2014, CPT added a new code to report cell-free DNA to screen for fetal aneuploidy. This new code is 81507 (Fetal aneuploidy [trisomy 21, 18, and 13] DNA sequence analysis of selected regions using maternal plasma, algorithm reported as a risk score for each trisomy), and it was added to report the Harmony™ Prenatal Test.
For 2015, another new code, 81420 (Fetal chromosomal aneuploidy [eg, trisomy 21, monosomy X] genomic sequence analysis panel, circulating cell-free fetal DNA in maternal blood, must include analysis of chromosomes 13, 18, and 21), was added. This code represents a more comprehensive analysis and would therefore not be reported or ordered with code 81507. This new code requires a genomic sequence analysis panel.
HPV revisions extend beyond new codes
The codes for HPV testing have been redefined. These codes have been deleted: 87620-87622 (Infectious agent detection by nucleic acid [DNA or RNA]; papillomavirus, human, direct probe technique/amplified probe technique/quantification). In their place are three new codes to choose from:
- 87623, Human papillomavirus (HPV), low-risk types (eg, 6, 11, 42, 43, 44)
- 87624, Human papillomavirus (HPV), high-risk types (eg, 16, 18, 31, 33, 35, 39, 45, 51, 52, 56, 58, 59, 68)
- 87625, Human papillomavirus (HPV), types 16 and 18 only, includes type 45, if performed.
This coding change may be significant for payment as some payers will cover testing for high-risk HPV types only, so be sure your practice management team is aware of the latest rules for ordering HPV testing for your patients. Otherwise, patients could be faced with unexpected out-of-pocket expenses.
Egg freezing recognized as mainstream
- Infertility laboratories will be pleased to learn that CPT has changed the status of the code for cryopreservation of oocytes from a Category III to a Category I code. This means that this technology has now proven itself as a mainstream procedure, warranting a Category I CPT code. The new code is 89337 (Cryopreservation, mature oocyte[s]), which replaces the deleted code 0059T (Cryopreservation; oocyte[s]).
Vaccination codes for 2015
Almost every year new codes are added, and 2015 is no different. This year, you will see codes for:
- 90651, Human papillomavirus vaccine types 6, 11, 16, 18, 31, 33, 45, 52, 58, nonavalent (HPV), 3 dose schedule, for intramuscular use
- 90630, Influenza virus vaccine, quadrivalent (IIV4), split virus, preservative free, for intradermal use.
There is also a revision to the flu virus vaccine code 90654 to indicate that it represents a trivalent preservative-free vaccine. See the TABLE below for a complete list of all the vaccines by trade name and CPT/Medicare Healthcare Common Procedure Coding System (HCPCS) codes for the 2014−2015 flu season.
Keep in mind that reporting administration of the flu vaccine is different for Medicare than for private payers. Administration code G0008 and diagnosis code V04.81 (Need for prophylactic vaccination and inoculation against influenza) would be reported in conjunction with the appropriate vaccine code for Medicare, while CPT instructs you to report 90471 instead for the administration. When we switch to ICD-10 diagnostic coding on October 1, 2015, the code V04.81 becomes Z23 (Encounter for immunization).
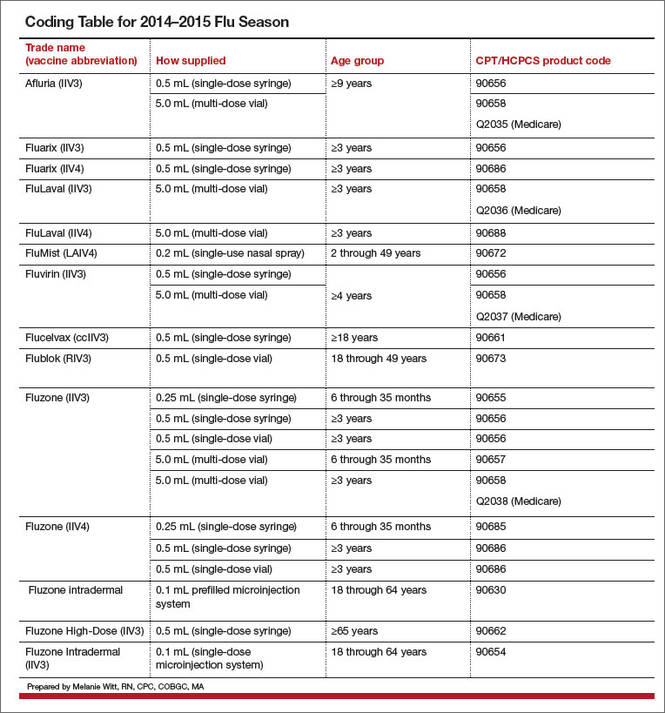
Three new codes for anoscopy
The first two codes were formerly Category III codes representing new technology, but now have proven to be more mainstream.
- 46601, Anoscopy; diagnostic, with high-resolution magnification (HRA) (eg, colposcope, operating microscope) and chemical agent enhancement, including collection of specimen(s) by brushing or washing, when performed
- 46607, Anoscopy; diagnostic, with high-resolution magnification (HRA) (eg, colposcope, operating microscope) and chemical agent enhancement, with biopsy, single or multiple
- 0377T, Anoscopy with directed submucosal injection of bulking agent for fecal incontinence.
Replacement codes for vertebral fracture assessments
If your practice is performing or ordering vertebral assessments for patients, there are two new codes to report. The old code, 77082 (Dual-energy X-ray absorptiometry [DXA], bone density study, 1 or more sites; vertebral fracture assessment) for vertebral fracture assessment has been deleted and replaced with:
- 77085, Dual-energy X-ray absorptiometry (DXA), bone density study, 1 or more sites; axial skeleton (eg, hips, pelvis, spine), including vertebral fracture assessment
- 77086, Vertebral fracture assessment via dual-energy X-ray absorptiometry (DXA).
Coding for breast ultrasound and tomosynthesis get more descriptive—at least for private insurance
The CPT Editorial Panel created three codes to describe digital breast tomosynthesis services and two new codes for a breast ultrasound.
- 77061, Digital breast tomosynthesis; unilateral
- 77062, Digital breast tomosynthesis; bilateral
- 77063, Screening digital breast tomosynthesis, bilateral (List separately in addition to the code for the primary procedure.)
- 76641, Ultrasound, breast, unilateral, real time with image documentation, including axilla when performed; complete
- 76642, Ultrasound, breast, unilateral, … ; limited.
Medicare, on the other hand, has decided to create a G code for tomosynthesis, which is the only code that will be accepted for payment if the patient meets her high-risk criteria for performance of this test.
Under Medicare rules you would report/order the following codes for mammographic services:
- Film (use CPT codes)
- 77056, Mammography; bilateral
- 77057, Screening mammography, bilateral (2-view film study of each breast)
- 2D digital (use G0202, G0204, and G0206)
- G0204, Diagnostic mammography, producing direct digital image, bilateral, all views
- G0206, Diagnostic mammography, producing direct digital image, unilateral, all views
- 3D screening (use G0202 for 2D digital plus the new CPT code 77063 for 3D)
procedure.)
- 3D diagnostic (use G0204 or G0206 for the 2D digital plus the new G code G0279 for 3D)
Modifier 59 becomes more specific
Another Medicare coding change that may affect ObGyns is the addition of new Medicare modifiers that are intended to eventually replace the modifier -59. This new list of modifiers will need to be appended to bundled procedures to more clearly explain why the secondary procedures should be paid separately. At the most recent American Medical Association (AMA) CPT symposium in Chicago, Illinois, CMS medical directors indicated that the new modifiers should be used only when the clinician is given instructions to do so by the carrier. Until then, the modifier -59 should continue to be used by most clinicians.
Here are the new modifiers, with an example of their use with currently bundled procedures that allow a modifier -59 to be used under certain circumstances:
- -XE: Separate encounter (A service that is distinct because it occurred during a separate encounter.) For instance, a patient presents to the office in the morning to have an abscess on her labia near her urethra incised and drained (56405). She returns in the afternoon to have a temporary catheter inserted because she states she cannot urinate and you decide to put in a temporary Foley catheter (51702) until the swelling has gone down. Add the modifier XE to 51702 to indicate it was performed at a different patient encounter.
- -XP: Separate practitioner (A service that is distinct because it was performed by a different practitioner.) Normally, Medicare will reimburse an unaffiliated clinician for performing a procedure that is bundled, since the bundling edits apply to the billing surgeon. But when two physicians from the same practice each are performing a different procedure at the same operative session that would otherwise be bundled, this new modifier will make that clear.
For example, Dr. Bates is performing a laparoscopic paravaginal defect repair (57423) and calls Dr. Clark, a urogynecologist in his practice, to remove severe adhesions from the ureters. The claim should go in under the same tax ID number, with the code 50715 listed first (as it has greater RVUs) and code 57423 reported with the -XP modifier.
- -XS: Separate structure (A service that is distinct because it was performed on a separate organ/structure.) Dr. Scott is performing the removal of endometrial implants around the left fallopian tube and in the cul-de-sac and notices that the right fallopian tube appears closed. He performs chromotubation on the right fallopian tube and notes that the right tube is blocked. Billing in this case would be 58662, 58350-XS.
- -XU: Unusual non-overlapping service (The use of a service that is distinct because it does not overlap usual components of the main service.) Mary has Medicare coverage and presents at 20 weeks 4 days gestation with bleeding and labor pains. Her examination shows bulging membranes that rupture when you attempt to remove the cerclage suture. You note a large rent in the cervix, but cannot get to the cerclage sutures as the patient is in active labor and beginning to bear down. The fetus and placenta are delivered a short time later through the rent in the cervix. You repair the rent in the cervix following delivery.
In this case, code 59400-52 (reduced services since the patient delivered at 20 weeks and there were reduced antepartum services), and 57720-XU because the repair of the cervix is not part of the usual services for a vaginal delivery.
Share your thoughts on this article! Send your Letter to the Editor to [email protected]. Please include your name and the city and state in which you practice.
At least one, if not many, of the coding changes highlighted below is likely to modify the incomes of ObGyns in the upcoming year. Here, I outline the 2015 changes that are most likely to affect your practice to some degree.
Medicare changes kick off a melancholy 2015
Surgical global periods: A move to eliminate them is underway
I begin this article not with a new or revised code, but with an active proposal, which, if implemented, could adversely affect your surgical income in a few short years.
Starting in 2017, the Centers for Medicare and Medicaid Services (CMS) has indicated that it will change all surgical codes to 0-day global periods. They plan on starting by converting 10-day global codes to 0-day codes in 2017, and then move on to the conversion of 90-day global codes in 2018. This is being proposed because of an Office of Inspector General (OIG) finding that many surgeons are not providing the evaluation and management (E/M) services included in the surgical code; therefore, Medicare is reimbursing for surgical procedures at a higher rate than warranted. In addition, the number of assigned visits may no longer reflect current care protocols, which again may mean that Medicare is not paying appropriately.
The immediate effect of this proposal—which has been adopted in the final rule published in the November 13, 2014, Federal Register—would be a reduction in payment for the converted codes due to a decrease in the assigned relative value units (RVUs). In addition, surgeons would need to document and provide the level of service for all preoperative and postoperative care, which may lead some payers to begin scrutinizing both levels of service billed and frequency of visits before and after surgical procedures.
CMS is still looking for any additional comments from physicians on this conversion process and such comments can be submitted electronically through a link at www.regulations.gov. Reference the final rule as CMS-1612-FC in your reply.
Medicare reimbursements poised to decrease in April
The calendar year 2015 conversion factor will remain at $35.80 from January 1 through March 31, 2015, as mandated by section 101 of the Protecting Access to Medicare Act of 2014. This represents the amount that will be multiplied by the geographically adjusted RVU for a code to determine the final Medicare allowable per procedure or service billed. Effective April 1, 2015, the conversion factor based on the sustainable growth rate (SGR) formula will be only $28.22—representing a 21.2% decrease—unless Congress acts to override this mandate.
Code bundling leads to lost Medicare compensation
Hysterectomy bundling. Effective October 1, 2014, CMS began permanently bundling anterior/posterior colporrhaphy and colpopexy procedures into all vaginal and laparoscopic-assisted hysterectomy codes. By permanently, CMS means that no modifier can be used to report Current Procedural Terminology (CPT) code 57260 (anterior and posterior [A&P] repair) or codes 57280, 57282, 57283 (abdominal, and vaginal approach colpopexy procedures) separately when performed with a vaginal or laparoscopic-assisted hysterectomy.
The American Congress of Obstetricians and Gynecologists (ACOG) and the American Urogynecologic Society (AUGS) wrote to CMS in May with regard to these edits and objected to them strongly. These organizations will continue to work with CMS to get them removed. Until then, physicians who perform anterior/posterior colporrhaphy and colpopexy procedures with a vaginal or laparoscopic-assisted hysterectomy will need to clearly make a case in the operative report for the need to perform the additional procedures in order to add a modifier -22 (Increased procedural services) to the hysterectomy code for consideration of additional payment. If an A&P repair is performed, it would not be appropriate to bill only an anterior repair (CPT code 57240) or a posterior repair (CPT code 57250) to obtain some separate reimbursement as this would represent inaccurate coding.
Hysteroscopy bundling. Another edit that will affect ObGyns is the bundling of CPT code 58558 (Hysteroscopy, surgical; with sampling [biopsy] of endometrium and/or poly-pectomy, with or without D&C) into codes for hysteroscopic removal of a fibroid (58561) and the removal of an impacted foreign body (58562).
Previously, these codes could have been billed together, but now only the addition of a modifier -22 to the primary procedure (myomectomy or foreign body removal) presents any chance for additional reimbursement. In order to report the modifier, Medicare has indicated that the documentation must clearly support the additional work in accomplishing the primary procedure, including a statement of how much time it added to the normal procedure.
Awareness of new or revised CPT codes could benefit your earnings
The 2015 CPT code set includes several changes, including laboratory and vaccination codes, which may be of interest to your practice. Because of Health Insurance Portability and Accountability Act (HIPAA) requirements, insurers were required to accept new codes on January 1, 2015.
Added: Fetal chromosomal aneuploidy code for genomic sequencing
On January 1, 2014, CPT added a new code to report cell-free DNA to screen for fetal aneuploidy. This new code is 81507 (Fetal aneuploidy [trisomy 21, 18, and 13] DNA sequence analysis of selected regions using maternal plasma, algorithm reported as a risk score for each trisomy), and it was added to report the Harmony™ Prenatal Test.
For 2015, another new code, 81420 (Fetal chromosomal aneuploidy [eg, trisomy 21, monosomy X] genomic sequence analysis panel, circulating cell-free fetal DNA in maternal blood, must include analysis of chromosomes 13, 18, and 21), was added. This code represents a more comprehensive analysis and would therefore not be reported or ordered with code 81507. This new code requires a genomic sequence analysis panel.
HPV revisions extend beyond new codes
The codes for HPV testing have been redefined. These codes have been deleted: 87620-87622 (Infectious agent detection by nucleic acid [DNA or RNA]; papillomavirus, human, direct probe technique/amplified probe technique/quantification). In their place are three new codes to choose from:
- 87623, Human papillomavirus (HPV), low-risk types (eg, 6, 11, 42, 43, 44)
- 87624, Human papillomavirus (HPV), high-risk types (eg, 16, 18, 31, 33, 35, 39, 45, 51, 52, 56, 58, 59, 68)
- 87625, Human papillomavirus (HPV), types 16 and 18 only, includes type 45, if performed.
This coding change may be significant for payment as some payers will cover testing for high-risk HPV types only, so be sure your practice management team is aware of the latest rules for ordering HPV testing for your patients. Otherwise, patients could be faced with unexpected out-of-pocket expenses.
Egg freezing recognized as mainstream
- Infertility laboratories will be pleased to learn that CPT has changed the status of the code for cryopreservation of oocytes from a Category III to a Category I code. This means that this technology has now proven itself as a mainstream procedure, warranting a Category I CPT code. The new code is 89337 (Cryopreservation, mature oocyte[s]), which replaces the deleted code 0059T (Cryopreservation; oocyte[s]).
Vaccination codes for 2015
Almost every year new codes are added, and 2015 is no different. This year, you will see codes for:
- 90651, Human papillomavirus vaccine types 6, 11, 16, 18, 31, 33, 45, 52, 58, nonavalent (HPV), 3 dose schedule, for intramuscular use
- 90630, Influenza virus vaccine, quadrivalent (IIV4), split virus, preservative free, for intradermal use.
There is also a revision to the flu virus vaccine code 90654 to indicate that it represents a trivalent preservative-free vaccine. See the TABLE below for a complete list of all the vaccines by trade name and CPT/Medicare Healthcare Common Procedure Coding System (HCPCS) codes for the 2014−2015 flu season.
Keep in mind that reporting administration of the flu vaccine is different for Medicare than for private payers. Administration code G0008 and diagnosis code V04.81 (Need for prophylactic vaccination and inoculation against influenza) would be reported in conjunction with the appropriate vaccine code for Medicare, while CPT instructs you to report 90471 instead for the administration. When we switch to ICD-10 diagnostic coding on October 1, 2015, the code V04.81 becomes Z23 (Encounter for immunization).
Three new codes for anoscopy
The first two codes were formerly Category III codes representing new technology, but now have proven to be more mainstream.
- 46601, Anoscopy; diagnostic, with high-resolution magnification (HRA) (eg, colposcope, operating microscope) and chemical agent enhancement, including collection of specimen(s) by brushing or washing, when performed
- 46607, Anoscopy; diagnostic, with high-resolution magnification (HRA) (eg, colposcope, operating microscope) and chemical agent enhancement, with biopsy, single or multiple
- 0377T, Anoscopy with directed submucosal injection of bulking agent for fecal incontinence.
Replacement codes for vertebral fracture assessments
If your practice is performing or ordering vertebral assessments for patients, there are two new codes to report. The old code, 77082 (Dual-energy X-ray absorptiometry [DXA], bone density study, 1 or more sites; vertebral fracture assessment) for vertebral fracture assessment has been deleted and replaced with:
- 77085, Dual-energy X-ray absorptiometry (DXA), bone density study, 1 or more sites; axial skeleton (eg, hips, pelvis, spine), including vertebral fracture assessment
- 77086, Vertebral fracture assessment via dual-energy X-ray absorptiometry (DXA).
Coding for breast ultrasound and tomosynthesis get more descriptive—at least for private insurance
The CPT Editorial Panel created three codes to describe digital breast tomosynthesis services and two new codes for a breast ultrasound.
- 77061, Digital breast tomosynthesis; unilateral
- 77062, Digital breast tomosynthesis; bilateral
- 77063, Screening digital breast tomosynthesis, bilateral (List separately in addition to the code for the primary procedure.)
- 76641, Ultrasound, breast, unilateral, real time with image documentation, including axilla when performed; complete
- 76642, Ultrasound, breast, unilateral, … ; limited.
Medicare, on the other hand, has decided to create a G code for tomosynthesis, which is the only code that will be accepted for payment if the patient meets her high-risk criteria for performance of this test.
Under Medicare rules you would report/order the following codes for mammographic services:
- Film (use CPT codes)
- 77056, Mammography; bilateral
- 77057, Screening mammography, bilateral (2-view film study of each breast)
- 2D digital (use G0202, G0204, and G0206)
- G0204, Diagnostic mammography, producing direct digital image, bilateral, all views
- G0206, Diagnostic mammography, producing direct digital image, unilateral, all views
- 3D screening (use G0202 for 2D digital plus the new CPT code 77063 for 3D)
procedure.)
- 3D diagnostic (use G0204 or G0206 for the 2D digital plus the new G code G0279 for 3D)
Modifier 59 becomes more specific
Another Medicare coding change that may affect ObGyns is the addition of new Medicare modifiers that are intended to eventually replace the modifier -59. This new list of modifiers will need to be appended to bundled procedures to more clearly explain why the secondary procedures should be paid separately. At the most recent American Medical Association (AMA) CPT symposium in Chicago, Illinois, CMS medical directors indicated that the new modifiers should be used only when the clinician is given instructions to do so by the carrier. Until then, the modifier -59 should continue to be used by most clinicians.
Here are the new modifiers, with an example of their use with currently bundled procedures that allow a modifier -59 to be used under certain circumstances:
- -XE: Separate encounter (A service that is distinct because it occurred during a separate encounter.) For instance, a patient presents to the office in the morning to have an abscess on her labia near her urethra incised and drained (56405). She returns in the afternoon to have a temporary catheter inserted because she states she cannot urinate and you decide to put in a temporary Foley catheter (51702) until the swelling has gone down. Add the modifier XE to 51702 to indicate it was performed at a different patient encounter.
- -XP: Separate practitioner (A service that is distinct because it was performed by a different practitioner.) Normally, Medicare will reimburse an unaffiliated clinician for performing a procedure that is bundled, since the bundling edits apply to the billing surgeon. But when two physicians from the same practice each are performing a different procedure at the same operative session that would otherwise be bundled, this new modifier will make that clear.
For example, Dr. Bates is performing a laparoscopic paravaginal defect repair (57423) and calls Dr. Clark, a urogynecologist in his practice, to remove severe adhesions from the ureters. The claim should go in under the same tax ID number, with the code 50715 listed first (as it has greater RVUs) and code 57423 reported with the -XP modifier.
- -XS: Separate structure (A service that is distinct because it was performed on a separate organ/structure.) Dr. Scott is performing the removal of endometrial implants around the left fallopian tube and in the cul-de-sac and notices that the right fallopian tube appears closed. He performs chromotubation on the right fallopian tube and notes that the right tube is blocked. Billing in this case would be 58662, 58350-XS.
- -XU: Unusual non-overlapping service (The use of a service that is distinct because it does not overlap usual components of the main service.) Mary has Medicare coverage and presents at 20 weeks 4 days gestation with bleeding and labor pains. Her examination shows bulging membranes that rupture when you attempt to remove the cerclage suture. You note a large rent in the cervix, but cannot get to the cerclage sutures as the patient is in active labor and beginning to bear down. The fetus and placenta are delivered a short time later through the rent in the cervix. You repair the rent in the cervix following delivery.
In this case, code 59400-52 (reduced services since the patient delivered at 20 weeks and there were reduced antepartum services), and 57720-XU because the repair of the cervix is not part of the usual services for a vaginal delivery.
Share your thoughts on this article! Send your Letter to the Editor to [email protected]. Please include your name and the city and state in which you practice.