User login
Verrucous Kaposi Sarcoma in an HIV-Positive Man
To the Editor:
Verrucous Kaposi sarcoma (VKS) is an uncommon variant of Kaposi sarcoma (KS) that rarely is seen in clinical practice or reported in the literature. It is strongly associated with lymphedema in patients with AIDS.1 We present a case of VKS in a human immunodeficiency virus (HIV)–positive man with cutaneous lesions that demonstrated minimal response to treatment with efavirenz-emtricitabine-tenofovir, doxorubicin, paclitaxel, and alitretinoin.
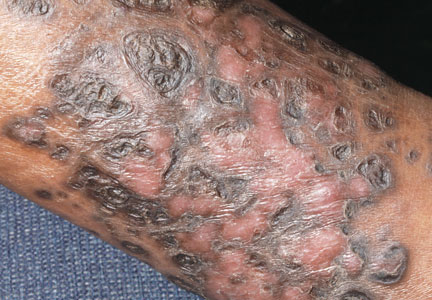
A 48-year-old man with a history of untreated HIV presented with a persistent eruption of heavily scaled, hyperpigmented, nonindurated, thin plaques in an ichthyosiform pattern on the bilateral lower legs and ankles of 4 years’ duration (Figure 1). He also had a number of soft, compressible, cystlike plaques without much overlying epidermal change on the lower extremities. He denied any prior episodes of skin breakdown, drainage, or secondary infection. Findings from the physical examination were otherwise unremarkable.

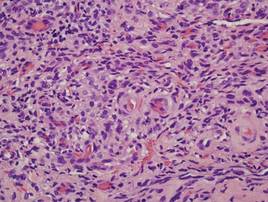
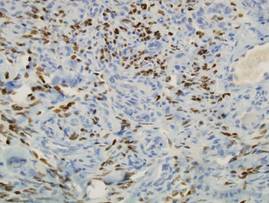
Two punch biopsies were performed on the lower legs, one from a scaly plaque and the other from a cystic area. The epidermis was hyperkeratotic and mildly hyperplastic with slitlike vascular spaces. A dense cellular proliferation of spindle-shaped cells was present in the dermis (Figure 2). Minimal cytologic atypia was noted. Immunohistochemical staining for human herpesvirus 8 (HHV-8) was strongly positive (Figure 3). Histologically, the cutaneous lesions were consistent with VKS.
At the current presentation, the CD4 count was 355 cells/mm3 and the viral load was 919,223 copies/mL. The CD4 count and viral load initially had been responsive to efavirenz-emtricitabine-tenofovir therapy; 17 months prior to the current presentation, the CD4 count was 692 cells/mm3 and the viral load was less than 50 copies/mL. However, the cutaneous lesions persisted despite therapy with efavirenz-emtricitabine-tenofovir, alitretinoin gel, and intralesional chemotherapeutic agents such as doxorubicin and paclitaxel.
Kaposi sarcoma, first described by Moritz Kaposi in 1872, represents a group of vascular neoplasms. Multiple subtypes have been described including classic, African endemic, transplant/AIDS associated, anaplastic, lymphedematous, hyperkeratotic/verrucous, keloidal, micronodular, pyogenic granulomalike, ecchymotic, and intravascular.1-3 Human herpesvirus 8 is associated with all clinical subtypes of KS.3 Immunohistochemical staining for HHV-8 latent nuclear antigen-1 has been shown in the literature to be highly sensitive and specific for KS and can potentially facilitate the diagnosis of KS among patients with similarly appearing dermatologic conditions, such as angiosarcoma, kaposiform hemangioendothelioma, or verrucous hemangioma.1,4 Human herpesvirus 8 infects endothelial cells and induces the proliferation of vascular spindle cells via the secretion of basic fibroblast growth factor and vascular endothelial growth factor.5 Human herpesvirus 8 also can lead to lymph vessel obstruction and lymph node enlargement by infecting cells within the lymphatic system. In addition, chronic lymphedema can itself lead to verruciform epidermal hyperplasia and hyperkeratosis, which has a clinical presentation similar to VKS.1
AIDS-associated KS typically starts as 1 or more purple-red macules that rapidly progress into papules, nodules, and plaques.1 These lesions have a predilection for the head, neck, trunk, and mucous membranes. Albeit a rare presentation, VKS is strongly associated with lymphedema in patients with AIDS.1,3,5 Previously, KS was often the presenting clinical manifestation of HIV infection, but since the use of highly active antiretroviral therapy (HAART) has become the standard of care, the incidence as well as the morbidity and mortality associated with KS has substantially decreased.1,5-7 Notably, in HIV patients who initially do not have signs or symptoms of KS, HHV-8 positivity is predictive of the development of KS within 2 to 4 years.6
In the literature, good prognostic indicators for KS include CD4 count greater than 150 cells/mm3, only cutaneous involvement, and negative B symptoms (eg, temperature >38°C, night sweats, unintentional weight loss >10% of normal body weight within 6 months).7 Kaposi sarcoma cannot be completely cured but can be appropriately managed with medical intervention. All KS subtypes are sensitive to radiation therapy; recalcitrant localized lesions can be treated with excision, cryotherapy, alitretinoin gel, laser ablation, or locally injected interferon or chemotherapeutic agents (eg, vincristine, vinblastine, actinomycin D).5,6 Liposomal anthracyclines (doxorubicin) and paclitaxel are first- and second-line agents for advanced KS, respectively.6
In HIV-associated KS, lesions frequently involute with the initiation of HAART; however, the cutaneous lesions in our patient persisted despite initiation of efavirenz-emtricitabine-tenofovir. He also was given intralesional doxorubicin andpaclitaxel as well as topical alitretinoin but did not experience complete resolution of the cutaneous lesions. It is possible that patients with VKS are recalcitrant to typical treatment modalities and therefore may require unconventional therapies to achieve maximal clearance of cutaneous lesions.
Verrucous Kaposi sarcoma is a rare presentation of KS that is infrequently seen in clinical practice or reported in the literature.3 A PubMed search of articles indexed for MEDLINE using the search term verrucous Kaposi sarcoma yielded 13 articles, one of which included a case series of 5 patients with AIDS and hyperkeratotic KS in Germany in the 1990s.5 Four of the articles were written in French, German, or Portuguese.8-11 The remainder of the articles discussed variants of KS other than VKS.
Although most patients with HIV and KS effectively respond to HAART, it may be possible that VKS is more difficult to treat. In addition, immunohistochemical staining for HHV-8, in particular HHV-8 latent nuclear antigen-1, may be useful to diagnose KS in HIV patients with uncharacteristic or indeterminate cutaneous lesions. Further research is needed to identify and delineate various efficacious therapeutic options for recalcitrant KS, particularly VKS.
Acknowledgment
We are indebted to Antoinette F. Hood, MD, Norfolk, Virginia, who digitized our patient’s histopathology slides.
1. Grayson W, Pantanowitz L. Histological variants of cutaneous Kaposi sarcoma. Diagn Pathol. 2008;3:31.
2. Amodio E, Goedert JJ, Barozzi P, et al. Differences in Kaposi sarcoma-associated herpesvirus-specific and herpesvirus-non-specific immune responses in classic Kaposi sarcoma cases and matched controls in Sicily. Cancer Sci. 2011;102:1769-1773.
3. Fagone S, Cavaleri A, Camuto M, et al. Hyperkeratotic Kaposi sarcoma with leg lymphedema after prolonged corticosteroid therapy for SLE. case report and review of the literature. Minerva Med. 2001;92:177-202.
4. Cheuk W, Wong KO, Wong CS, et al. Immunostaining for human herpesvirus 8 latent nuclear antigen-1 helps distinguish Kaposi sarcoma from its mimickers. Am J Clin Pathol. 2004;121:335-342.
5. Hengge UR, Stocks K, Goos M. Acquired immune deficiency syndrome-related hyperkeratotic Kaposi’s sarcoma with severe lymphedema: report of 5 cases. Br J Dermatol. 2000;142:501-505.
6. James WD, Berger TG, Elston DM, eds. Andrews’ Diseases of the Skin: Clinical Dermatology. 10th ed. Philadelphia, PA: WB Saunders; 2006.
7. Thomas S, Sindhu CB, Sreekumar S, et al. AIDS associated Kaposi’s Sarcoma. J Assoc Physicians India. 2011;59:387-389.
8. Mukai MM, Chaves T, Caldas L, et al. Primary Kaposi’s sarcoma of the penis [in Portuguese]. An Bras Dermatol. 2009;84:524-526.
9. Weidauer H, Tilgen W, Adler D. Kaposi’s sarcoma of the larynx [in German]. Laryngol Rhinol Otol (Stuttg). 1986;65:389-391.
10. Basset A. Clinical aspects of Kaposi’s disease [in French]. Bull Soc Pathol Exot Filiales. 1984;77(4, pt 2):529-532.
11. Wlotzke U, Hohenleutner U, Landthaler M. Dermatoses in leg amputees [in German]. Hautarzt. 1996;47:493-501.
To the Editor:
Verrucous Kaposi sarcoma (VKS) is an uncommon variant of Kaposi sarcoma (KS) that rarely is seen in clinical practice or reported in the literature. It is strongly associated with lymphedema in patients with AIDS.1 We present a case of VKS in a human immunodeficiency virus (HIV)–positive man with cutaneous lesions that demonstrated minimal response to treatment with efavirenz-emtricitabine-tenofovir, doxorubicin, paclitaxel, and alitretinoin.
A 48-year-old man with a history of untreated HIV presented with a persistent eruption of heavily scaled, hyperpigmented, nonindurated, thin plaques in an ichthyosiform pattern on the bilateral lower legs and ankles of 4 years’ duration (Figure 1). He also had a number of soft, compressible, cystlike plaques without much overlying epidermal change on the lower extremities. He denied any prior episodes of skin breakdown, drainage, or secondary infection. Findings from the physical examination were otherwise unremarkable.
Two punch biopsies were performed on the lower legs, one from a scaly plaque and the other from a cystic area. The epidermis was hyperkeratotic and mildly hyperplastic with slitlike vascular spaces. A dense cellular proliferation of spindle-shaped cells was present in the dermis (Figure 2). Minimal cytologic atypia was noted. Immunohistochemical staining for human herpesvirus 8 (HHV-8) was strongly positive (Figure 3). Histologically, the cutaneous lesions were consistent with VKS.
At the current presentation, the CD4 count was 355 cells/mm3 and the viral load was 919,223 copies/mL. The CD4 count and viral load initially had been responsive to efavirenz-emtricitabine-tenofovir therapy; 17 months prior to the current presentation, the CD4 count was 692 cells/mm3 and the viral load was less than 50 copies/mL. However, the cutaneous lesions persisted despite therapy with efavirenz-emtricitabine-tenofovir, alitretinoin gel, and intralesional chemotherapeutic agents such as doxorubicin and paclitaxel.
Kaposi sarcoma, first described by Moritz Kaposi in 1872, represents a group of vascular neoplasms. Multiple subtypes have been described including classic, African endemic, transplant/AIDS associated, anaplastic, lymphedematous, hyperkeratotic/verrucous, keloidal, micronodular, pyogenic granulomalike, ecchymotic, and intravascular.1-3 Human herpesvirus 8 is associated with all clinical subtypes of KS.3 Immunohistochemical staining for HHV-8 latent nuclear antigen-1 has been shown in the literature to be highly sensitive and specific for KS and can potentially facilitate the diagnosis of KS among patients with similarly appearing dermatologic conditions, such as angiosarcoma, kaposiform hemangioendothelioma, or verrucous hemangioma.1,4 Human herpesvirus 8 infects endothelial cells and induces the proliferation of vascular spindle cells via the secretion of basic fibroblast growth factor and vascular endothelial growth factor.5 Human herpesvirus 8 also can lead to lymph vessel obstruction and lymph node enlargement by infecting cells within the lymphatic system. In addition, chronic lymphedema can itself lead to verruciform epidermal hyperplasia and hyperkeratosis, which has a clinical presentation similar to VKS.1
AIDS-associated KS typically starts as 1 or more purple-red macules that rapidly progress into papules, nodules, and plaques.1 These lesions have a predilection for the head, neck, trunk, and mucous membranes. Albeit a rare presentation, VKS is strongly associated with lymphedema in patients with AIDS.1,3,5 Previously, KS was often the presenting clinical manifestation of HIV infection, but since the use of highly active antiretroviral therapy (HAART) has become the standard of care, the incidence as well as the morbidity and mortality associated with KS has substantially decreased.1,5-7 Notably, in HIV patients who initially do not have signs or symptoms of KS, HHV-8 positivity is predictive of the development of KS within 2 to 4 years.6
In the literature, good prognostic indicators for KS include CD4 count greater than 150 cells/mm3, only cutaneous involvement, and negative B symptoms (eg, temperature >38°C, night sweats, unintentional weight loss >10% of normal body weight within 6 months).7 Kaposi sarcoma cannot be completely cured but can be appropriately managed with medical intervention. All KS subtypes are sensitive to radiation therapy; recalcitrant localized lesions can be treated with excision, cryotherapy, alitretinoin gel, laser ablation, or locally injected interferon or chemotherapeutic agents (eg, vincristine, vinblastine, actinomycin D).5,6 Liposomal anthracyclines (doxorubicin) and paclitaxel are first- and second-line agents for advanced KS, respectively.6
In HIV-associated KS, lesions frequently involute with the initiation of HAART; however, the cutaneous lesions in our patient persisted despite initiation of efavirenz-emtricitabine-tenofovir. He also was given intralesional doxorubicin andpaclitaxel as well as topical alitretinoin but did not experience complete resolution of the cutaneous lesions. It is possible that patients with VKS are recalcitrant to typical treatment modalities and therefore may require unconventional therapies to achieve maximal clearance of cutaneous lesions.
Verrucous Kaposi sarcoma is a rare presentation of KS that is infrequently seen in clinical practice or reported in the literature.3 A PubMed search of articles indexed for MEDLINE using the search term verrucous Kaposi sarcoma yielded 13 articles, one of which included a case series of 5 patients with AIDS and hyperkeratotic KS in Germany in the 1990s.5 Four of the articles were written in French, German, or Portuguese.8-11 The remainder of the articles discussed variants of KS other than VKS.
Although most patients with HIV and KS effectively respond to HAART, it may be possible that VKS is more difficult to treat. In addition, immunohistochemical staining for HHV-8, in particular HHV-8 latent nuclear antigen-1, may be useful to diagnose KS in HIV patients with uncharacteristic or indeterminate cutaneous lesions. Further research is needed to identify and delineate various efficacious therapeutic options for recalcitrant KS, particularly VKS.
Acknowledgment
We are indebted to Antoinette F. Hood, MD, Norfolk, Virginia, who digitized our patient’s histopathology slides.
1. Grayson W, Pantanowitz L. Histological variants of cutaneous Kaposi sarcoma. Diagn Pathol. 2008;3:31.
2. Amodio E, Goedert JJ, Barozzi P, et al. Differences in Kaposi sarcoma-associated herpesvirus-specific and herpesvirus-non-specific immune responses in classic Kaposi sarcoma cases and matched controls in Sicily. Cancer Sci. 2011;102:1769-1773.
3. Fagone S, Cavaleri A, Camuto M, et al. Hyperkeratotic Kaposi sarcoma with leg lymphedema after prolonged corticosteroid therapy for SLE. case report and review of the literature. Minerva Med. 2001;92:177-202.
4. Cheuk W, Wong KO, Wong CS, et al. Immunostaining for human herpesvirus 8 latent nuclear antigen-1 helps distinguish Kaposi sarcoma from its mimickers. Am J Clin Pathol. 2004;121:335-342.
5. Hengge UR, Stocks K, Goos M. Acquired immune deficiency syndrome-related hyperkeratotic Kaposi’s sarcoma with severe lymphedema: report of 5 cases. Br J Dermatol. 2000;142:501-505.
6. James WD, Berger TG, Elston DM, eds. Andrews’ Diseases of the Skin: Clinical Dermatology. 10th ed. Philadelphia, PA: WB Saunders; 2006.
7. Thomas S, Sindhu CB, Sreekumar S, et al. AIDS associated Kaposi’s Sarcoma. J Assoc Physicians India. 2011;59:387-389.
8. Mukai MM, Chaves T, Caldas L, et al. Primary Kaposi’s sarcoma of the penis [in Portuguese]. An Bras Dermatol. 2009;84:524-526.
9. Weidauer H, Tilgen W, Adler D. Kaposi’s sarcoma of the larynx [in German]. Laryngol Rhinol Otol (Stuttg). 1986;65:389-391.
10. Basset A. Clinical aspects of Kaposi’s disease [in French]. Bull Soc Pathol Exot Filiales. 1984;77(4, pt 2):529-532.
11. Wlotzke U, Hohenleutner U, Landthaler M. Dermatoses in leg amputees [in German]. Hautarzt. 1996;47:493-501.
A disturbing conversation with another health care provider
One of my pet peeves is when a patient or colleague speaks ill of another health care provider. I find it unbecoming behavior that often (though not always) speaks more to the character of the speaker than that of the object of anger/derision/dissatisfaction. I recently had the misfortune of interacting with a nurse practitioner who behaved in this manner. (The evidence of my hypocrisy does not escape me.)
A patient had been having some vague complaints for about 5 years, including myalgias, headaches, and fatigue. She remembers a tick bite that preceded the onset of symptoms. She tested negative for Lyme disease and other tick-borne illnesses multiple times, but after seeing many different doctors she finally saw an infectious disease doctor who often treats patients for what he diagnoses as a chronic Lyme infection. The patient was on antibiotics for about 5 years. But because she didn’t really feel any better, she started questioning the diagnosis.

I explained to the patient why I thought that fibromyalgia might explain her symptoms. She looked this up on the Internet and found that the disease described her symptoms completely. She was happy to stop antibiotic treatment. However, in the interest of leaving no stone unturned, I referred her to a neurologist for her headaches.
The nurse practitioner who evaluated her sent her for a brain single-photon emission computed tomography scan that showed “multifocal regions of decreased uptake, distribution suggestive of vasculitis or multi-infarct dementia.” The NP then informed the patient of this result, said it was consistent with CNS Lyme, and asked her to return to the infectious disease doctor who then put her back on oral antibiotics.
The patient brought this all to my attention, asking for an opinion. I thought she probably had small vessel changes because she had hyperlipidemia and was a heavy smoker. But I was curious about the decision to label this as CNS Lyme, so I thought I would touch base with the NP. What ensued was possibly one of the most disturbing conversations I’ve had with another health care provider since I started practice.
She didn’t think she needed a lumbar puncture to confirm her diagnosis. She hadn’t bothered to order Lyme serologies or to look for previous results. “We take the patient’s word for it,” she smugly told me. She had full confidence that her diagnosis was correct, because “we see this all the time.” When I said I thought, common things being common, that the cigarette smoking was the most likely culprit for the changes, her response was: “Common things being common, Lyme disease is pretty common around here.” On the question of why the patient was getting oral antibiotics rather than IV antibiotics per Infectious Diseases Society of America guidelines for CNS Lyme, the response I got was again, that she sees this “all the time, and they do respond to oral antibiotics.”
I think the worst part was that when I pointed out that the preponderance of other doctors (two primary care physicians, two infectious disease doctors, another neurologist, another rheumatologist, and myself) did not agree with the diagnosis, her reply was to say that “the ID docs around here are way too conservative when it comes to treating chronic Lyme.”
Of course, she could very well be correct in her diagnosis. However, the conceit with which she so readily accused the ID specialists of being “too conservative” when she clearly did not do the necessary work herself (LP, serologies, etc.) just rubs me the wrong way. Lazy and arrogant make a horrible combination.
I politely disagreed and ended the conversation, but I was so worked up about the situation that I decided to write about it, thereby demonstrating the same bad behavior I claim to dislike. I am afraid at this stage in my professional development magnanimity is not a quality that I yet possess. Hopefully, I will not have many opportunities to demonstrate my lack of it.
Dr. Chan practices rheumatology in Pawtucket, R.I.
One of my pet peeves is when a patient or colleague speaks ill of another health care provider. I find it unbecoming behavior that often (though not always) speaks more to the character of the speaker than that of the object of anger/derision/dissatisfaction. I recently had the misfortune of interacting with a nurse practitioner who behaved in this manner. (The evidence of my hypocrisy does not escape me.)
A patient had been having some vague complaints for about 5 years, including myalgias, headaches, and fatigue. She remembers a tick bite that preceded the onset of symptoms. She tested negative for Lyme disease and other tick-borne illnesses multiple times, but after seeing many different doctors she finally saw an infectious disease doctor who often treats patients for what he diagnoses as a chronic Lyme infection. The patient was on antibiotics for about 5 years. But because she didn’t really feel any better, she started questioning the diagnosis.
I explained to the patient why I thought that fibromyalgia might explain her symptoms. She looked this up on the Internet and found that the disease described her symptoms completely. She was happy to stop antibiotic treatment. However, in the interest of leaving no stone unturned, I referred her to a neurologist for her headaches.
The nurse practitioner who evaluated her sent her for a brain single-photon emission computed tomography scan that showed “multifocal regions of decreased uptake, distribution suggestive of vasculitis or multi-infarct dementia.” The NP then informed the patient of this result, said it was consistent with CNS Lyme, and asked her to return to the infectious disease doctor who then put her back on oral antibiotics.
The patient brought this all to my attention, asking for an opinion. I thought she probably had small vessel changes because she had hyperlipidemia and was a heavy smoker. But I was curious about the decision to label this as CNS Lyme, so I thought I would touch base with the NP. What ensued was possibly one of the most disturbing conversations I’ve had with another health care provider since I started practice.
She didn’t think she needed a lumbar puncture to confirm her diagnosis. She hadn’t bothered to order Lyme serologies or to look for previous results. “We take the patient’s word for it,” she smugly told me. She had full confidence that her diagnosis was correct, because “we see this all the time.” When I said I thought, common things being common, that the cigarette smoking was the most likely culprit for the changes, her response was: “Common things being common, Lyme disease is pretty common around here.” On the question of why the patient was getting oral antibiotics rather than IV antibiotics per Infectious Diseases Society of America guidelines for CNS Lyme, the response I got was again, that she sees this “all the time, and they do respond to oral antibiotics.”
I think the worst part was that when I pointed out that the preponderance of other doctors (two primary care physicians, two infectious disease doctors, another neurologist, another rheumatologist, and myself) did not agree with the diagnosis, her reply was to say that “the ID docs around here are way too conservative when it comes to treating chronic Lyme.”
Of course, she could very well be correct in her diagnosis. However, the conceit with which she so readily accused the ID specialists of being “too conservative” when she clearly did not do the necessary work herself (LP, serologies, etc.) just rubs me the wrong way. Lazy and arrogant make a horrible combination.
I politely disagreed and ended the conversation, but I was so worked up about the situation that I decided to write about it, thereby demonstrating the same bad behavior I claim to dislike. I am afraid at this stage in my professional development magnanimity is not a quality that I yet possess. Hopefully, I will not have many opportunities to demonstrate my lack of it.
Dr. Chan practices rheumatology in Pawtucket, R.I.

Avoiding disillusionment
The holiday season, despite the hustle and bustle, can be a time of reflection. Thanksgiving is a time to reflect on what you have. The secular version of Christmas is a deep plunge into materialism and getting the things you desire. Then come those New Year’s resolutions in which you swear off material things and promise yourself you will become the person you have always wanted to be.
For those in academic settings educating the next cohort of physicians, this time of year has its own rituals. Undergraduate and medical school applications are being reviewed. Medical students are interviewing for residencies. Match day for residents seeking subspecialty fellowships occurs in mid-December. The other residents are starting to interview for real jobs. Overall, a vast undertaking occurs in which talents and aspirations are matched with finite and practical opportunities.
My goal is to advocate for the health of children, so I am concerned about how well pediatrics attracts the best and brightest minds. The best training programs in the world are still going to produce mediocre doctors if we start with mediocre talent. The stakes in recruiting talent are huge. The Washington Post has been running a series on the disappearance of the middle class. Some articles have lamented that the finance sector has recently siphoned off the best and brightest minds to make money by pushing money, rather than creating new technology, products, and jobs (“A black hole for our best and brightest,” by Jim Tankersley on Dec. 14, 2014). My second concern is nourishing the ideals and aspirations of those physician seedlings. Few people keep all their New Year’s resolutions for the entire year, but even partial credit can be important progress in a balanced life.
First, we need to attract people to science. There is a recognized shortage of high school students going into STEM fields (science, technology, engineering, and math). Various programs have been created to attract high school students, and particularly women, to those fields (“Women flocking to statistics, the newly hot, high-tech field of data science,” by Brigid Schulte, the Washington Post, Dec. 19, 2014). This then needs to be reinforced in college. For instance, the analysis of big data in health care is a burgeoning field. We need statisticians who can do the work.
Then we need to attract people to medicine. I’ve been in a few conversations recently about a book titled “Doctored: The Disillusionment of the American Physician,” by Dr. Sandeep Jauhar. I haven’t read more than a few excerpts from the book. An abbreviated version is the author’s essay, “Why Doctors Are Sick of Their Profession,” in the Wall Street Journal (Aug. 29, 2014).
There were enough inaccuracies in that article to dissuade me from reading further, but your mileage may differ. There are data to both support and refute most of his assertions. I believe he is correct that there have been some Faustian bargains made by the past two generations of doctors. Medicine welcomed the improved revenues from Medicare and Medicaid coverage. Those programs improved access, justice, health outcomes, and especially doctors’ incomes, but at a steep price to society. The Golden Goose Dr. Jauhar cited was indeed killed. The following generation of doctors has had to deal with managed care, preapprovals, and denials of payment, along with other cost controls. It was irrational to think that all that money from the government to physicians was going to flow indefinitely without strings. In a related development, the resulting paperwork has crushed solo office practice. Rather than being entrepreneurs, recently boarded pediatricians are trending toward larger group practices and salaried positions. So that affects the degree of independence in a medical career.
In pediatrics, physicians invest considerable time to open career paths into subspecialty areas that interest them, even if the income and lifestyle aren’t better and don’t justify the time and expense of further training. Pediatric hospital medicine is progressing toward becoming a boarded subspecialty with 2-year fellowships. Will that attract the best and brightest of the residents?
Continuing medical education is needed to maintain a knowledge base and a skill set. I assert there also needs to be continuing examination and reinforcement of one’s ideals and life goals. As a pediatrician, I am biased toward believing that maintaining a recommended daily allowance of that activity outperforms making New Year’s resolutions. We all know that crash diets rarely work in the long run.
What practical steps can be taken in the pediatrician’s office? Put up posters that encourage STEM education. Ask adolescents about their plans. The health and life expectancy of your patient will be related far more to his or her career choice than to the discovery of the next medicine to treat chronic hepatitis C. Spending just a moment of each adolescent well visit to explore his/her aspirations also may be just the medicine you need to avoid disillusionment. Maybe you will even inspire a bright teenager to become a pediatrician.
Dr. Powell is a pediatric hospitalist and clinical ethics consultant living in St. Louis. He is also listserv moderator for the American Academy of Pediatrics Section on Hospital Medicine. E-mail him at [email protected].

Vitamin D deficiency
Most physicians can recall the impressive x-ray of the rickets rosary or the flared radial head seen in medical school. On almost every exam, there was an a reference to the infant who was solely breastfed which led to seizures and abnormal finding on physical exam, but in practice, most of us would be hard pressed to recall an infant that presented with any of those symptoms.
With recent guideline changes to require that all infants be supplemented with vitamin D from birth, extreme presentations of vitamin D deficiency such as rickets are rare, but has vitamin D deficiency really gone away?

It is hard to pin down the prevalence of vitamin D deficiency in adolescents; it depends on the cut-off you use. In one study of 307 healthy Boston adolescents presenting for primary care, 24% were vitamin D deficient (serum 25[OH]D level, ≤15 ng/mL); of these 4.6% were severely vitamin D deficient (25[OH]D level, ≤8 ng/mL) (Arch. Pediatr. Adolesc. Med. 2004;158:531-7). Broader studies have demonstrated the prevalence of vitamin D deficiency to be 7% for adolescent males aged 14-18 years and 10% for females that age (National Center for Health Statistics Data Brief No. 59, March 2011). This makes sense given that the natural sources of vitamin D are oily fishes such as salmon and sardines, cod liver oil, liver, egg yolk, and organ meat, none of which are big favorites in the adolescent population.
Other factors that contribute to the rise in D deficiency are the promotion of sunscreen use to block UV rays which are essential for cutaneous synthesis. Skin cancer prevention and the promotion of the use of sunscreen and a direct correlation of lower vitamin D levels have been identified(Am. J. Clin. Nutr. 2008;88:1519-27).
Obesity plays a unique role, in that it causes sequestration of the vitamin D into the fat cells. With the dramatic rise in adolescent obesity plus poor nutritional intake, vitamin D deficiency is the natural result.
Clinically it is easy for vitamin D deficiency to go unnoticed. Bones have mineralized, so the typical changes seen in the infant do not occur in the adolescent. But what is apparent is the generalized fatigue, muscle or bone pain, and increased upper respiratory infections. Adolescents with low vitamin D levels also are at increased risk for hypertension, elevated blood sugars, and metabolic syndrome.
Screening for vitamin D deficiency is imperative for the adolescent age group who have been identified to have risk factors because the deficiency can compound other illnesses, prevents appropriate bone mineralization, and decreases the patient’s generalized sense of well-being. Serum 25(OH)D has a long half-life and is a better predictor of serum levels (Am. J. Clin. Nutr. 2008;88:582S-6S).
Supplementation of Vitamin D should be in the form of D3, which has been shown to be more efficient in raising the serum level (Am. J. Clin. Nutr. 2012;95:1357-64), and dose will vary depending on the severity. Complimenting it with a calcium supplement also will improve bone mineralization and absorption.
Vitamin D deficiency is not a thing of the past. A simple nutritional review with every encounter allows for the educational opportunity for healthy eating and appropriate supplementation. The patient with recurrent upper respiratory infections should be encouraged to maintain a daily intake of at least 600 IU, but in patients with increased risk factors an actual blood test should be done to determine the amount that should be prescribed.
Dr. Pearce is a pediatrician in Frankfort, Ill. She had no relevant financial disclosures. E-mail her at [email protected]. Scan this QR code or go to pediatricnews.com to view similar articles.
Most physicians can recall the impressive x-ray of the rickets rosary or the flared radial head seen in medical school. On almost every exam, there was an a reference to the infant who was solely breastfed which led to seizures and abnormal finding on physical exam, but in practice, most of us would be hard pressed to recall an infant that presented with any of those symptoms.
With recent guideline changes to require that all infants be supplemented with vitamin D from birth, extreme presentations of vitamin D deficiency such as rickets are rare, but has vitamin D deficiency really gone away?
It is hard to pin down the prevalence of vitamin D deficiency in adolescents; it depends on the cut-off you use. In one study of 307 healthy Boston adolescents presenting for primary care, 24% were vitamin D deficient (serum 25[OH]D level, ≤15 ng/mL); of these 4.6% were severely vitamin D deficient (25[OH]D level, ≤8 ng/mL) (Arch. Pediatr. Adolesc. Med. 2004;158:531-7). Broader studies have demonstrated the prevalence of vitamin D deficiency to be 7% for adolescent males aged 14-18 years and 10% for females that age (National Center for Health Statistics Data Brief No. 59, March 2011). This makes sense given that the natural sources of vitamin D are oily fishes such as salmon and sardines, cod liver oil, liver, egg yolk, and organ meat, none of which are big favorites in the adolescent population.
Other factors that contribute to the rise in D deficiency are the promotion of sunscreen use to block UV rays which are essential for cutaneous synthesis. Skin cancer prevention and the promotion of the use of sunscreen and a direct correlation of lower vitamin D levels have been identified(Am. J. Clin. Nutr. 2008;88:1519-27).
Obesity plays a unique role, in that it causes sequestration of the vitamin D into the fat cells. With the dramatic rise in adolescent obesity plus poor nutritional intake, vitamin D deficiency is the natural result.
Clinically it is easy for vitamin D deficiency to go unnoticed. Bones have mineralized, so the typical changes seen in the infant do not occur in the adolescent. But what is apparent is the generalized fatigue, muscle or bone pain, and increased upper respiratory infections. Adolescents with low vitamin D levels also are at increased risk for hypertension, elevated blood sugars, and metabolic syndrome.
Screening for vitamin D deficiency is imperative for the adolescent age group who have been identified to have risk factors because the deficiency can compound other illnesses, prevents appropriate bone mineralization, and decreases the patient’s generalized sense of well-being. Serum 25(OH)D has a long half-life and is a better predictor of serum levels (Am. J. Clin. Nutr. 2008;88:582S-6S).
Supplementation of Vitamin D should be in the form of D3, which has been shown to be more efficient in raising the serum level (Am. J. Clin. Nutr. 2012;95:1357-64), and dose will vary depending on the severity. Complimenting it with a calcium supplement also will improve bone mineralization and absorption.
Vitamin D deficiency is not a thing of the past. A simple nutritional review with every encounter allows for the educational opportunity for healthy eating and appropriate supplementation. The patient with recurrent upper respiratory infections should be encouraged to maintain a daily intake of at least 600 IU, but in patients with increased risk factors an actual blood test should be done to determine the amount that should be prescribed.
Dr. Pearce is a pediatrician in Frankfort, Ill. She had no relevant financial disclosures. E-mail her at [email protected]. Scan this QR code or go to pediatricnews.com to view similar articles.

New and Noteworthy Information—January 2015
Diabetes prevention and glucose control in midlife may protect against late-life cognitive decline, according to a study published December 2 in Annals of Internal Medicine. Researchers analyzed data from the Atherosclerosis Risk in Communities Study (ARIC). The investigators compared the amount of cognitive decline associated with aging with the amount of decline found in the ARIC participants. The study authors determined that participants with poorly controlled diabetes had 19% more cognitive decline than expected. They also observed declines for participants with controlled diabetes and prediabetes. “Knowing that the risk for cognitive impairments begins with diabetes and other risk factors in midlife can be a strong motivator for patients and their doctors to adopt and maintain long-term healthy practices,” stated the researchers.
The likelihood of receiving a clinical cognitive evaluation in elderly individuals with dementia depends on patient-specific factors such as severity of cognitive impairment and current marital status, according to a study published online ahead of print November 26 in Neurology. The investigation was part of the Health and Retirement Study. Eight hundred forty-five people age 70 and older were evaluated for dementia, and 297 met the criteria for dementia. Of those people, 45% had seen a doctor about their memory problems, compared with 5% of those with memory and thinking problems that did not meet the criteria for dementia, and 1% of those with normal memory and thinking skills. People who were married were more than twice as likely to undergo screening as people who were not married.
Stimwave Technologies (Miami Beach, Florida) has received FDA clearance to market the Stimwave Freedom Spinal Cord Stimulator System, a wireless, microtechnology neuromodulation device for the relief of chronic back pain and leg pain. The device, a long-term implant, is between 2 and 11 cm long and can be inserted through a standard needle. The Stimwave Freedom Spinal Cord Stimulator System also eliminates the need for long wires to be tunneled through the body and connected to the battery source. Patients who receive the system can undergo whole-body 3-T or 1.5-T MRI without removing the implant. The Stimwave technology is also fixed in place by an anchor that allows it to move only when the body moves. The device contains no internal batteries or toxic materials.
Chronic impairment of glymphatic pathway function after traumatic brain injury (TBI) may be a key factor that renders the post-traumatic brain vulnerable to tau aggregation and the onset of neurodegeneration, according to a study published December 3 in Journal of Neuroscience. Previously, investigators defined a network of paravascular channels called the glymphatic pathway that facilitates the clearance of solutes such as amyloid-β from the brain. The researchers demonstrated that extracellular tau in mice is cleared from the brain along the paravascular pathways. After TBI, glymphatic pathway function was reduced by 60%, and this impairment persisted for at least one month after injury. Knockout of the gene encoding the astroglial water channel aquaporin-4 exacerbated glymphatic pathway dysfunction after TBI and promoted the development of neurofibrillary pathology and neurodegeneration in the post-traumatic brain.
In patients with transient ischemic attack (TIA), CT evidence of acute ischemia alone or acute ischemia with chronic ischemia is associated with increased subsequent stroke risk within 90 days, according to a study published online ahead of print December 4 in Stroke. Of 2,028 patients who received CT scans within 24 hours of a TIA, 814 (40.1%) had brain damage resulting from ischemia. In addition, 3.4% of the people in the study group had a subsequent stroke within 90 days, and 25% of patients with CT scans showing three types of damage to their brain had strokes. “These findings should prompt physicians to be more aggressive in managing patients with TIA or nondisabling stroke who are diagnosed with acute ischemia, especially if there is additional chronic ischemia and microangiopathy,” the researchers said.
People who have sleep apnea or spend less time in deep sleep may be more likely to have changes in the brain that are associated with dementia, according to a study published December 10 in Neurology. A total of 167 Japanese–American men had sleep tests in their homes at an average age of 84. All men were followed until they died at an average of six years later. Autopsies were conducted on their brains to look for microinfarcts. Of the 41 men who spent the least sleep time with low blood oxygen levels, four had microinfarcts in the brain. Fourteen of the 42 men with the most sleep time with low blood oxygen levels had the abnormalities; thus, they were nearly four times more likely to develop brain damage.
Brains affected by autism share a pattern of increased immune responses, according to a data analysis published December 10 in Nature Communications. The researchers examined gene expression in samples from two tissue banks, comparing gene expression in people with autism with that in controls without the condition. Data from 104 brain samples from 72 individuals were analyzed. The investigators focused their analysis on microglial cells. In the brains with autism, the microglial cells appeared to be perpetually activated, and their genes for inflammation responses were activated. The results highlight “the lack of current understanding about how innate immunity controls neural circuits,” stated the study authors. Given the known genetic contributors to autism, inflammation is unlikely to be its root cause, they added.
Compared with placebo, progesterone did not improve outcomes when administered to patients with acute traumatic brain injury (TBI), according to a study published online ahead of print December 10 in the New England Journal of Medicine. Patients were randomly assigned to IV progesterone or placebo, and study treatment was initiated within four hours after injury and administered for 96 hours. The trial was stopped for futility. The researchers found no significant difference between the progesterone group and the placebo group in the proportion of patients with a favorable outcome. Favorable outcomes occurred in 51% of patients who received progesterone and in 56% of those who received placebo. Mortality after six months was 18.8% for participants receiving progesterone and 15.7% for those receiving placebo. Phlebitis was more common in the progesterone group.
Learning-related brain activity in patients with Parkinson’s disease improves as much in response to placebo as to medication, according to a study published in the December issue of Nature Neuroscience. For the study, researchers used functional MRI to scan the brains of 18 patients with Parkinson’s disease as they played a computer game that measures reward learning. In the game, participants discover through trial and error which of two symbols is more likely to lead to a better outcome. Participants played the game when they were not taking medication, when they took medication, and when they took placebo. The researchers found that the dopamine-rich areas of the brain associated with reward learning became equally active when patients took either the real medication or the placebo.
Oral fingolimod may improve outcomes for patients with acute and anterior cerebral circulation occlusion stroke, according to a study published online ahead of print December 8 in Proceedings of the National Academy of Sciences. The researchers conducted an open-label, evaluator-blinded, parallel-group clinical pilot trial of 22 patients with anterior cerebral circulation occlusion, among whom stroke onset had occurred more than 4.5 hours previously. Participants received standard management alone or standard management plus 0.5 mg of oral fingolimod per day for three consecutive days. Patients receiving fingolimod had lower circulating lymphocyte counts, milder neurologic deficits, and better recovery of neurologic functions. Neurologic rehabilitation was faster among participants who received fingolimod. In addition, enlargement of lesion size was less pronounced between baseline and day seven among patients who received fingolimod.
Migraine headache may double the risk of Bell’s palsy, according to a study published online ahead of print December 17 in Neurology. Two groups of 136,704 people age 18 and older, one group with migraine and one without, were followed for an average of three years. During that time, 671 people in the migraine group and 365 people in the control group were diagnosed with Bell’s palsy. Participants with migraine were twice as likely to develop Bell’s palsy, even after researchers accounted for other factors that could increase the risk of the condition, such as sex, high blood pressure, and diabetes. “Infection, inflammation, or heart and vascular problems could be shared causes for these diseases,” stated the researchers.
Struggling to balance on one leg for 20 seconds or longer is linked to an increased risk for small blood vessel damage in the brain and reduced cognitive function in healthy people with no clinical symptoms, according to a study published online ahead of print December 18 in Stroke. Investigators examined 841 women and 546 men with an average age of 67. To measure one-leg standing time, participants stood with their eyes open and raised one leg. In all, 34.5% of participants with more than two lacunar infarction lesions had trouble balancing, 16% of people with one lacunar infarction lesion had trouble balancing, 30% of participants with more than two microbleed lesions had trouble balancing, and 15.3% of people with one microbleed lesion had trouble balancing.
—Kimberly D. Williams

Type of Sickle Cell Disease May Affect Risk of Neurodevelopmental Disorders
COLUMBUS, OHIO—Among children with sickle cell disease, type of disease and presence of comorbidities may increase the risk for attentional or behavioral problems, according to research presented at the 43rd Annual Meeting of the Child Neurology Society. Demographics and disease complications also may influence the risk of neurodevelopmental disorders among these children.
“Earlier identification of pediatric patients with sickle cell disease and attention deficit hyperactivity disorder (ADHD), intellectual disability, and specific learning disabilities will allow faster treatment of these disorders and may improve academic performance and quality of life,” said Eboni I. Lance, MD, Co-Medical Director of the Sickle Cell Neurodevelopmental Clinic at Kennedy Krieger Institute in Baltimore.
ADHD Was Common Among Participants
From May 2012 to March 2014, Dr. Lance and colleagues conducted a retrospective chart review of children with sickle cell disease who presented to Kennedy Krieger Institute or Johns Hopkins Hospital. The investigators reviewed the charts for documentation of neurodevelopmental diagnoses such as ADHD; attentional problems; behavioral problems; executive dysfunction; learning disabilities in math, reading, and reading comprehension; intellectual disabilities; developmental delay; fine motor disorders; language disorders; and autism spectrum disorders. The researchers also extracted from the charts data about age, genotype of sickle cell disease, disease complication history, treatments, and school services.
A total of 59 children met inclusion criteria, including 18 who presented to Kennedy Krieger Institute and 41 who presented to Johns Hopkins Hospital. Patients’ average age was 17, and 58% of participants were male. Nearly all (97%) of the children were African American. About 63% of the children had hemoglobin SS type sickle cell disease, 20% had hemoglobin SC, and 10% had hemoglobin S-Beta thalassemia.
When the researchers reviewed participants’ neurodevelopmental diagnoses, they found that 19% of patients had ADHD, 19% had developmental delay, 12% had attention problems, 12% had learning disabilities in math, and 12% had learning disabilities in reading comprehension. Also, 10% of participants had a language disorder, 8% had anxiety, and 8% had behavioral problems.
Associations and Risks for Neurodevelopmental Disorders
Children with hemoglobin S-Beta thalassemia plus or null had significantly higher odds of attention problems than children with the hemoglobin SS type of sickle cell disease. Children with sickle cell disease and a history of asthma had significantly greater odds of behavioral problems than children with sickle cell disease without a history of asthma, even after adjustment for gender and sickle cell disease type. The investigators found no other significant relationships between other neurodevelopmental disorders and demographic characteristics or disease-related complications. They noted that stroke was not associated with significantly increased risk of a specific neurodevelopmental diagnosis, in comparison with other neurodevelopmental disorders.
“There may be differences in the disease phenotype, demographics, and prevalence of certain neurodevelopmental disorders within the pediatric sickle cell disease population,” said Dr. Lance. “Children with sickle cell disease should be screened for neurodevelopmental disorders, with emphasis on specific disease-related characteristics and complications as potential risk factors,” added Dr. Lance. “Specifically, evaluations should include a detailed sickle cell disease history of disease characteristics and complications, as well the typical history of neurologic complications and neurodevelopmental symptoms.”
—Erik Greb
Suggested Reading
Hensler M, Wolfe K, Lebensburger J, et al. Social skills and executive function among youth with sickle cell disease: a preliminary investigation. J Pediatr Psychol. 2014;39(5):493-500.
Hogan AM, Telfer PT, Kirkham FJ, de Haan M. Precursors of executive function in infants with sickle cell anemia. J Child Neurol. 2013;28(10):1197-1202.
COLUMBUS, OHIO—Among children with sickle cell disease, type of disease and presence of comorbidities may increase the risk for attentional or behavioral problems, according to research presented at the 43rd Annual Meeting of the Child Neurology Society. Demographics and disease complications also may influence the risk of neurodevelopmental disorders among these children.
“Earlier identification of pediatric patients with sickle cell disease and attention deficit hyperactivity disorder (ADHD), intellectual disability, and specific learning disabilities will allow faster treatment of these disorders and may improve academic performance and quality of life,” said Eboni I. Lance, MD, Co-Medical Director of the Sickle Cell Neurodevelopmental Clinic at Kennedy Krieger Institute in Baltimore.
ADHD Was Common Among Participants
From May 2012 to March 2014, Dr. Lance and colleagues conducted a retrospective chart review of children with sickle cell disease who presented to Kennedy Krieger Institute or Johns Hopkins Hospital. The investigators reviewed the charts for documentation of neurodevelopmental diagnoses such as ADHD; attentional problems; behavioral problems; executive dysfunction; learning disabilities in math, reading, and reading comprehension; intellectual disabilities; developmental delay; fine motor disorders; language disorders; and autism spectrum disorders. The researchers also extracted from the charts data about age, genotype of sickle cell disease, disease complication history, treatments, and school services.
A total of 59 children met inclusion criteria, including 18 who presented to Kennedy Krieger Institute and 41 who presented to Johns Hopkins Hospital. Patients’ average age was 17, and 58% of participants were male. Nearly all (97%) of the children were African American. About 63% of the children had hemoglobin SS type sickle cell disease, 20% had hemoglobin SC, and 10% had hemoglobin S-Beta thalassemia.
When the researchers reviewed participants’ neurodevelopmental diagnoses, they found that 19% of patients had ADHD, 19% had developmental delay, 12% had attention problems, 12% had learning disabilities in math, and 12% had learning disabilities in reading comprehension. Also, 10% of participants had a language disorder, 8% had anxiety, and 8% had behavioral problems.
Associations and Risks for Neurodevelopmental Disorders
Children with hemoglobin S-Beta thalassemia plus or null had significantly higher odds of attention problems than children with the hemoglobin SS type of sickle cell disease. Children with sickle cell disease and a history of asthma had significantly greater odds of behavioral problems than children with sickle cell disease without a history of asthma, even after adjustment for gender and sickle cell disease type. The investigators found no other significant relationships between other neurodevelopmental disorders and demographic characteristics or disease-related complications. They noted that stroke was not associated with significantly increased risk of a specific neurodevelopmental diagnosis, in comparison with other neurodevelopmental disorders.
“There may be differences in the disease phenotype, demographics, and prevalence of certain neurodevelopmental disorders within the pediatric sickle cell disease population,” said Dr. Lance. “Children with sickle cell disease should be screened for neurodevelopmental disorders, with emphasis on specific disease-related characteristics and complications as potential risk factors,” added Dr. Lance. “Specifically, evaluations should include a detailed sickle cell disease history of disease characteristics and complications, as well the typical history of neurologic complications and neurodevelopmental symptoms.”
—Erik Greb
Suggested Reading
Hensler M, Wolfe K, Lebensburger J, et al. Social skills and executive function among youth with sickle cell disease: a preliminary investigation. J Pediatr Psychol. 2014;39(5):493-500.
Hogan AM, Telfer PT, Kirkham FJ, de Haan M. Precursors of executive function in infants with sickle cell anemia. J Child Neurol. 2013;28(10):1197-1202.
Drug gets orphan designation for WM
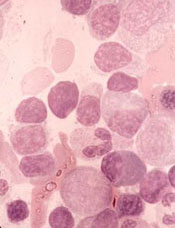
The US Food and Drug Administration (FDA) has granted orphan drug designation for IMO-8400, an antagonist of the endosomal Toll-like receptors (TLRs) 7, 8 and 9, for the treatment of Waldenström’s macroglobulinemia (WM).
The designation provides the drug’s maker, Idera Pharmaceuticals, with certain incentives, including eligibility for federal grants, research and development tax credits, and 7 years of marketing exclusivity if the product is approved.
Preclinical studies have shown that, in WM and other B‐cell lymphomas characterized by the MYD88 L265P oncogenic mutation, TLR signaling is overactivated. And this enables tumor cell survival and proliferation.
About 90% of WM patients are reported to harbor the MYD88 L265P mutation.
In research presented at the 2014 AACR Annual Meeting, investigators showed that IMO-8400 decreased the viability of mutated WM cells and diffuse large B-cell lymphoma (DLBCL) cells in vitro. The drug also decreased tumor growth and prolonged survival in mice with MYD88 L265P-positive DLBCL.
Now, Idera is conducting a phase 1/2 trial (NCT02092909) of IMO-8400 in patients with WM who have a history of relapse or failure to respond to one or more prior therapies. The protocol includes 3 dose-escalation cohorts of IMO-8400 administered subcutaneously.
The trial’s independent data review committee has completed its review of 4-week safety data from the second dose cohort (1.2 mg/kg/week) and has determined that Idera may open enrollment in the third dose cohort (2.4 mg/kg/week).
Final 24-week safety and clinical activity data are anticipated in the second half of 2015.
Aside from WM, Idera is pursuing clinical development of IMO-8400 in DLBCL patients harboring the MYD88 L265P mutation and in rare autoimmune diseases, including dermatomyositis. ![]()
A night in the tropicals
In a recent column, I considered the different meanings some words we use every day can have when patients use them. The word I discussed was “biopsy.” There are, of course, many other words our patients use, or at least pronounce, differently than we do.
Many middle-aged men, for instance, have troubles with their prostrate.
Patients of both genders may be quite outgoing in general, but the cells in their skin cancers are squeamish.
And lots of people ask me to take a look at their molds. Or remove them. Or they write as a reason for “Why are you seeing the doctor today?” the answer “Check molds.”
Or sometimes patients tell me that the medicine I prescribed for their eczema not only hadn’t helped, but had exasperated things. (This works both ways. The other day a friend complained that his kids were really exacerbating him. As a parent, I can relate.)
And then there was Jim, who came in last month. “Dr. Skirball sent me over to have you look at this rash,” he said. “He wants you to do an autopsy.”
Well, Dr. Skirball was just going to have to wait, wasn’t he?
But then I saw Emma, who presented me with a linguistic insight I never heard before. Even after many years, patients can surprise you.
Emma is 17. She has acne. One glance showed that after 2 months of treatment, Emma wasn’t getting any better.
“Is the cream irritating you at all?” I asked.
“No,” she said. “I’m not using it, Doctor.”
OK, I thought. That happens often enough. I needed to find out why, though. Maybe I could convince her to try it after all.
“How come you didn’t use it?” I asked.
“I read the instructions that came with it,” Emma said, brightly. “And I followed them!”
“That’s great,” I said. “What do you mean?”
“Well, I read the small print at the end, and I saw that there was a warning: ‘Only for tropical use.’ ”
“What?”
“It said it was just for tropical use. And just around then it got kind of chilly, so I decided not to take a chance.”
I’ve seen plenty of people who read a label warning that says, “Avoid excessive sun exposure,” (whatever that means) and think they should stop the medicine every time the sun comes out. In fact, I always tell patients up front to ignore that warning, to follow routine sun precautions when relevant, and take the medicine.
And I’ve also heard plenty of people pronounce topical treatment, “tropical treatment.” Or refer to the branded version of desoximetasone as “Tropicort.”
But never, ever, had I met someone who not only mispronounced “topical” as “tropical,” but understood it as “of or pertaining to the tropics.” And then didn’t use the product, because they live in the temperate zone.
Besides, it’s late fall in Boston. What was Emma planning to do? Wait till next spring? Move to the Cayman Islands?
While we’re at it, why don’t many patients bother calling to tell us that the reason they’ve decided to stop using something we prescribed? But that’s another story.
“Emma,” I explained. “It’s not ‘tropical use.’ It’s ‘topical use.’ That just means you use it externally. On top of the skin.”
“Oh, I get it,” Emma said.
As I said, patients never cease to amaze. The weather’s gotten even chillier around here, but now that Emma will use the cream, we’ll see how she does. If she goes to Mexico for winter break, she’ll do even better.
Where is global warming when you need it?
Dr. Rockoff practices dermatology in Brookline, Mass., and is a longtime contributor to Dermatology News. He serves on the clinical faculty at Tufts University, Boston, and has taught senior medical students and other trainees for 30 years.

Certain cancers primarily result from ‘bad luck’

in the bone marrow
Scientists have created a statistical model that measures the proportion of cancer incidence, across many tissue types, caused mainly by random mutations that occur when stem cells divide.
By their measure, two-thirds of adult cancers—including certain leukemias—can be explained primarily by “bad luck,” when these random mutations occur in genes that can drive cancer growth.
The remaining third are due to environmental factors and inherited genes.
“All cancers are caused by a combination of bad luck, the environment, and heredity, and we’ve created a model that may help quantify how much of these three factors contribute to cancer development,” said Bert Vogelstein, MD, of the Johns Hopkins University School of Medicine.
Dr Vogelstein and Cristian Tomasetti, PhD, also of the Johns Hopkins University School of Medicine, detailed these findings in Science.
The pair came to their conclusions by searching the scientific literature for information on the cumulative number of stem cell divisions in 31 tissue types during an average individual’s lifetime.
The researchers knew that cancer arises when tissue-specific stem cells make random mistakes, or mutations. But the actual contribution of these random mistakes to cancer incidence, in comparison to the contribution of hereditary or environmental factors, was unclear.
To sort out the role of random mutations in cancer risk, the team charted the number of stem cell divisions in 31 tissues and compared these rates with the lifetime risks of cancer in the same tissues among Americans.
From this data scatterplot, Drs Tomasetti and Vogelstein determined the correlation between the total number of stem cell divisions and cancer risk to be 0.804. Mathematically, the closer this value is to 1, the more stem cell divisions and cancer risk are correlated.
“Our study shows, in general, that a change in the number of stem cell divisions in a tissue type is highly correlated with a change in the incidence of cancer in that same tissue,” Dr Vogelstein said.
One example is in colon tissue, which undergoes 4 times more stem cell divisions than small intestine tissue in humans. Likewise, colon cancer is much more prevalent than small intestinal cancer.
“You could argue that the colon is exposed to more environmental factors than the small intestine, which increases the potential rate of acquired mutations,” Dr Tomasetti said.
However, the scientists observed the opposite in mouse colons, which had a lower number of stem cell divisions than in their small intestines. In mice, cancer incidence is lower in the colon than in the small intestine. The researchers believe this supports the role of the total number of stem cell divisions in the development of cancer.
Using statistical theory, the pair calculated how much of the variation in cancer risk can be explained by the number of stem cell divisions, which is 0.804 squared, or, in percentage form, approximately 65%.
Finally, the scientists classified the types of cancers they studied into two groups. They calculated which cancer types had an incidence predicted by the number of stem cell divisions and which had higher incidence.
They found that 22 cancer types—including acute myeloid leukemia and chronic lymphocytic leukemia—could be largely explained by the “bad luck” factor of random DNA mutations during cell division.
The other 9 cancer types had incidences higher than predicted by “bad luck” and were presumably due to a combination of bad luck plus environmental or inherited factors.
“We found that the types of cancer that had higher risk than predicted by the number of stem cell divisions were precisely the ones you’d expect, including lung cancer, which is linked to smoking; skin cancer, linked to sun exposure; and forms of cancers associated with hereditary syndromes,” Dr Vogelstein said.
“This study shows that you can add to your risk of getting cancers by smoking or other poor lifestyle factors. However, many forms of cancer are due largely to the bad luck of acquiring a mutation in a cancer driver gene regardless of lifestyle and heredity factors. The best way to eradicate these cancers will be through early detection, when they are still curable by surgery.”
The researchers noted that some cancers, such as breast and prostate cancer, were not included in the report because the team was unable to find reliable stem cell division rates in the scientific literature.
They hope other scientists will help refine their statistical model by finding more precise stem cell division rates. ![]()
Insomnia and e-books
Seems that none of my patients sleeps, or at least not very well. Indeed, population-based studies suggest that almost one-third of adults report difficulty initiating or maintaining sleep, waking up too early, and/or nonrestorative or poor quality of sleep.
Light-emitting electronic “e-readers” or “e-books” have exploded as a favorite medium for reading. Many of my patients tell me that when they are unable to sleep, they read. Much of this reading occurs on e-books. But artificial light can produce alerting effects and suppress melatonin. This might be causing or worsening the national insomnia epidemic.
Dr. Anne-Marie Chang and colleagues conducted a randomized, crossover study evaluating the impact of an e-book and a traditional book on sleep (PNAS 2014 Dec. 22 [doi:10.1073/pnas.1418490112]). In the study, 12 healthy young adults were randomized to two conditions: 1) reading an e-book for 4 hours before bedtime; or 2) reading a printed book for 4 hours before bedtime on 5 consecutive evenings. Participants then switched conditions.
The e-book suppressed evening levels of melatonin by 55%, whereas the printed book showed no suppression, and the e-book shifted the melatonin onset to more than 1.5 hours later. Compared with the printed book, the e-book also significantly increased sleep latency (10 minutes longer), decreased REM sleep by11 minutes, decreased evening sleepiness, and increased morning sleepiness.
But not all e-book readers are created equal. Screens of devices used in the current study emit blue light (wavelength 452 nm), the type of light most implicated in melatonin suppression. Newer “e-ink” readers do not emit this light and are “front lit,” with light cast inward rather than outward.
People struggling with insomnia should be encouraged to explore the e-ink options. The table included in the study can provide some guidance as to the type of e-book that may be most beneficial to our sleepy patients.
Dr. Ebbert is professor of medicine, a general internist at the Mayo Clinic in Rochester, Minn., and a diplomate of the American Board of Addiction Medicine. The opinions expressed are those of the author. The opinions expressed in this article should not be used to diagnose or treat any medical condition nor should they be used as a substitute for medical advice from a qualified, board-certified practicing clinician.