User login
October 2015 Quiz 1
ANSWER: A
Critique
Extrahepatic biliary atresia accounts for 25%-30% of children with neonatal cholestasis and it is the most commonly identified etiology. Despite the identification and ability to test for many other causes, idiopathic disease still accounts for a similar proportion of infants with cholestasis. Galactosemia, disorders of bile acid biosynthesis, and panhypopituitarism each account for 1% or slightly more of neonatal cholestasis. Autoimmune hepatitis is not a usual consideration in neonates.
Reference
Dellert S., Balistreri W., Neonatal cholestasis. In: Pediatric Gastrointestinal Disease: Pathophysiology, Diagnosis, Management, 3rd ed. Walker A., Durie P., Hamilton R., Walker–Smith J., eds. Hamilton, Ontario: B. C. Decker, 2000;52:880-94.
Does high dietary soy intake affect a woman’s risk of primary or recurrent breast cancer?
No, it doesn’t affect the risk of primary breast cancer, but it does (favorably) affect the risk of cancer recurrence.
Compared with diets low in soy, high dietary intake of soy protein or soy isoflavones isn’t associated with any alteration in the risk of developing primary breast cancer (strength of recommendation [SOR]: B, systematic review of prospective cohort studies). In patients with breast cancer, however, consuming a diet high in soy is associated with a 25% decrease in cancer recurrence and a 15% decrease in mortality (SOR: B, prospective cohort studies).
EVIDENCE SUMMARY
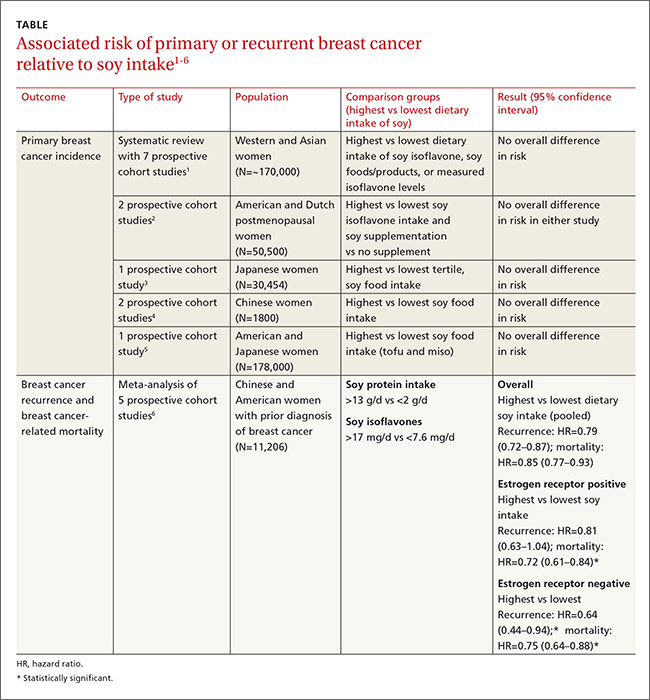
A large systematic review evaluated the relationship between dietary soy intake and risk of a primary breast cancer diagnosis. It included 7 prospective cohort studies, which comprised the best quality evidence available (numerous other reviewed studies were of lower quality). The review found no significant association between dietary soy intake and primary breast cancer (TABLE1-6).
Investigators either surveyed women for intake of soy isoflavones or soy foods or products (tofu, soybeans, lentils, miso) or measured urinary or plasma levels of soy isoflavones. They adjusted for age, alcohol use, smoking status, body mass index, caloric intake, and hormone replacement therapy, then followed subjects for 7 to 23 years, comparing the risk of breast cancer for the lowest and highest levels of soy intake.
Six of the prospective cohort studies found no association between soy intake and breast cancer risk; one study, comprising 4% of the total population, found a lower risk with higher soy intake (effect size=0.44; 95% confidence interval [CI], 0.26-0.73; an effect size of 0.2 is considered small, 0.6 medium, and 1.2 large). The authors didn’t do a meta-analysis of the prospective cohort studies.
Other cohort studies yield similar findings
Four other large systematic reviews evaluating soy intake and breast cancer risk incorporated a total of 6 individual prospective cohort studies that weren’t included in the previously described review (again, these studies comprised the best quality evidence within the reviews). The 6 studies found no association between soy intake and breast cancer risk.
In 2 of the studies, investigators surveyed postmenopausal women and followed them for 4 to 8 years.2 Investigators in another study adjusted for age, family and gynecologic history, hormone and medication use, exercise, and other factors.3 In 2 other studies, investigators evaluated population subsets that consumed the most vs the fewest servings per week or kilograms per year of soy foods.4 The sixth study compared low with high intake of soy foods and miso.5
Soy intake after breast cancer diagnosis reduces recurrence risk in most studies
Most prospective cohort studies evaluating the association between dietary soy intake after breast cancer diagnosis found an overall 21% decrease in recurrence with high soy intake and a 15% reduction in mortality (TABLE1-6).
Investigators in a meta-analysis of 5 studies that followed women for 4 to 7 years after first breast cancer diagnosis found that higher soy intake was associated with lower mortality but not less recurrence in women who were estrogen receptor positive. Both recurrence and mortality were decreased in estrogen receptor negative women.6
The study also found lower recurrence and mortality in premenopausal women with higher soy intake (recurrence hazard ratio [HR]=0.91; 95% CI, 0.72-1.14; mortality HR=0.78; 95% CI, 0.69-0.88). In postmenopausal women, higher intake was likewise associated with improvement of both outcomes (recurrence HR=0.67; 95% CI, 0.56-0.80; mortality HR=0.81; 95% CI, 0.73-0.91).
An earlier meta-analysis of 4 prospective cohort studies, 2 of which were not included above, also found reduced risk of breast cancer recurrence in groups with high vs low soy isoflavone intake (HR=0.84; 95% CI, 0.70-0.99).7 Women taking tamoxifen showed no difference in mortality or recurrence risk associated with soy intake.
An additional small prospective cohort study (n=256) found similar reductions in recurrence and mortality associated with higher consumption of soy protein.8
1. Chen M, Rao Y, Zheng Y, et al. Association between soy isoflavone intake and breast cancer risk for pre- and post-menopausal women: a meta-analysis of epidemiological studies. PLoS One. 2014;9:e89288.
2. Fritz H, Seely D, Flower G, et al. Soy, red clover, and isoflavones and breast cancer: a systematic review. PLoS One. 2013;8:e81968.
3. Nagata C, Mizoue T, Tanaka K, et al. Soy intake and breast cancer risk: an evaluation based on a systematic review of epidemiologic evidence among the Japanese population. Jpn J Clin Oncol. 2014;44:282–295.
4. Liu XO, Huang YB, Gao Y, et al. Association between dietary factors and breast cancer risk among Chinese females: systematic review and meta-analysis. Asian Pac J Cancer Prev. 2014;15:1291–1298.
5. Qin LQ, Xu JY, Wang PY, et al. Soyfood intake in the prevention of breast cancer risk in women: a meta-analysis of observational epidemiological studies. J Nutr Sci Vitaminol (Tokyo). 2006;52:428–436.
6. Chi F, Wu R, Zeng YC, et al. Post-diagnosis soy food intake and breast cancer survival: a meta-analysis of cohort studies. Asian Pac J Cancer Prev. 2013;14:2407–2412.
7. Dong JY, Qin LQ. Soy isoflavones consumption and risk of breast cancer incidence or recurrence: a meta-analysis of prospective studies. Breast Cancer Res Treat. 2011;125:315-323.
8. Kang HB, Zhang YF, Yang JD, et al. Study on soy isoflavone consumption and risk of breast cancer and survival. Asian Pac J Cancer Prev. 2012;13:995–998.
No, it doesn’t affect the risk of primary breast cancer, but it does (favorably) affect the risk of cancer recurrence.
Compared with diets low in soy, high dietary intake of soy protein or soy isoflavones isn’t associated with any alteration in the risk of developing primary breast cancer (strength of recommendation [SOR]: B, systematic review of prospective cohort studies). In patients with breast cancer, however, consuming a diet high in soy is associated with a 25% decrease in cancer recurrence and a 15% decrease in mortality (SOR: B, prospective cohort studies).
EVIDENCE SUMMARY
A large systematic review evaluated the relationship between dietary soy intake and risk of a primary breast cancer diagnosis. It included 7 prospective cohort studies, which comprised the best quality evidence available (numerous other reviewed studies were of lower quality). The review found no significant association between dietary soy intake and primary breast cancer (TABLE1-6).
Investigators either surveyed women for intake of soy isoflavones or soy foods or products (tofu, soybeans, lentils, miso) or measured urinary or plasma levels of soy isoflavones. They adjusted for age, alcohol use, smoking status, body mass index, caloric intake, and hormone replacement therapy, then followed subjects for 7 to 23 years, comparing the risk of breast cancer for the lowest and highest levels of soy intake.
Six of the prospective cohort studies found no association between soy intake and breast cancer risk; one study, comprising 4% of the total population, found a lower risk with higher soy intake (effect size=0.44; 95% confidence interval [CI], 0.26-0.73; an effect size of 0.2 is considered small, 0.6 medium, and 1.2 large). The authors didn’t do a meta-analysis of the prospective cohort studies.
Other cohort studies yield similar findings
Four other large systematic reviews evaluating soy intake and breast cancer risk incorporated a total of 6 individual prospective cohort studies that weren’t included in the previously described review (again, these studies comprised the best quality evidence within the reviews). The 6 studies found no association between soy intake and breast cancer risk.
In 2 of the studies, investigators surveyed postmenopausal women and followed them for 4 to 8 years.2 Investigators in another study adjusted for age, family and gynecologic history, hormone and medication use, exercise, and other factors.3 In 2 other studies, investigators evaluated population subsets that consumed the most vs the fewest servings per week or kilograms per year of soy foods.4 The sixth study compared low with high intake of soy foods and miso.5
Soy intake after breast cancer diagnosis reduces recurrence risk in most studies
Most prospective cohort studies evaluating the association between dietary soy intake after breast cancer diagnosis found an overall 21% decrease in recurrence with high soy intake and a 15% reduction in mortality (TABLE1-6).
Investigators in a meta-analysis of 5 studies that followed women for 4 to 7 years after first breast cancer diagnosis found that higher soy intake was associated with lower mortality but not less recurrence in women who were estrogen receptor positive. Both recurrence and mortality were decreased in estrogen receptor negative women.6
The study also found lower recurrence and mortality in premenopausal women with higher soy intake (recurrence hazard ratio [HR]=0.91; 95% CI, 0.72-1.14; mortality HR=0.78; 95% CI, 0.69-0.88). In postmenopausal women, higher intake was likewise associated with improvement of both outcomes (recurrence HR=0.67; 95% CI, 0.56-0.80; mortality HR=0.81; 95% CI, 0.73-0.91).
An earlier meta-analysis of 4 prospective cohort studies, 2 of which were not included above, also found reduced risk of breast cancer recurrence in groups with high vs low soy isoflavone intake (HR=0.84; 95% CI, 0.70-0.99).7 Women taking tamoxifen showed no difference in mortality or recurrence risk associated with soy intake.
An additional small prospective cohort study (n=256) found similar reductions in recurrence and mortality associated with higher consumption of soy protein.8
1. Chen M, Rao Y, Zheng Y, et al. Association between soy isoflavone intake and breast cancer risk for pre- and post-menopausal women: a meta-analysis of epidemiological studies. PLoS One. 2014;9:e89288.
2. Fritz H, Seely D, Flower G, et al. Soy, red clover, and isoflavones and breast cancer: a systematic review. PLoS One. 2013;8:e81968.
3. Nagata C, Mizoue T, Tanaka K, et al. Soy intake and breast cancer risk: an evaluation based on a systematic review of epidemiologic evidence among the Japanese population. Jpn J Clin Oncol. 2014;44:282–295.
4. Liu XO, Huang YB, Gao Y, et al. Association between dietary factors and breast cancer risk among Chinese females: systematic review and meta-analysis. Asian Pac J Cancer Prev. 2014;15:1291–1298.
5. Qin LQ, Xu JY, Wang PY, et al. Soyfood intake in the prevention of breast cancer risk in women: a meta-analysis of observational epidemiological studies. J Nutr Sci Vitaminol (Tokyo). 2006;52:428–436.
6. Chi F, Wu R, Zeng YC, et al. Post-diagnosis soy food intake and breast cancer survival: a meta-analysis of cohort studies. Asian Pac J Cancer Prev. 2013;14:2407–2412.
7. Dong JY, Qin LQ. Soy isoflavones consumption and risk of breast cancer incidence or recurrence: a meta-analysis of prospective studies. Breast Cancer Res Treat. 2011;125:315-323.
8. Kang HB, Zhang YF, Yang JD, et al. Study on soy isoflavone consumption and risk of breast cancer and survival. Asian Pac J Cancer Prev. 2012;13:995–998.
Evidence-based answers from the Family Physicians Inquiries Network

Worsening Migraine in Pregnancy Is Linked to Adverse Outcomes
VALENCIA, SPAIN—Women who present with acute severe migraine during pregnancy are at increased risk for adverse pregnancy outcomes and should be seen in a high-risk pregnancy clinic, according to research presented at the International Headache Congress.
“We should not be seeing these patients in a regular [obstetrician’s or] generalist’s office because oftentimes we need input from neurology, and we need extra surveillance for both the fetus and the mother,” said Tracy B. Grossman, MD, an obstetrics and gynecology resident at Montefiore Medical Center in New York.

Dr. Grossman described a retrospective study of 90 consecutive pregnant patients who presented with acute severe migraine and obtained a neurology consultation at Montefiore Medical Center.
“These patients are different from most migraine patients because most migraine patients actually see improvement of symptoms during pregnancy. So, this is a special group of patients with worsening and refractory migraine,” she said.
Most of the women were in their third trimester. Diagnoses included migraine with aura (11.6%), migraine without aura (59.3%), and both (29.1%). A minority had chronic migraine (12.8%), and 31.4% presented in status migrainosus.
Forty-nine of the 90 patients (54%) experienced one or more adverse pregnancy outcomes. The population’s preterm delivery rate was 28%, which is nearly three times the national average of 11%, as reported by the March of Dimes. The population’s preeclampsia rate was 20.5%, compared with a national rate of 3% to 4%. The low-birth-weight rate of 19.2% was more than double the 8% national average. The rate of cesarean sections was 30.8%.
The study hypothesis was that women with migraine with aura would have higher rates of preeclampsia, preterm delivery, and low birth weight. Although studies of migraine in pregnancy have been few, some investigators have reported these associations. The current study did not find these associations, however, because most of the patients did not have aura, said Dr. Grossman.
“It can’t be purely an aura [or] vascular phenomenon that’s resulting in these adverse outcomes. These high rates of adverse pregnancy outcomes aren’t easily explainable. There’s something going on here that we haven’t teased out yet as to why these migraine patients are special,” she said.
Their risk of adverse pregnancy outcomes was not related to the headache medications that the patients took. Sixty-two patients received a combination of oral and IV therapy with acetaminophen, metoclopramide, and dihydroergotamine. In addition, 30% of patients briefly took barbiturates, and 30% received oxycodone or codeine. Although these drugs raise concerns during pregnancy, the investigators found no associated increase in adverse pregnancy outcomes among women who received them, compared with the women who did not receive those drugs or who did not receive any headache medications.
Dr. Grossman’s own therapeutic preference for patients with severe migraine during pregnancy is a peripheral nerve block with bupivacaine and lidocaine. “It works for the majority of people—we don’t quite know why—and it’s a local therapy that avoids fetal exposure to systemic medications,” she observed.
—Bruce Jancin
VALENCIA, SPAIN—Women who present with acute severe migraine during pregnancy are at increased risk for adverse pregnancy outcomes and should be seen in a high-risk pregnancy clinic, according to research presented at the International Headache Congress.
“We should not be seeing these patients in a regular [obstetrician’s or] generalist’s office because oftentimes we need input from neurology, and we need extra surveillance for both the fetus and the mother,” said Tracy B. Grossman, MD, an obstetrics and gynecology resident at Montefiore Medical Center in New York.
Dr. Grossman described a retrospective study of 90 consecutive pregnant patients who presented with acute severe migraine and obtained a neurology consultation at Montefiore Medical Center.
“These patients are different from most migraine patients because most migraine patients actually see improvement of symptoms during pregnancy. So, this is a special group of patients with worsening and refractory migraine,” she said.
Most of the women were in their third trimester. Diagnoses included migraine with aura (11.6%), migraine without aura (59.3%), and both (29.1%). A minority had chronic migraine (12.8%), and 31.4% presented in status migrainosus.
Forty-nine of the 90 patients (54%) experienced one or more adverse pregnancy outcomes. The population’s preterm delivery rate was 28%, which is nearly three times the national average of 11%, as reported by the March of Dimes. The population’s preeclampsia rate was 20.5%, compared with a national rate of 3% to 4%. The low-birth-weight rate of 19.2% was more than double the 8% national average. The rate of cesarean sections was 30.8%.
The study hypothesis was that women with migraine with aura would have higher rates of preeclampsia, preterm delivery, and low birth weight. Although studies of migraine in pregnancy have been few, some investigators have reported these associations. The current study did not find these associations, however, because most of the patients did not have aura, said Dr. Grossman.
“It can’t be purely an aura [or] vascular phenomenon that’s resulting in these adverse outcomes. These high rates of adverse pregnancy outcomes aren’t easily explainable. There’s something going on here that we haven’t teased out yet as to why these migraine patients are special,” she said.
Their risk of adverse pregnancy outcomes was not related to the headache medications that the patients took. Sixty-two patients received a combination of oral and IV therapy with acetaminophen, metoclopramide, and dihydroergotamine. In addition, 30% of patients briefly took barbiturates, and 30% received oxycodone or codeine. Although these drugs raise concerns during pregnancy, the investigators found no associated increase in adverse pregnancy outcomes among women who received them, compared with the women who did not receive those drugs or who did not receive any headache medications.
Dr. Grossman’s own therapeutic preference for patients with severe migraine during pregnancy is a peripheral nerve block with bupivacaine and lidocaine. “It works for the majority of people—we don’t quite know why—and it’s a local therapy that avoids fetal exposure to systemic medications,” she observed.
—Bruce Jancin

Scalp Mass Is Painful and Oozes Pus
ANSWER
The correct answer is oral terbinafine or griseofulvin, plus a two-week taper of prednisone (choice “d”); further discussion follows. Most authorities recommend the use of oral steroids with terbinafine (choice “a”) or griseofulvin (choice “b”), to dampen the acute inflammatory reaction to the fungal antigen. Some sources advise the use of itraconazole (choice “c”) but not as a single agent.
DISCUSSION
This case is a classic representation of kerion, a type of tinea capitis. This distinctive presentation results from not only active localized fungal infection with one of the dermatophytes, but also an allergic response to the fungal antigen. (This antigen can also trigger a widespread eczematous rash called an id reaction.) The resulting boggy, tender mass often oozes pus and usually provokes significant localized adenopathy.
A more common type of tinea capitis is uncomplicated dermatophytic infection of the scalp, presenting as mild localized scaling and modest hair loss, with no edema or redness to speak of. Kerion, by contrast, is far more acute and involves an impressive amount of localized redness and edema, along with modest hair loss, purulence, bloody drainage, and marked tenderness. Untreated, kerion can result in permanent scarring alopecia.
Several different dermatophytes have been isolated from kerions, including Trichophyton tonsurans, T violaceum, and various members of the Microsporum family. These zoophilic or geophilic organisms affect children far more than adults. Distinguishing the causative type is significant, because different drugs are required to effectively treat each. This is why a fungal culture is done at the outset.
When the diagnosis is in doubt, a punch biopsy may be necessary, with the sample divided for processing of default H&E stains and for fungal culture. Other information can be obtained by plucking a few hairs from the mass and examining them under 10x power to see if fungal hyphae are confined to the insides of the hair shafts (endothrix) or the outside of the shafts (ectothrix).
This is one situation in which KOH is not helpful for diagnosis: The organisms are too deep to obtain with a superficial scrape.
A number of scalp conditions can mimic a kerion, including lichen planopilaris and folliculitis decalvans. Several years ago, I had a patient who presented with a similar lesion that turned out to be squamous cell carcinoma—which eventually metastasized and led to his death.
TREATMENT
Treatment of more severe types of tinea capitis can be trying, even when the diagnosis is nailed down. The challenge becomes treating the problem long and strong enough to produce a cure.
In this case, I started the patient (who, at age 8, weighed 110 pounds) on a month-long course of terbinafine (250 mg/d) with a two-week taper of prednisone (40 mg). The expectation was that this would rapidly diminish the edema and pain while we waited for the culture results.
If the results showed the expected T tonsurans, treatment would continue as planned. If the cause turned out to be one of the Microsporum species, a switch to griseofulvin, at relatively high doses, would be considered.

Four weeks ago, an 8-year-old boy developed a lesion in his scalp that manifested rather quickly and caused pain. Treatment with both topical medications (triple-antibiotic cream and mupirocin cream) and oral antibiotics (cephalexin and trimethoprim/sulfa) has failed to resolve the problem, so his mother brings him to dermatology for evaluation. The patient is afebrile but complains of fatigue. His mother denies any other health problems for the child. There is no history of foreign travel, and the patient’s brother is healthy. The boy is in no acute distress but complains of tenderness on palpation of the lesion. The mass in his left nuchal scalp, which measures 4 cm, is impressively swollen, boggy, wet, and inflamed. Numerous red folliculocentric papules—many oozing pus—are seen on the surface. Located inferiorly to the lesion on the neck is a firm, palpable subcutaneous mass. Examination of the rest of the scalp reveals nothing of note. The clinical presentation and lack of response to oral antibiotics yield a presumptive diagnosis of kerion. A fungal culture is taken, with plans to prescribe appropriate medication.

CLL Therapy: Focus on comorbidities, not age
CHICAGO – The majority of patients with chronic lymphocytic leukemia (CLL) are elderly patients over age 65 years, which underscores the need for a careful assessment of fitness for therapy – not necessarily because of age, but because of comorbidity burden, according to Dr. John G. Gribben.

In fact, 68% of CLL patients are over age 65 years (median, 71 years), and 41% are over age 75 years. Perhaps more importantly, 89% of elderly CLL patients have one or more comorbidities, and 46% have at least one major comorbidity, said Dr. Gribben of Barts Cancer Institute, Queen Mary University of London.
Conventional wisdom has long suggested that CLL shortens the life span only in younger patients; older patients were thought to be more likely “to die with CLL rather than of CLL,” he said at the American Society of Hematology Meeting on Hematologic Malignancies.
However, recent findings suggest that CLL shortens the life span of elderly patients as well, he noted.
“I think we probably have been undertreating and underthinking about the impact that CLL can have on these more elderly patients, and I think it does represent an area of unmet need,” he said.
Treatment options in the elderly include FCR (fludarabine, cyclophosphamide, rituximab) in those deemed fit enough to tolerate the regimen, he said, adding, “if you are concerned about neutropenia associated with FCR, there are those who use rituximab-fludarabine [RF], and that’s certainly a good option.”
However, in those with an 11q abnormality, good data show that the addition of the alkylator does add benefit. “I do think that FCR is worthwhile pushing [in those cases],” he said.
Bendamustine-rituximab is also an attractive option, as demonstrated in the CLL10 trial, but it is important to remember that patients in that trial were “fit, healthy patients” based on Clinical Illness Rating Scale (CIRS) scores of less than 6; they were patients who were deemed fit to be randomized to receive FCR.
Chlorambucil-based therapies administered with anti-CD20 monoclonal antibodies are also an option, as are novel agents in those with 17p deletions or a P53 mutation, he said.
When it comes to assessing elderly patients’ fitness for therapy, comorbidities play a more important role than age, he said, explaining that many patients over age 65 are very fit and would do well with therapies such as FCR.
For this reason, comorbidities should be the determining factor in treatment selection, he said.
No standard criteria for assessing fitness exist, but there are a few tools that can help.
Eastern Cooperative Oncology Group performance status and organ function (for example, creatinine clearance) can be helpful and often are used in trial settings, as are criteria for excluding patients from participation, but CIRS, used by the German CLL study group, is a more formal tool for assessing comorbidity.
The German group is not the first to use the tool – CIRS is a widely validated test that provides an objective measurement of fitness for more aggressive chemotherapy regimens – but the group did demonstrate in CLL11 that it could be used to enroll more elderly patients with comorbidities into clinical trials, Dr. Gribben said.
A CIRS score of 6 or lower indicates fitness, whereas increasing scores indicate an increasing lack of fitness, he explained, noting that “like every scoring system there are some issues … somebody could easily have a score higher than 6 with comorbidities that really don’t impact on chemotherapy tolerability.
“But in general terms, this is a good way to be making these sorts of assessments,” he said.
Dr. Gribben has received research funding from the National Institutes of Health, Cancer Research UK, MRC, and Wellcome Trust. He has received honoraria from Roche/Genentech, Celgene, Janssen, Pharmacyclics, Gilead, Mundipharma, Infinity, TG Therapeutics, and Ascerta, and he has a patent or receives royalties from Celgene. He also has been the principal investigator on a clinical trial for Roche, Takeda, Pharmacyclics, Gilead, and Infinity.
CHICAGO – The majority of patients with chronic lymphocytic leukemia (CLL) are elderly patients over age 65 years, which underscores the need for a careful assessment of fitness for therapy – not necessarily because of age, but because of comorbidity burden, according to Dr. John G. Gribben.
In fact, 68% of CLL patients are over age 65 years (median, 71 years), and 41% are over age 75 years. Perhaps more importantly, 89% of elderly CLL patients have one or more comorbidities, and 46% have at least one major comorbidity, said Dr. Gribben of Barts Cancer Institute, Queen Mary University of London.
Conventional wisdom has long suggested that CLL shortens the life span only in younger patients; older patients were thought to be more likely “to die with CLL rather than of CLL,” he said at the American Society of Hematology Meeting on Hematologic Malignancies.
However, recent findings suggest that CLL shortens the life span of elderly patients as well, he noted.
“I think we probably have been undertreating and underthinking about the impact that CLL can have on these more elderly patients, and I think it does represent an area of unmet need,” he said.
Treatment options in the elderly include FCR (fludarabine, cyclophosphamide, rituximab) in those deemed fit enough to tolerate the regimen, he said, adding, “if you are concerned about neutropenia associated with FCR, there are those who use rituximab-fludarabine [RF], and that’s certainly a good option.”
However, in those with an 11q abnormality, good data show that the addition of the alkylator does add benefit. “I do think that FCR is worthwhile pushing [in those cases],” he said.
Bendamustine-rituximab is also an attractive option, as demonstrated in the CLL10 trial, but it is important to remember that patients in that trial were “fit, healthy patients” based on Clinical Illness Rating Scale (CIRS) scores of less than 6; they were patients who were deemed fit to be randomized to receive FCR.
Chlorambucil-based therapies administered with anti-CD20 monoclonal antibodies are also an option, as are novel agents in those with 17p deletions or a P53 mutation, he said.
When it comes to assessing elderly patients’ fitness for therapy, comorbidities play a more important role than age, he said, explaining that many patients over age 65 are very fit and would do well with therapies such as FCR.
For this reason, comorbidities should be the determining factor in treatment selection, he said.
No standard criteria for assessing fitness exist, but there are a few tools that can help.
Eastern Cooperative Oncology Group performance status and organ function (for example, creatinine clearance) can be helpful and often are used in trial settings, as are criteria for excluding patients from participation, but CIRS, used by the German CLL study group, is a more formal tool for assessing comorbidity.
The German group is not the first to use the tool – CIRS is a widely validated test that provides an objective measurement of fitness for more aggressive chemotherapy regimens – but the group did demonstrate in CLL11 that it could be used to enroll more elderly patients with comorbidities into clinical trials, Dr. Gribben said.
A CIRS score of 6 or lower indicates fitness, whereas increasing scores indicate an increasing lack of fitness, he explained, noting that “like every scoring system there are some issues … somebody could easily have a score higher than 6 with comorbidities that really don’t impact on chemotherapy tolerability.
“But in general terms, this is a good way to be making these sorts of assessments,” he said.
Dr. Gribben has received research funding from the National Institutes of Health, Cancer Research UK, MRC, and Wellcome Trust. He has received honoraria from Roche/Genentech, Celgene, Janssen, Pharmacyclics, Gilead, Mundipharma, Infinity, TG Therapeutics, and Ascerta, and he has a patent or receives royalties from Celgene. He also has been the principal investigator on a clinical trial for Roche, Takeda, Pharmacyclics, Gilead, and Infinity.
AT MHM 2015

Rash, diarrhea, and eosinophilia
An 83-year-old Iraqi woman was transferred to our inpatient service from the intensive care unit (ICU). She had been admitted to the ICU for respiratory distress and hypotension, where she was treated with stress dose steroids, oseltamivir, vancomycin, piperacillin/tazobactam, and azithromycin. At our inpatient service, she complained of a new pruritic rash on her thighs, abdominal pain, and persistent diarrhea. Her medical history was notable for chronic interstitial lung disease, gastroesophageal reflux disease, and anemia.
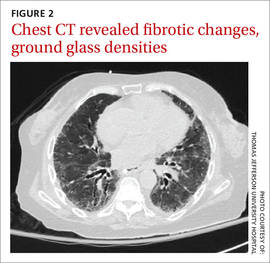
We noted a diffuse maculopapular rash on both of the patient’s inner thighs (FIGURE 1). Laboratory findings revealed leukocytosis and eosinophilia (total white blood cell count of 15,000, with 41% eosinophils). The patient’s eosinophil count—which had improved while she was on steroids in the ICU—had started to rise as steroids were tapered. Blood and cultures from a bronchoscopy were negative. Results from a bronchoalveolar lavage (BAL) were significant for a cell differential of 60% macrophages, 25% neutrophils, 5% lymphocytes, and 10% eosinophils. A stool sample for Clostridium difficile was negative. A computed tomography (CT) scan of the chest revealed bronchiectasis, fibrotic changes, and diffuse ground glass densities (FIGURE 2).
Our patient was a refugee who had arrived in the United States 5 years earlier. Per Centers for Disease Control and Prevention (CDC) guidelines, she had undergone routine stool ova and parasite (O&P) testing upon her arrival in the United States; the results were negative.

WHAT IS YOUR DIAGNOSIS?
HOW WOULD YOU TREAT THIS PATIENT?
Dx: Strongyloides stercoralis hyperinfection syndrome
We suspected a parasitic infection because our patient was a refugee with pulmonary, gastrointestinal (GI), and skin complaints, as well as intermittent eosinophilia. Her negative O&P test upon arrival to the United States did not, however, eliminate the possibility of Strongyloides stercoralis, which often goes undetected in routine O&P samples. A serum test for Strongyloides immunoglobulin G (IgG) was positive at 6.39 IV (positive, >2.11 IV). Subsequently, multiple stool samples were tested specifically for the parasite and came back positive, confirming the diagnosis.

Strongyloidiasis is caused by the roundworm S. stercoralis (FIGURE 3), which infects approximately 30 to 100 million people worldwide.1 It is most common in warm, humid climates in subtropical and tropical regions. With increasing trends in migration and travel, strongyloidiasis is now often diagnosed in nonendemic areas.2
The disease is most prevalent in socioeconomically disadvantaged communities and in agricultural settings. Infection in humans occurs when bare skin comes into contact with contaminated soil. The human T-cell lymphotropic virus-1 (HTLV-1) also predisposes individuals to developing strongyloidiasis.1
Infected patients can be asymptomatic or have intermittent symptoms. Patients are likely to complain of a pruritic rash, cough, shortness of breath, abdominal pain, nausea, and/or diarrhea.3,4 The rash, called larva currens, results when the larvae invade the perianal region. The rash typically spreads to the buttocks, groin, and inner thighs.3
Immunosuppressed patients are at a heightened risk. Two serious forms of strongyloidiasis—hyperinfection syndrome (HS) and disseminated strongyloidiasis (DS)—can develop in immunosuppressed individuals. This can occur in patients receiving high-dose corticosteroids.3-5 Immunosuppression can lead to accelerated autoinfection and a large burden of migrating larvae in the body.
HS was suspected in our patient based on her worsening lung disease, recent onset of diarrhea, and rash in the setting of increased eosinophils.
HS is usually limited to the pulmonary, GI, and skin systems, whereas DS can invade numerous other organs. Complications of HS and DS include disseminated bacterial and fungal infections; the mortality rate if either condition is left untreated is close to 90%.3-5
Strongyloidiasis can mimic other infections
The differential diagnosis for S. stercoralis infection includes the following:
Clostridium difficile infection must be excluded in a hospitalized patient with persistent diarrhea. A stool toxin and antigen test is used to make the diagnosis. Patients with C. difficile infection are more likely to have eosinopenia than eosinophilia.6
Schistosomiasis is a helminth infection that can also persist for decades. The signs and symptoms of a chronic infection can be similar to strongyloidiasis. However, patients with schistosomiasis will typically have large organ damage, bloody diarrhea, and/or urinary symptoms. Diagnosis is made from testing multiple stool samples, urine, and serology.6
Adrenal insufficiency occurs with complete or partial loss of endogenous glucocorticoids. There can be resultant eosinophilia, although it is usually not as marked as the eosinophilia observed in our patient. Adrenal insufficiency is diagnosed with an early morning serum cortisol test and a cosyntropin stimulation test.6
A high degree of suspicion in refugees is needed to make the diagnosis
When a patient is from an endemic area, such as Southeast Asia, Latin America, or sub-Saharan Africa7, one’s clinical suspicion should increase. Also, because signs and symptoms of strongyloidiasis are often nonspecific, a high suspicion for the disease is necessary to prompt testing. Eosinophilia may be present, but can be mild, and is not specific for the disease.
Available stool testing is not highly sensitive, and repeated specialized stool examinations are required, with sensitivity reaching close to 100% only after 7 serial samples are examined.3,8 Duodenal aspirate is more sensitive and larvae can also be seen through wet mount of bronchoalveolar lavage fluid. Serologic testing for Strongyloides IgG is available and has high sensitivity. However, specificity can be low because there can be cross-reactivity with other parasites, and the presence of the antibody does not differentiate between past and current infection.3,5,8
Imaging of the lungs is often variable and nonspecific. Findings on a chest x-ray or CT scan of the chest include diffuse alveolar opacities, interstitial infiltrates, pleural effusions, abscess or cavitation, or fibrotic changes.7 However, these findings can also be the result of a bacterial superinfection and not the parasite itself.3,6
Treatment begins with ivermectin
First-line treatment for strongyloidiasis is oral ivermectin, 200 mcg/kg/d.5 Optimal treatment duration is unknown because it is difficult to determine when S. stercoralis has been eradicated due to the low sensitivity of stool samples.4 For a patient with HS or DS, the CDC recommends treatment until stool and/or sputum samples are negative for 2 weeks.5
The CDC recommends that prior to arrival in the United States, all refugees should receive pre-departure treatment for parasites depending on their country of origin. For individuals arriving from the Middle East, the CDC recommends presumptive treatment with ivermectin for Strongyloides and albendazole for infections caused by soil-transmitted helminths.9 However, ivermectin was not routinely administered in the Middle East until January 2014.9,10 As a result of limited pre-departure treatment, US clinicians need to be cognizant of strongyloidiasis and have a high degree of suspicion in patients with nonspecific symptoms, especially when starting treatment with high-dose corticosteroids for other conditions.
We started our patient on a weight-based dose of ivermectin. Piperacillin/tazobactam 3.375 g (IV) every 6 hours was empirically started to cover enteric bacteria in the setting of HS, but was discontinued after blood cultures were negative. An HTLV-1/2 antibody test was negative. A repeat stool O&P test looking specifically for S. stercoralis came back positive on Day 6 of treatment. To determine the course of treatment, repeat O&Ps were done every 72 hours and ivermectin was continued until stool O&Ps were negative for 2 weeks. The total treatment course lasted 22 days.
During the course of treatment, our patient gained weight and her rash, diarrhea, and abdominal pain improved. She was discharged home and followed up with an infectious disease specialist as an outpatient. Three months later, repeat Strongyloides IgG testing was negative.
CORRESPONDENCE
Komal Soin, MD, MPH, Kaiser Permanente Waipio Medical Office, 94-1480 Moaniani Street, Waipahu, HI 96797; [email protected]
1. Centers for Disease Control and Prevention. Parasites - Strongyloides. Epidemiology & risk factors. Centers for Disease Control and Prevention Web site. Available at: http://www.cdc.gov/parasites/strongyloides/epi.html. Accessed September 4, 2015.
2. Buonfrate D, Angheben A, Gobbi F, et al. Imported strongyloidiasis: epidemiology, presentations, and treatment. Curr Infect Dis Rep. 2012;14:256-262.
3. Siddiqui AA, Berk SL. Diagnosis of Strongyloides stercoralis infection. Clin Infect Dis. 2001;33:1040-1047.
4. Buonfrate D, Requena-Mendez A, Angheben A, et al. Severe strongyloidiasis: a systematic review of case reports. BMC Infect Dis. 2013;13:78.
5. Centers for Disease Control and Prevention. Parasites - Strongyloides. Resources for health professionals. Centers for Disease Control and Prevention Web site. Available at: http://www.cdc.gov/parasites/strongyloides/health_professionals/index.html. Accessed September 4, 2015.
6. UpToDate. Klion AD, Weller PF. Approach to the patient with unexplained eosinophilia. UpToDate Web site. Available at: http://www.uptodate.com/contents/approach-to-the-patientwith-unexplained-eosinophilia. Accessed August 27, 2015.
7. Mokhlesi B, Shulzhenko O, Garimella PS, et al. Pulmonary strongyloidiasis: the varied clinical presentations. Clin Pulm Med. 2004;11:6-13.
8. Requena-Méndez A, Chiodini P, Bisoffi Z, et al. The laboratory diagnosis and follow up of strongyloidiasis: a systematic review. PLoS Negl Trop Dis. 2013;7:e2002.
9. Centers for Disease Control and Prevention. Guidelines for overseas presumptive treatment of strongyloidiasis, schistosomiasis, and soil-transmitted helminth infections. Centers for Disease Control and Prevention Web site. Available at: http://www.cdc.gov/immigrantrefugeehealth/guidelines/overseas/intestinal-parasites-overseas.html#me-asia-na-la-caribbean. Accessed April 3, 2014.
10. Centers for Disease Control and Prevention. Treatment options for presumptive parasitic infections. Centers for Disease Control and Prevention Web site. Available at: http://www.cdc.gov/immigrantrefugeehealth/guidelines/overseas/interventions/interventions.html. Accessed April 3, 2014.
An 83-year-old Iraqi woman was transferred to our inpatient service from the intensive care unit (ICU). She had been admitted to the ICU for respiratory distress and hypotension, where she was treated with stress dose steroids, oseltamivir, vancomycin, piperacillin/tazobactam, and azithromycin. At our inpatient service, she complained of a new pruritic rash on her thighs, abdominal pain, and persistent diarrhea. Her medical history was notable for chronic interstitial lung disease, gastroesophageal reflux disease, and anemia.
We noted a diffuse maculopapular rash on both of the patient’s inner thighs (FIGURE 1). Laboratory findings revealed leukocytosis and eosinophilia (total white blood cell count of 15,000, with 41% eosinophils). The patient’s eosinophil count—which had improved while she was on steroids in the ICU—had started to rise as steroids were tapered. Blood and cultures from a bronchoscopy were negative. Results from a bronchoalveolar lavage (BAL) were significant for a cell differential of 60% macrophages, 25% neutrophils, 5% lymphocytes, and 10% eosinophils. A stool sample for Clostridium difficile was negative. A computed tomography (CT) scan of the chest revealed bronchiectasis, fibrotic changes, and diffuse ground glass densities (FIGURE 2).
Our patient was a refugee who had arrived in the United States 5 years earlier. Per Centers for Disease Control and Prevention (CDC) guidelines, she had undergone routine stool ova and parasite (O&P) testing upon her arrival in the United States; the results were negative.
WHAT IS YOUR DIAGNOSIS?
HOW WOULD YOU TREAT THIS PATIENT?
Dx: Strongyloides stercoralis hyperinfection syndrome
We suspected a parasitic infection because our patient was a refugee with pulmonary, gastrointestinal (GI), and skin complaints, as well as intermittent eosinophilia. Her negative O&P test upon arrival to the United States did not, however, eliminate the possibility of Strongyloides stercoralis, which often goes undetected in routine O&P samples. A serum test for Strongyloides immunoglobulin G (IgG) was positive at 6.39 IV (positive, >2.11 IV). Subsequently, multiple stool samples were tested specifically for the parasite and came back positive, confirming the diagnosis.
Strongyloidiasis is caused by the roundworm S. stercoralis (FIGURE 3), which infects approximately 30 to 100 million people worldwide.1 It is most common in warm, humid climates in subtropical and tropical regions. With increasing trends in migration and travel, strongyloidiasis is now often diagnosed in nonendemic areas.2
The disease is most prevalent in socioeconomically disadvantaged communities and in agricultural settings. Infection in humans occurs when bare skin comes into contact with contaminated soil. The human T-cell lymphotropic virus-1 (HTLV-1) also predisposes individuals to developing strongyloidiasis.1
Infected patients can be asymptomatic or have intermittent symptoms. Patients are likely to complain of a pruritic rash, cough, shortness of breath, abdominal pain, nausea, and/or diarrhea.3,4 The rash, called larva currens, results when the larvae invade the perianal region. The rash typically spreads to the buttocks, groin, and inner thighs.3
Immunosuppressed patients are at a heightened risk. Two serious forms of strongyloidiasis—hyperinfection syndrome (HS) and disseminated strongyloidiasis (DS)—can develop in immunosuppressed individuals. This can occur in patients receiving high-dose corticosteroids.3-5 Immunosuppression can lead to accelerated autoinfection and a large burden of migrating larvae in the body.
HS was suspected in our patient based on her worsening lung disease, recent onset of diarrhea, and rash in the setting of increased eosinophils.
HS is usually limited to the pulmonary, GI, and skin systems, whereas DS can invade numerous other organs. Complications of HS and DS include disseminated bacterial and fungal infections; the mortality rate if either condition is left untreated is close to 90%.3-5
Strongyloidiasis can mimic other infections
The differential diagnosis for S. stercoralis infection includes the following:
Clostridium difficile infection must be excluded in a hospitalized patient with persistent diarrhea. A stool toxin and antigen test is used to make the diagnosis. Patients with C. difficile infection are more likely to have eosinopenia than eosinophilia.6
Schistosomiasis is a helminth infection that can also persist for decades. The signs and symptoms of a chronic infection can be similar to strongyloidiasis. However, patients with schistosomiasis will typically have large organ damage, bloody diarrhea, and/or urinary symptoms. Diagnosis is made from testing multiple stool samples, urine, and serology.6
Adrenal insufficiency occurs with complete or partial loss of endogenous glucocorticoids. There can be resultant eosinophilia, although it is usually not as marked as the eosinophilia observed in our patient. Adrenal insufficiency is diagnosed with an early morning serum cortisol test and a cosyntropin stimulation test.6
A high degree of suspicion in refugees is needed to make the diagnosis
When a patient is from an endemic area, such as Southeast Asia, Latin America, or sub-Saharan Africa7, one’s clinical suspicion should increase. Also, because signs and symptoms of strongyloidiasis are often nonspecific, a high suspicion for the disease is necessary to prompt testing. Eosinophilia may be present, but can be mild, and is not specific for the disease.
Available stool testing is not highly sensitive, and repeated specialized stool examinations are required, with sensitivity reaching close to 100% only after 7 serial samples are examined.3,8 Duodenal aspirate is more sensitive and larvae can also be seen through wet mount of bronchoalveolar lavage fluid. Serologic testing for Strongyloides IgG is available and has high sensitivity. However, specificity can be low because there can be cross-reactivity with other parasites, and the presence of the antibody does not differentiate between past and current infection.3,5,8
Imaging of the lungs is often variable and nonspecific. Findings on a chest x-ray or CT scan of the chest include diffuse alveolar opacities, interstitial infiltrates, pleural effusions, abscess or cavitation, or fibrotic changes.7 However, these findings can also be the result of a bacterial superinfection and not the parasite itself.3,6
Treatment begins with ivermectin
First-line treatment for strongyloidiasis is oral ivermectin, 200 mcg/kg/d.5 Optimal treatment duration is unknown because it is difficult to determine when S. stercoralis has been eradicated due to the low sensitivity of stool samples.4 For a patient with HS or DS, the CDC recommends treatment until stool and/or sputum samples are negative for 2 weeks.5
The CDC recommends that prior to arrival in the United States, all refugees should receive pre-departure treatment for parasites depending on their country of origin. For individuals arriving from the Middle East, the CDC recommends presumptive treatment with ivermectin for Strongyloides and albendazole for infections caused by soil-transmitted helminths.9 However, ivermectin was not routinely administered in the Middle East until January 2014.9,10 As a result of limited pre-departure treatment, US clinicians need to be cognizant of strongyloidiasis and have a high degree of suspicion in patients with nonspecific symptoms, especially when starting treatment with high-dose corticosteroids for other conditions.
We started our patient on a weight-based dose of ivermectin. Piperacillin/tazobactam 3.375 g (IV) every 6 hours was empirically started to cover enteric bacteria in the setting of HS, but was discontinued after blood cultures were negative. An HTLV-1/2 antibody test was negative. A repeat stool O&P test looking specifically for S. stercoralis came back positive on Day 6 of treatment. To determine the course of treatment, repeat O&Ps were done every 72 hours and ivermectin was continued until stool O&Ps were negative for 2 weeks. The total treatment course lasted 22 days.
During the course of treatment, our patient gained weight and her rash, diarrhea, and abdominal pain improved. She was discharged home and followed up with an infectious disease specialist as an outpatient. Three months later, repeat Strongyloides IgG testing was negative.
CORRESPONDENCE
Komal Soin, MD, MPH, Kaiser Permanente Waipio Medical Office, 94-1480 Moaniani Street, Waipahu, HI 96797; [email protected]
1. Centers for Disease Control and Prevention. Parasites - Strongyloides. Epidemiology & risk factors. Centers for Disease Control and Prevention Web site. Available at: http://www.cdc.gov/parasites/strongyloides/epi.html. Accessed September 4, 2015.
2. Buonfrate D, Angheben A, Gobbi F, et al. Imported strongyloidiasis: epidemiology, presentations, and treatment. Curr Infect Dis Rep. 2012;14:256-262.
3. Siddiqui AA, Berk SL. Diagnosis of Strongyloides stercoralis infection. Clin Infect Dis. 2001;33:1040-1047.
4. Buonfrate D, Requena-Mendez A, Angheben A, et al. Severe strongyloidiasis: a systematic review of case reports. BMC Infect Dis. 2013;13:78.
5. Centers for Disease Control and Prevention. Parasites - Strongyloides. Resources for health professionals. Centers for Disease Control and Prevention Web site. Available at: http://www.cdc.gov/parasites/strongyloides/health_professionals/index.html. Accessed September 4, 2015.
6. UpToDate. Klion AD, Weller PF. Approach to the patient with unexplained eosinophilia. UpToDate Web site. Available at: http://www.uptodate.com/contents/approach-to-the-patientwith-unexplained-eosinophilia. Accessed August 27, 2015.
7. Mokhlesi B, Shulzhenko O, Garimella PS, et al. Pulmonary strongyloidiasis: the varied clinical presentations. Clin Pulm Med. 2004;11:6-13.
8. Requena-Méndez A, Chiodini P, Bisoffi Z, et al. The laboratory diagnosis and follow up of strongyloidiasis: a systematic review. PLoS Negl Trop Dis. 2013;7:e2002.
9. Centers for Disease Control and Prevention. Guidelines for overseas presumptive treatment of strongyloidiasis, schistosomiasis, and soil-transmitted helminth infections. Centers for Disease Control and Prevention Web site. Available at: http://www.cdc.gov/immigrantrefugeehealth/guidelines/overseas/intestinal-parasites-overseas.html#me-asia-na-la-caribbean. Accessed April 3, 2014.
10. Centers for Disease Control and Prevention. Treatment options for presumptive parasitic infections. Centers for Disease Control and Prevention Web site. Available at: http://www.cdc.gov/immigrantrefugeehealth/guidelines/overseas/interventions/interventions.html. Accessed April 3, 2014.
New and Noteworthy Information—October 2015
Low vitamin D status was associated with accelerated decline in cognitive function in an ethnically diverse older population, according to data published online ahead of print September 14 in JAMA Neurology. Individuals with low vitamin D declined, on average, at a rate two to three times faster than those with adequate vitamin D levels, said the researchers. Serum 25-hydroxyvitamin D was measured at baseline and at five yearly follow-up visits in a longitudinal, multiethnic cohort of 382 patients in an outpatient clinic. Mean age was 75.5. “Independent of race or ethnicity, baseline cognitive abilities, and a host of other risk factors, vitamin D insufficiency was associated with significantly faster declines in both episodic memory and executive function performance,” the researchers reported. “This work, and that of others, suggests that there is enough evidence to recommend that people in their 60s and older discuss taking a daily vitamin D supplement with their physicians.”
Being overweight or obese may be linked to an increased risk of meningioma, according to a meta-analysis published online ahead of print September 16 in Neurology. The meta-analysis looked at available research on BMI, physical activity, and the two most common types of brain tumors—meningioma and glioma. A total of 12 studies on BMI and six on physical activity were analyzed, involving 2,982 meningioma cases and 3,057 glioma cases. Compared with people with a normal weight, overweight people were 21% more likely to develop a meningioma, and obese people were 54% more likely to develop one. “This is an important finding, since there are few known risk factors for meningioma, and the ones we do know about are not things a person can change,” said the investigators. No relationship was found between excess weight and glioma.
Working long hours is linked to an increased risk of stroke and coronary heart disease, compared with working a standard work week, according to research published online ahead of print August 19 in Lancet. Researchers performed a meta-analysis of published studies and unpublished individual-level data examining the effects of longer working hours on cardiovascular disease. Analysis of data from 25 studies involving 603,838 men and women from Europe, the USA, and Australia found a 13% increased risk of incident coronary heart disease in people working 55 or more hours per week, compared with those working a 35- to 40-hour work week. Analysis of data from 17 studies involving 528,908 men and women found a 1.3-times higher risk of stroke in individuals working longer hours per week, compared with those working standard hours. The association remained after controlling for smoking, alcohol consumption, and physical activity, as well as cardiovascular risk factors such as hypertension and high cholesterol.
FDA approved a new indication for Sunovion’s Aptiom (eslicarbazepine acetate): monotherapy for the treatment of partial-onset seizures. Aptiom was approved in 2013 as adjunctive therapy for partial-onset seizures. The new indication approval is based on the results of two phase III trials. Data from the monotherapy trials, in addition to the data generated from the adjunctive trials, confirm that the drug is efficacious and well-tolerated as adjunctive or monotherapy treatment within a daily dose range of 800 to 1,600 mg. The phase III trials evaluated eslicarbazepine acetate (1,600 mg/day or 1,200 mg/day) as monotherapy for partial-onset seizures in patients age 16 or older whose seizures were not well controlled with other antiepileptic drugs (AEDs). Conversion to eslicarbazepine acetate monotherapy was associated with favorable seizure control, compared with historical controls in patients with partial-onset seizures not well controlled by one or two AEDs.
Results of a hospital-based study published online ahead of print August 19 in Neurology offer clinical recommendations regarding acute headache in pregnant women. The investigators conducted a five-year, single-center, retrospective study of consecutive pregnant women presenting to acute care with headache and receiving a neurologic consultation. Their study cohort included 140 women (mean age, 29) who often presented in the third trimester (56.4%). Diagnoses included primary (65%) and secondary (35%) headache disorders. The most common primary headache disorder was migraine (91.2%), and secondary headache disorders were hypertensive disorders. The authors recommend that diagnostic vigilance be heightened in the absence of a headache history and if seizures, hypertension, or fever are present. Attack features may not adequately distinguish primary versus secondary disorders, and low thresholds for neuroimaging and monitoring for preeclampsia are justified, they said.
Short sleepers are four times more likely to catch a cold when exposed to the virus, compared with those who sleep longer, according to a study published in the September issue of Sleep. Researchers recruited 164 volunteers between 2007 and 2011. The recruits underwent two months of health screening, interviews, and questionnaires to establish baselines for stress, temperament, and alcohol and cigarette use. Researchers also measured participants’ normal sleep habits one week prior to sequestering them and administering the cold virus. Subjects who slept less than six hours per night were 4.2 times more likely to catch the cold, compared with those who got more than seven hours of sleep, and those who slept less than five hours were 4.5 times more likely to get sick.
Over the long term, a high dose of a purified form of resveratrol stabilizes a biomarker of Alzheimer’s disease progression, according to clinical trial results published online ahead of print September 11 in Neurology. Resveratrol is a naturally occurring compound found in foods such as red grapes, raspberries, dark chocolate, and some red wines. The randomized, phase II, placebo-controlled, double-blind study enrolled 119 patients with mild to moderate Alzheimer’s disease. The highest dose tested was 1 g orally twice per day. Patients who were treated with increasing doses of resveratrol over 12 months showed little or no change in amyloid-beta40 levels in blood and CSF. Those taking placebo had a decrease in the their levels of amyloid-beta40 over baseline. “We can’t conclude from this study that the effects of resveratrol treatment are beneficial,” said the investigators, but “it does appear that resveratrol was able to penetrate the blood–brain barrier, which is an important observation.”
Survivors of an intracerebral hemorrhage (ICH) who had inadequate blood pressure control during follow-up had a higher risk of ICH recurrence, according to a study in the September 1 issue of JAMA. This association was stronger with worsening severity of hypertension. Investigators studied 1,145 patients with ICH who survived at least 90 days. Median follow-up was 37 months. Blood pressure measurements were obtained at three, six, nine, and 12 months, and every six months thereafter. There were 102 recurrent ICH events among 505 survivors of lobar ICH and 44 recurrent ICH events among 640 survivors of nonlobar ICH. During follow-up, adequate blood pressure control was achieved on at least one measurement by 625 patients (55%) and consistently by 495 patients (43%). The ICH event rate for lobar and nonlobar ICH was higher among patients with inadequate blood pressure control, compared with patients with adequate blood pressure control.
Genetic findings support observational evidence that lower vitamin D levels are associated with increased risk of multiple sclerosis (MS), according to a study published online August 25 in PLOS Medicine. Using Mendelian randomization to reduce the possibility of confounding, the researchers examined whether there was an association between genetically reduced vitamin D levels and susceptibility to MS among participants in the International MS Genetics Consortium Study, which involves 14,498 patients with MS and 24,091 healthy controls. A genetic decrease in the natural-log-transformed vitamin D level by one standard deviation was associated with a twofold increased risk of MS. According to the researchers, “genetically lowered vitamin D levels are strongly associated with increased susceptibility to MS. Whether vitamin D sufficiency can delay or prevent MS onset merits further investigation.”
Diabetes may be linked to the buildup of tangles or tau in the brain, separate from Alzheimer’s disease, according to a study published online ahead of print September 2 in Neurology. The study involved 816 people (average age, 74). Of those, 397 had mild cognitive impairment, 191 had Alzheimer’s disease dementia, and 228 people had no memory or cognitive problems. A total of 124 people had diabetes. The researchers examined the relationship between type 2 diabetes, the loss of brain cells and their connections, levels of beta amyloid, and tau in the spinal fluid of the participants. Those with diabetes had on average 16 pg/mL greater levels of tau in the spinal and brain fluid, irrespective of the diagnosis of dementia. In addition, patients with diabetes had cortical tissue that was an average of 0.03 mm thinner than that of those who did not have diabetes, regardless of their cognitive abilities or dementia status.
Survivors of childhood cancer who have had a stroke have double the risk of a recurrent stroke when compared with noncancer stroke survivors, according to a study published online ahead of print August 26 in Neurology. The main predictors of recurrent stroke were cranial radiation therapy, hypertension, and older age at first stroke. Researchers analyzed retrospective data from the Childhood Cancer Survivor Study, which followed 14,358 survivors of pediatric cancer. Stroke rates were established through surveys and self-report. Of the 271 respondents who reported having a stroke, 70 also reported a second stroke. Overall, the rate of recurrence within the first 10 years after an initial stroke was 21%, which is double the rate in the general population of stroke survivors. The rate was 33% for patients who had received cranial radiation therapy.
—Glenn S. Williams

What’s Wrong With This Picture?
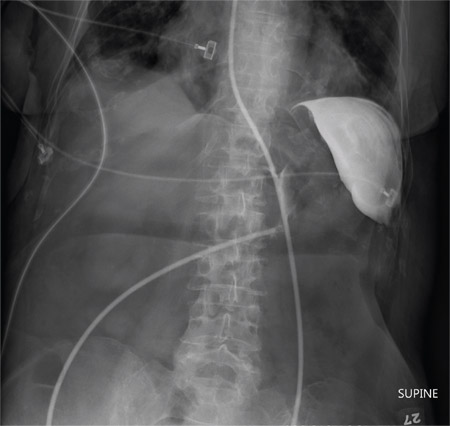
ANSWER
The radiograph shows an enteric tube passing through the gastrointestinal tract. However, it extends low into the left lower quadrant, loops around the right lower quadrant, and then heads up toward the left upper quadrant. Such a course is atypical and concerning for displaced position.
The radiologists concurred, and it was decided to instill some water-soluble contrast and repeat the KUB for further evaluation. That image is shown here. Note that the contrast does not appear to be in the stomach, as no gastric folds are visible. It accumulates in the left upper quadrant, under the diaphragm. Such a finding is concerning for possible gastric perforation.
The tube was promptly withdrawn, and urgent surgical consultation was obtained.
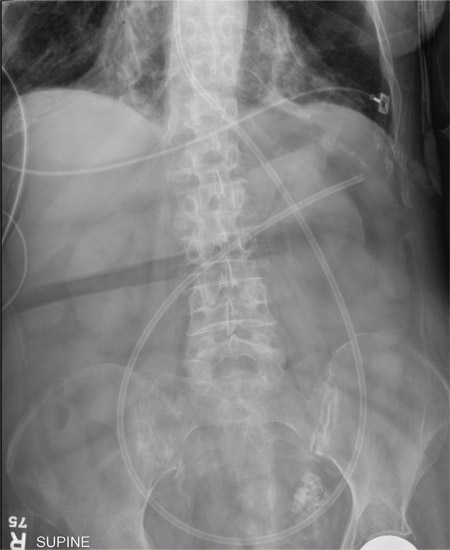
A 90-year-old woman, admitted for altered mental status, just had a nasogastric tube placed to facilitate nutrition and medication delivery. The ICU nurse asks you to review an abdominal radiograph to confirm correct placement, since several attempts by various hospital personnel were required before they felt they had the tube in place. The patient is otherwise currently stable, per the nurse’s report. Her vital signs are stable, and she will arouse to minimal stimulation, although she continues to demonstrate confusion. Portable KUB radiograph is shown. What is your impression?

Tumor Necrosis Factor Inhibitors and Multiple Sclerosis: A Closer Look
With the advent of tumor necrosis factor (TNF) inhibitors, one of the major topics of discussion is the relationship of the drug class with new or worsening multiple sclerosis (MS). Exacerbation of previously quiescent MS and the onset of other demyelinating diseases such as optic neuritis have been reported in patients taking TNF inhibitors. Symptoms included paraesthesia, visual disturbance, and confusion.
Therefore, controversy surrounds the use of TNF-α inhibitors in patients who are more predisposed to developing MS, specifically first-degree relatives of MS patients. The American Academy of Dermatology guidelines for TNF inhibitors state the following: “Because there is an association between anti-TNF therapy and demyelinating diseases (ie, MS), TNF inhibitors should not be used in patients with MS or other demyelinating diseases; first-degree relatives of patients with MS have an increased risk of developing MS, with a sibling relative risk of between 18 and 36, evidence strongly suggests that TNF inhibitors should not be used in first-degree relatives of patients with MS.”
Mansouri et al (J Drugs Dermatol. 2015;14:876-878) presented data suggesting that the number needed to treat is at least an order of magnitude smaller than the number needed to harm across all comparisons of anti–TNF-α agents and first-degree relative relationships. Based on these data, the authors suggest that physicians could weigh the treatment options available and work closely with neurological colleagues when prescribing anti–TNF-α therapy in this patient population, which could be an alternative approach to practicing absolute prohibition of anti–TNF-α agents in patients who have a first-degree relative with MS.
What’s the issue?
This article presents interesting data concerning the risk-benefit of using TNF inhibitors in a potential at-risk population. We are fortunate to have many treatment options available, but in many cases, a TNF inhibitor may be preferable. How will this information affect your use of TNF inhibitors in patients with a first-degree relative with MS?

Clindamycin–benzoyl peroxide combo effective in moderate and severe acne
A fixed combination of clindamycin phosphate 1.2% and benzoyl peroxide 3.75% (clindamycin-BP 3.75%) aqueous gel was effective and well tolerated in the treatment of moderate and severe acne vulgaris, reported Dr. Linda Stein Gold of Henry Ford Hospital in Detroit (J Drugs Dermatol. 2015;14[9]:969-74).

A multicenter, double-blind, randomized trial of 498 patients with moderate to severe acne showed that inflammatory and noninflammatory lesions were significantly reduced in patients who received treatment with clindamycin-BP 3.75% topical gel, compared with those in the vehicle group.
In patients with severe acne, 55.1% had a reduction of two grades or more in severity score at 12 weeks. In addition, 30.6% of patients assessed their acne as “clear” or “almost clear,” Dr. Stein Gold wrote. No participants withdrew from the study because of adverse events.
Read the article here.
A fixed combination of clindamycin phosphate 1.2% and benzoyl peroxide 3.75% (clindamycin-BP 3.75%) aqueous gel was effective and well tolerated in the treatment of moderate and severe acne vulgaris, reported Dr. Linda Stein Gold of Henry Ford Hospital in Detroit (J Drugs Dermatol. 2015;14[9]:969-74).
A multicenter, double-blind, randomized trial of 498 patients with moderate to severe acne showed that inflammatory and noninflammatory lesions were significantly reduced in patients who received treatment with clindamycin-BP 3.75% topical gel, compared with those in the vehicle group.
In patients with severe acne, 55.1% had a reduction of two grades or more in severity score at 12 weeks. In addition, 30.6% of patients assessed their acne as “clear” or “almost clear,” Dr. Stein Gold wrote. No participants withdrew from the study because of adverse events.
Read the article here.