User login
In reply: Starting insulin therapy
In Reply: We thank Dr. Weiss for his insightful comments and for the opportunity to clarify a number of points from our article.
We agree that controlling the fasting glucose should not take months. As mentioned in our article, adjusting the basal insulin dose should be done with 2 to 4 units every 2 to 3 days in order to reach the fasting glycemic goal. Applying this approach and systematically titrating the NPH, glargine, or detemir insulin will smoothly decrease the fasting glucose within 12 weeks, as described in the 24-week1 and 52-week2 treat-to-target trials in which basal insulin was added to the oral therapy in patients with type 2 diabetes.
When basal insulin is no longer sufficient to reach a target hemoglobin A1c, a glucagon-like peptide-1 receptor agonist or prandial insulin can be used. The basal-bolus or twice-daily premixed insulin analogues can also be considered as the initial therapy, depending on the patient, disease, and drug characteristics.3 We agree that once a prandial insulin regimen is initiated, the dose titration can be done based on preprandial or postprandial blood glucose measurements, as shown in Table 2 in our article. However, adding the prandial insulin without first optimizing the basal therapy was considered a limitation of the Orals Plus Apidra and Lantus (OPAL) study,4 which investigated the addition of one prandial insulin injection to basal glargine insulin.5 As a consequence, the subsequent studies investigating the effects of initiating and titrating the preprandial rapid-acting insulin (as a single dose or using a stepwise approach) in patients inadequately controlled with once-daily basal insulin and oral antidiabetic drugs had run-in periods of 12 to 14 weeks, in order to optimize the basal insulin dosage and achieve target fasting blood glucose levels of 110 mg/dL or less. This approach had the additional benefit of achieving a target hemoglobin A1c level of less than 7% in a significant number of patients (up to 37%),6 before starting the preprandial insulin.6–8
Regardless of the regimen selected, titration of the insulin doses can only be achieved with understanding the pharmacodynamic characteristics of each type of insulin used.9
- Riddle MC, Rosenstock J, Gerich J; Insulin Glargine 4002 Study Investigators. The Treat-to-Target Trial: randomized addition of glargine or human NPH insulin to oral therapy of type 2 diabetic patients. Diabetes Care 2003; 26:3080–3086.
- Rosenstock J, Davies M, Home PD, Larsen J, Koenen C, Schernthaner G. A randomised, 52-week, treat-to-target trial comparing insulin detemir with insulin glargine when administered as add-on to glucose-lowering drugs in insulin-naive people with type 2 diabetes. Diabetologia 2008; 51:408–416.
- Inzucchi SE, Bergenstal RM, Buse JB, et al. Management of hyperglycaemia in type 2 diabetes, 2015: a patient-centered approach. Update to a position statement of the American Diabetes Association and the European Association for the Study of Diabetes. Diabetologia 2015; 58:429–442.
- Owens DR. Stepwise intensification of insulin therapy in type 2 diabetes management—exploring the concept of the basal-plus approach in clinical practice. Diabet Med 2013; 30:276–288.
- Lankisch MR, Ferlinz KC, Leahy JL, Scherbaum WA; Orals Plus Apidra and Lantus (OPAL) Study Group. Introducing a simplified approach to insulin therapy in type 2 diabetes: a comparison of two single-dose regimens of insulin glulisine plus insulin glargine and oral antidiabetic drugs. Diabetes Obes Metab 2008; 10:1178–1185.
- Davidson MB, Raskin P, Tanenberg RJ, Vlajnic A, Hollander P. A stepwise approach to insulin therapy in patients with type 2 diabetes mellitus and basal insulin treatment failure. Endocr Pract 2011; 17:395–403.
- Meneghini L, Mersebach H, Kumar S, Svendsen AL, Hermansen K. Comparison of 2 intensification regimens with rapid-acting insulin aspart in type 2 diabetes mellitus inadequately controlled by once-daily insulin detemir and oral antidiabetes drugs: the Step-Wise Randomized Study. Endocrine Practice 2011; 17:727–736.
- Owens DR, Luzio SD, Sert-Langeron C, Riddle MC. Effects of initiation and titration of a single pre-prandial dose of insulin glulisine while continuing titrated insulin glargine in type 2 diabetes: a 6-month ‘proof-of-concept’ study. Diabetes Obes Metab 2011; 13:1020–1027.
- American Diabetes Association. 7. Approaches to glycemic treatment. Diabetes Care 2015; 38(suppl):S41–S48.
In Reply: We thank Dr. Weiss for his insightful comments and for the opportunity to clarify a number of points from our article.
We agree that controlling the fasting glucose should not take months. As mentioned in our article, adjusting the basal insulin dose should be done with 2 to 4 units every 2 to 3 days in order to reach the fasting glycemic goal. Applying this approach and systematically titrating the NPH, glargine, or detemir insulin will smoothly decrease the fasting glucose within 12 weeks, as described in the 24-week1 and 52-week2 treat-to-target trials in which basal insulin was added to the oral therapy in patients with type 2 diabetes.
When basal insulin is no longer sufficient to reach a target hemoglobin A1c, a glucagon-like peptide-1 receptor agonist or prandial insulin can be used. The basal-bolus or twice-daily premixed insulin analogues can also be considered as the initial therapy, depending on the patient, disease, and drug characteristics.3 We agree that once a prandial insulin regimen is initiated, the dose titration can be done based on preprandial or postprandial blood glucose measurements, as shown in Table 2 in our article. However, adding the prandial insulin without first optimizing the basal therapy was considered a limitation of the Orals Plus Apidra and Lantus (OPAL) study,4 which investigated the addition of one prandial insulin injection to basal glargine insulin.5 As a consequence, the subsequent studies investigating the effects of initiating and titrating the preprandial rapid-acting insulin (as a single dose or using a stepwise approach) in patients inadequately controlled with once-daily basal insulin and oral antidiabetic drugs had run-in periods of 12 to 14 weeks, in order to optimize the basal insulin dosage and achieve target fasting blood glucose levels of 110 mg/dL or less. This approach had the additional benefit of achieving a target hemoglobin A1c level of less than 7% in a significant number of patients (up to 37%),6 before starting the preprandial insulin.6–8
Regardless of the regimen selected, titration of the insulin doses can only be achieved with understanding the pharmacodynamic characteristics of each type of insulin used.9
- Riddle MC, Rosenstock J, Gerich J; Insulin Glargine 4002 Study Investigators. The Treat-to-Target Trial: randomized addition of glargine or human NPH insulin to oral therapy of type 2 diabetic patients. Diabetes Care 2003; 26:3080–3086.
- Rosenstock J, Davies M, Home PD, Larsen J, Koenen C, Schernthaner G. A randomised, 52-week, treat-to-target trial comparing insulin detemir with insulin glargine when administered as add-on to glucose-lowering drugs in insulin-naive people with type 2 diabetes. Diabetologia 2008; 51:408–416.
- Inzucchi SE, Bergenstal RM, Buse JB, et al. Management of hyperglycaemia in type 2 diabetes, 2015: a patient-centered approach. Update to a position statement of the American Diabetes Association and the European Association for the Study of Diabetes. Diabetologia 2015; 58:429–442.
- Owens DR. Stepwise intensification of insulin therapy in type 2 diabetes management—exploring the concept of the basal-plus approach in clinical practice. Diabet Med 2013; 30:276–288.
- Lankisch MR, Ferlinz KC, Leahy JL, Scherbaum WA; Orals Plus Apidra and Lantus (OPAL) Study Group. Introducing a simplified approach to insulin therapy in type 2 diabetes: a comparison of two single-dose regimens of insulin glulisine plus insulin glargine and oral antidiabetic drugs. Diabetes Obes Metab 2008; 10:1178–1185.
- Davidson MB, Raskin P, Tanenberg RJ, Vlajnic A, Hollander P. A stepwise approach to insulin therapy in patients with type 2 diabetes mellitus and basal insulin treatment failure. Endocr Pract 2011; 17:395–403.
- Meneghini L, Mersebach H, Kumar S, Svendsen AL, Hermansen K. Comparison of 2 intensification regimens with rapid-acting insulin aspart in type 2 diabetes mellitus inadequately controlled by once-daily insulin detemir and oral antidiabetes drugs: the Step-Wise Randomized Study. Endocrine Practice 2011; 17:727–736.
- Owens DR, Luzio SD, Sert-Langeron C, Riddle MC. Effects of initiation and titration of a single pre-prandial dose of insulin glulisine while continuing titrated insulin glargine in type 2 diabetes: a 6-month ‘proof-of-concept’ study. Diabetes Obes Metab 2011; 13:1020–1027.
- American Diabetes Association. 7. Approaches to glycemic treatment. Diabetes Care 2015; 38(suppl):S41–S48.
Drug-induced liver injury: Diagnosing (and treating) it early
› If you suspect your patient may have drug-induced liver injury (DILI), take a careful medication history, assess for risk factors, and investigate other possible causes. B
› Immediately stop any drugs you suspect are causing DILI, especially when the patient’s liver enzymes are rapidly increasing or there is evidence of acute liver failure. A
Strength of recommendation (SOR)
A Good-quality patient-oriented evidence
B Inconsistent or limited-quality patient-oriented evidence
C Consensus, usual practice, opinion, disease-oriented evidence, case series
CASE › James A, age 68, presents to his family physician (FP) with anorexia, nausea, and vague upper abdominal pain that he’s had for 2 weeks. Mr. A has diabetes and hypertension, both of which are well controlled by medications. He also consumes more than 4 alcoholic beverages daily.
On examination, the FP notes icterus and tenderness in the right hypochondrium. Liver function testing reveals elevated liver enzyme levels: aspartate aminotransferase (AST), 864 IU/L (normal range: 10-40 IU/L); alanine aminotransferase (ALT), 1012 IU/L (normal range: 7-56 IU/L); serum bilirubin, 4.8 mg/dL (normal range: 0.3-1.9 mg/dL); and alkaline phosphatase (ALP), 200 IU/L (normal range: 44-147 IU/L). Mr. A’s coagulation profile is slightly abnormal. He is provisionally diagnosed with acute hepatitis. The FP sends blood samples to the lab to assess for viral markers, and starts symptomatic management.
If Mr. A were your patient, how would you proceed?
In the United States, drug-induced liver injury (DILI) is the most common cause of acute liver failure.1,2 It can occur due to ingestion of any therapeutic drug, herbal product, or xenobiotic. Further complicating matters is the fact that it has an unpredictable and heterogeneous course, ranging from an asymptomatic rise in liver enzymes to acute liver failure. This article describes the risk factors, common causative agents, tools for early diagnosis, and effective management of DILI.
Two types of risk factors for DILI
Risk factors for DILI can be classified as drug-related (eg, dose, concomitant medications, polypharmacy) or host-related (eg, age, gender, alcohol intake, concomitant infections).3-5
Drug-related factors. Hundreds of agents can lead to liver injury. In fact, the US National Library of Medicine and the National Institute of Diabetes and Digestive and Kidney Diseases have created LiverTox (http://www.livertox.nih.gov/), an online database that provides detailed information on more than 600 such agents.6 Antibiotics are the most common cause of DILI, followed by neuropsychiatric drugs, immunomodulatory agents, antihypertensives, analgesics, antineoplastic drugs, and lipid-lowering agents.2
Among antibiotics, the specific medication most often responsible for DILI varies by geographical region. Amoxicillin/clavulanic acid is the most common causative antibiotic in the United States, whereas anti-tuberculosis agents such as isoniazid, rifampin, and pyrazinamide are the most common causative drugs in developing countries such as India, where the prevalence of tuberculosis is still high.7,8 Herbal and dietary supplements are emerging as an important cause of DILI.5,9,10
The use of multiple drugs further increases the risk of developing DILI.10 Drugs with a recommended daily dose of <50 mg are rarely associated with DILI.11
Host-related factors. Vulnerability to DILI is influenced by a patient’s age and sex.3,12 Very young and very old patients have an increased risk of developing DILI, and a patient’s age may make him or her particularly susceptible to the effects of certain medications.3,12,13 For example, children are more susceptible to DILI as a result of taking valproate or aspirin, whereas older patients are more likely to experience DILI brought on by amoxicillin/clavulanic acid.13 The pattern of liver injury also varies by age. Younger patients present most commonly with a hepatocellular pattern of injury, whereas older patients mostly present with a cholestatic pattern of liver injury.3
Some studies have found that women have a greater risk of developing DILI than men.13 The presence of chronic liver diseases, alcoholism, and nonalcoholic fatty liver disease (NAFLD) increase the risk of developing DILI.14 Diabetes is an independent risk factor for DILI.3
Clinical presentation of DILI varies widely
Some degree of liver injury may occur in any patient who ingests a drug that is metabolized in the liver. The clinical presentation of a patient with DILI can vary from an asymptomatic rise in liver enzymes to acute liver failure. Unexplained transaminitis should raise the possibility of DILI, especially when the patient has started a new drug in the preceding 3 months. However, in most patients, an asymptomatic rise in liver enzymes is due to hepatic adaptation or tolerance. In such cases, liver enzyme levels tend to normalize even if the patient continues to take the drug in the same dose.15
Apart from nonspecific symptoms such as anorexia, nausea, and vomiting, a patient with DILI may exhibit right upper quadrant pain, skin rash, or itching. A patient with severe DILI might exhibit jaundice, ascites, or encephalopathy.15

A stepwise approach to evaluation
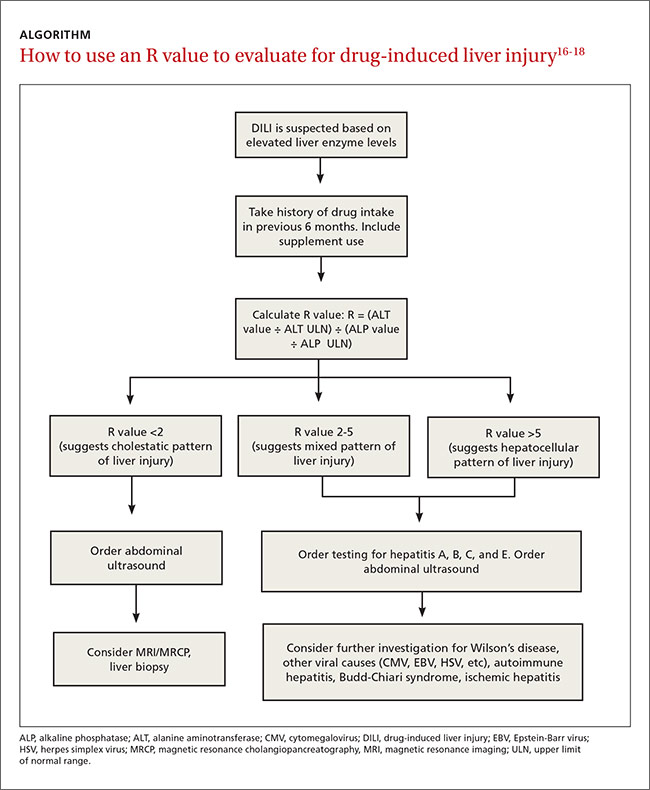
DILI is a diagnosis of exclusion.16 Guidelines from the American College of Gastroenterology (ACG) recommend a stepwise approach to evaluating a patient you suspect may have DILI (TABLE).16 First, take a detailed history regarding the onset of symptoms, time latency, and use of hepatotoxic and other drugs (dosage and duration of use). Also ask the patient about his or her use of herbal products, dietary supplements, and alcohol. Check the patient’s history for the presence of other liver diseases such as NAFLD.
Next, make sure initial laboratory testing includes liver function tests and an eosinophil count. In order to classify the pattern of liver injury as hepatocellular, cholestatic, or mixed, you’ll need to calculate the patient’s R value (ALGORITHM16-18). This value is calculated by dividing the patient’s ALT level by the ALP, using the upper limit of the normal range (ULN) as follows: R = (ALT value ÷ ALT ULN) ÷ (ALP value ÷ ALP ULN).17 A hepatocellular pattern of liver injury is indicated by an R value >5, a cholestatic pattern is an R value <2, and a mixed pattern is suggested by an R value between 2 and 5.17
Quite often, the pattern of liver damage is characteristic of a particular drug or drug class. For example, DILI induced by amoxicillin/clavulanic acid typically will exhibit a cholestatic injury pattern, whereas DILI resulting from a nonsteroidal anti-inflammatory drug typically is associated with a hepatocellular injury pattern.16
Rule out other causes. Further investigations should be directed at ruling out other possible causes of liver injury. If a patient has a hepatocellular pattern of liver injury, order serological tests to rule out acute viral hepatitis (hepatitis A, B, C, and E). Such patients should also be evaluated for autoimmune hepatitis, Budd-Chiari syndrome, Wilson’s disease, and ischemic hepatitis.16 In patients with a predominant cholestatic pattern, imaging studies and other serological tests should be ordered to rule out pancreato-biliary diseases.
Once DILI is confirmed, identify offending agent, grade severity
Which medication is responsible for DILI is determined by the physician based on his or her clinical experience and judgment. Guiding points are improvement of liver function tests after stopping the suspected drug (more on that in a bit), exclusion of other possible causes of liver injury, and the results of liver biopsy. (See “Time for a biopsy?”16)
DILI severity can be graded as mild (1+) to fatal (5+).19 Mild forms of DILI are associated with increased levels of liver enzymes (AST, ALT, or ALP) without raised serum bilirubin or clinical jaundice, whereas moderately severe DILI is associated with clinical jaundice or hyperbilirubinemia (bilirubin >2 mg/dL).19 Severe forms of DILI are associated with features of hepatic failure, such as ascites, encephalopathy, and an elevated international normalized ratio (>1.5), in addition to hyperbilirubinemia or jaundice.
American College of Gastroenterology guidelines recommend liver biopsy if autoimmune hepatitis is suspected, liver enzymes remain elevated for more than 6 months, or liver enzymes continue to rise even after stopping the suspected offending drug.16
Biopsy should also be considered if a patient’s alanine aminotransferase level fails to fall by at least half 60 days after stopping the suspected medication (in a patient with a hepatocellular pattern) or if a patient’s peak alkaline phosphatase level doesn’t fall by at least half at 180 days after stopping the suspected medication (in a patient with a cholestatic pattern).
CASE › Mr. A’s lab results are negative for viral markers. On further questioning, he reveals that he had recovered from a sore throat 3 weeks earlier, for which he had been prescribed an unknown dose of amoxicillin/clavulanic acid. A review of Mr. A’s drug history finds that he is taking metformin, pioglitazone, telmisartan, and atorvastatin for his chronic conditions. The FP suspects DILI , and refers Mr. A to a liver specialist for further investigation.
For many patients, stopping the offending drug will be sufficient
The first step in managing DILI is to stop the medication suspected of causing the liver injury.20 Discontinuing the suspected medication may not always be necessary in patients who have only slightly elevated liver enzymes, but should be strongly considered for a patient who has a considerable increase in liver enzymes levels (ie, an AST, ALT, or serum bilirubin level more than 3 times the ULN or an ALP more than 1.5 times the ULN at any time after initiating a new drug).18 Certain drugs, such as those used to treat tuberculosis, are associated with hepatic adaptation, in which there is spontaneous resolution of the increased liver enzymes level even while the drug is continued in the same dose.
In patients with mild to moderate DILI, stopping the offending drug typically results in normalization of liver enzyme levels.20 Management of patients with moderate to severe DILI is mainly supportive; however, a patient with acute liver failure will require intensive care support.21,22 Consider hospital admission for patients who exhibit severe symptoms, such as intractable vomiting or severe dehydration, those who experience bleeding due to coagulation failure, and those who develop hepatic encephalopathy.21
When more aggressive steps are needed
N-acetylcysteine (NAC) should be considered for all patients with DILI who present with acute liver failure.12,23-25 NAC can be administered either orally or intravenously. The following 3 regimens have been well studied for patients with acetaminophen-induced liver injury:26
• Oral 72-hour regimen: Loading dose of 140 mg/kg followed by 70 mg/kg every 4 hours up to 72 hours
• Intravenous 72-hour regimen: Loading infusion of 150 mg/kg over one hour, followed by 50 mg/kg over 4 hours, followed by 418.75 mg/kg over 67 hours
• Intravenous 21-hour regimen: Loading infusion of 150 mg/kg over one hour, followed by 50 mg/kg over 4 hours, followed by 100 mg/kg over 16 hours.
Of these regimens, the 72-hour IV regimen has been found to be more effective than the 21-hour regimen for patients with acetaminophen-induced liver toxicity.26 A study of NAC administered as continuous infusion for 72 hours in patients with acute liver failure found that the transplant-free survival rate was 40% for NAC in comparison with 27% for placebo.26
L-carnitine can be used to treat valproate-induced hepatotoxicity. In a case-control study of 92 patients with severe, symptomatic, valproate-induced hepatotoxicity, nearly half of 42 patients treated with L-carnitine survived, but only 10% of 50 patients treated solely with aggressive supportive care survived.27 Greater benefit has been found for IV vs oral L-carnitine.27,28
Ursodeoxycholic acid (UDCA), 13 to 15 mg/kg, may be helpful for DILI patients with a cholestatic pattern of liver injury.
Other therapies. Steroids have no defined role in management of DILI except in autoimmune-type DILI. Other drugs, such as silymarin and antioxidants, have been used to treat other forms of hepatic toxicities and might be beneficial for patients with DILI.29,30
Liver transplantation may be necessary to prevent death due to acute liver failure in patients with severe DILI. Various criteria, including Kings College criteria,31 can be used to select which patients may best benefit from liver transplantation.
For most patients, hospitalization will not be necessary
Generally, patients with DILI have a good prognosis.20,30 About 70% of patients with DILI do not require hospitalization, and approximately 90% recover without reaching the threshold of acute liver failure. However, patients with acute liver failure have a poor prognosis; 40% will require liver transplantation.16,20
Traditionally, patients with a cholestatic pattern of liver injury have been considered to have a better prognosis than those with a hepatocellular pattern of liver injury. Patients whose DILI is the result of a hypersensitivity reaction to a drug also have a good prognosis. This may be because features such as skin rash prompt early diagnosis and discontinuation of the offending drugs.7
CASE › A liver specialist evaluates Mr. A and concludes that his liver injury was caused by his long-term heavy alcohol consumption and exacerbated by the amoxicillin/clavulanic acid he had recently been prescribed. After 2 days, Mr. A develops drowsiness and is admitted to the hospital for further management. He is managed in the intensive care unit under supervision of a gastroenterologist. A NAC infusion is started at a loading dose of 150 mg/kg to manage acute liver failure. Unfortunately, however, Mr. A succumbs to his illness.
CORRESPONDENCE
Piyush Ranjan, MD, All India Institute of Medical Sciences, Ansari Nagar, New Delhi, India 110029; [email protected].
1. Khashab M, Tector AJ, Kwo PY. Epidemiology of acute liver failure. Curr Gastroenterol Rep. 2007;9:66-73.
2. Reuben A, Koch DG, Lee WM; Acute Liver Failure Study Group. Drug-induced acute liver failure: results of a U.S. multicenter, prospective study. Hepatology. 2010;52:2065-2076.
3. Chalasani N, Fontana RJ, Bonkovsky HL, et al; Drug Induced Liver Injury Network (DILIN). Causes, clinical features, and outcomes from a prospective study of drug-induced liver injury in the United States. Gastroenterology. 2008;135:1924-1934.
4. Björnsson ES. Epidemiology and risk factors for idiosyncratic drug-induced liver injury. Semin Liver Dis. 2014;34:115-122.
5. Suk KT, Kim DJ, Kim CH, et al. A prospective nationwide study of drug-induced liver injury in Korea. Am J Gastroenterol. 2012;107:1380-1387.
6. United States National Library of Medicine and the National Institute of Diabetes and Digestive and Kidney Diseases. LiverTox. United States National Library of Medicine Web site. Available at: http://livertox.nih.gov/. Accessed April 5, 2015.
7. Devarbhavi H, Dierkhising R, Kremers WK, et al. Single-center experience with drug-induced liver injury from India: causes, outcome, prognosis, and predictors of mortality. Am J Gastroenterol. 2010;105:2396-2404.
8. Björnsson ES. Drug-induced liver injury: an overview over the most critical compounds. Arch Toxicol. 2015;89:327-334.
9. Suk KT, Kim DJ. Drug-induced liver injury: present and future. Clin Mol Hepatol. 2012;18:249-257.
10. Herbals and dietary supplements. United States National Library of Medicine Web site. Available from: http://livertox.nih.gov/Herbals_and_Dietary_Supplements.htm. Accessed April 4, 2015.
11. Lammert C, Einarsson S, Saha C, et al. Relationship between daily dose of oral medications and idiosyncratic drug-induced liver injury: search for signals. Hepatology. 2008;47:2003-2009.
12. Björnsson ES, Bergmann OM, Björnsson HK, et al. Incidence, presentation, and outcomes in patients with drug-induced liver injury in the general population of Iceland. Gastroenterology. 2013;144:1419-1425.
13. Lucena MI, Andrade RJ, Kaplowitz N, et al; Spanish Group for the Study of Drug-Induced Liver Disease. Phenotypic characterization of idiosyncratic drug-induced liver injury: the influence of age and sex. Hepatology. 2009;49:2001-2009.
14. Tarantino G, Conca P, Basile V, et al. A prospective study of acute drug-induced liver injury in patients suffering from non-alcoholic fatty liver disease. Hepatol Res. 2007;37:410-415.
15. Hayashi PH, Fontana RJ. Clinical features, diagnosis, and natural history of drug-induced liver injury. Semin Liver Dis. 2014;34:134-144.
16. Chalasani NP, Hayashi PH, Bonkovsky HL, et al; Practice Parameters Committee of the American College of Gastroenterology. ACG Clinical Guideline: the diagnosis and management of idiosyncratic drug-induced liver injury. Am J Gastroenterol. 2014;109:950-966.
17. United States National Library of Medicine and the National Institute of Diabetes and Digestive and Kidney Diseases. Roussel Uclaf Causality Assessment Method (RUCAM) in Drug Induced Liver Injury. United States National Library of Medicine Web site. Available at: http://www.livertox.nih.gov/rucam.html. Accessed September 8, 2015.
18. Tajiri K, Shimizu Y. Practical guidelines for diagnosis and early management of drug-induced liver injury. World J Gastroenterol. 2008;14:6774-6785.
19. Fontana RJ, Seeff LB, Andrade RJ, et al. Standardization of nomenclature and causality assessment in drug-induced liver injury: summary of a clinical research workshop. Hepatology. 2010;52:730-742.
20. Leise MD, Poterucha JJ, Talwalkar JA. Drug-induced liver injury. Mayo Clin Proc. 2014;89:95-106.
21. Panackel C, Thomas R, Sebastian B, et al. Recent advances in management of acute liver failure. Indian J Crit Care Med. 2015;19:27-33.
22. Lee WM, Hynan LS, Rossaro L, et al; Acute Liver Failure Study Group. Intravenous N-acetylcysteine improves transplant-free survival in early stage non-acetaminophen acute liver failure. Gastroenterology. 2009;137:856-864.
23. Hu J, Zhang Q, Ren X, et al. Efficacy and safety of acetylcysteine in “non-acetaminophen” acute liver failure: A meta-analysis of prospective clinical trials. Clin Res Hepatol Gastroenterol. 2015.
24. Lancaster EM, Hiatt JR, Zarrinpar A. Acetaminophen hepatotoxicity: an updated review. Arch Toxicol. 2015;89:193-199.
25. Carter BA, Karpen SJ. Intestinal failure-associated liver disease: management and treatment strategies past, present, and future. Semin Liver Dis. 2007;27:251-258.
26. Woodhead JL, Howell BA, Yang Y, et al. An analysis of N-acetylcysteine treatment for acetaminophen overdose using a systems model of drug-induced liver injury. J Pharmacol Exp Ther. 2012;342:529-540.
27. Bohan TP, Helton E, McDonald I, et al. Effect of L-carnitine treatment for valproate-induced hepatotoxicity. Neurology. 2001;56:1405-1409.
28. Russell S. Carnitine as an antidote for acute valproate toxicity in children. Curr Opin Pediatr. 2007;19:206-210.
29. Ghabril M, Chalasani N, Björnsson E. Drug-induced liver injury: a clinical update. Curr Opin Gastroenterol. 2010;26:222-226.
30. Devarbhavi H. An update on drug-induced liver injury. J Clin Exp Hepatol. 2012;2:247-259.
31. Castaldo ET, Chari RS. Liver transplantation for acute hepatic failure. HPB (Oxford). 2006;8:29-34.
› If you suspect your patient may have drug-induced liver injury (DILI), take a careful medication history, assess for risk factors, and investigate other possible causes. B
› Immediately stop any drugs you suspect are causing DILI, especially when the patient’s liver enzymes are rapidly increasing or there is evidence of acute liver failure. A
Strength of recommendation (SOR)
A Good-quality patient-oriented evidence
B Inconsistent or limited-quality patient-oriented evidence
C Consensus, usual practice, opinion, disease-oriented evidence, case series
CASE › James A, age 68, presents to his family physician (FP) with anorexia, nausea, and vague upper abdominal pain that he’s had for 2 weeks. Mr. A has diabetes and hypertension, both of which are well controlled by medications. He also consumes more than 4 alcoholic beverages daily.
On examination, the FP notes icterus and tenderness in the right hypochondrium. Liver function testing reveals elevated liver enzyme levels: aspartate aminotransferase (AST), 864 IU/L (normal range: 10-40 IU/L); alanine aminotransferase (ALT), 1012 IU/L (normal range: 7-56 IU/L); serum bilirubin, 4.8 mg/dL (normal range: 0.3-1.9 mg/dL); and alkaline phosphatase (ALP), 200 IU/L (normal range: 44-147 IU/L). Mr. A’s coagulation profile is slightly abnormal. He is provisionally diagnosed with acute hepatitis. The FP sends blood samples to the lab to assess for viral markers, and starts symptomatic management.
If Mr. A were your patient, how would you proceed?
In the United States, drug-induced liver injury (DILI) is the most common cause of acute liver failure.1,2 It can occur due to ingestion of any therapeutic drug, herbal product, or xenobiotic. Further complicating matters is the fact that it has an unpredictable and heterogeneous course, ranging from an asymptomatic rise in liver enzymes to acute liver failure. This article describes the risk factors, common causative agents, tools for early diagnosis, and effective management of DILI.
Two types of risk factors for DILI
Risk factors for DILI can be classified as drug-related (eg, dose, concomitant medications, polypharmacy) or host-related (eg, age, gender, alcohol intake, concomitant infections).3-5
Drug-related factors. Hundreds of agents can lead to liver injury. In fact, the US National Library of Medicine and the National Institute of Diabetes and Digestive and Kidney Diseases have created LiverTox (http://www.livertox.nih.gov/), an online database that provides detailed information on more than 600 such agents.6 Antibiotics are the most common cause of DILI, followed by neuropsychiatric drugs, immunomodulatory agents, antihypertensives, analgesics, antineoplastic drugs, and lipid-lowering agents.2
Among antibiotics, the specific medication most often responsible for DILI varies by geographical region. Amoxicillin/clavulanic acid is the most common causative antibiotic in the United States, whereas anti-tuberculosis agents such as isoniazid, rifampin, and pyrazinamide are the most common causative drugs in developing countries such as India, where the prevalence of tuberculosis is still high.7,8 Herbal and dietary supplements are emerging as an important cause of DILI.5,9,10
The use of multiple drugs further increases the risk of developing DILI.10 Drugs with a recommended daily dose of <50 mg are rarely associated with DILI.11
Host-related factors. Vulnerability to DILI is influenced by a patient’s age and sex.3,12 Very young and very old patients have an increased risk of developing DILI, and a patient’s age may make him or her particularly susceptible to the effects of certain medications.3,12,13 For example, children are more susceptible to DILI as a result of taking valproate or aspirin, whereas older patients are more likely to experience DILI brought on by amoxicillin/clavulanic acid.13 The pattern of liver injury also varies by age. Younger patients present most commonly with a hepatocellular pattern of injury, whereas older patients mostly present with a cholestatic pattern of liver injury.3
Some studies have found that women have a greater risk of developing DILI than men.13 The presence of chronic liver diseases, alcoholism, and nonalcoholic fatty liver disease (NAFLD) increase the risk of developing DILI.14 Diabetes is an independent risk factor for DILI.3
Clinical presentation of DILI varies widely
Some degree of liver injury may occur in any patient who ingests a drug that is metabolized in the liver. The clinical presentation of a patient with DILI can vary from an asymptomatic rise in liver enzymes to acute liver failure. Unexplained transaminitis should raise the possibility of DILI, especially when the patient has started a new drug in the preceding 3 months. However, in most patients, an asymptomatic rise in liver enzymes is due to hepatic adaptation or tolerance. In such cases, liver enzyme levels tend to normalize even if the patient continues to take the drug in the same dose.15
Apart from nonspecific symptoms such as anorexia, nausea, and vomiting, a patient with DILI may exhibit right upper quadrant pain, skin rash, or itching. A patient with severe DILI might exhibit jaundice, ascites, or encephalopathy.15
A stepwise approach to evaluation
DILI is a diagnosis of exclusion.16 Guidelines from the American College of Gastroenterology (ACG) recommend a stepwise approach to evaluating a patient you suspect may have DILI (TABLE).16 First, take a detailed history regarding the onset of symptoms, time latency, and use of hepatotoxic and other drugs (dosage and duration of use). Also ask the patient about his or her use of herbal products, dietary supplements, and alcohol. Check the patient’s history for the presence of other liver diseases such as NAFLD.
Next, make sure initial laboratory testing includes liver function tests and an eosinophil count. In order to classify the pattern of liver injury as hepatocellular, cholestatic, or mixed, you’ll need to calculate the patient’s R value (ALGORITHM16-18). This value is calculated by dividing the patient’s ALT level by the ALP, using the upper limit of the normal range (ULN) as follows: R = (ALT value ÷ ALT ULN) ÷ (ALP value ÷ ALP ULN).17 A hepatocellular pattern of liver injury is indicated by an R value >5, a cholestatic pattern is an R value <2, and a mixed pattern is suggested by an R value between 2 and 5.17
Quite often, the pattern of liver damage is characteristic of a particular drug or drug class. For example, DILI induced by amoxicillin/clavulanic acid typically will exhibit a cholestatic injury pattern, whereas DILI resulting from a nonsteroidal anti-inflammatory drug typically is associated with a hepatocellular injury pattern.16
Rule out other causes. Further investigations should be directed at ruling out other possible causes of liver injury. If a patient has a hepatocellular pattern of liver injury, order serological tests to rule out acute viral hepatitis (hepatitis A, B, C, and E). Such patients should also be evaluated for autoimmune hepatitis, Budd-Chiari syndrome, Wilson’s disease, and ischemic hepatitis.16 In patients with a predominant cholestatic pattern, imaging studies and other serological tests should be ordered to rule out pancreato-biliary diseases.
Once DILI is confirmed, identify offending agent, grade severity
Which medication is responsible for DILI is determined by the physician based on his or her clinical experience and judgment. Guiding points are improvement of liver function tests after stopping the suspected drug (more on that in a bit), exclusion of other possible causes of liver injury, and the results of liver biopsy. (See “Time for a biopsy?”16)
DILI severity can be graded as mild (1+) to fatal (5+).19 Mild forms of DILI are associated with increased levels of liver enzymes (AST, ALT, or ALP) without raised serum bilirubin or clinical jaundice, whereas moderately severe DILI is associated with clinical jaundice or hyperbilirubinemia (bilirubin >2 mg/dL).19 Severe forms of DILI are associated with features of hepatic failure, such as ascites, encephalopathy, and an elevated international normalized ratio (>1.5), in addition to hyperbilirubinemia or jaundice.
American College of Gastroenterology guidelines recommend liver biopsy if autoimmune hepatitis is suspected, liver enzymes remain elevated for more than 6 months, or liver enzymes continue to rise even after stopping the suspected offending drug.16
Biopsy should also be considered if a patient’s alanine aminotransferase level fails to fall by at least half 60 days after stopping the suspected medication (in a patient with a hepatocellular pattern) or if a patient’s peak alkaline phosphatase level doesn’t fall by at least half at 180 days after stopping the suspected medication (in a patient with a cholestatic pattern).
CASE › Mr. A’s lab results are negative for viral markers. On further questioning, he reveals that he had recovered from a sore throat 3 weeks earlier, for which he had been prescribed an unknown dose of amoxicillin/clavulanic acid. A review of Mr. A’s drug history finds that he is taking metformin, pioglitazone, telmisartan, and atorvastatin for his chronic conditions. The FP suspects DILI , and refers Mr. A to a liver specialist for further investigation.
For many patients, stopping the offending drug will be sufficient
The first step in managing DILI is to stop the medication suspected of causing the liver injury.20 Discontinuing the suspected medication may not always be necessary in patients who have only slightly elevated liver enzymes, but should be strongly considered for a patient who has a considerable increase in liver enzymes levels (ie, an AST, ALT, or serum bilirubin level more than 3 times the ULN or an ALP more than 1.5 times the ULN at any time after initiating a new drug).18 Certain drugs, such as those used to treat tuberculosis, are associated with hepatic adaptation, in which there is spontaneous resolution of the increased liver enzymes level even while the drug is continued in the same dose.
In patients with mild to moderate DILI, stopping the offending drug typically results in normalization of liver enzyme levels.20 Management of patients with moderate to severe DILI is mainly supportive; however, a patient with acute liver failure will require intensive care support.21,22 Consider hospital admission for patients who exhibit severe symptoms, such as intractable vomiting or severe dehydration, those who experience bleeding due to coagulation failure, and those who develop hepatic encephalopathy.21
When more aggressive steps are needed
N-acetylcysteine (NAC) should be considered for all patients with DILI who present with acute liver failure.12,23-25 NAC can be administered either orally or intravenously. The following 3 regimens have been well studied for patients with acetaminophen-induced liver injury:26
• Oral 72-hour regimen: Loading dose of 140 mg/kg followed by 70 mg/kg every 4 hours up to 72 hours
• Intravenous 72-hour regimen: Loading infusion of 150 mg/kg over one hour, followed by 50 mg/kg over 4 hours, followed by 418.75 mg/kg over 67 hours
• Intravenous 21-hour regimen: Loading infusion of 150 mg/kg over one hour, followed by 50 mg/kg over 4 hours, followed by 100 mg/kg over 16 hours.
Of these regimens, the 72-hour IV regimen has been found to be more effective than the 21-hour regimen for patients with acetaminophen-induced liver toxicity.26 A study of NAC administered as continuous infusion for 72 hours in patients with acute liver failure found that the transplant-free survival rate was 40% for NAC in comparison with 27% for placebo.26
L-carnitine can be used to treat valproate-induced hepatotoxicity. In a case-control study of 92 patients with severe, symptomatic, valproate-induced hepatotoxicity, nearly half of 42 patients treated with L-carnitine survived, but only 10% of 50 patients treated solely with aggressive supportive care survived.27 Greater benefit has been found for IV vs oral L-carnitine.27,28
Ursodeoxycholic acid (UDCA), 13 to 15 mg/kg, may be helpful for DILI patients with a cholestatic pattern of liver injury.
Other therapies. Steroids have no defined role in management of DILI except in autoimmune-type DILI. Other drugs, such as silymarin and antioxidants, have been used to treat other forms of hepatic toxicities and might be beneficial for patients with DILI.29,30
Liver transplantation may be necessary to prevent death due to acute liver failure in patients with severe DILI. Various criteria, including Kings College criteria,31 can be used to select which patients may best benefit from liver transplantation.
For most patients, hospitalization will not be necessary
Generally, patients with DILI have a good prognosis.20,30 About 70% of patients with DILI do not require hospitalization, and approximately 90% recover without reaching the threshold of acute liver failure. However, patients with acute liver failure have a poor prognosis; 40% will require liver transplantation.16,20
Traditionally, patients with a cholestatic pattern of liver injury have been considered to have a better prognosis than those with a hepatocellular pattern of liver injury. Patients whose DILI is the result of a hypersensitivity reaction to a drug also have a good prognosis. This may be because features such as skin rash prompt early diagnosis and discontinuation of the offending drugs.7
CASE › A liver specialist evaluates Mr. A and concludes that his liver injury was caused by his long-term heavy alcohol consumption and exacerbated by the amoxicillin/clavulanic acid he had recently been prescribed. After 2 days, Mr. A develops drowsiness and is admitted to the hospital for further management. He is managed in the intensive care unit under supervision of a gastroenterologist. A NAC infusion is started at a loading dose of 150 mg/kg to manage acute liver failure. Unfortunately, however, Mr. A succumbs to his illness.
CORRESPONDENCE
Piyush Ranjan, MD, All India Institute of Medical Sciences, Ansari Nagar, New Delhi, India 110029; [email protected].
1. Khashab M, Tector AJ, Kwo PY. Epidemiology of acute liver failure. Curr Gastroenterol Rep. 2007;9:66-73.
2. Reuben A, Koch DG, Lee WM; Acute Liver Failure Study Group. Drug-induced acute liver failure: results of a U.S. multicenter, prospective study. Hepatology. 2010;52:2065-2076.
3. Chalasani N, Fontana RJ, Bonkovsky HL, et al; Drug Induced Liver Injury Network (DILIN). Causes, clinical features, and outcomes from a prospective study of drug-induced liver injury in the United States. Gastroenterology. 2008;135:1924-1934.
4. Björnsson ES. Epidemiology and risk factors for idiosyncratic drug-induced liver injury. Semin Liver Dis. 2014;34:115-122.
5. Suk KT, Kim DJ, Kim CH, et al. A prospective nationwide study of drug-induced liver injury in Korea. Am J Gastroenterol. 2012;107:1380-1387.
6. United States National Library of Medicine and the National Institute of Diabetes and Digestive and Kidney Diseases. LiverTox. United States National Library of Medicine Web site. Available at: http://livertox.nih.gov/. Accessed April 5, 2015.
7. Devarbhavi H, Dierkhising R, Kremers WK, et al. Single-center experience with drug-induced liver injury from India: causes, outcome, prognosis, and predictors of mortality. Am J Gastroenterol. 2010;105:2396-2404.
8. Björnsson ES. Drug-induced liver injury: an overview over the most critical compounds. Arch Toxicol. 2015;89:327-334.
9. Suk KT, Kim DJ. Drug-induced liver injury: present and future. Clin Mol Hepatol. 2012;18:249-257.
10. Herbals and dietary supplements. United States National Library of Medicine Web site. Available from: http://livertox.nih.gov/Herbals_and_Dietary_Supplements.htm. Accessed April 4, 2015.
11. Lammert C, Einarsson S, Saha C, et al. Relationship between daily dose of oral medications and idiosyncratic drug-induced liver injury: search for signals. Hepatology. 2008;47:2003-2009.
12. Björnsson ES, Bergmann OM, Björnsson HK, et al. Incidence, presentation, and outcomes in patients with drug-induced liver injury in the general population of Iceland. Gastroenterology. 2013;144:1419-1425.
13. Lucena MI, Andrade RJ, Kaplowitz N, et al; Spanish Group for the Study of Drug-Induced Liver Disease. Phenotypic characterization of idiosyncratic drug-induced liver injury: the influence of age and sex. Hepatology. 2009;49:2001-2009.
14. Tarantino G, Conca P, Basile V, et al. A prospective study of acute drug-induced liver injury in patients suffering from non-alcoholic fatty liver disease. Hepatol Res. 2007;37:410-415.
15. Hayashi PH, Fontana RJ. Clinical features, diagnosis, and natural history of drug-induced liver injury. Semin Liver Dis. 2014;34:134-144.
16. Chalasani NP, Hayashi PH, Bonkovsky HL, et al; Practice Parameters Committee of the American College of Gastroenterology. ACG Clinical Guideline: the diagnosis and management of idiosyncratic drug-induced liver injury. Am J Gastroenterol. 2014;109:950-966.
17. United States National Library of Medicine and the National Institute of Diabetes and Digestive and Kidney Diseases. Roussel Uclaf Causality Assessment Method (RUCAM) in Drug Induced Liver Injury. United States National Library of Medicine Web site. Available at: http://www.livertox.nih.gov/rucam.html. Accessed September 8, 2015.
18. Tajiri K, Shimizu Y. Practical guidelines for diagnosis and early management of drug-induced liver injury. World J Gastroenterol. 2008;14:6774-6785.
19. Fontana RJ, Seeff LB, Andrade RJ, et al. Standardization of nomenclature and causality assessment in drug-induced liver injury: summary of a clinical research workshop. Hepatology. 2010;52:730-742.
20. Leise MD, Poterucha JJ, Talwalkar JA. Drug-induced liver injury. Mayo Clin Proc. 2014;89:95-106.
21. Panackel C, Thomas R, Sebastian B, et al. Recent advances in management of acute liver failure. Indian J Crit Care Med. 2015;19:27-33.
22. Lee WM, Hynan LS, Rossaro L, et al; Acute Liver Failure Study Group. Intravenous N-acetylcysteine improves transplant-free survival in early stage non-acetaminophen acute liver failure. Gastroenterology. 2009;137:856-864.
23. Hu J, Zhang Q, Ren X, et al. Efficacy and safety of acetylcysteine in “non-acetaminophen” acute liver failure: A meta-analysis of prospective clinical trials. Clin Res Hepatol Gastroenterol. 2015.
24. Lancaster EM, Hiatt JR, Zarrinpar A. Acetaminophen hepatotoxicity: an updated review. Arch Toxicol. 2015;89:193-199.
25. Carter BA, Karpen SJ. Intestinal failure-associated liver disease: management and treatment strategies past, present, and future. Semin Liver Dis. 2007;27:251-258.
26. Woodhead JL, Howell BA, Yang Y, et al. An analysis of N-acetylcysteine treatment for acetaminophen overdose using a systems model of drug-induced liver injury. J Pharmacol Exp Ther. 2012;342:529-540.
27. Bohan TP, Helton E, McDonald I, et al. Effect of L-carnitine treatment for valproate-induced hepatotoxicity. Neurology. 2001;56:1405-1409.
28. Russell S. Carnitine as an antidote for acute valproate toxicity in children. Curr Opin Pediatr. 2007;19:206-210.
29. Ghabril M, Chalasani N, Björnsson E. Drug-induced liver injury: a clinical update. Curr Opin Gastroenterol. 2010;26:222-226.
30. Devarbhavi H. An update on drug-induced liver injury. J Clin Exp Hepatol. 2012;2:247-259.
31. Castaldo ET, Chari RS. Liver transplantation for acute hepatic failure. HPB (Oxford). 2006;8:29-34.
Signature may predict progression to MM
Photo by Graham Colm
New research has revealed a microRNA (miRNA) signature in the bone marrow of patients with multiple myeloma (MM) that is also detectable in peripheral blood.
Investigators believe this signature may mark the onset of MM and predict progression to MM in patients with monoclonal gammopathy of undetermined significance (MGUS) or smoldering myeloma (SMM).
This research has been published in The Journal of Molecular Diagnostics.
“Currently, there is no single factor that can predict patients with MGUS or SMM who are likely to progress to myeloma,” said Katherine R. Calvo, MD, PhD, of the National Institutes of Health in Bethesda, Maryland.
“A biomarker of disease progression in the peripheral blood could assist in the early identification of patients evolving to multiple myeloma.”
With this in mind, Dr Calvo and her colleagues studied miRNAs as possible biomarkers of MM. Previous research has shown increased levels of specific miRNAs in the blood and plasma of MM patients.
In this study, the investigators analyzed bone marrow, plasma, and serum samples from healthy controls and patients with MM, MGUS, or SMM.
The team analyzed fluid from the bone marrow of 20 patients with MM and identified 111 miRNAs that showed a 2-fold or greater difference from levels observed in 8 control samples. Sixty-nine of the miRNAs were downregulated, and 42 were upregulated.
Further analysis revealed a unique miRNA signature indicative of MM. The bone marrow signature included 8 members of the let-7 family of miRNAs, each of which showed significant decreases ranging from 6-fold to 17-fold (P<0.03) in patients with MM.
Other experiments revealed the miRNA profiles characteristic of MM in peripheral blood, serum, and plasma samples.
Using quantitative real-time PCR, the investigators identified 18 miRNAs that were significantly decreased in bone marrow MM samples. Of these, 11 (60%) miRNAs were also significantly decreased in serum samples, and 6 of the 11 were also found to be lower in plasma samples (including 3 members of the let-7 miRNA family).
The investigators further explored whether the miRNA pattern of MM in precursor diseases changes as the disease progresses. They analyzed serum samples in 17 patients with MGUS, 17 with SMM, 13 with MM, and 12 healthy controls.
Only 4 of the 11 miRNAs (36%) that were reduced in the MM serum samples were lower in the MGUS samples.
“This suggests that aberrant expression of these [4] miRNAs may be associated with early events in plasma cell neoplasia,” Dr Calvo said.
Eight of the 11 (73%) miRNAs were decreased in SMM plasma samples. However, 3 (27%) were significantly reduced only in the MM samples, suggesting that downregulation of this group of miRNAs may be related to later events during evolution from precursor disease to MM.
“Our findings suggest that the antiproliferative and proapoptotic miRNAs, such as the let-7 family members, are downregulated in multiple myeloma’s microenvironment,” Dr Calvo said.
“These findings suggest that measuring expression of miRNAs associated with myeloma progression in the peripheral blood may hold promise for predicting disease progression in MGUS and SMM.” ![]()
CHMP recommends product for hemophilia A

The European Medicines Agency’s Committee for Medicinal Products for Human Use (CHMP) has recommended marketing authorization for the recombinant factor VIII Fc fusion protein efmoroctocog alfa (Elocta) to treat patients with hemophilia A.
The CHMP’s recommendation will be reviewed by the European Commission (EC). The EC usually follows the CHMP’s recommendations and is expected to
deliver its final decision within 3 months.
If approved by the EC, efmoroctocog alfa would be the first hemophilia A treatment with prolonged circulation available in the European Union (plus Iceland, Lichtenstein, and Norway).
The CHMP’s positive opinion of efmoroctocog alfa was based on results from 2 phase 3 studies—A-LONG and Kids A-LONG.
A-LONG
The A-LONG study included 165 previously treated males 12 years of age and older with severe hemophilia A. Researchers evaluated individualized and weekly prophylaxis to reduce or prevent bleeding episodes and on-demand dosing to treat bleeding episodes.
Prophylaxis with efmoroctocog alfa resulted in low annualized bleeding rates, and a majority of bleeding episodes were controlled with a single injection of efmoroctocog alfa.
None of the patients developed neutralizing antibodies, efmoroctocog alfa was considered well-tolerated, and the product had a prolonged half-life when compared with rFVIII.
Kids A-LONG
The Kids A-LONG study included 71 boys (younger than 12) with severe hemophilia A who had at least 50 prior exposure days to FVIII therapies.
The children saw their median annualized bleeding rate decrease with efmoroctocog alfa, and close to half of the children did not have any bleeding episodes while they were receiving efmoroctocog alfa.
None of the patients developed inhibitors, and researchers said adverse events were typical of a pediatric hemophilia population.
ASPIRE
Participants in both the A-LONG and Kids A-LONG trials were able to enroll in ASPIRE, a phase 3 extension study evaluating the long-term safety and efficacy of efmoroctocog alfa.
Interim results of ASPIRE suggested that extended treatment with efmoroctocog alfa was largely safe and effective.
Efmoroctocog alfa development
Elocta is the European trade name for efmoroctocog alfa, which is known as Eloctate in the US, Canada, Australia, New Zealand, and Japan, where it is approved for the treatment of hemophilia A.
Biogen and Sobi are collaboration partners in the development and commercialization of efmoroctocog alfa for hemophilia A.
Last year, Sobi exercised its opt-in right to assume final development and commercialization of efmoroctocog alfa in the Sobi territories (essentially, Europe, North Africa, Russia, and certain countries in the Middle East). Biogen leads development for efmoroctocog alfa, has manufacturing rights, and has commercialization rights in North America and all other regions in the world excluding the Sobi territories. ![]()
New chimeric CD19 antibody may reduce MRD in ALL

NEW YORK—Researchers have developed a pharmaceutical-grade, third-generation, CD19-specific antibody that reduced minimal residual disease (MRD) in pediatric patients with B-cell precursor acute lymphoblastic leukemia (BCP-ALL).
This chimerized, Fc-optimized antibody—4G7SDIE—was used on a compassionate-need basis in 14 patients with relapsed or refractory BCP-ALL. Nine of the patients had prior stem cell transplants.
Ursula JE Seidel, a PhD candidate at University Children’s Hospital Tubingen in Germany, discussed early results with the new antibody (poster B144) during the inaugural CRI-CIMT-EATI-AACR International Cancer Immunotherapy Conference.
Patients received 4G7SDIE infusions ranging from 5 mg/m2 to 50 mg/m2 twice a week for a year or longer.
They rarely experienced fever, nausea, or headache, according to the investigators, and all had B-cell depletion.
“The good thing about this antibody is it has a very low toxicity profile,” Seidel noted.
Upon discontinuation of therapy, B-cell counts recovered rapidly to normal levels.
The researchers followed the patients for a median of 543 days after transplant (range, 208–1137) and a median of 720 days after administration of 4G7SDIE (range, 264–1115).
Nine of the 14 patients had a reduction in MRD by 1 log or more, 2 of whom were receiving additional therapy with tyrosine kinase inhibitors.
Five patients had a reduction in MRD below the quantifiable level, and 2 patients became MRD-negative.
Six patients relapsed, and 5 of them died from relapsed disease. Two patients died of sepsis or chemotoxicity while in complete molecular remission. And 6 patients remain in complete molecular remission.
Functional characterization of 4G7SDIE
Through analysis of cells from healthy volunteers and BCP-ALL blasts of untreated and treated patients, the researchers determined that 4G7SDIE mediates enhanced antibody‑dependent cellular cytotoxicity through its improved capability to recruit FcγRIIIa-bearing effector cells.
They identified natural killer cells and γδ T cells as the main effector cells. And they determined that the FcγRIIIa-V158F polymorphism did not influence the effect of 4G7SDIE-mediated antibody‑dependent cellular cytotoxicity.
The researchers believe that the promising anti-leukemic effects of 4G7SDIE both in vitro and in vivo call for additional exploration. They are currently planning a phase 1/2 study to further assess the therapeutic activity of 4G7SDIE. ![]()
Group calls for more investment in radiotherapy
woman for radiotherapy
Photo by Rhoda Baer
VIENNA—Millions of people throughout the world are dying from potentially treatable cancers because of a chronic underinvestment in radiotherapy resources, according to a new report.
The report suggests that expanding access to radiotherapy services will require a sizeable investment upfront, but that investment could bring economic benefits of up to $365 billion in developing countries over the next 20 years.
The report was published in The Lancet Oncology and presented at the 2015 European Cancer Congress.
The report estimates that 204 million fractions of radiotherapy will be needed to treat the 12 million cancer patients worldwide who could benefit from treatment in 2035.
But the cost per fraction is highly cost-effective and low compared to the price of many new cancer drugs, according to the report’s authors.
They estimate that full access to radiotherapy could be achieved for all patients in need in low-and middle income countries (LMIC) by 2035 for $97 billion, with potential health benefits of 27 million life-years saved and economic benefits ranging from $278 billion to $365 billion over the next 20 years.
“There is a widespread misconception that the costs of providing radiotherapy put it beyond the reach of all but the richest countries, [but] nothing could be further from the truth,” said Rifat Atun, MBBS, of Harvard University in Boston, Massachusetts.
“Our work . . . clearly shows that not only can this essential service be deployed safely and high quality treatment delivered in low- and middle-income countries, but that scale-up of radiotherapy capacity is a feasible and highly cost-effective investment.”
The report provides details on access to radiotherapy services across the world, on a country-by-country basis. The authors calculated the costs and benefits of meeting the worldwide shortfall in resources and bridging the gap in access to effective treatment.
Estimates suggest that, at present, about 40% to 60% of cancer patients worldwide have access to radiotherapy. Even in high-income countries like Canada, Australia, and the UK, numbers of radiotherapy facilities, equipment, and trained staff are inadequate.
Access is worst in low-income countries, where as many as 9 out of 10 people cannot access radiotherapy. The problem of access is especially acute in Africa. In most African countries, radiotherapy is virtually non-existent. Forty countries have no radiotherapy facilities at all.
“The time has come to agree and implement immediate actions to tackle the global shortfall in radiotherapy services and the crisis of access to this highly effective treatment,” Dr Atun said.
With that in mind, he and his colleagues called for the following 6 targets to be met.
By 2020:
- 80% of countries to have comprehensive cancer plans that include radiotherapy.
- Each LMIC to create 1 new center for treatment and training.
- 80% of LMICs to include radiotherapy services in their universal health coverage plans.
By 2025:
- A 25% increase in radiotherapy treatment capacity.
- LMICs to train 7500 radiation oncologists, 20,000 radiotherapy radiographers, and 6000 medical physicists.
- $46 billion of upfront investment to be raised to establish radiotherapy infrastructure and training in LMICs (with help from international banks and the private sector).
“The evidence outlined in the [report] reinforces the case for investing in radiotherapy as an essential component of cancer control,” said Mary Gospodarowicz, MD, co-chair of the UICC Global Task Force on Radiotherapy for Cancer Control.
“The building of radiotherapy capacity will require large initial investment. However, the treatment is more cost-effective than chemotherapy and surgery for treating cancer, and the health and economic benefits will be realized in just 10 to 15 years.” ![]()
High death rates for IBD patients who underwent emergency resections
Patients with inflammatory bowel disease (IBD) were about five to eight times more likely to die after emergency intestinal resection as opposed to elective surgery, a large meta-analysis found.
Overall mortality rates after emergency intestinal resection were 5.3% for patients with ulcerative colitis (UC) and 3.6% for patients with Crohn’s disease (CD), said Dr. Sunny Singh and his associates at the University of Calgary in Alberta, Canada. In contrast, only 0.6%-0.7% of patients died after elective resection, the researchers reported in the October issue of Gastroenterology (2015 Jun 5. doi: 10.1053/j.gastro.2015.06.001).
Source: American Gastroenterological AssociationClinicians should optimize medical management to avoid emergency resection, seek ways to reduce associated mortality, and use the data when counseling patients and weighing medical and surgical management options, they added.
Intestinal resection is less common among patients with IBD than in decades past, but almost half of CD patients undergo the surgery within 10 years of diagnosis, as do 16% of UC patients, according to another meta-analysis (Gastroenterology 2013;145:996-1006). Past studies have reported divergent rates of death after these surgeries, the researchers noted. To better understand mortality rates and relevant risk factors, they reviewed 18 original research articles and three abstracts published between 1990 and 2015, all of which were indexed in Medline, EMBASE, or PubMed. The studies included 67,057 UC patients and 75,971 CD patients from 15 countries.
Rates of mortality after elective resection were significantly lower than after emergency resection, whether patients had CD (elective, 0.6%; 95% confidence interval, 0.2%-1.7%; emergency, 3.6%; 1.8%-6.9%) or UC (elective, 0.7%; 0.6%-0.9%; emergency, 5.3%; 3.8%-7.3%), the researchers found. Death rates did not significantly differ based on disease type. Postoperative mortality dropped significantly after the 1990s among CD patients only, perhaps because emergency surgery has become less common in Calgary since 1997, the researchers said. However, they were unable to compare changes in death rates over time by surgery type, they said.
Several factors could explain the high fatality rates after emergency intestinal resection, the researchers said. Patients tended to have worse disease activity and higher rates of intestinal obstruction, intra-abdominal abscess, toxic megacolon, preoperative clostridial diarrhea, venous thromboembolism, malnourishment, or prolonged treatment with intravenous corticosteroids, they said. General surgeons are more likely to perform emergency resections than elective cases, which are typically handled by more experienced colorectal surgeons, they added. Emergency resections also are less likely to be performed laparoscopically than are elective resections, they noted. “The low risk of death associated with elective intestinal resections for CD and UC could be used as a quality assurance benchmark to compare outcomes between hospitals and surgeons,” they added.
The research was funded by the Canadian Institute of Health Research, Alberta-Innovates Health-Solutions, the Alberta IBD Consortium. Dr. Singh reported no conflicts of interest. Senior author Dr. Gilaad Kaplan and four coauthors disclosed speaker, advisory board, and funding relationships with a number of pharmaceutical companies.
FROM GASTROENTEROLOGY
Key clinical point: Patients with IBD were about five to eight times more likely to die after emergency intestinal resection as opposed to elective surgery.
Major finding: Overall mortality rates after emergency intestinal resection were 5.3% for patients with ulcerative colitis and 3.6% for Crohn’s disease; mortality rates after elective surgery were 0.7% and 0.6%, respectively.
Data source: Meta-analysis of 18 original research studies and three abstracts published between 1990 and 2015.
Disclosures: The research was funded by the Canadian Institute of Health Research, Alberta-Innovates Health-Solutions, the Alberta IBD Consortium. Dr. Singh reported no conflicts of interest. Senior author Dr. Gilaad Kaplan and four coauthors disclosed speaker, advisory board, and funding relationships with a number of pharmaceutical companies.
Case Studies in Toxicology: One Last Kick—Transverse Myelitis After an Overdose of Heroin via Insufflation

Case
A 17-year-old adolescent girl with a history of depression and opioid dependence, for which she was taking buprenorphine until 2 weeks earlier, presented to the ED via emergency medical services (EMS) after her father found her lying on the couch unresponsive and with shallow respirations. Naloxone was administered by EMS and her mental status improved.
At presentation, the patient admitted to insufflation of an unknown amount of heroin and ingestion of 2 mg of alprazolam earlier in the day. She denied any past or current use of intravenous (IV) drugs. During monitoring, she began to complain of numbness in her legs and an inability to urinate. Examination revealed paralysis and decreased sensation of her bilateral lower extremities to the midthigh, with decreased rectal tone. Because of the patient’s history of drug use and temporal association with the heroin overdose, both neurosurgery and toxicology services were consulted.
What can cause lower extremity paralysis in a drug user?
The differential diagnosis for the patient at this point included toxin-induced myelopathy, Guillain-Barré syndrome, hypokalemic periodic paralysis, spinal compression, epidural abscess, cerebrovascular accident, spinal lesion, and spinal artery dissection or infarction.
Although Guillain-Barré syndrome presents with ascending paralysis, there is usually an antecedent respiratory or gastrointestinal infection. While epidural abscess with spinal compression is associated with IV drug use and can present similarly, the patient in this case denied IV use. In the absence of any risk factors, cerebrovascular accident and spinal artery dissection were also unlikely.
Case Continuation
A bladder catheter was placed due to the patient’s inability to urinate, and approximately 1 L of urine output was retrieved. Immediate magnetic resonance imaging (MRI) demonstrated increased T2 signal intensity and expansion of the distal thoracic cord and conus without mass lesion, consistent with transverse myelitis (TM).
What is transverse myelitis and why does it occur?
Transverse myelitis is an inflammatory demyelinating disorder that focally affects the spinal cord, resulting in a specific pattern of motor, sensory, and autonomic dysfunction.1 Signs and symptoms include paresthesia, paralysis of the extremities, and loss of bladder and bowel control. The level of the spinal cord affected determines the clinical effects. Demyelination typically occurs at the thoracic segment, producing findings in the legs, as well as bladder and bowel dysfunction.
The exact cause of TM is unknown, but the inflammation may result from a viral complication or an abnormal immune response. Infectious viral agents suspected of causing TM include varicella zoster, herpes simplex, cytomegalovirus, Epstein-Barr, influenza, human immunodeficiency virus, hepatitis A, and rubella. It has also been postulated that an autoimmune reaction is responsible for the condition.
In some individuals, TM represents the first manifestation of an underlying demyelinating disorder such as multiple sclerosis or neuromyelitis optica. A diagnosis of TM is made through patient history, physical examination, and characteristic findings on neuroimaging, specifically MRI.
Heroin use has long been associated with the development of TM, and is usually associated with IV administration of the drug after a period of abstinence.2 This association strengthens the basis for an immunologic etiology—an initial sensitization and subsequent reexposure causing the effects of TM. There have also been cases of TM coexisting with rhabdomyolysis due to the patient being found in a contorted position.3 Another theory of the etiology of heroin-associated TM is a reaction to a possible adulterant or contaminant in the heroin.4
What is the treatment and prognosis of transverse myelitis?
Since there is no cure for TM, treatment is directed at reducing inflammation in the spinal cord. Initial therapy generally includes corticosteroids. In patients with a minimal response to corticosteroids, plasma exchange can be attempted. There are also limited data to suggest a beneficial role for the use of IV immunoglobulin.5 In addition to treatment, general supportive care must also be optimized, such as the use of prophylaxis for thrombophlebitis due to immobility and physical therapy, if possible.
The prognosis of patients with TM is variable, and up to two thirds of patients will have moderate-to-severe residual neurological disability.6 Recovery is slow, with most patients beginning to show improvement within the first 2 to 12 weeks from treatment and supportive care. The recovery process can continue for 2 years. However, if no improvement is made within the first 3 to 6 months, recovery is unlikely.7 Cases of heroin-associated TM may have a more favorable prognosis.8
A majority of individuals will only experience this clinical entity once, but there are rare causes of recurrent or relapsing TM.7 In these situations, a search for underlying demyelinating diseases should be performed.
Case Conclusion
The patient was immediately started on IV corticosteroids, but as there was no improvement after 5 days, plasmapheresis was performed. She received 5 cycles of plasmapheresis and a 5-day course of IV immunoglobulin but still without any improvement. A repeat MRI of the thoracic spine was performed and raised the possibility of cord infarct, but infectious or inflammatory myelitis remained within differential consideration. The patient continued to make minimal improvement with physical therapy and, after a 3-week hospital course, she was transferred to inpatient rehabilitation for further care. Over the next 2 months, the loss of sensation and motor ability of her legs did not improve, but she did regain control of her bowels and bladder.
Dr Regina is a medical toxicology fellow in the department of emergency medicine at North Shore Long Island Jewish Health System, New York. Dr Nelson, editor of “Case Studies in Toxicology,” is a professor in the department of emergency medicine and director of the medical toxicology fellowship program at the New York University School of Medicine and the New York City Poison Control Center. He is also associate editor, toxicology, of the EMERGENCY MEDICINE editorial board.
- Pandit L. Transverse myelitis spectrum disorders. Neurol India. 2009;57(2):126-133.
- Richter RW, Rosenberg RN. Transverse myelitis associated with heroin addiction. JAMA. 1968;206(6):1255-1257.
- Sahni V, Garg D, Garg S, Agarwal SK, Singh NP. Unusual complications of heroin abuse: transverse myelitis, rhabdomyolysis, compartment syndrome, and ARF. Clin Toxicol (Phila). 2008;46(2):153-155.
- Schein PS, Yessayan L, Mayman CI. Acute transverse myelitis associated with intravenous opium. Neurology. 1971;21(1):101-102.
- Absoud M, Gadian J, Hellier J, et al. Protocol for a multicentre randomiSed controlled TRial of IntraVEnous immunoglobulin versus standard therapy for the treatment of transverse myelitis in adults and children (STRIVE). BMJ Open. 2015;5(5):e008312.
- West TW. Transverse myelitis--a review of the presentation, diagnosis, and initial management. Discov Med. 2013;16(88):167-177.
- Transverse myelitis fact sheet. National Institute of Neurological Disorders and Stroke. http://www.ninds.nih.gov/disorders/transversemyelitis/detail_transversemyelitis.htm. Updated June 24, 2015. Accessed September 2, 2015.
- McGuire JL, Beslow LA, Finkel RS, Zimmerman RA, Henretig FM. A teenager with focal weakness. Pediatr Emerg Care. 2008;24(12):875-879.
Case
A 17-year-old adolescent girl with a history of depression and opioid dependence, for which she was taking buprenorphine until 2 weeks earlier, presented to the ED via emergency medical services (EMS) after her father found her lying on the couch unresponsive and with shallow respirations. Naloxone was administered by EMS and her mental status improved.
At presentation, the patient admitted to insufflation of an unknown amount of heroin and ingestion of 2 mg of alprazolam earlier in the day. She denied any past or current use of intravenous (IV) drugs. During monitoring, she began to complain of numbness in her legs and an inability to urinate. Examination revealed paralysis and decreased sensation of her bilateral lower extremities to the midthigh, with decreased rectal tone. Because of the patient’s history of drug use and temporal association with the heroin overdose, both neurosurgery and toxicology services were consulted.
What can cause lower extremity paralysis in a drug user?
The differential diagnosis for the patient at this point included toxin-induced myelopathy, Guillain-Barré syndrome, hypokalemic periodic paralysis, spinal compression, epidural abscess, cerebrovascular accident, spinal lesion, and spinal artery dissection or infarction.
Although Guillain-Barré syndrome presents with ascending paralysis, there is usually an antecedent respiratory or gastrointestinal infection. While epidural abscess with spinal compression is associated with IV drug use and can present similarly, the patient in this case denied IV use. In the absence of any risk factors, cerebrovascular accident and spinal artery dissection were also unlikely.
Case Continuation
A bladder catheter was placed due to the patient’s inability to urinate, and approximately 1 L of urine output was retrieved. Immediate magnetic resonance imaging (MRI) demonstrated increased T2 signal intensity and expansion of the distal thoracic cord and conus without mass lesion, consistent with transverse myelitis (TM).
What is transverse myelitis and why does it occur?
Transverse myelitis is an inflammatory demyelinating disorder that focally affects the spinal cord, resulting in a specific pattern of motor, sensory, and autonomic dysfunction.1 Signs and symptoms include paresthesia, paralysis of the extremities, and loss of bladder and bowel control. The level of the spinal cord affected determines the clinical effects. Demyelination typically occurs at the thoracic segment, producing findings in the legs, as well as bladder and bowel dysfunction.
The exact cause of TM is unknown, but the inflammation may result from a viral complication or an abnormal immune response. Infectious viral agents suspected of causing TM include varicella zoster, herpes simplex, cytomegalovirus, Epstein-Barr, influenza, human immunodeficiency virus, hepatitis A, and rubella. It has also been postulated that an autoimmune reaction is responsible for the condition.
In some individuals, TM represents the first manifestation of an underlying demyelinating disorder such as multiple sclerosis or neuromyelitis optica. A diagnosis of TM is made through patient history, physical examination, and characteristic findings on neuroimaging, specifically MRI.
Heroin use has long been associated with the development of TM, and is usually associated with IV administration of the drug after a period of abstinence.2 This association strengthens the basis for an immunologic etiology—an initial sensitization and subsequent reexposure causing the effects of TM. There have also been cases of TM coexisting with rhabdomyolysis due to the patient being found in a contorted position.3 Another theory of the etiology of heroin-associated TM is a reaction to a possible adulterant or contaminant in the heroin.4
What is the treatment and prognosis of transverse myelitis?
Since there is no cure for TM, treatment is directed at reducing inflammation in the spinal cord. Initial therapy generally includes corticosteroids. In patients with a minimal response to corticosteroids, plasma exchange can be attempted. There are also limited data to suggest a beneficial role for the use of IV immunoglobulin.5 In addition to treatment, general supportive care must also be optimized, such as the use of prophylaxis for thrombophlebitis due to immobility and physical therapy, if possible.
The prognosis of patients with TM is variable, and up to two thirds of patients will have moderate-to-severe residual neurological disability.6 Recovery is slow, with most patients beginning to show improvement within the first 2 to 12 weeks from treatment and supportive care. The recovery process can continue for 2 years. However, if no improvement is made within the first 3 to 6 months, recovery is unlikely.7 Cases of heroin-associated TM may have a more favorable prognosis.8
A majority of individuals will only experience this clinical entity once, but there are rare causes of recurrent or relapsing TM.7 In these situations, a search for underlying demyelinating diseases should be performed.
Case Conclusion
The patient was immediately started on IV corticosteroids, but as there was no improvement after 5 days, plasmapheresis was performed. She received 5 cycles of plasmapheresis and a 5-day course of IV immunoglobulin but still without any improvement. A repeat MRI of the thoracic spine was performed and raised the possibility of cord infarct, but infectious or inflammatory myelitis remained within differential consideration. The patient continued to make minimal improvement with physical therapy and, after a 3-week hospital course, she was transferred to inpatient rehabilitation for further care. Over the next 2 months, the loss of sensation and motor ability of her legs did not improve, but she did regain control of her bowels and bladder.
Dr Regina is a medical toxicology fellow in the department of emergency medicine at North Shore Long Island Jewish Health System, New York. Dr Nelson, editor of “Case Studies in Toxicology,” is a professor in the department of emergency medicine and director of the medical toxicology fellowship program at the New York University School of Medicine and the New York City Poison Control Center. He is also associate editor, toxicology, of the EMERGENCY MEDICINE editorial board.
- Pandit L. Transverse myelitis spectrum disorders. Neurol India. 2009;57(2):126-133.
- Richter RW, Rosenberg RN. Transverse myelitis associated with heroin addiction. JAMA. 1968;206(6):1255-1257.
- Sahni V, Garg D, Garg S, Agarwal SK, Singh NP. Unusual complications of heroin abuse: transverse myelitis, rhabdomyolysis, compartment syndrome, and ARF. Clin Toxicol (Phila). 2008;46(2):153-155.
- Schein PS, Yessayan L, Mayman CI. Acute transverse myelitis associated with intravenous opium. Neurology. 1971;21(1):101-102.
- Absoud M, Gadian J, Hellier J, et al. Protocol for a multicentre randomiSed controlled TRial of IntraVEnous immunoglobulin versus standard therapy for the treatment of transverse myelitis in adults and children (STRIVE). BMJ Open. 2015;5(5):e008312.
- West TW. Transverse myelitis--a review of the presentation, diagnosis, and initial management. Discov Med. 2013;16(88):167-177.
- Transverse myelitis fact sheet. National Institute of Neurological Disorders and Stroke. http://www.ninds.nih.gov/disorders/transversemyelitis/detail_transversemyelitis.htm. Updated June 24, 2015. Accessed September 2, 2015.
- McGuire JL, Beslow LA, Finkel RS, Zimmerman RA, Henretig FM. A teenager with focal weakness. Pediatr Emerg Care. 2008;24(12):875-879.

Malpractice Counsel: Cervical Spine Injury

| An 83-year-old man presented to the ED via emergency medical services (EMS) with a chief complaint of neck pain. He was the restrained driver of a car that was struck from behind by another vehicle. The patient denied any head injury, loss of consciousness, chest pain, shortness of breath, or abdominal pain. His medical history was significant for hypertension and coronary artery disease, for which he was taking several medications. Regarding his social history, the patient denied alcohol consumption or cigarette smoking. |
The patient’s physical examination was unremarkable. His vital signs were normal, and there was no obvious external evidence of trauma. The posterior cervical spine was tender to palpation in the midline, but no step-off signs were appreciated. The neurological examination, including strength and sensation in all four extremities, was normal.
Since the patient’s only complaint was neck pain and his physical examination and history were otherwise normal, the emergency physician (EP) ordered radiographs of the cervical spine. The imaging studies were interpreted as showing advanced degenerative changes but no fractures, and the patient was prescribed an analgesic and discharged home.
When the patient woke up the next morning, he was unable to move his extremities, and returned to the same ED via EMS. He was placed in a cervical collar and found to have flaccid extremities on examination. A computed tomography (CT) scan of the cervical spine revealed a transverse fracture through the C6 vertebra. Radiology services also reviewed the cervical spine X-rays from the previous day, noting the presence of fracture.
The patient was taken to the operating room by neurosurgery services but remained paralyzed postoperatively. He never recovered from his injury and died 6 months later. His family sued the EP and the hospital for missed diagnosis of cervical spine fracture at the first ED presentation and the resulting paralysis. The case was settled for $1.3 million prior to trial.
Discussion
The evaluation of suspected cervical spine injury secondary to blunt trauma is a frequent and important skill practiced by EPs. Motor vehicle accidents are the most common cause of spinal cord injury in the United States (42%), followed by falls (27%), acts of violence (15%), and sports-related injuries (8%).1 A review by Sekon and Fehlings2 showed that 55% of all spinal injuries involve the cervical spine. Interestingly, the majority of cervical spine injuries occur at the upper or lower ends of the cervical spine; C2 vertebral fractures account for 33%, while C6 and C7 vertebral fractures account for approximately 50%.1
There are two commonly used criteria to clinically clear the cervical spine (ie, no imaging studies necessary) in blunt-trauma patients. The first is the National Emergency X-Radiography Use Study (NEXUS), which has a sensitivity of 99.6% of identifying cervical spine fractures.1 According to the NEXUS criteria, no imaging studies are required if: (1) there is no midline cervical spine tenderness; (2) there are no focal neurological deficits; (3) the patient exhibits a normal level of alertness; (4) the patient is not intoxicated; and (5) there is no distracting injury.1
The other set of criteria used to clear the cervical spine is the Canadian Cervical Spine Rule. In these criteria, a patient is considered at very low risk for cervical spine fracture in the following cases: (1) the patient is fully alert with a Glasgow Coma scale of 15; (2) the patient has no high-risk factors (ie, age >65 years, dangerous mechanism of injury, fall greater than five stairs, axial load to the head, high-speed vehicular crash, bicycle or motorcycle crash, or the presence of paresthesias in the extremities); (3) the patient has low-risk factors (eg, simple vehicle crash, sitting position in the ED, ambulatory at any time, delayed onset of neck pain, and the absence of midline cervical tenderness); and (4) the patient can actively rotate his or her neck 45 degrees to the left and to the right. The Canadian group found the above criteria to have 100% sensitivity for predicting the absence of cervical spine injury.1
The patient in this case failed both sets of criteria (ie, presence of cervical spine tenderness and age >65 years) and therefore required imaging. Historically, cervical spine X-ray (three views, anteroposterior, lateral, and odontoid; or five views, three views plus obliques) has been the imaging study of choice for such patients. Unfortunately, however, cervical spine radiographs have severe limitations in identifying spinal injury. In a large retrospective review, Woodring and Lee,3 found that the standard three-view cervical spine series failed to demonstrate 61% of all fractures and 36% of all subluxation and dislocations. Similarly, in a prospective study of 1,006 patients with 72 injuries, Diaz et al,4 found a 52.3% missed fracture rate when five-view radiographs were used to identify cervical spine injury. In addition, radiographic evaluation of elderly patients was found to be even more challenging in identifying cervical spine injury due to age-related degenerative changes.
Given the abovementioned limitations associated with radiographic imaging, CT scan of the cervical spine has become the imaging study of choice in moderate-to-severe risk patients with blunt cervical spine trauma. This modality has been shown to have a higher sensitivity and specificity for evaluating cervical spine injury compared to plain X-ray films, with CT detecting 97% to 100% of cervical spine fractures.5
In addition to demonstrating a higher sensitivity, CT also has the advantage of speed—especially when the patient is undergoing other CT studies (eg, head, abdomen, pelvis). While some clinicians criticize the higher cost of CT versus plain films, CT has been shown to decrease institutional costs (when settlement costs are taken into account) due to the reduction of the incidence of paralysis resulting from false-negative imaging studies.6
Forgotten Tourniquet
| A 33-year-old woman presented to the ED with a chief complaint of left-sided abdominal and flank pain. She described the onset of pain as abrupt, severe, and lasting approximately 3 hours in duration. She admitted to nausea, but no vomiting. She also denied a history of any previous similar symptoms or recent trauma. The patient’s medical history was unremarkable. Her last menstrual period began 3 days prior to presentation. Regarding social history, she denied any tobacco or alcohol use. |
The patient’s vital signs were: blood pressure, 138/82 mm Hg; heart rate, 102 beats/minute; respiratory rate, 18 breaths/minute; temperature 98.6˚F. Oxygen saturation was 99% on room air.
The patient appeared uncomfortable overall. The physical examination was remarkable only for mild left-sided costovertebral angle tenderness. Her abdomen was soft, nontender, and without guarding or rebound.
The EP ordered the placement of an intravenous (IV) line, through which the patient was administered normal saline and morphine and promethazine, respectively, for pain and nausea. A complete blood count, basic metabolic panel, urinalysis, and urine pregnancy test were ordered. All of the laboratory bloodwork results were normal, and the urine pregnancy test was negative. The urinalysis was remarkable for 50 to 100 red blood cells.
A noncontrast CT scan of the abdomen and pelvis revealed a 3-mm ureteral stone on the left side. When the patient returned from radiology services, her pain was significantly decreased and she felt much improved. She was diagnosed with a kidney stone and discharged home with an analgesic and a strainer, along with instructions to follow-up with urology services. The patient was in the ED for a total of 5 hours.
The plaintiff sued the EP and hospital, claiming that the tourniquet used to start the IV line and draw blood was never removed, which in turn caused nerve damage resulting in reflex sympathetic dystrophy and complex regional pain syndrome. The defense denied all of these allegations, and the ED personnel testified that the tourniquet was removed as soon as the IV was established. The defense cited the plaintiff’s medical records, which contained documentation that the tourniquet had been removed. The defense further argued that if the tourniquet had been left on as the patient alleged, she would have experienced obvious physical signs, such as swelling, redness, infiltration of fluids, pain, and numbness. A defense verdict was returned.
Discussion
It is very tempting to simply dismiss this case as absurd, with nothing to be learned from it. It does defy common sense that no one would have noticed the tourniquet or, at the very least, that the patient would not have spoken up about it during her stay in the ED. While the jury clearly came to the correct conclusion, it does highlight a real problem: forgotten tourniquets.
According to the Pennsylvania Patient Safety Advisory (PPSA), there were 125 reports of tourniquets being left on patients in Pennsylvania healthcare facilities in 1 year alone.1 In 5% of these cases, the tourniquet was discovered within a half hour of application. In approximately 66% of cases, the tourniquet was left on for up to 2 hours, and the remaining were left in place for 2 to 18 hours.
Few locations within the hospital are without risk for this type of accident. The PPSA further noted that approximately 30% of retained tourniquets occurred on medical/surgical units, 14% in the ED, and 14% on inpatient and ambulatory surgical services departments. Approximately 19% were discovered when patients were transferred from one department to another.1
In the analysis of these incidents, contributing factors to forgotten tourniquets included staff failing to follow proper procedures, inadequate staff proficiency, and staff distractions and/or interruptions.1 In addition, some patients appeared to be at increased risk of having a retained tourniquet than others. Sixty percent of 125 patients with a forgotten tourniquet were aged 70 years or older, whereas some patients were younger than age 2 years.1 Not surprisingly, patients who were unable to verbally communicate (eg, patients who were intubated, under anesthesia, had expressive aphasia, severe dementia), were at the highest risk.
In a review of recovery room incidents, Salman and Asfar2 identified two cases of forgotten tourniquets out of approximately 7,000 patients. Potential strategies to avoid this mistake include: (1) only documenting procedures after they have been completed (eg, tourniquet removal); (2) double-checking that the tourniquet has been removed prior to leaving patient bedside; and (3) the use of extra-long tourniquets so the ends are more clearly visible.
Reference - Missed Cervical Spine Injury
- Looby S, Flanders A. Spine trauma. Radiol Clin North Am. 2011;49(1):129-163.
- Sekon LH, Fehlings MG. Epidemiology, demographics, and pathophysiology of acute spinal cord injury. Spine (Phila Pa 1976). 2001;26(24 Suppl):S2-S12.
- Woodring JH, Lee C. Limitations of cervical radiography in the evaluation of acute cervical trauma. J Trauma. 1993;34(1):32-39.
- Diaz JJ Jr, Gillman C, Morris JA Jr, May AK, Carrillo YM, Guy J. Are five-view plain films of the cervical spine unreliable? A prospective evaluation in blunt trauma patients with altered mental status. J Trauma. 2003;55(4):658-663.
- Parizel PM, Zijden T, Gaudino S, et al. Trauma of the spine and spinal cord: imagining strategies. Eur Spine J. 2010;19(Suppl 1):S8-S17.
- Grogan EL, Morris JA Jr, Dittus RS, et al. Cervical spine evaluation in urban trauma centers: lowering institutional costs and complications through helical CT scan. J Am Coll Surg. 2005;200(2):160-165.
Reference - Forgotten Tourniquet
- Pennsylvania Safety Advisory. Forgotten but not gone: tourniquets left on patients. PA PSRS Patient Saf Advis. 2005;2(2):19-21.
- Salman JM, Asfar SN. Recovery room incidents. Bas J Surg. 2007;24:3.
| An 83-year-old man presented to the ED via emergency medical services (EMS) with a chief complaint of neck pain. He was the restrained driver of a car that was struck from behind by another vehicle. The patient denied any head injury, loss of consciousness, chest pain, shortness of breath, or abdominal pain. His medical history was significant for hypertension and coronary artery disease, for which he was taking several medications. Regarding his social history, the patient denied alcohol consumption or cigarette smoking. |
The patient’s physical examination was unremarkable. His vital signs were normal, and there was no obvious external evidence of trauma. The posterior cervical spine was tender to palpation in the midline, but no step-off signs were appreciated. The neurological examination, including strength and sensation in all four extremities, was normal.
Since the patient’s only complaint was neck pain and his physical examination and history were otherwise normal, the emergency physician (EP) ordered radiographs of the cervical spine. The imaging studies were interpreted as showing advanced degenerative changes but no fractures, and the patient was prescribed an analgesic and discharged home.
When the patient woke up the next morning, he was unable to move his extremities, and returned to the same ED via EMS. He was placed in a cervical collar and found to have flaccid extremities on examination. A computed tomography (CT) scan of the cervical spine revealed a transverse fracture through the C6 vertebra. Radiology services also reviewed the cervical spine X-rays from the previous day, noting the presence of fracture.
The patient was taken to the operating room by neurosurgery services but remained paralyzed postoperatively. He never recovered from his injury and died 6 months later. His family sued the EP and the hospital for missed diagnosis of cervical spine fracture at the first ED presentation and the resulting paralysis. The case was settled for $1.3 million prior to trial.
Discussion
The evaluation of suspected cervical spine injury secondary to blunt trauma is a frequent and important skill practiced by EPs. Motor vehicle accidents are the most common cause of spinal cord injury in the United States (42%), followed by falls (27%), acts of violence (15%), and sports-related injuries (8%).1 A review by Sekon and Fehlings2 showed that 55% of all spinal injuries involve the cervical spine. Interestingly, the majority of cervical spine injuries occur at the upper or lower ends of the cervical spine; C2 vertebral fractures account for 33%, while C6 and C7 vertebral fractures account for approximately 50%.1
There are two commonly used criteria to clinically clear the cervical spine (ie, no imaging studies necessary) in blunt-trauma patients. The first is the National Emergency X-Radiography Use Study (NEXUS), which has a sensitivity of 99.6% of identifying cervical spine fractures.1 According to the NEXUS criteria, no imaging studies are required if: (1) there is no midline cervical spine tenderness; (2) there are no focal neurological deficits; (3) the patient exhibits a normal level of alertness; (4) the patient is not intoxicated; and (5) there is no distracting injury.1
The other set of criteria used to clear the cervical spine is the Canadian Cervical Spine Rule. In these criteria, a patient is considered at very low risk for cervical spine fracture in the following cases: (1) the patient is fully alert with a Glasgow Coma scale of 15; (2) the patient has no high-risk factors (ie, age >65 years, dangerous mechanism of injury, fall greater than five stairs, axial load to the head, high-speed vehicular crash, bicycle or motorcycle crash, or the presence of paresthesias in the extremities); (3) the patient has low-risk factors (eg, simple vehicle crash, sitting position in the ED, ambulatory at any time, delayed onset of neck pain, and the absence of midline cervical tenderness); and (4) the patient can actively rotate his or her neck 45 degrees to the left and to the right. The Canadian group found the above criteria to have 100% sensitivity for predicting the absence of cervical spine injury.1
The patient in this case failed both sets of criteria (ie, presence of cervical spine tenderness and age >65 years) and therefore required imaging. Historically, cervical spine X-ray (three views, anteroposterior, lateral, and odontoid; or five views, three views plus obliques) has been the imaging study of choice for such patients. Unfortunately, however, cervical spine radiographs have severe limitations in identifying spinal injury. In a large retrospective review, Woodring and Lee,3 found that the standard three-view cervical spine series failed to demonstrate 61% of all fractures and 36% of all subluxation and dislocations. Similarly, in a prospective study of 1,006 patients with 72 injuries, Diaz et al,4 found a 52.3% missed fracture rate when five-view radiographs were used to identify cervical spine injury. In addition, radiographic evaluation of elderly patients was found to be even more challenging in identifying cervical spine injury due to age-related degenerative changes.
Given the abovementioned limitations associated with radiographic imaging, CT scan of the cervical spine has become the imaging study of choice in moderate-to-severe risk patients with blunt cervical spine trauma. This modality has been shown to have a higher sensitivity and specificity for evaluating cervical spine injury compared to plain X-ray films, with CT detecting 97% to 100% of cervical spine fractures.5
In addition to demonstrating a higher sensitivity, CT also has the advantage of speed—especially when the patient is undergoing other CT studies (eg, head, abdomen, pelvis). While some clinicians criticize the higher cost of CT versus plain films, CT has been shown to decrease institutional costs (when settlement costs are taken into account) due to the reduction of the incidence of paralysis resulting from false-negative imaging studies.6
Forgotten Tourniquet
| A 33-year-old woman presented to the ED with a chief complaint of left-sided abdominal and flank pain. She described the onset of pain as abrupt, severe, and lasting approximately 3 hours in duration. She admitted to nausea, but no vomiting. She also denied a history of any previous similar symptoms or recent trauma. The patient’s medical history was unremarkable. Her last menstrual period began 3 days prior to presentation. Regarding social history, she denied any tobacco or alcohol use. |
The patient’s vital signs were: blood pressure, 138/82 mm Hg; heart rate, 102 beats/minute; respiratory rate, 18 breaths/minute; temperature 98.6˚F. Oxygen saturation was 99% on room air.
The patient appeared uncomfortable overall. The physical examination was remarkable only for mild left-sided costovertebral angle tenderness. Her abdomen was soft, nontender, and without guarding or rebound.
The EP ordered the placement of an intravenous (IV) line, through which the patient was administered normal saline and morphine and promethazine, respectively, for pain and nausea. A complete blood count, basic metabolic panel, urinalysis, and urine pregnancy test were ordered. All of the laboratory bloodwork results were normal, and the urine pregnancy test was negative. The urinalysis was remarkable for 50 to 100 red blood cells.
A noncontrast CT scan of the abdomen and pelvis revealed a 3-mm ureteral stone on the left side. When the patient returned from radiology services, her pain was significantly decreased and she felt much improved. She was diagnosed with a kidney stone and discharged home with an analgesic and a strainer, along with instructions to follow-up with urology services. The patient was in the ED for a total of 5 hours.
The plaintiff sued the EP and hospital, claiming that the tourniquet used to start the IV line and draw blood was never removed, which in turn caused nerve damage resulting in reflex sympathetic dystrophy and complex regional pain syndrome. The defense denied all of these allegations, and the ED personnel testified that the tourniquet was removed as soon as the IV was established. The defense cited the plaintiff’s medical records, which contained documentation that the tourniquet had been removed. The defense further argued that if the tourniquet had been left on as the patient alleged, she would have experienced obvious physical signs, such as swelling, redness, infiltration of fluids, pain, and numbness. A defense verdict was returned.
Discussion
It is very tempting to simply dismiss this case as absurd, with nothing to be learned from it. It does defy common sense that no one would have noticed the tourniquet or, at the very least, that the patient would not have spoken up about it during her stay in the ED. While the jury clearly came to the correct conclusion, it does highlight a real problem: forgotten tourniquets.
According to the Pennsylvania Patient Safety Advisory (PPSA), there were 125 reports of tourniquets being left on patients in Pennsylvania healthcare facilities in 1 year alone.1 In 5% of these cases, the tourniquet was discovered within a half hour of application. In approximately 66% of cases, the tourniquet was left on for up to 2 hours, and the remaining were left in place for 2 to 18 hours.
Few locations within the hospital are without risk for this type of accident. The PPSA further noted that approximately 30% of retained tourniquets occurred on medical/surgical units, 14% in the ED, and 14% on inpatient and ambulatory surgical services departments. Approximately 19% were discovered when patients were transferred from one department to another.1
In the analysis of these incidents, contributing factors to forgotten tourniquets included staff failing to follow proper procedures, inadequate staff proficiency, and staff distractions and/or interruptions.1 In addition, some patients appeared to be at increased risk of having a retained tourniquet than others. Sixty percent of 125 patients with a forgotten tourniquet were aged 70 years or older, whereas some patients were younger than age 2 years.1 Not surprisingly, patients who were unable to verbally communicate (eg, patients who were intubated, under anesthesia, had expressive aphasia, severe dementia), were at the highest risk.
In a review of recovery room incidents, Salman and Asfar2 identified two cases of forgotten tourniquets out of approximately 7,000 patients. Potential strategies to avoid this mistake include: (1) only documenting procedures after they have been completed (eg, tourniquet removal); (2) double-checking that the tourniquet has been removed prior to leaving patient bedside; and (3) the use of extra-long tourniquets so the ends are more clearly visible.
Reference - Missed Cervical Spine Injury
- Looby S, Flanders A. Spine trauma. Radiol Clin North Am. 2011;49(1):129-163.
- Sekon LH, Fehlings MG. Epidemiology, demographics, and pathophysiology of acute spinal cord injury. Spine (Phila Pa 1976). 2001;26(24 Suppl):S2-S12.
- Woodring JH, Lee C. Limitations of cervical radiography in the evaluation of acute cervical trauma. J Trauma. 1993;34(1):32-39.
- Diaz JJ Jr, Gillman C, Morris JA Jr, May AK, Carrillo YM, Guy J. Are five-view plain films of the cervical spine unreliable? A prospective evaluation in blunt trauma patients with altered mental status. J Trauma. 2003;55(4):658-663.
- Parizel PM, Zijden T, Gaudino S, et al. Trauma of the spine and spinal cord: imagining strategies. Eur Spine J. 2010;19(Suppl 1):S8-S17.
- Grogan EL, Morris JA Jr, Dittus RS, et al. Cervical spine evaluation in urban trauma centers: lowering institutional costs and complications through helical CT scan. J Am Coll Surg. 2005;200(2):160-165.
Reference - Forgotten Tourniquet
- Pennsylvania Safety Advisory. Forgotten but not gone: tourniquets left on patients. PA PSRS Patient Saf Advis. 2005;2(2):19-21.
- Salman JM, Asfar SN. Recovery room incidents. Bas J Surg. 2007;24:3.

Hospitalists Can Improve Healthcare Value
As the nation considers how to reduce healthcare costs, hospitalists can play a crucial role in this effort because they control many healthcare services through routine clinical decisions at the point of care. In fact, the government, payers, and the public now look to hospitalists as essential partners for reining in healthcare costs.[1, 2] The role of hospitalists is even more critical as payers, including Medicare, seek to shift reimbursements from volume to value.[1] Medicare's Value‐Based Purchasing program has already tied a percentage of hospital payments to metrics of quality, patient satisfaction, and cost,[1, 3] and Health and Human Services Secretary Sylvia Burwell announced that by the end of 2018, the goal is to have 50% of Medicare payments tied to quality or value through alternative payment models.[4]
Major opportunities for cost savings exist across the care continuum, particularly in postacute and transitional care, and hospitalist groups are leading innovative models that show promise for coordinating care and improving value.[5] Individual hospitalists are also in a unique position to provide high‐value care for their patients through advocating for appropriate care and leading local initiatives to improve value of care.[6, 7, 8] This commentary article aims to provide practicing hospitalists with a framework to incorporate these strategies into their daily work.
DESIGN STRATEGIES TO COORDINATE CARE
As delivery systems undertake the task of population health management, hospitalists will inevitably play a critical role in facilitating coordination between community, acute, and postacute care. During admission, discharge, and the hospitalization itself, standardizing care pathways for common hospital conditions such as pneumonia and cellulitis can be effective in decreasing utilization and improving clinical outcomes.[9, 10] Intermountain Healthcare in Utah has applied evidence‐based protocols to more than 60 clinical processes, re‐engineering roughly 80% of all care that they deliver.[11] These types of care redesigns and standardization promise to provide better, more efficient, and often safer care for more patients. Hospitalists can play important roles in developing and delivering on these pathways.
In addition, hospital physician discontinuity during admissions may lead to increased resource utilization, costs, and lower patient satisfaction.[12] Therefore, ensuring clear handoffs between inpatient providers, as well as with outpatient providers during transitions in care, is a vital component of delivering high‐value care. Of particular importance is the population of patients frequently readmitted to the hospital. Hospitalists are often well acquainted with these patients, and the myriad of psychosocial, economic, and environmental challenges this vulnerable population faces. Although care coordination programs are increasing in prevalence, data on their cost‐effectiveness are mixed, highlighting the need for testing innovations.[13] Certainly, hospitalists can be leaders adopting and documenting the effectiveness of spreading interventions that have been shown to be promising in improving care transitions at discharge, such as the Care Transitions Intervention, Project RED (Re‐Engineered Discharge), or the Transitional Care Model.[14, 15, 16]
The University of Chicago, through funding from the Centers for Medicare and Medicaid Innovation, is testing the use of a single physician who cares for frequently admitted patients both in and out of the hospital, thereby reducing the costs of coordination.[5] This comprehensivist model depends on physicians seeing patients in the hospital and then in a clinic located in or near the hospital for the subset of patients who stand to benefit most from this continuity. This differs from the old model of having primary care providers (PCPs) see inpatients and outpatients because the comprehensivist's patient panel is enriched with only patients who are at high risk for hospitalization, and thus these physicians have a more direct focus on hospital‐related care and higher daily hospitalized patient censuses, whereas PCPs were seeing fewer and fewer of their patients in the hospital on a daily basis. Evidence concerning the effectiveness of this model is expected by 2016. Hospitalists have also ventured out of the hospital into skilled nursing facilities, specializing in long‐term care.[17] These physicians are helping provide care to the roughly 1.6 million residents of US nursing homes.[17, 18] Preliminary evidence suggests increased physician staffing is associated with decreased hospitalization of nursing home residents.[18]
ADVOCATE FOR APPROPRIATE CARE
Hospitalists can advocate for appropriate care through avoiding low‐value services at the point of care, as well as learning and teaching about value.
Avoiding Low‐Value Services at the Point of Care
The largest contributor to the approximately $750 billion in annual healthcare waste is unnecessary services, which includes overuse, discretionary use beyond benchmarks, and unnecessary choice of higher‐cost services.[19] Drivers of overuse include medical culture, fee‐for‐service payments, patient expectations, and fear of malpractice litigation.[20] For practicing hospitalists, the most substantial motivation for overuse may be a desire to reassure patients and themselves.[21] Unfortunately, patients commonly overestimate the benefits and underestimate the potential harms of testing and treatments.[22] However, clear communication with patients can reduce overuse, underuse, and misuse.[23]
Specific targets for improving appropriate resource utilization may be identified from resources such as Choosing Wisely lists, guidelines, and appropriateness criteria. The Choosing Wisely campaign has brought together an unprecedented number of medical specialty societies to issue top five lists of things that physicians and patients should question (
| Adult Hospital Medicine Recommendations | Pediatric Hospital Medicine Recommendations |
|---|---|
| 1. Do not place, or leave in place, urinary catheters for incontinence or convenience, or monitoring of output for noncritically ill patients (acceptable indications: critical illness, obstruction, hospice, perioperatively for <2 days or urologic procedures; use weights instead to monitor diuresis). | 1. Do not order chest radiographs in children with uncomplicated asthma or bronchiolitis. |
| 2. Do not prescribe medications for stress ulcer prophylaxis to medical inpatients unless at high risk for gastrointestinal complication. | 2. Do not routinely use bronchodilators in children with bronchiolitis. |
| 3. Avoid transfusing red blood cells just because hemoglobin levels are below arbitrary thresholds such as 10, 9, or even 8 mg/dL in the absence of symptoms. | 3. Do not use systemic corticosteroids in children under 2 years of age with an uncomplicated lower respiratory tract infection. |
| 4. Avoid overuse/unnecessary use of telemetry monitoring in the hospital, particularly for patients at low risk for adverse cardiac outcomes. | 4. Do not treat gastroesophageal reflux in infants routinely with acid suppression therapy. |
| 5. Do not perform repetitive complete blood count and chemistry testing in the face of clinical and lab stability. | 5. Do not use continuous pulse oximetry routinely in children with acute respiratory illness unless they are on supplemental oxygen. |
As an example of this strategy, 1 multi‐institutional group has started training medical students to augment the traditional subjective‐objective‐assessment‐plan (SOAP) daily template with a value section (SOAP‐V), creating a cognitive forcing function to promote discussion of high‐value care delivery.[28] Physicians could include brief thoughts in this section about why they chose a specific intervention, their consideration of the potential benefits and harms compared to alternatives, how it may incorporate the patient's goals and values, and the known and potential costs of the intervention. Similarly, Flanders and Saint recommend that daily progress notes and sign‐outs include the indication, day of administration, and expected duration of therapy for all antimicrobial treatments, as a mechanism for curbing antimicrobial overuse in hospitalized patients.[29] Likewise, hospitalists can also document whether or not a patient needs routine labs, telemetry, continuous pulse oximetry, or other interventions or monitoring. It is not yet clear how effective this type of strategy will be, and drawbacks include creating longer progress notes and requiring more time for documentation. Another approach would be to work with the electronic health record to flag patients who are scheduled for telemetry or other potentially wasteful practices to inspire a daily practice audit to question whether the patient still meets criteria for such care. This approach acknowledges that patient's clinical status changes, and overcomes the inertia that results in so many therapies being continued despite a need or indication.
Communicating With Patients Who Want Everything
Some patients may be more worried about not getting every possible test, rather than concerns regarding associated costs. This may oftentimes be related to patients routinely overestimating the benefits of testing and treatments while not realizing the many potential downstream harms.[22] The perception is that patient demands frequently drive overtesting, but studies suggest the demanding patient is actually much less common than most physicians think.[30]
The Choosing Wisely campaign features video modules that provide a framework and specific examples for physician‐patient communication around some of the Choosing Wisely recommendations (available at:
Clinicians can explain why they do not believe that a test will help a patient and can share their concerns about the potential harms and downstream consequences of a given test. In addition, Consumer Reports and other groups have created trusted resources for patients that provide clear information for the public about unnecessary testing and services.
Learn and Teach Value
Traditionally, healthcare costs have largely remained hidden from both the public and medical professionals.[31, 32] As a result, hospitalists are generally not aware of the costs associated with their care.[33, 34] Although medical education has historically avoided the topic of healthcare costs,[35] recent calls to teach healthcare value have led to new educational efforts.[35, 36, 37] Future generations of medical professionals will be trained in these skills, but current hospitalists should seek opportunities to improve their knowledge of healthcare value and costs.
Fortunately, several resources can fill this gap. In addition to Choosing Wisely and ACR appropriateness criteria discussed above, newer tools focus on how to operationalize these recommendations with patients. The American College of Physicians (ACP) has launched a high‐value care educational platform that includes clinical recommendations, physician resources, curricula and public policy recommendations, and patient resources to help them understand the benefits, harms, and costs of tests and treatments for common clinical issues (
In an effort to provide frontline clinicians with the knowledge and tools necessary to address healthcare value, we have authored a textbook, Understanding Value‐Based Healthcare.[38] To identify the most promising ways of teaching these concepts, we also host the annual Teaching Value & Choosing Wisely Challenge and convene the Teaching Value in Healthcare Learning Network (bit.ly/teachingvaluenetwork) through our nonprofit, Costs of Care.[39]
In addition, hospitalists can also advocate for greater price transparency to help improve cost awareness and drive more appropriate care. The evidence on the effect of transparent costs in the electronic ordering system is evolving. Historically, efforts to provide diagnostic test prices at time of order led to mixed results,[40] but recent studies show clear benefits in resource utilization related to some form of cost display.[41, 42] This may be because physicians care more about healthcare costs and resource utilization than before. Feldman and colleagues found in a controlled clinical trial at Johns Hopkins that providing the costs of lab tests resulted in substantial decreases of certain lab tests and yielded a net cost reduction (based on 2011 Medicare Allowable Rate) of more than $400,000 at the hospital level during the 6‐month intervention period.[41] A recent systematic review concluded that charge information changed ordering and prescribing behavior in the majority of studies.[42] Some hospitalist programs are developing dashboards for various quality and utilization metrics. Sharing ratings or metrics internally or publically is a powerful way to motivate behavior change.[43]
LEAD LOCAL VALUE INITIATIVES
Hospitalists are ideal leaders of local value initiatives, whether it be through running value‐improvement projects or launching formal high‐value care programs.
Conduct Value‐Improvement Projects
Hospitalists across the country have largely taken the lead on designing value‐improvement pilots, programs, and groups within hospitals. Although value‐improvement projects may be built upon the established structures and techniques for quality improvement, importantly these programs should also include expertise in cost analyses.[8] Furthermore, some traditional quality‐improvement programs have failed to result in actual cost savings[44]; thus, it is not enough to simply rebrand quality improvement with a banner of value. Value‐improvement efforts must overcome the cultural hurdle of more care as better care, as well as pay careful attention to the diplomacy required with value improvement, because reducing costs may result in decreased revenue for certain departments or even decreases in individuals' wages.
One framework that we have used to guide value‐improvement project design is COST: culture, oversight accountability, system support, and training.[45] This approach leverages principles from implementation science to ensure that value‐improvement projects successfully provide multipronged tactics for overcoming the many barriers to high‐value care delivery. Figure 1 includes a worksheet for individual clinicians or teams to use when initially planning value‐improvement project interventions.[46] The examples in this worksheet come from a successful project at the University of California, San Francisco aimed at improving blood utilization stewardship by supporting adherence to a restrictive transfusion strategy. To address culture, a hospital‐wide campaign was led by physician peer champions to raise awareness about appropriate transfusion practices. This included posters that featured prominent local physician leaders displaying their support for the program. Oversight was provided through regular audit and feedback. Each month the number of patients on the medicine service who received transfusion with a pretransfusion hemoglobin above 8 grams per deciliter was shared at a faculty lunch meeting and shown on a graph included in the quality newsletter that was widely distributed in the hospital. The ordering system in the electronic medical record was eventually modified to include the patient's pretransfusion hemoglobin level at time of transfusion order and to provide default options and advice based on whether or not guidelines would generally recommend transfusion. Hospitalists and resident physicians were trained through multiple lectures and informal teaching settings about the rationale behind the changes and the evidence that supported a restrictive transfusion strategy.
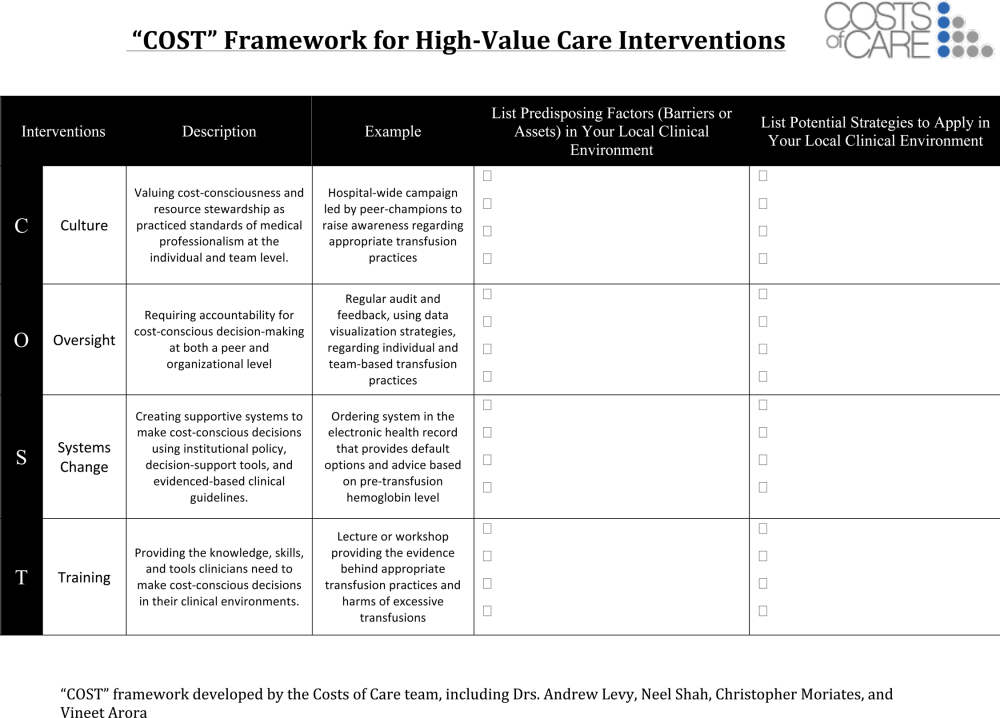
Launch High‐Value Care Programs
As value‐improvement projects grow, some institutions have created high‐value care programs and infrastructure. In March 2012, the University of California, San Francisco Division of Hospital Medicine launched a high‐value care program to promote healthcare value and clinician engagement.[8] The program was led by clinical hospitalists alongside a financial administrator, and aimed to use financial data to identify areas with clear evidence of waste, create evidence‐based interventions that would simultaneously improve quality while cutting costs, and pair interventions with cost awareness education and culture change efforts. In the first year of this program, 6 projects were launched targeting: (1) nebulizer to inhaler transitions,[47] (2) overuse of proton pump inhibitor stress ulcer prophlaxis,[48] (3) transfusions, (4) telemetry, (5) ionized calcium lab ordering, and (6) repeat inpatient echocardiograms.[8]
Similar hospitalist‐led groups have now formed across the country including the Johns Hopkins High‐Value Care Committee, Johns Hopkins Bayview Physicians for Responsible Ordering, and High‐Value Carolina. These groups are relatively new, and best practices and early lessons are still emerging, but all focus on engaging frontline clinicians in choosing targets and leading multipronged intervention efforts.
What About Financial Incentives?
Hospitalist high‐value care groups thus far have mostly focused on intrinsic motivations for decreasing waste by appealing to hospitalists' sense of professionalism and their commitment to improve patient affordability. When financial incentives are used, it is important that they are well aligned with internal motivations for clinicians to provide the best possible care to their patients. The Institute of Medicine recommends that payments are structured in a way to reward continuous learning and improvement in the provision of best care at lower cost.[19] In the Geisinger Health System in Pennsylvania, physician incentives are designed to reward teamwork and collaboration. For example, endocrinologists' goals are based on good control of glucose levels for all diabetes patients in the system, not just those they see.[49] Moreover, a collaborative approach is encouraged by bringing clinicians together across disciplinary service lines to plan, budget, and evaluate one another's performance. These efforts are partly credited with a 43% reduction in hospitalized days and $100 per member per month in savings among diabetic patients.[50]
Healthcare leaders, Drs. Tom Lee and Toby Cosgrove, have made a number of recommendations for creating incentives that lead to sustainable changes in care delivery[49]: avoid attaching large sums to any single target, watch for conflicts of interest, reward collaboration, and communicate the incentive program and goals clearly to clinicians.
In general, when appropriate extrinsic motivators align or interact synergistically with intrinsic motivation, it can promote high levels of performance and satisfaction.[51]
CONCLUSIONS
Hospitalists are now faced with a responsibility to reduce financial harm and provide high‐value care. To achieve this goal, hospitalist groups are developing innovative models for care across the continuum from hospital to home, and individual hospitalists can advocate for appropriate care and lead value‐improvement initiatives in hospitals. Through existing knowledge and new frameworks and tools that specifically address value, hospitalists can champion value at the bedside and ensure their patients get the best possible care at lower costs.
Disclosures: Drs. Moriates, Shah, and Arora have received grant funding from the ABIM Foundation, and royalties from McGraw‐Hill for the textbook Understanding Value‐Based Healthcare. The authors report no conflicts of interest.
- , . Value‐based purchasing—national programs to move from volume to value. N Engl J Med. 2012;367(4):292–295.
- . Value‐driven health care: implications for hospitals and hospitalists. J Hosp Med. 2009;4(8):507–511.
- , . Hospital value‐based purchasing. J Hosp Med. 2013;8(5):271–277.
- . Setting value‐based payment goals—HHS efforts to improve U.S. health care. N Engl J Med. 2015;372(10):897–899.
- , . Redesigning care for patients at increased hospitalization risk: the Comprehensive Care Physician model. Health Aff Proj Hope. 2014;33(5):770–777.
- , , , et al. Choosing wisely in adult hospital medicine: five opportunities for improved healthcare value. J Hosp Med. 2013;8(9):486–492.
- , , . First, do no (financial) harm. JAMA. 2013;310(6):577–578.
- , , , . Development of a hospital‐based program focused on improving healthcare value. J Hosp Med. 2014;9(10):671–677.
- , , , et al. A controlled trial of a critical pathway for treatment of community‐acquired pneumonia. JAMA. 2000;283(6):749–755.
- , , , , . Evidence‐based care pathway for cellulitis improves process, clinical, and cost outcomes [published online July 28, 2015]. J Hosp Med. doi:10.1002/jhm.2433.
- . The Lean approach to health care: safety, quality, and cost. Institute of Medicine. Available at: http://nam.edu/perspectives‐2012‐the‐lean‐approach‐to‐health‐care‐safety‐quality‐and‐cost/. Accessed September 22, 2015.
- , , , et al. The impact of hospitalist discontinuity on hospital cost, readmissions, and patient satisfaction. J Gen Intern Med. 2014;29(7):1004–1008.
- Congressional Budget Office. Lessons from Medicare's Demonstration Projects on Disease Management, Care Coordination, and Value‐Based Payment. Available at: https://www.cbo.gov/publication/42860. Accessed April 26, 2015.
- , , , et al. A reengineered hospital discharge program to decrease rehospitalization: a randomized trial. Ann Intern Med. 2009;150(3):178–187.
- , , , . The care transitions intervention: results of a randomized controlled trial. Arch Intern Med. 2006;166(17):1822–1828.
- , , , et al. Comprehensive discharge planning and home follow‐up of hospitalized elders: a randomized clinical trial. JAMA. 1999;281(7):613–620.
- . “SNFists” at work: nursing home docs patterned after hospitalists. Mod Healthc. 2012;42(13):32–33.
- , , , . Nursing home physician specialists: a response to the workforce crisis in long‐term care. Ann Intern Med. 2009;150(6):411–413.
- Institute of Medicine. Best Care at Lower Cost: The Path to Continuously Learning Health Care in America. Washington, DC: National Academies Press; 2012.
- , . The perfect storm of overutilization. JAMA. 2008;299(23):2789–2791.
- , , , et al. Overuse of testing in preoperative evaluation and syncope: a survey of hospitalists. Ann Intern Med. 2015;162(2):100–108.
- , . Patients' expectations of the benefits and harms of treatments, screening, and tests: a systematic review. JAMA Intern Med. 2015;175(2):274–286.
- , , , et al. Enhancing the Use and Quality of Colorectal Cancer Screening. Rockville, MD: Agency for Healthcare Research and Quality; 2010. Available at: http://www.ncbi.nlm.nih.gov/books/NBK44526. Accessed September 30, 2013.
- , , , et al. Choosing wisely in pediatric hospital medicine: five opportunities for improved healthcare value. J Hosp Med. 2013;8(9):479–485.
- . Teaching Choosing Wisely in medical education and training: the story of a pioneer. The Medical Professionalism Blog. Available at: http://blog.abimfoundation.org/teaching‐choosing‐wisely‐in‐meded. Accessed March 29, 2014.
- American College of Radiology. ACR appropriateness criteria overview. November 2013. Available at: http://www.acr.org/∼/media/ACR/Documents/AppCriteria/Overview.pdf. Accessed March 4, 2014.
- American College of Cardiology Foundation. Appropriate use criteria: what you need to know. Available at: http://www.cardiosource.org/∼/media/Files/Science%20and%20Quality/Quality%20Programs/FOCUS/E1302_AUC_Primer_Update.ashx. Accessed March 4, 2014.
- , , , , . SOAP‐V: applying high‐value care during patient care. The Medical Professionalism Blog. Available at: http://blog.abimfoundation.org/soap‐v‐applying‐high‐value‐care‐during‐patient‐care. Accessed April 3, 2015.
- , . Why does antimicrobial overuse in hospitalized patients persist? JAMA Intern Med. 2014;174(5):661–662.
- . The myth of the demanding patient. JAMA Oncol. 2015;1(1):18–19.
- . The disruptive innovation of price transparency in health care. JAMA. 2013;310(18):1927–1928.
- United States Government Accountability Office. Health Care Price Transparency—Meaningful Price Information Is Difficult for Consumers to Obtain Prior to Receiving Care. Washington, DC: United States Government Accountability Office; 2011:43.
- , , . General pediatric attending physicians' and residents' knowledge of inpatient hospital finances. Pediatrics. 2013;131(6):1072–1080.
- , , . Hospitalists' awareness of patient charges associated with inpatient care. J Hosp Med. 2010;5(5):295–297.
- . Cost consciousness in patient care—what is medical education's responsibility? N Engl J Med. 2010;362(14):1253–1255.
- . Providing high‐value, cost‐conscious care: a critical seventh general competency for physicians. Ann Intern Med. 2011;155(6):386–388.
- , , , . Defining competencies for education in health care value: recommendations from the University of California, San Francisco Center for Healthcare Value Training Initiative. Acad Med. 2015;90(4):421–424.
- , , . Understanding Value‐Based Healthcare. New York: McGraw‐Hill; 2015.
- , , , . Wisdom of the crowd: bright ideas and innovations from the teaching value and choosing wisely challenge. Acad Med. 2015;90(5):624–628.
- , , , et al. Does the computerized display of charges affect inpatient ancillary test utilization? Arch Intern Med. 1997;157(21):2501–2508.
- , , , et al. Impact of providing fee data on laboratory test ordering: a controlled clinical trial. JAMA Intern Med. 2013;173(10):903–908.
- , , , . The effect of charge display on cost of care and physician practice behaviors: a systematic review. J Gen Intern Med. 2015;30(6):835–842.
- , , , , , . Closing the Quality Gap: Revisiting the State of the Science. Vol. 5. Public Reporting as a Quality Improvement Strategy. Rockville, MD: Agency for Healthcare Research and Quality; 2012.
- , , , . The savings illusion—why clinical quality improvement fails to deliver bottom‐line results. N Engl J Med. 2011;365(26):e48.
- , , , . Fostering value in clinical practice among future physicians: time to consider COST. Acad Med. 2014;89(11):1440.
- , , , , , . The Teaching Value Workshop. MedEdPORTAL Publications; 2014. Available at: https://www.mededportal.org/publication/9859. Accessed September 22, 2015.
- , , , , . “Nebs no more after 24”: a pilot program to improve the use of appropriate respiratory therapies. JAMA Intern Med. 2013;173(17):1647–1648.
- , , , et al. The development and implementation of a bundled quality improvement initiative to reduce inappropriate stress ulcer prophylaxis. ICU Dir. 2013;4(6):322–325.
- , . Engaging doctors in the health care revolution. Harvard Business Review. June 2014. Available at: http://hbr.org/2014/06/engaging‐doctors‐in‐the‐health‐care‐revolution/ar/1. Accessed July 30, 2014.
- , , . Geisinger Health System: achieving the potential of system integration through innovation, leadership, measurement, and incentives. June 2009. Available at: http://www.commonwealthfund.org/publications/case‐studies/2009/jun/geisinger‐health‐system‐achieving‐the‐potential‐of‐system‐integration. Accessed September 22, 2015.
- Motivational synergy: toward new conceptualizations of intrinsic and extrinsic motivation in the workplace. Hum Resource Manag 1993;3(3):185–201. Available at: http://www.hbs.edu/faculty/Pages/item.aspx?num=2500. Accessed July 31, 2014.
As the nation considers how to reduce healthcare costs, hospitalists can play a crucial role in this effort because they control many healthcare services through routine clinical decisions at the point of care. In fact, the government, payers, and the public now look to hospitalists as essential partners for reining in healthcare costs.[1, 2] The role of hospitalists is even more critical as payers, including Medicare, seek to shift reimbursements from volume to value.[1] Medicare's Value‐Based Purchasing program has already tied a percentage of hospital payments to metrics of quality, patient satisfaction, and cost,[1, 3] and Health and Human Services Secretary Sylvia Burwell announced that by the end of 2018, the goal is to have 50% of Medicare payments tied to quality or value through alternative payment models.[4]
Major opportunities for cost savings exist across the care continuum, particularly in postacute and transitional care, and hospitalist groups are leading innovative models that show promise for coordinating care and improving value.[5] Individual hospitalists are also in a unique position to provide high‐value care for their patients through advocating for appropriate care and leading local initiatives to improve value of care.[6, 7, 8] This commentary article aims to provide practicing hospitalists with a framework to incorporate these strategies into their daily work.
DESIGN STRATEGIES TO COORDINATE CARE
As delivery systems undertake the task of population health management, hospitalists will inevitably play a critical role in facilitating coordination between community, acute, and postacute care. During admission, discharge, and the hospitalization itself, standardizing care pathways for common hospital conditions such as pneumonia and cellulitis can be effective in decreasing utilization and improving clinical outcomes.[9, 10] Intermountain Healthcare in Utah has applied evidence‐based protocols to more than 60 clinical processes, re‐engineering roughly 80% of all care that they deliver.[11] These types of care redesigns and standardization promise to provide better, more efficient, and often safer care for more patients. Hospitalists can play important roles in developing and delivering on these pathways.
In addition, hospital physician discontinuity during admissions may lead to increased resource utilization, costs, and lower patient satisfaction.[12] Therefore, ensuring clear handoffs between inpatient providers, as well as with outpatient providers during transitions in care, is a vital component of delivering high‐value care. Of particular importance is the population of patients frequently readmitted to the hospital. Hospitalists are often well acquainted with these patients, and the myriad of psychosocial, economic, and environmental challenges this vulnerable population faces. Although care coordination programs are increasing in prevalence, data on their cost‐effectiveness are mixed, highlighting the need for testing innovations.[13] Certainly, hospitalists can be leaders adopting and documenting the effectiveness of spreading interventions that have been shown to be promising in improving care transitions at discharge, such as the Care Transitions Intervention, Project RED (Re‐Engineered Discharge), or the Transitional Care Model.[14, 15, 16]
The University of Chicago, through funding from the Centers for Medicare and Medicaid Innovation, is testing the use of a single physician who cares for frequently admitted patients both in and out of the hospital, thereby reducing the costs of coordination.[5] This comprehensivist model depends on physicians seeing patients in the hospital and then in a clinic located in or near the hospital for the subset of patients who stand to benefit most from this continuity. This differs from the old model of having primary care providers (PCPs) see inpatients and outpatients because the comprehensivist's patient panel is enriched with only patients who are at high risk for hospitalization, and thus these physicians have a more direct focus on hospital‐related care and higher daily hospitalized patient censuses, whereas PCPs were seeing fewer and fewer of their patients in the hospital on a daily basis. Evidence concerning the effectiveness of this model is expected by 2016. Hospitalists have also ventured out of the hospital into skilled nursing facilities, specializing in long‐term care.[17] These physicians are helping provide care to the roughly 1.6 million residents of US nursing homes.[17, 18] Preliminary evidence suggests increased physician staffing is associated with decreased hospitalization of nursing home residents.[18]
ADVOCATE FOR APPROPRIATE CARE
Hospitalists can advocate for appropriate care through avoiding low‐value services at the point of care, as well as learning and teaching about value.
Avoiding Low‐Value Services at the Point of Care
The largest contributor to the approximately $750 billion in annual healthcare waste is unnecessary services, which includes overuse, discretionary use beyond benchmarks, and unnecessary choice of higher‐cost services.[19] Drivers of overuse include medical culture, fee‐for‐service payments, patient expectations, and fear of malpractice litigation.[20] For practicing hospitalists, the most substantial motivation for overuse may be a desire to reassure patients and themselves.[21] Unfortunately, patients commonly overestimate the benefits and underestimate the potential harms of testing and treatments.[22] However, clear communication with patients can reduce overuse, underuse, and misuse.[23]
Specific targets for improving appropriate resource utilization may be identified from resources such as Choosing Wisely lists, guidelines, and appropriateness criteria. The Choosing Wisely campaign has brought together an unprecedented number of medical specialty societies to issue top five lists of things that physicians and patients should question (
| Adult Hospital Medicine Recommendations | Pediatric Hospital Medicine Recommendations |
|---|---|
| 1. Do not place, or leave in place, urinary catheters for incontinence or convenience, or monitoring of output for noncritically ill patients (acceptable indications: critical illness, obstruction, hospice, perioperatively for <2 days or urologic procedures; use weights instead to monitor diuresis). | 1. Do not order chest radiographs in children with uncomplicated asthma or bronchiolitis. |
| 2. Do not prescribe medications for stress ulcer prophylaxis to medical inpatients unless at high risk for gastrointestinal complication. | 2. Do not routinely use bronchodilators in children with bronchiolitis. |
| 3. Avoid transfusing red blood cells just because hemoglobin levels are below arbitrary thresholds such as 10, 9, or even 8 mg/dL in the absence of symptoms. | 3. Do not use systemic corticosteroids in children under 2 years of age with an uncomplicated lower respiratory tract infection. |
| 4. Avoid overuse/unnecessary use of telemetry monitoring in the hospital, particularly for patients at low risk for adverse cardiac outcomes. | 4. Do not treat gastroesophageal reflux in infants routinely with acid suppression therapy. |
| 5. Do not perform repetitive complete blood count and chemistry testing in the face of clinical and lab stability. | 5. Do not use continuous pulse oximetry routinely in children with acute respiratory illness unless they are on supplemental oxygen. |
As an example of this strategy, 1 multi‐institutional group has started training medical students to augment the traditional subjective‐objective‐assessment‐plan (SOAP) daily template with a value section (SOAP‐V), creating a cognitive forcing function to promote discussion of high‐value care delivery.[28] Physicians could include brief thoughts in this section about why they chose a specific intervention, their consideration of the potential benefits and harms compared to alternatives, how it may incorporate the patient's goals and values, and the known and potential costs of the intervention. Similarly, Flanders and Saint recommend that daily progress notes and sign‐outs include the indication, day of administration, and expected duration of therapy for all antimicrobial treatments, as a mechanism for curbing antimicrobial overuse in hospitalized patients.[29] Likewise, hospitalists can also document whether or not a patient needs routine labs, telemetry, continuous pulse oximetry, or other interventions or monitoring. It is not yet clear how effective this type of strategy will be, and drawbacks include creating longer progress notes and requiring more time for documentation. Another approach would be to work with the electronic health record to flag patients who are scheduled for telemetry or other potentially wasteful practices to inspire a daily practice audit to question whether the patient still meets criteria for such care. This approach acknowledges that patient's clinical status changes, and overcomes the inertia that results in so many therapies being continued despite a need or indication.
Communicating With Patients Who Want Everything
Some patients may be more worried about not getting every possible test, rather than concerns regarding associated costs. This may oftentimes be related to patients routinely overestimating the benefits of testing and treatments while not realizing the many potential downstream harms.[22] The perception is that patient demands frequently drive overtesting, but studies suggest the demanding patient is actually much less common than most physicians think.[30]
The Choosing Wisely campaign features video modules that provide a framework and specific examples for physician‐patient communication around some of the Choosing Wisely recommendations (available at:
Clinicians can explain why they do not believe that a test will help a patient and can share their concerns about the potential harms and downstream consequences of a given test. In addition, Consumer Reports and other groups have created trusted resources for patients that provide clear information for the public about unnecessary testing and services.
Learn and Teach Value
Traditionally, healthcare costs have largely remained hidden from both the public and medical professionals.[31, 32] As a result, hospitalists are generally not aware of the costs associated with their care.[33, 34] Although medical education has historically avoided the topic of healthcare costs,[35] recent calls to teach healthcare value have led to new educational efforts.[35, 36, 37] Future generations of medical professionals will be trained in these skills, but current hospitalists should seek opportunities to improve their knowledge of healthcare value and costs.
Fortunately, several resources can fill this gap. In addition to Choosing Wisely and ACR appropriateness criteria discussed above, newer tools focus on how to operationalize these recommendations with patients. The American College of Physicians (ACP) has launched a high‐value care educational platform that includes clinical recommendations, physician resources, curricula and public policy recommendations, and patient resources to help them understand the benefits, harms, and costs of tests and treatments for common clinical issues (
In an effort to provide frontline clinicians with the knowledge and tools necessary to address healthcare value, we have authored a textbook, Understanding Value‐Based Healthcare.[38] To identify the most promising ways of teaching these concepts, we also host the annual Teaching Value & Choosing Wisely Challenge and convene the Teaching Value in Healthcare Learning Network (bit.ly/teachingvaluenetwork) through our nonprofit, Costs of Care.[39]
In addition, hospitalists can also advocate for greater price transparency to help improve cost awareness and drive more appropriate care. The evidence on the effect of transparent costs in the electronic ordering system is evolving. Historically, efforts to provide diagnostic test prices at time of order led to mixed results,[40] but recent studies show clear benefits in resource utilization related to some form of cost display.[41, 42] This may be because physicians care more about healthcare costs and resource utilization than before. Feldman and colleagues found in a controlled clinical trial at Johns Hopkins that providing the costs of lab tests resulted in substantial decreases of certain lab tests and yielded a net cost reduction (based on 2011 Medicare Allowable Rate) of more than $400,000 at the hospital level during the 6‐month intervention period.[41] A recent systematic review concluded that charge information changed ordering and prescribing behavior in the majority of studies.[42] Some hospitalist programs are developing dashboards for various quality and utilization metrics. Sharing ratings or metrics internally or publically is a powerful way to motivate behavior change.[43]
LEAD LOCAL VALUE INITIATIVES
Hospitalists are ideal leaders of local value initiatives, whether it be through running value‐improvement projects or launching formal high‐value care programs.
Conduct Value‐Improvement Projects
Hospitalists across the country have largely taken the lead on designing value‐improvement pilots, programs, and groups within hospitals. Although value‐improvement projects may be built upon the established structures and techniques for quality improvement, importantly these programs should also include expertise in cost analyses.[8] Furthermore, some traditional quality‐improvement programs have failed to result in actual cost savings[44]; thus, it is not enough to simply rebrand quality improvement with a banner of value. Value‐improvement efforts must overcome the cultural hurdle of more care as better care, as well as pay careful attention to the diplomacy required with value improvement, because reducing costs may result in decreased revenue for certain departments or even decreases in individuals' wages.
One framework that we have used to guide value‐improvement project design is COST: culture, oversight accountability, system support, and training.[45] This approach leverages principles from implementation science to ensure that value‐improvement projects successfully provide multipronged tactics for overcoming the many barriers to high‐value care delivery. Figure 1 includes a worksheet for individual clinicians or teams to use when initially planning value‐improvement project interventions.[46] The examples in this worksheet come from a successful project at the University of California, San Francisco aimed at improving blood utilization stewardship by supporting adherence to a restrictive transfusion strategy. To address culture, a hospital‐wide campaign was led by physician peer champions to raise awareness about appropriate transfusion practices. This included posters that featured prominent local physician leaders displaying their support for the program. Oversight was provided through regular audit and feedback. Each month the number of patients on the medicine service who received transfusion with a pretransfusion hemoglobin above 8 grams per deciliter was shared at a faculty lunch meeting and shown on a graph included in the quality newsletter that was widely distributed in the hospital. The ordering system in the electronic medical record was eventually modified to include the patient's pretransfusion hemoglobin level at time of transfusion order and to provide default options and advice based on whether or not guidelines would generally recommend transfusion. Hospitalists and resident physicians were trained through multiple lectures and informal teaching settings about the rationale behind the changes and the evidence that supported a restrictive transfusion strategy.
Launch High‐Value Care Programs
As value‐improvement projects grow, some institutions have created high‐value care programs and infrastructure. In March 2012, the University of California, San Francisco Division of Hospital Medicine launched a high‐value care program to promote healthcare value and clinician engagement.[8] The program was led by clinical hospitalists alongside a financial administrator, and aimed to use financial data to identify areas with clear evidence of waste, create evidence‐based interventions that would simultaneously improve quality while cutting costs, and pair interventions with cost awareness education and culture change efforts. In the first year of this program, 6 projects were launched targeting: (1) nebulizer to inhaler transitions,[47] (2) overuse of proton pump inhibitor stress ulcer prophlaxis,[48] (3) transfusions, (4) telemetry, (5) ionized calcium lab ordering, and (6) repeat inpatient echocardiograms.[8]
Similar hospitalist‐led groups have now formed across the country including the Johns Hopkins High‐Value Care Committee, Johns Hopkins Bayview Physicians for Responsible Ordering, and High‐Value Carolina. These groups are relatively new, and best practices and early lessons are still emerging, but all focus on engaging frontline clinicians in choosing targets and leading multipronged intervention efforts.
What About Financial Incentives?
Hospitalist high‐value care groups thus far have mostly focused on intrinsic motivations for decreasing waste by appealing to hospitalists' sense of professionalism and their commitment to improve patient affordability. When financial incentives are used, it is important that they are well aligned with internal motivations for clinicians to provide the best possible care to their patients. The Institute of Medicine recommends that payments are structured in a way to reward continuous learning and improvement in the provision of best care at lower cost.[19] In the Geisinger Health System in Pennsylvania, physician incentives are designed to reward teamwork and collaboration. For example, endocrinologists' goals are based on good control of glucose levels for all diabetes patients in the system, not just those they see.[49] Moreover, a collaborative approach is encouraged by bringing clinicians together across disciplinary service lines to plan, budget, and evaluate one another's performance. These efforts are partly credited with a 43% reduction in hospitalized days and $100 per member per month in savings among diabetic patients.[50]
Healthcare leaders, Drs. Tom Lee and Toby Cosgrove, have made a number of recommendations for creating incentives that lead to sustainable changes in care delivery[49]: avoid attaching large sums to any single target, watch for conflicts of interest, reward collaboration, and communicate the incentive program and goals clearly to clinicians.
In general, when appropriate extrinsic motivators align or interact synergistically with intrinsic motivation, it can promote high levels of performance and satisfaction.[51]
CONCLUSIONS
Hospitalists are now faced with a responsibility to reduce financial harm and provide high‐value care. To achieve this goal, hospitalist groups are developing innovative models for care across the continuum from hospital to home, and individual hospitalists can advocate for appropriate care and lead value‐improvement initiatives in hospitals. Through existing knowledge and new frameworks and tools that specifically address value, hospitalists can champion value at the bedside and ensure their patients get the best possible care at lower costs.
Disclosures: Drs. Moriates, Shah, and Arora have received grant funding from the ABIM Foundation, and royalties from McGraw‐Hill for the textbook Understanding Value‐Based Healthcare. The authors report no conflicts of interest.
- , . Value‐based purchasing—national programs to move from volume to value. N Engl J Med. 2012;367(4):292–295.
- . Value‐driven health care: implications for hospitals and hospitalists. J Hosp Med. 2009;4(8):507–511.
- , . Hospital value‐based purchasing. J Hosp Med. 2013;8(5):271–277.
- . Setting value‐based payment goals—HHS efforts to improve U.S. health care. N Engl J Med. 2015;372(10):897–899.
- , . Redesigning care for patients at increased hospitalization risk: the Comprehensive Care Physician model. Health Aff Proj Hope. 2014;33(5):770–777.
- , , , et al. Choosing wisely in adult hospital medicine: five opportunities for improved healthcare value. J Hosp Med. 2013;8(9):486–492.
- , , . First, do no (financial) harm. JAMA. 2013;310(6):577–578.
- , , , . Development of a hospital‐based program focused on improving healthcare value. J Hosp Med. 2014;9(10):671–677.
- , , , et al. A controlled trial of a critical pathway for treatment of community‐acquired pneumonia. JAMA. 2000;283(6):749–755.
- , , , , . Evidence‐based care pathway for cellulitis improves process, clinical, and cost outcomes [published online July 28, 2015]. J Hosp Med. doi:10.1002/jhm.2433.
- . The Lean approach to health care: safety, quality, and cost. Institute of Medicine. Available at: http://nam.edu/perspectives‐2012‐the‐lean‐approach‐to‐health‐care‐safety‐quality‐and‐cost/. Accessed September 22, 2015.
- , , , et al. The impact of hospitalist discontinuity on hospital cost, readmissions, and patient satisfaction. J Gen Intern Med. 2014;29(7):1004–1008.
- Congressional Budget Office. Lessons from Medicare's Demonstration Projects on Disease Management, Care Coordination, and Value‐Based Payment. Available at: https://www.cbo.gov/publication/42860. Accessed April 26, 2015.
- , , , et al. A reengineered hospital discharge program to decrease rehospitalization: a randomized trial. Ann Intern Med. 2009;150(3):178–187.
- , , , . The care transitions intervention: results of a randomized controlled trial. Arch Intern Med. 2006;166(17):1822–1828.
- , , , et al. Comprehensive discharge planning and home follow‐up of hospitalized elders: a randomized clinical trial. JAMA. 1999;281(7):613–620.
- . “SNFists” at work: nursing home docs patterned after hospitalists. Mod Healthc. 2012;42(13):32–33.
- , , , . Nursing home physician specialists: a response to the workforce crisis in long‐term care. Ann Intern Med. 2009;150(6):411–413.
- Institute of Medicine. Best Care at Lower Cost: The Path to Continuously Learning Health Care in America. Washington, DC: National Academies Press; 2012.
- , . The perfect storm of overutilization. JAMA. 2008;299(23):2789–2791.
- , , , et al. Overuse of testing in preoperative evaluation and syncope: a survey of hospitalists. Ann Intern Med. 2015;162(2):100–108.
- , . Patients' expectations of the benefits and harms of treatments, screening, and tests: a systematic review. JAMA Intern Med. 2015;175(2):274–286.
- , , , et al. Enhancing the Use and Quality of Colorectal Cancer Screening. Rockville, MD: Agency for Healthcare Research and Quality; 2010. Available at: http://www.ncbi.nlm.nih.gov/books/NBK44526. Accessed September 30, 2013.
- , , , et al. Choosing wisely in pediatric hospital medicine: five opportunities for improved healthcare value. J Hosp Med. 2013;8(9):479–485.
- . Teaching Choosing Wisely in medical education and training: the story of a pioneer. The Medical Professionalism Blog. Available at: http://blog.abimfoundation.org/teaching‐choosing‐wisely‐in‐meded. Accessed March 29, 2014.
- American College of Radiology. ACR appropriateness criteria overview. November 2013. Available at: http://www.acr.org/∼/media/ACR/Documents/AppCriteria/Overview.pdf. Accessed March 4, 2014.
- American College of Cardiology Foundation. Appropriate use criteria: what you need to know. Available at: http://www.cardiosource.org/∼/media/Files/Science%20and%20Quality/Quality%20Programs/FOCUS/E1302_AUC_Primer_Update.ashx. Accessed March 4, 2014.
- , , , , . SOAP‐V: applying high‐value care during patient care. The Medical Professionalism Blog. Available at: http://blog.abimfoundation.org/soap‐v‐applying‐high‐value‐care‐during‐patient‐care. Accessed April 3, 2015.
- , . Why does antimicrobial overuse in hospitalized patients persist? JAMA Intern Med. 2014;174(5):661–662.
- . The myth of the demanding patient. JAMA Oncol. 2015;1(1):18–19.
- . The disruptive innovation of price transparency in health care. JAMA. 2013;310(18):1927–1928.
- United States Government Accountability Office. Health Care Price Transparency—Meaningful Price Information Is Difficult for Consumers to Obtain Prior to Receiving Care. Washington, DC: United States Government Accountability Office; 2011:43.
- , , . General pediatric attending physicians' and residents' knowledge of inpatient hospital finances. Pediatrics. 2013;131(6):1072–1080.
- , , . Hospitalists' awareness of patient charges associated with inpatient care. J Hosp Med. 2010;5(5):295–297.
- . Cost consciousness in patient care—what is medical education's responsibility? N Engl J Med. 2010;362(14):1253–1255.
- . Providing high‐value, cost‐conscious care: a critical seventh general competency for physicians. Ann Intern Med. 2011;155(6):386–388.
- , , , . Defining competencies for education in health care value: recommendations from the University of California, San Francisco Center for Healthcare Value Training Initiative. Acad Med. 2015;90(4):421–424.
- , , . Understanding Value‐Based Healthcare. New York: McGraw‐Hill; 2015.
- , , , . Wisdom of the crowd: bright ideas and innovations from the teaching value and choosing wisely challenge. Acad Med. 2015;90(5):624–628.
- , , , et al. Does the computerized display of charges affect inpatient ancillary test utilization? Arch Intern Med. 1997;157(21):2501–2508.
- , , , et al. Impact of providing fee data on laboratory test ordering: a controlled clinical trial. JAMA Intern Med. 2013;173(10):903–908.
- , , , . The effect of charge display on cost of care and physician practice behaviors: a systematic review. J Gen Intern Med. 2015;30(6):835–842.
- , , , , , . Closing the Quality Gap: Revisiting the State of the Science. Vol. 5. Public Reporting as a Quality Improvement Strategy. Rockville, MD: Agency for Healthcare Research and Quality; 2012.
- , , , . The savings illusion—why clinical quality improvement fails to deliver bottom‐line results. N Engl J Med. 2011;365(26):e48.
- , , , . Fostering value in clinical practice among future physicians: time to consider COST. Acad Med. 2014;89(11):1440.
- , , , , , . The Teaching Value Workshop. MedEdPORTAL Publications; 2014. Available at: https://www.mededportal.org/publication/9859. Accessed September 22, 2015.
- , , , , . “Nebs no more after 24”: a pilot program to improve the use of appropriate respiratory therapies. JAMA Intern Med. 2013;173(17):1647–1648.
- , , , et al. The development and implementation of a bundled quality improvement initiative to reduce inappropriate stress ulcer prophylaxis. ICU Dir. 2013;4(6):322–325.
- , . Engaging doctors in the health care revolution. Harvard Business Review. June 2014. Available at: http://hbr.org/2014/06/engaging‐doctors‐in‐the‐health‐care‐revolution/ar/1. Accessed July 30, 2014.
- , , . Geisinger Health System: achieving the potential of system integration through innovation, leadership, measurement, and incentives. June 2009. Available at: http://www.commonwealthfund.org/publications/case‐studies/2009/jun/geisinger‐health‐system‐achieving‐the‐potential‐of‐system‐integration. Accessed September 22, 2015.
- Motivational synergy: toward new conceptualizations of intrinsic and extrinsic motivation in the workplace. Hum Resource Manag 1993;3(3):185–201. Available at: http://www.hbs.edu/faculty/Pages/item.aspx?num=2500. Accessed July 31, 2014.
© 2015 Society of Hospital Medicine
