User login
Study lays groundwork for autologous nerve cell transplantation in Hirschsprung disease
Neural progenitor cells from the proximal colons of patients with Hirschsprung disease divided and formed neurons and glia in their own distal aganglionic colon tissue, according to a study published in the January issue of Cellular and Molecular Gastroenterology and Hepatology.
The approach could lead to “a promising therapeutic strategy” for Hirschsprung disease, because autologous transplantation of nerve progenitor cells would prevent immune rejection, said Dr. Benjamin Rollo of Murdoch Children’s Research Institute in Victoria, Australia, and his associates. But they cautioned against reading too much into their findings, “as there are distributional hurdles to surmount” before cell therapy can be used alone or in combination with surgery.
Hirschsprung disease is a congenital disorder in which embryonic neural crest cells fail to form the distal part of the enteric nervous system. The resulting lack of bowel motility leads to severe constipation and potentially fatal megacolon. Treatment involves surgically resecting the aganglionic distal bowel and anastomosing the normal proximal bowel to the anorectum, but this approach itself can cause constipation as well as fecal soiling, the investigators noted (Cell Molec Gastroenterol Hepatol. 2015 Oct. 22 [doi: 10.1016/j.jcmgh.2015.09.007]).
For the study, they harvested tissue from the proximal (neuronal) and distal (aneuronal) margins of resection of the colons of 31 infants and children with Hirschsprung disease. They cultured cells from the myenteric plexus of the proximal colon, and separated out nerve cells by using flow cytometry for the p75 neural crest marker. To test whether these nerve cells could colonize aganglionic colon, they co-cultured them with aneural avian embryo gut and with patients’ own aneuronal colon muscle. In addition, they co-cultured embryonic mouse enteric nernous system cells with human aneuronal colon muscle. They used quantitative reverse transcriptase PCR and several other standard laboratory techniques to detect cellular markers and mitosis.
Ganglia from the patients’ proximal colons expressed the neural crest markers p75, SOX10, and HNK1, as well as several neuronal, neurite, and glial markers, the researchers reported. The proximal colon specimens also contained ENS progenitor cells, which were SOX10-positive but lacked neuronal or glial markers. The progenitor cells comprised less than 5% of all cells from the proximal colon, but proliferated fourfold more after supplementation with CHIR-99021, a selective inhibitor of glycogen synthase kinase 3. They successfully colonized avian aneural embryonic gut and autologous postnatal aneuronal colon tissue, and the latter also was colonized successfully by mouse enteric neural crest cells.
The study “fulfilled three key requirements” for transplantation – harvesting enteric nervous system cells from the proximal colons of patients with Hirschsprung disease; confirming that postnatal aneuronal colon tissue could support an enteric nervous system; and showing that enteric nervous system–derived cells could colonize both embryonic gut and autologous postnatal colon tissue, said the researchers. More work is needed to sufficiently expand embryonic neural crest stem or progenitor cells and transplant them over a large area of colon, although supplementation with growth factors and use of elastic polymer substrates might help, they added.
The National Health and Medical Research Council, Murdoch Children’s Research Institute, Graham Burke and Yvonne Spencer, the Federation of Chinese Associations, Fonds du Service de chirurgie pédiatrique et de Perfectionnement du CHUV, Fondation SICPA, and Société Académique Vaudoise funded the study. The researchers disclosed no conflicts of interest.
Hirschsprung disease results from a failure of complete neural crest cell migration into the distal colon. Current therapy relies on surgical resection of the aganglionic distal colon. However, for many children, particularly those with large aganglionic segments, surgery often fails to completely normalize function.
One therapeutic approach might be to transplant new enteric neural cells into the aganglionic colon. This has been partially accomplished in rodent and avian models. However, it is not known if human smooth muscle can be colonized or if human postnatal enteric nervous system cells are capable of migration, expansion, and differentiation.
Rollo et al. show that human postnatal enteric nervous system cells isolated from the proximal, i.e., ganglionic, margin of Hirschsprung disease resection specimens can migrate and spread to colonize aganglionic smooth muscle from the distal margin of the same specimen. Remarkably, the transplanted cells differentiated into neurons and glia and formed normal-appearing neural structures.
Many questions remain. If neural cells isolated from the proximal margin can migrate ex vivo, why didn’t they migrate during in utero development? Do the transplanted cells restore normal motility, which requires a complex series of events that must be precisely orchestrated?
Nevertheless, the demonstration that human postnatal neural cells can be isolated from surgical specimens and used to colonize aganglionic smooth muscle suggests that it may be possible to conserve and restore motility and, potentially, to successfully treat Hirschprung disease patients without the need for surgery.
Marion France, Ph.D., is a postdoctoral research fellow at Brigham and Women’s Hospital and Harvard Medical School, Boston. She has no conflicts of interest.
Neural progenitor cells from the proximal colons of patients with Hirschsprung disease divided and formed neurons and glia in their own distal aganglionic colon tissue, according to a study published in the January issue of Cellular and Molecular Gastroenterology and Hepatology.
The approach could lead to “a promising therapeutic strategy” for Hirschsprung disease, because autologous transplantation of nerve progenitor cells would prevent immune rejection, said Dr. Benjamin Rollo of Murdoch Children’s Research Institute in Victoria, Australia, and his associates. But they cautioned against reading too much into their findings, “as there are distributional hurdles to surmount” before cell therapy can be used alone or in combination with surgery.
Hirschsprung disease is a congenital disorder in which embryonic neural crest cells fail to form the distal part of the enteric nervous system. The resulting lack of bowel motility leads to severe constipation and potentially fatal megacolon. Treatment involves surgically resecting the aganglionic distal bowel and anastomosing the normal proximal bowel to the anorectum, but this approach itself can cause constipation as well as fecal soiling, the investigators noted (Cell Molec Gastroenterol Hepatol. 2015 Oct. 22 [doi: 10.1016/j.jcmgh.2015.09.007]).
For the study, they harvested tissue from the proximal (neuronal) and distal (aneuronal) margins of resection of the colons of 31 infants and children with Hirschsprung disease. They cultured cells from the myenteric plexus of the proximal colon, and separated out nerve cells by using flow cytometry for the p75 neural crest marker. To test whether these nerve cells could colonize aganglionic colon, they co-cultured them with aneural avian embryo gut and with patients’ own aneuronal colon muscle. In addition, they co-cultured embryonic mouse enteric nernous system cells with human aneuronal colon muscle. They used quantitative reverse transcriptase PCR and several other standard laboratory techniques to detect cellular markers and mitosis.
Ganglia from the patients’ proximal colons expressed the neural crest markers p75, SOX10, and HNK1, as well as several neuronal, neurite, and glial markers, the researchers reported. The proximal colon specimens also contained ENS progenitor cells, which were SOX10-positive but lacked neuronal or glial markers. The progenitor cells comprised less than 5% of all cells from the proximal colon, but proliferated fourfold more after supplementation with CHIR-99021, a selective inhibitor of glycogen synthase kinase 3. They successfully colonized avian aneural embryonic gut and autologous postnatal aneuronal colon tissue, and the latter also was colonized successfully by mouse enteric neural crest cells.
The study “fulfilled three key requirements” for transplantation – harvesting enteric nervous system cells from the proximal colons of patients with Hirschsprung disease; confirming that postnatal aneuronal colon tissue could support an enteric nervous system; and showing that enteric nervous system–derived cells could colonize both embryonic gut and autologous postnatal colon tissue, said the researchers. More work is needed to sufficiently expand embryonic neural crest stem or progenitor cells and transplant them over a large area of colon, although supplementation with growth factors and use of elastic polymer substrates might help, they added.
The National Health and Medical Research Council, Murdoch Children’s Research Institute, Graham Burke and Yvonne Spencer, the Federation of Chinese Associations, Fonds du Service de chirurgie pédiatrique et de Perfectionnement du CHUV, Fondation SICPA, and Société Académique Vaudoise funded the study. The researchers disclosed no conflicts of interest.
FROM CELLULAR AND MOLECULAR GASTROENTEROLOGY AND HEPATOLOGY
Key clinical point: A preclinical study took several key steps toward autologous transplantation of nerve progenitor cells to treat Hirschsprung disease.
Major finding: Neural progenitor cells from the proximal colons of patients with Hirschsprung disease divided and formed neurons and glia in their own distal aganglionic colon tissue.
Data source: Flow cytometry, reverse transcriptase-PCR, immunohistochemistry, and cell culture of proximal (neuronal) and distal (aneuronal) colon tissue from 31 affected patients, and co-culture with avian embryonic gut and mouse enteric nervous system cells.
Disclosures: The National Health and Medical Research Council, Murdoch Children’s Research Institute, Graham Burke and Yvonne Spencer, the Federation of Chinese Associations, Fonds du Service de chirurgie pédiatrique et de Perfectionnement du CHUV, Fondation SICPA, and Société Académique Vaudoise funded the study. The researchers disclosed no conflicts of interest.
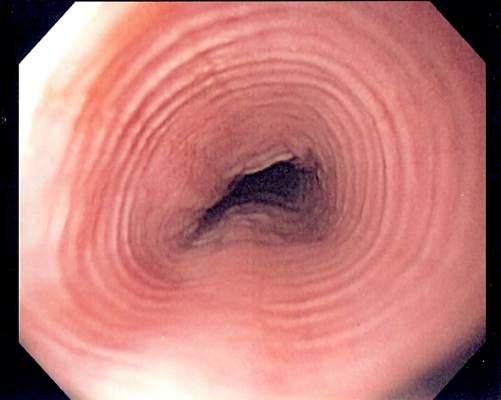
PPIs caused remission in about half of esophageal eosinophilia cases
About half of patients with symptomatic esophageal eosinophilia achieved complete clinical and histologic remission on proton pump inhibitors (PPIs), according to a systematic review and meta-analysis of 33 studies.
“Our results support the concept of PPIs as first-line therapy in both children and adults,” Dr. Alfredo Lucendo of the Servicio de Salud de Castillo–La Mancha, Hospital General de Tomelloso, Albacete, Spain, and his associates wrote in the January issue of Clinical Gastroenterology and Hepatology. “Other effective alternatives, such as dietary or topical steroid therapy, likely might be set aside as second-line treatment, owing to long-term safety concerns (topical steroid therapy) and impairment of quality of life and nutritional inadequacy (dietary interventions).”

The study also confirmed that esophageal pH monitoring does not accurately predict therapeutic response to PPI therapy. “The performance of this test before histologic reevaluation on PPI therapy should be discouraged,” according to the researchers (Clin Gastroenterol Hepatol. 2015. [doi:10.1016/j.cgh.2015.07.041]). Eosinophilic esophagitis was first described as a distinct disorder about 20 years ago, but only recently was understood to be the most common cause of chronic esophageal symptoms among children and young adults. Some cases are now known to respond to PPI therapy, but reported remission rates have varied depending on study design and patient population, the investigators said. In addition, no one had systematically reviewed studies of PPI-responsive esophageal eosinophilia for quality or to determine the optimal type of PPI, dose, or treatment duration.
Therefore, the investigators searched MEDLINE, EMBASE, SCOPUS, and abstracts from the annual meetings of the American Gastroenterological Association, the American College of Gastroenterology, and United European Gastroenterology, identifying 33 studies of 619 patients with symptomatic esophageal eosinophilia. Eleven of the studies were prospective, of which only two were randomized controlled trials. The researchers defined a histologic response as less than 15 eosinophils per high-powered frame after PPI therapy. “Missing data regarding PPI therapy were common and prevented us from drawing conclusions on the most effective PPI drug and doses,” they said. In addition, most studies lacked structured or objective survey tools or other measures of clinical improvement, making it impossible to rule out self-adapted coping strategies as a main cause of improvement over time.
With those caveats in mind, about 61% of patients in the pooled analysis had a clinical response to PPI therapy (95% confidence interval, 48%-72%), and half achieved clinical and histologic remission (95% CI, 42%-59%), the investigators reported. Therapy was somewhat more effective when administered twice a day instead of once daily, when clinicians used esophageal pH monitoring, and when studies were prospective instead of retrospective, but the differences were not significant. Nor did therapeutic response significantly differ based on the age of patients, type of report, or quality of the study.
The overall findings “should be interpreted with caution because of poor-quality evidence, heterogeneity, and publication bias,” the researchers said. Prospective studies are needed to examine the best PPI, dose, and dosing interval to use in an initial trial in the clinic; to clarify long-term effects and dosing strategies; to assess the ability of PPIs to reverse fibrotic esophageal remodeling; and to examine the effects of the CYP2C19 genotype on clinical and histologic response, they added. “More quality evidence on pediatric PPI-responsive eosinophilic esophagitis is needed urgently,” they emphasized.
The authors reported no funding sources and had no disclosures.
Proton pump inhibitor–responsive esophageal eosinophilia (PPI-REE) is a condition in which patients have symptoms of esophageal dysfunction (often dysphagia or heartburn), biopsies with at least 15 eosinophils per high-power field (eos/hpf), and symptomatic and histologic resolution after a PPI trial, typically at twice-daily dosing. Currently, PPI-REE and eosinophilic esophagitis (EoE) overlap substantially, but in the most recent guidelines, they are still considered to be distinct entities. PPI-REE was first reported almost 10 years ago, and since then multiple prospective and retrospective studies in both children and adults have further characterized it. The study by Dr. Lucendo and colleagues, a comprehensive and rigorously conducted systematic review and meta-analysis of 33 studies accounting for 619 patients, found that just over 50% of patients with esophageal eosinophilia had histologic remission (less than 15 eos/hpf) and just over 60% had symptomatic improvement after PPI use. Moreover, similar responses were seen whether or not there was pathologic acid exposure on pH testing.

|
| Dr. Evan S. Dellon |
While there was heterogeneity between studies on meta-analysis, there are several important messages from this study. First, PPI-REE is commonly seen in patients with esophageal eosinophilia, and is not always simply due to reflux. Second, PPIs have a potent antieosinophil effect in these patients. Interestingly, novel acid-independent mechanisms for this anti-inflammatory action recently have been described in other studies. Third, a PPI trial remains important prior to confirming the diagnosis of EoE, and PPIs should be considered the first-line treatment when esophageal eosinophilia is identified. However, it bears emphasizing that all esophageal eosinophilia is not due to EoE. If a patient responds to the PPI trial, there is no clear need to move toward topical steroid or dietary elimination therapy specifically for EoE, and starting multiple antieosinophil treatments concomitantly precludes determining which is most effective. In the future, understanding which patients with esophageal eosinophilia will most benefit from a PPI trial will be important, as we are currently unable to predict this from clinical, endoscopic, and histologic factors. Future studies and guidelines will also need to address whether EoE and PPI-REE are distinct diseases or manifestations of the same underlying process.
Dr. Evan S. Dellon, MPH, is associate professor of medicine and epidemiology at the Center for Esophageal Diseases and Swallowing, division of gastroenterology and hepatology, University of North Carolina School of Medicine at Chapel Hill. He has received research funding from Meritage, Miraca, Receptos, and Regeneron and consulted for Aptalis, Banner, Novartis, Receptos, Regeneron, and Roche.
Proton pump inhibitor–responsive esophageal eosinophilia (PPI-REE) is a condition in which patients have symptoms of esophageal dysfunction (often dysphagia or heartburn), biopsies with at least 15 eosinophils per high-power field (eos/hpf), and symptomatic and histologic resolution after a PPI trial, typically at twice-daily dosing. Currently, PPI-REE and eosinophilic esophagitis (EoE) overlap substantially, but in the most recent guidelines, they are still considered to be distinct entities. PPI-REE was first reported almost 10 years ago, and since then multiple prospective and retrospective studies in both children and adults have further characterized it. The study by Dr. Lucendo and colleagues, a comprehensive and rigorously conducted systematic review and meta-analysis of 33 studies accounting for 619 patients, found that just over 50% of patients with esophageal eosinophilia had histologic remission (less than 15 eos/hpf) and just over 60% had symptomatic improvement after PPI use. Moreover, similar responses were seen whether or not there was pathologic acid exposure on pH testing.
|
|
| Dr. Evan S. Dellon |
While there was heterogeneity between studies on meta-analysis, there are several important messages from this study. First, PPI-REE is commonly seen in patients with esophageal eosinophilia, and is not always simply due to reflux. Second, PPIs have a potent antieosinophil effect in these patients. Interestingly, novel acid-independent mechanisms for this anti-inflammatory action recently have been described in other studies. Third, a PPI trial remains important prior to confirming the diagnosis of EoE, and PPIs should be considered the first-line treatment when esophageal eosinophilia is identified. However, it bears emphasizing that all esophageal eosinophilia is not due to EoE. If a patient responds to the PPI trial, there is no clear need to move toward topical steroid or dietary elimination therapy specifically for EoE, and starting multiple antieosinophil treatments concomitantly precludes determining which is most effective. In the future, understanding which patients with esophageal eosinophilia will most benefit from a PPI trial will be important, as we are currently unable to predict this from clinical, endoscopic, and histologic factors. Future studies and guidelines will also need to address whether EoE and PPI-REE are distinct diseases or manifestations of the same underlying process.
Dr. Evan S. Dellon, MPH, is associate professor of medicine and epidemiology at the Center for Esophageal Diseases and Swallowing, division of gastroenterology and hepatology, University of North Carolina School of Medicine at Chapel Hill. He has received research funding from Meritage, Miraca, Receptos, and Regeneron and consulted for Aptalis, Banner, Novartis, Receptos, Regeneron, and Roche.
About half of patients with symptomatic esophageal eosinophilia achieved complete clinical and histologic remission on proton pump inhibitors (PPIs), according to a systematic review and meta-analysis of 33 studies.
“Our results support the concept of PPIs as first-line therapy in both children and adults,” Dr. Alfredo Lucendo of the Servicio de Salud de Castillo–La Mancha, Hospital General de Tomelloso, Albacete, Spain, and his associates wrote in the January issue of Clinical Gastroenterology and Hepatology. “Other effective alternatives, such as dietary or topical steroid therapy, likely might be set aside as second-line treatment, owing to long-term safety concerns (topical steroid therapy) and impairment of quality of life and nutritional inadequacy (dietary interventions).”
The study also confirmed that esophageal pH monitoring does not accurately predict therapeutic response to PPI therapy. “The performance of this test before histologic reevaluation on PPI therapy should be discouraged,” according to the researchers (Clin Gastroenterol Hepatol. 2015. [doi:10.1016/j.cgh.2015.07.041]). Eosinophilic esophagitis was first described as a distinct disorder about 20 years ago, but only recently was understood to be the most common cause of chronic esophageal symptoms among children and young adults. Some cases are now known to respond to PPI therapy, but reported remission rates have varied depending on study design and patient population, the investigators said. In addition, no one had systematically reviewed studies of PPI-responsive esophageal eosinophilia for quality or to determine the optimal type of PPI, dose, or treatment duration.
Therefore, the investigators searched MEDLINE, EMBASE, SCOPUS, and abstracts from the annual meetings of the American Gastroenterological Association, the American College of Gastroenterology, and United European Gastroenterology, identifying 33 studies of 619 patients with symptomatic esophageal eosinophilia. Eleven of the studies were prospective, of which only two were randomized controlled trials. The researchers defined a histologic response as less than 15 eosinophils per high-powered frame after PPI therapy. “Missing data regarding PPI therapy were common and prevented us from drawing conclusions on the most effective PPI drug and doses,” they said. In addition, most studies lacked structured or objective survey tools or other measures of clinical improvement, making it impossible to rule out self-adapted coping strategies as a main cause of improvement over time.
With those caveats in mind, about 61% of patients in the pooled analysis had a clinical response to PPI therapy (95% confidence interval, 48%-72%), and half achieved clinical and histologic remission (95% CI, 42%-59%), the investigators reported. Therapy was somewhat more effective when administered twice a day instead of once daily, when clinicians used esophageal pH monitoring, and when studies were prospective instead of retrospective, but the differences were not significant. Nor did therapeutic response significantly differ based on the age of patients, type of report, or quality of the study.
The overall findings “should be interpreted with caution because of poor-quality evidence, heterogeneity, and publication bias,” the researchers said. Prospective studies are needed to examine the best PPI, dose, and dosing interval to use in an initial trial in the clinic; to clarify long-term effects and dosing strategies; to assess the ability of PPIs to reverse fibrotic esophageal remodeling; and to examine the effects of the CYP2C19 genotype on clinical and histologic response, they added. “More quality evidence on pediatric PPI-responsive eosinophilic esophagitis is needed urgently,” they emphasized.
The authors reported no funding sources and had no disclosures.
FROM CLINICAL GASTROENTEROLOGY AND HEPATOLOGY
Key clinical point: Proton pump inhibitors should be considered in the first-line treatment of esophageal eosinophilia.
Major finding: Half of patients achieved clinical and histologic remission after a trial of PPIs.
Data source: Meta-analysis of 33 studies of 619 patients with symptomatic esophageal eosinophilia indicative of eosinophilic esophagitis.
Disclosures: The authors reported no funding sources and had no disclosures.
Measure found significant variations in outpatient colonoscopy quality
Facilities that performed outpatient colonoscopies varied significantly in terms of subsequent unplanned hospital visits, even after patient-level risk factors were adjusted for, according to a Medicare claims analysis reported in the January issue of Gastroenterology.
This first-in-kind quality measure will help “make transparent the full range of adverse events requiring hospital care that patients experience post-[colonoscopy], inform patient choice, create incentives for improved care, and assist providers’ quality improvement efforts, wrote Dr. Isuru Ranasinghe of Yale–New Haven (Conn.) Hospital and his associates. Preventing unplanned hospitals visits after colonoscopy could also help improve patient outcomes and cut health care costs, they added.

More than 90% of colonoscopies occur in outpatient settings, where it is difficult to follow-up and track serious adverse events such as colonic perforation or gastrointestinal bleeding. Furthermore, there are no publicly available quality reports of providers or facilities that perform outpatient colonoscopies. To help fill that gap, the researchers tracked unplanned hospital visits within 7 days after colonoscopy as part of an outpatient quality initiative by the Centers for Medicare & Medicaid Services. The analysis included 20% of Medicare outpatient colonoscopy claims in 2010, which amounted to 331,880 colonoscopies performed at 8,140 facilities (Gastroenterology 2015 [doi: 10.1053/j.gastro.2015.09.009]).
In 2010, there were 16.3 unplanned hospital visits for every 1,000 Medicare claims for outpatient colonoscopies, which equated to 27,000 such visits nationwide, the investigators said. Patients who were older than 85 years were significantly more likely to have an unplanned hospital visit than were patients aged 65-69 years (odds ratio, 1.87; 95% confidence interval, 1.54-2.28). The other most significant predictors included having an electrolyte or acid/base imbalance (OR, 1.43) or a psychiatric disorder (OR, 1.34). After adjusting for these factors, unplanned admission rates varied significantly among facilities in all four states with available data, including New York, California, Florida, and Nebraska, the researchers said.
These findings might not apply to patients who are too young to be enrolled in Medicare, which “is important, as most colonoscopies are performed among patients aged less than 65 years, although older patients are more likely to suffer adverse events,” Dr. Ranasinghe and his associates noted. The study also did not assess deaths, the one-third of GI bleeding events that occur more than a week after colonoscopy, or the various factors that might affect quality of care, such as type of anesthesia, polypectomy technique, and access to follow-up care. “The goal of the measure is to reveal the opportunity for improvement, and to prompt facilities to examine their practices in depth to identify ways to lower hospital visit rates to the level achieved by the best providers,” the researchers emphasized.
The work was supported by the Centers for Medicare & Medicaid Services, the National Health and Medical Research Council, the National Heart Foundation of Australia, the National Institute on Aging, the American Federation for Aging Research. Dr. Ranasinghe and nine coinvestigators reported working under contract with CMS to develop and maintain performance measures. Three coinvestigators reported financial relationships with AbbVie, qMed, Pentax, Olympus, Myriad Genetics, UnitedHealth, Medtronic, and Johnson & Johnson.
Source: American Gastroenterological Association
As part of the Centers for Medicare & Medicaid Services initiative to develop outpatient quality measures, Dr. Ranasinghe and his colleagues designed a risk-adjusted measure to capture serious adverse events characterized by unplanned hospitalization within 7 days after colonoscopy.
While no measure is perfect, this measure captures many important adverse outcomes after colonoscopy. Their methods carefully excluded hospitalizations that were elective or could be attributable to other conditions. This is an important quality measure because the endoscopist is often unaware of hospitalizations that occur post colonoscopy (Arch Intern Med. 2010;170:1752-7), and therefore cannot target quality improvement (QI) efforts at preventing such unplanned outcomes.

|
| Dr. Jeremy Adler |
This measure can be calculated from available data without chart audit and will fulfill CMS reporting requirements. However, it will be important to keep in mind that it was developed for patients 65 years and older, and may not be applicable to younger patients. Furthermore, to make this measure meaningful, it should be used to improve quality, not just assess quality.
The authors demonstrated that they were able to identify practices that were outliers, even when risk adjusted and adjusted for practice volume. This could allow practices to become self-aware and provide benchmarks against which to compare and improve their performance.
However, one major limitation to using this measure for QI is that the Healthcare Cost and Utilization Project only provides updated data yearly, after a substantial time lag, making it unsuitable for short-term or rapid-cycle QI efforts. In order for individual practices to target their improvement efforts, they would need to review their own local postcolonoscopy hospitalization data as an outcome measure more frequently. They could then review each case in depth to learn details that could further help target improvement efforts.
Dr. Jeremy Adler, M.Sc. is assistant professor, division of pediatric gastroenterology and Child Health Evaluation and Research Unit, University of Michigan, Ann Arbor. He has no conflicts of interest.
As part of the Centers for Medicare & Medicaid Services initiative to develop outpatient quality measures, Dr. Ranasinghe and his colleagues designed a risk-adjusted measure to capture serious adverse events characterized by unplanned hospitalization within 7 days after colonoscopy.
While no measure is perfect, this measure captures many important adverse outcomes after colonoscopy. Their methods carefully excluded hospitalizations that were elective or could be attributable to other conditions. This is an important quality measure because the endoscopist is often unaware of hospitalizations that occur post colonoscopy (Arch Intern Med. 2010;170:1752-7), and therefore cannot target quality improvement (QI) efforts at preventing such unplanned outcomes.
|
|
| Dr. Jeremy Adler |
This measure can be calculated from available data without chart audit and will fulfill CMS reporting requirements. However, it will be important to keep in mind that it was developed for patients 65 years and older, and may not be applicable to younger patients. Furthermore, to make this measure meaningful, it should be used to improve quality, not just assess quality.
The authors demonstrated that they were able to identify practices that were outliers, even when risk adjusted and adjusted for practice volume. This could allow practices to become self-aware and provide benchmarks against which to compare and improve their performance.
However, one major limitation to using this measure for QI is that the Healthcare Cost and Utilization Project only provides updated data yearly, after a substantial time lag, making it unsuitable for short-term or rapid-cycle QI efforts. In order for individual practices to target their improvement efforts, they would need to review their own local postcolonoscopy hospitalization data as an outcome measure more frequently. They could then review each case in depth to learn details that could further help target improvement efforts.
Dr. Jeremy Adler, M.Sc. is assistant professor, division of pediatric gastroenterology and Child Health Evaluation and Research Unit, University of Michigan, Ann Arbor. He has no conflicts of interest.
Facilities that performed outpatient colonoscopies varied significantly in terms of subsequent unplanned hospital visits, even after patient-level risk factors were adjusted for, according to a Medicare claims analysis reported in the January issue of Gastroenterology.
This first-in-kind quality measure will help “make transparent the full range of adverse events requiring hospital care that patients experience post-[colonoscopy], inform patient choice, create incentives for improved care, and assist providers’ quality improvement efforts, wrote Dr. Isuru Ranasinghe of Yale–New Haven (Conn.) Hospital and his associates. Preventing unplanned hospitals visits after colonoscopy could also help improve patient outcomes and cut health care costs, they added.
More than 90% of colonoscopies occur in outpatient settings, where it is difficult to follow-up and track serious adverse events such as colonic perforation or gastrointestinal bleeding. Furthermore, there are no publicly available quality reports of providers or facilities that perform outpatient colonoscopies. To help fill that gap, the researchers tracked unplanned hospital visits within 7 days after colonoscopy as part of an outpatient quality initiative by the Centers for Medicare & Medicaid Services. The analysis included 20% of Medicare outpatient colonoscopy claims in 2010, which amounted to 331,880 colonoscopies performed at 8,140 facilities (Gastroenterology 2015 [doi: 10.1053/j.gastro.2015.09.009]).
In 2010, there were 16.3 unplanned hospital visits for every 1,000 Medicare claims for outpatient colonoscopies, which equated to 27,000 such visits nationwide, the investigators said. Patients who were older than 85 years were significantly more likely to have an unplanned hospital visit than were patients aged 65-69 years (odds ratio, 1.87; 95% confidence interval, 1.54-2.28). The other most significant predictors included having an electrolyte or acid/base imbalance (OR, 1.43) or a psychiatric disorder (OR, 1.34). After adjusting for these factors, unplanned admission rates varied significantly among facilities in all four states with available data, including New York, California, Florida, and Nebraska, the researchers said.
These findings might not apply to patients who are too young to be enrolled in Medicare, which “is important, as most colonoscopies are performed among patients aged less than 65 years, although older patients are more likely to suffer adverse events,” Dr. Ranasinghe and his associates noted. The study also did not assess deaths, the one-third of GI bleeding events that occur more than a week after colonoscopy, or the various factors that might affect quality of care, such as type of anesthesia, polypectomy technique, and access to follow-up care. “The goal of the measure is to reveal the opportunity for improvement, and to prompt facilities to examine their practices in depth to identify ways to lower hospital visit rates to the level achieved by the best providers,” the researchers emphasized.
The work was supported by the Centers for Medicare & Medicaid Services, the National Health and Medical Research Council, the National Heart Foundation of Australia, the National Institute on Aging, the American Federation for Aging Research. Dr. Ranasinghe and nine coinvestigators reported working under contract with CMS to develop and maintain performance measures. Three coinvestigators reported financial relationships with AbbVie, qMed, Pentax, Olympus, Myriad Genetics, UnitedHealth, Medtronic, and Johnson & Johnson.
Source: American Gastroenterological Association
FROM GASTROENTEROLOGY
Key clinical point: Researchers validated a new measure to evaluate the quality of outpatient colonoscopies.
Major finding: Risk-adjusted rates of these visits varied significantly among health care facilities in all four states with available data.
Data source: An analysis of 20% of Medicare outpatient colonoscopy claims in 2010, which included 331,880 procedures performed at 8,140 facilities.
Disclosures: The work was supported by the Centers for Medicare & Medicaid Services, the National Health and Medical Research Council, the National Heart Foundation of Australia, the National Institute on Aging, and the American Federation for Aging Research. Dr. Ranasinghe and nine coinvestigators reported working under contract with CMS to develop and maintain performance measures. Three coinvestigators reported financial relationships with AbbVie, gMed, Pentax, Olympus, Myriad Genetics, UnitedHealth, Medtronic, and Johnson & Johnson.

Malpractice Counsel: Allergic Reaction Versus Anaphylaxis
Allergic Reaction Versus Anaphylaxis
A 34-year-old woman presented to ED with complaints of an allergic reaction, the onset of which began approximately 1 hour prior. The patient did not know what might have caused her symptoms. She complained of hives and itching all over; she denied difficulty swallowing, wheezing, and shortness of breath. Her medical history was unremarkable. She was on no medications, and she denied any alcohol or tobacco use. She had no known medication or food allergies.
Physical examination revealed a woman in mild discomfort, secondary to generalized itching. Her vital signs, including pulse oximetry, were normal. There was no swelling of the face, lips, or oropharynx. The lungs were clear to auscultation bilaterally. The heart and abdominal examinations were normal. Examination of the skin revealed diffuse urticaria without petechiae or purpura.
The emergency physician (EP) ordered 125 mg of methylprednisolone sodium succinate and 25 mg of diphenhydramine intravenously (IV). After approximately 1 hour, the hives and itching decreased and the patient felt improved. She was diagnosed with an allergic reaction and discharged home with a prescription for diphenhydramine and a methylprednisolone dose pack.

The following day, the patient collapsed at home and emergency medical services was called. Unfortunately, the patient could not be resuscitated and was pronounced dead at the scene. An autopsy revealed the patient had died from anaphylaxis and laryngeal edema, with an extremely elevated tryptase level of 200 ng/mL (normal, <11.5 ng/mL).
The patient’s family sued the EP for failure to diagnose and treat anaphylaxis, failure to treat with epinephrine, and failure to admit the patient to the hospital. The defense claimed the patient did not present with anaphylaxis, but rather simply a worsening of the hives and angioedema, and that the treatment provided was appropriate. The jury found in favor of the defendants.
Discussion
It does not appear the patient presented with anaphylaxis on the first visit, but may have had it on the second visit. In 2004, the National Institutes of Allergy and Infectious Disease (NIAID) panel and the Food Allergy and Anaphylaxis Network (FAAN) developed criteria for the diagnosis of anaphylaxis.1 According to the criteria, anaphylaxis is likely when any one of the following three criteria are present: (1) acute onset of symptoms involving the skin or mucosa (eg, pruritus, hives, angioedema), and either respiratory compromise (eg, dyspnea, wheezing, stridor, hypoxia) or hypotension/end-organ dysfunction (eg, syncope, incontinence); (2) two or more symptoms (eg, respiratory compromise, hypotension/end-organ dysfunction, persistent gastrointestinal [GI] symptoms such as vomiting, diarrhea, or crampy abdominal pain) that occur rapidly after exposure involving the skin or mucosa; or (3) hypotension from a known allergen to the patient. The accuracy of these criteria has been retrospectively evaluated in an ED study, and found to have a 97% sensitivity and an 82% specificity.2 The negative predictive value was good at 98%, but the positive predictive value was only 69%.2
When a patient presents with minimal or subtle symptoms, anaphylaxis can be a very difficult diagnosis to make in the ED early on in the process. While no EP will miss the diagnosis in a patient with hives, hypotension, and wheezing, it can be easy to miss when the predominant symptoms are GI, such as nausea, vomiting, or diarrhea. In addition, the differential diagnosis for the presentation of anaphylaxis in the ED can be extremely broad and include vasovagal reaction, asthma attack, myocardial infarction, gastroenteritis, panic attack, or airway obstruction.
Due to the nature of emergency medicine, EPs must consider multiple etiologies before determining an evaluation and management plan. While recognizing there are limitations to the NIAID/FAAN criteria, EPs should be aware of them. We are very good at treating these types of symptoms with antihistamines and steroids; however, we frequently fail to give epinephrine when indicated. It is important to remember that epinephrine is the first-line treatment for anaphylaxis—not corticosteroids or antihistamines.3
Reasons for not administering epinephrine are multiple. First, as discussed above, if the diagnosis of anaphylaxis is not considered, the EP is not going to administer the drug of choice. Secondly, EPs have been taught to have a healthy respect for epinephrine and its effects, especially in older patients. Due to this cautious approach, epinephrine is frequently not given to patients with mild symptoms or to those who present early in the course of disease.
Emergency physicians have experience giving epinephrine subcutaneously, but not nearly as much with the intramuscular (IM) route. This is important, because an IM injection in the anterolateral thigh is the recommended location for the treatment of anaphylaxis. The dose should be weight based (0.01 mg/kg) to a maximum of 0.5 mg. This dose can be given every 5 to 15 minutes as necessary to control symptoms.3 The dosing is important to remember, since many EDs stock only autoinjectable epinephrine devices for use in anaphylaxis. These autoinjectors only contain 0.3 mg of epinephrine, so some patients may be underdosed if used.
In the management of allergic reactions and anaphylaxis, EPs frequently administer antihistamines and corticosteroids. While there is no direct evidence to support their use in the management of anaphylaxis, theoretical benefits do exist.3 This, combined with the excellent medication safety profile and lack of serious side effects, make these two medication classes appropriate for use in the ED.
- Allergic Reaction Versus Anaphylaxis
- Manivannan V, Decker WW, Stead LG, Li JT, Campbell RL. National Institute of Allergy and Infectious Disease and Food Allergy and Anaphylaxis Network criteria for anaphylaxis. Int J Emerg Med. 2009;2(1):3-5.
- Campbell RL, Hagan JB, Manivannan V, et al. Evaluation of National Institute of Allergy and Infectious Diseases/Food Allergy and Anaphylaxis Network criteria for the diagnosis of anaphylaxis in emergency department patients. J Allergy Clin Immunol. 2012;129(3):748-752.
- Campbell RL, Li JT, Nicklas RA, Sadosty AT; Members of the Joint Task Force; Practice Parameter Workgroup. Emergency department diagnosis and treatment of anaphylaxis: a practice parameter. Ann Allergy Asthma Immunol. 2014;113(6):599-608.
Allergic Reaction Versus Anaphylaxis
A 34-year-old woman presented to ED with complaints of an allergic reaction, the onset of which began approximately 1 hour prior. The patient did not know what might have caused her symptoms. She complained of hives and itching all over; she denied difficulty swallowing, wheezing, and shortness of breath. Her medical history was unremarkable. She was on no medications, and she denied any alcohol or tobacco use. She had no known medication or food allergies.
Physical examination revealed a woman in mild discomfort, secondary to generalized itching. Her vital signs, including pulse oximetry, were normal. There was no swelling of the face, lips, or oropharynx. The lungs were clear to auscultation bilaterally. The heart and abdominal examinations were normal. Examination of the skin revealed diffuse urticaria without petechiae or purpura.
The emergency physician (EP) ordered 125 mg of methylprednisolone sodium succinate and 25 mg of diphenhydramine intravenously (IV). After approximately 1 hour, the hives and itching decreased and the patient felt improved. She was diagnosed with an allergic reaction and discharged home with a prescription for diphenhydramine and a methylprednisolone dose pack.
The following day, the patient collapsed at home and emergency medical services was called. Unfortunately, the patient could not be resuscitated and was pronounced dead at the scene. An autopsy revealed the patient had died from anaphylaxis and laryngeal edema, with an extremely elevated tryptase level of 200 ng/mL (normal, <11.5 ng/mL).
The patient’s family sued the EP for failure to diagnose and treat anaphylaxis, failure to treat with epinephrine, and failure to admit the patient to the hospital. The defense claimed the patient did not present with anaphylaxis, but rather simply a worsening of the hives and angioedema, and that the treatment provided was appropriate. The jury found in favor of the defendants.
Discussion
It does not appear the patient presented with anaphylaxis on the first visit, but may have had it on the second visit. In 2004, the National Institutes of Allergy and Infectious Disease (NIAID) panel and the Food Allergy and Anaphylaxis Network (FAAN) developed criteria for the diagnosis of anaphylaxis.1 According to the criteria, anaphylaxis is likely when any one of the following three criteria are present: (1) acute onset of symptoms involving the skin or mucosa (eg, pruritus, hives, angioedema), and either respiratory compromise (eg, dyspnea, wheezing, stridor, hypoxia) or hypotension/end-organ dysfunction (eg, syncope, incontinence); (2) two or more symptoms (eg, respiratory compromise, hypotension/end-organ dysfunction, persistent gastrointestinal [GI] symptoms such as vomiting, diarrhea, or crampy abdominal pain) that occur rapidly after exposure involving the skin or mucosa; or (3) hypotension from a known allergen to the patient. The accuracy of these criteria has been retrospectively evaluated in an ED study, and found to have a 97% sensitivity and an 82% specificity.2 The negative predictive value was good at 98%, but the positive predictive value was only 69%.2
When a patient presents with minimal or subtle symptoms, anaphylaxis can be a very difficult diagnosis to make in the ED early on in the process. While no EP will miss the diagnosis in a patient with hives, hypotension, and wheezing, it can be easy to miss when the predominant symptoms are GI, such as nausea, vomiting, or diarrhea. In addition, the differential diagnosis for the presentation of anaphylaxis in the ED can be extremely broad and include vasovagal reaction, asthma attack, myocardial infarction, gastroenteritis, panic attack, or airway obstruction.
Due to the nature of emergency medicine, EPs must consider multiple etiologies before determining an evaluation and management plan. While recognizing there are limitations to the NIAID/FAAN criteria, EPs should be aware of them. We are very good at treating these types of symptoms with antihistamines and steroids; however, we frequently fail to give epinephrine when indicated. It is important to remember that epinephrine is the first-line treatment for anaphylaxis—not corticosteroids or antihistamines.3
Reasons for not administering epinephrine are multiple. First, as discussed above, if the diagnosis of anaphylaxis is not considered, the EP is not going to administer the drug of choice. Secondly, EPs have been taught to have a healthy respect for epinephrine and its effects, especially in older patients. Due to this cautious approach, epinephrine is frequently not given to patients with mild symptoms or to those who present early in the course of disease.
Emergency physicians have experience giving epinephrine subcutaneously, but not nearly as much with the intramuscular (IM) route. This is important, because an IM injection in the anterolateral thigh is the recommended location for the treatment of anaphylaxis. The dose should be weight based (0.01 mg/kg) to a maximum of 0.5 mg. This dose can be given every 5 to 15 minutes as necessary to control symptoms.3 The dosing is important to remember, since many EDs stock only autoinjectable epinephrine devices for use in anaphylaxis. These autoinjectors only contain 0.3 mg of epinephrine, so some patients may be underdosed if used.
In the management of allergic reactions and anaphylaxis, EPs frequently administer antihistamines and corticosteroids. While there is no direct evidence to support their use in the management of anaphylaxis, theoretical benefits do exist.3 This, combined with the excellent medication safety profile and lack of serious side effects, make these two medication classes appropriate for use in the ED.
- Allergic Reaction Versus Anaphylaxis
- Manivannan V, Decker WW, Stead LG, Li JT, Campbell RL. National Institute of Allergy and Infectious Disease and Food Allergy and Anaphylaxis Network criteria for anaphylaxis. Int J Emerg Med. 2009;2(1):3-5.
- Campbell RL, Hagan JB, Manivannan V, et al. Evaluation of National Institute of Allergy and Infectious Diseases/Food Allergy and Anaphylaxis Network criteria for the diagnosis of anaphylaxis in emergency department patients. J Allergy Clin Immunol. 2012;129(3):748-752.
- Campbell RL, Li JT, Nicklas RA, Sadosty AT; Members of the Joint Task Force; Practice Parameter Workgroup. Emergency department diagnosis and treatment of anaphylaxis: a practice parameter. Ann Allergy Asthma Immunol. 2014;113(6):599-608.

Abstracts Presented at the 2015 AVAHO Annual Meeting


Advances in Hematology and Oncology (May 2015)


2015 Best Practices in Hematology and Oncology


Five Strategies for Early Career, Academic Hospitalists
One of the challenges a new academic hospitalist faces is trying to become a valued member of the teaching faculty. You are intent on becoming that next great attending you have always aspired to be; however, no one has clearly guided you on making this transition. In our experience, a handful of common teaching pitfalls frequently unravel the best efforts of young hospitalists. Below, you will find five strategies to take your teaching to the next level.
1. Don’t Try to Be Attending AND Resident.
Being a hospitalist attending is distinctly different than being a resident. It certainly is not being a “super-resident,” PGY-4, or PGY-17 for the team. When challenged with a new role and greater responsibility, it is natural to default to a more comfortable position (i.e., the hands-on mindset of the resident), but by doing so, you encroach on the work of the actual resident on your team. Adult learning theory teaches that it is responsibility that is the cornerstone of adult motivation. Trainees must have a chance to perform the work expected of their position without interference.

Let the resident be the resident. To reach this goal, set clear expectations and discuss the expectations up front. Make sure that you draw a sharp line between where the responsibility of the resident ends and yours begins. Have your resident help set her own expectations for the team, as well. This empowers the resident and also gives you insight into her view of the team dynamics. Your expectations should vary with the ability of the learner and the time of year. For example, the degree of autonomy that you may give a second-year resident in July is much less than what you might give a ready-to-graduate, third-year resident in June.
If granting autonomy makes you uncomfortable, observe your trainees from a distance for your own reassurance. Read the electronic medical record in depth; follow up on orders after attending rounds. If you don’t like a treatment decision, step in without inducing undue shame. After all, this is why residents are still in training, and it gives you the chance to demonstrate how to turn good care into great care.
2. Make Sure You Get to Know Your Trainees
Getting to know your trainees seems so simple that it often gets overlooked. Yet this may be the way your teaching and role modeling make their greatest impact. For adults to thrive in a learning environment, inclusion is key. There is no better way to feel included than to feel known. Inclusion allows learners to feel comfortable with being vulnerable by answering questions, asking questions, interacting, and participating in a meaningful manner on rounds. Consider your own behavior: How comfortable are you asking a question among a large audience of strangers versus asking the same question in a small group of friends? Inclusion will affect behavior.
Engage in “biographic rounds” near the start of your time together. As the attending, set the example by telling your trainees about yourself. Let them know where you are from, where you trained, what led you to choose hospital medicine, and some details about what you do in your spare time. Personal information will help break down the artificial walls that separate attendings from trainees.
Allow every member of your team to tell his or her story. It may not seem like much to you, but the effect on learners has been well established. If you invest in them, they will invest in the team.
3. Make Time to Observe Your Learners
You are responsible for evaluation and feedback of all your learners. Many factors contribute to poor feedback, but one of the most important is that new attendings often do not make a conscious effort to observe their learners. These attendings struggle to give meaningful feedback.

Take time and take notes:
- Take the time to watch your resident respond when the student is presenting her patient.
- Take time to allow the resident or intern to conduct bedside rounds on his patient.
- Take time to stop by on call to watch a student, intern, or resident take a history and perform a physical exam.
Even if you are unable to observe the whole encounter, there is little that gives you as much insight into your trainees as seeing them perform even part of a history and physical exam on a new patient. With time, a series of small observations will add up to a large number of specific comments.
Take notes on your trainees’ actions as you might do for your patients. This way, you have a record of what they did well and what needs work. Specific feedback will show that you paid attention and took the time to care about them as you would your patients.
4. Don’t Keep Your Thoughts to Yourself

Your job is akin to that of a syndicated columnist who is paid to give an informed narrative on the facts of the day. You must explain how the facts actually matter to patient care.
Think out loud. Explain your thoughts as much as possible. Do not assume that even your most senior trainees understand why you recommend a certain test or treatment. It is like algebra, where the teacher would never accept your answer unless you showed your work. For the sake of your learners, you must always “show your thinking.” They will learn as much from your clinical reasoning as they can from any canned talk on a subject.
5. Explicitly Plan Time for Teaching
“Thinking out loud” is a great way to teach, but a prepared talk can go into more depth on a topic. Yet how to find the time? The demands of a busy clinical service can overwhelm the best of intentions. Preparation is key. Good teaching does not happen by chance.
Set aside time for formal teaching outside of rounds. Be explicit as to when this will happen. Tell your team a day before, so they can prepare themselves or clear their time.
Have a handful of “canned” talks that you can give on topics related to common situations encountered in the hospital. They need not last more than 10 minutes. Always leave time for questions, and do your best to make them interactive. Even on a busy service, 10-15 minutes is reasonable for a brief, focused teaching session.
In Sum
Being an academic hospitalist with teaching responsibilities is highly rewarding. But becoming that next “great attending” requires an ongoing commitment to acquiring and developing your teaching skills.
Consider attending the SHM annual meeting or the Academic Hospitalist Academy to gain further knowledge on how to enhance your teaching career. In the meantime, try and practice some of the above tips—your learners may thank you. TH
Dr. Burger is associate program director of internal medicine residency in the Department of Medicine at Mount Sinai Beth Israel and assistant professor of medicine at Icahn School of Medicine at Mount Sinai, both in New York City. Dr. Miller is chief of the division of general internal medicine, associate chair of education, and associate professor in the Department of Internal Medicine at Saint Louis University.
One of the challenges a new academic hospitalist faces is trying to become a valued member of the teaching faculty. You are intent on becoming that next great attending you have always aspired to be; however, no one has clearly guided you on making this transition. In our experience, a handful of common teaching pitfalls frequently unravel the best efforts of young hospitalists. Below, you will find five strategies to take your teaching to the next level.
1. Don’t Try to Be Attending AND Resident.
Being a hospitalist attending is distinctly different than being a resident. It certainly is not being a “super-resident,” PGY-4, or PGY-17 for the team. When challenged with a new role and greater responsibility, it is natural to default to a more comfortable position (i.e., the hands-on mindset of the resident), but by doing so, you encroach on the work of the actual resident on your team. Adult learning theory teaches that it is responsibility that is the cornerstone of adult motivation. Trainees must have a chance to perform the work expected of their position without interference.
Let the resident be the resident. To reach this goal, set clear expectations and discuss the expectations up front. Make sure that you draw a sharp line between where the responsibility of the resident ends and yours begins. Have your resident help set her own expectations for the team, as well. This empowers the resident and also gives you insight into her view of the team dynamics. Your expectations should vary with the ability of the learner and the time of year. For example, the degree of autonomy that you may give a second-year resident in July is much less than what you might give a ready-to-graduate, third-year resident in June.
If granting autonomy makes you uncomfortable, observe your trainees from a distance for your own reassurance. Read the electronic medical record in depth; follow up on orders after attending rounds. If you don’t like a treatment decision, step in without inducing undue shame. After all, this is why residents are still in training, and it gives you the chance to demonstrate how to turn good care into great care.
2. Make Sure You Get to Know Your Trainees
Getting to know your trainees seems so simple that it often gets overlooked. Yet this may be the way your teaching and role modeling make their greatest impact. For adults to thrive in a learning environment, inclusion is key. There is no better way to feel included than to feel known. Inclusion allows learners to feel comfortable with being vulnerable by answering questions, asking questions, interacting, and participating in a meaningful manner on rounds. Consider your own behavior: How comfortable are you asking a question among a large audience of strangers versus asking the same question in a small group of friends? Inclusion will affect behavior.
Engage in “biographic rounds” near the start of your time together. As the attending, set the example by telling your trainees about yourself. Let them know where you are from, where you trained, what led you to choose hospital medicine, and some details about what you do in your spare time. Personal information will help break down the artificial walls that separate attendings from trainees.
Allow every member of your team to tell his or her story. It may not seem like much to you, but the effect on learners has been well established. If you invest in them, they will invest in the team.
3. Make Time to Observe Your Learners
You are responsible for evaluation and feedback of all your learners. Many factors contribute to poor feedback, but one of the most important is that new attendings often do not make a conscious effort to observe their learners. These attendings struggle to give meaningful feedback.
Take time and take notes:
- Take the time to watch your resident respond when the student is presenting her patient.
- Take time to allow the resident or intern to conduct bedside rounds on his patient.
- Take time to stop by on call to watch a student, intern, or resident take a history and perform a physical exam.
Even if you are unable to observe the whole encounter, there is little that gives you as much insight into your trainees as seeing them perform even part of a history and physical exam on a new patient. With time, a series of small observations will add up to a large number of specific comments.
Take notes on your trainees’ actions as you might do for your patients. This way, you have a record of what they did well and what needs work. Specific feedback will show that you paid attention and took the time to care about them as you would your patients.
4. Don’t Keep Your Thoughts to Yourself
Your job is akin to that of a syndicated columnist who is paid to give an informed narrative on the facts of the day. You must explain how the facts actually matter to patient care.
Think out loud. Explain your thoughts as much as possible. Do not assume that even your most senior trainees understand why you recommend a certain test or treatment. It is like algebra, where the teacher would never accept your answer unless you showed your work. For the sake of your learners, you must always “show your thinking.” They will learn as much from your clinical reasoning as they can from any canned talk on a subject.
5. Explicitly Plan Time for Teaching
“Thinking out loud” is a great way to teach, but a prepared talk can go into more depth on a topic. Yet how to find the time? The demands of a busy clinical service can overwhelm the best of intentions. Preparation is key. Good teaching does not happen by chance.
Set aside time for formal teaching outside of rounds. Be explicit as to when this will happen. Tell your team a day before, so they can prepare themselves or clear their time.
Have a handful of “canned” talks that you can give on topics related to common situations encountered in the hospital. They need not last more than 10 minutes. Always leave time for questions, and do your best to make them interactive. Even on a busy service, 10-15 minutes is reasonable for a brief, focused teaching session.
In Sum
Being an academic hospitalist with teaching responsibilities is highly rewarding. But becoming that next “great attending” requires an ongoing commitment to acquiring and developing your teaching skills.
Consider attending the SHM annual meeting or the Academic Hospitalist Academy to gain further knowledge on how to enhance your teaching career. In the meantime, try and practice some of the above tips—your learners may thank you. TH
Dr. Burger is associate program director of internal medicine residency in the Department of Medicine at Mount Sinai Beth Israel and assistant professor of medicine at Icahn School of Medicine at Mount Sinai, both in New York City. Dr. Miller is chief of the division of general internal medicine, associate chair of education, and associate professor in the Department of Internal Medicine at Saint Louis University.

EZH2 inhibitor can produce durable responses
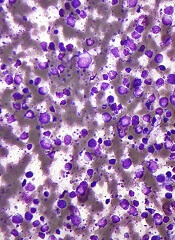
ORLANDO, FL—Updated results of a phase 1 study suggest the EZH2 inhibitor tazemetostat (EPZ-6438) can produce durable responses in patients with advanced non-Hodgkin lymphoma (NHL).
The drug has demonstrated activity against diffuse large B-cell lymphoma (DLBCL), follicular lymphoma (FL), and marginal zone lymphoma (MZL).
The overall response rate among NHL patients in this study was 56%, and 1 patient has maintained a response for more than 21 months.
In addition, the drug’s safety profile is “still acceptable,” according to Vincent Ribrag, MD, of Institut Gustave Roussy in Villejuif, France.
Dr Ribrag presented the results of this study at the 2015 ASH Annual Meeting (abstract 473*). The research, which was previously presented at the 13th International Conference on Malignant Lymphoma, was sponsored by Epizyme, Inc., the company developing tazemetostat.
The trial has enrolled 58 patients, 21 with relapsed or refractory B-cell NHL and 37 with advanced solid tumors. The NHL cohort includes 5 patients with germinal center B-cell (GCB) DLBCL, 6 cases of non-GCB DLBCL, 3 DLBCL cases of an undetermined subtype, 6 patients with FL, and 1 case of MZL.
At baseline, the NHL patients had a median age of 63 (range, 24-84) and were heavily pretreated. Eighty-five percent of patients had received 3 or more prior therapies, and 33% had received 5 or more. Thirty-eight percent of patients had undergone an autologous transplant, and 57% had received radiotherapy.
The patients received tazemetostat twice daily at a range of doses. For the dose-escalation portion of the trial, they received 100 mg, 200 mg, 400 mg, 800 mg, or 1600 mg. For the dose-expansion phase, they received 800 mg or 1600 mg.
The researchers are now conducting a drug-drug interaction substudy in which patients receive 800 mg of tazemetostat twice daily and a food-effect substudy in which patients receive the drug at 400 mg twice daily.
Dr Ribrag said the recommended phase 2 dose of tazemetostat is 800 mg twice daily.
Safety
At the data cutoff point (November 7, 2015), 55 patients—20 with NHL and 35 with solid tumors—were evaluable for safety.
Treatment-related adverse events in these patients included asthenia (n=13), nausea (n=8), thrombocytopenia (n=7), dysgeusia (n=5), vomiting (n=5), dry skin (n=4), decreased appetite (n=4), diarrhea (n=4), muscle spasms (n=3), neutropenia (n=3), anemia (n=3), night sweats (n=3), hypertension (n=2), constipation (n=2), peripheral edema (n=2), hypophosphatemia (n=1), anxiety (n=1), depression (n=1), abdominal pain (n=1), and hepatocellular injury (n=1).
There were 4 grade 3 or higher adverse events that were considered treatment-related, including nausea, hypertension, neutropenia, and hepatocellular injury.
Efficacy
Sixteen of the NHL patients were evaluable for efficacy. Nine patients responded to treatment, 2 with complete responses (CRs) and 7 with partial responses (PRs).
Five of the 10 DLBCL patients responded, 4 with PRs and 1 with a CR. Three of the 5 FL patients responded, 2 with PRs and 1 with a CR. The patient with MZL achieved a PR.
Four responders remain on study—2 with DLBCL and 2 with FL.
One DLBCL patient with an EZH2 mutation (Y646H) had relapsed after or was refractory to 6 previous treatment regimens. This patient achieved a PR after 16 weeks of tazemetostat. The patient is still in PR at week 44 and remains on study.
Based on these results, Epizyme is currently enrolling patients in a phase 2 study of tazemetostat monotherapy. The trial is open to patients with DLBCL or FL in France, Australia, and the UK. ![]()
*Data in the abstract differ from the presentation.
BM fibrosis grade may impact OS in PMF
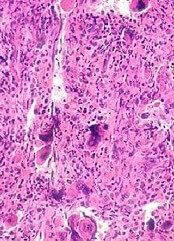
ORLANDO, FL—Having a higher grade of bone marrow (BM) fibrosis may confer inferior overall survival (OS) in patients with primary myelofibrosis (PMF), according to a retrospective study.
Investigators found that having a fibrosis grade of 2 or higher at diagnosis was associated with “unique clinical and molecular variables” that suggested a more aggressive disease phenotype.
And the median OS was significantly shorter in patients with higher grades of fibrosis.
However, when the investigators divided patients according to their International Prognostic Scoring System (IPSS) risk group, having a fibrosis grade of 2 or higher was only significantly associated with reduced OS among patients in the low-risk or intermediate-1-risk categories.
Paola Guglielmelli, MD, PhD, of the University of Florence in Italy, presented these findings at the 2015 ASH Annual Meeting (abstract 351*).
Dr Guglielmelli noted that the prognostic significance of BM fibrosis grade in PMF has been debated. So she and her colleagues set out to analyze the prognostic impact of fibrosis in 540 PMF patients from 6 Italian centers belonging to AGIMM (AIRC-Gruppo Italiano Malattie Mieloproliferative).
BM biopsies were obtained at diagnosis and evaluated by local pathologists according to 2008 World Health Organization criteria. The European consensus scoring system was used to grade fibrosis on a scale of MF-0 to MF-3.
Fifty patients were classified as MF-0 (9.3%), 180 were MF-1 (33.3%), 196 were MF-2 (36.3%), and 114 were MF-3 (21.1%).
Patients in the MF-2 and MF-3 groups were significantly more likely to have constitutional symptoms (P<0.0001), splenomegaly ≥10 cm from left costal margin (P<0.0001), a peripheral blast count ≥1% (P<0.0001), a greater risk of anemia (P<0.0001) or thrombocytopenia (P=0.001), and belong to the intermediate-2 or high-risk IPSS categories (P<0.0001).
In addition, patients in the MF-2 and MF-3 groups were significantly more likely to qualify as high-molecular-risk (HMR), which was defined as having at least 1 mutation in ASXL1, EZH2, SRSF2, or IDH1/2 (P<0.0001). The frequency of HMR patients increased progressively according to fibrosis grade: MF-0 (16%), MF-1 (25.6%), MF-2 (33.7%), and MF-3 (44.7%).
Patients with 2 or more HMR mutated genes were preferentially MF-2 or MF-3. None of the MF-0 patients fell into this category, compared to 4.4% for MF-1, 10.2% for MF-2, and 10.5% for MF-3 (P<0.0001).
Survival
The median OS was significantly shorter in patients with higher BM fibrosis grades (P<0.0001). The median OS was 7.2 years in the MF-3 group (hazard ratio [HR]=8.7), 6.7 years in the MF-2 group (HR=7.3), 14.7 years in the MF-1 group (HR=3.9), and not reached in the MF-0 group (reference).
In multivariable analysis, having a BM fibrosis grade of 2 or greater was significantly associated with reduced OS (HR=3.8, P=0.01).
Other variables significantly associated with reduced OS were being in the intermediate-1 (HR=2.9, P<0.0001), intermedicate-2 (HR=10.0, P<0.0001), or high-risk IPSS categories (HR=9.7, P<0.0001); having CALR type 2 mutation (HR=3.4, P=0.010), JAK2/MPL mutation (HR=2.4, P=0.003), or being triple-negative (HR=4.5, P<0.0001); being classified as HMR (HR=2.4, P<0.0001); and having 2 or more HMR mutations (HR=4.3, P=0.009).
Dr Guglielmelli and her colleagues also assessed the impact of BM fibrosis grade according to IPSS risk score.
They found that, for patients in the low/intermediate-1-risk categories, the median OS was not reached in the MF-0 group, was 22.8 years in the MF-1 group (HR=3.9), and was 15.4 years in the MF-2 and -3 groups combined (HR=7.4, P=0.001).
In the intermediate-2/high-risk categories, the median OS was 11 years for the MF-0 group, 3.6 years for the MF-1 group (HR=2.2), and 3.6 years in the MF-2 and -3 groups (HR=2.7, P=0.28).
Dr Guglielmelli therefore concluded that BM fibrosis grade might help refine prognostic stratification for PMF patients in the lower-risk IPSS categories. However, she noted that this study had limitations, and the results should be confirmed with prospective research. ![]()
*Data in the abstract differ from the presentation.