User login
Targeting gut flora to treat and prevent disease
› Encourage patients to eat a healthy diet that includes an adequate amount of soluble fiber to maintain a healthy, diverse microbiome. B
› Recommend combination probiotics to treat symptoms of irritable bowel syndrome. A
› Encourage patients to take probiotics containing Lactobacillus species to prevent antibiotic-associated diarrhea and Saccharomyces to prevent Clostridium difficile infection. A
› Recommend probiotics containing Lactobacillus species and/or Saccharomyces to treat acute infectious diarrhea. A
Strength of recommendation (SOR)
A Good-quality patient-oriented evidence
B Inconsistent or limited-quality patient-oriented evidence
C Consensus, usual practice, opinion, disease-oriented evidence, case series
CASE 1 › Sheila S, age 27, has irritable bowel syndrome (IBS) and comes to your office for a follow-up visit. Over the past 6 months she has started taking a fiber supplement, drinking more water, and looking for links between stress and her symptoms. She has read about probiotics and wonders if you would consider recommending them in her situation.
CASE 2 › Mark M, age 45, has type 2 diabetes and is overweight. He is motivated to change his diet and has started to exercise more. He is taking metformin 2000 mg/d but his hemoglobin A1c remains slightly elevated at 7.2%. He heard on television that probiotics might help to keep him from needing to add another medication.
Most of the living organisms that comprise the human microbiome—all of the microbes that live on or in humans—are found in the gastrointestinal (GI) tract. The gut flora contribute 99% of the genetic material in the human body. The composition of the gut flora is remarkably diverse across the population; each individual has a unique microbial footprint. Within this microbial diversity, there appears to be a stable number of genes that are responsible for the major functions of the gut flora.1 These microbes:
- supply essential nutrients by breaking down complex carbohydrates;
- generate secondary bile acids that assist in digesting fats;2
- synthesize vitamins such as K, B12, folate, and biotin;3
- contribute to the defensive barrier in the colon by keeping pathogenic bacteria from crossing the colonic mucosa; and
- interact with our systemic immune system in a way that maintains a level of homeostasis, allowing for appropriate activation in the face of pathogens without developing autoimmunity.4
The gut flora also play a role in the communication between the central nervous system and the enteric nervous system by modulating the hormonal and neural pathways that have been labeled the “gut-brain axis.” The gut-brain axis has been associated with numerous disease states, including irritable bowel syndrome and certain psychiatric disorders.5
Researchers are investigating interventions that target the microbiome to increase microbial diversity and the presence of certain species to prevent or treat various diseases. The use of probiotics and dietary changes to increase intake of soluble fiber have been the most studied of these interventions. The thought is that these interventions can correct an imbalance, or dysbiosis, of the gut flora.6 Studies have shown that decreased microbial diversity is associated with elevations of certain disease markers (eg, adiposity, insulin, triglycerides, C–reactive protein)7 and that increases in soluble fiber lead to the greatest long-term improvement in microbial diversity.8 Fecal transplant—the transfer of a processed mixture of stool that contains “healthy” bacteria from a donor into the intestines of a patient—is being explored as a method of replacing colonic gut flora, but evidence is limited.
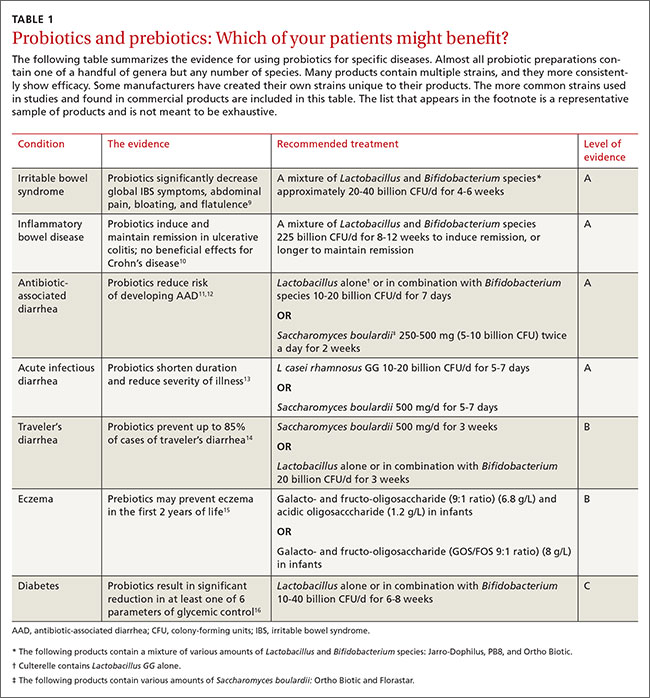
The following review takes a closer look at these options and identifies those that are most likely to benefit patients in the treatment—and prevention—of several diseases (TABLE 1).9-16
Evidence is best for using probiotics for digestive diseases
Dietary interventions for digestive diseases have long been studied, but are getting renewed attention for their potential impact on the microbiome.17 Beyond dietary modification, other similar treatment options include probiotics (live microorganisms thought to confer a beneficial effect on the host), prebiotics (non-digestible food ingredients, including oligosaccharides and inulin, thought to promote the growth of “helpful” gut flora), and synbiotics (combinations of the 2).18
Irritable bowel syndrome (IBS) is a heterogeneous disorder characterized by altered intestinal transit, low-grade colonic inflammation, and/or alterations in the gutbrain axis. Research has increasingly focused on recently discovered increases in intestinal immune activation, intestinal permeability, and alterations in the colonic microbiome (decreased diversity and increased pathogenic bacteria) associated with IBS.19
A meta-analysis of 43 randomized control trials (RCTs) found probiotics ranging from Lactobacillus to Saccharomyces can significantly decrease global IBS symptoms, abdominal pain, bloating, and flatulence.9 For a patient such as Ms. S, the evidence suggests a probiotic that contains a mixture of Lactobacillus and Bifidobacterium might help relieve her symptoms.9 In terms of dietary modifications, soluble fiber, which is already known to help treat IBS,20 has profound effects on improving microbiota diversity and in shifting the composition toward less pathogenic strains.21 The Institute of Medicine's daily recommended intake of soluble fiber is about 15 g/d.22
Inflammatory bowel disease (IBD) is caused by inflammation of the GI lining due to an overactive immune response. Evidence shows that patients with IBD have an altered microbial composition—specifically, an increase in bacteria that produce pro-inflammatory molecules and a decrease in bacteria that have a dampening effect on immune activation.23
Most studies evaluating probiotics as a treatment for IBD have been small and have used a wide variety of bacterial mixtures, which makes comparisons difficult. Recent meta-analyses found combination probiotics can both induce and maintain remission in patients with ulcerative colitis, but have no beneficial effects in Crohn’s disease.10 In a review of 9 case series of patients with IBD, fecal transplant reduced IBD symptoms, and patients were able to decrease medication use.24
Diarrheal illness. The human intestine is protected from diarrheal illness by healthy bacteria that block the actions of pathogenic bacteria. This mechanism is called colonization resistance. Moderate levels of evidence support the use of probiotics to prevent or treat several types of diarrheal illness.14
Antibiotic-associated diarrhea (AAD) is caused when antibiotic use alters the microbial balance. Recent meta-analyses have shown probiotics can prevent AAD and Clostridium difficile-associated diarrhea.11,12 Several case series and one RCT have found that fecal transplants are safe and efficacious for treating recurrent Clostridium difficile infection.25 Using probiotics to treat symptoms of AAD has been less studied.
Acute infectious diarrhea and traveler’s diarrhea (TD). A Cochrane review found that probiotics decreased the duration of diarrheal episodes by 25 hours, decreased the risk of an episode lasting more than 4 days by 59%, and led to one less diarrheal stool per day by the second day of the intervention.13 In a separate meta-analysis of 12 studies, probiotics significantly prevented 85% of cases of TD.14
Encouraging early evidence for several other illnesses
Metabolic disorders. Both animal and human studies support the theory that gut flora contribute to energy homeostasis, and in some genetically predisposed people dysbiosis may lead to obesity and diabetes. The traditional western diet4 and possibly decreased physical activity26 are major contributors to gut flora dysbiosis. Healthy bacteria in the gut break down soluble fiber into short chain fatty acids (SCFAs). SCFAs are associated with increased satiety, decreased food intake, lower levels of inflammation, and improvement in insulin signaling in adipose tissue. In addition to decreased SFCA production, dysbiosis also leads to increased lipid deposition through higher levels of lipoprotein lipase.27
Obesity. The bacteria in our gut affect energy metabolism. In patients with obesity, increased amounts of bacteria in the taxa Firmicutes and a corresponding decrease in Bacteroidetes is associated with an increased energy harvest and decreased SCFA production, which leads to a pro-inflammatory state.28 Probiotics that contain Bifidobacterium and Lactobacillus are thought to help correct this dysbiosis by increasing production of SCFAs.28
A recent meta-analysis of 4 RCTs found no significant difference between supplementation with probiotics and placebo on weight reduction.29 However, lower-quality studies with more subjects and longer duration have shown a statistically significant improvement in weight reduction with probiotic use compared to placebo.29
Diabetes. Although dietary interventions to improve glycemic control have long been an important cornerstone of treatment, probiotic supplementation to further alter gut flora composition is also being evaluated. Studies have found probiotics have largely beneficial effects on glycemic control, especially in animals. The largest systematic review to date looked at 33 studies, including 5 human trials. The human studies each found a significant reduction in at least one of 6 parameters of glycemic control (levels of fasting plasma glucose, postprandial blood glucose, glycated hemoglobin, insulin, insulin resistance, and onset of diabetes).16 It is unclear which probiotic strains confer benefit, and if those benefits are sustainable without dietary modification and increased physical activity.
Psychiatric illnesses. The gut-brain axis is thought to impact mental health by several mechanisms, including modulating the hypothalamic-pituitary-adrenal axis, activating the immune system, producing active metabolites, and affecting the vagus nerve. It is unclear which of these pathways may be clinically relevant.5,30 The few human studies that have looked for a potential link between gut flora and psychiatric illness have focused on depression and autism spectrum disorders (ASD).
Depression. Small studies comparing the microbiome composition of depressed patients vs healthy controls have found differences in patterns of both over- and underrepresented microbiota species in depressed patients, although the patterns across studies have been inconsistent.31,32 One small functional magnetic resonance imaging study of healthy women showed that a fermented milk product that contained probiotics affected activity in areas of the brain that control emotion and sensation.33 A few small studies have shown that patients who used probiotics had improved depression scores.34 Further studies are needed.
ASD. Children with ASD have GI disturbances—most commonly diarrhea, constipation, and/or bloating—more often than healthy controls.35,36 This association has led to speculation of a connection between the gut and brain. The microbial composition and diversity appears to be different in individuals with ASD; several studies have found an increase in Clostridia species.37
Research on probiotics for treating ASD has been primarily in preclinical models. Human studies of probiotics for ASD are lacking.38 Small studies on dietary modifications such as gluten-free and casein-free diets have had varying results; to what extent these dietary changes exert their influence via the intestinal microbiome is unknown.38
Eczema. Several studies have looked at the role of prebiotics and probiotics in reducing the risk for allergic disease. A 2013 Cochrane review found strong evidence that certain prebiotics can prevent eczema in children under age 2.15 There is limited evidence that probiotics may also play a role in preventing eczema.39,40 However, probiotics do not appear to be effective for treating eczema.41
Rheumatoid arthritis (RA). Patients with RA have a change in the balance of function of different T helper cells subsets, and several studies have shown that changes in the gut microbiome can affect this balance.42 A recent small study of patients with RA found that 75% of those with new onset RA had Prevotella copri bacteria as the predominant species, and patients with chronic RA had a decrease in Bacteroides species compared to healthy counterparts.42-44 The exact influence of gut flora dysbiosis on RA is unknown.45 Small studies suggest dietary changes may improve RA symptoms, while data on the use of probiotics to alleviate symptoms is mixed.46
What to tell patients about gut flora and health
There is increasing evidence that the gut microbiome and the genes contained therein have an impact on an individual’s health. (See TABLE 2 for additional resources.) The best preventive advice for patients and their families is to eat a diet rich in fruits and vegetables. This measure has well proven benefits beyond its potential effects on gut flora.

Correcting dysbiosis with diet or probiotics may play a role in treating chronic conditions; however, in many cases, further research is required to elucidate specific recommendations. In the meantime, given the safety profile of probiotics and dietary fiber, it is reasonable to consider using these interventions, particularly probiotics for treating IBS, ulcerative colitis, and acute infectious diarrhea; probiotics for preventing antibiotic-associated diarrhea and traveler’s diarrhea; and prebiotics for preventing eczema in high-risk infants.
CORRESPONDENCE
Jill Schneiderhan, MD, Family Medicine at Domino’s Farms, 24 Frank Lloyd Wright Dr., Lobby H, Suite 2300, Ann Arbor, MI 48105; [email protected].
1. Human Microbiome Project Consortium. Structure, function and diversity of the healthy human microbiome. Nature. 2012;486(7402):207-214.
2. Conlon MA, Bird AR. The impact of diet and lifestyle on gut microbiota and human health. Nutrients. 2015;7:17-44.
3. Nicholson JK, Holmes E, Kinross J, et al. Host-gut microbiota metabolic interactions. Science. 2012;336:1262-1267.
4. Zhang YJ, Li S, Gan RY, et al. Impacts of gut bacteria on human health and diseases. Int J Mol Sci. 2015;16:7493-7519.
5. Tillisch K. The effects of gut microbiota on CNS function in humans. Gut Microbes. 2014;5:404-410.
6. Belizario JE, Napolitano M. Human microbiomes and their roles in dysbiosis, common diseases, and novel therapeutic approaches. Front Microbiol. 2015;6:1050.
7. Le Chatelier E, Nielsen T, Qin J, et al. Richness of human gut microbiome correlates with metabolic markers. Nature. 2013;500:541-546.
8. Cotillard A, Kennedy SP, Kong LC, et al. Dietary intervention impact on gut microbial gene richness. Nature. 2013;500:585-588.
9. Ford AC, Quigley EM, Lacy BE, et al. Efficacy of prebiotics, probiotics, and synbiotics in irritable bowel syndrome and chronic idiopathic constipation: systematic review and meta-analysis. Am J Gastroenterol. 2014;109:1547-1561; quiz 1546,1562.
10. Fujiya M, Ueno N, Kohgo Y. Probiotic treatments for induction and maintenance of remission in inflammatory bowel diseases: a meta-analysis of randomized controlled trials. Clin J Gastroenterol. 2014;7(1):1-13.
11. Hempel S, Newberry SJ, Maher AR, et al. Probiotics for the prevention and treatment of antibiotic-associated diarrhea: a systematic review and meta-analysis. JAMA. 2012;307:1959-1969.
12. Szajewska H, Kolodziej M. Systematic review with meta-analysis: Saccharomyces boulardii in the prevention of antibiotic-associated diarrhoea. Aliment Pharmacol Ther. 2015;42:793–801.
13. Allen SJ, Martinez EG, Gregorio GV, et al. Probiotics for treating acute infectious diarrhoea. Cochrane Database Syst Rev. 2010(11):CD003048.
14. McFarland LV. Meta-analysis of probiotics for the prevention of traveler’s diarrhea. Travel Med Infect Dis. 2007;5:97-105.
15. Osborn DA, Sinn JK. Prebiotics in infants for prevention of allergy. The Cochrane Library. 2013. Cochrane Database Syst Rev. 2013;3:CD006474.
16. Razmpoosh E, Javadi M, Ejtahed HS, et al. Probiotics as beneficial agents in the management of diabetes mellitus: a systematic review. Diabetes Metab Res Rev. 2015. [Epub ahead of print].
17. Aguirre M, Eck A, Savelkoul PH, et al. Diet drives quick changes in the metabolic activity and composition of human gut microbiota in a validated in vitro gut model. Res Microbiol. 2015. [Epub ahead of print].
18. Neish AS. Microbes in gastrointestinal health and disease. Gastroenterology. 2009;136:65-80.
19. Chey WD, Kurlander J, Eswaran S. Irritable bowel syndrome: a clinical review. JAMA. 2015;313:949-958.
20. Moayyedi P, Quigley EM, Lacy BE, et al. The effect of fiber supplementation on irritable bowel syndrome: a systematic review and meta-analysis. Am J Gastroenterol. 2014;109:1367-1374.
21. Simpson HL, Campbell BJ. Review article: dietary fibre-microbiota interactions. Aliment Pharmacol Ther. 2015;42:158-179.
22. Otten JJ, Hellwig JP, Meyers LD; Institute of Medicine of the National Academies. Dietary Reference Intakes: The essential guide to nutrient requirements. 2006. US Department of Agriculture Web site. Available at: http://www.nal.usda.gov/fnic/DRI/Essential_Guide/DRIEssentialGuideNutReq.pdf. Accessed December 8, 2015.
23. Hansen JJ, Sartor RB. Therapeutic manipulation of the microbiome in IBD: current results and future approaches. Curr Treat Options Gastroenterol. 2015;13:105-120.
24. Anderson JL, Edney RJ, Whelan K. Systematic review: faecal microbiota transplantation in the management of inflammatory bowel disease. Aliment Pharmacol Ther. 2012;36:503-516.
25. Cammarota G, Ianiro G, Gasbarrini A. Fecal microbiota transplantation for the treatment of Clostridium difficile infection: a systematic review. J Clin Gastroenterol. 2014;48:693-702.
26. Bermon S, Petriz B, Kajeniene A, et al. The microbiota: an exercise immunology perspective. Exerc Immunol Rev. 2015;21:70-79.
27. Hur KY, Lee MS. Gut microbiota and metabolic disorders. Diabetes Metab J. 2015;39:198-203.
28. Devaraj S, Hemarajata P, Versalovic J. The human gut microbiome and body metabolism: implications for obesity and diabetes. Clin Chem. 2013;59:617-628.
29. Park S, Bae JH. Probiotics for weight loss: a systematic review and meta-analysis. Nutr Res. 2015;35:566-575.
30. Petra AI, Panagiotidou S, Hatziagelaki E, et al. Gut-microbiotabrain axis and its effect on neuropsychiatric disorders with suspected immune dysregulation. Clin Ther. 2015;37:984-995.
31. Jiang H, Ling Z, Zhang Y, et al. Altered fecal microbiota composition in patients with major depressive disorder. Brain Behav Immun. 2015;48:186-194.
32. Naseribafrouei A, Hestad K, Avershina E, et al. Correlation between the human fecal microbiota and depression. Neurogastroenterol Motil. 2014;26:1155-1162.
33. Tillisch K, Labus J, Kilpatrick L, et al. Consumption of fermented milk product with probiotic modulates brain activity. Gastroenterology. 2013;144:1394-1401.
34. Bested AC, Logan AC, Selhub EM. Intestinal microbiota, probiotics and mental health: from Metchnikoff to modern advances: part III - convergence toward clinical trials. Gut Pathog. 2013;5:4.
35. Krajmalnik-Brown R, Lozupone C, Kang DW, et al. Gut bacteria in children with autism spectrum disorders: challenges and promise of studying how a complex community influences a complex disease. Microb Ecol Health Dis. 2015;26:26914.
36. Buie T. Potential etiologic factors of microbiome disruption in autism. Clin Ther. 2015;37:976-983.
37. Cao X, Lin P, Jiang P, et al. Characteristics of the gastrointestinal microbiome in children with autism spectrum disorder: a systematic review. Shanghai Arch Psychiatry. 2013;25:342-353.
38. Frye RE, Slattery J, MacFabe DF, et al. Approaches to studying and manipulating the enteric microbiome to improve autism symptoms. Microb Ecol Health Dis. 2015;26:26878.
39. Osborn DA, Sinn JK. Probiotics in infants for prevention of allergic disease and food hypersensitivity. Cochrane Database Syst Rev. 2007;(4):CD006475.
40. Tang ML, Lahtinen SJ, Boyle RJ. Probiotics and prebiotics: clinical effects in allergic disease. Curr Opin Pediatr. 2010;22:626-634.
41. Boyle RJ, Bath-Hextall FJ, Leonardi-Bee J, et al. Probiotics for treating eczema. Cochrane Database Syst Rev. 2008;(4):CD006135.
42. Rogier R, Koenders MI, Abdollahi-Roodsaz S. Toll-like receptor mediated modulation of T cell response by commensal intestinal microbiota as a trigger for autoimmune arthritis. J Immunol Res. 2015;2015:527696.
43. Perez-Santiago Ja, Gianella Sa, Massanella Ma, et al. Gut Lactobacillales are associated with higher CD4 and less microbial translocation during HIV infection. AIDS. 2013;27:1921-1931.
44. Scher JU, Sczesnak A, Longman RS, et al. Expansion of intestinal Prevotella copri correlates with enhanced susceptibility to arthritis. Elife. 2013;2:e01202.
45. Scofield RH. Rheumatic diseases and the microbiome. Int J Rheum Dis. 2014;17:489-492.
46. Sandhya P, Danda D, Sharma D, et al. Does the buck stop with the bugs?: an overview of microbial dysbiosis in rheumatoid arthritis. Int J Rheum Dis. 2015. [Epub ahead of print].
› Encourage patients to eat a healthy diet that includes an adequate amount of soluble fiber to maintain a healthy, diverse microbiome. B
› Recommend combination probiotics to treat symptoms of irritable bowel syndrome. A
› Encourage patients to take probiotics containing Lactobacillus species to prevent antibiotic-associated diarrhea and Saccharomyces to prevent Clostridium difficile infection. A
› Recommend probiotics containing Lactobacillus species and/or Saccharomyces to treat acute infectious diarrhea. A
Strength of recommendation (SOR)
A Good-quality patient-oriented evidence
B Inconsistent or limited-quality patient-oriented evidence
C Consensus, usual practice, opinion, disease-oriented evidence, case series
CASE 1 › Sheila S, age 27, has irritable bowel syndrome (IBS) and comes to your office for a follow-up visit. Over the past 6 months she has started taking a fiber supplement, drinking more water, and looking for links between stress and her symptoms. She has read about probiotics and wonders if you would consider recommending them in her situation.
CASE 2 › Mark M, age 45, has type 2 diabetes and is overweight. He is motivated to change his diet and has started to exercise more. He is taking metformin 2000 mg/d but his hemoglobin A1c remains slightly elevated at 7.2%. He heard on television that probiotics might help to keep him from needing to add another medication.
Most of the living organisms that comprise the human microbiome—all of the microbes that live on or in humans—are found in the gastrointestinal (GI) tract. The gut flora contribute 99% of the genetic material in the human body. The composition of the gut flora is remarkably diverse across the population; each individual has a unique microbial footprint. Within this microbial diversity, there appears to be a stable number of genes that are responsible for the major functions of the gut flora.1 These microbes:
- supply essential nutrients by breaking down complex carbohydrates;
- generate secondary bile acids that assist in digesting fats;2
- synthesize vitamins such as K, B12, folate, and biotin;3
- contribute to the defensive barrier in the colon by keeping pathogenic bacteria from crossing the colonic mucosa; and
- interact with our systemic immune system in a way that maintains a level of homeostasis, allowing for appropriate activation in the face of pathogens without developing autoimmunity.4
The gut flora also play a role in the communication between the central nervous system and the enteric nervous system by modulating the hormonal and neural pathways that have been labeled the “gut-brain axis.” The gut-brain axis has been associated with numerous disease states, including irritable bowel syndrome and certain psychiatric disorders.5
Researchers are investigating interventions that target the microbiome to increase microbial diversity and the presence of certain species to prevent or treat various diseases. The use of probiotics and dietary changes to increase intake of soluble fiber have been the most studied of these interventions. The thought is that these interventions can correct an imbalance, or dysbiosis, of the gut flora.6 Studies have shown that decreased microbial diversity is associated with elevations of certain disease markers (eg, adiposity, insulin, triglycerides, C–reactive protein)7 and that increases in soluble fiber lead to the greatest long-term improvement in microbial diversity.8 Fecal transplant—the transfer of a processed mixture of stool that contains “healthy” bacteria from a donor into the intestines of a patient—is being explored as a method of replacing colonic gut flora, but evidence is limited.
The following review takes a closer look at these options and identifies those that are most likely to benefit patients in the treatment—and prevention—of several diseases (TABLE 1).9-16
Evidence is best for using probiotics for digestive diseases
Dietary interventions for digestive diseases have long been studied, but are getting renewed attention for their potential impact on the microbiome.17 Beyond dietary modification, other similar treatment options include probiotics (live microorganisms thought to confer a beneficial effect on the host), prebiotics (non-digestible food ingredients, including oligosaccharides and inulin, thought to promote the growth of “helpful” gut flora), and synbiotics (combinations of the 2).18
Irritable bowel syndrome (IBS) is a heterogeneous disorder characterized by altered intestinal transit, low-grade colonic inflammation, and/or alterations in the gutbrain axis. Research has increasingly focused on recently discovered increases in intestinal immune activation, intestinal permeability, and alterations in the colonic microbiome (decreased diversity and increased pathogenic bacteria) associated with IBS.19
A meta-analysis of 43 randomized control trials (RCTs) found probiotics ranging from Lactobacillus to Saccharomyces can significantly decrease global IBS symptoms, abdominal pain, bloating, and flatulence.9 For a patient such as Ms. S, the evidence suggests a probiotic that contains a mixture of Lactobacillus and Bifidobacterium might help relieve her symptoms.9 In terms of dietary modifications, soluble fiber, which is already known to help treat IBS,20 has profound effects on improving microbiota diversity and in shifting the composition toward less pathogenic strains.21 The Institute of Medicine's daily recommended intake of soluble fiber is about 15 g/d.22
Inflammatory bowel disease (IBD) is caused by inflammation of the GI lining due to an overactive immune response. Evidence shows that patients with IBD have an altered microbial composition—specifically, an increase in bacteria that produce pro-inflammatory molecules and a decrease in bacteria that have a dampening effect on immune activation.23
Most studies evaluating probiotics as a treatment for IBD have been small and have used a wide variety of bacterial mixtures, which makes comparisons difficult. Recent meta-analyses found combination probiotics can both induce and maintain remission in patients with ulcerative colitis, but have no beneficial effects in Crohn’s disease.10 In a review of 9 case series of patients with IBD, fecal transplant reduced IBD symptoms, and patients were able to decrease medication use.24
Diarrheal illness. The human intestine is protected from diarrheal illness by healthy bacteria that block the actions of pathogenic bacteria. This mechanism is called colonization resistance. Moderate levels of evidence support the use of probiotics to prevent or treat several types of diarrheal illness.14
Antibiotic-associated diarrhea (AAD) is caused when antibiotic use alters the microbial balance. Recent meta-analyses have shown probiotics can prevent AAD and Clostridium difficile-associated diarrhea.11,12 Several case series and one RCT have found that fecal transplants are safe and efficacious for treating recurrent Clostridium difficile infection.25 Using probiotics to treat symptoms of AAD has been less studied.
Acute infectious diarrhea and traveler’s diarrhea (TD). A Cochrane review found that probiotics decreased the duration of diarrheal episodes by 25 hours, decreased the risk of an episode lasting more than 4 days by 59%, and led to one less diarrheal stool per day by the second day of the intervention.13 In a separate meta-analysis of 12 studies, probiotics significantly prevented 85% of cases of TD.14
Encouraging early evidence for several other illnesses
Metabolic disorders. Both animal and human studies support the theory that gut flora contribute to energy homeostasis, and in some genetically predisposed people dysbiosis may lead to obesity and diabetes. The traditional western diet4 and possibly decreased physical activity26 are major contributors to gut flora dysbiosis. Healthy bacteria in the gut break down soluble fiber into short chain fatty acids (SCFAs). SCFAs are associated with increased satiety, decreased food intake, lower levels of inflammation, and improvement in insulin signaling in adipose tissue. In addition to decreased SFCA production, dysbiosis also leads to increased lipid deposition through higher levels of lipoprotein lipase.27
Obesity. The bacteria in our gut affect energy metabolism. In patients with obesity, increased amounts of bacteria in the taxa Firmicutes and a corresponding decrease in Bacteroidetes is associated with an increased energy harvest and decreased SCFA production, which leads to a pro-inflammatory state.28 Probiotics that contain Bifidobacterium and Lactobacillus are thought to help correct this dysbiosis by increasing production of SCFAs.28
A recent meta-analysis of 4 RCTs found no significant difference between supplementation with probiotics and placebo on weight reduction.29 However, lower-quality studies with more subjects and longer duration have shown a statistically significant improvement in weight reduction with probiotic use compared to placebo.29
Diabetes. Although dietary interventions to improve glycemic control have long been an important cornerstone of treatment, probiotic supplementation to further alter gut flora composition is also being evaluated. Studies have found probiotics have largely beneficial effects on glycemic control, especially in animals. The largest systematic review to date looked at 33 studies, including 5 human trials. The human studies each found a significant reduction in at least one of 6 parameters of glycemic control (levels of fasting plasma glucose, postprandial blood glucose, glycated hemoglobin, insulin, insulin resistance, and onset of diabetes).16 It is unclear which probiotic strains confer benefit, and if those benefits are sustainable without dietary modification and increased physical activity.
Psychiatric illnesses. The gut-brain axis is thought to impact mental health by several mechanisms, including modulating the hypothalamic-pituitary-adrenal axis, activating the immune system, producing active metabolites, and affecting the vagus nerve. It is unclear which of these pathways may be clinically relevant.5,30 The few human studies that have looked for a potential link between gut flora and psychiatric illness have focused on depression and autism spectrum disorders (ASD).
Depression. Small studies comparing the microbiome composition of depressed patients vs healthy controls have found differences in patterns of both over- and underrepresented microbiota species in depressed patients, although the patterns across studies have been inconsistent.31,32 One small functional magnetic resonance imaging study of healthy women showed that a fermented milk product that contained probiotics affected activity in areas of the brain that control emotion and sensation.33 A few small studies have shown that patients who used probiotics had improved depression scores.34 Further studies are needed.
ASD. Children with ASD have GI disturbances—most commonly diarrhea, constipation, and/or bloating—more often than healthy controls.35,36 This association has led to speculation of a connection between the gut and brain. The microbial composition and diversity appears to be different in individuals with ASD; several studies have found an increase in Clostridia species.37
Research on probiotics for treating ASD has been primarily in preclinical models. Human studies of probiotics for ASD are lacking.38 Small studies on dietary modifications such as gluten-free and casein-free diets have had varying results; to what extent these dietary changes exert their influence via the intestinal microbiome is unknown.38
Eczema. Several studies have looked at the role of prebiotics and probiotics in reducing the risk for allergic disease. A 2013 Cochrane review found strong evidence that certain prebiotics can prevent eczema in children under age 2.15 There is limited evidence that probiotics may also play a role in preventing eczema.39,40 However, probiotics do not appear to be effective for treating eczema.41
Rheumatoid arthritis (RA). Patients with RA have a change in the balance of function of different T helper cells subsets, and several studies have shown that changes in the gut microbiome can affect this balance.42 A recent small study of patients with RA found that 75% of those with new onset RA had Prevotella copri bacteria as the predominant species, and patients with chronic RA had a decrease in Bacteroides species compared to healthy counterparts.42-44 The exact influence of gut flora dysbiosis on RA is unknown.45 Small studies suggest dietary changes may improve RA symptoms, while data on the use of probiotics to alleviate symptoms is mixed.46
What to tell patients about gut flora and health
There is increasing evidence that the gut microbiome and the genes contained therein have an impact on an individual’s health. (See TABLE 2 for additional resources.) The best preventive advice for patients and their families is to eat a diet rich in fruits and vegetables. This measure has well proven benefits beyond its potential effects on gut flora.
Correcting dysbiosis with diet or probiotics may play a role in treating chronic conditions; however, in many cases, further research is required to elucidate specific recommendations. In the meantime, given the safety profile of probiotics and dietary fiber, it is reasonable to consider using these interventions, particularly probiotics for treating IBS, ulcerative colitis, and acute infectious diarrhea; probiotics for preventing antibiotic-associated diarrhea and traveler’s diarrhea; and prebiotics for preventing eczema in high-risk infants.
CORRESPONDENCE
Jill Schneiderhan, MD, Family Medicine at Domino’s Farms, 24 Frank Lloyd Wright Dr., Lobby H, Suite 2300, Ann Arbor, MI 48105; [email protected].
1. Human Microbiome Project Consortium. Structure, function and diversity of the healthy human microbiome. Nature. 2012;486(7402):207-214.
2. Conlon MA, Bird AR. The impact of diet and lifestyle on gut microbiota and human health. Nutrients. 2015;7:17-44.
3. Nicholson JK, Holmes E, Kinross J, et al. Host-gut microbiota metabolic interactions. Science. 2012;336:1262-1267.
4. Zhang YJ, Li S, Gan RY, et al. Impacts of gut bacteria on human health and diseases. Int J Mol Sci. 2015;16:7493-7519.
5. Tillisch K. The effects of gut microbiota on CNS function in humans. Gut Microbes. 2014;5:404-410.
6. Belizario JE, Napolitano M. Human microbiomes and their roles in dysbiosis, common diseases, and novel therapeutic approaches. Front Microbiol. 2015;6:1050.
7. Le Chatelier E, Nielsen T, Qin J, et al. Richness of human gut microbiome correlates with metabolic markers. Nature. 2013;500:541-546.
8. Cotillard A, Kennedy SP, Kong LC, et al. Dietary intervention impact on gut microbial gene richness. Nature. 2013;500:585-588.
9. Ford AC, Quigley EM, Lacy BE, et al. Efficacy of prebiotics, probiotics, and synbiotics in irritable bowel syndrome and chronic idiopathic constipation: systematic review and meta-analysis. Am J Gastroenterol. 2014;109:1547-1561; quiz 1546,1562.
10. Fujiya M, Ueno N, Kohgo Y. Probiotic treatments for induction and maintenance of remission in inflammatory bowel diseases: a meta-analysis of randomized controlled trials. Clin J Gastroenterol. 2014;7(1):1-13.
11. Hempel S, Newberry SJ, Maher AR, et al. Probiotics for the prevention and treatment of antibiotic-associated diarrhea: a systematic review and meta-analysis. JAMA. 2012;307:1959-1969.
12. Szajewska H, Kolodziej M. Systematic review with meta-analysis: Saccharomyces boulardii in the prevention of antibiotic-associated diarrhoea. Aliment Pharmacol Ther. 2015;42:793–801.
13. Allen SJ, Martinez EG, Gregorio GV, et al. Probiotics for treating acute infectious diarrhoea. Cochrane Database Syst Rev. 2010(11):CD003048.
14. McFarland LV. Meta-analysis of probiotics for the prevention of traveler’s diarrhea. Travel Med Infect Dis. 2007;5:97-105.
15. Osborn DA, Sinn JK. Prebiotics in infants for prevention of allergy. The Cochrane Library. 2013. Cochrane Database Syst Rev. 2013;3:CD006474.
16. Razmpoosh E, Javadi M, Ejtahed HS, et al. Probiotics as beneficial agents in the management of diabetes mellitus: a systematic review. Diabetes Metab Res Rev. 2015. [Epub ahead of print].
17. Aguirre M, Eck A, Savelkoul PH, et al. Diet drives quick changes in the metabolic activity and composition of human gut microbiota in a validated in vitro gut model. Res Microbiol. 2015. [Epub ahead of print].
18. Neish AS. Microbes in gastrointestinal health and disease. Gastroenterology. 2009;136:65-80.
19. Chey WD, Kurlander J, Eswaran S. Irritable bowel syndrome: a clinical review. JAMA. 2015;313:949-958.
20. Moayyedi P, Quigley EM, Lacy BE, et al. The effect of fiber supplementation on irritable bowel syndrome: a systematic review and meta-analysis. Am J Gastroenterol. 2014;109:1367-1374.
21. Simpson HL, Campbell BJ. Review article: dietary fibre-microbiota interactions. Aliment Pharmacol Ther. 2015;42:158-179.
22. Otten JJ, Hellwig JP, Meyers LD; Institute of Medicine of the National Academies. Dietary Reference Intakes: The essential guide to nutrient requirements. 2006. US Department of Agriculture Web site. Available at: http://www.nal.usda.gov/fnic/DRI/Essential_Guide/DRIEssentialGuideNutReq.pdf. Accessed December 8, 2015.
23. Hansen JJ, Sartor RB. Therapeutic manipulation of the microbiome in IBD: current results and future approaches. Curr Treat Options Gastroenterol. 2015;13:105-120.
24. Anderson JL, Edney RJ, Whelan K. Systematic review: faecal microbiota transplantation in the management of inflammatory bowel disease. Aliment Pharmacol Ther. 2012;36:503-516.
25. Cammarota G, Ianiro G, Gasbarrini A. Fecal microbiota transplantation for the treatment of Clostridium difficile infection: a systematic review. J Clin Gastroenterol. 2014;48:693-702.
26. Bermon S, Petriz B, Kajeniene A, et al. The microbiota: an exercise immunology perspective. Exerc Immunol Rev. 2015;21:70-79.
27. Hur KY, Lee MS. Gut microbiota and metabolic disorders. Diabetes Metab J. 2015;39:198-203.
28. Devaraj S, Hemarajata P, Versalovic J. The human gut microbiome and body metabolism: implications for obesity and diabetes. Clin Chem. 2013;59:617-628.
29. Park S, Bae JH. Probiotics for weight loss: a systematic review and meta-analysis. Nutr Res. 2015;35:566-575.
30. Petra AI, Panagiotidou S, Hatziagelaki E, et al. Gut-microbiotabrain axis and its effect on neuropsychiatric disorders with suspected immune dysregulation. Clin Ther. 2015;37:984-995.
31. Jiang H, Ling Z, Zhang Y, et al. Altered fecal microbiota composition in patients with major depressive disorder. Brain Behav Immun. 2015;48:186-194.
32. Naseribafrouei A, Hestad K, Avershina E, et al. Correlation between the human fecal microbiota and depression. Neurogastroenterol Motil. 2014;26:1155-1162.
33. Tillisch K, Labus J, Kilpatrick L, et al. Consumption of fermented milk product with probiotic modulates brain activity. Gastroenterology. 2013;144:1394-1401.
34. Bested AC, Logan AC, Selhub EM. Intestinal microbiota, probiotics and mental health: from Metchnikoff to modern advances: part III - convergence toward clinical trials. Gut Pathog. 2013;5:4.
35. Krajmalnik-Brown R, Lozupone C, Kang DW, et al. Gut bacteria in children with autism spectrum disorders: challenges and promise of studying how a complex community influences a complex disease. Microb Ecol Health Dis. 2015;26:26914.
36. Buie T. Potential etiologic factors of microbiome disruption in autism. Clin Ther. 2015;37:976-983.
37. Cao X, Lin P, Jiang P, et al. Characteristics of the gastrointestinal microbiome in children with autism spectrum disorder: a systematic review. Shanghai Arch Psychiatry. 2013;25:342-353.
38. Frye RE, Slattery J, MacFabe DF, et al. Approaches to studying and manipulating the enteric microbiome to improve autism symptoms. Microb Ecol Health Dis. 2015;26:26878.
39. Osborn DA, Sinn JK. Probiotics in infants for prevention of allergic disease and food hypersensitivity. Cochrane Database Syst Rev. 2007;(4):CD006475.
40. Tang ML, Lahtinen SJ, Boyle RJ. Probiotics and prebiotics: clinical effects in allergic disease. Curr Opin Pediatr. 2010;22:626-634.
41. Boyle RJ, Bath-Hextall FJ, Leonardi-Bee J, et al. Probiotics for treating eczema. Cochrane Database Syst Rev. 2008;(4):CD006135.
42. Rogier R, Koenders MI, Abdollahi-Roodsaz S. Toll-like receptor mediated modulation of T cell response by commensal intestinal microbiota as a trigger for autoimmune arthritis. J Immunol Res. 2015;2015:527696.
43. Perez-Santiago Ja, Gianella Sa, Massanella Ma, et al. Gut Lactobacillales are associated with higher CD4 and less microbial translocation during HIV infection. AIDS. 2013;27:1921-1931.
44. Scher JU, Sczesnak A, Longman RS, et al. Expansion of intestinal Prevotella copri correlates with enhanced susceptibility to arthritis. Elife. 2013;2:e01202.
45. Scofield RH. Rheumatic diseases and the microbiome. Int J Rheum Dis. 2014;17:489-492.
46. Sandhya P, Danda D, Sharma D, et al. Does the buck stop with the bugs?: an overview of microbial dysbiosis in rheumatoid arthritis. Int J Rheum Dis. 2015. [Epub ahead of print].

Pediatric Dermatology Consult - January 2016
By Ellen S. Haddock and Lawrence F. Eichenfield, M.D.
Urticaria multiforme
Although not the most classic presentation, this patient’s migrating rash is most consistent with urticaria (hives). Urticaria is dermal edema which causes transient edematous and usually pruritic wheals.1,2 Each individual lesion lasts less than 24 hours and disappears without leaving a mark. Urticaria is caused by mast cell activation, which leads to release of antihistamines and other substances that increase capillary and venule permeability, allowing fluid to leak into the extravascular space.1 In children, mast cell activation is usually triggered by infections, drugs, or foods.1
Classic urticaria consists of large, pruritic plaques and may be associated with airway edema. However, urticaria also can present with annular and polycyclic lesions, which may be less pruritic and are not associated with airway edema.3 This “multiple redness” is distinct from erythema multiforme (EM), although often urticaria is confused with EM. Lesions of EM are annular and typically have purpuric or dusky centers, with each lesion lasting a minimum of 1 week.4 Annular lesions in urticaria usually do not have central duskiness or blisters. Often the centers of annular urticaria lesions are relatively normal and edges are raised. Some urticaria, especially in younger children as in this case, is sometimes called “urticaria multiforme” because the ecchymotic centers are reminiscent of, but distinct from, classic target lesions of EM. Urticaria multiforme is commonly misdiagnosed as EM, with 29% of patients originally misdiagnosed in one study.3
Urticaria multiforme occurs most commonly in infants and preschool-aged children,5 although it has been diagnosed in patients as old as 18 years.6 Patients often have had an antecedent bacterial or viral illness, recent treatment with antibiotics, or recent vaccination (67%, 44%, and 11% of patients, respectively, in one series).4 In contrast with classic urticaria, urticaria multiforme has not been associated with food allergy.4
In this case, urticaria multiforme was likely caused by a hypersensitivity reaction to amoxicillin. A reaction to nitrofurantoin was less likely because the patient had been taking it continuously for months without any complications.
Differential diagnosis

The differential diagnosis for urticaria multiforme includes EM and a serum sickness–like reaction. The main clue that this patient’s rash was a subtype of urticaria rather than EM was its transience, with individual lesions appearing and disappearing in less than a day.4 In contrast, the lesions of EM are fixed, persisting for a week or longer. While urticaria multiforme may have central ecchymosis (termed “hemorrhagic urticaria”) that looks similar to the dusky centers of EM lesions and persists longer than the transient edematous plaques,1 it resolves quickly with appropriate treatment.4 In contrast, the dusky centers of EM, which are caused by epidermal necrosis, take longer to resolve.4 Dermatographism, if present, would support a diagnosis of urticaria rather than EM. Similarly, facial or acral edema, if present, would support a diagnosis of urticaria multiforme; they are uncommon in EM. In contrast, any necrosis, blistering, or erosions in the centers of the annular lesions or on mucosal membranes would suggest EM, as necrosis, blistering, erosions, and mucosal involvement do not occur in urticaria multiforme.4 We stress that in EM, “the center of the lesion is the center of the action,” while in urticaria, wheals often have relatively normal centers.
Although both urticaria and EM lesions may be pruritic, any burning sensation is more suggestive of EM.4 Urticaria multiforme is often associated with antibiotics, vaccinations, and upper respiratory infections, while EM is most commonly associated with herpes simplex infection.4,7
Urticaria multiforme also may appear similar to a serum sickness–like reaction, which is another kind of hypersensitivity reaction triggered by the administration of antibiotics. It is most commonly associated with cefaclor, but also is associated with other antibiotics including amoxicillin.8 As with urticaria, hypersensitivity drug eruptions and serum sickness-like reactions may present with purpuric, polycyclic wheals with central clearing. However, as with EM, the lesions of serum sickness–like reactions are fixed, lasting for days to weeks.4 Facial or acral angioedema may occur in both urticaria multiforme and serum sickness–like reactions, but serum sickness–like reactions are not associated with dermatographism.4 Furthermore, serum sickness–like reactions are typically associated with high-grade fever, myalgia, arthralgia, and lymphadenopathy, which are not seen in urticaria multiforme.4,5
Diagnosis of urticaria multiforme usually can be made by history and physical exam, so lab testing and skin biopsy typically are not necessary.5 If performed, lab work may show modest elevation in erythrocyte sedimentation rate and C-reactive protein, but often these acute-phase reactants are within normal limits, and complete blood count and complete metabolic panel are unremarkable.3,5 Although urticaria multiforme often is associated with antecedent viral or bacterial infections, work-up for infectious etiology typically is not fruitful or helpful.4 If lesions are biopsied, the histology of urticaria multiforme is indistinguishable from other types of acute urticaria, showing dermal edema with perivascular lymphocytic infiltrate.9 In contrast, EM shows exocytosis, spongiosis, and epidermal necrosis.9
Treatment
The first step in managing urticaria multiforme is discontinuing any unnecessary antibiotic that could be triggering the hypersensitivity reaction. Urticaria multiforme typically resolves within 2 weeks without any treatment and responds to treatment with antihistamines within 24-28 hours.5 Treatment with a histamine1 (H1) blocker such as hydroxyzine, cetirizine, or diphenhydramine may be sufficient to resolve the eruption, but combination therapy with both an H1 blocker and an H2 blocker such as ranitidine can be helpful.4 Treatment with systemic corticosteroids usually is not necessary and should be reserved for severely symptomatic or refractory cases.4,9
One of the reasons that it is important to distinguish urticaria multiforme from EM is to avoid overtreatment with systemic steroids,3 which are rarely required for urticaria multiforme but are sometimes useful, although controversial, for EM.1 Additionally, the correct diagnosis is important for providing anticipatory guidance.6 Patients diagnosed with serum sickness–like reactions should be counseled to avoid unnecessary exposure to the culprit antibiotic in the future. Patients with urticaria multiforme who were taking an antibiotic at the onset of the eruption may consider avoiding the potential culprit antibiotic in the future, but it is important to keep in mind that urticaria multiforme is more strongly associated with antecedent infection than with antibiotic use, and so antibiotic avoidance may not be necessary unless justified by formal allergy testing. EM minor is more commonly associated with a herpes simplex virus infection than a drug reaction, so antibiotic use is less concerning, but patients should be counseled that recurrence is common and prophylactic treatment with acyclovir may be advised for recurrent disease.1
References
- “Neonatal and Infant Dermatology” (Elsevier Health Sciences: New York, 2014, pp. 456-70).
- CRIAI. 2006;30(1):003-012.
- Pediatr Dermatol. 1997;14(3):231-4.
- Pediatrics. 2007;119(5):e1177-83.
- Pediatr Dermatol. 2011;28(4):436-8.
- The Journal of Allergy and Clinical Immunology in Practice. 2013;1(5):520-1.
- Arch Dermatol. 1993;129(1):92-6.
- “The Hypersensitivity Syndromes” in Hurwitz Clinical Pediatric Dermatology. 4 ed. Elsevier: New York, 2011, pp. 455-84.
- J Clin Aesthet Dermatol. 2013;6(3):34-9.
Ms. Haddock is a medical student at University of California, San Diego School of Medicine and a research associate at Rady Children’s Hospital, San Diego. Dr. Eichenfield is chief of pediatric and adolescent dermatology at Rady Children’s Hospital-San Diego and professor of medicine and pediatrics at UC San Diego School of Medicine. Dr. Eichenfield and Ms. Haddock said they have no relevant financial disclosures. Email [email protected].
By Ellen S. Haddock and Lawrence F. Eichenfield, M.D.
Urticaria multiforme
Although not the most classic presentation, this patient’s migrating rash is most consistent with urticaria (hives). Urticaria is dermal edema which causes transient edematous and usually pruritic wheals.1,2 Each individual lesion lasts less than 24 hours and disappears without leaving a mark. Urticaria is caused by mast cell activation, which leads to release of antihistamines and other substances that increase capillary and venule permeability, allowing fluid to leak into the extravascular space.1 In children, mast cell activation is usually triggered by infections, drugs, or foods.1
Classic urticaria consists of large, pruritic plaques and may be associated with airway edema. However, urticaria also can present with annular and polycyclic lesions, which may be less pruritic and are not associated with airway edema.3 This “multiple redness” is distinct from erythema multiforme (EM), although often urticaria is confused with EM. Lesions of EM are annular and typically have purpuric or dusky centers, with each lesion lasting a minimum of 1 week.4 Annular lesions in urticaria usually do not have central duskiness or blisters. Often the centers of annular urticaria lesions are relatively normal and edges are raised. Some urticaria, especially in younger children as in this case, is sometimes called “urticaria multiforme” because the ecchymotic centers are reminiscent of, but distinct from, classic target lesions of EM. Urticaria multiforme is commonly misdiagnosed as EM, with 29% of patients originally misdiagnosed in one study.3
Urticaria multiforme occurs most commonly in infants and preschool-aged children,5 although it has been diagnosed in patients as old as 18 years.6 Patients often have had an antecedent bacterial or viral illness, recent treatment with antibiotics, or recent vaccination (67%, 44%, and 11% of patients, respectively, in one series).4 In contrast with classic urticaria, urticaria multiforme has not been associated with food allergy.4
In this case, urticaria multiforme was likely caused by a hypersensitivity reaction to amoxicillin. A reaction to nitrofurantoin was less likely because the patient had been taking it continuously for months without any complications.
Differential diagnosis
The differential diagnosis for urticaria multiforme includes EM and a serum sickness–like reaction. The main clue that this patient’s rash was a subtype of urticaria rather than EM was its transience, with individual lesions appearing and disappearing in less than a day.4 In contrast, the lesions of EM are fixed, persisting for a week or longer. While urticaria multiforme may have central ecchymosis (termed “hemorrhagic urticaria”) that looks similar to the dusky centers of EM lesions and persists longer than the transient edematous plaques,1 it resolves quickly with appropriate treatment.4 In contrast, the dusky centers of EM, which are caused by epidermal necrosis, take longer to resolve.4 Dermatographism, if present, would support a diagnosis of urticaria rather than EM. Similarly, facial or acral edema, if present, would support a diagnosis of urticaria multiforme; they are uncommon in EM. In contrast, any necrosis, blistering, or erosions in the centers of the annular lesions or on mucosal membranes would suggest EM, as necrosis, blistering, erosions, and mucosal involvement do not occur in urticaria multiforme.4 We stress that in EM, “the center of the lesion is the center of the action,” while in urticaria, wheals often have relatively normal centers.
Although both urticaria and EM lesions may be pruritic, any burning sensation is more suggestive of EM.4 Urticaria multiforme is often associated with antibiotics, vaccinations, and upper respiratory infections, while EM is most commonly associated with herpes simplex infection.4,7
Urticaria multiforme also may appear similar to a serum sickness–like reaction, which is another kind of hypersensitivity reaction triggered by the administration of antibiotics. It is most commonly associated with cefaclor, but also is associated with other antibiotics including amoxicillin.8 As with urticaria, hypersensitivity drug eruptions and serum sickness-like reactions may present with purpuric, polycyclic wheals with central clearing. However, as with EM, the lesions of serum sickness–like reactions are fixed, lasting for days to weeks.4 Facial or acral angioedema may occur in both urticaria multiforme and serum sickness–like reactions, but serum sickness–like reactions are not associated with dermatographism.4 Furthermore, serum sickness–like reactions are typically associated with high-grade fever, myalgia, arthralgia, and lymphadenopathy, which are not seen in urticaria multiforme.4,5
Diagnosis of urticaria multiforme usually can be made by history and physical exam, so lab testing and skin biopsy typically are not necessary.5 If performed, lab work may show modest elevation in erythrocyte sedimentation rate and C-reactive protein, but often these acute-phase reactants are within normal limits, and complete blood count and complete metabolic panel are unremarkable.3,5 Although urticaria multiforme often is associated with antecedent viral or bacterial infections, work-up for infectious etiology typically is not fruitful or helpful.4 If lesions are biopsied, the histology of urticaria multiforme is indistinguishable from other types of acute urticaria, showing dermal edema with perivascular lymphocytic infiltrate.9 In contrast, EM shows exocytosis, spongiosis, and epidermal necrosis.9
Treatment
The first step in managing urticaria multiforme is discontinuing any unnecessary antibiotic that could be triggering the hypersensitivity reaction. Urticaria multiforme typically resolves within 2 weeks without any treatment and responds to treatment with antihistamines within 24-28 hours.5 Treatment with a histamine1 (H1) blocker such as hydroxyzine, cetirizine, or diphenhydramine may be sufficient to resolve the eruption, but combination therapy with both an H1 blocker and an H2 blocker such as ranitidine can be helpful.4 Treatment with systemic corticosteroids usually is not necessary and should be reserved for severely symptomatic or refractory cases.4,9
One of the reasons that it is important to distinguish urticaria multiforme from EM is to avoid overtreatment with systemic steroids,3 which are rarely required for urticaria multiforme but are sometimes useful, although controversial, for EM.1 Additionally, the correct diagnosis is important for providing anticipatory guidance.6 Patients diagnosed with serum sickness–like reactions should be counseled to avoid unnecessary exposure to the culprit antibiotic in the future. Patients with urticaria multiforme who were taking an antibiotic at the onset of the eruption may consider avoiding the potential culprit antibiotic in the future, but it is important to keep in mind that urticaria multiforme is more strongly associated with antecedent infection than with antibiotic use, and so antibiotic avoidance may not be necessary unless justified by formal allergy testing. EM minor is more commonly associated with a herpes simplex virus infection than a drug reaction, so antibiotic use is less concerning, but patients should be counseled that recurrence is common and prophylactic treatment with acyclovir may be advised for recurrent disease.1
References
- “Neonatal and Infant Dermatology” (Elsevier Health Sciences: New York, 2014, pp. 456-70).
- CRIAI. 2006;30(1):003-012.
- Pediatr Dermatol. 1997;14(3):231-4.
- Pediatrics. 2007;119(5):e1177-83.
- Pediatr Dermatol. 2011;28(4):436-8.
- The Journal of Allergy and Clinical Immunology in Practice. 2013;1(5):520-1.
- Arch Dermatol. 1993;129(1):92-6.
- “The Hypersensitivity Syndromes” in Hurwitz Clinical Pediatric Dermatology. 4 ed. Elsevier: New York, 2011, pp. 455-84.
- J Clin Aesthet Dermatol. 2013;6(3):34-9.
Ms. Haddock is a medical student at University of California, San Diego School of Medicine and a research associate at Rady Children’s Hospital, San Diego. Dr. Eichenfield is chief of pediatric and adolescent dermatology at Rady Children’s Hospital-San Diego and professor of medicine and pediatrics at UC San Diego School of Medicine. Dr. Eichenfield and Ms. Haddock said they have no relevant financial disclosures. Email [email protected].

A 15-month-old male presents with a rash that began on his trunk 2 days ago and has spread to his arms, legs, and face. His parents say that the rash seems to migrate, with individual spots seeming to disappear and then reappear in new locations. The patient is playful and seems unbothered by the rash. He has a history of vesicoureteral reflux, for which he takes prophylactic nitrofurantoin daily. He was diagnosed with otitis media 7 days ago, for which he has been taking amoxicillin. On physical exam, the patient is afebrile. He has pink, edematous annular (ring-shaped) and polycyclic (composed of overlapping circles) plaques on his face, chest, abdomen, back, and upper and lower extremities. Some lesions appear vaguely targetoid with central clearing and raised borders. There is no mucosal involvement, joint involvement, or lymphadenopathy.

January 2016 Digital Edition
Table of Contents.
- Obesity Management: Update of the Pharmacologic Treatment Options
- Lessons Learned From the RACAT Trial: A Comparison of Rheumatoid Arthritis Therapies
- Long-Term Surgical Management of Severe Pelvic Injury and Resulting Neurogenic Bladder From an Improvised Explosive Device
- Personalized Health Planning in Primary Care Settings
- Treatment Options for Acute Gout
- Supporting Caregivers of Veterans Online

Advances in Hematology and Oncology (August 2013)


Why Hospitalists Should Embrace Population Health
Population health focuses on the specific health needs of an individual within a defined population.
“In order to truly measure a patient’s health outcomes and identify best practices, providers must evaluate a group of people with similar health needs,” explains Joseph Damore, vice president of population health management for Charlotte-N.C.-based Premier, Inc. “Once we understand a population’s outcomes, we can then target the individual.”

Fundamentally, population health is about individualized care and intervening earlier in order to get a better outcome based on what generally works for the population. It’s also about identifying populations that need specific, targeted care, such as diabetic and oncology patients.
Back in 2003, David A. Kindig MD, PhD, and Greg Stoddart, PhD, defined population health as “the health outcomes of a group of individuals, including the distribution of such outcomes within the group.”1
In order to achieve population health, according to Nick Fitterman, MD, SFHM, vice chair of hospital medicine for the Hofstra North Shore-LIJ School of Medicine in Hempstead, N.Y., “it is necessary to reduce health inequities or disparities among different populations due to, among other factors, the social determinants of health, which include social, environmental, cultural, and physical factors.”
Even though the concept of population health emerged more than 25 years ago, Dr. Fitterman points out that, until recently, the U.S. healthcare system has looked at an individual’s episodic illness rather than at population health, which focuses on wellness, prevention, and coordinated care across the continuum.

Marianne McPherson, PhD, MS, senior director of programs, research, and evaluation for the National Institute for Children’s Health Quality in Boston, says it is important for hospitalists to focus on both the patient and the population.
“You need to understand the particular factors facing the patient in front of you and understand that that individual is a product of a variety of different circumstances,” she says. “If you only look at an individual’s health, you can miss important trends across a group of patients within a population or community.
“By looking at both the individual and entire population, you can provide the most effective healthcare and health promotion.”
Government Spearheads Initiatives

With passage of the Patient Protection and Affordable Care Act (ACA) of 2010, the U.S. government helped accelerate the movement toward population health. According to Joshua D. Lenchus, DO, RPh, FACP, SFHM, a veteran hospitalist, president of Jackson Health System Medical Staff, and associate professor of clinical medicine and anesthesiology at the University of Miami Miller School of Medicine, the act’s provisions aim to improve the quality of care and create accountable care organizations (ACOs).
“The idea was to provide patients with insurance coverage, which would improve the access to care of which they were previously deprived,” he says. “With better access, they may receive quality healthcare and the identification and mitigation of disease at an early stage, thereby reducing overall healthcare costs, with the commensurate benefit of a healthy patient population.
“Of course, this is fraught with naïveté, because it explicitly dismisses nonmedical health determinants (i.e., socioeconomic status, education, literacy rate, transportation availability, employment status, individual patient responsibility, and so forth).”
Now, with ACOs, a hospital or healthcare system can manage patient risk with a potential financial gain—if they manage it well. The government shifts the episodic cost of care to an ACO, charges it with achieving health outcome metrics, and allows it to reap the reward of doing so in a cost-effective manner. More risk equals more reward, potentially. But to affect positive change in patient outcomes (e.g. health) in this manner requires acknowledging such external determinants. Hospitals, hospitalists, and physician leaders must seriously consider health determinants and how they impact patients if they are going to adequately address population health.

David Nash, MD, MBA, founding dean of the Jefferson College of Population Health at Thomas Jefferson University in Philadelphia, sees the ACA as the major driver of population health, with the payment structure moving from a world of volume to one of value.
“It’s all about demonstrating an improvement in the population’s health,” he says.
In January 2015, U.S. Department of Health and Human Services Secretary Sylvia Mathews Burwell announced that by 2018, 50 cents of every Medicare dollar will be attached to some measure of outcome.2
“So this move, from volume to value, will be the underpinning of the entire population health movement,” Dr. Nash says, “and we will be rewarded based on an improvement in a population’s health, instead of rewards for using resources on a per person basis.”
What’s a Hospitalist to Do?
Hospitalists typically are focused on inpatient care, managing a patient stay and coordinating discharge. Population health is an area, experts say, where hospitalists can extend their expertise in patient care and take a leadership role beyond the hospital.
“Hospitalists need to be aware of population health, embrace it, and help to develop structures within their programs that allow them to more closely partner with social services and case managers,” Dr. Fitterman says. “[You can] coordinate this type of care.”
Listen to more of our interview with Dr. Fitterman.
Dr. Lenchus agrees, noting that hospitalists intersect with population health most at discharge.
“The time point during which we must reconcile our discharge plan with the realities of the patient’s everyday life,” he says. “As we encourage an increasingly active lifestyle, we must pause to ascertain whether or not the patient lives in a neighborhood that is safe for outdoor activity.
As better nutrition is suggested, we must understand that the cost of a meal at a fast food chain is likely cheaper than one at a health food store. And, when arranging for a follow-up appointment, we must account for the bus schedule if a patient depends on that mode of transportation, as well as the potential to be released from work if employed.
“All of these external health determinants play a significant role in patients’ ability to adhere to instructions. Failure to [consider them in the discharge plan] will inevitably result in worsened health outcomes for the patient, and possibly hospital readmission.”
Hospitalists should be aware of the community-based organizations and services that exist, maintaining a working knowledge of who can provide volunteers, aid, food, and clothing to patients in need.
“Hospitalists should help lead or coordinate efforts to catalog these services in a community in which we practice, so we can steer patients toward these facilities,” Dr. Fitterman says. “In the past, we would treat acute medical issues and walk away. Now we need to be involved in patients’ needs, and those of their families.”
Establish a Team
A team-based approach is key to improving patient outcomes upon discharge, Dr. Lenchus says. Hospitalists should interact with social workers and case managers in anticipation of discharge; include the pharmacist in discharge medication counseling sessions. Are there relevant pharmaceutical industry-sponsored programs that can help the patient obtain prescription medications? Does the patient already qualify for some assistance? If the patient is insured, is the medication being prescribed on the formulary, or can it be modified so that it is covered? Could a generic version be prescribed? Does the patient understand the reason for hospitalization, have a follow-up appointment, and know how to take his medications?
Dr. Nash sees physicians as the team captains; physicians know how the system works, because they see it up close every day. The team includes key personnel, such as nurse practitioners, physician assistants, pharmacists, patient navigators, social workers, and patient educators.
“A physician, who might be a hospitalist, ideally will have additional training in both leadership and in population health,” Dr. Nash says.
He also encourages hospitalists to become patient advocates and educators, even though this is not their traditional role.
“They can do a lot to help a hospitalized patient face their challenges,” he says. “Encourage patients to stop smoking, go on a diet, and exercise. When a physician engages in this conversation, it aids in a patient’s ability to tackle challenges.”
For hospitalists who already feel overstretched with demands and overwhelmed with taking on the task of managing population health, Dr. McPherson suggests they learn more about the trend by studying it as part of their continuing education requirements. In addition, many hospitals have a department dedicated to patient safety or quality assurance.
“Ask how they can help the hospital to provide better patient care,” Dr. McPherson says. “Ask patients about their concerns or those of their neighbors. You may start to see trends.”
For example, if you suspect a trend of children who live in a certain housing development having difficulty breathing, try to find out if other hospital units are aware of this. Also try to ascertain whether or not any community groups connected to the hospital are already working to make the housing safer.
Population Health Challenges
The transition to being accountable for the health of a population will most likely be challenging for all providers. It involves significant risk, especially during the transition period, when an organization must live in both worlds (fee-for-service and value-based payment), says Damore, Premier’s vice president of population health management. He says it also requires:
- Enlightened and supportive leadership;
- Information technology to analyze claims and other infrastructure;
- New care management programs to coordinate care across the continuum;
- Agreements that align payment with population health management; and
- Skills and ability to transform a culture to a new value-based model.
To overcome the challenge of incorporating population health, Dr. McPherson suggests hospitals look to their large network of peers and learn from those already doing this, rather than reinventing the wheel. Look for champions to spearhead such initiatives.
“Identify folks who are already oriented in this direction and took steps in this vein,” she says.
Time and money are potential concerns, especially if embarking on a population health initiative will be an additional expense.
“A potential solution would be to look at ways to shift the focus, so that population health becomes integral to proper patient care, from promoting health and well-being to treating illness,” Dr. McPherson says. For example, by minimizing environmentally associated risks, hospitalists might be able to decrease the number of admissions, which will result in a return on your investment and improve population health.
Population health is here to stay, as payment models shift from fee-for-service to the value-based model. Hospitalists should embrace the movement and spearhead initiatives to get others on board. A hospital-wide team approach is advised. And, to save time and money, seek guidance from others who have already been successful. TH
Karen Appold is a medical writer in Pennsylvania.
References
1. Kindig D, Stoddart G. What is population health? Am J Public Health. 2003:93(3):380-383. doi: 10.2105/AJPH.93.3.380
2. Mathews Burwell S. Progress towards achieving better care, smarter spending, healthier people. U.S. Department of Health and Human Services website. January 26, 2015. Available at: http://www.hhs.gov/blog/2015/01/26/progress-towards-better-care-smarter-spending-healthier-people.html. Accessed November 8, 2015.
A Population’s Health Isn’t Just about Healthcare

Improvement in population health requires action on multiple determinants, including medical care, health behaviors, and the social and physical environments; therefore, no single entity can be held accountable for achieving improved outcomes. Medical organizations, the government, schools, businesses, and community organizations all need to make substantial changes in how they approach health and allocate resources.1
“Community organizations have important roles, such as social services and urban planning, and businesses need to understand that they have to invest in their communities if they want a healthy future workforce,” says David A. Kindig MD, PhD, emeritus professor of population health sciences at the University of Wisconsin Madison School of Medicine and Public Health. “Everyone has a role to play.”

Healthcare organizations need to reach beyond their traditional roles to support these interventions.
“It is a team sport in 2015,” Dr. Kindig says. “For many decades, medical care was considered the most prominent factor for a population’s health. Of course it remains so, but from a population health perspective, these other factors are equally or even more important.”
According to county health rankings and roadmaps compiled for the entire United States by the University of Wisconsin, the following factors play a role in population health: clinical care, 20%; health behaviors (e.g. tobacco use, diet and exercise, sexual activity), 30%; social and economic factors (e.g. jobs, education, and social support), 40%; and physical environment (i.e., air and water quality, housing, and transit), 10%.2
The bottom line is that most determinants of health (80%) are nonclinical.
“Social determinants are the principal driver of well-being,” says David Nash, MD, MBA, founding dean of the Jefferson College of Population Health at Thomas Jefferson University in Philadelphia. “It’s mostly about what someone does every day to stay healthy.” TH
References
1. Kindig DA, Isham G. Population health improvement: a community health business model that engages partners in all sectors. Front Health Serv Manage. 2014;30(4):3-20.
2. Our approach. County Health Rankings & Roadmaps website. Available at: http://www.countyhealthrankings.org/our-approach. Accessed November 8, 2015.
Population health focuses on the specific health needs of an individual within a defined population.
“In order to truly measure a patient’s health outcomes and identify best practices, providers must evaluate a group of people with similar health needs,” explains Joseph Damore, vice president of population health management for Charlotte-N.C.-based Premier, Inc. “Once we understand a population’s outcomes, we can then target the individual.”
Fundamentally, population health is about individualized care and intervening earlier in order to get a better outcome based on what generally works for the population. It’s also about identifying populations that need specific, targeted care, such as diabetic and oncology patients.
Back in 2003, David A. Kindig MD, PhD, and Greg Stoddart, PhD, defined population health as “the health outcomes of a group of individuals, including the distribution of such outcomes within the group.”1
In order to achieve population health, according to Nick Fitterman, MD, SFHM, vice chair of hospital medicine for the Hofstra North Shore-LIJ School of Medicine in Hempstead, N.Y., “it is necessary to reduce health inequities or disparities among different populations due to, among other factors, the social determinants of health, which include social, environmental, cultural, and physical factors.”
Even though the concept of population health emerged more than 25 years ago, Dr. Fitterman points out that, until recently, the U.S. healthcare system has looked at an individual’s episodic illness rather than at population health, which focuses on wellness, prevention, and coordinated care across the continuum.
Marianne McPherson, PhD, MS, senior director of programs, research, and evaluation for the National Institute for Children’s Health Quality in Boston, says it is important for hospitalists to focus on both the patient and the population.
“You need to understand the particular factors facing the patient in front of you and understand that that individual is a product of a variety of different circumstances,” she says. “If you only look at an individual’s health, you can miss important trends across a group of patients within a population or community.
“By looking at both the individual and entire population, you can provide the most effective healthcare and health promotion.”
Government Spearheads Initiatives
With passage of the Patient Protection and Affordable Care Act (ACA) of 2010, the U.S. government helped accelerate the movement toward population health. According to Joshua D. Lenchus, DO, RPh, FACP, SFHM, a veteran hospitalist, president of Jackson Health System Medical Staff, and associate professor of clinical medicine and anesthesiology at the University of Miami Miller School of Medicine, the act’s provisions aim to improve the quality of care and create accountable care organizations (ACOs).
“The idea was to provide patients with insurance coverage, which would improve the access to care of which they were previously deprived,” he says. “With better access, they may receive quality healthcare and the identification and mitigation of disease at an early stage, thereby reducing overall healthcare costs, with the commensurate benefit of a healthy patient population.
“Of course, this is fraught with naïveté, because it explicitly dismisses nonmedical health determinants (i.e., socioeconomic status, education, literacy rate, transportation availability, employment status, individual patient responsibility, and so forth).”
Now, with ACOs, a hospital or healthcare system can manage patient risk with a potential financial gain—if they manage it well. The government shifts the episodic cost of care to an ACO, charges it with achieving health outcome metrics, and allows it to reap the reward of doing so in a cost-effective manner. More risk equals more reward, potentially. But to affect positive change in patient outcomes (e.g. health) in this manner requires acknowledging such external determinants. Hospitals, hospitalists, and physician leaders must seriously consider health determinants and how they impact patients if they are going to adequately address population health.
David Nash, MD, MBA, founding dean of the Jefferson College of Population Health at Thomas Jefferson University in Philadelphia, sees the ACA as the major driver of population health, with the payment structure moving from a world of volume to one of value.
“It’s all about demonstrating an improvement in the population’s health,” he says.
In January 2015, U.S. Department of Health and Human Services Secretary Sylvia Mathews Burwell announced that by 2018, 50 cents of every Medicare dollar will be attached to some measure of outcome.2
“So this move, from volume to value, will be the underpinning of the entire population health movement,” Dr. Nash says, “and we will be rewarded based on an improvement in a population’s health, instead of rewards for using resources on a per person basis.”
What’s a Hospitalist to Do?
Hospitalists typically are focused on inpatient care, managing a patient stay and coordinating discharge. Population health is an area, experts say, where hospitalists can extend their expertise in patient care and take a leadership role beyond the hospital.
“Hospitalists need to be aware of population health, embrace it, and help to develop structures within their programs that allow them to more closely partner with social services and case managers,” Dr. Fitterman says. “[You can] coordinate this type of care.”
Listen to more of our interview with Dr. Fitterman.
Dr. Lenchus agrees, noting that hospitalists intersect with population health most at discharge.
“The time point during which we must reconcile our discharge plan with the realities of the patient’s everyday life,” he says. “As we encourage an increasingly active lifestyle, we must pause to ascertain whether or not the patient lives in a neighborhood that is safe for outdoor activity.
As better nutrition is suggested, we must understand that the cost of a meal at a fast food chain is likely cheaper than one at a health food store. And, when arranging for a follow-up appointment, we must account for the bus schedule if a patient depends on that mode of transportation, as well as the potential to be released from work if employed.
“All of these external health determinants play a significant role in patients’ ability to adhere to instructions. Failure to [consider them in the discharge plan] will inevitably result in worsened health outcomes for the patient, and possibly hospital readmission.”
Hospitalists should be aware of the community-based organizations and services that exist, maintaining a working knowledge of who can provide volunteers, aid, food, and clothing to patients in need.
“Hospitalists should help lead or coordinate efforts to catalog these services in a community in which we practice, so we can steer patients toward these facilities,” Dr. Fitterman says. “In the past, we would treat acute medical issues and walk away. Now we need to be involved in patients’ needs, and those of their families.”
Establish a Team
A team-based approach is key to improving patient outcomes upon discharge, Dr. Lenchus says. Hospitalists should interact with social workers and case managers in anticipation of discharge; include the pharmacist in discharge medication counseling sessions. Are there relevant pharmaceutical industry-sponsored programs that can help the patient obtain prescription medications? Does the patient already qualify for some assistance? If the patient is insured, is the medication being prescribed on the formulary, or can it be modified so that it is covered? Could a generic version be prescribed? Does the patient understand the reason for hospitalization, have a follow-up appointment, and know how to take his medications?
Dr. Nash sees physicians as the team captains; physicians know how the system works, because they see it up close every day. The team includes key personnel, such as nurse practitioners, physician assistants, pharmacists, patient navigators, social workers, and patient educators.
“A physician, who might be a hospitalist, ideally will have additional training in both leadership and in population health,” Dr. Nash says.
He also encourages hospitalists to become patient advocates and educators, even though this is not their traditional role.
“They can do a lot to help a hospitalized patient face their challenges,” he says. “Encourage patients to stop smoking, go on a diet, and exercise. When a physician engages in this conversation, it aids in a patient’s ability to tackle challenges.”
For hospitalists who already feel overstretched with demands and overwhelmed with taking on the task of managing population health, Dr. McPherson suggests they learn more about the trend by studying it as part of their continuing education requirements. In addition, many hospitals have a department dedicated to patient safety or quality assurance.
“Ask how they can help the hospital to provide better patient care,” Dr. McPherson says. “Ask patients about their concerns or those of their neighbors. You may start to see trends.”
For example, if you suspect a trend of children who live in a certain housing development having difficulty breathing, try to find out if other hospital units are aware of this. Also try to ascertain whether or not any community groups connected to the hospital are already working to make the housing safer.
Population Health Challenges
The transition to being accountable for the health of a population will most likely be challenging for all providers. It involves significant risk, especially during the transition period, when an organization must live in both worlds (fee-for-service and value-based payment), says Damore, Premier’s vice president of population health management. He says it also requires:
- Enlightened and supportive leadership;
- Information technology to analyze claims and other infrastructure;
- New care management programs to coordinate care across the continuum;
- Agreements that align payment with population health management; and
- Skills and ability to transform a culture to a new value-based model.
To overcome the challenge of incorporating population health, Dr. McPherson suggests hospitals look to their large network of peers and learn from those already doing this, rather than reinventing the wheel. Look for champions to spearhead such initiatives.
“Identify folks who are already oriented in this direction and took steps in this vein,” she says.
Time and money are potential concerns, especially if embarking on a population health initiative will be an additional expense.
“A potential solution would be to look at ways to shift the focus, so that population health becomes integral to proper patient care, from promoting health and well-being to treating illness,” Dr. McPherson says. For example, by minimizing environmentally associated risks, hospitalists might be able to decrease the number of admissions, which will result in a return on your investment and improve population health.
Population health is here to stay, as payment models shift from fee-for-service to the value-based model. Hospitalists should embrace the movement and spearhead initiatives to get others on board. A hospital-wide team approach is advised. And, to save time and money, seek guidance from others who have already been successful. TH
Karen Appold is a medical writer in Pennsylvania.
References
1. Kindig D, Stoddart G. What is population health? Am J Public Health. 2003:93(3):380-383. doi: 10.2105/AJPH.93.3.380
2. Mathews Burwell S. Progress towards achieving better care, smarter spending, healthier people. U.S. Department of Health and Human Services website. January 26, 2015. Available at: http://www.hhs.gov/blog/2015/01/26/progress-towards-better-care-smarter-spending-healthier-people.html. Accessed November 8, 2015.
A Population’s Health Isn’t Just about Healthcare
Improvement in population health requires action on multiple determinants, including medical care, health behaviors, and the social and physical environments; therefore, no single entity can be held accountable for achieving improved outcomes. Medical organizations, the government, schools, businesses, and community organizations all need to make substantial changes in how they approach health and allocate resources.1
“Community organizations have important roles, such as social services and urban planning, and businesses need to understand that they have to invest in their communities if they want a healthy future workforce,” says David A. Kindig MD, PhD, emeritus professor of population health sciences at the University of Wisconsin Madison School of Medicine and Public Health. “Everyone has a role to play.”
Healthcare organizations need to reach beyond their traditional roles to support these interventions.
“It is a team sport in 2015,” Dr. Kindig says. “For many decades, medical care was considered the most prominent factor for a population’s health. Of course it remains so, but from a population health perspective, these other factors are equally or even more important.”
According to county health rankings and roadmaps compiled for the entire United States by the University of Wisconsin, the following factors play a role in population health: clinical care, 20%; health behaviors (e.g. tobacco use, diet and exercise, sexual activity), 30%; social and economic factors (e.g. jobs, education, and social support), 40%; and physical environment (i.e., air and water quality, housing, and transit), 10%.2
The bottom line is that most determinants of health (80%) are nonclinical.
“Social determinants are the principal driver of well-being,” says David Nash, MD, MBA, founding dean of the Jefferson College of Population Health at Thomas Jefferson University in Philadelphia. “It’s mostly about what someone does every day to stay healthy.” TH
References
1. Kindig DA, Isham G. Population health improvement: a community health business model that engages partners in all sectors. Front Health Serv Manage. 2014;30(4):3-20.
2. Our approach. County Health Rankings & Roadmaps website. Available at: http://www.countyhealthrankings.org/our-approach. Accessed November 8, 2015.

Population Health Prevails at Two Institutions
Population health—a movement to improve the health of an entire population—is a growing trend driven by the U.S. government. Many health systems are already on board, as healthcare shifts from a fee-for-service system to a value-based system.
One group of Premier Health hospitals and health systems has been collaborating since 2011 to build capabilities to become clinically integrated care networks that are accountable for the health of defined populations within their communities, according to Joseph Damore, vice president of population health management for the Charlotte, N.C-based company.
Damore says Premier has developed a comprehensive framework for the activities and capabilities necessary for successful population health management. Building blocks include:
- Patient-centered foundation (greater patient engagement and involvement in clinical decisions);
- Health home (a primary care medical home);
- High-value network (a set of providers who deliver quality care at an efficient price and whose performance is measured in the areas of cost, quality, and satisfaction);
- Payer partnership (care delivery network providers working with payers to create aligned financial incentives consistent with providing high-value care);
- Population health data management (collecting, analyzing, and reporting data covering all of the care the network’s patient population receives); and
- Network leadership (systematic governance and administration) focused on improving health, managing and coordinating care, and managing per capita cost.
“We’re also working with health systems on initiatives to establish patient-centered foundations and medical homes and create clinically integrated networks, providing our members with a direct roadmap to follow to successfully transition to this new value-based model,” Damore says.
At Jackson Memorial Hospital, one of the nation’s largest safety net hospitals, managing population health is ingrained in staff from day one. Nonetheless, Joshua D. Lenchus, DO, RPh, FACP, SFHM, president of Jackson Health System Medical Staff, says there are opportunities for improvement.
“A more team-based, collaborative approach is being piloted on some floors of our hospital, with specific physician groups,” he says. “Armed with the knowledge of these interventions, we can work on bolstering the pearls and rectifying the pitfalls as we move forward.
“One of our biggest obstacles to success is our patients’ general socioeconomic status.”
A current initiative at Jackson includes piloting a physician-led, multidisciplinary approach to address some of the health determinants. Furthermore, the health system is building additional satellite community clinics and urgent care centers, as it attempts to address disease earlier in the process. Additionally, there is a renewed emphasis on reinforcing the primary care infrastructure to facilitate patient appointment needs, Dr. Lenchus says. TH
Team discovers virus linked to HCV

Photo by Daniel Gay
Researchers have discovered a bloodborne virus, known as human pegivirus 2 (HPgV-2), in patients with hepatitis C virus (HCV).
The team identified 8 complete strains of HPgV-2 and noted that the virus was only found in patients who tested positive for HCV RNA. However, it’s not clear if HPgV-2 causes hepatitis.
Charles Chiu, MD, PhD, of the University of California San Francisco, and his colleagues described their discovery of HPgV-2 in PLOS Pathogens.
The team identified the virus by sequencing plasma from an HCV-infected patient with multiple bloodborne exposures who died from sepsis of unknown etiology.
They said HPgV-2 is “highly divergent,” sharing less than 32% amino acid identity with its nearest relatives, rodent and bat pegiviruses.
After their initial discovery, the researchers screened an additional 2440 plasma samples and found 11 HPgV-2 RNA-positive samples.
All 12 HPgV-2 RNA-positive cases were found in patients who tested positive for HCV RNA, including 2 patients who were also infected with HIV.
The researchers performed longitudinal sampling in 2 patients and found that active HPgV-2 infection can persist in blood for at least 7 weeks, despite the presence of virus-specific antibodies.
The team also identified 1 patient with HPgV-2 and HCV RNA who was seronegative for both viruses. They said this suggests a high likelihood of simultaneous acquisition of HCV and HPgV-2 infection from an acute co-transmission event.
“Based on our findings, our team used the genetic makeup of the virus to develop both a molecular test for detecting it in the bloodstream and an antibody test for determining an immune response to the virus,” said John Hackett Jr, PhD, of Abbott Laboratories, Inc. in Abbott Park, Illinois.
“Our next step is to explore whether this new virus can cause disease, and if so, work with blood banks to continue to help safeguard the world’s blood supply against these types of new viruses. Research such as this is ultimately focused on unlocking new technologies that hold the potential for significant improvements to the practice of healthcare.” ![]()
2016 Directory of VA and DoD Facilities
Click here to access the 2016 Directory of VA and DoD Facilities Digital Edition
Table of Contents
- Letter From the Publisher
- Explanatory Notes and Abbreviation Key
- Veterans Integrated Service Network (VISN) Guide / MyVA Regions Guide
- Department of Veterans Affairs Health Care Facilities
- TRICARE Region Guide
- Department of Defense Health Care Facilities

Hepatitis C virus infection linked to cardiovascular death, disease, and stroke
Patients with hepatitis C virus (HCV) infection face a significantly increased risk of cardiovascular death, subclinical carotid thickening and atherosclerosis, and cerebrocardiovascular events, especially when they also have diabetes and hypertension, according to a systematic review and meta-analysis of 22 studies published in the January issue of Gastroenterology.
“To our knowledge, our meta-analysis clearly highlights, for the first time, that HCV infection increases the risk of cardiovascular disease-related mortality,” wrote Dr. Salvatore Petta and his associates at the University of Palermo, Italy. “We [also] found a twofold higher risk of subclinical carotid plaques among HCV-infected individuals compared to uninfected controls, without significant heterogeneity among studies, as well as an increased risk of carotid thickening. We observed a slightly significant increase in cerebrocardiovascular events among HCV-infected patients, despite the high heterogeneity among studies that was mostly related to the prevalence of diabetes mellitus and hypertension.”

A number of observational studies have reported cardiovascular outcomes in HCV-infected patients, but results have been “ambiguous,” Dr. Petta and his colleagues said. For their meta-analysis, they searched PubMed, Medline, EMBASE, the Cochrane Library, and reference lists of articles to identify studies published through July 2015 that either compared cardiovascular disease between HCV-infected and uninfected patients, or evaluated the prevalence of HCV infection among patients with cardiovascular disease. This literature search identified 12 case-control studies and 10 cohort studies. Outcome measures included carotid atherosclerosis (nine studies), intima media thickness (eight studies), coronary artery disease (seven studies), stroke (six studies), and cardiovascular mortality (three studies) (Gastroenterology. 2015 Sep 18. doi: 10.1053/j.gastro.2015.09.00).In the pooled analysis, the odds of cardiovascular death were 65% higher in HCV-infected patients, compared with uninfected individuals (95% confidence interval for this increase, 1.07%-2.56%). Compared with controls, HCV-infected patients also were at higher risk of carotid plaques (odds ratio, 2.27; 95% CI, 1.76-2.94), especially when they were smokers (P = .02). HCV infection also significantly increased the odds of carotid artery intima-media thickening (OR, 1.20; 95% CI, 1.03-1.40), and cerebrocardiovascular events (OR, 1.30; 95% CI, 1.10-1.55). However, subgroup analyses showed that HCV infection only increased the likelihood of cerebrocardiovascular events in populations with a more than 10% prevalence of diabetes or a more than 20% prevalence of hypertension (OR, 1.71; P less than .001 for both subgroup analyses).
Because the studies of cerebrocardiovascular events were heterogeneous, the researchers also stratified them by study design and by the average age of patients. Pooled odds ratios for the link between HCV infection and cerebrocardiovascular events remained significant at 1.21 for the cohort studies, 2.01 for the case-control studies, 2.46 among patients who averaged more than 50 years of age, and 1.35 among younger patients.
The Egger test for publication bias showed that the literature search was unlikely to have overlooked studies in terms of any of the outcome measures, the investigators noted. “From a clinical standpoint, the results of our meta-analysis suggest that HCV infection increases cardiovascular risk, particularly for individuals who already have cardiovascular risk factors, such as diabetes and hypertension,” they concluded. “Although effective and safe oral antiviral regimens are available, more information is needed to confirm whether anti-HCV medications will decrease cardiovascular risk, as suggested in some studies.”
The researchers reported having no funding sources or conflicts of interest.
Source: American Gastroenterological Association
Patients with hepatitis C virus (HCV) infection face a significantly increased risk of cardiovascular death, subclinical carotid thickening and atherosclerosis, and cerebrocardiovascular events, especially when they also have diabetes and hypertension, according to a systematic review and meta-analysis of 22 studies published in the January issue of Gastroenterology.
“To our knowledge, our meta-analysis clearly highlights, for the first time, that HCV infection increases the risk of cardiovascular disease-related mortality,” wrote Dr. Salvatore Petta and his associates at the University of Palermo, Italy. “We [also] found a twofold higher risk of subclinical carotid plaques among HCV-infected individuals compared to uninfected controls, without significant heterogeneity among studies, as well as an increased risk of carotid thickening. We observed a slightly significant increase in cerebrocardiovascular events among HCV-infected patients, despite the high heterogeneity among studies that was mostly related to the prevalence of diabetes mellitus and hypertension.”
A number of observational studies have reported cardiovascular outcomes in HCV-infected patients, but results have been “ambiguous,” Dr. Petta and his colleagues said. For their meta-analysis, they searched PubMed, Medline, EMBASE, the Cochrane Library, and reference lists of articles to identify studies published through July 2015 that either compared cardiovascular disease between HCV-infected and uninfected patients, or evaluated the prevalence of HCV infection among patients with cardiovascular disease. This literature search identified 12 case-control studies and 10 cohort studies. Outcome measures included carotid atherosclerosis (nine studies), intima media thickness (eight studies), coronary artery disease (seven studies), stroke (six studies), and cardiovascular mortality (three studies) (Gastroenterology. 2015 Sep 18. doi: 10.1053/j.gastro.2015.09.00).In the pooled analysis, the odds of cardiovascular death were 65% higher in HCV-infected patients, compared with uninfected individuals (95% confidence interval for this increase, 1.07%-2.56%). Compared with controls, HCV-infected patients also were at higher risk of carotid plaques (odds ratio, 2.27; 95% CI, 1.76-2.94), especially when they were smokers (P = .02). HCV infection also significantly increased the odds of carotid artery intima-media thickening (OR, 1.20; 95% CI, 1.03-1.40), and cerebrocardiovascular events (OR, 1.30; 95% CI, 1.10-1.55). However, subgroup analyses showed that HCV infection only increased the likelihood of cerebrocardiovascular events in populations with a more than 10% prevalence of diabetes or a more than 20% prevalence of hypertension (OR, 1.71; P less than .001 for both subgroup analyses).
Because the studies of cerebrocardiovascular events were heterogeneous, the researchers also stratified them by study design and by the average age of patients. Pooled odds ratios for the link between HCV infection and cerebrocardiovascular events remained significant at 1.21 for the cohort studies, 2.01 for the case-control studies, 2.46 among patients who averaged more than 50 years of age, and 1.35 among younger patients.
The Egger test for publication bias showed that the literature search was unlikely to have overlooked studies in terms of any of the outcome measures, the investigators noted. “From a clinical standpoint, the results of our meta-analysis suggest that HCV infection increases cardiovascular risk, particularly for individuals who already have cardiovascular risk factors, such as diabetes and hypertension,” they concluded. “Although effective and safe oral antiviral regimens are available, more information is needed to confirm whether anti-HCV medications will decrease cardiovascular risk, as suggested in some studies.”
The researchers reported having no funding sources or conflicts of interest.
Source: American Gastroenterological Association
FROM GASTROENTEROLOGY
Key clinical point: Patients with HCV infection are at increased risk of cardiovascular death, stroke, and subclinical carotid atherosclerosis and thickening.
Major finding: The pooled odds of cardiovascular death were 65% higher among infected, compared with uninfected individuals.
Data source: A systematic review and meta-analysis of 22 observational studies.
Disclosures: The researchers reported having no funding sources or conflicts of interest.

Nonalcoholic fatty liver disease linked to liver cancer without cirrhosis
About 13% of U.S. veterans with hepatocellular carcinoma had no evidence of preexisting cirrhosis, according to a report published in the January issue of Clinical Gastroenterology and Hepatology.
“The main risk factors for this entity were nonalcoholic fatty liver disease [NAFLD] or metabolic syndrome” – not hepatitis C virus infection [HCV], HBV [hepatitis B virus] infection, or alcohol abuse, said Dr. Sahil Mittal of the Michael E. DeBakey Veterans Affairs Medical Center and Baylor College of Medicine in Houston. Screening all patients with NAFLD for hepatocellular carcinoma [HCC] is impractical, so studies should seek “actionable risk factors” or biomarkers that reliably identify NAFLD patients who are at particular risk of HCC, wrote Dr. Mittal and his coinvestigators.

Researchers have debated whether chronic HCV infection or alcohol abuse can lead to HCC in the absence of cirrhosis, while at least one study has shown that NAFLD can predispose patients to this disease entity (Arch Pathol Lab Med. 2008;132:1761-6).
But few studies have systematically examined risk factors for HCC without cirrhosis in the general population, the investigators said. Therefore, they randomly selected 1,500 patients from the U.S. Veterans Affairs system who were diagnosed with HCC between 2005 and 2010 on the basis of histopathology or established imaging criteria (Hepatology 2005;42:1208-36).
They reviewed complete medical records for these patients, and classified those who did not have cirrhosis according to the quality of supporting histology, laboratory, and imaging data (Clin Gastroenterol Hepatol. 2015. doi: 0.1016/j.cgh.2015.07.019).
In all, 3% of the cohort had level 1 (“highest-quality”) evidence for not having cirrhosis, while another 10% had level 2 evidence for no cirrhosis, the investigators said. “Compared with HCC in the presence of cirrhosis, these patients were more likely to have metabolic syndrome or NAFLD or no identifiable risk factor, and less likely to have alcohol abuse or HCV infection,” they added. Only two-thirds of NAFLD patients with HCC had cirrhosis, compared with 91% of patients with chronic HCV infection, 92% of HCV-infected patients, and 88% of patients with an alcohol use disorder. Notably, the odds of HCC in the absence of cirrhosis were more than five times higher when patients had NAFLD (odds ratio [OR], 5.4; 95% confidence interval [CI], 3.4-8.5) or metabolic syndrome (OR, 5.0; 95% CI, 3.1-7.8) compared with HCV infection.
Patients with cirrhosis often go unscreened for HCC even though they are at greatest risk of this cancer. Therefore, trying to screen all patients with NAFLD for HCC would be “logistically impractical,” particularly when the absolute risk of HCC in noncirrhotic patients is unknown and no one has examined the best ways to screen this population, the investigators said. Instead, clinicians could prioritize screening and treating NAFLD patients for diabetes mellitus and obesity, both of which are associated with HCC. “There is evidence to suggest that metformin reduces the risk of HCC among diabetics,” they added. “Studies of these and other risk factors of HCC among NAFLD patients with and without cirrhosis are needed.”
Most patients in the study were male, potentially limiting the generalizability of the findings, the researchers noted.
The National Cancer Institute, the Houston Veterans Affairs Health Services Research and Development Center of Excellence, the Michael E. DeBakey Veterans Affairs Medical Center, and the Dan Duncan Cancer Center funded the study. The researchers had no disclosures.
Source: American Gastroenterological Association
About 13% of U.S. veterans with hepatocellular carcinoma had no evidence of preexisting cirrhosis, according to a report published in the January issue of Clinical Gastroenterology and Hepatology.
“The main risk factors for this entity were nonalcoholic fatty liver disease [NAFLD] or metabolic syndrome” – not hepatitis C virus infection [HCV], HBV [hepatitis B virus] infection, or alcohol abuse, said Dr. Sahil Mittal of the Michael E. DeBakey Veterans Affairs Medical Center and Baylor College of Medicine in Houston. Screening all patients with NAFLD for hepatocellular carcinoma [HCC] is impractical, so studies should seek “actionable risk factors” or biomarkers that reliably identify NAFLD patients who are at particular risk of HCC, wrote Dr. Mittal and his coinvestigators.
Researchers have debated whether chronic HCV infection or alcohol abuse can lead to HCC in the absence of cirrhosis, while at least one study has shown that NAFLD can predispose patients to this disease entity (Arch Pathol Lab Med. 2008;132:1761-6).
But few studies have systematically examined risk factors for HCC without cirrhosis in the general population, the investigators said. Therefore, they randomly selected 1,500 patients from the U.S. Veterans Affairs system who were diagnosed with HCC between 2005 and 2010 on the basis of histopathology or established imaging criteria (Hepatology 2005;42:1208-36).
They reviewed complete medical records for these patients, and classified those who did not have cirrhosis according to the quality of supporting histology, laboratory, and imaging data (Clin Gastroenterol Hepatol. 2015. doi: 0.1016/j.cgh.2015.07.019).
In all, 3% of the cohort had level 1 (“highest-quality”) evidence for not having cirrhosis, while another 10% had level 2 evidence for no cirrhosis, the investigators said. “Compared with HCC in the presence of cirrhosis, these patients were more likely to have metabolic syndrome or NAFLD or no identifiable risk factor, and less likely to have alcohol abuse or HCV infection,” they added. Only two-thirds of NAFLD patients with HCC had cirrhosis, compared with 91% of patients with chronic HCV infection, 92% of HCV-infected patients, and 88% of patients with an alcohol use disorder. Notably, the odds of HCC in the absence of cirrhosis were more than five times higher when patients had NAFLD (odds ratio [OR], 5.4; 95% confidence interval [CI], 3.4-8.5) or metabolic syndrome (OR, 5.0; 95% CI, 3.1-7.8) compared with HCV infection.
Patients with cirrhosis often go unscreened for HCC even though they are at greatest risk of this cancer. Therefore, trying to screen all patients with NAFLD for HCC would be “logistically impractical,” particularly when the absolute risk of HCC in noncirrhotic patients is unknown and no one has examined the best ways to screen this population, the investigators said. Instead, clinicians could prioritize screening and treating NAFLD patients for diabetes mellitus and obesity, both of which are associated with HCC. “There is evidence to suggest that metformin reduces the risk of HCC among diabetics,” they added. “Studies of these and other risk factors of HCC among NAFLD patients with and without cirrhosis are needed.”
Most patients in the study were male, potentially limiting the generalizability of the findings, the researchers noted.
The National Cancer Institute, the Houston Veterans Affairs Health Services Research and Development Center of Excellence, the Michael E. DeBakey Veterans Affairs Medical Center, and the Dan Duncan Cancer Center funded the study. The researchers had no disclosures.
Source: American Gastroenterological Association
FROM CLINICAL GASTROENTEROLOGY AND HEPATOLOGY
Key clinical point: Nonalcoholic fatty liver disease and metabolic syndrome are risk factors for hepatocellular carcinoma in the absence of cirrhosis.
Major finding: Patients with these diseases were more than five times as likely to develop noncirrhotic HCC compared with patients with chronic hepatitis C virus infection.
Data source: A study of 1,500 randomly selected U.S. veterans diagnosed with HCC between 2005 and 2010.
Disclosures: The National Cancer Institute, the Houston Veterans Affairs Health Services Research and Development Center of Excellence, the Michael E. DeBakey Veterans Affairs Medical Center, and the Dan Duncan Cancer Center funded the study. The researchers had no disclosures.