User login
What Gets Lost
This issue of the Journal of Hospital Medicine highlights an important contribution to the evolving state of graduate medical education (GME). The study assesses the relationship between attending physician workload and teaching effectiveness and patient safety.[1]
From the outset, it is important to note that although the focus of this study is on teaching on the wards, this is not necessarily synonymous with learning on the wards. Even if a busy service compromises a faculty's teaching on the wards, more patients on a service might augment a resident's learning on the wards, from patients, peers, active clinical decision making, and overall exposure to diversity of disease.
The independent variable in this study is intensity, with the presumption that the number of patients is proportional to intensity, as codified by the Accreditation Council for Graduate Medical Education (ACGME) regulations regarding caps for admissions and service size. However, are 10 single‐organ chest pain patients the same intensity of 5 septic patients? The authors address this issue as much as possible by integrating expected mortality as a surrogate measure of intensity. Yet, given the heterogeneity of severity of illness even within a diagnosis, this too is likely to be an inaccurate measure of the true intensity of a service. Of course, such measures do not touch upon the social intensity that varies widely from patient to patient, which might be more time consuming and mentally exhausting than managing the diagnosis itself.
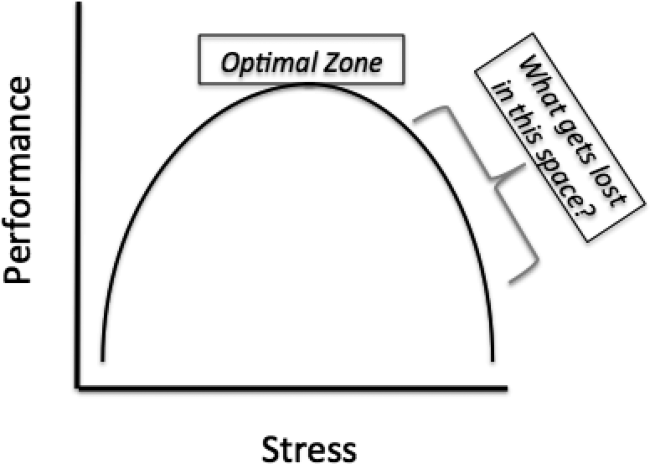
However, these limitations aside, this study's biggest contribution is that it raises the question that will define GME in the years to come, How does learning fluctuate with service intensity? The Yerkes‐Dodson curve was published in 1908, defining the relationship between stress and performance (Figure 1).[2] Many have interpreted the ACGME rules on admission caps and duty hours as being designed to make a kinder, gentler learning environment. However, as the curve suggests, optimizing service intensity (stress) is much more than just being nice; it is about optimizing performance, both in the way of patient care and learning. The question of how learning fluctuates with service intensity might be better framed as, What gets lost in the space as you move to the right of the optimal stress zone on the Yerkes‐Dodson curve?

Quality is first. This study correlates intensity with adverse events, and though there is a modest association, this likely underestimates the true magnitude of the problem. The measures in this study are documented adverse events, and are thus unlikely to capture the near misses that increase with heightened stress and intensity. Mistakes increase as mental bandwidth is insufficient to think through the consequences of each decision. Slipsthings you know you need to do but forget to doincrease as the mind becomes distracted.
Good work is next. All hospitalists know that it is possible to get a patient in and out of the hospital, but it is also possible to do so with such poor quality that the patient comes right back. Csikszentmihalyi described the concept of flow: the ability to become fully immersed in a task, concentrating on nothing except that task at hand.[3] What comes from flow is good work. Achieving flow requires the time to engage in a task, but it also requires that the mind is not distracted by the worry of what else needs to be done. As service intensity increases, so does fragmentation and distractions, both of which are enemies to flow. Achieving flow also might have implications for teaching and learning: Does it matter how good the teacher is, or how often she teaches, if the residents are so distracted that they are not mentally there and ready to receive that teaching?
The presumption underlying all GME is that practice makes perfect. However, practice does not make perfect; perfect practice makes perfect. Furthermore, just because you were physically there for an experience, does not mean you actually experienced it. It is possible to be engaged in a patient encounter, and mentally drive right past it, missing the full implications of the experience that would have presumptively allowed for improvement. The difference between practice and perfect practice is contingent upon mentally being there and upon the ability to reflect upon that experience such that improvement is possible. However, experiencing the experience and reflection require time and mental bandwidth; both are diminished as you move to the right of the optimal zone. One of the central roles of the attending is to help learners fully experience the experience and reflect upon how things could have been done better. Though not specifically addressed by this study, one wonders if an attending on an intense teaching service has the time to provide that counsel, and even if they do, if the residents are in a mental position to receive it.
This study assesses the implications of a highly intense service on patient outcomes; what is not assessed are the implications for the future patients who will receive care from these residents. In Strangers to Ourselves, Wilson describes the adaptive unconscious: the mind's ability to take routinely performed tasks and put them into an unconscious hard drive such that they can be completed at a later time without any conscious thought.[4] It is adaptive, because it allows multitasking while doing rote activities. However, it is dangerous too, because once a rote task has been relegated to the adaptive unconscious, it is beyond the ability of the conscious mind to inspect and change it. The exponential consequence of imperfect practice is that the wrong thing done again and again settles into the adaptive unconscious, and there it will be for the rest of that resident's career. What is not specifically explored by this study, though nonetheless reasonable to assume, is that as a teaching service's intensity increases, the quality and frequency of attending feedback and resident self‐reflection declines. The risk of a dysfunctional adaptive unconscious is inversely proportional to feedback and self‐reflection.
So how do we redesign the inpatient GME experience to optimize performance? The architect tasked with designing an optimal learning environment for an inpatient service is tasked with addressing both ends of the Yerkes‐Dodson curve. Too low of service intensity, residents lose out on exposure to diverse medical disease, and subsequent engagement in complex decision making requisite for developing their confidence and autonomy. Too high of service intensity, residents lose out on the teaching and feedback from their attendings, and the ability to truly experience and reflect upon the patients for whom they provide care. However, to do this effectively, the GME architect will need an accurate measure of inpatient intensity, something better than our current measures of duty hours and patient caps. Without that, it will be difficult to construct a learning environment that benefits not only the patients of today, but also the patients of tomorrow. One thing is for sure, the intensity of an inpatient service will only increase in the years to come, and the answer to the question of balancing intensity with learning, more than any other, will determine GME effectiveness. Achieving that balance will be a road of a thousand miles, but in raising this central question, this study gives us the first step.
- , , , , . Associations between attending physician workload, teaching effectiveness, and patient safety. J Hosp Med. 2016;11:169–173.
- , . The relation of strength of stimulus to rapidity of habit formation. J Comp Neurol Psychol. 1908;18:459–482.
- . Flow: The Psychology of Optimal Experience. New York, NY: Harper and Row; 1990.
- . Strangers to Ourselves: Discovering the Adaptive Unconscious. Cambridge, MA: Harvard University Press; 2002.
This issue of the Journal of Hospital Medicine highlights an important contribution to the evolving state of graduate medical education (GME). The study assesses the relationship between attending physician workload and teaching effectiveness and patient safety.[1]
From the outset, it is important to note that although the focus of this study is on teaching on the wards, this is not necessarily synonymous with learning on the wards. Even if a busy service compromises a faculty's teaching on the wards, more patients on a service might augment a resident's learning on the wards, from patients, peers, active clinical decision making, and overall exposure to diversity of disease.
The independent variable in this study is intensity, with the presumption that the number of patients is proportional to intensity, as codified by the Accreditation Council for Graduate Medical Education (ACGME) regulations regarding caps for admissions and service size. However, are 10 single‐organ chest pain patients the same intensity of 5 septic patients? The authors address this issue as much as possible by integrating expected mortality as a surrogate measure of intensity. Yet, given the heterogeneity of severity of illness even within a diagnosis, this too is likely to be an inaccurate measure of the true intensity of a service. Of course, such measures do not touch upon the social intensity that varies widely from patient to patient, which might be more time consuming and mentally exhausting than managing the diagnosis itself.
However, these limitations aside, this study's biggest contribution is that it raises the question that will define GME in the years to come, How does learning fluctuate with service intensity? The Yerkes‐Dodson curve was published in 1908, defining the relationship between stress and performance (Figure 1).[2] Many have interpreted the ACGME rules on admission caps and duty hours as being designed to make a kinder, gentler learning environment. However, as the curve suggests, optimizing service intensity (stress) is much more than just being nice; it is about optimizing performance, both in the way of patient care and learning. The question of how learning fluctuates with service intensity might be better framed as, What gets lost in the space as you move to the right of the optimal stress zone on the Yerkes‐Dodson curve?
Quality is first. This study correlates intensity with adverse events, and though there is a modest association, this likely underestimates the true magnitude of the problem. The measures in this study are documented adverse events, and are thus unlikely to capture the near misses that increase with heightened stress and intensity. Mistakes increase as mental bandwidth is insufficient to think through the consequences of each decision. Slipsthings you know you need to do but forget to doincrease as the mind becomes distracted.
Good work is next. All hospitalists know that it is possible to get a patient in and out of the hospital, but it is also possible to do so with such poor quality that the patient comes right back. Csikszentmihalyi described the concept of flow: the ability to become fully immersed in a task, concentrating on nothing except that task at hand.[3] What comes from flow is good work. Achieving flow requires the time to engage in a task, but it also requires that the mind is not distracted by the worry of what else needs to be done. As service intensity increases, so does fragmentation and distractions, both of which are enemies to flow. Achieving flow also might have implications for teaching and learning: Does it matter how good the teacher is, or how often she teaches, if the residents are so distracted that they are not mentally there and ready to receive that teaching?
The presumption underlying all GME is that practice makes perfect. However, practice does not make perfect; perfect practice makes perfect. Furthermore, just because you were physically there for an experience, does not mean you actually experienced it. It is possible to be engaged in a patient encounter, and mentally drive right past it, missing the full implications of the experience that would have presumptively allowed for improvement. The difference between practice and perfect practice is contingent upon mentally being there and upon the ability to reflect upon that experience such that improvement is possible. However, experiencing the experience and reflection require time and mental bandwidth; both are diminished as you move to the right of the optimal zone. One of the central roles of the attending is to help learners fully experience the experience and reflect upon how things could have been done better. Though not specifically addressed by this study, one wonders if an attending on an intense teaching service has the time to provide that counsel, and even if they do, if the residents are in a mental position to receive it.
This study assesses the implications of a highly intense service on patient outcomes; what is not assessed are the implications for the future patients who will receive care from these residents. In Strangers to Ourselves, Wilson describes the adaptive unconscious: the mind's ability to take routinely performed tasks and put them into an unconscious hard drive such that they can be completed at a later time without any conscious thought.[4] It is adaptive, because it allows multitasking while doing rote activities. However, it is dangerous too, because once a rote task has been relegated to the adaptive unconscious, it is beyond the ability of the conscious mind to inspect and change it. The exponential consequence of imperfect practice is that the wrong thing done again and again settles into the adaptive unconscious, and there it will be for the rest of that resident's career. What is not specifically explored by this study, though nonetheless reasonable to assume, is that as a teaching service's intensity increases, the quality and frequency of attending feedback and resident self‐reflection declines. The risk of a dysfunctional adaptive unconscious is inversely proportional to feedback and self‐reflection.
So how do we redesign the inpatient GME experience to optimize performance? The architect tasked with designing an optimal learning environment for an inpatient service is tasked with addressing both ends of the Yerkes‐Dodson curve. Too low of service intensity, residents lose out on exposure to diverse medical disease, and subsequent engagement in complex decision making requisite for developing their confidence and autonomy. Too high of service intensity, residents lose out on the teaching and feedback from their attendings, and the ability to truly experience and reflect upon the patients for whom they provide care. However, to do this effectively, the GME architect will need an accurate measure of inpatient intensity, something better than our current measures of duty hours and patient caps. Without that, it will be difficult to construct a learning environment that benefits not only the patients of today, but also the patients of tomorrow. One thing is for sure, the intensity of an inpatient service will only increase in the years to come, and the answer to the question of balancing intensity with learning, more than any other, will determine GME effectiveness. Achieving that balance will be a road of a thousand miles, but in raising this central question, this study gives us the first step.
- , , , , . Associations between attending physician workload, teaching effectiveness, and patient safety. J Hosp Med. 2016;11:169–173.
- , . The relation of strength of stimulus to rapidity of habit formation. J Comp Neurol Psychol. 1908;18:459–482.
- . Flow: The Psychology of Optimal Experience. New York, NY: Harper and Row; 1990.
- . Strangers to Ourselves: Discovering the Adaptive Unconscious. Cambridge, MA: Harvard University Press; 2002.
Cosmetic Corner: Dermatologists Weigh in on Dermal Fillers
To improve patient care and outcomes, leading dermatologists offered their recommendations on dermal fillers. Consideration must be given to:
- Belotero Balance
Merz North America, Inc
“In my experience, this is the only filler available in the US market that can be used to treat very fine, “etched-in” lines without creating ridges or bumps.”
— Mark G. Rubin, MD, Beverly Hills, California
Recommended by Gary Goldenberg, MD, New York, New York
- Juvéderm Voluma XC
Allergan, Inc
“This is a longer-lasting dermal filler great for adding structural support and lift in the zygoma, chin, and jawline.”
—Anthony M. Rossi, MD, New York, New York
Recommended by Gary Goldenberg, MD, New York, New York
- Radiesse
Merz North America, Inc
Recommended by Gary Goldenberg, MD, New York, New York
- Restylane Lyft and Restylane Silk
Galderma Laboratories, LP
Recommended by Gary Goldenberg, MD, New York, New York
- Sculptra Aesthetic
Galderma Laboratories, LP
Recommended by Gary Goldenberg, MD, New York, New York
Cutis invites readers to send us their recommendations. Antiperspirants, shampoos, and conditioners will be featured in upcoming editions of Cosmetic Corner. Please e-mail your recommendation(s) to the Editorial Office.
Disclaimer: Opinions expressed herein do not necessarily reflect those of Cutis or Frontline Medical Communications Inc. and shall not be used for product endorsement purposes. Any reference made to a specific commercial product does not indicate or imply that Cutis or Frontline Medical Communications Inc. endorses, recommends, or favors the product mentioned. No guarantee is given to the effects of recommended products.

Point/Counterpoint: Self-employed community practice is still a viable proposition
YES
The recent 2-year bipartisan budget deal signed by President Obama and sent up by Congress brought the hammer down on hospitals so quickly that they did not see it coming. It is highly unusual for Congress to keep anything secreted from the American Hospital Association (AHA) lobby. The AHA spent $4.6 million in the first quarter of 2015 for an annual estimated expenditure of about $18 million. This does not include dollars spent by local and state hospital associations. The SVS is clearly dwarfed by these powerful interests. Our society spent less than $100,000 in that same quarter on advocating for over 4,000 members, the majority of whom are United States residents and most of whom depend solely on the SVS to look out for them.
As a result of the budget deal, Medicare will not pay most hospital-owned physician practices higher rates than those of independently owned practices. The reimbursement changes will apply to those hospital-owned physician practices acquired or opened since the date the law was signed and also located farther than 250 yards from a hospital’s main campus. It does grandfather in facilities prior to the signing that were being reimbursed with hospital outpatient department (HOPD) rates. The savings will prevent an increase in premiums for about 15 million Medicare beneficiaries. The AHA expressed its outrage while the AARP celebrated. So did independent physicians who have been protesting all along that costs were rising because of excessive payments to hospitals for essentially the same services.
Margot Sanger-Katz, in a column for “The Upshot” in the New York Times, wrote that it had been estimated that correcting this payment differential would save Medicare $30 billion over 10 years, more than Medicare could save if it raised the Medicare eligibility age to 67!1 She also pointed out that the Medicare Payment Advisory Committee (MedPAC), an independent group that advises Congress, thinks “that the pay differences should be narrowed, but only for a select set of medical services in which it’s really clear that there’s no difference between the care offered by a hospital and a physician office.”

The rush to buy physician practices is being done for many reasons but the disparate payment schedule favoring hospital-owned practices for many of the same services is one reason. The hospital brings in a lot more revenue through its hired physicians providing the same service in their offices that are now under the banner of the health system. The hospitals cite several justifications for the “surcharge” on care provided by employed physicians in hospital facilities, some of which may be valid. Regulatory requirements, sicker inpatients, increased cost due to training programs, and being required to support money-losing services such as burn care are some reasons. But, independent physicians say they provide the same or better quality care at a lower cost without resources such as legal, accounting, self-insurance against professional liability, and robust lobbying firms.
Hospitals have also contended that vertical integration by buying physician practices should lead to lower health care costs by squeezing efficiencies within the system. There have been conflicting reports on whether physician hospital integration leads to lower health care expenditures.2 The public debate has caught the attention of government regulators. In the recent case of Saint Lukes-Saltzer, the question before the Federal Trade Commission (the agency responsible for federal antitrust action) was: Did total medical expenditures increase or decrease for patients cared for by physician practices acquired by St. Luke’s? Indeed, the conclusions were that not only did overall costs not go down but evidence showed that the merger may have resulted in increased costs.
On appeal, the Ninth Circuit Court ruled that any future efficiency must be “substantial, verifiable and specific” to the merger. Ciliberto and Dranove looked at hospital prices after physician hospital affiliations in California and found no evidence of increase in prices.3 Baker and coauthors analyzed privately insured patients between 2001 and 2007 and the effect of physician hospital integration on hospital prices, admission volumes, and spending.4 They reported higher hospital prices and spending in hospitals with the tightest vertically integrated relationship with physicians. In one of the few studies of the issue, Capps and colleagues reviewed 7 years of administrative data from multiple insurers across the United States to estimate postintegration costs. From 2007 to 2013, they found that there was a 57% increase in the share of spending by physicians whose practices are owned by hospitals. In addition, this led to an increase in physician prices of 14% post integration.5 The larger the market share of inpatients by a hospital the larger the price increase. The authors estimate that about 25% of the price increases are precisely due to “exploitation of reimbursement rules” by charging the facility fees for their employed physicians. If these “surcharges” led to decreased utilization as one measure of increased efficiency and therefore reduced overall health care costs, it would be acceptable. But, Capps et al. found no such evidence and speculate that this scenario could lead to higher expenditures.
In a recent study, total expenditures for over 4 million patients by private physician groups or integrated groups covered by health maintenance organizations (HMOs) in California between 2009 and 2012 were analyzed.6 Mean annual expenditures were highest for large multihospital systems followed by hospital-owned physician groups and, lastly, physician-owned groups. The expenditures for multihospital systems were 19.8% higher and for local hospital-employed physician groups 10% higher compared to physician-owned organizations.
Why should prices increase after tighter physician hospital integration on a large scale? Market power. Once health systems have a large enough number of physicians in their panel, hospitals could charge insurers higher prices to access their specialists. Similarly, by employing a large number of physicians in a particular specialty, which then attracts a large pool of patients with a particular illness, they could dominate the other health systems in the region. One action specifically forbidden by anti-kickback laws is compensating physicians based on the number of referrals they make to the hospital. But, there are enough loopholes that allow hospitals to indirectly tie compensation to “productivity.” This may change with bundled payments or compensation tied to “value,” although there will always be incentives for work volume to some degree.
A further roadblock for basing merger decisions entirely on possible efficiencies is how the courts will see these activities in terms of antitrust actions. Most arguments using efficiency as the basis for merging physician groups with hospitals are vague and in general courts have not superseded antitrust actions with economic efficiency arguments.
What should be genuine reasons for hospitals employing and aligning with physicians? Addressing uneven quality of care, access and, of course, ever spiraling costs. If the object was to share responsibility for attacking these problems, health care systems and physicians would be cut a lot of slack. But, some health care systems want to not only survive the existing chaos but also dominate their local market.
I guess health care is really no different from Wall Street corporations in its focus on short-term gains versus long-term benefits. Until broader incentives change, health systems will continue to look to survive and gain market share and power. Competition, in isolation, drives tactics where the only objective may be to increase market share. However, it appears that the FTC will be busy wielding the Sherman Act of the antitrust law to keep a check on health systems to ensure consumers, payers, physicians, and the country at large are all on a fair playing field.7
Dr. Satiani is professor of clinical surgery, division of vascular diseases & surgery, department of surgery, associate director, FAME; director, Faculty Leadership Institute, and medical director, Vascular Labs, at Ohio State University College of Medicine, Columbus. He is also an associate medical editor for Vascular Specialist.
References
2. Journal of Health Economics 2006; 25: 1-28.
3. Journal of Health Economics 2006; 25: 29-38.
4. Health Affairs 2014; 33(5): 756-63.
5. www.ipr.northwestern.edu/publications/docs/workingpapers/2015/IPR-WP-15-02.pdf
6. JAMA. 2014; 312(16):1663-9.
7. Plastic & Reconstructive Surgery. 2006; 117(3): 1012-22.
NO
The days of hanging one’s shingle on a door and starting a self-employed practice are rapidly fading. While some fondly remember the practice of medicine as it was in Norman Rockwell’s classic “Before the Shot,” the realities of a current practice couldn’t be more different. Reusable syringes, analog weighing stations, an unaccompanied minor, and lack of regard for universal precautions are just a few examples from that painting that have long since disappeared. However, the humor in this painting comes from the young boy scrutinizing the doctor’s credentials, implying a sense of distrust and fear as he stands there with his buttocks partially exposed waiting for the vaccination.
This scrutiny of physician performance and results is more relevant today than ever before. Perhaps if we were to update the painting today, it would depict the boy furiously tapping away at his tablet searching through ProPublica to see what the doctor’s complication rate with the intended procedure truly is.
This is just one of the many pressures physicians are facing today. Navigating the publicly reported complication data is but one tiny portion of the regulatory red tape physicians face in taking care of their patients. If you add in the need to negotiate and contact with insurers, manage an office staff, acquire and maintain an electronic medical record (EMR) while ensuring that your EMR is properly secured against potential cyber threats and compliant with meaningful use regulations, audit your billing and coding, keep up to date with upcoming changes to bundled payments, mail out and track Hospital Consumer Assessment of Healthcare Providers and Systems (HCAHPS), as well as an endless list of other requirements, it is no wonder physicians are less willing to take these challenges on as solo practitioners. In fact, based on Medscape’s 2014 Employed Doctors Report, which compiled responses from over 4,600 physicians, the top three reasons for being an employed physician were not having to deal with the business of running an office (58%), not having to deal with insurers and billing (45%), and guaranteed income/even cash flow (42%).1
Multiple sources continue to confirm the trend that more physicians are moving to an employed practice.2-4 In the last decade, the rate of hospital employment has increased from 11% to 64%.1 There are many factors that have pushed physicians away from self-employment. Some of these are related to physicians’ personal choices, and many are from external pressures. As various parts of the Affordable Care Act come into play, there will continue to be increasing regulatory demands. These have the potential of increasing overhead costs, and, coupled with decreasing reimbursement, will inevitably make staying profitable more challenging in a self-employed model.
There are two other very telling trends that foretell the inevitable decline of self-employed physicians. Fewer and fewer new graduates are reporting that they are self employed. In the most recent surveys, twice as many physicians under the age of 40 are employed than self-employed.1 Furthermore, 92% of residents surveyed in their final year would prefer employment with a salary, and only 2% would consider solo practice.5 Of these graduating residents, 36% specifically were considering hospital employment, which is nearly a 10-fold increase from a decade ago. The second factor affecting new hires is their confidence that they have the necessary skills to manage a self-employed model. During the same decade, there was only a small increase in graduating residents who felt very prepared to deal with the business side of medicine (10% vs. 2%).5 This lack of knowledge will undoubtedly make it difficult for those who would consider self-employment to feel comfortable in that practice model. Some have speculated that there is soon to be a “push back” from the physicians and specifically from specialists who don’t have as much to gain in large group practices. With so few graduates considering solo and small group practice, and the overwhelming majority not feeling very prepared to manage the business of medicine, who can help lead this trend reversal?
Not only are fewer new graduates choosing self-employment, but fewer opportunities for self-employment are available as more physician groups are being bought by hospitals or other large group practices. Specifically with vascular surgery, there is a significant overhead cost requirement. Advantages to joining a large group practice include better ability to negotiate cost savings with the frequent capital requirements for new equipment, updates and maintenance of the electronic records, and professional liability. In fact, one study in California shows that as the proportion of physicians employed by the health system increased, supply chain expenses and inventory costs improved.6 Furthermore, hospitals have administrators who are hired to negotiate with insurers regarding reimbursement and respond to audits and other regulatory changes. As mentioned above, the top two reasons for avoiding self-employment are precisely these. This will no doubt draw even more physicians and specifically vascular surgeons into employed models.
Dr. Haurani is assistant professor of surgery in the division of vascular diseases and surgery, Ohio State University Medical Center, Columbus.
References
1. www.medscape.com/features/slideshow/public/employed-doctors#1
3.Perspect Vasc Surg Endovasc Ther. 2013;25:46-52.
4 Tenn Med. 2012;105:38-39.
5.www.merritthawkins.com/uploadedFiles/MerrittHawkings/Surveys/2014_MerrittHawkins_FYMR_Survey.pdf.
6. Health Care Manage Rev. 2015 Jul 23. [Epub ahead of print] www.ncbi.nlm.nih.gov/pubmed/26207654
YES
The recent 2-year bipartisan budget deal signed by President Obama and sent up by Congress brought the hammer down on hospitals so quickly that they did not see it coming. It is highly unusual for Congress to keep anything secreted from the American Hospital Association (AHA) lobby. The AHA spent $4.6 million in the first quarter of 2015 for an annual estimated expenditure of about $18 million. This does not include dollars spent by local and state hospital associations. The SVS is clearly dwarfed by these powerful interests. Our society spent less than $100,000 in that same quarter on advocating for over 4,000 members, the majority of whom are United States residents and most of whom depend solely on the SVS to look out for them.
As a result of the budget deal, Medicare will not pay most hospital-owned physician practices higher rates than those of independently owned practices. The reimbursement changes will apply to those hospital-owned physician practices acquired or opened since the date the law was signed and also located farther than 250 yards from a hospital’s main campus. It does grandfather in facilities prior to the signing that were being reimbursed with hospital outpatient department (HOPD) rates. The savings will prevent an increase in premiums for about 15 million Medicare beneficiaries. The AHA expressed its outrage while the AARP celebrated. So did independent physicians who have been protesting all along that costs were rising because of excessive payments to hospitals for essentially the same services.
Margot Sanger-Katz, in a column for “The Upshot” in the New York Times, wrote that it had been estimated that correcting this payment differential would save Medicare $30 billion over 10 years, more than Medicare could save if it raised the Medicare eligibility age to 67!1 She also pointed out that the Medicare Payment Advisory Committee (MedPAC), an independent group that advises Congress, thinks “that the pay differences should be narrowed, but only for a select set of medical services in which it’s really clear that there’s no difference between the care offered by a hospital and a physician office.”
The rush to buy physician practices is being done for many reasons but the disparate payment schedule favoring hospital-owned practices for many of the same services is one reason. The hospital brings in a lot more revenue through its hired physicians providing the same service in their offices that are now under the banner of the health system. The hospitals cite several justifications for the “surcharge” on care provided by employed physicians in hospital facilities, some of which may be valid. Regulatory requirements, sicker inpatients, increased cost due to training programs, and being required to support money-losing services such as burn care are some reasons. But, independent physicians say they provide the same or better quality care at a lower cost without resources such as legal, accounting, self-insurance against professional liability, and robust lobbying firms.
Hospitals have also contended that vertical integration by buying physician practices should lead to lower health care costs by squeezing efficiencies within the system. There have been conflicting reports on whether physician hospital integration leads to lower health care expenditures.2 The public debate has caught the attention of government regulators. In the recent case of Saint Lukes-Saltzer, the question before the Federal Trade Commission (the agency responsible for federal antitrust action) was: Did total medical expenditures increase or decrease for patients cared for by physician practices acquired by St. Luke’s? Indeed, the conclusions were that not only did overall costs not go down but evidence showed that the merger may have resulted in increased costs.
On appeal, the Ninth Circuit Court ruled that any future efficiency must be “substantial, verifiable and specific” to the merger. Ciliberto and Dranove looked at hospital prices after physician hospital affiliations in California and found no evidence of increase in prices.3 Baker and coauthors analyzed privately insured patients between 2001 and 2007 and the effect of physician hospital integration on hospital prices, admission volumes, and spending.4 They reported higher hospital prices and spending in hospitals with the tightest vertically integrated relationship with physicians. In one of the few studies of the issue, Capps and colleagues reviewed 7 years of administrative data from multiple insurers across the United States to estimate postintegration costs. From 2007 to 2013, they found that there was a 57% increase in the share of spending by physicians whose practices are owned by hospitals. In addition, this led to an increase in physician prices of 14% post integration.5 The larger the market share of inpatients by a hospital the larger the price increase. The authors estimate that about 25% of the price increases are precisely due to “exploitation of reimbursement rules” by charging the facility fees for their employed physicians. If these “surcharges” led to decreased utilization as one measure of increased efficiency and therefore reduced overall health care costs, it would be acceptable. But, Capps et al. found no such evidence and speculate that this scenario could lead to higher expenditures.
In a recent study, total expenditures for over 4 million patients by private physician groups or integrated groups covered by health maintenance organizations (HMOs) in California between 2009 and 2012 were analyzed.6 Mean annual expenditures were highest for large multihospital systems followed by hospital-owned physician groups and, lastly, physician-owned groups. The expenditures for multihospital systems were 19.8% higher and for local hospital-employed physician groups 10% higher compared to physician-owned organizations.
Why should prices increase after tighter physician hospital integration on a large scale? Market power. Once health systems have a large enough number of physicians in their panel, hospitals could charge insurers higher prices to access their specialists. Similarly, by employing a large number of physicians in a particular specialty, which then attracts a large pool of patients with a particular illness, they could dominate the other health systems in the region. One action specifically forbidden by anti-kickback laws is compensating physicians based on the number of referrals they make to the hospital. But, there are enough loopholes that allow hospitals to indirectly tie compensation to “productivity.” This may change with bundled payments or compensation tied to “value,” although there will always be incentives for work volume to some degree.
A further roadblock for basing merger decisions entirely on possible efficiencies is how the courts will see these activities in terms of antitrust actions. Most arguments using efficiency as the basis for merging physician groups with hospitals are vague and in general courts have not superseded antitrust actions with economic efficiency arguments.
What should be genuine reasons for hospitals employing and aligning with physicians? Addressing uneven quality of care, access and, of course, ever spiraling costs. If the object was to share responsibility for attacking these problems, health care systems and physicians would be cut a lot of slack. But, some health care systems want to not only survive the existing chaos but also dominate their local market.
I guess health care is really no different from Wall Street corporations in its focus on short-term gains versus long-term benefits. Until broader incentives change, health systems will continue to look to survive and gain market share and power. Competition, in isolation, drives tactics where the only objective may be to increase market share. However, it appears that the FTC will be busy wielding the Sherman Act of the antitrust law to keep a check on health systems to ensure consumers, payers, physicians, and the country at large are all on a fair playing field.7
Dr. Satiani is professor of clinical surgery, division of vascular diseases & surgery, department of surgery, associate director, FAME; director, Faculty Leadership Institute, and medical director, Vascular Labs, at Ohio State University College of Medicine, Columbus. He is also an associate medical editor for Vascular Specialist.
References
2. Journal of Health Economics 2006; 25: 1-28.
3. Journal of Health Economics 2006; 25: 29-38.
4. Health Affairs 2014; 33(5): 756-63.
5. www.ipr.northwestern.edu/publications/docs/workingpapers/2015/IPR-WP-15-02.pdf
6. JAMA. 2014; 312(16):1663-9.
7. Plastic & Reconstructive Surgery. 2006; 117(3): 1012-22.
NO
The days of hanging one’s shingle on a door and starting a self-employed practice are rapidly fading. While some fondly remember the practice of medicine as it was in Norman Rockwell’s classic “Before the Shot,” the realities of a current practice couldn’t be more different. Reusable syringes, analog weighing stations, an unaccompanied minor, and lack of regard for universal precautions are just a few examples from that painting that have long since disappeared. However, the humor in this painting comes from the young boy scrutinizing the doctor’s credentials, implying a sense of distrust and fear as he stands there with his buttocks partially exposed waiting for the vaccination.
This scrutiny of physician performance and results is more relevant today than ever before. Perhaps if we were to update the painting today, it would depict the boy furiously tapping away at his tablet searching through ProPublica to see what the doctor’s complication rate with the intended procedure truly is.
This is just one of the many pressures physicians are facing today. Navigating the publicly reported complication data is but one tiny portion of the regulatory red tape physicians face in taking care of their patients. If you add in the need to negotiate and contact with insurers, manage an office staff, acquire and maintain an electronic medical record (EMR) while ensuring that your EMR is properly secured against potential cyber threats and compliant with meaningful use regulations, audit your billing and coding, keep up to date with upcoming changes to bundled payments, mail out and track Hospital Consumer Assessment of Healthcare Providers and Systems (HCAHPS), as well as an endless list of other requirements, it is no wonder physicians are less willing to take these challenges on as solo practitioners. In fact, based on Medscape’s 2014 Employed Doctors Report, which compiled responses from over 4,600 physicians, the top three reasons for being an employed physician were not having to deal with the business of running an office (58%), not having to deal with insurers and billing (45%), and guaranteed income/even cash flow (42%).1
Multiple sources continue to confirm the trend that more physicians are moving to an employed practice.2-4 In the last decade, the rate of hospital employment has increased from 11% to 64%.1 There are many factors that have pushed physicians away from self-employment. Some of these are related to physicians’ personal choices, and many are from external pressures. As various parts of the Affordable Care Act come into play, there will continue to be increasing regulatory demands. These have the potential of increasing overhead costs, and, coupled with decreasing reimbursement, will inevitably make staying profitable more challenging in a self-employed model.
There are two other very telling trends that foretell the inevitable decline of self-employed physicians. Fewer and fewer new graduates are reporting that they are self employed. In the most recent surveys, twice as many physicians under the age of 40 are employed than self-employed.1 Furthermore, 92% of residents surveyed in their final year would prefer employment with a salary, and only 2% would consider solo practice.5 Of these graduating residents, 36% specifically were considering hospital employment, which is nearly a 10-fold increase from a decade ago. The second factor affecting new hires is their confidence that they have the necessary skills to manage a self-employed model. During the same decade, there was only a small increase in graduating residents who felt very prepared to deal with the business side of medicine (10% vs. 2%).5 This lack of knowledge will undoubtedly make it difficult for those who would consider self-employment to feel comfortable in that practice model. Some have speculated that there is soon to be a “push back” from the physicians and specifically from specialists who don’t have as much to gain in large group practices. With so few graduates considering solo and small group practice, and the overwhelming majority not feeling very prepared to manage the business of medicine, who can help lead this trend reversal?
Not only are fewer new graduates choosing self-employment, but fewer opportunities for self-employment are available as more physician groups are being bought by hospitals or other large group practices. Specifically with vascular surgery, there is a significant overhead cost requirement. Advantages to joining a large group practice include better ability to negotiate cost savings with the frequent capital requirements for new equipment, updates and maintenance of the electronic records, and professional liability. In fact, one study in California shows that as the proportion of physicians employed by the health system increased, supply chain expenses and inventory costs improved.6 Furthermore, hospitals have administrators who are hired to negotiate with insurers regarding reimbursement and respond to audits and other regulatory changes. As mentioned above, the top two reasons for avoiding self-employment are precisely these. This will no doubt draw even more physicians and specifically vascular surgeons into employed models.
Dr. Haurani is assistant professor of surgery in the division of vascular diseases and surgery, Ohio State University Medical Center, Columbus.
References
1. www.medscape.com/features/slideshow/public/employed-doctors#1
3.Perspect Vasc Surg Endovasc Ther. 2013;25:46-52.
4 Tenn Med. 2012;105:38-39.
5.www.merritthawkins.com/uploadedFiles/MerrittHawkings/Surveys/2014_MerrittHawkins_FYMR_Survey.pdf.
6. Health Care Manage Rev. 2015 Jul 23. [Epub ahead of print] www.ncbi.nlm.nih.gov/pubmed/26207654
Cold weather linked to increase in strokes, MI
ORLANDO – Cold temperature days were associated with a 28% increase in the risk of MI and a 15% increase in stroke over an 18-year period in Ontario, Hong Chen, Ph.D., reported at the American Heart Association scientific sessions.
The relationship between air temperature and cardiovascular events mapped out as a U-shaped pattern, with the lowest-risk trough occurring on days when the temperature averaged 54º F. However, the U-shape was skewed such that the increased risk achieved significance on the cold but not hot days, according to Dr. Chen of Public Health Ontario and the University of Toronto.

He and his coinvestigators looked at the relationship between daily temperature and cardiovascular risk because the epidemiologic data in this area was sparse even though there are intriguing animal studies suggesting that extreme cold weather can induce a prothrombotic inflammatory reaction and hypercoagulable state.
The investigators matched daily temperature and cardiovascular hospital admission data for all 14 health districts in the sprawling province of Ontario for the period 1996-2013. During the study period, there were 443,447 hospitalizations for acute MI, 355,837 for stroke, 237,979 for ischemic stroke, and 1.4 million admissions coded as ischemic heart disease.
In a multivariate analysis controlling for influenza activity, air pollution levels, relative humidity, and day of the week, the adjusted rate of admissions for MI was 28% greater on the coldest 1% of days than on days where the temperature averaged the optimal 54º F. The coldest days were also associated with a 12% increase in the risk of admission for ischemic heart disease, a 15% increase in stroke, and a 19% increase in ischemic stroke.
Dr. Chen and his coworkers also examined their mountain of data to see how selected comorbid conditions might affect temperature-related risk. They found that the risk of admission for ischemic heart disease on cold days was greatest among individuals with a history of conduction disorders, while the risk of cold-related stroke was highest in Ontarians with preexisting arrhythmias.
Dr. Chen reported having no financial conflicts of interest regarding this public health study.
ORLANDO – Cold temperature days were associated with a 28% increase in the risk of MI and a 15% increase in stroke over an 18-year period in Ontario, Hong Chen, Ph.D., reported at the American Heart Association scientific sessions.
The relationship between air temperature and cardiovascular events mapped out as a U-shaped pattern, with the lowest-risk trough occurring on days when the temperature averaged 54º F. However, the U-shape was skewed such that the increased risk achieved significance on the cold but not hot days, according to Dr. Chen of Public Health Ontario and the University of Toronto.
He and his coinvestigators looked at the relationship between daily temperature and cardiovascular risk because the epidemiologic data in this area was sparse even though there are intriguing animal studies suggesting that extreme cold weather can induce a prothrombotic inflammatory reaction and hypercoagulable state.
The investigators matched daily temperature and cardiovascular hospital admission data for all 14 health districts in the sprawling province of Ontario for the period 1996-2013. During the study period, there were 443,447 hospitalizations for acute MI, 355,837 for stroke, 237,979 for ischemic stroke, and 1.4 million admissions coded as ischemic heart disease.
In a multivariate analysis controlling for influenza activity, air pollution levels, relative humidity, and day of the week, the adjusted rate of admissions for MI was 28% greater on the coldest 1% of days than on days where the temperature averaged the optimal 54º F. The coldest days were also associated with a 12% increase in the risk of admission for ischemic heart disease, a 15% increase in stroke, and a 19% increase in ischemic stroke.
Dr. Chen and his coworkers also examined their mountain of data to see how selected comorbid conditions might affect temperature-related risk. They found that the risk of admission for ischemic heart disease on cold days was greatest among individuals with a history of conduction disorders, while the risk of cold-related stroke was highest in Ontarians with preexisting arrhythmias.
Dr. Chen reported having no financial conflicts of interest regarding this public health study.
AT THE AHA SCIENTIFIC SESSIONS
Key clinical point: Expect noticeably more hospital admissions for stroke and ischemic heart disease on cold weather days.
Major finding: Cold weather brought a 15% increase in the risk of hospital admission for stroke and a 28% rise in admissions for acute MI in Ontario, compared with days when the average temperature was 54º F.
Data source: This retrospective study looked at the association between daily temperature and the risk of hospital admission for acute MI, stroke, and other cardiovascular events over an 18-year period across Ontario.
Disclosures: The presenter reported having no financial conflicts of interest regarding this public health study.

ACR: Etanercept during pregnancy doubles the odds of major malformations
SAN FRANCISCO – Etanercept during pregnancy more than doubled the risk of major congenital malformations in a study by the Organization of Teratology Information Specialists.
The group keeps a prospective registry on exposures to biologics during pregnancy. It is finishing up its adalimumab (Humira) investigation and hasn’t found much to worry about, and continues to gather data on abatacept (Orencia), tocilizumab (Actemra), tofacitinib (Xeljanz), apremilast (Otezla), and certolizumab pegol (Cimzia).

Etanercept (Enbrel), however, seems to be a different story; major malformations turned up in the group’s recently completed investigation. Even so, Organization of Teratology Information Specialists (OTIS) investigator Dr. Christina D. Chambers, Ph.D., of the University of California, San Diego, was careful to note at the annual meeting of the American College of Rheumatology that “etanercept is not meeting the criteria for causality. There’s no pattern” in major defects and “no biological plausibility” because the drug doesn’t seem to cross the placenta when the fetus is most vulnerable to adverse outcomes.
“It is difficult to draw the conclusion that this drug is causing harm. With true teratogens, you tend to see reduced birth weights and an increased risk of spontaneous abortion, which is not the case with etanercept. We are seeing only this one finding that kind of stands alone, and everything else looks pretty good,” she said.
The etanercept study investigated pregnancy outcomes in 370 women exposed to the drug while pregnant, mostly women with rheumatoid arthritis, but also women with psoriasis and ankylosing spondylitis. Their outcomes were compared with 164 pregnant women with the same diseases but no etanercept exposure – the disease control group – and 296 healthy pregnant women.
Women in all three groups were about 33 years old on average, and about 80% were white. The women were enrolled toward the end of their first trimester. Disease severity, comorbidities, and use of vitamins, alcohol, and tobacco were similar between etanercept and disease control women. About 40% of the etanercept and disease control women, but just one in the healthy pregnancy group, were exposed to systemic corticosteroids while pregnant.
There were 33 major structural defects in children born to women taking etanercept versus 7 in the disease control group. That translated to a more than doubling of risk with etanercept (odds ratio, 2.37; 95% confidence interval, 1.02-5.52), and a more than doubling of risk versus the 10 major structural defects in children born to healthy control women (OR, 2.91; 95% CI, 1.37-6.76).
A subanalysis excluded chromosomal anomalies, but “did not [change] our conclusions,” Dr. Chambers said.
Major structural defects generally refer to problems that need a surgical fix, including spina bifida, atrial septal defects, cleft palates, hypospadias, polydactyly, and craniosynostosis.
Minor defects that don’t need surgery, like a missing earlobe, occurred in six children exposed to etanercept and showed two different patterns that involved “three specific minor malformations” not seen in either of the control groups, Dr. Chambers said. She did not elaborate on what those patterns were, but noted that the parents usually had them, too, “suggesting a genetic component as opposed to a drug effect.”
Children in the three study groups had no statistically significant differences in 1-year malignancy rates, serious infections, and hospitalizations, even when exposed to etanercept in the third trimester.
Children exposed to etanercept, however, were more likely to be born preterm and more likely to be small for gestational age in weight, length, and head circumference. They were also more likely than disease control children to screen positive for developmental issues at 1 year, but none of those differences were statistically significant.
Dr. Chambers disclosed funding from 14 companies, including Amgen, the maker of etanercept, and Janssen, Pfizer, Roche, Sanofi/Genzyme, GlaxoSmithKline, and AbbVie, the maker of adalimumab.
SAN FRANCISCO – Etanercept during pregnancy more than doubled the risk of major congenital malformations in a study by the Organization of Teratology Information Specialists.
The group keeps a prospective registry on exposures to biologics during pregnancy. It is finishing up its adalimumab (Humira) investigation and hasn’t found much to worry about, and continues to gather data on abatacept (Orencia), tocilizumab (Actemra), tofacitinib (Xeljanz), apremilast (Otezla), and certolizumab pegol (Cimzia).
Etanercept (Enbrel), however, seems to be a different story; major malformations turned up in the group’s recently completed investigation. Even so, Organization of Teratology Information Specialists (OTIS) investigator Dr. Christina D. Chambers, Ph.D., of the University of California, San Diego, was careful to note at the annual meeting of the American College of Rheumatology that “etanercept is not meeting the criteria for causality. There’s no pattern” in major defects and “no biological plausibility” because the drug doesn’t seem to cross the placenta when the fetus is most vulnerable to adverse outcomes.
“It is difficult to draw the conclusion that this drug is causing harm. With true teratogens, you tend to see reduced birth weights and an increased risk of spontaneous abortion, which is not the case with etanercept. We are seeing only this one finding that kind of stands alone, and everything else looks pretty good,” she said.
The etanercept study investigated pregnancy outcomes in 370 women exposed to the drug while pregnant, mostly women with rheumatoid arthritis, but also women with psoriasis and ankylosing spondylitis. Their outcomes were compared with 164 pregnant women with the same diseases but no etanercept exposure – the disease control group – and 296 healthy pregnant women.
Women in all three groups were about 33 years old on average, and about 80% were white. The women were enrolled toward the end of their first trimester. Disease severity, comorbidities, and use of vitamins, alcohol, and tobacco were similar between etanercept and disease control women. About 40% of the etanercept and disease control women, but just one in the healthy pregnancy group, were exposed to systemic corticosteroids while pregnant.
There were 33 major structural defects in children born to women taking etanercept versus 7 in the disease control group. That translated to a more than doubling of risk with etanercept (odds ratio, 2.37; 95% confidence interval, 1.02-5.52), and a more than doubling of risk versus the 10 major structural defects in children born to healthy control women (OR, 2.91; 95% CI, 1.37-6.76).
A subanalysis excluded chromosomal anomalies, but “did not [change] our conclusions,” Dr. Chambers said.
Major structural defects generally refer to problems that need a surgical fix, including spina bifida, atrial septal defects, cleft palates, hypospadias, polydactyly, and craniosynostosis.
Minor defects that don’t need surgery, like a missing earlobe, occurred in six children exposed to etanercept and showed two different patterns that involved “three specific minor malformations” not seen in either of the control groups, Dr. Chambers said. She did not elaborate on what those patterns were, but noted that the parents usually had them, too, “suggesting a genetic component as opposed to a drug effect.”
Children in the three study groups had no statistically significant differences in 1-year malignancy rates, serious infections, and hospitalizations, even when exposed to etanercept in the third trimester.
Children exposed to etanercept, however, were more likely to be born preterm and more likely to be small for gestational age in weight, length, and head circumference. They were also more likely than disease control children to screen positive for developmental issues at 1 year, but none of those differences were statistically significant.
Dr. Chambers disclosed funding from 14 companies, including Amgen, the maker of etanercept, and Janssen, Pfizer, Roche, Sanofi/Genzyme, GlaxoSmithKline, and AbbVie, the maker of adalimumab.
AT THE ACR ANNUAL MEETING
Key clinical point: Although etanercept exposure was associated with more than twofold higher odds of major structural defects, there was no pattern to the defects and no biological plausibility to etanercept causing the defects.
Major finding: There were 33 major structural defects in children born to etanercept women versus 7 in a disease comparison group, translating to a more than doubling of risk with etanercept (OR, 2.37; 95% CI, 1.02-5.52).
Data source: Prospective investigation of 830 pregnant women.
Disclosures: The presenting investigator disclosed funding from 14 companies, including Amgen, the maker of etanercept, and AbbVie, the maker of adalimumab.
January 2016 Quiz 2
Q2: ANSWER: B
Critique
Cyclic vomiting syndrome (CVS) is characterized by typical vomiting episodes regarding onset and duration, which usually occur three or more times per year. Typically, there is absence of nausea and vomiting between episodes. CVS affects both genders; however, there does appear to be a hormonal influence in women, with 57% of women with CVS reporting an association with menses. Tricyclic antidepressants have been shown to be effective as a prophylactic agent in several small studies with amitriptyline being the most commonly studied medication. Namin and colleagues investigated 31 adult patients who fit the Rome II criteria for CVS. Twenty-seven patients were treated with amitriptyline and completed scales for anxiety, depression, and symptoms. Eighty-four percent suffered from an anxiety disorder, and 78% revealed depression. The patients were started on a low dose of amitriptyline and titrated up to a goal of 1 mg/kg per day. After an average of 16.8 months, the Visual Analog Scale revealed a significant mean improvement (P less than .05) in severity of their symptoms by 6.1. Additionally, there was 78% improvement in vomiting, 75.3% improvement in pain, and 69.3% improvement in nausea.
Choice A: Domperidone has not been found to be beneficial in CVS.
Choice C: Metoclopramide does not decrease symptom recurrence in CVS.
Choice D: Selective serotonin reuptake inhibitors have not been shown in clinical trials to decrease CVS recurrence.
Choice E: Proton pump inhibitors can help as an adjunct to suppress gastric secretion. However, they do not decrease the frequency of CVS episodes.
References
- Namin F., et al. Clinical, psychiatric, and manometric profile of cyclic vomiting syndrome in adults and response to tricyclic therapy. Neurogastroenterol Motil. 2007;19:196-202.
January 2016 Quiz 1
Q1: ANSWER: E
Critique
The incidence of bacterial infections in patients with cirrhosis with and without ascites who are admitted to the hospital with an upper GI bleed is 45% and studies have shown that the use of short-term (less than 7 days) prophylactic antibiotics is associated with lower rates of bacterial infections and lower risk for bleeding and death. Nadolol, a noncardioselective beta-blocker, is not helpful in active bleeding from gastric fundic varices. Imaging studies are the second step in the management of the patient to look for splenic vein thrombosis as a cause for fundic gastric varices. In cases where isolated gastric fundic varices are due to splenic vein thrombosis the treatment would be surgical referral for splenectomy.
References
- Chavez-Tapia N.C., Barrientos-Gutierrez T., Tellez-Avila F.I., et al. Antibiotic prophylaxis for cirrhotic patients with upper gastrointestinal bleeding. Cochrane Database Syst Rev. 2010;Sep 8:CD002907.
- Hou M.C., Lin H.C., Liu T.T., et al. Antibiotic prophylaxis after endoscopic therapy prevents rebleeding in acute variceal hemorrhage: a randomized trial. Hepatology. 2004;39:746-53.
- Rimola A., García-Tsao G., Navasa M., et al. Diagnosis, treatment and prophylaxis of spontaneous bacterial peritonitis: a consensus document. International Ascites Club. J Hepatol. 2000 Jan;32:142-53.
Gastroenterology research needs your support
Many breakthroughs have been achieved through gastroenterological and hepatological research over the past century, forming the basis of the modern medical practice. As the charitable arm of the American Gastroenterological Association (AGA), the AGA Research Foundation contributes to this tradition of discovery to combat the continued loss of life and suffering brought on by digestive diseases.
The AGA Research Foundation is committed to closing the gap in research funding. The foundation serves the physicians and scientists who research, diagnose, prevent, and treat diseases of the gastrointestinal tract and liver and serves the patients whose lives and well-being depend on AGA’s members.
“This award is an invaluable asset to the start of my career in the field of pediatric gastroenterology and eosinophilic esophagitis research. It will foster continual growth in my research proficiency during my early years as a young physician-scientist,” said Dr. Edaire Cheng, UT Southwestern Medical Center, 2013 Research Scholar Award recipient.
“I have the great opportunity to pursue my research endeavors with protected time and resources. I also aim to encourage other young physicians to the field of gastroenterology and participation in research. The AGA Research Foundation has been extremely supportive of my work.”
The Foundation’s impact
• More than 863 scientists have been awarded grants.
• 90% of investigators who received an AGA Research Scholar Award (RSA) over the past 10 years have stayed in gastroenterology and hepatology research.
• Over 85% of AGA-funded researchers in the past 10 years received NIH funding subsequent to their AGA award with over 50% receiving $1 million or more in NIH grant support.
The AGA Research Foundation provides a key source of funding at a critical juncture in a young researcher’s career. Help provide critical funding to young researchers today by making a donation to the AGA Research Foundation on the foundation’s website or by mail to 4930 Del Ray Avenue, Bethesda, MD 20814.
Oral fluconazole raises miscarriage risk
The use of oral fluconazole during pregnancy significantly raises the risk of spontaneous abortion, according to a report published online Jan. 5 in JAMA.
In a nationwide cohort study in Denmark involving more than 1.4 million pregnancies that occurred from 1997-2013, oral fluconazole increased the risk of spontaneous abortion from 7-22 weeks gestation, compared with no exposure to fluconazole and with exposure to a topical azole.
The drug did not raise the risk of stillbirth significantly in this study, “but this outcome was relatively rare and the results were therefore imprecise,” wrote Ditte Molgaard-Nielsen of the department of epidemiology research, Statens Serum Institut, Copenhagen, and associates.

The study findings indicate that “cautious prescribing of oral fluconazole in pregnancy may be advisable,” at least until more data regarding this association become available.
Pregnant women are at increased risk for candidiasis because of hormonal changes, and the prevalence of the infection is estimated to be 10% among pregnant women in the U.S. Intravaginal topical azoles are considered first-line treatment during pregnancy, but oral fluconazole can be used instead if the patient prefers it, in recurrent cases, or if symptoms are severe.
Long-term, high-dose oral fluconazole is associated with distinct craniofacial and skeletal birth defects, and most safety studies have focused on the possible teratogenic effects of the lower doses typically used during pregnancy. Only two epidemiologic studies to date have assessed a possible association with spontaneous abortion and stillbirth, and both “may not have had sufficient power to detect even a moderately increased risk,” the investigators wrote.
To examine a possible association between oral fluconazole use and spontaneous abortion (pregnancy loss at 7-22 gestational weeks) or stillbirth (pregnancy loss at 23 weeks or later), the investigators analyzed data in a national registry of all births, stillbirths, spontaneous abortions, induced abortions, ectopic pregnancies, cases of hydatidiform mole, and all other abnormal products of gestation. They correlated this with data in registries of all hospitalizations and all prescriptions filled in Denmark, focusing on the period from 1997-2013.
There were 3,315 pregnancies in which the mother received oral fluconazole during weeks 7-22, and these were matched for propensity score and maternal age with 13,246 control pregnancies. A total of 147 spontaneous abortions occurred in the exposed group and 563 in the control group. Exposure to oral fluconazole significantly increased the risk of spontaneous abortion, with a hazard ratio (HR) of 1.48, the investigators found (JAMA. 2016 Jan;315(1):58-67. doi: 10.1001/jama.2015.17844). In a further analysis that controlled for confounding by underlying disease (vaginal candidiasis), pregnancies exposed to oral fluconazole were at significantly higher risk of spontaneous abortion compared with both pregnancies exposed to topical azoles (HR, 1.62) and those exposed to pivmecillinam (HR, 1.44).
In addition, there were 5,382 pregnancies in which the mother received oral fluconazole during weeks 23 onward, and these were matched with 21,506 control pregnancies. A total of 21 stillbirths occurred in the exposed group and 77 in the control group. The hazard ratio for stillbirth in exposed pregnancies, compared with control pregnancies, was 1.32, which was not statistically significant. However, this result should be interpreted with caution because of the small numbers in these categories, the investigators wrote.
The use of oral fluconazole during pregnancy significantly raises the risk of spontaneous abortion, according to a report published online Jan. 5 in JAMA.
In a nationwide cohort study in Denmark involving more than 1.4 million pregnancies that occurred from 1997-2013, oral fluconazole increased the risk of spontaneous abortion from 7-22 weeks gestation, compared with no exposure to fluconazole and with exposure to a topical azole.
The drug did not raise the risk of stillbirth significantly in this study, “but this outcome was relatively rare and the results were therefore imprecise,” wrote Ditte Molgaard-Nielsen of the department of epidemiology research, Statens Serum Institut, Copenhagen, and associates.
The study findings indicate that “cautious prescribing of oral fluconazole in pregnancy may be advisable,” at least until more data regarding this association become available.
Pregnant women are at increased risk for candidiasis because of hormonal changes, and the prevalence of the infection is estimated to be 10% among pregnant women in the U.S. Intravaginal topical azoles are considered first-line treatment during pregnancy, but oral fluconazole can be used instead if the patient prefers it, in recurrent cases, or if symptoms are severe.
Long-term, high-dose oral fluconazole is associated with distinct craniofacial and skeletal birth defects, and most safety studies have focused on the possible teratogenic effects of the lower doses typically used during pregnancy. Only two epidemiologic studies to date have assessed a possible association with spontaneous abortion and stillbirth, and both “may not have had sufficient power to detect even a moderately increased risk,” the investigators wrote.
To examine a possible association between oral fluconazole use and spontaneous abortion (pregnancy loss at 7-22 gestational weeks) or stillbirth (pregnancy loss at 23 weeks or later), the investigators analyzed data in a national registry of all births, stillbirths, spontaneous abortions, induced abortions, ectopic pregnancies, cases of hydatidiform mole, and all other abnormal products of gestation. They correlated this with data in registries of all hospitalizations and all prescriptions filled in Denmark, focusing on the period from 1997-2013.
There were 3,315 pregnancies in which the mother received oral fluconazole during weeks 7-22, and these were matched for propensity score and maternal age with 13,246 control pregnancies. A total of 147 spontaneous abortions occurred in the exposed group and 563 in the control group. Exposure to oral fluconazole significantly increased the risk of spontaneous abortion, with a hazard ratio (HR) of 1.48, the investigators found (JAMA. 2016 Jan;315(1):58-67. doi: 10.1001/jama.2015.17844). In a further analysis that controlled for confounding by underlying disease (vaginal candidiasis), pregnancies exposed to oral fluconazole were at significantly higher risk of spontaneous abortion compared with both pregnancies exposed to topical azoles (HR, 1.62) and those exposed to pivmecillinam (HR, 1.44).
In addition, there were 5,382 pregnancies in which the mother received oral fluconazole during weeks 23 onward, and these were matched with 21,506 control pregnancies. A total of 21 stillbirths occurred in the exposed group and 77 in the control group. The hazard ratio for stillbirth in exposed pregnancies, compared with control pregnancies, was 1.32, which was not statistically significant. However, this result should be interpreted with caution because of the small numbers in these categories, the investigators wrote.
FROM JAMA
Key clinical point: The use of oral fluconazole during pregnancy significantly raises the risk of spontaneous abortion.
Major finding: A total of 147 spontaneous abortions occurred in the 3,315 pregnancies exposed to oral fluconazole, compared with 563 in the 13,246 control pregnancies.
Data source: A nationwide Danish cohort study involving 1,405,663 pregnancies from 1997-2013.
Disclosures: This study was supported by the Danish Medical Research Council. Ditte Molgaard-Nielsen and associates reported having no relevant financial disclosures.

Vascular: The Final Frontier - Pushing vascular science where no science has gone before
Space is truly a magical place, enchanting philosophers, scientists, artists and dreamers. From ancient civilizations that found pantheons of gods among the stars, to novelist Andy Weir’s visionary tale of human efforts to colonize Mars recently portrayed in the movie “The Martian,” to George Lucas’ epic drama between Jedis and Sith lords in “Star Wars,” it is clear that space draws humanity to push the frontiers of science and technology – or maybe just draws us to the box office.
Nonetheless, in this day and age there are astronauts and cosmonauts who have colonized lower earth orbit (LEO) on the International Space Station (ISS), in a situation quite similar to that of the station Arthur C. Clark envisioned in his 1968 science fiction novel, “2001: A Space Odyssey.”
Unfortunately, human physiology, which has evolved in and grown accustomed to Earth’s gravity, is completely altered in space where there is either no gravity effect or different gravitational pulls result from different planetary bodies. Because of this unique medical anomaly, the ISS is a platform for research of interest to a forward-thinking vascular specialist.
Dr. Richard Hughson, from the University of Waterloo in Waterloo, Ontario, is researching vascular aging in spaceflight crew members. His work is a part of the Schlegel-University of Waterloo Research Institute for Aging, where he is theme leader/chair of vascular aging and brain health and holds the Schlegel Research Chair in that discipline.
Dr. Hughson is supported by the Canadian Space Agency (CSA) and Canadian Institute for Health Research (CIHR) He discussed his research in a recent audio interview (http://cihr-irsc.gc.ca/e/49523.html).
Observations have demonstrated that short-duration and extended spaceflight missions may simulate accelerated vascular aging in some of these highly fit individuals traveling to space. Specifically, spaceflight crew members have been shown to have difficulty controlling a rise in their blood pressure, perhaps secondary to the loss of Earth’s gravity, but rather in the inherent cephalad fluid shift (as blood no longer pools in the legs). In addition, significant postflight postural hypotension and physical deconditioning with resultant sarcopenia and osteopenia are known to occur.
Dr. Hughson has shown through ultrasonography that the carotid arteries of spaceflight crew members are considerably stiffer compared to their preflight arteries and that they appear to have “aged the equivalent of 20-30 years in stiffness.” The ramifications of this type of research on the study of the normal earthbound vascular aging processes are under investigation.
To counteract the effects of vascular aging and physical deconditioning in space, physical activity is key; however, the 30 minutes per day allotted to busy astronauts amid their responsibilities is just not cutting it, according to Dr. Hughson. Missions are being extended for longer periods of time, leading to serious physical consequences, For example, American astronaut Scott Kelly’s year in space will certainly result in considerable accelerated aging in his arterial system. Thus, it becomes increasingly necessary to understand and prevent the vascular aging process in astronauts, future spaceflight crew members, and perhaps one day those seeking to colonize the Moon, Mars, and beyond.
When colonization time arrives, space agencies certainly should be in the market for well-qualified vascular specialists.
Perhaps great job opportunities await those in our profession who will be brave enough to leave Earth’s cradle.
Dr Drudi is a vascular surgery resident at McGill University, Montreal.