User login
Breakdown
The patient's tachycardia and leukocytosis suggest sepsis. Potential sources include soft tissue infection or osteomyelitis from his sacral ulcers, Clostridium difficile, or a urinary tract infection. Impaired visceral sensation from his spinal cord injury may dampen his response to an intra‐abdominal process, such as mesenteric ischemia or toxic megacolon. Records from other hospitals should be reviewed to assess the acuity of change in his WBC count, hemoglobin, and creatinine. His anemia may be from chronic inflammation (eg, osteomyelitis), renal insufficiency, hemolysis, or occult blood loss, including retroperitoneal and gastrointestinal sources. His kidney injury may be from tubular necrosis in the setting of sepsis or obstructive uropathy related to a neurogenic bladder.
Potential contributors to his PEA and cardiovascular collapse are drug use (cocaine), alcohol withdrawal, infection, hypovolemia, myocardial ischemia, or heart failure. Severe hemorrhage, hyperkalemia, or acidosis from acute kidney injury and sepsis could also account for his cardiac arrest. His paraplegia and hospitalization raise the risk of venous thromboembolism, which can lead to PEA from pulmonary embolus and prolonged hypoxia.
His profound anemia is the likely cause of his PEA arrest and severe lactic acidosis. Massive hemolysis is most likely given no overt evidence of bleeding to account for the precipitous fall in hematocrit. Hemolysis can result from disorders intrinsic or extrinsic to the red blood cell (RBC). Intrinsic defects are usually congenital and involve the membrane, hemoglobin, or metabolic enzymes within the RBC. Extrinsic hemolysis arises from processes that injure the RBC from the outside: antibodies, infections, and mechanical shearing.
A rapidly declining platelet count is seen in microangiopathic hemolytic conditions such as disseminated intravascular coagulation (DIC) or thrombotic thrombocytopenic purpura (TTP), where platelets are consumed along with RBCs; sepsis makes DIC more likely. Autoimmune hemolytic anemia (AIHA) is sometimes accompanied by immune thrombocytopenia. AIHA arises from antibodies that are idiopathic or produced in response to infection, autoimmune conditions (eg, systemic lupus erythematosus), lymphoproliferative disease, or drugs (eg, ‐lactam antibiotics). The antiphospholipid syndrome can lead to thrombocytopenia, hemolysis, and kidney injury. Devitalized tissue in his sacral ulcers may predispose the patient to infection with Clostridium perfringens, which can elaborate enzymes that trigger massive hemolysis.
Because automated hemoglobin measurement is performed by spectrophotometry (light absorption and scatter), high concentrations of poorly soluble autoantibodies can increase the turbidity of the sample and preclude the measurement of hemoglobin concentration. This could lead to the report of interfering substances.

Low haptoglobin, elevated LDH, and hyperbilirubinemia confirm hemolysis. A more robust reticulocytosis is expected in the face of profound anemia, but the patient may also suffer from a concomitant hypoproliferative state (eg, nutritional deficiency). More likely, the rapidity of his decline outpaced the marrow's response, which can be delayed by days.
The most common cause of a combined elevation of the INR/PT and aPTT in a critically ill patient is DIC. Although no schistocytes were detected on the peripheral smear, they can be absent in up to 50% of DIC cases. TTP is associated with hemolytic anemia, kidney injury, and thrombocytopenia, but it generally does not cause coagulopathy.
The combination of red cell agglutination and hemophagocytosis suggests that the RBCs are coated with autoantibodies that cross‐link the cells and make them targets for phagocytosis by neutrophils in the circulation. This is distinct from the hemophagocytic syndrome, a rare immune activation syndrome characterized by macrophage phagocytosis of RBCs in the reticuloendothelial system. The blood smear also shows microspherocytes, which are seen in AIHA and hereditary spherocytosis.
Acute tubular necrosis could result from sepsis, ischemic injury from DIC, hypotension during cardiac arrest, or heme pigment toxicity. Urine sediment should be reviewed for dysmorphic RBCs or RBC casts that would indicate glomerulonephritis (eg, from an underlying autoimmune process associated with AIHA).
Urine hemoglobin that is disproportionate to the degree of hematuria suggests hemoglobinuria, which in turn defines the hemolysis as intravascular. Processes that directly lyse RBCs in circulation via mechanical shearing, activation of complement, infection of the RBC, or enzymatic or oxidative destruction of the membrane cause intravascular hemolysis. Leading considerations include microangiopathy (eg, DIC, TTP), clostridial sepsis, and AIHA.
AIHA can be broadly classified as warm or cold. Warm AIHA is caused by immunoglobulin IgG antibodies that bind most avidly at body temperature. Because warm AIHA does not activate complement, patients present with evidence of extravascular hemolysis that is typically chronic and mild to moderate in severity. It does not typically cause the acute, fulminant, intravascular hemolytic condition seen here.
Cold AIHA is characterized by autoantibodies that bind at lower temperatures and comes in 2 forms: cold agglutinin disease and (rarely) paroxysmal cold hemoglobinuria (PCH). Cold agglutinins are most often IgM antibodies produced in response to infection (Mycoplasma pneumoniae, infectious mononucleosis), drugs, or a hematologic malignancy. These IgM antibodies bind RBCs, causing them to agglutinate, and fix complement (including C3) to the surface of RBCs when blood circulates to cooler parts of the body. This results in complement activation, formation of the membrane attack complex, and intravascular hemolysis when bound and activated complement is present in large numbers. Acute infection can increase the complement available for binding to the surface of RBCs. Through a slightly different mechanism, PCH causes intravascular hemolysis through direct IgG activation of complement fixed to the surface of RBCs. During a hemolytic episode the direct antibody test (DAT) is positive using anti‐C3 and negative for IgG.
Based on the patient's clinical evidence of intravascular hemolysis and a suspected autoimmune etiology, the leading diagnosis at this time is cold AIHA.
The DAT detects IgG or complement adherent to RBCs. This patient has tested positive for both IgG and C3, though much more strongly for IgG, suggesting an unusual ability of the patient's IgG to activate complement. The phenomenon of mixed AIHA, in which the patient has both warm‐ and cold‐reacting antibodies, is rare.
Regarding infections associated with AIHA, there is no cough or rash to suggest M pneumoniae, and there is no sore throat, fever, lymphadenopathy, splenomegaly, or atypical lymphocytosis to suggest infectious mononucleosis. He should be tested for human immunodeficiency virus, which is also associated with AIHA. His leukocytosis may raise suspicion for an underlying hematologic malignancy, but he does not have blasts, dysplastic leukocytes, or lymphocytosis on his peripheral blood smear. Systemic lupus erythematosus can be associated with AIHA, thrombocytopenia, and renal failure, but he lacks the more common clinical manifestations of rash, arthralgias, and fever.
Drug‐induced immune hemolytic anemia (DIIHA) can cause both the clinical and serologic profile of an AIHA, as seen here. DIIHA can be distinguished from mixed AIHA if hemolysis abates with discontinuation of an offending drug. His deterioration is temporally associated with drug administration at the time of admission. Cephalosporins and ‐lactams (e.g., piperacillin) are the most common causes of DIIHA, and ‐lactamases such as tazobactam have also been implicated. By exclusion of other causes, DIIHA secondary to piperacillin is most likely responsible for his massive intravascular hemolysis.
COMMENTARY
This case illustrates a dramatic presentation of fulminant intravascular hemolysis secondary to piperacillin. The incidence of DIIHA is estimated to be 1 in 1 million.[1] Historically, methyldopa and high‐dose penicillin have been responsible for the majority of cases,[2] but in recent years complex penicillins, including piperacillin, and second‐ and third‐generation cephalosporins have been implicated.[3, 4] Cases of DIIHA are often underdiagnosed or misdiagnosed, as smoldering or less severe cases may not be recognized or are attributed to other causes.
A positive DAT, suggesting immunoglobulin and/or complement binding to RBCs, is the most reliable laboratory finding in DIIHA.[5] However, a positive DAT does not identify the source of the antigen and may result in misattribution of the immune hemolysis to autoimmunity rather than to a drug. Repeated or continued administration of the offending drug (as in this case) may perpetuate or worsen the hemolysis. Drug‐specific antibody tests may help to confirm the diagnosis, but these tests are complex and take significant time for specialized laboratories to run.
Severe hemolysis should be considered when a patient has a sudden and dramatic drop in his hemoglobin level in the absence of bleeding. Because DIIHA can be rapidly progressive, discontinuing a suspected culprit drug is the most important diagnostic and therapeutic measure. Typically, when an offending drug is stopped, the hemolysis stops as well. The time course over which this occurs depends on the rapidity of drug clearance.[4] Hemodialysis or plasmapheresis may be required in cases where the medication is renally excreted, particularly in cases of concomitant kidney injury. Evidence supporting corticosteroid use in DIIHA is limited, as the offending agent is usually discontinued by the time corticosteroids are initiated.[4]
This patient's DAT confirmed both IgG and complement activation, consistent with DIIHA caused by an immune complexlike reaction. This mechanism involves the antibody binding to a mixed epitope of the drug and a RBC membrane glycoprotein.[6] The offending drug was stopped only when review of his medical records established a clear temporal association between antibiotic administration and prior hemolysis.
The 2009 Health Information Technology for Economic and Clinical Health Act created an electronic health record (EHR) incentive program (meaningful use criteria).[7] By 2012, only 6% of hospitals met all of the stage 2 criteria, which include EHR interoperability across health systems.[8] The patient's preceding hemolytic event was described in records faxed by the outside hospitals, but without EHR interoperability, the treating clinicians did not have timely access to this information. Instead, the familiar manual process of obtaining outside records involving signed forms, phone calls, fax machines, and reams of paper progressed at its usual pace. Real‐time access to health records might have guided providers to select an alternative antibiotic regimen. Instead, a communication breakdown contributed to a catastrophic drug reaction and to this tragic patient outcome.
KEY TEACHING POINTS
- In a patient presenting with acute hemolysis and a positive DAT, consider DIIHA.
- Both piperacillin and tazobactam can cause a severe, complement‐mediated immune hemolytic anemia (DIIHA).
- Drug‐induced antibodies are detected by direct antiglobulin testing, but a complete medication history is the key to diagnosis.
- Management of drug‐induced hemolytic anemia involves immediate discontinuation of the culprit medication, supportive care, and potentially corticosteroids, plasmapheresis, and/or hemodialysis to expedite removal of the offending agent.
- EHR interoperability may provide timely access to important health information across different hospitals, expedite health information exchange, and reduce adverse patient outcomes that stem from communication delays.
This case was submitted anonymously to AHRQ WebM&M on July 18, 2014, and was accepted on August 7, 2014. The case and WebM&M commentary were published online on October 26, 2015.[9] This separate commentary on the same case was later submitted to the Journal of Hospital Medicine on September 2, 2015, accepted on November 24, 2015, and published on January 22, 2016. The 2 publications are written by different authors, and although they reference the same case, they make different but valuable points.
Disclosure
Nothing to report.
The patient's tachycardia and leukocytosis suggest sepsis. Potential sources include soft tissue infection or osteomyelitis from his sacral ulcers, Clostridium difficile, or a urinary tract infection. Impaired visceral sensation from his spinal cord injury may dampen his response to an intra‐abdominal process, such as mesenteric ischemia or toxic megacolon. Records from other hospitals should be reviewed to assess the acuity of change in his WBC count, hemoglobin, and creatinine. His anemia may be from chronic inflammation (eg, osteomyelitis), renal insufficiency, hemolysis, or occult blood loss, including retroperitoneal and gastrointestinal sources. His kidney injury may be from tubular necrosis in the setting of sepsis or obstructive uropathy related to a neurogenic bladder.
Potential contributors to his PEA and cardiovascular collapse are drug use (cocaine), alcohol withdrawal, infection, hypovolemia, myocardial ischemia, or heart failure. Severe hemorrhage, hyperkalemia, or acidosis from acute kidney injury and sepsis could also account for his cardiac arrest. His paraplegia and hospitalization raise the risk of venous thromboembolism, which can lead to PEA from pulmonary embolus and prolonged hypoxia.
His profound anemia is the likely cause of his PEA arrest and severe lactic acidosis. Massive hemolysis is most likely given no overt evidence of bleeding to account for the precipitous fall in hematocrit. Hemolysis can result from disorders intrinsic or extrinsic to the red blood cell (RBC). Intrinsic defects are usually congenital and involve the membrane, hemoglobin, or metabolic enzymes within the RBC. Extrinsic hemolysis arises from processes that injure the RBC from the outside: antibodies, infections, and mechanical shearing.
A rapidly declining platelet count is seen in microangiopathic hemolytic conditions such as disseminated intravascular coagulation (DIC) or thrombotic thrombocytopenic purpura (TTP), where platelets are consumed along with RBCs; sepsis makes DIC more likely. Autoimmune hemolytic anemia (AIHA) is sometimes accompanied by immune thrombocytopenia. AIHA arises from antibodies that are idiopathic or produced in response to infection, autoimmune conditions (eg, systemic lupus erythematosus), lymphoproliferative disease, or drugs (eg, ‐lactam antibiotics). The antiphospholipid syndrome can lead to thrombocytopenia, hemolysis, and kidney injury. Devitalized tissue in his sacral ulcers may predispose the patient to infection with Clostridium perfringens, which can elaborate enzymes that trigger massive hemolysis.
Because automated hemoglobin measurement is performed by spectrophotometry (light absorption and scatter), high concentrations of poorly soluble autoantibodies can increase the turbidity of the sample and preclude the measurement of hemoglobin concentration. This could lead to the report of interfering substances.
Low haptoglobin, elevated LDH, and hyperbilirubinemia confirm hemolysis. A more robust reticulocytosis is expected in the face of profound anemia, but the patient may also suffer from a concomitant hypoproliferative state (eg, nutritional deficiency). More likely, the rapidity of his decline outpaced the marrow's response, which can be delayed by days.
The most common cause of a combined elevation of the INR/PT and aPTT in a critically ill patient is DIC. Although no schistocytes were detected on the peripheral smear, they can be absent in up to 50% of DIC cases. TTP is associated with hemolytic anemia, kidney injury, and thrombocytopenia, but it generally does not cause coagulopathy.
The combination of red cell agglutination and hemophagocytosis suggests that the RBCs are coated with autoantibodies that cross‐link the cells and make them targets for phagocytosis by neutrophils in the circulation. This is distinct from the hemophagocytic syndrome, a rare immune activation syndrome characterized by macrophage phagocytosis of RBCs in the reticuloendothelial system. The blood smear also shows microspherocytes, which are seen in AIHA and hereditary spherocytosis.
Acute tubular necrosis could result from sepsis, ischemic injury from DIC, hypotension during cardiac arrest, or heme pigment toxicity. Urine sediment should be reviewed for dysmorphic RBCs or RBC casts that would indicate glomerulonephritis (eg, from an underlying autoimmune process associated with AIHA).
Urine hemoglobin that is disproportionate to the degree of hematuria suggests hemoglobinuria, which in turn defines the hemolysis as intravascular. Processes that directly lyse RBCs in circulation via mechanical shearing, activation of complement, infection of the RBC, or enzymatic or oxidative destruction of the membrane cause intravascular hemolysis. Leading considerations include microangiopathy (eg, DIC, TTP), clostridial sepsis, and AIHA.
AIHA can be broadly classified as warm or cold. Warm AIHA is caused by immunoglobulin IgG antibodies that bind most avidly at body temperature. Because warm AIHA does not activate complement, patients present with evidence of extravascular hemolysis that is typically chronic and mild to moderate in severity. It does not typically cause the acute, fulminant, intravascular hemolytic condition seen here.
Cold AIHA is characterized by autoantibodies that bind at lower temperatures and comes in 2 forms: cold agglutinin disease and (rarely) paroxysmal cold hemoglobinuria (PCH). Cold agglutinins are most often IgM antibodies produced in response to infection (Mycoplasma pneumoniae, infectious mononucleosis), drugs, or a hematologic malignancy. These IgM antibodies bind RBCs, causing them to agglutinate, and fix complement (including C3) to the surface of RBCs when blood circulates to cooler parts of the body. This results in complement activation, formation of the membrane attack complex, and intravascular hemolysis when bound and activated complement is present in large numbers. Acute infection can increase the complement available for binding to the surface of RBCs. Through a slightly different mechanism, PCH causes intravascular hemolysis through direct IgG activation of complement fixed to the surface of RBCs. During a hemolytic episode the direct antibody test (DAT) is positive using anti‐C3 and negative for IgG.
Based on the patient's clinical evidence of intravascular hemolysis and a suspected autoimmune etiology, the leading diagnosis at this time is cold AIHA.
The DAT detects IgG or complement adherent to RBCs. This patient has tested positive for both IgG and C3, though much more strongly for IgG, suggesting an unusual ability of the patient's IgG to activate complement. The phenomenon of mixed AIHA, in which the patient has both warm‐ and cold‐reacting antibodies, is rare.
Regarding infections associated with AIHA, there is no cough or rash to suggest M pneumoniae, and there is no sore throat, fever, lymphadenopathy, splenomegaly, or atypical lymphocytosis to suggest infectious mononucleosis. He should be tested for human immunodeficiency virus, which is also associated with AIHA. His leukocytosis may raise suspicion for an underlying hematologic malignancy, but he does not have blasts, dysplastic leukocytes, or lymphocytosis on his peripheral blood smear. Systemic lupus erythematosus can be associated with AIHA, thrombocytopenia, and renal failure, but he lacks the more common clinical manifestations of rash, arthralgias, and fever.
Drug‐induced immune hemolytic anemia (DIIHA) can cause both the clinical and serologic profile of an AIHA, as seen here. DIIHA can be distinguished from mixed AIHA if hemolysis abates with discontinuation of an offending drug. His deterioration is temporally associated with drug administration at the time of admission. Cephalosporins and ‐lactams (e.g., piperacillin) are the most common causes of DIIHA, and ‐lactamases such as tazobactam have also been implicated. By exclusion of other causes, DIIHA secondary to piperacillin is most likely responsible for his massive intravascular hemolysis.
COMMENTARY
This case illustrates a dramatic presentation of fulminant intravascular hemolysis secondary to piperacillin. The incidence of DIIHA is estimated to be 1 in 1 million.[1] Historically, methyldopa and high‐dose penicillin have been responsible for the majority of cases,[2] but in recent years complex penicillins, including piperacillin, and second‐ and third‐generation cephalosporins have been implicated.[3, 4] Cases of DIIHA are often underdiagnosed or misdiagnosed, as smoldering or less severe cases may not be recognized or are attributed to other causes.
A positive DAT, suggesting immunoglobulin and/or complement binding to RBCs, is the most reliable laboratory finding in DIIHA.[5] However, a positive DAT does not identify the source of the antigen and may result in misattribution of the immune hemolysis to autoimmunity rather than to a drug. Repeated or continued administration of the offending drug (as in this case) may perpetuate or worsen the hemolysis. Drug‐specific antibody tests may help to confirm the diagnosis, but these tests are complex and take significant time for specialized laboratories to run.
Severe hemolysis should be considered when a patient has a sudden and dramatic drop in his hemoglobin level in the absence of bleeding. Because DIIHA can be rapidly progressive, discontinuing a suspected culprit drug is the most important diagnostic and therapeutic measure. Typically, when an offending drug is stopped, the hemolysis stops as well. The time course over which this occurs depends on the rapidity of drug clearance.[4] Hemodialysis or plasmapheresis may be required in cases where the medication is renally excreted, particularly in cases of concomitant kidney injury. Evidence supporting corticosteroid use in DIIHA is limited, as the offending agent is usually discontinued by the time corticosteroids are initiated.[4]
This patient's DAT confirmed both IgG and complement activation, consistent with DIIHA caused by an immune complexlike reaction. This mechanism involves the antibody binding to a mixed epitope of the drug and a RBC membrane glycoprotein.[6] The offending drug was stopped only when review of his medical records established a clear temporal association between antibiotic administration and prior hemolysis.
The 2009 Health Information Technology for Economic and Clinical Health Act created an electronic health record (EHR) incentive program (meaningful use criteria).[7] By 2012, only 6% of hospitals met all of the stage 2 criteria, which include EHR interoperability across health systems.[8] The patient's preceding hemolytic event was described in records faxed by the outside hospitals, but without EHR interoperability, the treating clinicians did not have timely access to this information. Instead, the familiar manual process of obtaining outside records involving signed forms, phone calls, fax machines, and reams of paper progressed at its usual pace. Real‐time access to health records might have guided providers to select an alternative antibiotic regimen. Instead, a communication breakdown contributed to a catastrophic drug reaction and to this tragic patient outcome.
KEY TEACHING POINTS
- In a patient presenting with acute hemolysis and a positive DAT, consider DIIHA.
- Both piperacillin and tazobactam can cause a severe, complement‐mediated immune hemolytic anemia (DIIHA).
- Drug‐induced antibodies are detected by direct antiglobulin testing, but a complete medication history is the key to diagnosis.
- Management of drug‐induced hemolytic anemia involves immediate discontinuation of the culprit medication, supportive care, and potentially corticosteroids, plasmapheresis, and/or hemodialysis to expedite removal of the offending agent.
- EHR interoperability may provide timely access to important health information across different hospitals, expedite health information exchange, and reduce adverse patient outcomes that stem from communication delays.
This case was submitted anonymously to AHRQ WebM&M on July 18, 2014, and was accepted on August 7, 2014. The case and WebM&M commentary were published online on October 26, 2015.[9] This separate commentary on the same case was later submitted to the Journal of Hospital Medicine on September 2, 2015, accepted on November 24, 2015, and published on January 22, 2016. The 2 publications are written by different authors, and although they reference the same case, they make different but valuable points.
Disclosure
Nothing to report.

Early severe-injury DCL fascial closure more likely with postop hypertonic saline
SAN ANTONIO – In massively transfused patients undergoing damage control laparotomy, postop hypertonic saline improves primary fascial closure rates at first take-back, according to investigators from the University of Texas Health Science Center at Houston.
After controlling for age, injury severity, and resuscitation volumes, primary fascial closure (PFC) at first take-back was almost four times as likely in patients who received hypertonic saline (HTS) after bleeding damage control laparotomy (DCL) instead of traditional isotonic maintenance fluids (odds ratio, 3.82; 95% confidence interval, 1.02-14.31; P = .047).
“In a group of seriously injured bleeding trauma patients undergoing DCL, the use of HTS was associated with a lower fluid balance and a higher rate of PFC at the first take-back,” the investigators concluded.
It’s unclear if the results are because of the hypertonic saline drawing off more edema fluid and making early PFC more likely, or because HTS patients in the study received less fluid than their standard maintenance peers – 30 cc/hr of 3% sodium chloride versus 125 cc/hr of traditional isotonic fluids post op.
PFC at first take-back is known to reduce complications. Previous studies have shown that HTS improves PFC rates, but they included moderately injured patients who would have been closed early no matter what postop fluids they received. The investigators wanted to see how well HTS worked in more severely injured patients.
The study compared 54 adult DCL patients from 2010 to 2011 who received traditional isotonic postop maintenance with 41 from 2013 to 2014 on HTS, both for 72 hours or until fascial closure, whichever came first. The university switched to HTS around 2012 based on earlier studies, allowing for the comparison. Patients in both groups received at least three RBC units during surgery, according to investigator Dr. Lindley Folkerson, a surgery resident at the university.
Twenty-seven HTS patients (66%) were closed at first take-back, versus 33 (61%) in the traditional maintenance group. The median time for closure was 29 hours in the HTS group but 38 hours in traditional maintenance patients (P = .035).
There were no between-group demographic or injury severity differences, but because the university has become more conservative with DCL in recent years, the HTS patients were more hypotensive and had greater baseline fluid deficits at emergency department arrival, and received more blood in the operating room. Even so, HTS patients had significantly lower fluid balances at 24 and 48 hours.
The university hasn’t noticed increased kidney injuries with lower-volume HTS, but that might prove to be a problem in a larger study, Dr. Folkerson said at the annual scientific assembly of the Eastern Association for the Surgery of Trauma.
A limitation of the study is that patients were resuscitated as their physicians saw fit, so some in the HTS group likely got isotonic fluids. “We did not restrict fluids because they were on the HTS protocol. Crystalloid, colloid, and blood products were given as deemed necessary by the bedside physician,” she said.
The investigators had no disclosures.
We all agree that fascial closure should be a goal. Many people have many ideas on how best to achieve delayed primary fascial closure. Diuretics decrease visceral edema. The Whitman patch prevents fascial retraction. Patients who return earlier to the operating room are more likely to be closed.
This study describes an institutional effort to improve rates of delayed primary fascial closure which should be commended. Despite patients presenting more critically ill, the rate of closure at first take-back was improved with hypertonic saline. Maybe it is not the hypertonic saline per se but the fact that they gave it instead of all the fluid we used to give.
Dr. Margaret Lauerman is an assistant professor of shock trauma at the University of Maryland Medical Center in Baltimore. She has no disclosures.
SAN ANTONIO – In massively transfused patients undergoing damage control laparotomy, postop hypertonic saline improves primary fascial closure rates at first take-back, according to investigators from the University of Texas Health Science Center at Houston.
After controlling for age, injury severity, and resuscitation volumes, primary fascial closure (PFC) at first take-back was almost four times as likely in patients who received hypertonic saline (HTS) after bleeding damage control laparotomy (DCL) instead of traditional isotonic maintenance fluids (odds ratio, 3.82; 95% confidence interval, 1.02-14.31; P = .047).
“In a group of seriously injured bleeding trauma patients undergoing DCL, the use of HTS was associated with a lower fluid balance and a higher rate of PFC at the first take-back,” the investigators concluded.
It’s unclear if the results are because of the hypertonic saline drawing off more edema fluid and making early PFC more likely, or because HTS patients in the study received less fluid than their standard maintenance peers – 30 cc/hr of 3% sodium chloride versus 125 cc/hr of traditional isotonic fluids post op.
PFC at first take-back is known to reduce complications. Previous studies have shown that HTS improves PFC rates, but they included moderately injured patients who would have been closed early no matter what postop fluids they received. The investigators wanted to see how well HTS worked in more severely injured patients.
The study compared 54 adult DCL patients from 2010 to 2011 who received traditional isotonic postop maintenance with 41 from 2013 to 2014 on HTS, both for 72 hours or until fascial closure, whichever came first. The university switched to HTS around 2012 based on earlier studies, allowing for the comparison. Patients in both groups received at least three RBC units during surgery, according to investigator Dr. Lindley Folkerson, a surgery resident at the university.
Twenty-seven HTS patients (66%) were closed at first take-back, versus 33 (61%) in the traditional maintenance group. The median time for closure was 29 hours in the HTS group but 38 hours in traditional maintenance patients (P = .035).
There were no between-group demographic or injury severity differences, but because the university has become more conservative with DCL in recent years, the HTS patients were more hypotensive and had greater baseline fluid deficits at emergency department arrival, and received more blood in the operating room. Even so, HTS patients had significantly lower fluid balances at 24 and 48 hours.
The university hasn’t noticed increased kidney injuries with lower-volume HTS, but that might prove to be a problem in a larger study, Dr. Folkerson said at the annual scientific assembly of the Eastern Association for the Surgery of Trauma.
A limitation of the study is that patients were resuscitated as their physicians saw fit, so some in the HTS group likely got isotonic fluids. “We did not restrict fluids because they were on the HTS protocol. Crystalloid, colloid, and blood products were given as deemed necessary by the bedside physician,” she said.
The investigators had no disclosures.
AT THE EAST SCIENTIFIC ASSEMBLY
Key clinical point: Order 30 cc/hour of 3% sodium chloride after bleeding DCL if you want to close patients in about a day.
Major finding: The median time for fascial closure was 29 hours in the hypertonic saline. group but 38 hours in the traditional fluid maintenance group (P = .035).
Data source: Review of 95 DCL patients.
Disclosures: The investigators had no disclosures.

VIDEO: New diagnostic, treatment methods for fungal infections
ORLANDO – New diagnostic and treatment options are at the forefront of what’s new and exciting in the area of superficial cutaneous fungal infections, according to Dr. Adam Friedman.
“Although superficial cutaneous mycoses [are] extremely common, they can be quite a challenge for several reasons,” explained Dr. Friedman of the George Washington University in Washington, at the Orlando Dermatology Aesthetic and Clinical annual meeting, adding that “many of the common skin diseases are often confused for tineum, and vice versa.”
In this video interview, Dr. Friedman discusses what dermatologists should look for in terms of diagnosing and treating dermatophytes and onychomycosis, two of most common and increasingly treatable fungal infections patients are likely to present with.
Dr. Friedman did not report any relevant financial disclosures.
The video associated with this article is no longer available on this site. Please view all of our videos on the MDedge YouTube channel
AT ODAC 2016
Psychiatry’s role in fighting obesity
We are into a new year, and among many New Year’s resolutions we hear is the resolution to take off body weight. That people are going for a new start, a chance to begin again, is actually good; it brings new hope and vigor to the issue. But sadly, most Americans making this resolution find themselves starting anew at a weight higher than they were the previous new year when they made the same resolution. Despite ourselves, we diet, exercise, and take off some pounds and then return to our previous behaviors that got us to wanting to take off the pounds in the first place.
Can psychiatry get into the body weight adventure and begin to lead the way to solutions? What I hope to do in this new column, “Weighty Issues,” is to share some of what I have learned in becoming an obesity medicine specialist, and learn from other experts who have been assessing and treating overweight and obesity for years.
I also hope to learn and share what we as psychiatrists are doing to manage our own weight (as many of us sit for a living) and lifestyles.
Coming to terms
About two-thirds of Americans are by medical calculations overweight, with half of that proportion actually medically obese. It is well-known that being overweight is a major risk factor for most of the illnesses that cause morbidity and early death among Americans. But this public health crisis was only classified an illness by the American Medical Association in 2013. What took us so long?
The topic of over body weight and psychiatry has been heavy on my mind for many years. It always puzzled me that psychiatry concentrated on anorexia nervosa, bulimia, and binge eating but was largely not focusing on the issue that was creeping up around us and becoming the major public health concern: that of overweight and obesity.
I knew that we were to concern ourselves only with illness but by ignoring the issue we, along with the rest of medicine, have promoted major, chronic illnesses of diabetes, heart disease, cancer, and so on. Fortunately for us, the AMA declared obesity a medical illness, but unfortunately, the way the reimbursement reads for treating obesity, one must be a sort of primary care physician or surgeon to get paid for the work. To my way of thinking, psychiatrists are the best physicians to be working in the field of overweight and obesity medicine, because we – more than any other medical specialty – understand that thoughts and feelings are involved in behavior. We understand that to be successful long-term in any endeavor, one must understand and harness one’s thoughts and feelings.
Moreover, we, more than physicians in other specialties, understand that the treater’s simple transference and countertransference, and the patient’s transference, can determine the trajectory and outcome of the treatment process. Additionally, psychiatrists regularly see their patients more often and over longer periods of time than do other physicians while developing and maintaining respectful and supportive relationships that can best handle the very personal issue of weight.
Surgery often not the answer
After having been a part of many psychiatric and psychological pre–bariatric surgery screenings over many years and having known many patients, friends, and colleagues who had undergone the different surgical treatments for overweight with complications and/or obesity, only to see them, many years later, larger than they were before the surgical intervention, I began to think that cutting it out was not the only definitive way to get better health measures. I knew that each surgical candidate really meant it when they pledged to follow through indefinitely but that feelings and life had intervened, and those were more powerful than surgery. That led me to think like a psychiatrist, and learn from and keep on learning from the feelings throughout life’s challenges and not like a surgeon, whose view is “once it is cut out, it is finished.”
It even led me to think medically radical thoughts that rapid weight loss through diet and lifestyle intervention, such as the weight loss that is achieved through surgery, could be a very good thing with one major caveat ... long-term intervention (psychiatry, the discipline, knows something about long-term intervention). That kind of thinking led me to try to register for a lifestyle program that was sold out at that time. A course in Obesity Medicine, the crux of the matter, was not sold out. I took one course and was hooked, learning all that I did not know about overweight and obesity, and realizing just how complicated the matter of weight actually is.
In time, I studied and learned more, saw more patients, and became a diplomate of the American Board of Obesity Medicine (ABOM). Of the approximately 1,300 diplomates of the ABOM, only 15 identify as having psychiatry as their primary specialty. The board reports that there may be other psychiatrists who are also boarded in internal medicine or pediatrics or surgery, but specific information is not available.
Those of us who prescribe typical and atypical antipsychotic agents and some of the older and newer antidepressants are familiar with the weight gain that can be attendant to these medications. We also are familiar with metabolic syndrome, which can be associated and our need to follow fasting blood glucose and lipid levels as well as waist circumference, height, and weight.
Many of us also will educate our patients about eating fewer sweets and drinking fewer sugar sweetened beverages, consuming fewer starches, and we will advise our patients to increase their exercise. We may even prescribe metformin if the fasting blood sugar and hemoglobin A1C begin to creep upward. In addition, we are constantly trying to offset the side effects of medications that we prescribe for very serious illnesses. In short, psychiatrists already are in the obesity medicine arena.
Addressing personal challenges
Talking the talk and walking the walk is so important in the area of overweight and obesity. I have struggled with overweight most of my adult life and have been “overnutritioned” – the Chinese term for overweight, off and on during my career in psychiatry. During my obesity medicine studies, I took my own weight and lifestyle seriously, and lost a significant amount of weight. Friends and patients asked me if I were well. Over time, some patients who had been with me for years volunteered how they felt about my voluntary weight loss. Most said that I no longer looked powerful; some said that I looked like a lightweight – not a serious person.
Interestingly, over time, all of my patients who had weight issues of their own began to manage their own weight better, and began to talk about their feelings and relationship to food, exercise, and weight. We have all realized that there is more under that puffy cover than meets the eye and that it insulates a whole host of stuff. Calories in and calories out become a superficial path toward a solution.
Regarding simple transference and countertransference ... many physicians have powerful adverse feelings about patients who are overweight or obese and really struggle with working with these patients. One of my friends, a family medicine specialist, told me that he cannot look at them and has told his staff not to assign those patients to him, because they do not comply and then do not come back to follow up. It is likely that his patients pick up on his disdain, anger, and lack of hope for them, and do not return in order to protect their feelings. Interestingly, this friend has struggled with his own weight throughout his professional life. Perhaps psychiatry could be useful to the myriad of other physicians like my friend who have visceral reactions to patients with weight issues so that the physicians can be kinder to themselves and their patients can receive the care, understanding, and respect that they deserve.
Attaining and maintaining a healthy weight across the life cycles is a complicated thought-, feeling-, and event-filled endeavor. I look forward to sharing basic science, clinical science, research, and anecdotal reports as we explore “Weighty Issues.”
Dr. Harris, a diplomate of the American Board of Obesity Medicine, is in private practice in adult and geriatric psychiatry in Hartford, Conn. She also works as a psychiatric consultant to continuing care retirement organizations and professional groups. Dr. Harris, a former president of the Black Psychiatrists of America, is a Distinguished Fellow of the American Psychiatric Association. Besides psychotherapy, her major clinical interests include geriatrics and the interface between general medicine and psychiatry.

VIDEO: Consider adding photodynamic therapy to your practice
ORLANDO – Dermatologists with the right patient population should consider incorporating photodynamic therapy (PDT) into their practices, as it is becoming an increasingly popular and effective.
Although most dermatologists know about PDT, “They’re not as comfortable setting up the office” and often don’t know the best ways to use PDT to achieve optimal treatment outcomes, explained Dr. Neal Bhatia, director of clinical dermatology at Therapeutics Clinical Research in San Diego, during his session at the Orlando Dermatology Aesthetic and Clinical annual meeting.
In this video interview, Dr. Bhatia, explains the benefits of PDT, what type of patient would be best suited for this treatment, and why it’s increasingly important for dermatologists to offer this treatment to their patients – even if they’ve never considered doing so before.
Dr. Bhatia is a clinical investigator and consultant with Dusa Pharmaceuticals and Biofrontera. He did not report any other relevant disclosures.
The video associated with this article is no longer available on this site. Please view all of our videos on the MDedge YouTube channel
EXPERT ANALYSIS FROM ODAC 2016

Finding more transplant hearts but not more donors
Heart transplant volumes in the United States have remained static since the start of the century because of improved trauma prevention and treatment, but that has challenged cardiologists to find enough donor hearts for the growing ranks of advanced heart failure patients. So a multidisciplinary team at the University of Washington in Seattle initiated a quality improvement program that doubled transplant volume without any change in transplant-related deaths by accepting hearts they would have otherwise discarded.
The study came about after the researchers determined that a large number of donor hearts from their own organ procurement program were being sent to other transplant centers. So they gathered a multidisciplinary team of transplant surgeons, cardiologists, and members of the organ procurement program to study ways to improve its center-specific organ utilization rate. The endeavor resulted in an increase in utilization rates from 28% to 49% in a year, a rate that has been sustained through a second year, according to study findings published in the January issue of the Journal of Thoracic and Cardiovascular Surgery (2016;151:238-43).
“The simple process of systematically reviewing donor turn down events as a group tended to reduce variability [and] increase confidence in expanded criteria donors and resulted in improved donor organ utilization and transplant volumes,” lead author Dr. Jason Smith and colleagues said.
The 30-day and 1-year death rates were similar before and after the quality improvement program started, but the death rates of those on the heart wait list declined from 17.2% to 12%, “which was not statistically significant,” Dr. Smith and coauthors said, “but does show that increasing use of organs that may be outside of the usual pattern has a trend toward improved wait list survival and needs to be considered when assessing donor hearts.”
Because of excellent results of heart transplants in patients with advanced heart failure, a number of investigators have proposed expanding the population of heart donors to include older people, those with higher risk of infectious disease, or with heart disease such as coronary artery disease and left ventricular hypertrophy, Dr. Smith and coauthors said. Their own review found a higher-than-expected rate of donor hearts sent to other centers from the University of Washington organ procurement program.
The multidisciplinary team analyzed the organs the University of Washington surgeons refused and sent to other institutions from July 2012 to June 2013.
For a year after that, the multidisciplinary group did real-time analysis of organ refusal along with quarterly reviews “in a non-confrontational, proactive” setting, as Dr. Smith and his colleagues described it. The group held open discussions on refused organs that were ultimately transplanted elsewhere. “The review process was facilitated to provide a constructive environment to encourage development of best practices and consistency,” the researchers noted. The quality improvement program led to an increase in the unit’s transplant volume despite fewer donor offers.
The researchers acknowledged that donor assessment has been the focus of much controversy. They pointed out that average donor age has increased over the last 20 years from 29 years to 33 years and has since retreated to 31 years, and some programs utilize donors up to their mid-60s. Also, previous studies have advocated for the use of donors who meet the criteria of the Centers for Disease Control and Prevention high risk behavior of infection as well as some drug abusers because of the low-risk of transmission and emerging evidence affirming the safety of hearts of drug users.
“The individual decision to utilize or discard a donor organ is one of the most challenging aspects of transplant medicine,” Dr. Smith and colleagues said. “It requires balancing donor risks against the exigencies of the recipient.”
Today, the multidisciplinary team evaluates each heart offered for donation and is exploring ways to accept even more donor hearts, even discarded hearts. “This represents a large, untapped pool of potential donor hearts that might add to the net number of transplants performed nationally and not merely redistribute organ usage,” Dr. Smith and colleagues said.
Dr. Smith is a consultant for Thoratec and is a primary site investigator for the EXPAND Trial sponsored by TransMedics. Dr. Todd Dardas is supported by the American College of Cardiology/Daiichi Sankyo Career Development Award. Dr. Jay Pal receives grant support from Tenax. Dr. Wayne Levy is a consultant for HeartWare, Novartis, GE Healthcare, Pharmin, and Biotronik. Dr. Claudius Mahr is a consultant for Thoratec, HeartWare and Abiomed. Dr. Nahush Mokadam is a consultant for Thoratec, HeartWare, Syncardia and St. Jude Medical, and has research grants from Thoratec, HeartWare and Syncardia. The other coauthors had no relationships to disclose.
How the University of Washington researchers brought about such a dramatic increase in donor heart utilization raises a number of questions, Dr. Nicholas Smedira of Cleveland Clinic said in his invited commentary (J Thorac Cardiovasc Surg 2016;151:243-4).
“They refer euphemistically to ‘behavioral adaptation’ and ‘frank discussions’ regarding ‘individual and group bias’ as explanations, but understanding exactly how this is accomplished is not easy,” Dr. Smedira said.
Noteworthy is that the researchers used more donors who meet Center for Disease Control and Prevention high risk criteria for infectious disease. However, cardiologists tend to weigh their decision for accepting donor hearts “by the last memorable or distressful experience,” Dr. Smedira said. Hence, many of these donor hearts go unused. At the same time, assessing risk without complete information is challenging, he said.
Besides their thought processes, other factors that influence cardiologists’ decisions on accepting donor hearts include fatigue, scheduling conflicts, reimbursement issues, and outcome metrics. He credited the University of Washington for its “courage” to examine their decision-making process, including exploring biases as well as working “collectively and blamelessly” to support their decisions. “I would encourage more transplant centers to follow a program similar to the University of Washington’s and maybe we will be hearing more yeses and fewer nos,” Dr. Smedira said.
He had no relationships to disclose.
Heart transplant volumes in the United States have remained static since the start of the century because of improved trauma prevention and treatment, but that has challenged cardiologists to find enough donor hearts for the growing ranks of advanced heart failure patients. So a multidisciplinary team at the University of Washington in Seattle initiated a quality improvement program that doubled transplant volume without any change in transplant-related deaths by accepting hearts they would have otherwise discarded.
The study came about after the researchers determined that a large number of donor hearts from their own organ procurement program were being sent to other transplant centers. So they gathered a multidisciplinary team of transplant surgeons, cardiologists, and members of the organ procurement program to study ways to improve its center-specific organ utilization rate. The endeavor resulted in an increase in utilization rates from 28% to 49% in a year, a rate that has been sustained through a second year, according to study findings published in the January issue of the Journal of Thoracic and Cardiovascular Surgery (2016;151:238-43).
“The simple process of systematically reviewing donor turn down events as a group tended to reduce variability [and] increase confidence in expanded criteria donors and resulted in improved donor organ utilization and transplant volumes,” lead author Dr. Jason Smith and colleagues said.
The 30-day and 1-year death rates were similar before and after the quality improvement program started, but the death rates of those on the heart wait list declined from 17.2% to 12%, “which was not statistically significant,” Dr. Smith and coauthors said, “but does show that increasing use of organs that may be outside of the usual pattern has a trend toward improved wait list survival and needs to be considered when assessing donor hearts.”
Because of excellent results of heart transplants in patients with advanced heart failure, a number of investigators have proposed expanding the population of heart donors to include older people, those with higher risk of infectious disease, or with heart disease such as coronary artery disease and left ventricular hypertrophy, Dr. Smith and coauthors said. Their own review found a higher-than-expected rate of donor hearts sent to other centers from the University of Washington organ procurement program.
The multidisciplinary team analyzed the organs the University of Washington surgeons refused and sent to other institutions from July 2012 to June 2013.
For a year after that, the multidisciplinary group did real-time analysis of organ refusal along with quarterly reviews “in a non-confrontational, proactive” setting, as Dr. Smith and his colleagues described it. The group held open discussions on refused organs that were ultimately transplanted elsewhere. “The review process was facilitated to provide a constructive environment to encourage development of best practices and consistency,” the researchers noted. The quality improvement program led to an increase in the unit’s transplant volume despite fewer donor offers.
The researchers acknowledged that donor assessment has been the focus of much controversy. They pointed out that average donor age has increased over the last 20 years from 29 years to 33 years and has since retreated to 31 years, and some programs utilize donors up to their mid-60s. Also, previous studies have advocated for the use of donors who meet the criteria of the Centers for Disease Control and Prevention high risk behavior of infection as well as some drug abusers because of the low-risk of transmission and emerging evidence affirming the safety of hearts of drug users.
“The individual decision to utilize or discard a donor organ is one of the most challenging aspects of transplant medicine,” Dr. Smith and colleagues said. “It requires balancing donor risks against the exigencies of the recipient.”
Today, the multidisciplinary team evaluates each heart offered for donation and is exploring ways to accept even more donor hearts, even discarded hearts. “This represents a large, untapped pool of potential donor hearts that might add to the net number of transplants performed nationally and not merely redistribute organ usage,” Dr. Smith and colleagues said.
Dr. Smith is a consultant for Thoratec and is a primary site investigator for the EXPAND Trial sponsored by TransMedics. Dr. Todd Dardas is supported by the American College of Cardiology/Daiichi Sankyo Career Development Award. Dr. Jay Pal receives grant support from Tenax. Dr. Wayne Levy is a consultant for HeartWare, Novartis, GE Healthcare, Pharmin, and Biotronik. Dr. Claudius Mahr is a consultant for Thoratec, HeartWare and Abiomed. Dr. Nahush Mokadam is a consultant for Thoratec, HeartWare, Syncardia and St. Jude Medical, and has research grants from Thoratec, HeartWare and Syncardia. The other coauthors had no relationships to disclose.
Key clinical point: A group approach to systematically review rejected donor organs has led to expanded donor criteria and resulted in improved donor organ utilization and transplant volume.
Major finding: Transplant utilization rate increased from 28% to 49% with no significant change in 30-day survival after implementation of a donor review protocol.
Data source: Retrospective review of 293 total donor heart offers at a single center from July 2012 to June 2013 compared with review of 279 heart offers from July 2013 to June 2014.
Disclosures: Lead author Dr. Jason Smith is a consultant for Thoratec and is a primary site investigator for the EXPAND Trial sponsored by TransMedics. Dr. Todd Dardas is supported by the American College of Cardiology/Daiichi Sankyo Career Development Award. Dr. Jay Pal receives grant support from Tenax. Dr. Wayne Levy is a consultant for HeartWare, Novartis, GE Healthcare, Pharmin, and Biotronik. Dr. Claudius Mahr is a consultant for Thoratec, HeartWare and Abiomed. Dr. Nahush Mokadam is a consultant for Thoratec, HeartWare, Syncardia, and St. Jude Medical, and has research grants from Thoratec, HeartWare and Syncardia. The other coauthors had no relationships to disclose.
False Estradiol Results From Interaction With Fulvestrant
Estradiol testing may guide treatment for patients with estrogen receptor-positive breast cancer, but researchers from Rush University Medical Center in Chicago, Illinois, have a cautionary report about relying on that when fulvestrant, an estrogen receptor antagonist, is used with standard steroid immunoassays. They report on a patient who had a falsely elevated estradiol reading that led to unnecessary procedures.
Related: Delayed Adjuvant Chemotherapy Significantly Affects Breast Cancer Recovery
Their patient underwent a bilateral oophorectomy and was then started on anti-estrogen therapy with letrozole and fulvestrant, as well as zoledronic acid. At the patient’s request, her primary oncologist obtained a serum estradiol level, which was “unexpectedly” high. The finding was puzzling, the authors say, because she had reported menopausal symptoms, such as hot flashes, which were not consistent with the estradiol level obtained. She also had a complete clinical response to treatment, according to symptoms, radiologic findings, and decreasing levels of carcinoma antigen 125.
A pelvic ultrasound revealed a possible small soft tissue density in the left adnexal region—a “concerning” finding suggesting ovarian remnant syndrome, a rare condition in which ovarian tissue remains after oophorectomy.
Related: Extending Therapy for Breast Cancer
After additional imaging and laparoscopy, pathology revealed fibrovascular and adipose tissue, but no ovarian tissue, ruling out ovarian remnant syndrome as the cause of the elevated estradiol.
Endocrinologists suspected that fulvestrant, which has a molecular structure similar to that of estradiol, was reacting with the standard estradiol immunoassay. That theory was confirmed by testing the serum estradiol levels with the more sensitive, specific liquid chromatography-tandem mass spectrometry, which showed that the levels were actually undetectable.
Related: USPSTF Supports Mammography Starting at Age 50
Fulvestrant has no known agonist effects; it has not previously been reported to elevate estradiol levels or cross-react with estradiol immunoassays, the authors say. Neither the package insert for fulvestrant nor the product insert for the immunoassay warn about the interaction. The authors, therefore, advise clinicians to be aware of the “high likelihood” of this potential drug-assay interaction.
Source:
Berger D, Waheed S, Fattout Y, Kazlauskaite LU. Clin Breast Cancer. 2016;16(1)e11-e16.
doi: 10.1016/j.clbc.2015.07.004.
Investigating Isotretinoin Inconsistencies

In a JAMA Dermatology article published online on December 2, Lee et al challenged the commonly held belief that laboratory studies should be monitored frequently for patients on isotretinoin. In this systematic review and meta-analysis, abnormalities in liver function tests (LFTs), complete blood cell count (CBC), and lipid panel were compared in a set of 22 randomized clinical trials and 4 retrospective studies (1574 patients). Results revealed changes in the mean laboratory values from baseline (99% CI) of the following: aspartate aminotransferase, 22.67 U/L (19.94–25.41 U/L); alanine aminotransferase, 21.77 U/L (18.96–24.59 U/L); alkaline phosphatase, 88.35 U/L (58.94–117.76 U/L); white blood cell count portion of CBC, 6890/µL (5700–8030/µL); lipid panel (triglycerides, 119.98 mg/dL [98.58–141.39 mg/dL]; total cholesterol, 184.74 mg/dL [178.17–191.31 mg/dL]; low-density lipoprotein cholesterol, 109.23 mg/dL [103.68–114.79 mg/dL]; high-density lipoprotein cholesterol, 42.80 mg/dL [39.84–45.76 mg/dL]).
Although these laboratory values were altered as noted above, only 0.5% of patients exhibited test results statistically above or below the mean laboratory values. Additionally, of these laboratory abnormalities, mean changes were not considered to be high risk based on National Institutes of Health clinical center reference ranges.
What’s the issue?
Last year the residents in-training in our department noted variations in what each faculty member was recommending for isotretinoin laboratory monitoring. Practices ranged from initial then monthly full CBC, LFTs, and lipid panel, to those who only checked these laboratory results initially and at 1 month, to those who only performed review of systems-germane parameters. After reviewing the literature, individual preferences, and cost comparisons, a consensus was reached: tests for aspartate aminotransferase, alanine aminotransferase (in lieu of LFT panel), total cholesterol, triglycerides (in lieu of lipid panel), and relevant pregnancy screens would be performed initially, at month 1, and at month 2.
Lee et al also determined that monthly laboratory testing may not be necessary, especially for this low-risk category of patients, but further study is required to determine if there is a standardized way to approach laboratory testing from a safety and economic standpoint, as each dermatologist who prescribes isotretinoin can identify individual cases in which laboratory monitoring was helpful or uncovered individual comorbidities or toxicities in addition to instances where blood work was prohibitively redundant and expensive.
What is your approach to blood work in isotretinoin patients, and can you identify individual patient populations that require more or less stringent laboratory monitoring?
Fertility preservation in early cervical cancer
Historically, the standard of care for women diagnosed with early cervical cancer has been radical hysterectomy. Thus, young women are not only being confronted with a cancer diagnosis, but may also be forced to cope with the loss of their fertility.
As many young women with cervical cancer were not accepting of this treatment, Dr. Daniel Dargent pioneered the vaginal radical trachelectomy as a fertility-preserving treatment option for early cervical cancer in 1994. There have now been more than 900 vaginal radical trachelectomies performed and they have been shown to have oncologic outcomes similar to those of traditional radical hysterectomy, while sparing a woman’s fertility (Int J Gynecol Cancer. 2013 Jul;23[6]:982-9).

Obstetric outcomes following vaginal radical trachelectomy are acceptable with 17% miscarriage rate in the first trimester (compared to 10%-20% in the general population) and 8% in the second trimester (compared to 1%-5% in the general population) (Am Fam Physician. 2007 Nov 1;76[9]:1341-6). Following vaginal radical trachelectomy, 64% of pregnancies deliver at term.
The usual criteria required to undergo radical trachelectomy include:
1) Reproductive age with desire for fertility.
2) Stage IA1 with LVSI (lymphovascular space invasion), IA2, or IB1 with tumor less than 2 cm.
3) Limited endocervical involvement via preoperative MRI.
4) Negative pelvic lymph nodes.
Preoperative PET scan can be used to evaluate nodal status, but suspicious lymph nodes should be evaluated on frozen section at the time of surgery. The presence of LVSI alone is not a contraindication to trachelectomy.
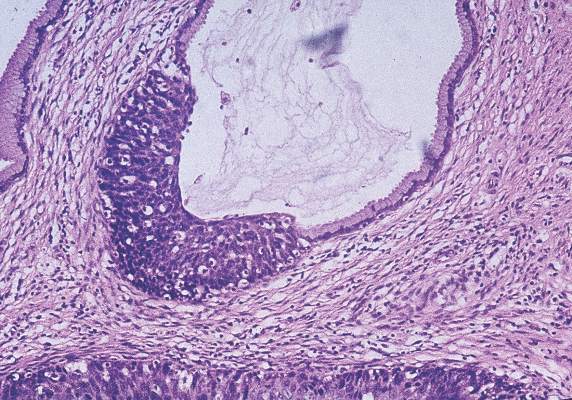
A key limitation of vaginal radical trachelectomy is the specialized training required to perform this technically challenging procedure. Few surgeons in the United States are trained to perform vaginal radical trachelectomy. In response to this limitation, surgeons began to attempt radical trachelectomy via laparotomy (Gynecol Oncol. 2006 Dec;103[3]:807-13). Oncologic outcomes following fertility-sparing abdominal radical trachelectomy have been reported to be equivalent to radical hysterectomy. Concerns regarding the abdominal approach to radical trachelectomy include higher rates of second trimester loss (19%) when compared to the vaginal approach (8%), higher rate of loss of fertility (30%), and risk of postoperative adhesions.
The advent of minimally invasive surgery, particularly robotic surgery, now offers surgeons the ability to perform a procedure technically similar to radical hysterectomy using a minimally invasive approach. Given the similarity of procedural steps of radical trachelectomy to radical hysterectomy using the robotic platform, this procedure is gaining acceptance in the United States with an associated improved surgeon learning curve (Gynecol Oncol. 2008 Nov;111[2]:255-60). In addition, the use of minimally invasive surgery should result in less adhesion formation facilitating natural fertility options postoperatively.

Obstetric and fertility outcomes are limited following minimally invasive radical trachelectomy via laparoscopy or robotic surgery given the novelty of this procedure. Emerging obstetric outcomes appear reassuring, but further data are needed to fully understand the effects of this procedure on pregnancy outcomes and the need for assisted reproductive techniques to achieve pregnancy.
The management of pregnancies following radical trachelectomy is also an area with limited data, which presents a clinical challenge to obstetricians. Many gynecologic oncologists perform a permanent cerclage at the time of trachelectomy and recommend delivery via scheduled cesarean at term for all subsequent pregnancies prior to labor (usually 37-38 weeks).
At our institution, we recommend the use of progesterone from 16 to 36 weeks despite no clear evidence on the role of progesterone in this setting. Maternal-fetal medicine consultation should be considered to either follow these patients during their pregnancies or to perform a single consultative visit to guide antepartum care.
Some have advocated for less radical surgery, such as simple trachelectomy or large cold knife conization, as the risk of parametrial extension in these patients is low (Gynecol Oncol. 2011 Dec;123[3]:557-60). More data are needed to determine if this is a safe approach. Further, the use of neoadjuvant chemotherapy followed by cold knife conization for fertility preservation in women with larger tumors has been proposed. This may be a feasible option in women with chemo-sensitive tumors, but progression on chemotherapy and increased recurrences have been reported with this approach (Gynecol Oncol. 2008 Dec;111[3]:438-43).
Women of reproductive age diagnosed with early cervical cancer now have multiple options for fertility preservation. Ongoing research regarding obstetric and fertility outcomes is needed; however, oncologic outcomes appear to be equivalent.
Dr. Clark is a fellow in the division of gynecologic oncology, department of obstetrics and gynecology, at the University of North Carolina, Chapel Hill. Dr. Boggess is an expert in robotic surgery in gynecologic oncology and is a professor in the division of gynecologic oncology at UNC–Chapel Hill. They reported having no financial disclosures relevant to this column. Email them at [email protected].
Historically, the standard of care for women diagnosed with early cervical cancer has been radical hysterectomy. Thus, young women are not only being confronted with a cancer diagnosis, but may also be forced to cope with the loss of their fertility.
As many young women with cervical cancer were not accepting of this treatment, Dr. Daniel Dargent pioneered the vaginal radical trachelectomy as a fertility-preserving treatment option for early cervical cancer in 1994. There have now been more than 900 vaginal radical trachelectomies performed and they have been shown to have oncologic outcomes similar to those of traditional radical hysterectomy, while sparing a woman’s fertility (Int J Gynecol Cancer. 2013 Jul;23[6]:982-9).
Obstetric outcomes following vaginal radical trachelectomy are acceptable with 17% miscarriage rate in the first trimester (compared to 10%-20% in the general population) and 8% in the second trimester (compared to 1%-5% in the general population) (Am Fam Physician. 2007 Nov 1;76[9]:1341-6). Following vaginal radical trachelectomy, 64% of pregnancies deliver at term.
The usual criteria required to undergo radical trachelectomy include:
1) Reproductive age with desire for fertility.
2) Stage IA1 with LVSI (lymphovascular space invasion), IA2, or IB1 with tumor less than 2 cm.
3) Limited endocervical involvement via preoperative MRI.
4) Negative pelvic lymph nodes.
Preoperative PET scan can be used to evaluate nodal status, but suspicious lymph nodes should be evaluated on frozen section at the time of surgery. The presence of LVSI alone is not a contraindication to trachelectomy.
A key limitation of vaginal radical trachelectomy is the specialized training required to perform this technically challenging procedure. Few surgeons in the United States are trained to perform vaginal radical trachelectomy. In response to this limitation, surgeons began to attempt radical trachelectomy via laparotomy (Gynecol Oncol. 2006 Dec;103[3]:807-13). Oncologic outcomes following fertility-sparing abdominal radical trachelectomy have been reported to be equivalent to radical hysterectomy. Concerns regarding the abdominal approach to radical trachelectomy include higher rates of second trimester loss (19%) when compared to the vaginal approach (8%), higher rate of loss of fertility (30%), and risk of postoperative adhesions.
The advent of minimally invasive surgery, particularly robotic surgery, now offers surgeons the ability to perform a procedure technically similar to radical hysterectomy using a minimally invasive approach. Given the similarity of procedural steps of radical trachelectomy to radical hysterectomy using the robotic platform, this procedure is gaining acceptance in the United States with an associated improved surgeon learning curve (Gynecol Oncol. 2008 Nov;111[2]:255-60). In addition, the use of minimally invasive surgery should result in less adhesion formation facilitating natural fertility options postoperatively.
Obstetric and fertility outcomes are limited following minimally invasive radical trachelectomy via laparoscopy or robotic surgery given the novelty of this procedure. Emerging obstetric outcomes appear reassuring, but further data are needed to fully understand the effects of this procedure on pregnancy outcomes and the need for assisted reproductive techniques to achieve pregnancy.
The management of pregnancies following radical trachelectomy is also an area with limited data, which presents a clinical challenge to obstetricians. Many gynecologic oncologists perform a permanent cerclage at the time of trachelectomy and recommend delivery via scheduled cesarean at term for all subsequent pregnancies prior to labor (usually 37-38 weeks).
At our institution, we recommend the use of progesterone from 16 to 36 weeks despite no clear evidence on the role of progesterone in this setting. Maternal-fetal medicine consultation should be considered to either follow these patients during their pregnancies or to perform a single consultative visit to guide antepartum care.
Some have advocated for less radical surgery, such as simple trachelectomy or large cold knife conization, as the risk of parametrial extension in these patients is low (Gynecol Oncol. 2011 Dec;123[3]:557-60). More data are needed to determine if this is a safe approach. Further, the use of neoadjuvant chemotherapy followed by cold knife conization for fertility preservation in women with larger tumors has been proposed. This may be a feasible option in women with chemo-sensitive tumors, but progression on chemotherapy and increased recurrences have been reported with this approach (Gynecol Oncol. 2008 Dec;111[3]:438-43).
Women of reproductive age diagnosed with early cervical cancer now have multiple options for fertility preservation. Ongoing research regarding obstetric and fertility outcomes is needed; however, oncologic outcomes appear to be equivalent.
Dr. Clark is a fellow in the division of gynecologic oncology, department of obstetrics and gynecology, at the University of North Carolina, Chapel Hill. Dr. Boggess is an expert in robotic surgery in gynecologic oncology and is a professor in the division of gynecologic oncology at UNC–Chapel Hill. They reported having no financial disclosures relevant to this column. Email them at [email protected].

Families Perceive Few Benefits From Aggressive End-of-Life Care
Bereaved families were substantially more satisfied with end-of-life cancer care when patients did not die in hospital, received more than 3 days of hospice care, and did not enter the ICU within 30 days of dying, according to a multicenter, prospective study published online Jan. 19 in JAMA.
The analysis is one of the first of its type to assess these end-of-life care indicators, said Dr. Alexi Wright of Harvard Medical School, Boston, and her associates. The findings could affect health policy as electronic health records expand under the Health Information Technology for Economic and Clinical Health Act, they said.
End-of-life cancer care has become increasingly aggressive, belying evidence that this approach does not improve patient outcomes, quality of life, or caregiver bereavement. To explore alternatives, the researchers analyzed 1,146 interviews of family members of Medicare patients who died of lung or colorectal cancer by 2011. Their data source was the multiregional, prospective, observational Cancer Care Outcomes Research and Surveillance (CanCORS) study (JAMA 2016;315:284-92).

Family members described end-of-life care as “excellent” 59% of the time when hospice care lasted more 3 days, but 43% of the time otherwise (95% confidence interval for adjusted difference, 11% to 22%). Notably, 73% of patients who received more than 3 days of hospice care died in their preferred location, compared with 40% of patients who received less or no hospice care. Care was rated as excellent 52% of the time when ICU admission was avoided within 30 days of death, and 57% of the time when patients died outside the hospital, compared with 45% and 42% of the time otherwise.
The results support “advance care planning consistent with the preferences of patients,” said the investigators. They recommended more extensive counseling of cancer patients and families, earlier palliative care referrals, and an audit and feedback system to monitor the use of aggressive end-of-life care.
The National Cancer Institute and the Cancer Care Outcomes Research and Surveillance Consortium funded the study. One coinvestigator reported financial relationships with the American Academy of Hospice and Palliative Medicine, National Institute of Nursing Research, National Institute on Aging, Retirement Research Retirement Foundation, California Healthcare Foundation, Commonwealth Fund, West Health Institute, University of Wisconsin, and UpToDate.com. Senior author Dr. Mary Landrum, also of Harvard Medical School, reported grant funding from Pfizer and personal fees from McKinsey and Company and Greylock McKinnon Associates. The other authors had no disclosures.
Bereaved families were substantially more satisfied with end-of-life cancer care when patients did not die in hospital, received more than 3 days of hospice care, and did not enter the ICU within 30 days of dying, according to a multicenter, prospective study published online Jan. 19 in JAMA.
The analysis is one of the first of its type to assess these end-of-life care indicators, said Dr. Alexi Wright of Harvard Medical School, Boston, and her associates. The findings could affect health policy as electronic health records expand under the Health Information Technology for Economic and Clinical Health Act, they said.
End-of-life cancer care has become increasingly aggressive, belying evidence that this approach does not improve patient outcomes, quality of life, or caregiver bereavement. To explore alternatives, the researchers analyzed 1,146 interviews of family members of Medicare patients who died of lung or colorectal cancer by 2011. Their data source was the multiregional, prospective, observational Cancer Care Outcomes Research and Surveillance (CanCORS) study (JAMA 2016;315:284-92).
Family members described end-of-life care as “excellent” 59% of the time when hospice care lasted more 3 days, but 43% of the time otherwise (95% confidence interval for adjusted difference, 11% to 22%). Notably, 73% of patients who received more than 3 days of hospice care died in their preferred location, compared with 40% of patients who received less or no hospice care. Care was rated as excellent 52% of the time when ICU admission was avoided within 30 days of death, and 57% of the time when patients died outside the hospital, compared with 45% and 42% of the time otherwise.
The results support “advance care planning consistent with the preferences of patients,” said the investigators. They recommended more extensive counseling of cancer patients and families, earlier palliative care referrals, and an audit and feedback system to monitor the use of aggressive end-of-life care.
The National Cancer Institute and the Cancer Care Outcomes Research and Surveillance Consortium funded the study. One coinvestigator reported financial relationships with the American Academy of Hospice and Palliative Medicine, National Institute of Nursing Research, National Institute on Aging, Retirement Research Retirement Foundation, California Healthcare Foundation, Commonwealth Fund, West Health Institute, University of Wisconsin, and UpToDate.com. Senior author Dr. Mary Landrum, also of Harvard Medical School, reported grant funding from Pfizer and personal fees from McKinsey and Company and Greylock McKinnon Associates. The other authors had no disclosures.
FROM JAMA
