User login
Chromosomal Deletion May Increase the Risk of Parkinson’s Disease
Chromosomal deletion at 22q11.2 may increase the risk of Parkinson’s disease, particularly early-onset Parkinson’s disease, according to research published online ahead of print March 23 in the Lancet Neurology.
The association between Parkinson’s disease and chromosome 22q11.2 deletion syndrome could be important for patient management, with implications for identifying and managing comorbidities as well as for genetic counseling, said Kin Y. Mok, PhD, of the Department of Molecular Neuroscience at the University College London Institute of Neurology and the Division of Life Science at Hong Kong University of Science and Technology, and colleagues.
Deletion at 22q11.2 is among the most common interstitial deletions in humans and one of the strongest genetic risk factors for schizophrenia, the authors noted. The clinical phenotype of chromosome 22q11.2 deletion syndrome varies widely and can include cleft palate, dysmorphic facial features, cardiac defects, skeletal deformities, and learning disabilities. The deletions are inherited from a parent in 5% to 10% of cases and occur de novo in the remainder of cases.
An observational study by Butcher et al found an increased frequency of Parkinson’s disease in patients with chromosome 22q11.2 deletion syndrome, compared with controls. Few patients with chromosome 22q11.2 deletion syndrome developed Parkinson’s disease, however, indicating that other factors play a role.
Four Genome-Wide Association Studies
To establish the frequency of deletions spanning the 22q11.2 locus in idiopathic Parkinson’s disease, Dr. Mok and colleagues screened data from the following four large independent genome-wide association studies: the UK Wellcome Trust Case Control Consortium 2 Parkinson’s disease, the Dutch Parkinson’s Disease Genetics Consortium, the US National Institute on Aging, and the International Parkinson’s Disease Genomics Consortium.
The investigators conducted case–control association analysis to compare the proportions of 22q11.2 deletions between groups. They used Fisher’s exact test for the independent case–control studies and the Mantel–Haenszel test for the meta-analyses. In addition, they retrieved clinical details from the medical records of patients with Parkinson’s disease who had 22q11.2 deletions.
In all, they included data from 9,387 patients with Parkinson’s disease and 13,863 controls in their analysis. Eight patients with Parkinson’ disease and none of the controls had 22q11.2 deletions. Age at onset was available for 8,451 of the patients with Parkinson’s disease, including all of those with 22q11.2 deletions. Age at onset was lower in patients carrying a 22q11.2 deletion, compared with patients with Parkinson’s disease who were not carrying a deletion (mean age at onset, 42.1 vs 60.3).In addition, a deletion was present in more patients with early-onset Parkinson’s disease than with late-onset Parkinson’s disease. “Of the 1,014 patients with Parkinson’s disease with age at onset younger than 45 years, five (0.49%) had 22q11.2 deletions, compared with three (0.04%) of 7,437 with an age at onset of 45 years or older,” the researchers said.
None of the patients with a deletion presented with a diagnosis of chromosome 22q11.2 deletion syndrome or schizophrenia. “With hindsight, some cases had other features suggestive of 22q11.2 deletion syndrome, such as hypocalcemia, depression, fatigue, mental retardation, and cleft palate,” the researchers said.
“Clinicians should bear this uncommon 22q11.2 deletion in mind when a patient presents with early-onset Parkinson’s disease,” said Dr. Mok and colleagues. “Carriers of a 22q11.2 deletion are prone to many other potential comorbidities, and clinicians should actively investigate for these comorbidities when managing a patient with a 22q11.2 deletion and Parkinson’s disease.”
Although the 22q11.2 deletion is associated with two neuropsychiatric disorders, schizophrenia and Parkinson’s disease, it is not clear whether the deletion “is a single common pathogenic pathway or whether separate genetic defects within the 22q11.2 deletion contribute to the differing phenotypes,” the authors said.
Findings May Reflect Ascertainment Bias
The findings are based on a retrospective, combined analysis of four studies that might be heterogeneous, and the methods of case referral in those studies could have led to ascertainment bias. For instance, although a history of schizoaffective disorder was not an explicit exclusion criterion in the recruitment of patients with Parkinson’s disease, the UK Brain Bank excludes patients with neuroleptic treatment at onset of Parkinson’s disease, the investigators said. Furthermore, psychiatrists or other specialists likely would manage patients who carry the deletion and have severe psychiatric or systemic illness, making those patients potentially less likely to be referred to neurology recruitment centers.
“We should approach their findings with cautious optimism,” said Eng-King Tan, MBBS, Senior Consultant Neurologist at the National Neuroscience Institute at Singapore General Hospital and Professor at Duke-National University of Singapore Medical School, in an accompanying commentary. “The estimated prevalence of 22q11.2 deletion syndrome in the general population (0.024%) and that of a 22q deletion among patients with early-onset Parkinson’s disease (0.49%) are low. Hence, any large-scale effect on screening in the general population of patients with Parkinson’s disease will be small.” In addition, fewer than 20 patients with coexistent 22q11.2 deletion syndrome and Parkinson’s disease have been identified so far, and it is not clear why only 3% of patients with the syndrome develop Parkinson’s disease, said Dr. Tan. Nevertheless, the study will heighten clinicians’ vigilance “in looking for features of 22q11.2 deletion syndrome in patients with early-onset Parkinson’s disease, and in carefully considering Parkinson’s disease as a differential diagnosis in patients with 22q11.2 deletion syndrome even if these patients are on antipsychotic drugs.”
—Jake Remaly
Suggested Reading
Butcher NJ, Kiehl TR, Hazrati LN, et al. Association between early-onset Parkinson disease and 22q11.2 deletion syndrome: identification of a novel genetic form of Parkinson disease and its clinical implications. JAMA Neurol. 2013;70(11):1359-1366.
Mok KY, Sheerin U, Simón-Sánchez J, et al. Deletions at 22q11.2 in idiopathic Parkinson’s disease: a combined analysis of genome-wide association data. Lancet Neurol. 2016 Mar 23 [Epub ahead of print].
Tan EK. Chromosomal deletion at 22q11.2 and Parkinson’s disease. Lancet Neurol. 2016 Mar 23 [Epub ahead of print].
Chromosomal deletion at 22q11.2 may increase the risk of Parkinson’s disease, particularly early-onset Parkinson’s disease, according to research published online ahead of print March 23 in the Lancet Neurology.
The association between Parkinson’s disease and chromosome 22q11.2 deletion syndrome could be important for patient management, with implications for identifying and managing comorbidities as well as for genetic counseling, said Kin Y. Mok, PhD, of the Department of Molecular Neuroscience at the University College London Institute of Neurology and the Division of Life Science at Hong Kong University of Science and Technology, and colleagues.
Deletion at 22q11.2 is among the most common interstitial deletions in humans and one of the strongest genetic risk factors for schizophrenia, the authors noted. The clinical phenotype of chromosome 22q11.2 deletion syndrome varies widely and can include cleft palate, dysmorphic facial features, cardiac defects, skeletal deformities, and learning disabilities. The deletions are inherited from a parent in 5% to 10% of cases and occur de novo in the remainder of cases.
An observational study by Butcher et al found an increased frequency of Parkinson’s disease in patients with chromosome 22q11.2 deletion syndrome, compared with controls. Few patients with chromosome 22q11.2 deletion syndrome developed Parkinson’s disease, however, indicating that other factors play a role.
Four Genome-Wide Association Studies
To establish the frequency of deletions spanning the 22q11.2 locus in idiopathic Parkinson’s disease, Dr. Mok and colleagues screened data from the following four large independent genome-wide association studies: the UK Wellcome Trust Case Control Consortium 2 Parkinson’s disease, the Dutch Parkinson’s Disease Genetics Consortium, the US National Institute on Aging, and the International Parkinson’s Disease Genomics Consortium.
The investigators conducted case–control association analysis to compare the proportions of 22q11.2 deletions between groups. They used Fisher’s exact test for the independent case–control studies and the Mantel–Haenszel test for the meta-analyses. In addition, they retrieved clinical details from the medical records of patients with Parkinson’s disease who had 22q11.2 deletions.
In all, they included data from 9,387 patients with Parkinson’s disease and 13,863 controls in their analysis. Eight patients with Parkinson’ disease and none of the controls had 22q11.2 deletions. Age at onset was available for 8,451 of the patients with Parkinson’s disease, including all of those with 22q11.2 deletions. Age at onset was lower in patients carrying a 22q11.2 deletion, compared with patients with Parkinson’s disease who were not carrying a deletion (mean age at onset, 42.1 vs 60.3).In addition, a deletion was present in more patients with early-onset Parkinson’s disease than with late-onset Parkinson’s disease. “Of the 1,014 patients with Parkinson’s disease with age at onset younger than 45 years, five (0.49%) had 22q11.2 deletions, compared with three (0.04%) of 7,437 with an age at onset of 45 years or older,” the researchers said.
None of the patients with a deletion presented with a diagnosis of chromosome 22q11.2 deletion syndrome or schizophrenia. “With hindsight, some cases had other features suggestive of 22q11.2 deletion syndrome, such as hypocalcemia, depression, fatigue, mental retardation, and cleft palate,” the researchers said.
“Clinicians should bear this uncommon 22q11.2 deletion in mind when a patient presents with early-onset Parkinson’s disease,” said Dr. Mok and colleagues. “Carriers of a 22q11.2 deletion are prone to many other potential comorbidities, and clinicians should actively investigate for these comorbidities when managing a patient with a 22q11.2 deletion and Parkinson’s disease.”
Although the 22q11.2 deletion is associated with two neuropsychiatric disorders, schizophrenia and Parkinson’s disease, it is not clear whether the deletion “is a single common pathogenic pathway or whether separate genetic defects within the 22q11.2 deletion contribute to the differing phenotypes,” the authors said.
Findings May Reflect Ascertainment Bias
The findings are based on a retrospective, combined analysis of four studies that might be heterogeneous, and the methods of case referral in those studies could have led to ascertainment bias. For instance, although a history of schizoaffective disorder was not an explicit exclusion criterion in the recruitment of patients with Parkinson’s disease, the UK Brain Bank excludes patients with neuroleptic treatment at onset of Parkinson’s disease, the investigators said. Furthermore, psychiatrists or other specialists likely would manage patients who carry the deletion and have severe psychiatric or systemic illness, making those patients potentially less likely to be referred to neurology recruitment centers.
“We should approach their findings with cautious optimism,” said Eng-King Tan, MBBS, Senior Consultant Neurologist at the National Neuroscience Institute at Singapore General Hospital and Professor at Duke-National University of Singapore Medical School, in an accompanying commentary. “The estimated prevalence of 22q11.2 deletion syndrome in the general population (0.024%) and that of a 22q deletion among patients with early-onset Parkinson’s disease (0.49%) are low. Hence, any large-scale effect on screening in the general population of patients with Parkinson’s disease will be small.” In addition, fewer than 20 patients with coexistent 22q11.2 deletion syndrome and Parkinson’s disease have been identified so far, and it is not clear why only 3% of patients with the syndrome develop Parkinson’s disease, said Dr. Tan. Nevertheless, the study will heighten clinicians’ vigilance “in looking for features of 22q11.2 deletion syndrome in patients with early-onset Parkinson’s disease, and in carefully considering Parkinson’s disease as a differential diagnosis in patients with 22q11.2 deletion syndrome even if these patients are on antipsychotic drugs.”
—Jake Remaly
Chromosomal deletion at 22q11.2 may increase the risk of Parkinson’s disease, particularly early-onset Parkinson’s disease, according to research published online ahead of print March 23 in the Lancet Neurology.
The association between Parkinson’s disease and chromosome 22q11.2 deletion syndrome could be important for patient management, with implications for identifying and managing comorbidities as well as for genetic counseling, said Kin Y. Mok, PhD, of the Department of Molecular Neuroscience at the University College London Institute of Neurology and the Division of Life Science at Hong Kong University of Science and Technology, and colleagues.
Deletion at 22q11.2 is among the most common interstitial deletions in humans and one of the strongest genetic risk factors for schizophrenia, the authors noted. The clinical phenotype of chromosome 22q11.2 deletion syndrome varies widely and can include cleft palate, dysmorphic facial features, cardiac defects, skeletal deformities, and learning disabilities. The deletions are inherited from a parent in 5% to 10% of cases and occur de novo in the remainder of cases.
An observational study by Butcher et al found an increased frequency of Parkinson’s disease in patients with chromosome 22q11.2 deletion syndrome, compared with controls. Few patients with chromosome 22q11.2 deletion syndrome developed Parkinson’s disease, however, indicating that other factors play a role.
Four Genome-Wide Association Studies
To establish the frequency of deletions spanning the 22q11.2 locus in idiopathic Parkinson’s disease, Dr. Mok and colleagues screened data from the following four large independent genome-wide association studies: the UK Wellcome Trust Case Control Consortium 2 Parkinson’s disease, the Dutch Parkinson’s Disease Genetics Consortium, the US National Institute on Aging, and the International Parkinson’s Disease Genomics Consortium.
The investigators conducted case–control association analysis to compare the proportions of 22q11.2 deletions between groups. They used Fisher’s exact test for the independent case–control studies and the Mantel–Haenszel test for the meta-analyses. In addition, they retrieved clinical details from the medical records of patients with Parkinson’s disease who had 22q11.2 deletions.
In all, they included data from 9,387 patients with Parkinson’s disease and 13,863 controls in their analysis. Eight patients with Parkinson’ disease and none of the controls had 22q11.2 deletions. Age at onset was available for 8,451 of the patients with Parkinson’s disease, including all of those with 22q11.2 deletions. Age at onset was lower in patients carrying a 22q11.2 deletion, compared with patients with Parkinson’s disease who were not carrying a deletion (mean age at onset, 42.1 vs 60.3).In addition, a deletion was present in more patients with early-onset Parkinson’s disease than with late-onset Parkinson’s disease. “Of the 1,014 patients with Parkinson’s disease with age at onset younger than 45 years, five (0.49%) had 22q11.2 deletions, compared with three (0.04%) of 7,437 with an age at onset of 45 years or older,” the researchers said.
None of the patients with a deletion presented with a diagnosis of chromosome 22q11.2 deletion syndrome or schizophrenia. “With hindsight, some cases had other features suggestive of 22q11.2 deletion syndrome, such as hypocalcemia, depression, fatigue, mental retardation, and cleft palate,” the researchers said.
“Clinicians should bear this uncommon 22q11.2 deletion in mind when a patient presents with early-onset Parkinson’s disease,” said Dr. Mok and colleagues. “Carriers of a 22q11.2 deletion are prone to many other potential comorbidities, and clinicians should actively investigate for these comorbidities when managing a patient with a 22q11.2 deletion and Parkinson’s disease.”
Although the 22q11.2 deletion is associated with two neuropsychiatric disorders, schizophrenia and Parkinson’s disease, it is not clear whether the deletion “is a single common pathogenic pathway or whether separate genetic defects within the 22q11.2 deletion contribute to the differing phenotypes,” the authors said.
Findings May Reflect Ascertainment Bias
The findings are based on a retrospective, combined analysis of four studies that might be heterogeneous, and the methods of case referral in those studies could have led to ascertainment bias. For instance, although a history of schizoaffective disorder was not an explicit exclusion criterion in the recruitment of patients with Parkinson’s disease, the UK Brain Bank excludes patients with neuroleptic treatment at onset of Parkinson’s disease, the investigators said. Furthermore, psychiatrists or other specialists likely would manage patients who carry the deletion and have severe psychiatric or systemic illness, making those patients potentially less likely to be referred to neurology recruitment centers.
“We should approach their findings with cautious optimism,” said Eng-King Tan, MBBS, Senior Consultant Neurologist at the National Neuroscience Institute at Singapore General Hospital and Professor at Duke-National University of Singapore Medical School, in an accompanying commentary. “The estimated prevalence of 22q11.2 deletion syndrome in the general population (0.024%) and that of a 22q deletion among patients with early-onset Parkinson’s disease (0.49%) are low. Hence, any large-scale effect on screening in the general population of patients with Parkinson’s disease will be small.” In addition, fewer than 20 patients with coexistent 22q11.2 deletion syndrome and Parkinson’s disease have been identified so far, and it is not clear why only 3% of patients with the syndrome develop Parkinson’s disease, said Dr. Tan. Nevertheless, the study will heighten clinicians’ vigilance “in looking for features of 22q11.2 deletion syndrome in patients with early-onset Parkinson’s disease, and in carefully considering Parkinson’s disease as a differential diagnosis in patients with 22q11.2 deletion syndrome even if these patients are on antipsychotic drugs.”
—Jake Remaly
Suggested Reading
Butcher NJ, Kiehl TR, Hazrati LN, et al. Association between early-onset Parkinson disease and 22q11.2 deletion syndrome: identification of a novel genetic form of Parkinson disease and its clinical implications. JAMA Neurol. 2013;70(11):1359-1366.
Mok KY, Sheerin U, Simón-Sánchez J, et al. Deletions at 22q11.2 in idiopathic Parkinson’s disease: a combined analysis of genome-wide association data. Lancet Neurol. 2016 Mar 23 [Epub ahead of print].
Tan EK. Chromosomal deletion at 22q11.2 and Parkinson’s disease. Lancet Neurol. 2016 Mar 23 [Epub ahead of print].
Suggested Reading
Butcher NJ, Kiehl TR, Hazrati LN, et al. Association between early-onset Parkinson disease and 22q11.2 deletion syndrome: identification of a novel genetic form of Parkinson disease and its clinical implications. JAMA Neurol. 2013;70(11):1359-1366.
Mok KY, Sheerin U, Simón-Sánchez J, et al. Deletions at 22q11.2 in idiopathic Parkinson’s disease: a combined analysis of genome-wide association data. Lancet Neurol. 2016 Mar 23 [Epub ahead of print].
Tan EK. Chromosomal deletion at 22q11.2 and Parkinson’s disease. Lancet Neurol. 2016 Mar 23 [Epub ahead of print].
Self-Administered Tool Identifies Chronic Migraine
A 12-item case-finding tool correctly classifies most people with migraine and chronic migraine, according to research published in the March issue of Cephalalgia. The tool, which is called Identify Chronic Migraine (ID-CM), classifies migraine with a sensitivity of 83.5% and a specificity of 88.5% and chronic migraine with a sensitivity of 80.6% and a specificity of 88.6%.
Migraine, and chronic migraine in particular, is underdiagnosed and undertreated, said Richard B. Lipton, MD, Vice Chair of Neurology at Albert Einstein College of Medicine in the Bronx, New York, and colleagues. The authors sought to develop a valid case-finding tool for chronic migraine that would be applicable to people who reported severe headache.

Richard B. Lipton, MD
The researchers developed their instrument in four stages. In the first stage, they convened an international panel of expert clinicians and researchers that selected potential items from existing diagnostic tools. The panel also suggested additional items for consideration. In stage two, Dr. Lipton and colleagues conducted cognitive debriefing interviews with people with chronic migraine to determine whether the latter understood the tool’s instructions and whether the items were worded properly.
Researchers also administered the items that had emerged from stage two, along with a set of patient-reported outcome measures, to a Web-based sample of 1,600 people with migraine or other severe headache. Data from this stage enabled them to perform a psychometric assessment of the new tool’s candidate items. Finally, in stage four, investigators compared diagnoses assigned using ID-CM with independent diagnoses assigned by headache experts using a semistructured diagnostic interview for migraine. Patients who had participated in the third stage of development were invited to participate in this stage.
The final version of ID-CM includes two questions about headache frequency, four about headache symptoms, two about medication use, two about whether headache interferes with activities, and two about whether headache interferes with making plans.
“ID-CM has been rigorously evaluated and has strong psychometric properties and high classification accuracy, both for migraine and chronic migraine,” said Dr. Lipton. “Compared with other well-known and highly regarded screening and diagnostic tools for various diseases/disorders, the classification accuracy of ID-CM was both absolutely and relatively strong....The simplicity and accuracy of ID-CM will enable health care professionals with or without training in neurology, pain, or headache to correctly identify the majority of patients with migraine or chronic migraine,” Dr. Lipton said. “Clinicians will then be able to accurately diagnose or refer affected patients to specialists for effective treatment that will reduce the burden of illness experienced by those with migraine and chronic migraine.”
—Erik Greb
Suggested Reading
Lipton RB, Serrano D, Buse DC, et al. Improving the detection of chronic migraine: Development and validation of Identify Chronic Migraine (ID-CM). Cephalalgia. 2016;36(3):203-215.
A 12-item case-finding tool correctly classifies most people with migraine and chronic migraine, according to research published in the March issue of Cephalalgia. The tool, which is called Identify Chronic Migraine (ID-CM), classifies migraine with a sensitivity of 83.5% and a specificity of 88.5% and chronic migraine with a sensitivity of 80.6% and a specificity of 88.6%.
Migraine, and chronic migraine in particular, is underdiagnosed and undertreated, said Richard B. Lipton, MD, Vice Chair of Neurology at Albert Einstein College of Medicine in the Bronx, New York, and colleagues. The authors sought to develop a valid case-finding tool for chronic migraine that would be applicable to people who reported severe headache.
Richard B. Lipton, MD
The researchers developed their instrument in four stages. In the first stage, they convened an international panel of expert clinicians and researchers that selected potential items from existing diagnostic tools. The panel also suggested additional items for consideration. In stage two, Dr. Lipton and colleagues conducted cognitive debriefing interviews with people with chronic migraine to determine whether the latter understood the tool’s instructions and whether the items were worded properly.
Researchers also administered the items that had emerged from stage two, along with a set of patient-reported outcome measures, to a Web-based sample of 1,600 people with migraine or other severe headache. Data from this stage enabled them to perform a psychometric assessment of the new tool’s candidate items. Finally, in stage four, investigators compared diagnoses assigned using ID-CM with independent diagnoses assigned by headache experts using a semistructured diagnostic interview for migraine. Patients who had participated in the third stage of development were invited to participate in this stage.
The final version of ID-CM includes two questions about headache frequency, four about headache symptoms, two about medication use, two about whether headache interferes with activities, and two about whether headache interferes with making plans.
“ID-CM has been rigorously evaluated and has strong psychometric properties and high classification accuracy, both for migraine and chronic migraine,” said Dr. Lipton. “Compared with other well-known and highly regarded screening and diagnostic tools for various diseases/disorders, the classification accuracy of ID-CM was both absolutely and relatively strong....The simplicity and accuracy of ID-CM will enable health care professionals with or without training in neurology, pain, or headache to correctly identify the majority of patients with migraine or chronic migraine,” Dr. Lipton said. “Clinicians will then be able to accurately diagnose or refer affected patients to specialists for effective treatment that will reduce the burden of illness experienced by those with migraine and chronic migraine.”
—Erik Greb
A 12-item case-finding tool correctly classifies most people with migraine and chronic migraine, according to research published in the March issue of Cephalalgia. The tool, which is called Identify Chronic Migraine (ID-CM), classifies migraine with a sensitivity of 83.5% and a specificity of 88.5% and chronic migraine with a sensitivity of 80.6% and a specificity of 88.6%.
Migraine, and chronic migraine in particular, is underdiagnosed and undertreated, said Richard B. Lipton, MD, Vice Chair of Neurology at Albert Einstein College of Medicine in the Bronx, New York, and colleagues. The authors sought to develop a valid case-finding tool for chronic migraine that would be applicable to people who reported severe headache.
Richard B. Lipton, MD
The researchers developed their instrument in four stages. In the first stage, they convened an international panel of expert clinicians and researchers that selected potential items from existing diagnostic tools. The panel also suggested additional items for consideration. In stage two, Dr. Lipton and colleagues conducted cognitive debriefing interviews with people with chronic migraine to determine whether the latter understood the tool’s instructions and whether the items were worded properly.
Researchers also administered the items that had emerged from stage two, along with a set of patient-reported outcome measures, to a Web-based sample of 1,600 people with migraine or other severe headache. Data from this stage enabled them to perform a psychometric assessment of the new tool’s candidate items. Finally, in stage four, investigators compared diagnoses assigned using ID-CM with independent diagnoses assigned by headache experts using a semistructured diagnostic interview for migraine. Patients who had participated in the third stage of development were invited to participate in this stage.
The final version of ID-CM includes two questions about headache frequency, four about headache symptoms, two about medication use, two about whether headache interferes with activities, and two about whether headache interferes with making plans.
“ID-CM has been rigorously evaluated and has strong psychometric properties and high classification accuracy, both for migraine and chronic migraine,” said Dr. Lipton. “Compared with other well-known and highly regarded screening and diagnostic tools for various diseases/disorders, the classification accuracy of ID-CM was both absolutely and relatively strong....The simplicity and accuracy of ID-CM will enable health care professionals with or without training in neurology, pain, or headache to correctly identify the majority of patients with migraine or chronic migraine,” Dr. Lipton said. “Clinicians will then be able to accurately diagnose or refer affected patients to specialists for effective treatment that will reduce the burden of illness experienced by those with migraine and chronic migraine.”
—Erik Greb
Suggested Reading
Lipton RB, Serrano D, Buse DC, et al. Improving the detection of chronic migraine: Development and validation of Identify Chronic Migraine (ID-CM). Cephalalgia. 2016;36(3):203-215.
Suggested Reading
Lipton RB, Serrano D, Buse DC, et al. Improving the detection of chronic migraine: Development and validation of Identify Chronic Migraine (ID-CM). Cephalalgia. 2016;36(3):203-215.

What Distinguishes Chronic Migraine From Episodic Migraine?
STOWE, VERMONT—Rather than greater headache frequency, a systemic endocrine–metabolic disorder that is associated with frequent headaches may distinguish chronic migraine from episodic migraine, said Egilius L. H. Spierings, MD, PhD, at the 26th Annual Stowe Headache Symposium of the Headache Cooperative of New England.

Egilius L. H. Spierings, MD, PhD
According to the International Headache Society (IHS), a patient with headache on 15 or more days per month for more than three months, and whose headache has the features of migraine on at least eight days per month, fulfills the diagnostic criteria for chronic migraine. A migraineur with headache on 14 or fewer days per month has episodic migraine. The neurology community has accepted this distinction.
The IHS classification is “extremely simple” and “highly arbitrarily defined,” said Dr. Spierings, Director of the Headache and Face Pain Program at Tufts Medical Center in Boston and Clinical Professor of Craniofacial Pain at Tufts University. “There must be more behind that distinction, especially when you look at the question of why Botox works preventively in chronic migraine and not in episodic migraine.”
Taking the perspective of a general practitioner, rather than that of a headache specialist, may clarify the distinction between chronic and episodic migraine, according to Dr. Spierings. A general review of systems suggests that patients with episodic migraine tend to be healthy overall, while patients with chronic migraine tend to have many psychiatric and medical comorbidities. In an exploratory study, Dr. Spierings and colleagues found that women with chronic migraine had a significantly higher prevalence of menstrual cycle disorders (eg, oligomenorrhea and polymenorrhea) and dysmenorrhea, compared with women with episodic migraine.
These findings appear to be consistent with those of previous research. In 2002, Bigal and colleagues found that asthma, allergies, hypertension, and hypothyroidism were significantly more common in patients with chronic migraine than in those with episodic migraine. In 2006, Tietjen et al observed that endometriosis was significantly more common in women with chronic migraine than in women with episodic migraine.
In the most extensive study in this area, Ferrari et al found that psychiatric, gastrointestinal, musculoskeletal, ocular, genitourinary, hematologic, cerebrovascular, and cardiac comorbidities were significantly more common in patients with chronic migraine than in those with episodic migraine. Hypertension, constipation, and insomnia also were more prevalent in chronic migraine.
In addition, data from various studies show that patients with chronic migraine tend to be, on average, 10 to 20 years older than those with episodic migraine. About two-thirds of patients with chronic migraine develop their condition gradually over time out of episodic migraine, a transition that takes, on average, 11.6 years. During this period, these patients may develop the comorbidities that are more frequent in chronic migraine, said Dr. Spierings.
But younger patients with chronic migraine also have more comorbidities than patients of the same age with episodic migraine. One patient of Dr. Spierings was an 18-year-old woman who had had chronic migraine since menarche and whose mother had migraine. The woman’s comorbidities included fatigue, insomnia, anxiety, depression, tight and sore neck and shoulder muscles, reflux disease, and diarrhea. Another patient of Dr. Spierings was a 20-year-old woman who had had chronic migraine since menarche and whose mother had migraine. Among her comorbidities were fatigue, insomnia, depression, tight and sore neck and shoulder muscles, lumbago, polymenorrhea, dysmenorrhea, and hypermenorrhea.
Dr. Spierings also examined a 34-year-old woman without a family history of migraine. She developed a pressure sensation in the temples, but not headaches or migraine, after pregnancy. The woman’s comorbidities included fatigue, anxiety, tight and sore neck and shoulder muscles, fibromyalgia, gastritis, constipation, endometriosis, and hypermenorrhea.
All three patients have a disorder of multiple systems that affects the nervous system, the musculoskeletal system, the gastrointestinal system, and the genitourinary system. “The only unifying diagnosis … is somatic symptom disorder,” said Dr. Spierings. Yet this diagnosis is unsatisfying, he added.
“These people have a systemic endocrine–metabolic disorder centered around energy metabolism that causes the multitude of medical and psychiatric conditions that we tend to see in patients [with chronic migraine] .… It is a syndrome with multiple etiologies, either endocrine or metabolic, genetic or acquired.” The first two patients may have a “genetically determined headache amplifier” that contributed to the development of chronic migraine, Dr. Spierings added. The third patient, who has no family history of migraine, does not have this genetically determined headache amplifier.
In previous research, Dr. Spierings and colleagues concluded that stress, tension, irregular eating times, fatigue, and insufficient sleep were general headache triggers to which everyone is susceptible. “When we do not have that headache amplifier, we get regular headaches that we can combat with a couple of aspirin. When we have that headache amplifier inherited from one or both parents, we need specific antimigraine medications to take care of it,” he said. The inherited headache amplifier “is the essence of migraine” and is related to the threshold at which neurogenic inflammation occurs, said Dr. Spierings. Patients with chronic migraine have the headache amplifier and a systemic disorder not shared by patients with episodic migraine, he concluded.
—Erik Greb
STOWE, VERMONT—Rather than greater headache frequency, a systemic endocrine–metabolic disorder that is associated with frequent headaches may distinguish chronic migraine from episodic migraine, said Egilius L. H. Spierings, MD, PhD, at the 26th Annual Stowe Headache Symposium of the Headache Cooperative of New England.
Egilius L. H. Spierings, MD, PhD
According to the International Headache Society (IHS), a patient with headache on 15 or more days per month for more than three months, and whose headache has the features of migraine on at least eight days per month, fulfills the diagnostic criteria for chronic migraine. A migraineur with headache on 14 or fewer days per month has episodic migraine. The neurology community has accepted this distinction.
The IHS classification is “extremely simple” and “highly arbitrarily defined,” said Dr. Spierings, Director of the Headache and Face Pain Program at Tufts Medical Center in Boston and Clinical Professor of Craniofacial Pain at Tufts University. “There must be more behind that distinction, especially when you look at the question of why Botox works preventively in chronic migraine and not in episodic migraine.”
Taking the perspective of a general practitioner, rather than that of a headache specialist, may clarify the distinction between chronic and episodic migraine, according to Dr. Spierings. A general review of systems suggests that patients with episodic migraine tend to be healthy overall, while patients with chronic migraine tend to have many psychiatric and medical comorbidities. In an exploratory study, Dr. Spierings and colleagues found that women with chronic migraine had a significantly higher prevalence of menstrual cycle disorders (eg, oligomenorrhea and polymenorrhea) and dysmenorrhea, compared with women with episodic migraine.
These findings appear to be consistent with those of previous research. In 2002, Bigal and colleagues found that asthma, allergies, hypertension, and hypothyroidism were significantly more common in patients with chronic migraine than in those with episodic migraine. In 2006, Tietjen et al observed that endometriosis was significantly more common in women with chronic migraine than in women with episodic migraine.
In the most extensive study in this area, Ferrari et al found that psychiatric, gastrointestinal, musculoskeletal, ocular, genitourinary, hematologic, cerebrovascular, and cardiac comorbidities were significantly more common in patients with chronic migraine than in those with episodic migraine. Hypertension, constipation, and insomnia also were more prevalent in chronic migraine.
In addition, data from various studies show that patients with chronic migraine tend to be, on average, 10 to 20 years older than those with episodic migraine. About two-thirds of patients with chronic migraine develop their condition gradually over time out of episodic migraine, a transition that takes, on average, 11.6 years. During this period, these patients may develop the comorbidities that are more frequent in chronic migraine, said Dr. Spierings.
But younger patients with chronic migraine also have more comorbidities than patients of the same age with episodic migraine. One patient of Dr. Spierings was an 18-year-old woman who had had chronic migraine since menarche and whose mother had migraine. The woman’s comorbidities included fatigue, insomnia, anxiety, depression, tight and sore neck and shoulder muscles, reflux disease, and diarrhea. Another patient of Dr. Spierings was a 20-year-old woman who had had chronic migraine since menarche and whose mother had migraine. Among her comorbidities were fatigue, insomnia, depression, tight and sore neck and shoulder muscles, lumbago, polymenorrhea, dysmenorrhea, and hypermenorrhea.
Dr. Spierings also examined a 34-year-old woman without a family history of migraine. She developed a pressure sensation in the temples, but not headaches or migraine, after pregnancy. The woman’s comorbidities included fatigue, anxiety, tight and sore neck and shoulder muscles, fibromyalgia, gastritis, constipation, endometriosis, and hypermenorrhea.
All three patients have a disorder of multiple systems that affects the nervous system, the musculoskeletal system, the gastrointestinal system, and the genitourinary system. “The only unifying diagnosis … is somatic symptom disorder,” said Dr. Spierings. Yet this diagnosis is unsatisfying, he added.
“These people have a systemic endocrine–metabolic disorder centered around energy metabolism that causes the multitude of medical and psychiatric conditions that we tend to see in patients [with chronic migraine] .… It is a syndrome with multiple etiologies, either endocrine or metabolic, genetic or acquired.” The first two patients may have a “genetically determined headache amplifier” that contributed to the development of chronic migraine, Dr. Spierings added. The third patient, who has no family history of migraine, does not have this genetically determined headache amplifier.
In previous research, Dr. Spierings and colleagues concluded that stress, tension, irregular eating times, fatigue, and insufficient sleep were general headache triggers to which everyone is susceptible. “When we do not have that headache amplifier, we get regular headaches that we can combat with a couple of aspirin. When we have that headache amplifier inherited from one or both parents, we need specific antimigraine medications to take care of it,” he said. The inherited headache amplifier “is the essence of migraine” and is related to the threshold at which neurogenic inflammation occurs, said Dr. Spierings. Patients with chronic migraine have the headache amplifier and a systemic disorder not shared by patients with episodic migraine, he concluded.
—Erik Greb
STOWE, VERMONT—Rather than greater headache frequency, a systemic endocrine–metabolic disorder that is associated with frequent headaches may distinguish chronic migraine from episodic migraine, said Egilius L. H. Spierings, MD, PhD, at the 26th Annual Stowe Headache Symposium of the Headache Cooperative of New England.
Egilius L. H. Spierings, MD, PhD
According to the International Headache Society (IHS), a patient with headache on 15 or more days per month for more than three months, and whose headache has the features of migraine on at least eight days per month, fulfills the diagnostic criteria for chronic migraine. A migraineur with headache on 14 or fewer days per month has episodic migraine. The neurology community has accepted this distinction.
The IHS classification is “extremely simple” and “highly arbitrarily defined,” said Dr. Spierings, Director of the Headache and Face Pain Program at Tufts Medical Center in Boston and Clinical Professor of Craniofacial Pain at Tufts University. “There must be more behind that distinction, especially when you look at the question of why Botox works preventively in chronic migraine and not in episodic migraine.”
Taking the perspective of a general practitioner, rather than that of a headache specialist, may clarify the distinction between chronic and episodic migraine, according to Dr. Spierings. A general review of systems suggests that patients with episodic migraine tend to be healthy overall, while patients with chronic migraine tend to have many psychiatric and medical comorbidities. In an exploratory study, Dr. Spierings and colleagues found that women with chronic migraine had a significantly higher prevalence of menstrual cycle disorders (eg, oligomenorrhea and polymenorrhea) and dysmenorrhea, compared with women with episodic migraine.
These findings appear to be consistent with those of previous research. In 2002, Bigal and colleagues found that asthma, allergies, hypertension, and hypothyroidism were significantly more common in patients with chronic migraine than in those with episodic migraine. In 2006, Tietjen et al observed that endometriosis was significantly more common in women with chronic migraine than in women with episodic migraine.
In the most extensive study in this area, Ferrari et al found that psychiatric, gastrointestinal, musculoskeletal, ocular, genitourinary, hematologic, cerebrovascular, and cardiac comorbidities were significantly more common in patients with chronic migraine than in those with episodic migraine. Hypertension, constipation, and insomnia also were more prevalent in chronic migraine.
In addition, data from various studies show that patients with chronic migraine tend to be, on average, 10 to 20 years older than those with episodic migraine. About two-thirds of patients with chronic migraine develop their condition gradually over time out of episodic migraine, a transition that takes, on average, 11.6 years. During this period, these patients may develop the comorbidities that are more frequent in chronic migraine, said Dr. Spierings.
But younger patients with chronic migraine also have more comorbidities than patients of the same age with episodic migraine. One patient of Dr. Spierings was an 18-year-old woman who had had chronic migraine since menarche and whose mother had migraine. The woman’s comorbidities included fatigue, insomnia, anxiety, depression, tight and sore neck and shoulder muscles, reflux disease, and diarrhea. Another patient of Dr. Spierings was a 20-year-old woman who had had chronic migraine since menarche and whose mother had migraine. Among her comorbidities were fatigue, insomnia, depression, tight and sore neck and shoulder muscles, lumbago, polymenorrhea, dysmenorrhea, and hypermenorrhea.
Dr. Spierings also examined a 34-year-old woman without a family history of migraine. She developed a pressure sensation in the temples, but not headaches or migraine, after pregnancy. The woman’s comorbidities included fatigue, anxiety, tight and sore neck and shoulder muscles, fibromyalgia, gastritis, constipation, endometriosis, and hypermenorrhea.
All three patients have a disorder of multiple systems that affects the nervous system, the musculoskeletal system, the gastrointestinal system, and the genitourinary system. “The only unifying diagnosis … is somatic symptom disorder,” said Dr. Spierings. Yet this diagnosis is unsatisfying, he added.
“These people have a systemic endocrine–metabolic disorder centered around energy metabolism that causes the multitude of medical and psychiatric conditions that we tend to see in patients [with chronic migraine] .… It is a syndrome with multiple etiologies, either endocrine or metabolic, genetic or acquired.” The first two patients may have a “genetically determined headache amplifier” that contributed to the development of chronic migraine, Dr. Spierings added. The third patient, who has no family history of migraine, does not have this genetically determined headache amplifier.
In previous research, Dr. Spierings and colleagues concluded that stress, tension, irregular eating times, fatigue, and insufficient sleep were general headache triggers to which everyone is susceptible. “When we do not have that headache amplifier, we get regular headaches that we can combat with a couple of aspirin. When we have that headache amplifier inherited from one or both parents, we need specific antimigraine medications to take care of it,” he said. The inherited headache amplifier “is the essence of migraine” and is related to the threshold at which neurogenic inflammation occurs, said Dr. Spierings. Patients with chronic migraine have the headache amplifier and a systemic disorder not shared by patients with episodic migraine, he concluded.
—Erik Greb

Smartphones, smart parents
In the age of technology, parents denying their teens a smartphone is blatant child abuse, at least in the eyes of the teen. Between Twitter, Instagram, and Snapchat, a teen’s entire life revolves around minute-to-minute check-ins. Smartphones have opened the door for sexual predators, bullying, and complete withdrawal from the world that surrounds them. But, with every bad there is a good and it’s knowing how to make the technology takeover work for you.

The smartphone is the best bargaining chip ever created. A teen would sooner die than lose his or her phone. Parents need to use this upper hand to get just about anything done: “You will get your phone back when XYZ is done.” Teens should understand that a phone is a privilege and not a right, so if they don’t want to cooperate, then there is a consequence.
Second, there is no greater source of information than a teen’s phone. From information in text, to locations, to the dreaded selfies, teens cannot help themselves when it comes to sharing every aspect of their lives. There are countless stories of teens getting busted because they posted a picture on Instagram with the person they were not supposed to be with or from a place they were not supposed to be. There are several great apps that allow parents to see deleted texts, and track locations and websites visited. These same apps allow parents to add controls that block X-rated websites, and notify them when the teen leaves a location or signs up for social media apps.
Accidents are the leading cause of death among teens and smartphones have only increased that. A recent study showed that 34% admitted to texting and driving. Another study reported that 11 teens die per day* because of distracted driver accidents. Not only are teens distracted, they also are inexperienced and are increasing their risk of injury. Teens are 23 times more likely to be in an accident as a result of distracted driving.

Now, there are apps that will alert parents when the teen is driving above the speed limit or has left the restricted area designated by the parent. These apps can silence incoming texts and prevent texts from being sent if the teen is in motion. Some of the apps will read the text out loud and respond with an automated response, letting the caller know that they are unavailable. Canary, My Mobile Watchdog, and Drivesafe.ly are examples, but both Sprint and Verizon have similar apps available. This is an excellent way for parents to monitor teen driving habits. The cost varies from $7.99/month to $99/month but the information provided is priceless.
Whether we like it or not, smartphones are here and have totally changed how teens interact and give them limitless exposure. Many parents, even if they own a smartphone, only use it for its basic functions and may have no idea these types of controls exist. Educating parents that they can use the phone as a tool to monitor and protect their teens is an important part of the well visit, and could very well save a life.
Dr. Pearce is a pediatrician in Frankfort, Ill. Email her at [email protected].
*Correction, 6/1/2016: The frequency of teen deaths due to distracted driver accidents was misquoted.
In the age of technology, parents denying their teens a smartphone is blatant child abuse, at least in the eyes of the teen. Between Twitter, Instagram, and Snapchat, a teen’s entire life revolves around minute-to-minute check-ins. Smartphones have opened the door for sexual predators, bullying, and complete withdrawal from the world that surrounds them. But, with every bad there is a good and it’s knowing how to make the technology takeover work for you.
The smartphone is the best bargaining chip ever created. A teen would sooner die than lose his or her phone. Parents need to use this upper hand to get just about anything done: “You will get your phone back when XYZ is done.” Teens should understand that a phone is a privilege and not a right, so if they don’t want to cooperate, then there is a consequence.
Second, there is no greater source of information than a teen’s phone. From information in text, to locations, to the dreaded selfies, teens cannot help themselves when it comes to sharing every aspect of their lives. There are countless stories of teens getting busted because they posted a picture on Instagram with the person they were not supposed to be with or from a place they were not supposed to be. There are several great apps that allow parents to see deleted texts, and track locations and websites visited. These same apps allow parents to add controls that block X-rated websites, and notify them when the teen leaves a location or signs up for social media apps.
Accidents are the leading cause of death among teens and smartphones have only increased that. A recent study showed that 34% admitted to texting and driving. Another study reported that 11 teens die per day* because of distracted driver accidents. Not only are teens distracted, they also are inexperienced and are increasing their risk of injury. Teens are 23 times more likely to be in an accident as a result of distracted driving.
Now, there are apps that will alert parents when the teen is driving above the speed limit or has left the restricted area designated by the parent. These apps can silence incoming texts and prevent texts from being sent if the teen is in motion. Some of the apps will read the text out loud and respond with an automated response, letting the caller know that they are unavailable. Canary, My Mobile Watchdog, and Drivesafe.ly are examples, but both Sprint and Verizon have similar apps available. This is an excellent way for parents to monitor teen driving habits. The cost varies from $7.99/month to $99/month but the information provided is priceless.
Whether we like it or not, smartphones are here and have totally changed how teens interact and give them limitless exposure. Many parents, even if they own a smartphone, only use it for its basic functions and may have no idea these types of controls exist. Educating parents that they can use the phone as a tool to monitor and protect their teens is an important part of the well visit, and could very well save a life.
Dr. Pearce is a pediatrician in Frankfort, Ill. Email her at [email protected].
*Correction, 6/1/2016: The frequency of teen deaths due to distracted driver accidents was misquoted.
In the age of technology, parents denying their teens a smartphone is blatant child abuse, at least in the eyes of the teen. Between Twitter, Instagram, and Snapchat, a teen’s entire life revolves around minute-to-minute check-ins. Smartphones have opened the door for sexual predators, bullying, and complete withdrawal from the world that surrounds them. But, with every bad there is a good and it’s knowing how to make the technology takeover work for you.
The smartphone is the best bargaining chip ever created. A teen would sooner die than lose his or her phone. Parents need to use this upper hand to get just about anything done: “You will get your phone back when XYZ is done.” Teens should understand that a phone is a privilege and not a right, so if they don’t want to cooperate, then there is a consequence.
Second, there is no greater source of information than a teen’s phone. From information in text, to locations, to the dreaded selfies, teens cannot help themselves when it comes to sharing every aspect of their lives. There are countless stories of teens getting busted because they posted a picture on Instagram with the person they were not supposed to be with or from a place they were not supposed to be. There are several great apps that allow parents to see deleted texts, and track locations and websites visited. These same apps allow parents to add controls that block X-rated websites, and notify them when the teen leaves a location or signs up for social media apps.
Accidents are the leading cause of death among teens and smartphones have only increased that. A recent study showed that 34% admitted to texting and driving. Another study reported that 11 teens die per day* because of distracted driver accidents. Not only are teens distracted, they also are inexperienced and are increasing their risk of injury. Teens are 23 times more likely to be in an accident as a result of distracted driving.
Now, there are apps that will alert parents when the teen is driving above the speed limit or has left the restricted area designated by the parent. These apps can silence incoming texts and prevent texts from being sent if the teen is in motion. Some of the apps will read the text out loud and respond with an automated response, letting the caller know that they are unavailable. Canary, My Mobile Watchdog, and Drivesafe.ly are examples, but both Sprint and Verizon have similar apps available. This is an excellent way for parents to monitor teen driving habits. The cost varies from $7.99/month to $99/month but the information provided is priceless.
Whether we like it or not, smartphones are here and have totally changed how teens interact and give them limitless exposure. Many parents, even if they own a smartphone, only use it for its basic functions and may have no idea these types of controls exist. Educating parents that they can use the phone as a tool to monitor and protect their teens is an important part of the well visit, and could very well save a life.
Dr. Pearce is a pediatrician in Frankfort, Ill. Email her at [email protected].
*Correction, 6/1/2016: The frequency of teen deaths due to distracted driver accidents was misquoted.

Calcineurin-targeted therapies eyed for multiple myeloma
Treating multiple myeloma cells with panobinostat and FK506 reduced their viability by inhibiting expression of the PPP3CA catalytic subunit of calcineurin, according to researchers.
“The development of new calcineurin-targeted therapies, which inhibit PPP3CA–NF-kappaB signaling by small molecules, is expected to profoundly improve the treatment of multiple myeloma. This will overcome drug resistance and improve osteolytic lesions in a wide range of patients, including those receiving reduced intensity–conditioned allogeneic stem cell transplantation, who may be treated with panobinostat and FK506,” wrote Dr. Yoichi Imai of Tokyo Women’s Medical University in Japan, and his associates (JCI Insight 2016 doi: 10.1172/jci.insight.85061). .
Adding panobinostat to bortezomib and dexamethasone has been shown to improve progression-free survival in relapsed and refractory multiple myeloma, the researchers noted. Other studies have linked calcineurin activation to the pathogenesis of T-cell cancers, and calcineurin inhibition seems to be involved in defective B-cell activation, they added.
Eight candidate oncogenes were identified by use of the Gene Expression Omnibus. PPP3CA was expressed at significantly higher levels in multiple myeloma cells from patients with stage III disease compared with those with stage I disease (P = .016). Furthermore, levels of serum lactate dehydrogenase correlated with PPP3CA expression and with poor overall and progression-free survival. Patients with high PPP3CA expression also had high levels of alpha4 integrins, which mediate resistance to bortezomib and conventional chemotherapy, the researchers noted.
When multiple myeloma cells were exposed to either panobinostat or a control agent, PPP3CA dropped in the panobinostat-treated cells. Adding the proteasome inhibitor lactacystin to the mixture counteracted this effect, “supporting the possibility that PPP3CA expression was reduced through protein degradation by panobinostat,” they said.
Levels of PPP3CA expression were lower in multiple myeloma cells that were cotreated with an HDAC inhibitor (panobinostat or ACY-1215) and the immunosuppressive agent FK506 than in multiple myeloma cells that were exposed only to an HDAC inhibitor. In addition, the combination regimen blocked the formation of osteoclasts, which are involved in osteolytic lesions, the researchers noted.
Also, significantly higher PPP3CA expression, which correlated with worse progression-free survival, was noted in bortezomib-resistant patients, compared with bortezomib-sensitive patients.
“The cytotoxic effect exerted by panobinostat on CD20+ cells was subtle, while the addition of FK506 did not increase their viability,” the researchers reported. “Moreover, development of T and B lineage cells was normal in PPP3CA-deficient mice, and panobinostat did not compromise donor lymphocyte reconstitution in a mouse BM transplantation model. These results suggest that calcineurin-targeting therapy exerts an antimyeloma effect without inducing significant side effects in normal lymphoid systems.”
The Japan Society for the Promotion of Science, the Takeda Science Foundation, the International Myeloma Foundation, and the Japan Leukemia Research Fund funded the study. The investigators had no disclosures.
Treating multiple myeloma cells with panobinostat and FK506 reduced their viability by inhibiting expression of the PPP3CA catalytic subunit of calcineurin, according to researchers.
“The development of new calcineurin-targeted therapies, which inhibit PPP3CA–NF-kappaB signaling by small molecules, is expected to profoundly improve the treatment of multiple myeloma. This will overcome drug resistance and improve osteolytic lesions in a wide range of patients, including those receiving reduced intensity–conditioned allogeneic stem cell transplantation, who may be treated with panobinostat and FK506,” wrote Dr. Yoichi Imai of Tokyo Women’s Medical University in Japan, and his associates (JCI Insight 2016 doi: 10.1172/jci.insight.85061). .
Adding panobinostat to bortezomib and dexamethasone has been shown to improve progression-free survival in relapsed and refractory multiple myeloma, the researchers noted. Other studies have linked calcineurin activation to the pathogenesis of T-cell cancers, and calcineurin inhibition seems to be involved in defective B-cell activation, they added.
Eight candidate oncogenes were identified by use of the Gene Expression Omnibus. PPP3CA was expressed at significantly higher levels in multiple myeloma cells from patients with stage III disease compared with those with stage I disease (P = .016). Furthermore, levels of serum lactate dehydrogenase correlated with PPP3CA expression and with poor overall and progression-free survival. Patients with high PPP3CA expression also had high levels of alpha4 integrins, which mediate resistance to bortezomib and conventional chemotherapy, the researchers noted.
When multiple myeloma cells were exposed to either panobinostat or a control agent, PPP3CA dropped in the panobinostat-treated cells. Adding the proteasome inhibitor lactacystin to the mixture counteracted this effect, “supporting the possibility that PPP3CA expression was reduced through protein degradation by panobinostat,” they said.
Levels of PPP3CA expression were lower in multiple myeloma cells that were cotreated with an HDAC inhibitor (panobinostat or ACY-1215) and the immunosuppressive agent FK506 than in multiple myeloma cells that were exposed only to an HDAC inhibitor. In addition, the combination regimen blocked the formation of osteoclasts, which are involved in osteolytic lesions, the researchers noted.
Also, significantly higher PPP3CA expression, which correlated with worse progression-free survival, was noted in bortezomib-resistant patients, compared with bortezomib-sensitive patients.
“The cytotoxic effect exerted by panobinostat on CD20+ cells was subtle, while the addition of FK506 did not increase their viability,” the researchers reported. “Moreover, development of T and B lineage cells was normal in PPP3CA-deficient mice, and panobinostat did not compromise donor lymphocyte reconstitution in a mouse BM transplantation model. These results suggest that calcineurin-targeting therapy exerts an antimyeloma effect without inducing significant side effects in normal lymphoid systems.”
The Japan Society for the Promotion of Science, the Takeda Science Foundation, the International Myeloma Foundation, and the Japan Leukemia Research Fund funded the study. The investigators had no disclosures.
Treating multiple myeloma cells with panobinostat and FK506 reduced their viability by inhibiting expression of the PPP3CA catalytic subunit of calcineurin, according to researchers.
“The development of new calcineurin-targeted therapies, which inhibit PPP3CA–NF-kappaB signaling by small molecules, is expected to profoundly improve the treatment of multiple myeloma. This will overcome drug resistance and improve osteolytic lesions in a wide range of patients, including those receiving reduced intensity–conditioned allogeneic stem cell transplantation, who may be treated with panobinostat and FK506,” wrote Dr. Yoichi Imai of Tokyo Women’s Medical University in Japan, and his associates (JCI Insight 2016 doi: 10.1172/jci.insight.85061). .
Adding panobinostat to bortezomib and dexamethasone has been shown to improve progression-free survival in relapsed and refractory multiple myeloma, the researchers noted. Other studies have linked calcineurin activation to the pathogenesis of T-cell cancers, and calcineurin inhibition seems to be involved in defective B-cell activation, they added.
Eight candidate oncogenes were identified by use of the Gene Expression Omnibus. PPP3CA was expressed at significantly higher levels in multiple myeloma cells from patients with stage III disease compared with those with stage I disease (P = .016). Furthermore, levels of serum lactate dehydrogenase correlated with PPP3CA expression and with poor overall and progression-free survival. Patients with high PPP3CA expression also had high levels of alpha4 integrins, which mediate resistance to bortezomib and conventional chemotherapy, the researchers noted.
When multiple myeloma cells were exposed to either panobinostat or a control agent, PPP3CA dropped in the panobinostat-treated cells. Adding the proteasome inhibitor lactacystin to the mixture counteracted this effect, “supporting the possibility that PPP3CA expression was reduced through protein degradation by panobinostat,” they said.
Levels of PPP3CA expression were lower in multiple myeloma cells that were cotreated with an HDAC inhibitor (panobinostat or ACY-1215) and the immunosuppressive agent FK506 than in multiple myeloma cells that were exposed only to an HDAC inhibitor. In addition, the combination regimen blocked the formation of osteoclasts, which are involved in osteolytic lesions, the researchers noted.
Also, significantly higher PPP3CA expression, which correlated with worse progression-free survival, was noted in bortezomib-resistant patients, compared with bortezomib-sensitive patients.
“The cytotoxic effect exerted by panobinostat on CD20+ cells was subtle, while the addition of FK506 did not increase their viability,” the researchers reported. “Moreover, development of T and B lineage cells was normal in PPP3CA-deficient mice, and panobinostat did not compromise donor lymphocyte reconstitution in a mouse BM transplantation model. These results suggest that calcineurin-targeting therapy exerts an antimyeloma effect without inducing significant side effects in normal lymphoid systems.”
The Japan Society for the Promotion of Science, the Takeda Science Foundation, the International Myeloma Foundation, and the Japan Leukemia Research Fund funded the study. The investigators had no disclosures.
FROM JCI INSIGHT
Key clinical point: Treating multiple myeloma cells with panobinostat and FK506 reduced their viability by inhibiting expression of the PPP3CA catalytic subunit of calcineurin.
Major finding: PPP3CA was associated with MM cell viability and osteoclast formation, and was degraded by panobinostat through HDAC inhibition.
Data source: An in vitro and in vivo laboratory study of MM in human and mouse models.
Disclosures: The Japan Society for the Promotion of Science, the Takeda Science Foundation, the International Myeloma Foundation, and the Japan Leukemia Research Fund funded the study. The investigators had no disclosures.
Primary arrhythmia syndromes: Common cause of pediatric sudden cardiac death
CHICAGO – Just over one-half of all sudden deaths in a large pediatric case series were due to a primary arrhythmia syndrome, Dr. Grazia Delle Donne reported at the annual meeting of the American College of Cardiology.
She presented an analysis of all patients under the age of 18 years who were referred to London’s Royal Brompton Hospital for post mortem examination following presumed sudden cardiac death during 1991-2013. Royal Brompton is a national referral center for sudden cardiac death.
The review was undertaken because sudden cardiac death in the pediatric population occurs infrequently. Little is known about the prevalence of the various causes, noted Dr. Delle Donne of Royal Brompton.

Of the 398 subjects, 266 (67%) were female. The median age at death was 14 years. Twenty-two percent of the fatalities occurred during or immediately after exercise. Thirty-nine percent occurred while at rest.
Thirty-one percent of subjects had a family history of sudden cardiac death, another 14% had a family history of cardiomyopathy, and in 5% of cases there was a significant family history of arrhythmia.
Five percent of the children were known to have congenital heart disease. Eighteen percent of the children had a history of syncope.
Investigators determined that a primary arrhythmia syndrome such as long QT or Brugada syndrome was the cause of sudden death in 54% of cases. Death was attributed to cardiomyopathy in 15% cases, congenital heart disease in 8%, myocarditis in 6%, and coronary anomalies in 5%, with miscellaneous causes accounting for the remainder.
Dr. Delle Donne reported having no financial conflicts of interest regarding her presentation.
CHICAGO – Just over one-half of all sudden deaths in a large pediatric case series were due to a primary arrhythmia syndrome, Dr. Grazia Delle Donne reported at the annual meeting of the American College of Cardiology.
She presented an analysis of all patients under the age of 18 years who were referred to London’s Royal Brompton Hospital for post mortem examination following presumed sudden cardiac death during 1991-2013. Royal Brompton is a national referral center for sudden cardiac death.
The review was undertaken because sudden cardiac death in the pediatric population occurs infrequently. Little is known about the prevalence of the various causes, noted Dr. Delle Donne of Royal Brompton.
Of the 398 subjects, 266 (67%) were female. The median age at death was 14 years. Twenty-two percent of the fatalities occurred during or immediately after exercise. Thirty-nine percent occurred while at rest.
Thirty-one percent of subjects had a family history of sudden cardiac death, another 14% had a family history of cardiomyopathy, and in 5% of cases there was a significant family history of arrhythmia.
Five percent of the children were known to have congenital heart disease. Eighteen percent of the children had a history of syncope.
Investigators determined that a primary arrhythmia syndrome such as long QT or Brugada syndrome was the cause of sudden death in 54% of cases. Death was attributed to cardiomyopathy in 15% cases, congenital heart disease in 8%, myocarditis in 6%, and coronary anomalies in 5%, with miscellaneous causes accounting for the remainder.
Dr. Delle Donne reported having no financial conflicts of interest regarding her presentation.
CHICAGO – Just over one-half of all sudden deaths in a large pediatric case series were due to a primary arrhythmia syndrome, Dr. Grazia Delle Donne reported at the annual meeting of the American College of Cardiology.
She presented an analysis of all patients under the age of 18 years who were referred to London’s Royal Brompton Hospital for post mortem examination following presumed sudden cardiac death during 1991-2013. Royal Brompton is a national referral center for sudden cardiac death.
The review was undertaken because sudden cardiac death in the pediatric population occurs infrequently. Little is known about the prevalence of the various causes, noted Dr. Delle Donne of Royal Brompton.
Of the 398 subjects, 266 (67%) were female. The median age at death was 14 years. Twenty-two percent of the fatalities occurred during or immediately after exercise. Thirty-nine percent occurred while at rest.
Thirty-one percent of subjects had a family history of sudden cardiac death, another 14% had a family history of cardiomyopathy, and in 5% of cases there was a significant family history of arrhythmia.
Five percent of the children were known to have congenital heart disease. Eighteen percent of the children had a history of syncope.
Investigators determined that a primary arrhythmia syndrome such as long QT or Brugada syndrome was the cause of sudden death in 54% of cases. Death was attributed to cardiomyopathy in 15% cases, congenital heart disease in 8%, myocarditis in 6%, and coronary anomalies in 5%, with miscellaneous causes accounting for the remainder.
Dr. Delle Donne reported having no financial conflicts of interest regarding her presentation.
AT ACC 16
Key clinical point: Primary arrhythmia syndromes accounted for most cases of sudden cardiac death in a large pediatric case series.
Major finding: Family history of sudden cardiac death was present in 31% of 398 cases.
Data source: A retrospective review of all 398 cases of sudden cardiac death in childhood referred for post mortem examination at a British center during 1991-2013.
Disclosures: Dr. Delle Donne reported having no financial conflicts of interest.

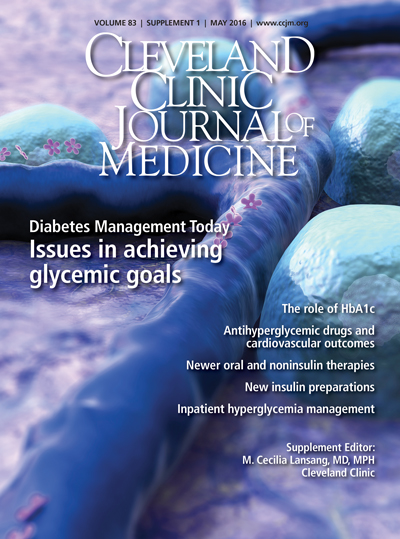
Diabetes Management Today: Issues in achieving glycemic goals

Supplement Editor:
M. Cecilia Lansang, MD, MPH
Contents
Diabetes management today: Issues in achieving glycemic goals
M. Cecilia Lansang
The role of hemoglobin A1c in the assessment of diabetes and cardiovascular risk
Courtney Nagel Sandler and Marie E. McDonnell
Antihyperglycemic drugs and cardiovascular outcomes in type 2 diabetes
Om P. Ganda
Newer oral and noninsulin therapies to treat type 2 diabetes mellitus
Kathie L. Hermayer and Andrew Dake
New insulin preparations: A primer for the clinician
Luigi Meneghini
Inpatient hyperglycemia management: A practical review for primary medical and surgical teams
M. Cecilia Lansang and Guillermo E. Umpierrez
Supplement Editor:
M. Cecilia Lansang, MD, MPH
Contents
Diabetes management today: Issues in achieving glycemic goals
M. Cecilia Lansang
The role of hemoglobin A1c in the assessment of diabetes and cardiovascular risk
Courtney Nagel Sandler and Marie E. McDonnell
Antihyperglycemic drugs and cardiovascular outcomes in type 2 diabetes
Om P. Ganda
Newer oral and noninsulin therapies to treat type 2 diabetes mellitus
Kathie L. Hermayer and Andrew Dake
New insulin preparations: A primer for the clinician
Luigi Meneghini
Inpatient hyperglycemia management: A practical review for primary medical and surgical teams
M. Cecilia Lansang and Guillermo E. Umpierrez
Supplement Editor:
M. Cecilia Lansang, MD, MPH
Contents
Diabetes management today: Issues in achieving glycemic goals
M. Cecilia Lansang
The role of hemoglobin A1c in the assessment of diabetes and cardiovascular risk
Courtney Nagel Sandler and Marie E. McDonnell
Antihyperglycemic drugs and cardiovascular outcomes in type 2 diabetes
Om P. Ganda
Newer oral and noninsulin therapies to treat type 2 diabetes mellitus
Kathie L. Hermayer and Andrew Dake
New insulin preparations: A primer for the clinician
Luigi Meneghini
Inpatient hyperglycemia management: A practical review for primary medical and surgical teams
M. Cecilia Lansang and Guillermo E. Umpierrez
Advances in menopause transition management
Guest Editor
Andrew M. Kaunitz, MD
Authors
Sheryl Kingsberg, PhD; Michael Krychman, MD; Juliana M. Kling, MD, MPH; JoAnn E. Manson, MD, DrPH; James H. Liu, MD; Gretchen Collins, MD; Susan Kellogg Spadt, PhD, CRNP, IF, FCST, CSC
The object of this special issue is to enhance how you respond to and manage patients' menopausal and sexuality symptom concerns. The articles aim to alert women's health professionals to:
- the effects of sexual dysfunction, genitourinary syndrome of menopause in particular, on women emotionally and physically, and the available treatment options
- current nonhormonal treatment for hot flashes
- latest data on SERMs' role in managing menopausal symptoms, considering matching patients' symptoms to agents
- recommendations for intimacy counseling.
Articles included:

Not enough women are receiving treatment for bothersome menopausal symptoms
Andrew M. Kaunitz, MD
Mitigating the impact of genitourinary syndrome of menopause on sexuality
Sheryl Kingsberg, PhD, and Michael Krychman, MD
Nonhormonal treatment options for vasomotor symptoms of menopause
Juliana M. Kling, MD, MPH, and JoAnn E. Manson, MD, DrPH
SERMs in menopause: Matching agents to patients' symptoms and attributes
James H. Liu, MD, and Gretchen Collins, MD
Tips for counseling women about intimacy after menopause
Susan Kellogg Spadt, PhD, CRNP, IF, FCST, CSC
Guest Editor
Andrew M. Kaunitz, MD
Authors
Sheryl Kingsberg, PhD; Michael Krychman, MD; Juliana M. Kling, MD, MPH; JoAnn E. Manson, MD, DrPH; James H. Liu, MD; Gretchen Collins, MD; Susan Kellogg Spadt, PhD, CRNP, IF, FCST, CSC
The object of this special issue is to enhance how you respond to and manage patients' menopausal and sexuality symptom concerns. The articles aim to alert women's health professionals to:
- the effects of sexual dysfunction, genitourinary syndrome of menopause in particular, on women emotionally and physically, and the available treatment options
- current nonhormonal treatment for hot flashes
- latest data on SERMs' role in managing menopausal symptoms, considering matching patients' symptoms to agents
- recommendations for intimacy counseling.
Articles included:
Not enough women are receiving treatment for bothersome menopausal symptoms
Andrew M. Kaunitz, MD
Mitigating the impact of genitourinary syndrome of menopause on sexuality
Sheryl Kingsberg, PhD, and Michael Krychman, MD
Nonhormonal treatment options for vasomotor symptoms of menopause
Juliana M. Kling, MD, MPH, and JoAnn E. Manson, MD, DrPH
SERMs in menopause: Matching agents to patients' symptoms and attributes
James H. Liu, MD, and Gretchen Collins, MD
Tips for counseling women about intimacy after menopause
Susan Kellogg Spadt, PhD, CRNP, IF, FCST, CSC
Guest Editor
Andrew M. Kaunitz, MD
Authors
Sheryl Kingsberg, PhD; Michael Krychman, MD; Juliana M. Kling, MD, MPH; JoAnn E. Manson, MD, DrPH; James H. Liu, MD; Gretchen Collins, MD; Susan Kellogg Spadt, PhD, CRNP, IF, FCST, CSC
The object of this special issue is to enhance how you respond to and manage patients' menopausal and sexuality symptom concerns. The articles aim to alert women's health professionals to:
- the effects of sexual dysfunction, genitourinary syndrome of menopause in particular, on women emotionally and physically, and the available treatment options
- current nonhormonal treatment for hot flashes
- latest data on SERMs' role in managing menopausal symptoms, considering matching patients' symptoms to agents
- recommendations for intimacy counseling.
Articles included:
Not enough women are receiving treatment for bothersome menopausal symptoms
Andrew M. Kaunitz, MD
Mitigating the impact of genitourinary syndrome of menopause on sexuality
Sheryl Kingsberg, PhD, and Michael Krychman, MD
Nonhormonal treatment options for vasomotor symptoms of menopause
Juliana M. Kling, MD, MPH, and JoAnn E. Manson, MD, DrPH
SERMs in menopause: Matching agents to patients' symptoms and attributes
James H. Liu, MD, and Gretchen Collins, MD
Tips for counseling women about intimacy after menopause
Susan Kellogg Spadt, PhD, CRNP, IF, FCST, CSC

Diabetes management today: Issues in achieving glycemic goals

In 2001, it was projected that nearly 20 million Americans would have diabetes by 2025.1 But in 2015, 29 million Americans had been diagnosed with diabetes, exceeding the 2001 projection by 9 million. Newer projections are sobering—the prevalence of diabetes is estimated to increase from 9.3% of the population in 2012 to between 21% and 30% by 2050.2
As a result, most healthcare providers will face patients with diabetes or at risk for diabetes. Patients with diabetes today differ from those in the past in that increasing numbers of them are insulin resistant with impaired insulin secretion. Elements of metabolic syndrome including obesity, hypertension, high triglyceride levels, and low high-density lipoprotein levels increase the risk of diabetes and cardiovascular disease.
With the medications and treatments available today, how well are we practitioners doing in managing hyperglycemia? National Health and Nutrition Examination Survey data from 2005 to 2010 show that among patients taking diabetes medication, only 55% had controlled hemoglobin A1c (HbA1c) levels.3 The role of HbA1c in the assessment and management of patients with diabetes is discussed in this supplement by Marie E. McDonnell, MD, and Courtney Nagel Sandler, MD. Though an essential tool in blood glucose control, appropriate HbA1c target levels and reliability vary among patients. Interpretation of HbA1c may be difficult in some patients, and HbA1c levels should be tailored by balancing risks and benefits.
Diabetes management is complicated by the existence of comorbid cardiovascular disease. While a number of studies link intense glycemic control to improved cardiovascular outcomes in patients with diabetes, other studies have demonstrated higher morbidity and mortality associated with antihyperglycemic drugs. Om P. Ganda, MD, reviews the sometimes perplexing and confusing research on the effect of glucose-lowering drugs on cardiovascular outcomes, including results from a recently completed trial evaluating empagliflozin.
Further reflecting the complexity of the biologic mechanisms associated with treating diabetes, today we have 12 classes of drugs approved by the US Food and Drug Administration (FDA) for diabetes compared with the two classes (insulin and sulfonylureas) available in the 1980s. In the last decade, the FDA approved 14 noninsulin drugs in 5 classes. In this supplement, Kathie L. Hermayer, MD, MS, and Andrew Dake, MD, discuss the various noninsulin therapies and their use in achieving the balance of blood glucose control and reduced adverse events and hypoglycemia in patients with type 2 diabetes.
For patients with profound insulin deficiency, insulin remains the most important therapeutic option. Insulin is available in four general classes: rapid-, short-, intermediate-, and long-acting (and in premixed variations). The latest in insulin formulations include ultra-long-acting insulin, new concentrated insulin (glargine U-300 and lispro U-200), and inhaled insulin. A primer on these new insulin preparations and how they fit into clinical practice is provided by Luigi Meneghini, MD, MBA.
Finally, despite the availability of new medications for outpatient management of patients with diabetes, inpatient care represents the largest proportion of healthcare dollars spent on these patients. In inpatients, hyperglycemia is associated with a higher risk of complications, higher utilization of healthcare resources, and increased mortality rates. Guillermo E. Umpierrez, MD, CDE, and I outline best practices to achieve glycemic control and avoid hypoglycemia in critically and noncritically ill inpatients.
The growing number of patients with diabetes and the variety of therapeutic options available present physicians with many considerations in achieving glycemic goals. With great enthusiasm, I invite you to read this supplement on diabetes and hope you find it worthwhile and useful in elucidating issues in the management of diabetes today.
- Boyle JP, Honeycutt AA, Narayan KM, et al. Projection of diabetes burden through 2050: impact of changing demography and disease prevalence in the U.S. Diabetes Care 2001; 24:1936–1940.
- Boyle JP, Thompson TJ, Gregg EW, Baker LE, Williamson DF. Projection of the year 2050 burden of diabetes in the US adult population: dynamic modeling of incidence, mortality, and prediabetes prevalence. Popul Health Metr 2010; 8:29.
- Selvin E, Parrinello CM, Sacks DB, Coresh J. Trends in prevalence and control of diabetes in the United States, 1988-1994 and 1999-2010. Ann Intern Med 2014; 160:517–525.
In 2001, it was projected that nearly 20 million Americans would have diabetes by 2025.1 But in 2015, 29 million Americans had been diagnosed with diabetes, exceeding the 2001 projection by 9 million. Newer projections are sobering—the prevalence of diabetes is estimated to increase from 9.3% of the population in 2012 to between 21% and 30% by 2050.2
As a result, most healthcare providers will face patients with diabetes or at risk for diabetes. Patients with diabetes today differ from those in the past in that increasing numbers of them are insulin resistant with impaired insulin secretion. Elements of metabolic syndrome including obesity, hypertension, high triglyceride levels, and low high-density lipoprotein levels increase the risk of diabetes and cardiovascular disease.
With the medications and treatments available today, how well are we practitioners doing in managing hyperglycemia? National Health and Nutrition Examination Survey data from 2005 to 2010 show that among patients taking diabetes medication, only 55% had controlled hemoglobin A1c (HbA1c) levels.3 The role of HbA1c in the assessment and management of patients with diabetes is discussed in this supplement by Marie E. McDonnell, MD, and Courtney Nagel Sandler, MD. Though an essential tool in blood glucose control, appropriate HbA1c target levels and reliability vary among patients. Interpretation of HbA1c may be difficult in some patients, and HbA1c levels should be tailored by balancing risks and benefits.
Diabetes management is complicated by the existence of comorbid cardiovascular disease. While a number of studies link intense glycemic control to improved cardiovascular outcomes in patients with diabetes, other studies have demonstrated higher morbidity and mortality associated with antihyperglycemic drugs. Om P. Ganda, MD, reviews the sometimes perplexing and confusing research on the effect of glucose-lowering drugs on cardiovascular outcomes, including results from a recently completed trial evaluating empagliflozin.
Further reflecting the complexity of the biologic mechanisms associated with treating diabetes, today we have 12 classes of drugs approved by the US Food and Drug Administration (FDA) for diabetes compared with the two classes (insulin and sulfonylureas) available in the 1980s. In the last decade, the FDA approved 14 noninsulin drugs in 5 classes. In this supplement, Kathie L. Hermayer, MD, MS, and Andrew Dake, MD, discuss the various noninsulin therapies and their use in achieving the balance of blood glucose control and reduced adverse events and hypoglycemia in patients with type 2 diabetes.
For patients with profound insulin deficiency, insulin remains the most important therapeutic option. Insulin is available in four general classes: rapid-, short-, intermediate-, and long-acting (and in premixed variations). The latest in insulin formulations include ultra-long-acting insulin, new concentrated insulin (glargine U-300 and lispro U-200), and inhaled insulin. A primer on these new insulin preparations and how they fit into clinical practice is provided by Luigi Meneghini, MD, MBA.
Finally, despite the availability of new medications for outpatient management of patients with diabetes, inpatient care represents the largest proportion of healthcare dollars spent on these patients. In inpatients, hyperglycemia is associated with a higher risk of complications, higher utilization of healthcare resources, and increased mortality rates. Guillermo E. Umpierrez, MD, CDE, and I outline best practices to achieve glycemic control and avoid hypoglycemia in critically and noncritically ill inpatients.
The growing number of patients with diabetes and the variety of therapeutic options available present physicians with many considerations in achieving glycemic goals. With great enthusiasm, I invite you to read this supplement on diabetes and hope you find it worthwhile and useful in elucidating issues in the management of diabetes today.
In 2001, it was projected that nearly 20 million Americans would have diabetes by 2025.1 But in 2015, 29 million Americans had been diagnosed with diabetes, exceeding the 2001 projection by 9 million. Newer projections are sobering—the prevalence of diabetes is estimated to increase from 9.3% of the population in 2012 to between 21% and 30% by 2050.2
As a result, most healthcare providers will face patients with diabetes or at risk for diabetes. Patients with diabetes today differ from those in the past in that increasing numbers of them are insulin resistant with impaired insulin secretion. Elements of metabolic syndrome including obesity, hypertension, high triglyceride levels, and low high-density lipoprotein levels increase the risk of diabetes and cardiovascular disease.
With the medications and treatments available today, how well are we practitioners doing in managing hyperglycemia? National Health and Nutrition Examination Survey data from 2005 to 2010 show that among patients taking diabetes medication, only 55% had controlled hemoglobin A1c (HbA1c) levels.3 The role of HbA1c in the assessment and management of patients with diabetes is discussed in this supplement by Marie E. McDonnell, MD, and Courtney Nagel Sandler, MD. Though an essential tool in blood glucose control, appropriate HbA1c target levels and reliability vary among patients. Interpretation of HbA1c may be difficult in some patients, and HbA1c levels should be tailored by balancing risks and benefits.
Diabetes management is complicated by the existence of comorbid cardiovascular disease. While a number of studies link intense glycemic control to improved cardiovascular outcomes in patients with diabetes, other studies have demonstrated higher morbidity and mortality associated with antihyperglycemic drugs. Om P. Ganda, MD, reviews the sometimes perplexing and confusing research on the effect of glucose-lowering drugs on cardiovascular outcomes, including results from a recently completed trial evaluating empagliflozin.
Further reflecting the complexity of the biologic mechanisms associated with treating diabetes, today we have 12 classes of drugs approved by the US Food and Drug Administration (FDA) for diabetes compared with the two classes (insulin and sulfonylureas) available in the 1980s. In the last decade, the FDA approved 14 noninsulin drugs in 5 classes. In this supplement, Kathie L. Hermayer, MD, MS, and Andrew Dake, MD, discuss the various noninsulin therapies and their use in achieving the balance of blood glucose control and reduced adverse events and hypoglycemia in patients with type 2 diabetes.
For patients with profound insulin deficiency, insulin remains the most important therapeutic option. Insulin is available in four general classes: rapid-, short-, intermediate-, and long-acting (and in premixed variations). The latest in insulin formulations include ultra-long-acting insulin, new concentrated insulin (glargine U-300 and lispro U-200), and inhaled insulin. A primer on these new insulin preparations and how they fit into clinical practice is provided by Luigi Meneghini, MD, MBA.
Finally, despite the availability of new medications for outpatient management of patients with diabetes, inpatient care represents the largest proportion of healthcare dollars spent on these patients. In inpatients, hyperglycemia is associated with a higher risk of complications, higher utilization of healthcare resources, and increased mortality rates. Guillermo E. Umpierrez, MD, CDE, and I outline best practices to achieve glycemic control and avoid hypoglycemia in critically and noncritically ill inpatients.
The growing number of patients with diabetes and the variety of therapeutic options available present physicians with many considerations in achieving glycemic goals. With great enthusiasm, I invite you to read this supplement on diabetes and hope you find it worthwhile and useful in elucidating issues in the management of diabetes today.
- Boyle JP, Honeycutt AA, Narayan KM, et al. Projection of diabetes burden through 2050: impact of changing demography and disease prevalence in the U.S. Diabetes Care 2001; 24:1936–1940.
- Boyle JP, Thompson TJ, Gregg EW, Baker LE, Williamson DF. Projection of the year 2050 burden of diabetes in the US adult population: dynamic modeling of incidence, mortality, and prediabetes prevalence. Popul Health Metr 2010; 8:29.
- Selvin E, Parrinello CM, Sacks DB, Coresh J. Trends in prevalence and control of diabetes in the United States, 1988-1994 and 1999-2010. Ann Intern Med 2014; 160:517–525.
- Boyle JP, Honeycutt AA, Narayan KM, et al. Projection of diabetes burden through 2050: impact of changing demography and disease prevalence in the U.S. Diabetes Care 2001; 24:1936–1940.
- Boyle JP, Thompson TJ, Gregg EW, Baker LE, Williamson DF. Projection of the year 2050 burden of diabetes in the US adult population: dynamic modeling of incidence, mortality, and prediabetes prevalence. Popul Health Metr 2010; 8:29.
- Selvin E, Parrinello CM, Sacks DB, Coresh J. Trends in prevalence and control of diabetes in the United States, 1988-1994 and 1999-2010. Ann Intern Med 2014; 160:517–525.

The role of hemoglobin A1c in the assessment of diabetes and cardiovascular risk
Since its widespread introduction into routine clinical practice nearly 2 decades ago, hemoglobin A1c (HbA1c) measurement has become an integral tool for the diagnosis and management of diabetes mellitus. It is frequently used in both the care of individuals and in landmark population-based clinical trials. It also serves as a surrogate marker of glycemic control and is a key risk indicator for diabetes-associated microvascular and macrovascular complications and mortality.
With so much importance placed on one laboratory value, it is imperative to remember that the test is imperfect, with pitfalls both in accuracy and interpretation. The purpose of this review is to provide a broad understanding of HbA1c and how it can be optimally applied to patient management and the assessment of diabetes and cardiovascular (CV) risk.
HbA1c TESTING, BACKGROUND
HbA1c was first discovered in 1955, but elevated HbA1c levels in diabetes patients were not noted until 1968.1 Another 8 years passed before HbA1c was correlated with blood glucose values in hospitalized patients with diabetes and was proposed for monitoring glycemia.2
Biochemically, HbA1c forms through a nonenzymatic reaction in which glucose attaches to the valine amino terminal of one or both beta chains of hemoglobin A. This compound can be separated out from nonglycated hemoglobin and from other glycated hemoglobin molecules through various methods, such as high performance liquid chromatography or immunoassay.3
During the first few years of clinical use, HbA1c measures were inconsistent. The publication of the Diabetes Control and Complications Trial (DCCT) in 19933 made the importance of precise HbA1c measurement apparent. This study found that the approximate 2% difference in HbA1c between standard- and intensive-insulin therapy groups resulted in dramatically reduced risk of microvascular disease in patients with type 1 diabetes. The continuation of the DCCT, the Epidemiology of Diabetes Interventions and Complications trial,4 and a study of patients with type 2 diabetes, the United Kingdom Prospective Diabetes Study (UKPDS),5 further supported the relationship between sustaining a lower average HbA1c over time and improved patient outcomes, including CV events and mortality. Given the implications of small changes in HbA1c on morbidity, the need to reduce error margins in measurement became apparent.
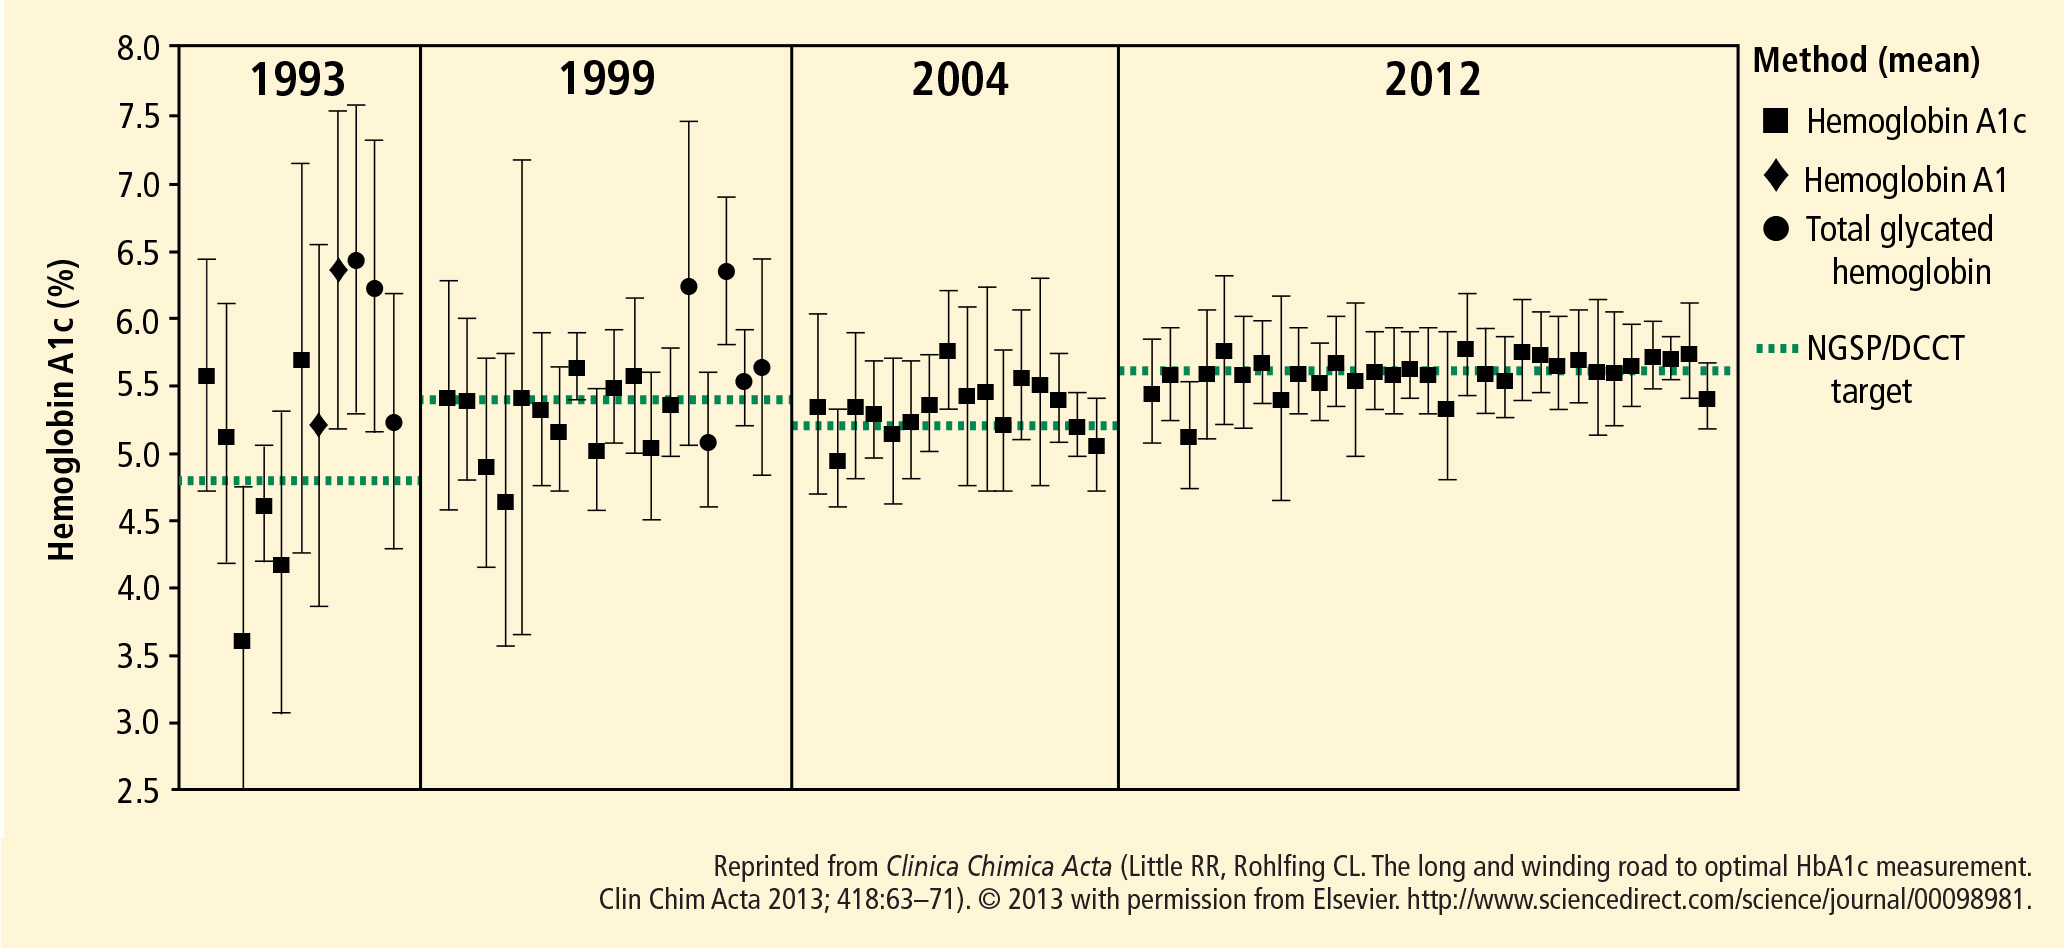
The NGSP (formerly the National Glycohemoglobin Standardization Program) was founded in 1996 to regulate HbA1c measurements to DCCT standards.6 This program, now international in scope through involvement with the International Federation of Clinical Chemistry and Laboratory Medicine (IFCC), calibrates HbA1c measurements by outside laboratories and manufacturers to reference standards. Laboratories and manufacturers that measure HbA1c certify through IFCC/NGSP and participate in yearly surveys to ensure inter-laboratory reproducibility. Through this successful program, standardization and accuracy of HbA1c measurements greatly improved from 1993 to 2012 (Figure 1).1,6,7 Largely owing to this fact, HbA1c was approved as a diagnostic tool by the American Diabetes Association (ADA) in 2009;8 the test has become a key measure for diagnosing, screening, and monitoring diabetes.
The HbA1c level is affected by the blood glucose concentration, the duration of red blood cell (RBC) exposure to varying concentrations, and RBC quantity. HbA1c most accurately reflects the previous 2 to 3 months of glycemic control in the setting of the usual RBC life span of 120 days.9 As a relatively long-term indicator of glycemic control, it may not accurately represent acute improvements or deteriorations in glycemia. Recent factors affecting glycemia must be considered, as HbA1c represents a weighted average glucose with 50% contribution from the preceding month.10
HbA1c must be interpreted with caution. In nonpregnant adults, HbA1c is often falsely low in conditions that reduce the number of glycosylated RBCs, such as hemolysis, splenomegaly, chronic kidney disease, cirrhosis, hemorrhage, blood transfusions, use of erythropoiesis-stimulating agents, and certain hemoglobinopathies (ie, HbS, HbC, HbF). Alternately, HbA1c is elevated in other hemoglobinopathies and in conditions that result in decreased RBC turnover such as iron or vitamin B12-deficiency anemia.11–13
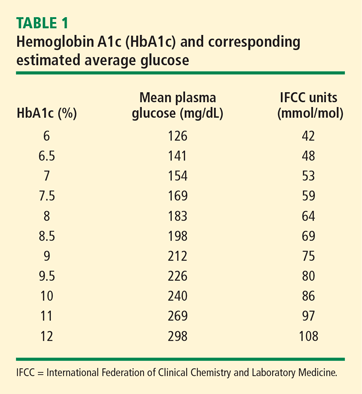
The 2008 A1c-Derived Average Glucose study group (507 participants from 10 international centers) used linear regression analysis to correlate HbA1c drawn every 3 months with average blood glucose readings taken during those 3 months. Results from participants without diabetes were compared with patients with type 1 or type 2 diabetes.14 The resulting significant correlation between HbA1c and average blood glucose readings (coefficient of determination 0.84, P <.0001) became the standard for estimating glycemia from HbA1c (Table 1).
DIAGNOSIS, SCREENING FOR DIABETES
HbA1c was accepted by the ADA as a diagnostic test for diabetes in 20094 and the World Health Organization (WHO) in 2011,13 although the WHO recommended alternate methods for diagnosis given concerns about test availability, cost, and accuracy in the developing world.15
Advantages to HbA1c use in diagnosis include standardization of measurement, convenience as a single blood-draw that does not require fasting, minimal day-to-day variability, and preanalytic sample stability. Although point-of-care testing for HbA1c is widely available, it is not recommended for diagnostic use because these assays are generally not IFCC/NGSP certified and do not undergo the same proficiency testing as laboratory samples.12,16
The 1997 Expert Committee on the Diagnosis and Classification of Diabetes Mellitus17 encouraged that diagnosis be based on the glycemic level at which microvascular complications develop. Using fasting plasma glucose (FPG), 2-hour postprandial plasma glucose, and funduscopic data from several large epidemiologic studies, the committee established that increased risk of diabetic retinopathy occurs at FPG levels greater than or equal to 126 mg/dL (7.0 mmol/L). Subsequent studies analyzed sensitivity and specificity correlations between FPG levels above 126 mg/dL and HbA1c in an effort to define cutoffs for HbA1c as a diagnostic tool; however, their results lacked clear clinical relevance.18–20
In 2003, the DETECT-2 trial analyzed HbA1c levels in more than 28,000 participants to determine HbA1c diagnostic definitions based on microvascular complications.21 Evaluating HbA1c in 0.5% increments, investigators found that the incidence of diabetic retinopathy rose above baseline at HbA1c of 6.5%, the now accepted diagnostic value. It is important to note that this cutoff makes HbA1c less sensitive than other diagnostic indicators, which if applied to the same number of individuals, would result in up to one-third more patients diagnosed with diabetes. However, the lower sensitivity is balanced by higher screening rates given HbA1c accessibility.16
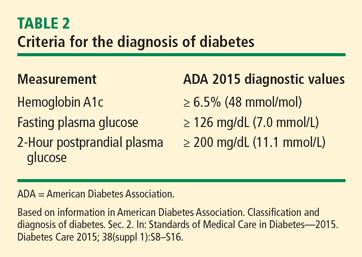
Diabetes can be diagnosed according to the criteria in Table 2, using venous plasma samples for HbA1c and glucose measurements. FPG assessment, both alone and as part of a 2-hour oral glucose tolerance test (OGTT), requires a minimum 8-hour fast. Although it is more cumbersome for both patients and practitioners, the 2-hour OGTT remains the technical standard diagnostic test for diabetes. It can formally identify patients with impaired fasting glucose and impaired glucose tolerance, which are markers of impaired beta cell function and future progression to frank diabetes mellitus.
In the presence of clear symptoms of hyperglycemia such as blurry vision, polyuria, polydipsia, weight loss, and a random plasma glucose value ≥ 200 mg/dL (11.1 mmol/L), a single laboratory measurement fitting any of the three diagnostic criteria confirms the diagnosis of diabetes. In the absence of these symptoms, one positive test must be repeated and remain positive in order to confirm diabetes. As an alternative to repeating the original diagnostic test, two of the three criteria may be positive at any one time to make the diagnosis.13,16
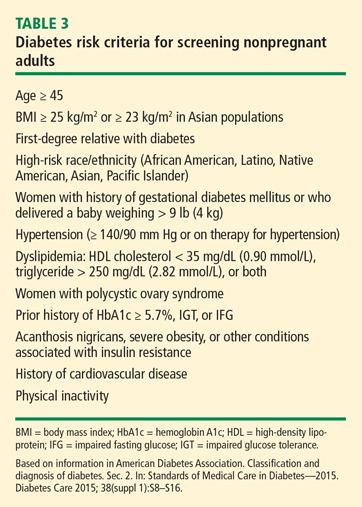
Routine screening for diabetes using HbA1c should be based on risk in the absence of symptoms (Table 3). The ADA recommends screening at 3-year intervals if an initial screen is within normal limits or yearly in individuals with prediabetes or a change in risk status.16 Screening also is recommended for patients on medications that increase the risk of hyperglycemia (eg, glucocorticoids, thiazides, and atypical antipsychotics).
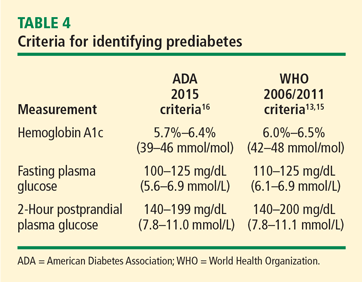
Individuals with prediabetes are identified as having impaired fasting glucose and impaired glucose tolerance based on 2-hour OGTT, FPG, or HbA1c (Table 4). Those with HbA1c values 6.00% to 6.49% are considered by the ADA and WHO to have the highest risk of developing diabetes.13,15,16 This range is based primarily on a 2010 systematic review22 evaluating the relationship between HbA1c and progression to diabetes in studies involving more than 44,000 participants. Patients with HbA1c of 6.0% or above had a 5-year risk of progression to diabetes between 25% and 50%, 20 times higher than those with HbA1c less than 5%.22 The ADA-defined lower limit for diagnosing prediabetes (HbA1c ≥ 5.7%) is based on a 2011 analysis of National Health and Nutrition Examination Survey data.23 In that study, adults with HbA1c levels at or above 5.7% were at similar risk of developing frank type 2 diabetes and CV disease (41.3% over 7.5 years and 13.3% over 10 years, respectively) as the 3,234 participants in the Diabetes Prevention Program, a prospective, population-based study evaluating the risk of incident diabetes.23,24
MONITORING PATIENTS WITH DIABETES
HbA1c should be performed every 3 months in patients with known diabetes and can be spaced to twice yearly in patients meeting treatment goals on stable therapy.
While not recommended for diagnosis, point-of-care testing of HbA1c has been endorsed by the ADA for monitoring patients with diabetes. Studies have shown that a higher percentage of patients achieve HbA1c targets with treatment adjustment based on point-of-care testing of HbA1c at the time of visit vs usual laboratory monitoring.16,25
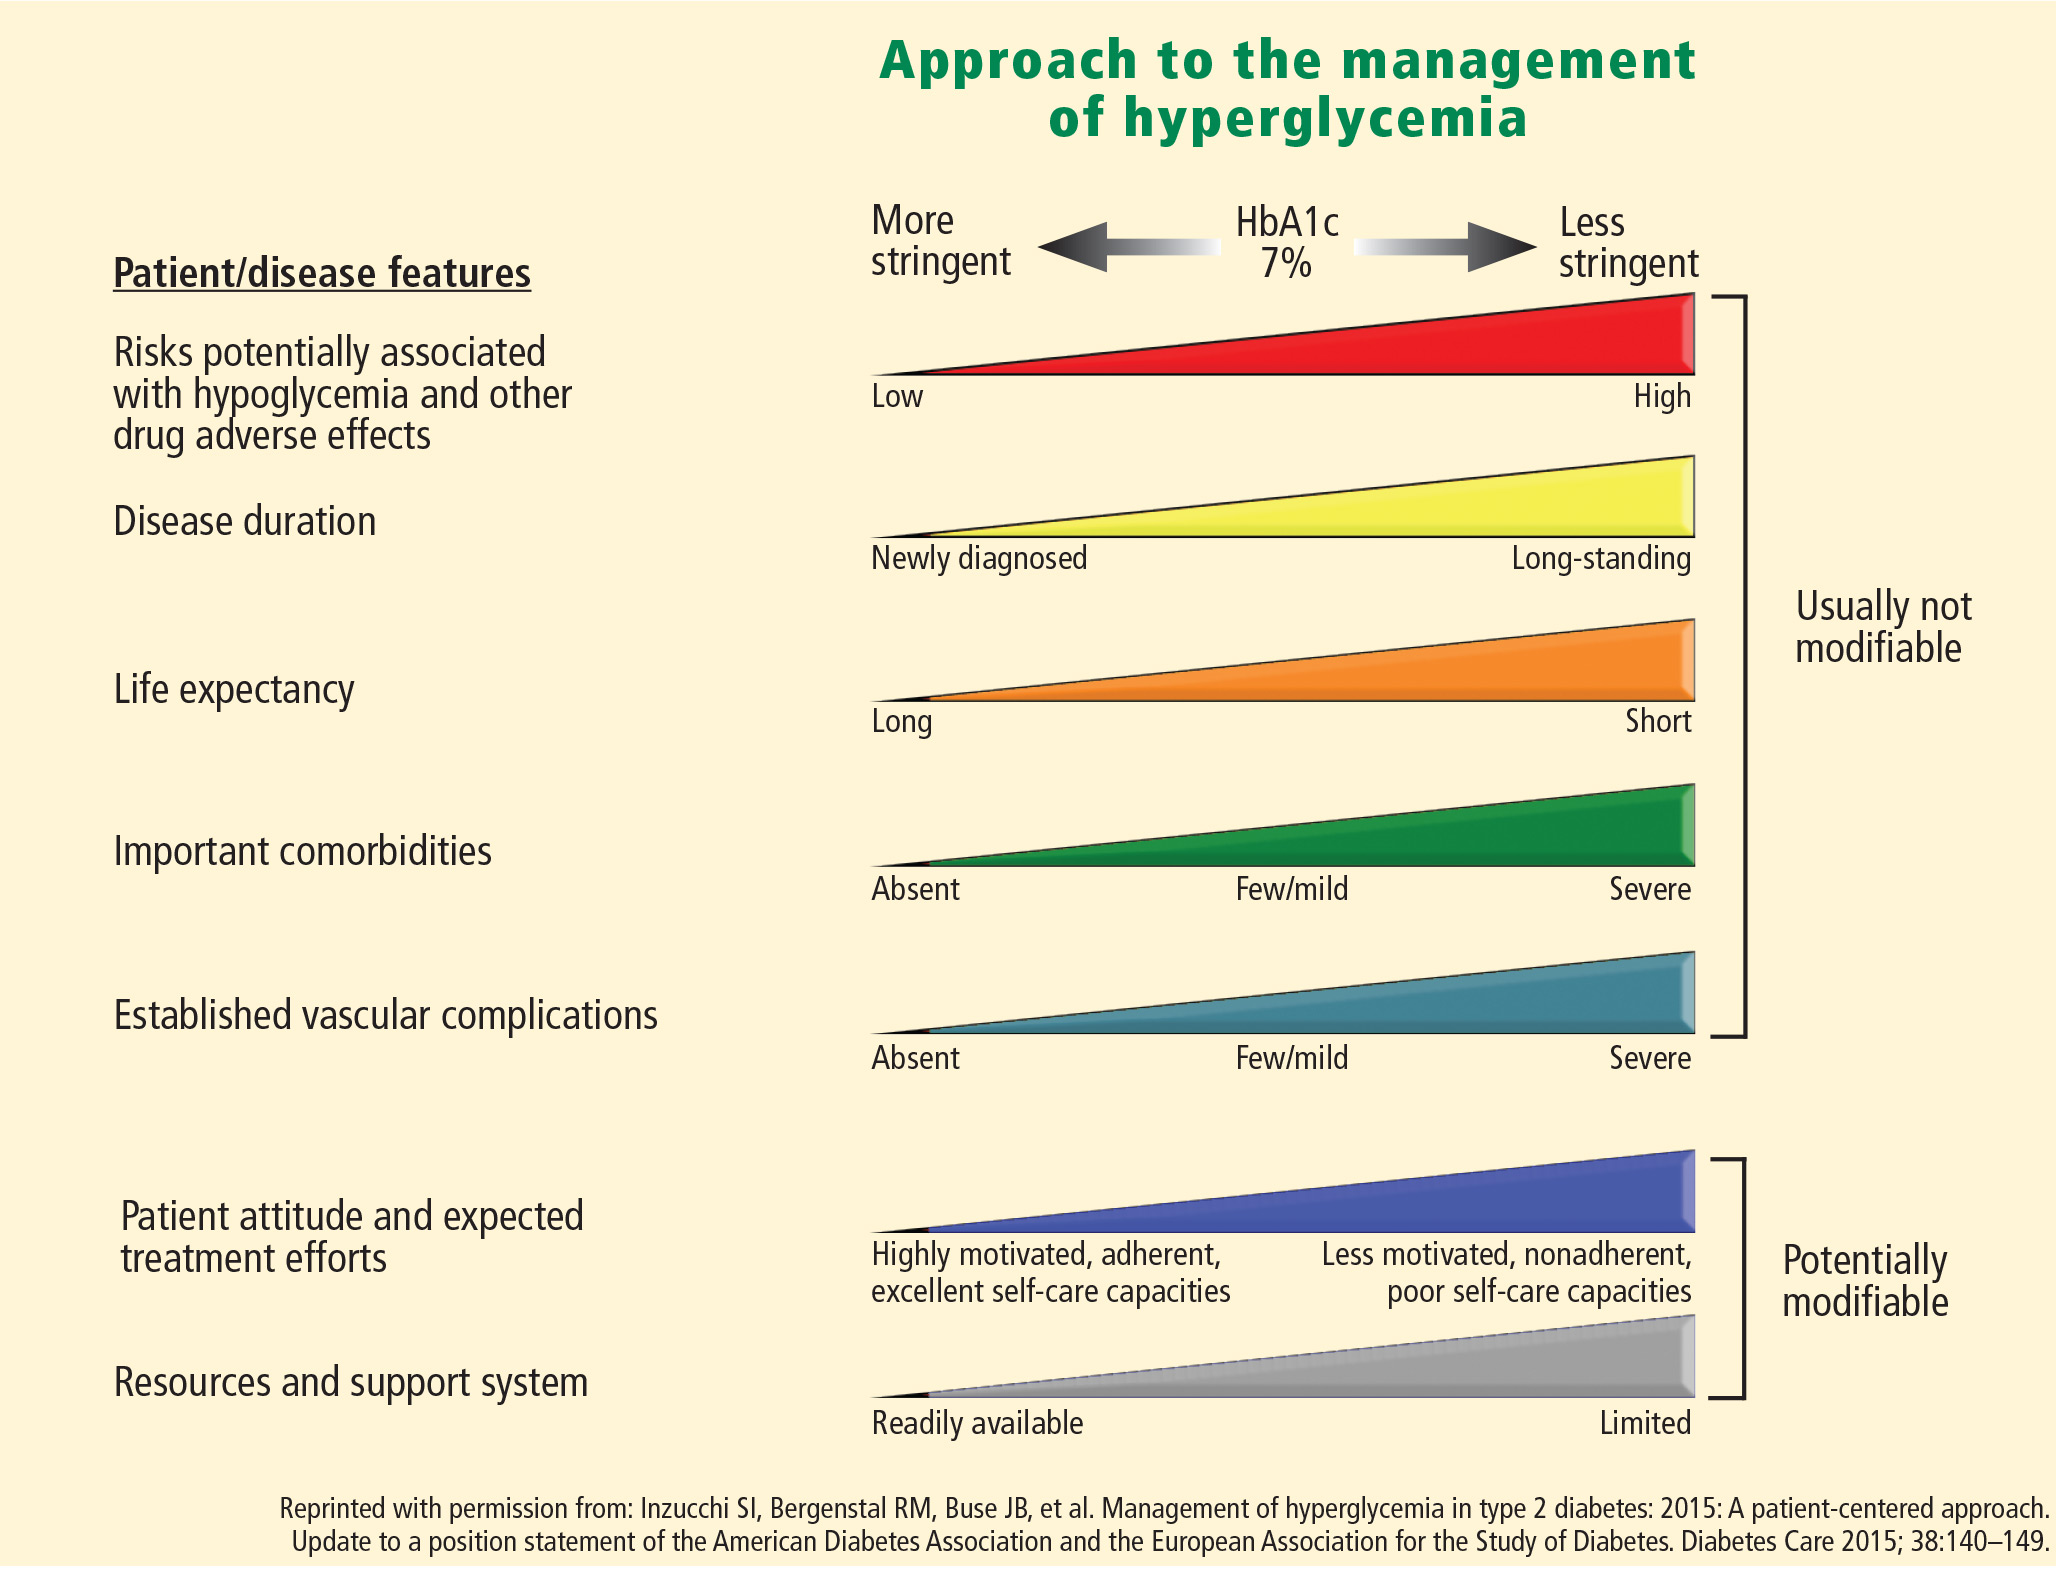
Goal HbA1c levels in patients with diabetes should be patient-tailored, as outlined in Figure 2. For example, stricter control with HbA1c (≤ 6.5%) may be desired in a young, otherwise healthy individual, whereas an HbA1c of 8% may be appropriate in a patient with multiple comorbidities.26
HbA1c AND CARDIOVASCULAR RISK
HbA1c has been established as a strong predictor of CV events and mortality in patients with diabetes despite the absence of firm evidence that glycemic control modifies this risk substantially over time.27 Results from the UKPDS and DCCT trials lend strong support to the hypothesis that glycemic control early in the course of disease provides preventive benefit.3–5 In contrast, three major trials that enrolled older patients at higher baseline risk showed no mortality or CV benefit of tighter glycemic control.28–30 One of these, the Action to Control Cardiovascular Risk in Diabetes trial,28 found increased mortality risk in the intensive glycemic-control arm among those who did not achieve the HbA1c target, illustrating the complexity of interpreting HbA1c in clinical practice.
While HbA1c may predict the risk of mortality and CV events in diabetes populations, it is unlikely to be a strong predictor in patients without established diabetes. Analysis of data from the Emerging Risk Factors Collaboration indicates that below the HbA1c diagnostic threshold of diabetes (< 6.5%), HbA1c is less predictive than stronger risk factors such as lipids.31 In this retrospective analysis, which included a cohort of more than 200,000 individuals without diabetes, the risk model to predict CV events was not enhanced significantly by the addition of HbA1c information.
MISREPRESENTING THE GLYCEMIC ‘BIG PICTURE’
Aside from the previously discussed medical conditions that may affect HbA1c accuracy, other factors may complicate HbA1c interpretation. Recent studies raised concern about the generalizability of HbA1c across racial and ethnic groups. A 2010 study of non-Hispanic black and white participants without diabetes revealed that black participants had higher HbA1c levels across the glycemic continuum.32 In the past, concern was raised that these HbA1c elevations were related simply to poorer glycemic management and healthcare disparities. However, a study using data from the Diabetes Prevention Program compared HbA1c in five racial and ethnic groups and found that racial and ethnic minorities had higher HbA1c levels after adjusting for demographics, socioeconomics, and anthropometrics.33 This suggests that racial-genetic differences in RBC survival or glycation of hemoglobin may affect HbA1c. These studies did not assess for the presence of hemoglobinopathies despite higher prevalence in certain ethnic groups.
One critique of the HbA1c assay is that HbA1c does not reflect glycemic variability. A 2007 study analyzing DCCT data found that participants with similar HbA1c levels had dissimilar mean plasma glucose (MPG) levels and glucose variability (standard deviation of MPG).34 The authors provided an example of two patients with identical HbA1c and MPG but disparate glucose variability. The patient with higher glucose variability had a 35% to 45% excess risk of hypoglycemia. Failure of HbA1c to clearly define those at risk for frequent hypoglycemic events is problematic, since hypoglycemia is an identified risk factor for CV disease and morbidity.35,36 Of perhaps greatest concern is that an elevated HbA1c may be a common presentation of variability in the elderly. One study showed that more than 60% of elderly patients taking insulin with an average HbA1c above 8% had several hypoglycemic events per week, and based on elevated HbA1c, they may be advised to increase insulin dosing.37
Glucose variability itself, including wide postprandial excursions, may be a risk factor for CV disease. The recent FLAT-SUGAR trial used HbA1c and continuous glucose monitoring to assess glycemic control and CV risk markers in participants on basal-bolus insulin therapy plus metformin versus subjects on basal insulin, metformin, and a GLP-1 agonist intended to reduce postprandial glucose excursions.38 Although groups achieved similar target HbA1c levels, the intervention group had fewer glycemic excursions as well as reductions in some CV risk markers.
Alternatives to HbA1c are available for monitoring glycemic control. The monosaccharide 1,5-anhydroglucitol, a short-term marker of glycemia, competes with glucose for reabsorption in the kidney. In patients with normal renal function, low serum levels represent short-term hyperglycemia. Fructosamine and glycated albumin, formed by the glycation of proteins, reflect glycemia over the 2- to 4-week protein half-life.39 Fructosamine measurement is confounded by the presence of low molecular weight substances such as bilirubin and uric acid; therefore, it may not be useful in medically complex patients. Glycated albumin is not affected by these substances; it may also be useful in patients in whom variations in RBC survival make HbA1c unreliable.11,40 Despite the growing body of research about their usefulness, these tests lack the stringent standardization of HbA1c and have not been vetted for use in large clinical trials. Thus, their use in routine clinical practice remains controversial.
CONCLUSION
The focus on HbA1c during the last 40 years has resulted in enhanced test accuracy, availability, and use among patients and providers in the care of diabetes. Because HbA1c has become the standard in how population-based studies evaluate the effects of glycemic control on disease progression and complications, it serves as the basis for guidelines that address diabetes and CV risk definition and management. Although HbA1c may seem familiar, there is much not known about test interpretation and how it may actually miss the mark. As HbA1c use continues, these concerns need to be clarified to optimize the screening, diagnosis, and care of patients with diabetes and CV disease.
- Little RR, Rohlfing CL. The long and winding road to optimal HbA1c measurement. Clin Chim Acta 2013; 418:63–71.
- Koenig RJ, Peterson CM, Jones RL, Saudek C, Lehrman M, Cerami A. Correlation of glucose regulation and hemoglobin A1c in diabetes mellitus. N Engl J Med 1976; 295:417–420.
- The Diabetes Control and Complications Trial Research Group. The effect of intensive treatment of diabetes on the development and progression of long-term complications in insulin-dependent diabetes mellitus. N Engl J Med 1993; 329:977–986.
- Nathan DM, Cleary PA, Backlund JY; Diabetes Control and Complications Trial/Epidemiology of Diabetes Interventions and Complications (DCCT/EDIC) Study Research Group. Intensive diabetes treatment and cardiovascular disease in patients with type 1 diabetes. N Engl J Med 2005; 353:2643–2653.
- UK Prospective Diabetes Study (UKPDS) Group. Intensive blood-glucose control with sulphonylureas or insulin compared with conventional treatment and risk of complications in patients with type 2 diabetes (UKPDS 33). Lancet 1998; 352:837–853.
- National Glycohemoglobin Standardization Program. About the NGSP: background. NGSP website. http://www.ngsp.org/bground.asp. Published 2010. Accessed March 15, 2016.
- Little RR, Rohlfing CL, Sacks DB; National Glycohemoglobin Standardization Program (NGSP) Steering Committee. Status of hemoglobin A1c measurement and goals for improvement: from chaos to order for improving diabetes care. Clin Chem 2011; 57:205–214.
- Cox ME, Edelman D. Tests for screening and diagnosis of type 2 diabetes. Clinical Diabetes 2009; 27:132–138.
- American Diabetes Association. Tests of glycemia in diabetes. Diabetes Care 2004; 27(suppl 1):S91–S93.
- Rohlfing CL, Wiedmeyer HM, Little RR, England JD, Tennill A, Goldstein DE. Defining the relationship between plasma glucose and HbA(1c): analysis of glucose profiles and HbA(1c) in the Diabetes Control and Complications Trial. Diabetes Care 2002; 25:275–278.
- Koga M. Glycated albumin: clinical usefulness. Clin Chim Acta 2014; 433:96–104.
- International Expert Committee. International Expert Committee report on the role of the A1c assay in the diagnosis of diabetes. Diabetes Care 2009; 32:1327–1334.
- World Health Organization. Use of glycated haemoglobin (HbA1c) in the diagnosis of diabetes mellitus. Abbreviated report of a WHO consultation. World Health Organization website. http://www.who.int/diabetes/publications/report-hba1c_2011.pdf. Published 2011. Accessed March 15, 2016.
- Nathan DM, Kuenen J, Borg R, Zheng H, Schoenfeld D, Heine RJ; A1c-Derived Average Glucose Study Group. Translating the A1c assay into estimated average glucose values. Diabetes Care 2008; 31:1473–1478.
- World Health Organization. Definition and diagnosis of diabetes mellitus and intermediate hyperglycemia: report of a WHO/IDF consultation. World Health Organization website. http://apps.who.int/iris/bitstream/10665/43588/1/9241594934_eng.pdf. Published 2006. Accessed March 15, 2016.
- American Diabetes Association. Classification and diagnosis of diabetes. Sec 2. In: Standards of Medical Care in Diabetes—2015. Diabetes Care 2015; 38(suppl 1):S8–S16.
- The Expert Committee on the Diagnosis and Classification of Diabetes Mellitus. Report of the Expert Committee on the diagnosis and classification of diabetes mellitus. Diabetes Care 1997; 20:1183–1197.
- Buell C, Kermah D, Davidson MB. Utility of A1c for diabetes screening in the 1999-2004 NHANES population. Diabetes Care 2007; 30:2233–2235.
- Bennett CM, Guo M, Dharmage SC. HbA(1c) as a screening tool for detection of type 2 diabetes: a systematic review. Diabet Med 2007; 24:333–343.
- Rohlfing CL, Little RR, Wiedmeyer HM, et al. Use of GHb (HbA1c) in screening for undiagnosed diabetes in the U.S. population. Diabetes Care 2000; 23:187–191.
- Colagiuri S, Lee CM, Wong TY; DETECT-2 Collaboration Writing Group. Glycemic thresholds for diabetes-specific retinopathy: implications for diagnostic criteria for diabetes. Diabetes Care 2011; 34:145–150.
- Zhang X, Gregg EW, Williamson DF, et al. A1c level and future risk of diabetes: a systematic review. Diabetes Care 2010; 33:1665–1673.
- Ackermann RT, Cheng YJ, Williamson DF, Gregg EW. Identifying adults at high risk for diabetes and cardiovascular disease using hemoglobin A1c National Health and Nutrition Examination Survey 2005-2006. Am J Prev Med 2011; 40:11–17.
- Knowler WC, Barrett-Connor E, Fowler SE; Diabetes Prevention Program Research Group. Reduction in the incidence of type 2 diabetes with lifestyle intervention or metformin. N Engl J Med 2002; 346:393–403.
- Kennedy L, Herman WH, Strange P, Harris A; GOAL A1C Team. Impact of active versus usual algorithmic titration of basal insulin and point-of-care versus laboratory measurement of HbA1c on glycemic control in patients with type 2 diabetes: the Glycemic Optimization with Algorithms and Labs at Point of Care (GOAL A1c) trial. Diabetes Care 2006; 29:1–8.
- Inzucchi SE, Bergenstal RM, Buse JB, et al. Management of hyperglycemia in type 2 diabetes, 2015: a patient-centered approach: update to a position statement of the American Diabetes Association and the European Association for the Study of Diabetes. Diabetes Care 2015; 38:140–149.
- Khaw KT. Elevated HbA1c level: a risk factor for cardiovascular disease mortality in patients with chronic heart failure? Nat Clin Pract Endocrinol Metab 2009; 5:130–131.
- Action to Control Cardiovascular Risk in Diabetes Study Group; Gerstein HC, Miller ME, Byington RP, et al. Effects of intensive glucose lowering in type 2 diabetes. N Engl J Med 2008; 358:2545–2559.
- ADVANCE Collaborative Group; Patel A, MacMahon S, Chalmers J, et al. Intensive blood glucose control and vascular outcomes in patients with type 2 diabetes. N Engl J Med 2008; 358:2560–5572.
- Duckworth W, Abraira C, Moritz T, et al; VADT Investigators. Glucose control and vascular complications in veterans with type 2 diabetes. N Engl J Med 2009; 360:129–139.
- Emerging Risk Factors Collaboration; Di Angelantonio E, Gao P, Kahn H, et al. Glycated hemoglobin measurement and prediction of cardiovascular disease. JAMA 2014; 311:1225–1233.
- Ziemer DC, Kolm P, Weintraub WS, et al. Glucose-independent, black-white differences in hemoglobin A1c levels: a cross-sectional analysis of 2 studies. Ann Intern Med 2010; 152:770–777.
- Herman WH, Ma Y, Uwaifo G, et al; Diabetes Prevention Program Research Group. Differences in A1c by race and ethnicity among patients with impaired glucose tolerance in the Diabetes Prevention Program. Diabetes Care 2007; 30:2543–2457.
- Kilpatrick ES, Rigby AS, Good K, Atkin SL. Relating mean blood glucose and glucose variability to the risk of multiple episodes of hypoglycaemia in type 1 diabetes. Diabetologia 2007; 50:2553–2561.
- Khunti K, Davies M, Majeed A, Thorsted BL, Wolden ML, Paul SK. Hypoglycemia and risk of cardiovascular disease and all-cause mortality in insulin-treated people with type 1 and type 2 diabetes: a cohort study. Diabetes Care 2015; 38:316–322.
- Krinsley JS, Schultz MJ, Sprong PE, et al. Mild hypoglycemia is independently associated with increased mortality in the critically ill. Crit Care 2011; 15:R173.
- Munshi MN, Segal AR, Suhl E, et al. Frequent hypoglycemia among elderly patients with poor glycemic control. Arch Intern Med 2011; 171:362–364.
- Hirsch IB, Probstfield JL, Davis BR, et al. Glucose variability in type 2 diabetes: the initial results of the FLAT-SUGAR trial. Diabetes 2015; 64(suppl 1): A100. Abstract 385-OR.
- Kim KJ, Lee BW. The roles of glycated albumin as intermediate glycation index and pathogenic protein. Diabetes Metab J 2012; 36:98–107.
- Klonoff DC. Serum fructosamine as a screening test for type 2 diabetes. Diabetes Technol Ther 2000; 2:537–539.
Since its widespread introduction into routine clinical practice nearly 2 decades ago, hemoglobin A1c (HbA1c) measurement has become an integral tool for the diagnosis and management of diabetes mellitus. It is frequently used in both the care of individuals and in landmark population-based clinical trials. It also serves as a surrogate marker of glycemic control and is a key risk indicator for diabetes-associated microvascular and macrovascular complications and mortality.
With so much importance placed on one laboratory value, it is imperative to remember that the test is imperfect, with pitfalls both in accuracy and interpretation. The purpose of this review is to provide a broad understanding of HbA1c and how it can be optimally applied to patient management and the assessment of diabetes and cardiovascular (CV) risk.
HbA1c TESTING, BACKGROUND
HbA1c was first discovered in 1955, but elevated HbA1c levels in diabetes patients were not noted until 1968.1 Another 8 years passed before HbA1c was correlated with blood glucose values in hospitalized patients with diabetes and was proposed for monitoring glycemia.2
Biochemically, HbA1c forms through a nonenzymatic reaction in which glucose attaches to the valine amino terminal of one or both beta chains of hemoglobin A. This compound can be separated out from nonglycated hemoglobin and from other glycated hemoglobin molecules through various methods, such as high performance liquid chromatography or immunoassay.3
During the first few years of clinical use, HbA1c measures were inconsistent. The publication of the Diabetes Control and Complications Trial (DCCT) in 19933 made the importance of precise HbA1c measurement apparent. This study found that the approximate 2% difference in HbA1c between standard- and intensive-insulin therapy groups resulted in dramatically reduced risk of microvascular disease in patients with type 1 diabetes. The continuation of the DCCT, the Epidemiology of Diabetes Interventions and Complications trial,4 and a study of patients with type 2 diabetes, the United Kingdom Prospective Diabetes Study (UKPDS),5 further supported the relationship between sustaining a lower average HbA1c over time and improved patient outcomes, including CV events and mortality. Given the implications of small changes in HbA1c on morbidity, the need to reduce error margins in measurement became apparent.
The NGSP (formerly the National Glycohemoglobin Standardization Program) was founded in 1996 to regulate HbA1c measurements to DCCT standards.6 This program, now international in scope through involvement with the International Federation of Clinical Chemistry and Laboratory Medicine (IFCC), calibrates HbA1c measurements by outside laboratories and manufacturers to reference standards. Laboratories and manufacturers that measure HbA1c certify through IFCC/NGSP and participate in yearly surveys to ensure inter-laboratory reproducibility. Through this successful program, standardization and accuracy of HbA1c measurements greatly improved from 1993 to 2012 (Figure 1).1,6,7 Largely owing to this fact, HbA1c was approved as a diagnostic tool by the American Diabetes Association (ADA) in 2009;8 the test has become a key measure for diagnosing, screening, and monitoring diabetes.
The HbA1c level is affected by the blood glucose concentration, the duration of red blood cell (RBC) exposure to varying concentrations, and RBC quantity. HbA1c most accurately reflects the previous 2 to 3 months of glycemic control in the setting of the usual RBC life span of 120 days.9 As a relatively long-term indicator of glycemic control, it may not accurately represent acute improvements or deteriorations in glycemia. Recent factors affecting glycemia must be considered, as HbA1c represents a weighted average glucose with 50% contribution from the preceding month.10
HbA1c must be interpreted with caution. In nonpregnant adults, HbA1c is often falsely low in conditions that reduce the number of glycosylated RBCs, such as hemolysis, splenomegaly, chronic kidney disease, cirrhosis, hemorrhage, blood transfusions, use of erythropoiesis-stimulating agents, and certain hemoglobinopathies (ie, HbS, HbC, HbF). Alternately, HbA1c is elevated in other hemoglobinopathies and in conditions that result in decreased RBC turnover such as iron or vitamin B12-deficiency anemia.11–13
The 2008 A1c-Derived Average Glucose study group (507 participants from 10 international centers) used linear regression analysis to correlate HbA1c drawn every 3 months with average blood glucose readings taken during those 3 months. Results from participants without diabetes were compared with patients with type 1 or type 2 diabetes.14 The resulting significant correlation between HbA1c and average blood glucose readings (coefficient of determination 0.84, P <.0001) became the standard for estimating glycemia from HbA1c (Table 1).
DIAGNOSIS, SCREENING FOR DIABETES
HbA1c was accepted by the ADA as a diagnostic test for diabetes in 20094 and the World Health Organization (WHO) in 2011,13 although the WHO recommended alternate methods for diagnosis given concerns about test availability, cost, and accuracy in the developing world.15
Advantages to HbA1c use in diagnosis include standardization of measurement, convenience as a single blood-draw that does not require fasting, minimal day-to-day variability, and preanalytic sample stability. Although point-of-care testing for HbA1c is widely available, it is not recommended for diagnostic use because these assays are generally not IFCC/NGSP certified and do not undergo the same proficiency testing as laboratory samples.12,16
The 1997 Expert Committee on the Diagnosis and Classification of Diabetes Mellitus17 encouraged that diagnosis be based on the glycemic level at which microvascular complications develop. Using fasting plasma glucose (FPG), 2-hour postprandial plasma glucose, and funduscopic data from several large epidemiologic studies, the committee established that increased risk of diabetic retinopathy occurs at FPG levels greater than or equal to 126 mg/dL (7.0 mmol/L). Subsequent studies analyzed sensitivity and specificity correlations between FPG levels above 126 mg/dL and HbA1c in an effort to define cutoffs for HbA1c as a diagnostic tool; however, their results lacked clear clinical relevance.18–20
In 2003, the DETECT-2 trial analyzed HbA1c levels in more than 28,000 participants to determine HbA1c diagnostic definitions based on microvascular complications.21 Evaluating HbA1c in 0.5% increments, investigators found that the incidence of diabetic retinopathy rose above baseline at HbA1c of 6.5%, the now accepted diagnostic value. It is important to note that this cutoff makes HbA1c less sensitive than other diagnostic indicators, which if applied to the same number of individuals, would result in up to one-third more patients diagnosed with diabetes. However, the lower sensitivity is balanced by higher screening rates given HbA1c accessibility.16
Diabetes can be diagnosed according to the criteria in Table 2, using venous plasma samples for HbA1c and glucose measurements. FPG assessment, both alone and as part of a 2-hour oral glucose tolerance test (OGTT), requires a minimum 8-hour fast. Although it is more cumbersome for both patients and practitioners, the 2-hour OGTT remains the technical standard diagnostic test for diabetes. It can formally identify patients with impaired fasting glucose and impaired glucose tolerance, which are markers of impaired beta cell function and future progression to frank diabetes mellitus.
In the presence of clear symptoms of hyperglycemia such as blurry vision, polyuria, polydipsia, weight loss, and a random plasma glucose value ≥ 200 mg/dL (11.1 mmol/L), a single laboratory measurement fitting any of the three diagnostic criteria confirms the diagnosis of diabetes. In the absence of these symptoms, one positive test must be repeated and remain positive in order to confirm diabetes. As an alternative to repeating the original diagnostic test, two of the three criteria may be positive at any one time to make the diagnosis.13,16
Routine screening for diabetes using HbA1c should be based on risk in the absence of symptoms (Table 3). The ADA recommends screening at 3-year intervals if an initial screen is within normal limits or yearly in individuals with prediabetes or a change in risk status.16 Screening also is recommended for patients on medications that increase the risk of hyperglycemia (eg, glucocorticoids, thiazides, and atypical antipsychotics).
Individuals with prediabetes are identified as having impaired fasting glucose and impaired glucose tolerance based on 2-hour OGTT, FPG, or HbA1c (Table 4). Those with HbA1c values 6.00% to 6.49% are considered by the ADA and WHO to have the highest risk of developing diabetes.13,15,16 This range is based primarily on a 2010 systematic review22 evaluating the relationship between HbA1c and progression to diabetes in studies involving more than 44,000 participants. Patients with HbA1c of 6.0% or above had a 5-year risk of progression to diabetes between 25% and 50%, 20 times higher than those with HbA1c less than 5%.22 The ADA-defined lower limit for diagnosing prediabetes (HbA1c ≥ 5.7%) is based on a 2011 analysis of National Health and Nutrition Examination Survey data.23 In that study, adults with HbA1c levels at or above 5.7% were at similar risk of developing frank type 2 diabetes and CV disease (41.3% over 7.5 years and 13.3% over 10 years, respectively) as the 3,234 participants in the Diabetes Prevention Program, a prospective, population-based study evaluating the risk of incident diabetes.23,24
MONITORING PATIENTS WITH DIABETES
HbA1c should be performed every 3 months in patients with known diabetes and can be spaced to twice yearly in patients meeting treatment goals on stable therapy.
While not recommended for diagnosis, point-of-care testing of HbA1c has been endorsed by the ADA for monitoring patients with diabetes. Studies have shown that a higher percentage of patients achieve HbA1c targets with treatment adjustment based on point-of-care testing of HbA1c at the time of visit vs usual laboratory monitoring.16,25
Goal HbA1c levels in patients with diabetes should be patient-tailored, as outlined in Figure 2. For example, stricter control with HbA1c (≤ 6.5%) may be desired in a young, otherwise healthy individual, whereas an HbA1c of 8% may be appropriate in a patient with multiple comorbidities.26
HbA1c AND CARDIOVASCULAR RISK
HbA1c has been established as a strong predictor of CV events and mortality in patients with diabetes despite the absence of firm evidence that glycemic control modifies this risk substantially over time.27 Results from the UKPDS and DCCT trials lend strong support to the hypothesis that glycemic control early in the course of disease provides preventive benefit.3–5 In contrast, three major trials that enrolled older patients at higher baseline risk showed no mortality or CV benefit of tighter glycemic control.28–30 One of these, the Action to Control Cardiovascular Risk in Diabetes trial,28 found increased mortality risk in the intensive glycemic-control arm among those who did not achieve the HbA1c target, illustrating the complexity of interpreting HbA1c in clinical practice.
While HbA1c may predict the risk of mortality and CV events in diabetes populations, it is unlikely to be a strong predictor in patients without established diabetes. Analysis of data from the Emerging Risk Factors Collaboration indicates that below the HbA1c diagnostic threshold of diabetes (< 6.5%), HbA1c is less predictive than stronger risk factors such as lipids.31 In this retrospective analysis, which included a cohort of more than 200,000 individuals without diabetes, the risk model to predict CV events was not enhanced significantly by the addition of HbA1c information.
MISREPRESENTING THE GLYCEMIC ‘BIG PICTURE’
Aside from the previously discussed medical conditions that may affect HbA1c accuracy, other factors may complicate HbA1c interpretation. Recent studies raised concern about the generalizability of HbA1c across racial and ethnic groups. A 2010 study of non-Hispanic black and white participants without diabetes revealed that black participants had higher HbA1c levels across the glycemic continuum.32 In the past, concern was raised that these HbA1c elevations were related simply to poorer glycemic management and healthcare disparities. However, a study using data from the Diabetes Prevention Program compared HbA1c in five racial and ethnic groups and found that racial and ethnic minorities had higher HbA1c levels after adjusting for demographics, socioeconomics, and anthropometrics.33 This suggests that racial-genetic differences in RBC survival or glycation of hemoglobin may affect HbA1c. These studies did not assess for the presence of hemoglobinopathies despite higher prevalence in certain ethnic groups.
One critique of the HbA1c assay is that HbA1c does not reflect glycemic variability. A 2007 study analyzing DCCT data found that participants with similar HbA1c levels had dissimilar mean plasma glucose (MPG) levels and glucose variability (standard deviation of MPG).34 The authors provided an example of two patients with identical HbA1c and MPG but disparate glucose variability. The patient with higher glucose variability had a 35% to 45% excess risk of hypoglycemia. Failure of HbA1c to clearly define those at risk for frequent hypoglycemic events is problematic, since hypoglycemia is an identified risk factor for CV disease and morbidity.35,36 Of perhaps greatest concern is that an elevated HbA1c may be a common presentation of variability in the elderly. One study showed that more than 60% of elderly patients taking insulin with an average HbA1c above 8% had several hypoglycemic events per week, and based on elevated HbA1c, they may be advised to increase insulin dosing.37
Glucose variability itself, including wide postprandial excursions, may be a risk factor for CV disease. The recent FLAT-SUGAR trial used HbA1c and continuous glucose monitoring to assess glycemic control and CV risk markers in participants on basal-bolus insulin therapy plus metformin versus subjects on basal insulin, metformin, and a GLP-1 agonist intended to reduce postprandial glucose excursions.38 Although groups achieved similar target HbA1c levels, the intervention group had fewer glycemic excursions as well as reductions in some CV risk markers.
Alternatives to HbA1c are available for monitoring glycemic control. The monosaccharide 1,5-anhydroglucitol, a short-term marker of glycemia, competes with glucose for reabsorption in the kidney. In patients with normal renal function, low serum levels represent short-term hyperglycemia. Fructosamine and glycated albumin, formed by the glycation of proteins, reflect glycemia over the 2- to 4-week protein half-life.39 Fructosamine measurement is confounded by the presence of low molecular weight substances such as bilirubin and uric acid; therefore, it may not be useful in medically complex patients. Glycated albumin is not affected by these substances; it may also be useful in patients in whom variations in RBC survival make HbA1c unreliable.11,40 Despite the growing body of research about their usefulness, these tests lack the stringent standardization of HbA1c and have not been vetted for use in large clinical trials. Thus, their use in routine clinical practice remains controversial.
CONCLUSION
The focus on HbA1c during the last 40 years has resulted in enhanced test accuracy, availability, and use among patients and providers in the care of diabetes. Because HbA1c has become the standard in how population-based studies evaluate the effects of glycemic control on disease progression and complications, it serves as the basis for guidelines that address diabetes and CV risk definition and management. Although HbA1c may seem familiar, there is much not known about test interpretation and how it may actually miss the mark. As HbA1c use continues, these concerns need to be clarified to optimize the screening, diagnosis, and care of patients with diabetes and CV disease.
Since its widespread introduction into routine clinical practice nearly 2 decades ago, hemoglobin A1c (HbA1c) measurement has become an integral tool for the diagnosis and management of diabetes mellitus. It is frequently used in both the care of individuals and in landmark population-based clinical trials. It also serves as a surrogate marker of glycemic control and is a key risk indicator for diabetes-associated microvascular and macrovascular complications and mortality.
With so much importance placed on one laboratory value, it is imperative to remember that the test is imperfect, with pitfalls both in accuracy and interpretation. The purpose of this review is to provide a broad understanding of HbA1c and how it can be optimally applied to patient management and the assessment of diabetes and cardiovascular (CV) risk.
HbA1c TESTING, BACKGROUND
HbA1c was first discovered in 1955, but elevated HbA1c levels in diabetes patients were not noted until 1968.1 Another 8 years passed before HbA1c was correlated with blood glucose values in hospitalized patients with diabetes and was proposed for monitoring glycemia.2
Biochemically, HbA1c forms through a nonenzymatic reaction in which glucose attaches to the valine amino terminal of one or both beta chains of hemoglobin A. This compound can be separated out from nonglycated hemoglobin and from other glycated hemoglobin molecules through various methods, such as high performance liquid chromatography or immunoassay.3
During the first few years of clinical use, HbA1c measures were inconsistent. The publication of the Diabetes Control and Complications Trial (DCCT) in 19933 made the importance of precise HbA1c measurement apparent. This study found that the approximate 2% difference in HbA1c between standard- and intensive-insulin therapy groups resulted in dramatically reduced risk of microvascular disease in patients with type 1 diabetes. The continuation of the DCCT, the Epidemiology of Diabetes Interventions and Complications trial,4 and a study of patients with type 2 diabetes, the United Kingdom Prospective Diabetes Study (UKPDS),5 further supported the relationship between sustaining a lower average HbA1c over time and improved patient outcomes, including CV events and mortality. Given the implications of small changes in HbA1c on morbidity, the need to reduce error margins in measurement became apparent.
The NGSP (formerly the National Glycohemoglobin Standardization Program) was founded in 1996 to regulate HbA1c measurements to DCCT standards.6 This program, now international in scope through involvement with the International Federation of Clinical Chemistry and Laboratory Medicine (IFCC), calibrates HbA1c measurements by outside laboratories and manufacturers to reference standards. Laboratories and manufacturers that measure HbA1c certify through IFCC/NGSP and participate in yearly surveys to ensure inter-laboratory reproducibility. Through this successful program, standardization and accuracy of HbA1c measurements greatly improved from 1993 to 2012 (Figure 1).1,6,7 Largely owing to this fact, HbA1c was approved as a diagnostic tool by the American Diabetes Association (ADA) in 2009;8 the test has become a key measure for diagnosing, screening, and monitoring diabetes.
The HbA1c level is affected by the blood glucose concentration, the duration of red blood cell (RBC) exposure to varying concentrations, and RBC quantity. HbA1c most accurately reflects the previous 2 to 3 months of glycemic control in the setting of the usual RBC life span of 120 days.9 As a relatively long-term indicator of glycemic control, it may not accurately represent acute improvements or deteriorations in glycemia. Recent factors affecting glycemia must be considered, as HbA1c represents a weighted average glucose with 50% contribution from the preceding month.10
HbA1c must be interpreted with caution. In nonpregnant adults, HbA1c is often falsely low in conditions that reduce the number of glycosylated RBCs, such as hemolysis, splenomegaly, chronic kidney disease, cirrhosis, hemorrhage, blood transfusions, use of erythropoiesis-stimulating agents, and certain hemoglobinopathies (ie, HbS, HbC, HbF). Alternately, HbA1c is elevated in other hemoglobinopathies and in conditions that result in decreased RBC turnover such as iron or vitamin B12-deficiency anemia.11–13
The 2008 A1c-Derived Average Glucose study group (507 participants from 10 international centers) used linear regression analysis to correlate HbA1c drawn every 3 months with average blood glucose readings taken during those 3 months. Results from participants without diabetes were compared with patients with type 1 or type 2 diabetes.14 The resulting significant correlation between HbA1c and average blood glucose readings (coefficient of determination 0.84, P <.0001) became the standard for estimating glycemia from HbA1c (Table 1).
DIAGNOSIS, SCREENING FOR DIABETES
HbA1c was accepted by the ADA as a diagnostic test for diabetes in 20094 and the World Health Organization (WHO) in 2011,13 although the WHO recommended alternate methods for diagnosis given concerns about test availability, cost, and accuracy in the developing world.15
Advantages to HbA1c use in diagnosis include standardization of measurement, convenience as a single blood-draw that does not require fasting, minimal day-to-day variability, and preanalytic sample stability. Although point-of-care testing for HbA1c is widely available, it is not recommended for diagnostic use because these assays are generally not IFCC/NGSP certified and do not undergo the same proficiency testing as laboratory samples.12,16
The 1997 Expert Committee on the Diagnosis and Classification of Diabetes Mellitus17 encouraged that diagnosis be based on the glycemic level at which microvascular complications develop. Using fasting plasma glucose (FPG), 2-hour postprandial plasma glucose, and funduscopic data from several large epidemiologic studies, the committee established that increased risk of diabetic retinopathy occurs at FPG levels greater than or equal to 126 mg/dL (7.0 mmol/L). Subsequent studies analyzed sensitivity and specificity correlations between FPG levels above 126 mg/dL and HbA1c in an effort to define cutoffs for HbA1c as a diagnostic tool; however, their results lacked clear clinical relevance.18–20
In 2003, the DETECT-2 trial analyzed HbA1c levels in more than 28,000 participants to determine HbA1c diagnostic definitions based on microvascular complications.21 Evaluating HbA1c in 0.5% increments, investigators found that the incidence of diabetic retinopathy rose above baseline at HbA1c of 6.5%, the now accepted diagnostic value. It is important to note that this cutoff makes HbA1c less sensitive than other diagnostic indicators, which if applied to the same number of individuals, would result in up to one-third more patients diagnosed with diabetes. However, the lower sensitivity is balanced by higher screening rates given HbA1c accessibility.16
Diabetes can be diagnosed according to the criteria in Table 2, using venous plasma samples for HbA1c and glucose measurements. FPG assessment, both alone and as part of a 2-hour oral glucose tolerance test (OGTT), requires a minimum 8-hour fast. Although it is more cumbersome for both patients and practitioners, the 2-hour OGTT remains the technical standard diagnostic test for diabetes. It can formally identify patients with impaired fasting glucose and impaired glucose tolerance, which are markers of impaired beta cell function and future progression to frank diabetes mellitus.
In the presence of clear symptoms of hyperglycemia such as blurry vision, polyuria, polydipsia, weight loss, and a random plasma glucose value ≥ 200 mg/dL (11.1 mmol/L), a single laboratory measurement fitting any of the three diagnostic criteria confirms the diagnosis of diabetes. In the absence of these symptoms, one positive test must be repeated and remain positive in order to confirm diabetes. As an alternative to repeating the original diagnostic test, two of the three criteria may be positive at any one time to make the diagnosis.13,16
Routine screening for diabetes using HbA1c should be based on risk in the absence of symptoms (Table 3). The ADA recommends screening at 3-year intervals if an initial screen is within normal limits or yearly in individuals with prediabetes or a change in risk status.16 Screening also is recommended for patients on medications that increase the risk of hyperglycemia (eg, glucocorticoids, thiazides, and atypical antipsychotics).
Individuals with prediabetes are identified as having impaired fasting glucose and impaired glucose tolerance based on 2-hour OGTT, FPG, or HbA1c (Table 4). Those with HbA1c values 6.00% to 6.49% are considered by the ADA and WHO to have the highest risk of developing diabetes.13,15,16 This range is based primarily on a 2010 systematic review22 evaluating the relationship between HbA1c and progression to diabetes in studies involving more than 44,000 participants. Patients with HbA1c of 6.0% or above had a 5-year risk of progression to diabetes between 25% and 50%, 20 times higher than those with HbA1c less than 5%.22 The ADA-defined lower limit for diagnosing prediabetes (HbA1c ≥ 5.7%) is based on a 2011 analysis of National Health and Nutrition Examination Survey data.23 In that study, adults with HbA1c levels at or above 5.7% were at similar risk of developing frank type 2 diabetes and CV disease (41.3% over 7.5 years and 13.3% over 10 years, respectively) as the 3,234 participants in the Diabetes Prevention Program, a prospective, population-based study evaluating the risk of incident diabetes.23,24
MONITORING PATIENTS WITH DIABETES
HbA1c should be performed every 3 months in patients with known diabetes and can be spaced to twice yearly in patients meeting treatment goals on stable therapy.
While not recommended for diagnosis, point-of-care testing of HbA1c has been endorsed by the ADA for monitoring patients with diabetes. Studies have shown that a higher percentage of patients achieve HbA1c targets with treatment adjustment based on point-of-care testing of HbA1c at the time of visit vs usual laboratory monitoring.16,25
Goal HbA1c levels in patients with diabetes should be patient-tailored, as outlined in Figure 2. For example, stricter control with HbA1c (≤ 6.5%) may be desired in a young, otherwise healthy individual, whereas an HbA1c of 8% may be appropriate in a patient with multiple comorbidities.26
HbA1c AND CARDIOVASCULAR RISK
HbA1c has been established as a strong predictor of CV events and mortality in patients with diabetes despite the absence of firm evidence that glycemic control modifies this risk substantially over time.27 Results from the UKPDS and DCCT trials lend strong support to the hypothesis that glycemic control early in the course of disease provides preventive benefit.3–5 In contrast, three major trials that enrolled older patients at higher baseline risk showed no mortality or CV benefit of tighter glycemic control.28–30 One of these, the Action to Control Cardiovascular Risk in Diabetes trial,28 found increased mortality risk in the intensive glycemic-control arm among those who did not achieve the HbA1c target, illustrating the complexity of interpreting HbA1c in clinical practice.
While HbA1c may predict the risk of mortality and CV events in diabetes populations, it is unlikely to be a strong predictor in patients without established diabetes. Analysis of data from the Emerging Risk Factors Collaboration indicates that below the HbA1c diagnostic threshold of diabetes (< 6.5%), HbA1c is less predictive than stronger risk factors such as lipids.31 In this retrospective analysis, which included a cohort of more than 200,000 individuals without diabetes, the risk model to predict CV events was not enhanced significantly by the addition of HbA1c information.
MISREPRESENTING THE GLYCEMIC ‘BIG PICTURE’
Aside from the previously discussed medical conditions that may affect HbA1c accuracy, other factors may complicate HbA1c interpretation. Recent studies raised concern about the generalizability of HbA1c across racial and ethnic groups. A 2010 study of non-Hispanic black and white participants without diabetes revealed that black participants had higher HbA1c levels across the glycemic continuum.32 In the past, concern was raised that these HbA1c elevations were related simply to poorer glycemic management and healthcare disparities. However, a study using data from the Diabetes Prevention Program compared HbA1c in five racial and ethnic groups and found that racial and ethnic minorities had higher HbA1c levels after adjusting for demographics, socioeconomics, and anthropometrics.33 This suggests that racial-genetic differences in RBC survival or glycation of hemoglobin may affect HbA1c. These studies did not assess for the presence of hemoglobinopathies despite higher prevalence in certain ethnic groups.
One critique of the HbA1c assay is that HbA1c does not reflect glycemic variability. A 2007 study analyzing DCCT data found that participants with similar HbA1c levels had dissimilar mean plasma glucose (MPG) levels and glucose variability (standard deviation of MPG).34 The authors provided an example of two patients with identical HbA1c and MPG but disparate glucose variability. The patient with higher glucose variability had a 35% to 45% excess risk of hypoglycemia. Failure of HbA1c to clearly define those at risk for frequent hypoglycemic events is problematic, since hypoglycemia is an identified risk factor for CV disease and morbidity.35,36 Of perhaps greatest concern is that an elevated HbA1c may be a common presentation of variability in the elderly. One study showed that more than 60% of elderly patients taking insulin with an average HbA1c above 8% had several hypoglycemic events per week, and based on elevated HbA1c, they may be advised to increase insulin dosing.37
Glucose variability itself, including wide postprandial excursions, may be a risk factor for CV disease. The recent FLAT-SUGAR trial used HbA1c and continuous glucose monitoring to assess glycemic control and CV risk markers in participants on basal-bolus insulin therapy plus metformin versus subjects on basal insulin, metformin, and a GLP-1 agonist intended to reduce postprandial glucose excursions.38 Although groups achieved similar target HbA1c levels, the intervention group had fewer glycemic excursions as well as reductions in some CV risk markers.
Alternatives to HbA1c are available for monitoring glycemic control. The monosaccharide 1,5-anhydroglucitol, a short-term marker of glycemia, competes with glucose for reabsorption in the kidney. In patients with normal renal function, low serum levels represent short-term hyperglycemia. Fructosamine and glycated albumin, formed by the glycation of proteins, reflect glycemia over the 2- to 4-week protein half-life.39 Fructosamine measurement is confounded by the presence of low molecular weight substances such as bilirubin and uric acid; therefore, it may not be useful in medically complex patients. Glycated albumin is not affected by these substances; it may also be useful in patients in whom variations in RBC survival make HbA1c unreliable.11,40 Despite the growing body of research about their usefulness, these tests lack the stringent standardization of HbA1c and have not been vetted for use in large clinical trials. Thus, their use in routine clinical practice remains controversial.
CONCLUSION
The focus on HbA1c during the last 40 years has resulted in enhanced test accuracy, availability, and use among patients and providers in the care of diabetes. Because HbA1c has become the standard in how population-based studies evaluate the effects of glycemic control on disease progression and complications, it serves as the basis for guidelines that address diabetes and CV risk definition and management. Although HbA1c may seem familiar, there is much not known about test interpretation and how it may actually miss the mark. As HbA1c use continues, these concerns need to be clarified to optimize the screening, diagnosis, and care of patients with diabetes and CV disease.
- Little RR, Rohlfing CL. The long and winding road to optimal HbA1c measurement. Clin Chim Acta 2013; 418:63–71.
- Koenig RJ, Peterson CM, Jones RL, Saudek C, Lehrman M, Cerami A. Correlation of glucose regulation and hemoglobin A1c in diabetes mellitus. N Engl J Med 1976; 295:417–420.
- The Diabetes Control and Complications Trial Research Group. The effect of intensive treatment of diabetes on the development and progression of long-term complications in insulin-dependent diabetes mellitus. N Engl J Med 1993; 329:977–986.
- Nathan DM, Cleary PA, Backlund JY; Diabetes Control and Complications Trial/Epidemiology of Diabetes Interventions and Complications (DCCT/EDIC) Study Research Group. Intensive diabetes treatment and cardiovascular disease in patients with type 1 diabetes. N Engl J Med 2005; 353:2643–2653.
- UK Prospective Diabetes Study (UKPDS) Group. Intensive blood-glucose control with sulphonylureas or insulin compared with conventional treatment and risk of complications in patients with type 2 diabetes (UKPDS 33). Lancet 1998; 352:837–853.
- National Glycohemoglobin Standardization Program. About the NGSP: background. NGSP website. http://www.ngsp.org/bground.asp. Published 2010. Accessed March 15, 2016.
- Little RR, Rohlfing CL, Sacks DB; National Glycohemoglobin Standardization Program (NGSP) Steering Committee. Status of hemoglobin A1c measurement and goals for improvement: from chaos to order for improving diabetes care. Clin Chem 2011; 57:205–214.
- Cox ME, Edelman D. Tests for screening and diagnosis of type 2 diabetes. Clinical Diabetes 2009; 27:132–138.
- American Diabetes Association. Tests of glycemia in diabetes. Diabetes Care 2004; 27(suppl 1):S91–S93.
- Rohlfing CL, Wiedmeyer HM, Little RR, England JD, Tennill A, Goldstein DE. Defining the relationship between plasma glucose and HbA(1c): analysis of glucose profiles and HbA(1c) in the Diabetes Control and Complications Trial. Diabetes Care 2002; 25:275–278.
- Koga M. Glycated albumin: clinical usefulness. Clin Chim Acta 2014; 433:96–104.
- International Expert Committee. International Expert Committee report on the role of the A1c assay in the diagnosis of diabetes. Diabetes Care 2009; 32:1327–1334.
- World Health Organization. Use of glycated haemoglobin (HbA1c) in the diagnosis of diabetes mellitus. Abbreviated report of a WHO consultation. World Health Organization website. http://www.who.int/diabetes/publications/report-hba1c_2011.pdf. Published 2011. Accessed March 15, 2016.
- Nathan DM, Kuenen J, Borg R, Zheng H, Schoenfeld D, Heine RJ; A1c-Derived Average Glucose Study Group. Translating the A1c assay into estimated average glucose values. Diabetes Care 2008; 31:1473–1478.
- World Health Organization. Definition and diagnosis of diabetes mellitus and intermediate hyperglycemia: report of a WHO/IDF consultation. World Health Organization website. http://apps.who.int/iris/bitstream/10665/43588/1/9241594934_eng.pdf. Published 2006. Accessed March 15, 2016.
- American Diabetes Association. Classification and diagnosis of diabetes. Sec 2. In: Standards of Medical Care in Diabetes—2015. Diabetes Care 2015; 38(suppl 1):S8–S16.
- The Expert Committee on the Diagnosis and Classification of Diabetes Mellitus. Report of the Expert Committee on the diagnosis and classification of diabetes mellitus. Diabetes Care 1997; 20:1183–1197.
- Buell C, Kermah D, Davidson MB. Utility of A1c for diabetes screening in the 1999-2004 NHANES population. Diabetes Care 2007; 30:2233–2235.
- Bennett CM, Guo M, Dharmage SC. HbA(1c) as a screening tool for detection of type 2 diabetes: a systematic review. Diabet Med 2007; 24:333–343.
- Rohlfing CL, Little RR, Wiedmeyer HM, et al. Use of GHb (HbA1c) in screening for undiagnosed diabetes in the U.S. population. Diabetes Care 2000; 23:187–191.
- Colagiuri S, Lee CM, Wong TY; DETECT-2 Collaboration Writing Group. Glycemic thresholds for diabetes-specific retinopathy: implications for diagnostic criteria for diabetes. Diabetes Care 2011; 34:145–150.
- Zhang X, Gregg EW, Williamson DF, et al. A1c level and future risk of diabetes: a systematic review. Diabetes Care 2010; 33:1665–1673.
- Ackermann RT, Cheng YJ, Williamson DF, Gregg EW. Identifying adults at high risk for diabetes and cardiovascular disease using hemoglobin A1c National Health and Nutrition Examination Survey 2005-2006. Am J Prev Med 2011; 40:11–17.
- Knowler WC, Barrett-Connor E, Fowler SE; Diabetes Prevention Program Research Group. Reduction in the incidence of type 2 diabetes with lifestyle intervention or metformin. N Engl J Med 2002; 346:393–403.
- Kennedy L, Herman WH, Strange P, Harris A; GOAL A1C Team. Impact of active versus usual algorithmic titration of basal insulin and point-of-care versus laboratory measurement of HbA1c on glycemic control in patients with type 2 diabetes: the Glycemic Optimization with Algorithms and Labs at Point of Care (GOAL A1c) trial. Diabetes Care 2006; 29:1–8.
- Inzucchi SE, Bergenstal RM, Buse JB, et al. Management of hyperglycemia in type 2 diabetes, 2015: a patient-centered approach: update to a position statement of the American Diabetes Association and the European Association for the Study of Diabetes. Diabetes Care 2015; 38:140–149.
- Khaw KT. Elevated HbA1c level: a risk factor for cardiovascular disease mortality in patients with chronic heart failure? Nat Clin Pract Endocrinol Metab 2009; 5:130–131.
- Action to Control Cardiovascular Risk in Diabetes Study Group; Gerstein HC, Miller ME, Byington RP, et al. Effects of intensive glucose lowering in type 2 diabetes. N Engl J Med 2008; 358:2545–2559.
- ADVANCE Collaborative Group; Patel A, MacMahon S, Chalmers J, et al. Intensive blood glucose control and vascular outcomes in patients with type 2 diabetes. N Engl J Med 2008; 358:2560–5572.
- Duckworth W, Abraira C, Moritz T, et al; VADT Investigators. Glucose control and vascular complications in veterans with type 2 diabetes. N Engl J Med 2009; 360:129–139.
- Emerging Risk Factors Collaboration; Di Angelantonio E, Gao P, Kahn H, et al. Glycated hemoglobin measurement and prediction of cardiovascular disease. JAMA 2014; 311:1225–1233.
- Ziemer DC, Kolm P, Weintraub WS, et al. Glucose-independent, black-white differences in hemoglobin A1c levels: a cross-sectional analysis of 2 studies. Ann Intern Med 2010; 152:770–777.
- Herman WH, Ma Y, Uwaifo G, et al; Diabetes Prevention Program Research Group. Differences in A1c by race and ethnicity among patients with impaired glucose tolerance in the Diabetes Prevention Program. Diabetes Care 2007; 30:2543–2457.
- Kilpatrick ES, Rigby AS, Good K, Atkin SL. Relating mean blood glucose and glucose variability to the risk of multiple episodes of hypoglycaemia in type 1 diabetes. Diabetologia 2007; 50:2553–2561.
- Khunti K, Davies M, Majeed A, Thorsted BL, Wolden ML, Paul SK. Hypoglycemia and risk of cardiovascular disease and all-cause mortality in insulin-treated people with type 1 and type 2 diabetes: a cohort study. Diabetes Care 2015; 38:316–322.
- Krinsley JS, Schultz MJ, Sprong PE, et al. Mild hypoglycemia is independently associated with increased mortality in the critically ill. Crit Care 2011; 15:R173.
- Munshi MN, Segal AR, Suhl E, et al. Frequent hypoglycemia among elderly patients with poor glycemic control. Arch Intern Med 2011; 171:362–364.
- Hirsch IB, Probstfield JL, Davis BR, et al. Glucose variability in type 2 diabetes: the initial results of the FLAT-SUGAR trial. Diabetes 2015; 64(suppl 1): A100. Abstract 385-OR.
- Kim KJ, Lee BW. The roles of glycated albumin as intermediate glycation index and pathogenic protein. Diabetes Metab J 2012; 36:98–107.
- Klonoff DC. Serum fructosamine as a screening test for type 2 diabetes. Diabetes Technol Ther 2000; 2:537–539.
- Little RR, Rohlfing CL. The long and winding road to optimal HbA1c measurement. Clin Chim Acta 2013; 418:63–71.
- Koenig RJ, Peterson CM, Jones RL, Saudek C, Lehrman M, Cerami A. Correlation of glucose regulation and hemoglobin A1c in diabetes mellitus. N Engl J Med 1976; 295:417–420.
- The Diabetes Control and Complications Trial Research Group. The effect of intensive treatment of diabetes on the development and progression of long-term complications in insulin-dependent diabetes mellitus. N Engl J Med 1993; 329:977–986.
- Nathan DM, Cleary PA, Backlund JY; Diabetes Control and Complications Trial/Epidemiology of Diabetes Interventions and Complications (DCCT/EDIC) Study Research Group. Intensive diabetes treatment and cardiovascular disease in patients with type 1 diabetes. N Engl J Med 2005; 353:2643–2653.
- UK Prospective Diabetes Study (UKPDS) Group. Intensive blood-glucose control with sulphonylureas or insulin compared with conventional treatment and risk of complications in patients with type 2 diabetes (UKPDS 33). Lancet 1998; 352:837–853.
- National Glycohemoglobin Standardization Program. About the NGSP: background. NGSP website. http://www.ngsp.org/bground.asp. Published 2010. Accessed March 15, 2016.
- Little RR, Rohlfing CL, Sacks DB; National Glycohemoglobin Standardization Program (NGSP) Steering Committee. Status of hemoglobin A1c measurement and goals for improvement: from chaos to order for improving diabetes care. Clin Chem 2011; 57:205–214.
- Cox ME, Edelman D. Tests for screening and diagnosis of type 2 diabetes. Clinical Diabetes 2009; 27:132–138.
- American Diabetes Association. Tests of glycemia in diabetes. Diabetes Care 2004; 27(suppl 1):S91–S93.
- Rohlfing CL, Wiedmeyer HM, Little RR, England JD, Tennill A, Goldstein DE. Defining the relationship between plasma glucose and HbA(1c): analysis of glucose profiles and HbA(1c) in the Diabetes Control and Complications Trial. Diabetes Care 2002; 25:275–278.
- Koga M. Glycated albumin: clinical usefulness. Clin Chim Acta 2014; 433:96–104.
- International Expert Committee. International Expert Committee report on the role of the A1c assay in the diagnosis of diabetes. Diabetes Care 2009; 32:1327–1334.
- World Health Organization. Use of glycated haemoglobin (HbA1c) in the diagnosis of diabetes mellitus. Abbreviated report of a WHO consultation. World Health Organization website. http://www.who.int/diabetes/publications/report-hba1c_2011.pdf. Published 2011. Accessed March 15, 2016.
- Nathan DM, Kuenen J, Borg R, Zheng H, Schoenfeld D, Heine RJ; A1c-Derived Average Glucose Study Group. Translating the A1c assay into estimated average glucose values. Diabetes Care 2008; 31:1473–1478.
- World Health Organization. Definition and diagnosis of diabetes mellitus and intermediate hyperglycemia: report of a WHO/IDF consultation. World Health Organization website. http://apps.who.int/iris/bitstream/10665/43588/1/9241594934_eng.pdf. Published 2006. Accessed March 15, 2016.
- American Diabetes Association. Classification and diagnosis of diabetes. Sec 2. In: Standards of Medical Care in Diabetes—2015. Diabetes Care 2015; 38(suppl 1):S8–S16.
- The Expert Committee on the Diagnosis and Classification of Diabetes Mellitus. Report of the Expert Committee on the diagnosis and classification of diabetes mellitus. Diabetes Care 1997; 20:1183–1197.
- Buell C, Kermah D, Davidson MB. Utility of A1c for diabetes screening in the 1999-2004 NHANES population. Diabetes Care 2007; 30:2233–2235.
- Bennett CM, Guo M, Dharmage SC. HbA(1c) as a screening tool for detection of type 2 diabetes: a systematic review. Diabet Med 2007; 24:333–343.
- Rohlfing CL, Little RR, Wiedmeyer HM, et al. Use of GHb (HbA1c) in screening for undiagnosed diabetes in the U.S. population. Diabetes Care 2000; 23:187–191.
- Colagiuri S, Lee CM, Wong TY; DETECT-2 Collaboration Writing Group. Glycemic thresholds for diabetes-specific retinopathy: implications for diagnostic criteria for diabetes. Diabetes Care 2011; 34:145–150.
- Zhang X, Gregg EW, Williamson DF, et al. A1c level and future risk of diabetes: a systematic review. Diabetes Care 2010; 33:1665–1673.
- Ackermann RT, Cheng YJ, Williamson DF, Gregg EW. Identifying adults at high risk for diabetes and cardiovascular disease using hemoglobin A1c National Health and Nutrition Examination Survey 2005-2006. Am J Prev Med 2011; 40:11–17.
- Knowler WC, Barrett-Connor E, Fowler SE; Diabetes Prevention Program Research Group. Reduction in the incidence of type 2 diabetes with lifestyle intervention or metformin. N Engl J Med 2002; 346:393–403.
- Kennedy L, Herman WH, Strange P, Harris A; GOAL A1C Team. Impact of active versus usual algorithmic titration of basal insulin and point-of-care versus laboratory measurement of HbA1c on glycemic control in patients with type 2 diabetes: the Glycemic Optimization with Algorithms and Labs at Point of Care (GOAL A1c) trial. Diabetes Care 2006; 29:1–8.
- Inzucchi SE, Bergenstal RM, Buse JB, et al. Management of hyperglycemia in type 2 diabetes, 2015: a patient-centered approach: update to a position statement of the American Diabetes Association and the European Association for the Study of Diabetes. Diabetes Care 2015; 38:140–149.
- Khaw KT. Elevated HbA1c level: a risk factor for cardiovascular disease mortality in patients with chronic heart failure? Nat Clin Pract Endocrinol Metab 2009; 5:130–131.
- Action to Control Cardiovascular Risk in Diabetes Study Group; Gerstein HC, Miller ME, Byington RP, et al. Effects of intensive glucose lowering in type 2 diabetes. N Engl J Med 2008; 358:2545–2559.
- ADVANCE Collaborative Group; Patel A, MacMahon S, Chalmers J, et al. Intensive blood glucose control and vascular outcomes in patients with type 2 diabetes. N Engl J Med 2008; 358:2560–5572.
- Duckworth W, Abraira C, Moritz T, et al; VADT Investigators. Glucose control and vascular complications in veterans with type 2 diabetes. N Engl J Med 2009; 360:129–139.
- Emerging Risk Factors Collaboration; Di Angelantonio E, Gao P, Kahn H, et al. Glycated hemoglobin measurement and prediction of cardiovascular disease. JAMA 2014; 311:1225–1233.
- Ziemer DC, Kolm P, Weintraub WS, et al. Glucose-independent, black-white differences in hemoglobin A1c levels: a cross-sectional analysis of 2 studies. Ann Intern Med 2010; 152:770–777.
- Herman WH, Ma Y, Uwaifo G, et al; Diabetes Prevention Program Research Group. Differences in A1c by race and ethnicity among patients with impaired glucose tolerance in the Diabetes Prevention Program. Diabetes Care 2007; 30:2543–2457.
- Kilpatrick ES, Rigby AS, Good K, Atkin SL. Relating mean blood glucose and glucose variability to the risk of multiple episodes of hypoglycaemia in type 1 diabetes. Diabetologia 2007; 50:2553–2561.
- Khunti K, Davies M, Majeed A, Thorsted BL, Wolden ML, Paul SK. Hypoglycemia and risk of cardiovascular disease and all-cause mortality in insulin-treated people with type 1 and type 2 diabetes: a cohort study. Diabetes Care 2015; 38:316–322.
- Krinsley JS, Schultz MJ, Sprong PE, et al. Mild hypoglycemia is independently associated with increased mortality in the critically ill. Crit Care 2011; 15:R173.
- Munshi MN, Segal AR, Suhl E, et al. Frequent hypoglycemia among elderly patients with poor glycemic control. Arch Intern Med 2011; 171:362–364.
- Hirsch IB, Probstfield JL, Davis BR, et al. Glucose variability in type 2 diabetes: the initial results of the FLAT-SUGAR trial. Diabetes 2015; 64(suppl 1): A100. Abstract 385-OR.
- Kim KJ, Lee BW. The roles of glycated albumin as intermediate glycation index and pathogenic protein. Diabetes Metab J 2012; 36:98–107.
- Klonoff DC. Serum fructosamine as a screening test for type 2 diabetes. Diabetes Technol Ther 2000; 2:537–539.
KEY POINTS
- An HbA1c level ≥ 6.5% is the diagnostic cutoff used for diabetes diagnosis; patients with prediabetes have HbA1c values of 5.7% to 6.4%.
- HbA1c is formed by the glycation of hemoglobin, thus HbA1c may be difficult to interpret in patients with medical disorders affecting red blood cell survival or glycosylation.
- The use of HbA1c monitoring to manage patients with diabetes should include target levels that are tailored according to the risks and benefits of glycemic control, especially cardiovascular risks.
- Although commonly used by population studies as a risk indicator for diabetes and cardiovascular complications, HbA1c may misrepresent the glycemic “big picture.”