User login
Infections kill many waiting for liver transplant, force others off list
AMSTERDAM – Infection is a major cause of death among patients waiting for a liver transplant, killing more than half of those who contracted one.
Infection also was the biggest reason that patients with end-stage liver disease withdrew from the transplant waiting list, a 9-year-long study has shown. Patients who developed an infection were six times more likely to withdraw than were those who did not, Dr. Loes Alferink wrote in a poster presented at the European Society of Clinical Microbiology and Infectious Diseases annual congress.
“We need to focus on better prophylactic antibiotic strategies to save lives in patients with end-stage liver disease who are on the waiting list,” said Dr. Alferink of Erasmus Medical Center, Rotterdam, the Netherlands.
She and her colleagues examined the effect of infections on 312 patients who were waiting for a transplant at Erasmus Medical Center from the period of 2006-2013. During that time, a total of 317 infections developed in 144 patients. The infections were fatal in 58% of these patients.
These included spontaneous primary cholangitis (75); spontaneous bacterial peritonitis (61); urogenital (38), respiratory (30), and skin (25) infections; as well as primary bacteremia (22). Also, there were 18 cases of gastroenteritis and 12 cases of Candida esophagitis. The remainder were unspecified infections.
The death rate was highest in primary bacteremia, which killed about 40% of those who developed it. The rate was about 25% in respiratory infections, 20% in spontaneous primary bacteremia, 15% in esophagitis, 10% in gastroenteritis and urinary tract infections, and 10% in patients with multiple site infections.
The pathogens were gram negative (70) and gram positive (37) bacteria; Enterococcus faecium (15) and faecalis (3); yeasts (13); viruses (7); and mold (2). The remainder of the infections yielded a negative culture.
In 24 patients, multiple pathogens were identified. These patients had the highest rate of mortality, with almost half of them dying from their infection; one of the two patients with a mold infection also died. The death rate was 20% in patients with yeast infections, 18% in those with E. faecium, 15% in gram-positive infections, and 10% in gram-negative infections.
A multivariate analysis found several factors that increased the risk of dying from an infection. For every 10 years of increasing age, the risk of infection-related mortality doubled (odds ratio, 2); worse MELD (Model for End-Stage Liver Disease) scores increased the risk by 12%.
Patients with hepatic encephalopathy were 76% more likely to die from an infection, and those with refractory ascites faced a 2.5-fold increased risk. Mechanical ventilation was associated with more than a fivefold increased risk (OR, 5.72).
Patients who developed an infection were almost six times more likely to be withdrawn from the transplant waiting list (hazard ratio, 5.87). The regression analysis for withdrawal identified several factors that significantly increased the risk, including age, MELD score, and serum albumin. The biggest risk factor for withdrawal related to infection was refractory ascites, which more than doubled the risk (HR, 2.2).
Dr. Alferink had no financial disclosures.
On Twitter @Alz_Gal
AMSTERDAM – Infection is a major cause of death among patients waiting for a liver transplant, killing more than half of those who contracted one.
Infection also was the biggest reason that patients with end-stage liver disease withdrew from the transplant waiting list, a 9-year-long study has shown. Patients who developed an infection were six times more likely to withdraw than were those who did not, Dr. Loes Alferink wrote in a poster presented at the European Society of Clinical Microbiology and Infectious Diseases annual congress.
“We need to focus on better prophylactic antibiotic strategies to save lives in patients with end-stage liver disease who are on the waiting list,” said Dr. Alferink of Erasmus Medical Center, Rotterdam, the Netherlands.
She and her colleagues examined the effect of infections on 312 patients who were waiting for a transplant at Erasmus Medical Center from the period of 2006-2013. During that time, a total of 317 infections developed in 144 patients. The infections were fatal in 58% of these patients.
These included spontaneous primary cholangitis (75); spontaneous bacterial peritonitis (61); urogenital (38), respiratory (30), and skin (25) infections; as well as primary bacteremia (22). Also, there were 18 cases of gastroenteritis and 12 cases of Candida esophagitis. The remainder were unspecified infections.
The death rate was highest in primary bacteremia, which killed about 40% of those who developed it. The rate was about 25% in respiratory infections, 20% in spontaneous primary bacteremia, 15% in esophagitis, 10% in gastroenteritis and urinary tract infections, and 10% in patients with multiple site infections.
The pathogens were gram negative (70) and gram positive (37) bacteria; Enterococcus faecium (15) and faecalis (3); yeasts (13); viruses (7); and mold (2). The remainder of the infections yielded a negative culture.
In 24 patients, multiple pathogens were identified. These patients had the highest rate of mortality, with almost half of them dying from their infection; one of the two patients with a mold infection also died. The death rate was 20% in patients with yeast infections, 18% in those with E. faecium, 15% in gram-positive infections, and 10% in gram-negative infections.
A multivariate analysis found several factors that increased the risk of dying from an infection. For every 10 years of increasing age, the risk of infection-related mortality doubled (odds ratio, 2); worse MELD (Model for End-Stage Liver Disease) scores increased the risk by 12%.
Patients with hepatic encephalopathy were 76% more likely to die from an infection, and those with refractory ascites faced a 2.5-fold increased risk. Mechanical ventilation was associated with more than a fivefold increased risk (OR, 5.72).
Patients who developed an infection were almost six times more likely to be withdrawn from the transplant waiting list (hazard ratio, 5.87). The regression analysis for withdrawal identified several factors that significantly increased the risk, including age, MELD score, and serum albumin. The biggest risk factor for withdrawal related to infection was refractory ascites, which more than doubled the risk (HR, 2.2).
Dr. Alferink had no financial disclosures.
On Twitter @Alz_Gal
AMSTERDAM – Infection is a major cause of death among patients waiting for a liver transplant, killing more than half of those who contracted one.
Infection also was the biggest reason that patients with end-stage liver disease withdrew from the transplant waiting list, a 9-year-long study has shown. Patients who developed an infection were six times more likely to withdraw than were those who did not, Dr. Loes Alferink wrote in a poster presented at the European Society of Clinical Microbiology and Infectious Diseases annual congress.
“We need to focus on better prophylactic antibiotic strategies to save lives in patients with end-stage liver disease who are on the waiting list,” said Dr. Alferink of Erasmus Medical Center, Rotterdam, the Netherlands.
She and her colleagues examined the effect of infections on 312 patients who were waiting for a transplant at Erasmus Medical Center from the period of 2006-2013. During that time, a total of 317 infections developed in 144 patients. The infections were fatal in 58% of these patients.
These included spontaneous primary cholangitis (75); spontaneous bacterial peritonitis (61); urogenital (38), respiratory (30), and skin (25) infections; as well as primary bacteremia (22). Also, there were 18 cases of gastroenteritis and 12 cases of Candida esophagitis. The remainder were unspecified infections.
The death rate was highest in primary bacteremia, which killed about 40% of those who developed it. The rate was about 25% in respiratory infections, 20% in spontaneous primary bacteremia, 15% in esophagitis, 10% in gastroenteritis and urinary tract infections, and 10% in patients with multiple site infections.
The pathogens were gram negative (70) and gram positive (37) bacteria; Enterococcus faecium (15) and faecalis (3); yeasts (13); viruses (7); and mold (2). The remainder of the infections yielded a negative culture.
In 24 patients, multiple pathogens were identified. These patients had the highest rate of mortality, with almost half of them dying from their infection; one of the two patients with a mold infection also died. The death rate was 20% in patients with yeast infections, 18% in those with E. faecium, 15% in gram-positive infections, and 10% in gram-negative infections.
A multivariate analysis found several factors that increased the risk of dying from an infection. For every 10 years of increasing age, the risk of infection-related mortality doubled (odds ratio, 2); worse MELD (Model for End-Stage Liver Disease) scores increased the risk by 12%.
Patients with hepatic encephalopathy were 76% more likely to die from an infection, and those with refractory ascites faced a 2.5-fold increased risk. Mechanical ventilation was associated with more than a fivefold increased risk (OR, 5.72).
Patients who developed an infection were almost six times more likely to be withdrawn from the transplant waiting list (hazard ratio, 5.87). The regression analysis for withdrawal identified several factors that significantly increased the risk, including age, MELD score, and serum albumin. The biggest risk factor for withdrawal related to infection was refractory ascites, which more than doubled the risk (HR, 2.2).
Dr. Alferink had no financial disclosures.
On Twitter @Alz_Gal
AT ECCMID 2016
Key clinical point: Infections are a major cause of transplant wait-list withdrawal and death in patients with end-stage liver disease.
Major finding: Infections increased the risk of withdrawal by sixfold, and killed 58% of those who developed one.
Data source: A retrospective study of 144 patients who developed a total of 317 infections.
Disclosures: Dr. Alferink had no financial disclosures.
Hospital intervention slashes heparin-induced thrombocytopenia
A simple, hospital-wide “avoid heparin” intervention dramatically cut the rate of suspected heparin-induced thrombocytopenia by 42%, that of positive ELISA screens for HIT by 63%, that of adjudicated HIT by 79%, and that of HIT with thrombosis by 91%, while also reducing the costs of HIT-related care by 83% at one large university hospital.
The medical literature has focused on early recognition and treatment of heparin-induced thrombocytopenia, “but its prevention has been largely overlooked,” noted Dr. Kelly E. McGowan of Sunnybrook Health Sciences Centre and the University of Toronto and her associates.
Sunnybrook introduced an “avoid heparin” program in 2006 in which most intravenous and subcutaneous unfractionated heparin was replaced with low-molecular-weight heparin (LMWH) in prophylactic or therapeutic doses; heparinized saline in arterial and central venous lines was replaced with saline flushes; order sets were modified to exclude unfractionated heparin options; and unfractionated heparin stores were removed from most nursing units.
Unfractionated heparin remained available for use in hemodialysis, cardiovascular surgery, and certain cases of acute coronary syndrome. Most hospital clinicians were unaware that LMWH was being substituted for unfractionated heparin, and none were aware that the effects of this change were being studied.
The investigators assessed all 1,118 cases of suspected heparin-induced thrombocytopenia that occurred during a 10-year period before and after this intervention was implemented. The use of LMWH rose fourfold after the program was initiated, but the annual rate of HIT associated with LMWH remained constant at 0.9 cases per 10,000 admissions over the course of the study.
The annual incidence of suspected HIT decreased from 85.5 per 10,000 admissions per year before the intervention to 49.0 afterward (relative risk reduction, 41.7%). The rate of positive ELISA screens for the disorder dropped from 16.5 to 6.1 per 10,000 (RRR, 62.9%), the rate of adjudicated HIT decreased from 10.7 to 2.2 per 10,000, and the rate of HIT with thrombosis declined from 4.6 to 0.4 per 10,000.
The program’s greatest impact was on cardiac surgery, but the burden of HIT also markedly decreased in other surgical and medical patients. HIT decreased by 77% in cardiovascular surgeries, 77% in other surgeries, 75% in cardiology patients, and 62% in medical patients, Dr. McGowan and her associates said (Blood 2016 Apr 21;127[16]:1954-9).
Patients with HIT during the preintervention years more often developed thrombosis (43%), usually venous thromboembolism, compared with those who had HIT in the postintervention years (19%), and median length of stay declined accordingly. The average estimated costs of HIT care per year dropped by about $267,000 dollars per year, from $322,000 before the program was implemented to $55,000 afterward.
The investigators added that this is the first study ever to show the success of an HIT prevention strategy. Their findings indicate that a hospital-wide “avoid heparin” program can substantially reduce morbidity, mortality, and costs associated with HIT. “The heparin avoidance strategy that we used was not complex or costly and would be feasible in other centers,” they noted.
This study is the first to show the substantial impact of large-scale removal of heparin from clinical practice in the real world. But implementing such a program at a system-wide level wouldn’t be simple.
The cost of a unit of low-molecular-weight heparin is six- to eightfold higher than that of unfractionated heparin. Hospitals may need to be convinced that unfractionated heparin is not the bargain it appears to be once the costs of heparin-induced thrombocytopenia are factored in.
In addition, unfractionated heparin remains the best option for patients undergoing cardiovascular surgery, those with renal failure, and those at high risk for bleeding that requires a rapid reversal agent.
Lori-Ann Linkins, M.D., of McMaster University, Hamilton (Ont.), made these remarks in a commentary accompanying Dr. McGowan’s report (Blood 2016 Apr 21;127[16]:1945-6). She reported receiving lecture honoraria from Pfizer and research funding from Bayer.
This study is the first to show the substantial impact of large-scale removal of heparin from clinical practice in the real world. But implementing such a program at a system-wide level wouldn’t be simple.
The cost of a unit of low-molecular-weight heparin is six- to eightfold higher than that of unfractionated heparin. Hospitals may need to be convinced that unfractionated heparin is not the bargain it appears to be once the costs of heparin-induced thrombocytopenia are factored in.
In addition, unfractionated heparin remains the best option for patients undergoing cardiovascular surgery, those with renal failure, and those at high risk for bleeding that requires a rapid reversal agent.
Lori-Ann Linkins, M.D., of McMaster University, Hamilton (Ont.), made these remarks in a commentary accompanying Dr. McGowan’s report (Blood 2016 Apr 21;127[16]:1945-6). She reported receiving lecture honoraria from Pfizer and research funding from Bayer.
This study is the first to show the substantial impact of large-scale removal of heparin from clinical practice in the real world. But implementing such a program at a system-wide level wouldn’t be simple.
The cost of a unit of low-molecular-weight heparin is six- to eightfold higher than that of unfractionated heparin. Hospitals may need to be convinced that unfractionated heparin is not the bargain it appears to be once the costs of heparin-induced thrombocytopenia are factored in.
In addition, unfractionated heparin remains the best option for patients undergoing cardiovascular surgery, those with renal failure, and those at high risk for bleeding that requires a rapid reversal agent.
Lori-Ann Linkins, M.D., of McMaster University, Hamilton (Ont.), made these remarks in a commentary accompanying Dr. McGowan’s report (Blood 2016 Apr 21;127[16]:1945-6). She reported receiving lecture honoraria from Pfizer and research funding from Bayer.
A simple, hospital-wide “avoid heparin” intervention dramatically cut the rate of suspected heparin-induced thrombocytopenia by 42%, that of positive ELISA screens for HIT by 63%, that of adjudicated HIT by 79%, and that of HIT with thrombosis by 91%, while also reducing the costs of HIT-related care by 83% at one large university hospital.
The medical literature has focused on early recognition and treatment of heparin-induced thrombocytopenia, “but its prevention has been largely overlooked,” noted Dr. Kelly E. McGowan of Sunnybrook Health Sciences Centre and the University of Toronto and her associates.
Sunnybrook introduced an “avoid heparin” program in 2006 in which most intravenous and subcutaneous unfractionated heparin was replaced with low-molecular-weight heparin (LMWH) in prophylactic or therapeutic doses; heparinized saline in arterial and central venous lines was replaced with saline flushes; order sets were modified to exclude unfractionated heparin options; and unfractionated heparin stores were removed from most nursing units.
Unfractionated heparin remained available for use in hemodialysis, cardiovascular surgery, and certain cases of acute coronary syndrome. Most hospital clinicians were unaware that LMWH was being substituted for unfractionated heparin, and none were aware that the effects of this change were being studied.
The investigators assessed all 1,118 cases of suspected heparin-induced thrombocytopenia that occurred during a 10-year period before and after this intervention was implemented. The use of LMWH rose fourfold after the program was initiated, but the annual rate of HIT associated with LMWH remained constant at 0.9 cases per 10,000 admissions over the course of the study.
The annual incidence of suspected HIT decreased from 85.5 per 10,000 admissions per year before the intervention to 49.0 afterward (relative risk reduction, 41.7%). The rate of positive ELISA screens for the disorder dropped from 16.5 to 6.1 per 10,000 (RRR, 62.9%), the rate of adjudicated HIT decreased from 10.7 to 2.2 per 10,000, and the rate of HIT with thrombosis declined from 4.6 to 0.4 per 10,000.
The program’s greatest impact was on cardiac surgery, but the burden of HIT also markedly decreased in other surgical and medical patients. HIT decreased by 77% in cardiovascular surgeries, 77% in other surgeries, 75% in cardiology patients, and 62% in medical patients, Dr. McGowan and her associates said (Blood 2016 Apr 21;127[16]:1954-9).
Patients with HIT during the preintervention years more often developed thrombosis (43%), usually venous thromboembolism, compared with those who had HIT in the postintervention years (19%), and median length of stay declined accordingly. The average estimated costs of HIT care per year dropped by about $267,000 dollars per year, from $322,000 before the program was implemented to $55,000 afterward.
The investigators added that this is the first study ever to show the success of an HIT prevention strategy. Their findings indicate that a hospital-wide “avoid heparin” program can substantially reduce morbidity, mortality, and costs associated with HIT. “The heparin avoidance strategy that we used was not complex or costly and would be feasible in other centers,” they noted.
A simple, hospital-wide “avoid heparin” intervention dramatically cut the rate of suspected heparin-induced thrombocytopenia by 42%, that of positive ELISA screens for HIT by 63%, that of adjudicated HIT by 79%, and that of HIT with thrombosis by 91%, while also reducing the costs of HIT-related care by 83% at one large university hospital.
The medical literature has focused on early recognition and treatment of heparin-induced thrombocytopenia, “but its prevention has been largely overlooked,” noted Dr. Kelly E. McGowan of Sunnybrook Health Sciences Centre and the University of Toronto and her associates.
Sunnybrook introduced an “avoid heparin” program in 2006 in which most intravenous and subcutaneous unfractionated heparin was replaced with low-molecular-weight heparin (LMWH) in prophylactic or therapeutic doses; heparinized saline in arterial and central venous lines was replaced with saline flushes; order sets were modified to exclude unfractionated heparin options; and unfractionated heparin stores were removed from most nursing units.
Unfractionated heparin remained available for use in hemodialysis, cardiovascular surgery, and certain cases of acute coronary syndrome. Most hospital clinicians were unaware that LMWH was being substituted for unfractionated heparin, and none were aware that the effects of this change were being studied.
The investigators assessed all 1,118 cases of suspected heparin-induced thrombocytopenia that occurred during a 10-year period before and after this intervention was implemented. The use of LMWH rose fourfold after the program was initiated, but the annual rate of HIT associated with LMWH remained constant at 0.9 cases per 10,000 admissions over the course of the study.
The annual incidence of suspected HIT decreased from 85.5 per 10,000 admissions per year before the intervention to 49.0 afterward (relative risk reduction, 41.7%). The rate of positive ELISA screens for the disorder dropped from 16.5 to 6.1 per 10,000 (RRR, 62.9%), the rate of adjudicated HIT decreased from 10.7 to 2.2 per 10,000, and the rate of HIT with thrombosis declined from 4.6 to 0.4 per 10,000.
The program’s greatest impact was on cardiac surgery, but the burden of HIT also markedly decreased in other surgical and medical patients. HIT decreased by 77% in cardiovascular surgeries, 77% in other surgeries, 75% in cardiology patients, and 62% in medical patients, Dr. McGowan and her associates said (Blood 2016 Apr 21;127[16]:1954-9).
Patients with HIT during the preintervention years more often developed thrombosis (43%), usually venous thromboembolism, compared with those who had HIT in the postintervention years (19%), and median length of stay declined accordingly. The average estimated costs of HIT care per year dropped by about $267,000 dollars per year, from $322,000 before the program was implemented to $55,000 afterward.
The investigators added that this is the first study ever to show the success of an HIT prevention strategy. Their findings indicate that a hospital-wide “avoid heparin” program can substantially reduce morbidity, mortality, and costs associated with HIT. “The heparin avoidance strategy that we used was not complex or costly and would be feasible in other centers,” they noted.
FROM BLOOD
Key clinical point: A simple, hospital-wide “avoid heparin” intervention dramatically cut the burden of heparin-induced thrombocytopenia at one hospital.
Major finding: The annual incidence of suspected HIT decreased from 85.5 per 10,000 admissions per year before the intervention to 49.0 afterward (relative risk reduction, 41.7%).
Data source: A retrospective comparison of 1,118 heparin-induced disorders at a large university hospital before and after the implementation of a preventive intervention.
Disclosures: No sponsors/supporters were identified for this study. Dr. McGowan reported having no relevant financial disclosures; her associates reported ties to numerous industry sources.
Many ‘nonurgent’ ED cases actually are urgent
Many emergency department cases deemed “nonurgent” by triage personnel actually are indistinguishable from those deemed “urgent,” according to a Research Letter to the Editor published in JAMA Internal Medicine.
To examine whether a triage determination of nonurgent status really rules out the possibility of serious pathology, researchers analyzed data from the National Hospital Ambulatory Medical Care Survey, a representative annual probability sample survey of ED visits categorized by level of urgency. They focused on 59,293 ED visits by patients aged 18-64 years during a 3-year period, which were representative of 240 million ED visits across the country. An estimated total of 218.5 million of these visits (92.5%) were categorized as urgent and 17.8 million (7.5%) as nonurgent by triage personnel, said Dr. Renee Y. Hsia of the department of emergency medicine and the Philip R. Lee Institute for Health Policy Studies, University of California San Francisco, and her associates.
Patients required diagnostic services such as blood tests, electrocardiograms, or imaging in 8.45 million “nonurgent” visits (48%), and patients required procedures such as intravenous fluids, casting, or splinting in 5.76 million “nonurgent” visits (32%). More than 775,000 “nonurgent” visits (4%) resulted in hospital admission, including 126,000 admissions to critical care units. And in 1.19 million “nonurgent” visits (7%), patients arrived by ambulance.
In addition, half of the top 10 diagnoses from “nonurgent” visits were identical to those from urgent visits, the investigators said (JAMA Int Med. 2016 April 18. doi: 10.1001/jamainternmed.2016.0878).
“Certainly, not all of these data necessarily indicate that these services were required, and they could signal overuse or a lack of availability of primary care physicians. However, to some degree, our findings indicate that either patients or health care professionals do entertain a degree of uncertainty that requires further evaluation before diagnosis,” Dr. Hsia and her associates said.
Triage was never intended to completely rule out the possibility of severe illness in patients considered nonurgent, but was meant to predict the amount of time a patient could safely wait to be seen in the ED. However, over time, “the term ‘nonurgent’ has been often politicized to mean ‘inappropriate,’ ” they noted.
“Our findings highlight the lack of certainty of nonurgent status even when it is determined prospectively by a provider at triage, and suggest that caution must be taken when using triage scores beyond their intended purpose,” the investigators said.
Many emergency department cases deemed “nonurgent” by triage personnel actually are indistinguishable from those deemed “urgent,” according to a Research Letter to the Editor published in JAMA Internal Medicine.
To examine whether a triage determination of nonurgent status really rules out the possibility of serious pathology, researchers analyzed data from the National Hospital Ambulatory Medical Care Survey, a representative annual probability sample survey of ED visits categorized by level of urgency. They focused on 59,293 ED visits by patients aged 18-64 years during a 3-year period, which were representative of 240 million ED visits across the country. An estimated total of 218.5 million of these visits (92.5%) were categorized as urgent and 17.8 million (7.5%) as nonurgent by triage personnel, said Dr. Renee Y. Hsia of the department of emergency medicine and the Philip R. Lee Institute for Health Policy Studies, University of California San Francisco, and her associates.
Patients required diagnostic services such as blood tests, electrocardiograms, or imaging in 8.45 million “nonurgent” visits (48%), and patients required procedures such as intravenous fluids, casting, or splinting in 5.76 million “nonurgent” visits (32%). More than 775,000 “nonurgent” visits (4%) resulted in hospital admission, including 126,000 admissions to critical care units. And in 1.19 million “nonurgent” visits (7%), patients arrived by ambulance.
In addition, half of the top 10 diagnoses from “nonurgent” visits were identical to those from urgent visits, the investigators said (JAMA Int Med. 2016 April 18. doi: 10.1001/jamainternmed.2016.0878).
“Certainly, not all of these data necessarily indicate that these services were required, and they could signal overuse or a lack of availability of primary care physicians. However, to some degree, our findings indicate that either patients or health care professionals do entertain a degree of uncertainty that requires further evaluation before diagnosis,” Dr. Hsia and her associates said.
Triage was never intended to completely rule out the possibility of severe illness in patients considered nonurgent, but was meant to predict the amount of time a patient could safely wait to be seen in the ED. However, over time, “the term ‘nonurgent’ has been often politicized to mean ‘inappropriate,’ ” they noted.
“Our findings highlight the lack of certainty of nonurgent status even when it is determined prospectively by a provider at triage, and suggest that caution must be taken when using triage scores beyond their intended purpose,” the investigators said.
Many emergency department cases deemed “nonurgent” by triage personnel actually are indistinguishable from those deemed “urgent,” according to a Research Letter to the Editor published in JAMA Internal Medicine.
To examine whether a triage determination of nonurgent status really rules out the possibility of serious pathology, researchers analyzed data from the National Hospital Ambulatory Medical Care Survey, a representative annual probability sample survey of ED visits categorized by level of urgency. They focused on 59,293 ED visits by patients aged 18-64 years during a 3-year period, which were representative of 240 million ED visits across the country. An estimated total of 218.5 million of these visits (92.5%) were categorized as urgent and 17.8 million (7.5%) as nonurgent by triage personnel, said Dr. Renee Y. Hsia of the department of emergency medicine and the Philip R. Lee Institute for Health Policy Studies, University of California San Francisco, and her associates.
Patients required diagnostic services such as blood tests, electrocardiograms, or imaging in 8.45 million “nonurgent” visits (48%), and patients required procedures such as intravenous fluids, casting, or splinting in 5.76 million “nonurgent” visits (32%). More than 775,000 “nonurgent” visits (4%) resulted in hospital admission, including 126,000 admissions to critical care units. And in 1.19 million “nonurgent” visits (7%), patients arrived by ambulance.
In addition, half of the top 10 diagnoses from “nonurgent” visits were identical to those from urgent visits, the investigators said (JAMA Int Med. 2016 April 18. doi: 10.1001/jamainternmed.2016.0878).
“Certainly, not all of these data necessarily indicate that these services were required, and they could signal overuse or a lack of availability of primary care physicians. However, to some degree, our findings indicate that either patients or health care professionals do entertain a degree of uncertainty that requires further evaluation before diagnosis,” Dr. Hsia and her associates said.
Triage was never intended to completely rule out the possibility of severe illness in patients considered nonurgent, but was meant to predict the amount of time a patient could safely wait to be seen in the ED. However, over time, “the term ‘nonurgent’ has been often politicized to mean ‘inappropriate,’ ” they noted.
“Our findings highlight the lack of certainty of nonurgent status even when it is determined prospectively by a provider at triage, and suggest that caution must be taken when using triage scores beyond their intended purpose,” the investigators said.
FROM JAMA INTERNAL MEDICINE
Key clinical point: Many emergency department cases deemed “nonurgent” by triage personnel actually are indistinguishable from those deemed “urgent.”
Major finding: Patients required diagnostic services such as blood tests, ECGs, or imaging in 8.45 million “nonurgent” ED visits (48%), and procedures such as intravenous fluids, casting, or splinting in 5.76 million (32%).
Data source: An analysis of 59,293 adult ED visits representing 240 million such visits across the United States during a 3-year period.
Disclosures: No sponsor was identified for this study. Dr. Hsia and her associates reported having no relevant financial disclosures.
Risk of arthritis in children with Down syndrome higher than previously reported
GLASGOW – Children with Down syndrome are at increased risk for arthritis that often goes unrecognized and leads to treatment delays and potential chronic disability.
Research presented at the British Society for Rheumatology annual conference highlighted how Down arthropathy is not only more prevalent than idiopathic juvenile arthritis (JIA), but also has distinct clinical and radiographic features.
“Our research to date has shown that there is a significant increased risk of arthritis in children with trisomy 21, and higher than that previously reported,” said Dr. Charlene Foley, a research fellow at Our Lady’s Children’s Hospital in Dublin.

“There is a significant delay in diagnosis, which may be a cause of the x-ray changes at diagnosis, or it may be in fact that Down arthropathy is more aggressive,” than other childhood forms of arthritis, she observed.
Dr. Foley noted that Down arthropathy was first reported in the medical literature about 30 years ago and crude estimates suggested a prevalence of around 8.7 cases per 1,000 children versus 1 per 1,000 for JIA. However, the research she presented put the crude point prevalence at 18-21 per 1,000 children.
Dr. Foley presented the findings of an observational study conducted in the Republic of Ireland in which children with trisomy 21 and their families were identified from a variety of sources and invited to participate. After completion of a screening questionnaire and an appointment local to the participants, children who were suspected of having arthritis were invited to attend a consultant appointment. They underwent a clinical management pathway developed for JIA because no specific pathway had been developed for the children at that time, with follow-up appointments held every 3-6 months depending on the child’s needs.
Over an 18-month period, 503 children with trisomy 21 and a mean age of 8 years were screened. They had a range of musculoskeletal anomalies, the most common of which were flat feet in almost all the children (91.1%), inflammatory arthritis in 7.1%, and scoliosis in 4.8%. Many other problems occurred, with an incidence of 1.5% or less for each.
A total of 22 new cases of Down arthropathy have been identified to date, in addition to 11 at the clinic who predated the start of the study. About 75% have come through the screening clinics and the rest through pediatricians’ referral.
“It is a challenging disease both in terms of diagnosis and management,” Dr. Foley said. Of all the identified children, 91% had poor language skills or nonverbal communication and 15% had autism spectrum disorder.
On average, the time to diagnosis of the arthropathy was 1.7 years versus 0.74 years for a control group of 33 children with JIA. This is likely an underestimation, however, as 42% of the children or parents in the Down arthropathy cohort were unable to give a date on which symptoms had started.
Dr. Foley reported that the majority of trisomy 21 children had presented with polyarticular arthritis, mostly involving the proximal interphalangeal joints of the hands (78.6% of cases), or the wrists (53.6% of cases). There was significant small joint involvement (88% vs. 43% of the JIA cohort), and higher restricted joint counts (4.5 vs. 2.0). There were also differences in erythrocyte sedimentation rate and C-reactive protein at diagnosis, with these being “barely raised” in children with Down arthropathy versus children with JIA, so unlikely to aid a diagnosis. Children were also found to be rheumatoid factor negative.
Two-thirds of Down arthropathy cases had x-ray changes at presentation versus 24% of the JIA group, of which 29% versus 9.5% were erosive.
Treatment is complicated by drug-related side effects, with many children unable to tolerate methotrexate, Dr. Foley said. In the Irish cohort, treatment with methotrexate led to nausea in 75%, compared with 7.1% of the JIA children. Although reports are limited, methotrexate intolerance has been shown in children with trisomy 21, so there could be a genetic or metabolic reason behind this. Dr. Foley noted that they manage this problem by starting methotrexate on the lowest possible doses (10 mg/m2) and co-administering the antiemetic ondansetron. They have a low threshold for switching to an anti-TNF drug if needed, and have also started giving biologic drugs to some newly diagnosed children.
“The take-home message is to think outside of the Down syndrome box and don’t just blame everything on Down syndrome,” Dr. Foley said. As it may be challenging to examine a child, she suggested looking at the hands first because they are the most likely to be affected.
“We feel that a musculoskeletal assessment should be part of the annual surveillance for all children with Down syndrome,” she concluded.
As for who should conduct such an assessment, Dr. Foley suggested that general pediatricians who are regularly seeing these children for other health checks should perform it. However, as one delegate observed, nonrheumatology professionals may need a little training and guidance, as musculoskeletal assessments can be difficult. Looking only at the hands, and potentially the feet, may be one solution.
The study has raised a number of questions and future research will be needed to further characterize the arthritis and to determine how best to diagnose and treat it, noted Dr. Foley, who indicated that she had no conflicts of interest.
GLASGOW – Children with Down syndrome are at increased risk for arthritis that often goes unrecognized and leads to treatment delays and potential chronic disability.
Research presented at the British Society for Rheumatology annual conference highlighted how Down arthropathy is not only more prevalent than idiopathic juvenile arthritis (JIA), but also has distinct clinical and radiographic features.
“Our research to date has shown that there is a significant increased risk of arthritis in children with trisomy 21, and higher than that previously reported,” said Dr. Charlene Foley, a research fellow at Our Lady’s Children’s Hospital in Dublin.
“There is a significant delay in diagnosis, which may be a cause of the x-ray changes at diagnosis, or it may be in fact that Down arthropathy is more aggressive,” than other childhood forms of arthritis, she observed.
Dr. Foley noted that Down arthropathy was first reported in the medical literature about 30 years ago and crude estimates suggested a prevalence of around 8.7 cases per 1,000 children versus 1 per 1,000 for JIA. However, the research she presented put the crude point prevalence at 18-21 per 1,000 children.
Dr. Foley presented the findings of an observational study conducted in the Republic of Ireland in which children with trisomy 21 and their families were identified from a variety of sources and invited to participate. After completion of a screening questionnaire and an appointment local to the participants, children who were suspected of having arthritis were invited to attend a consultant appointment. They underwent a clinical management pathway developed for JIA because no specific pathway had been developed for the children at that time, with follow-up appointments held every 3-6 months depending on the child’s needs.
Over an 18-month period, 503 children with trisomy 21 and a mean age of 8 years were screened. They had a range of musculoskeletal anomalies, the most common of which were flat feet in almost all the children (91.1%), inflammatory arthritis in 7.1%, and scoliosis in 4.8%. Many other problems occurred, with an incidence of 1.5% or less for each.
A total of 22 new cases of Down arthropathy have been identified to date, in addition to 11 at the clinic who predated the start of the study. About 75% have come through the screening clinics and the rest through pediatricians’ referral.
“It is a challenging disease both in terms of diagnosis and management,” Dr. Foley said. Of all the identified children, 91% had poor language skills or nonverbal communication and 15% had autism spectrum disorder.
On average, the time to diagnosis of the arthropathy was 1.7 years versus 0.74 years for a control group of 33 children with JIA. This is likely an underestimation, however, as 42% of the children or parents in the Down arthropathy cohort were unable to give a date on which symptoms had started.
Dr. Foley reported that the majority of trisomy 21 children had presented with polyarticular arthritis, mostly involving the proximal interphalangeal joints of the hands (78.6% of cases), or the wrists (53.6% of cases). There was significant small joint involvement (88% vs. 43% of the JIA cohort), and higher restricted joint counts (4.5 vs. 2.0). There were also differences in erythrocyte sedimentation rate and C-reactive protein at diagnosis, with these being “barely raised” in children with Down arthropathy versus children with JIA, so unlikely to aid a diagnosis. Children were also found to be rheumatoid factor negative.
Two-thirds of Down arthropathy cases had x-ray changes at presentation versus 24% of the JIA group, of which 29% versus 9.5% were erosive.
Treatment is complicated by drug-related side effects, with many children unable to tolerate methotrexate, Dr. Foley said. In the Irish cohort, treatment with methotrexate led to nausea in 75%, compared with 7.1% of the JIA children. Although reports are limited, methotrexate intolerance has been shown in children with trisomy 21, so there could be a genetic or metabolic reason behind this. Dr. Foley noted that they manage this problem by starting methotrexate on the lowest possible doses (10 mg/m2) and co-administering the antiemetic ondansetron. They have a low threshold for switching to an anti-TNF drug if needed, and have also started giving biologic drugs to some newly diagnosed children.
“The take-home message is to think outside of the Down syndrome box and don’t just blame everything on Down syndrome,” Dr. Foley said. As it may be challenging to examine a child, she suggested looking at the hands first because they are the most likely to be affected.
“We feel that a musculoskeletal assessment should be part of the annual surveillance for all children with Down syndrome,” she concluded.
As for who should conduct such an assessment, Dr. Foley suggested that general pediatricians who are regularly seeing these children for other health checks should perform it. However, as one delegate observed, nonrheumatology professionals may need a little training and guidance, as musculoskeletal assessments can be difficult. Looking only at the hands, and potentially the feet, may be one solution.
The study has raised a number of questions and future research will be needed to further characterize the arthritis and to determine how best to diagnose and treat it, noted Dr. Foley, who indicated that she had no conflicts of interest.
GLASGOW – Children with Down syndrome are at increased risk for arthritis that often goes unrecognized and leads to treatment delays and potential chronic disability.
Research presented at the British Society for Rheumatology annual conference highlighted how Down arthropathy is not only more prevalent than idiopathic juvenile arthritis (JIA), but also has distinct clinical and radiographic features.
“Our research to date has shown that there is a significant increased risk of arthritis in children with trisomy 21, and higher than that previously reported,” said Dr. Charlene Foley, a research fellow at Our Lady’s Children’s Hospital in Dublin.
“There is a significant delay in diagnosis, which may be a cause of the x-ray changes at diagnosis, or it may be in fact that Down arthropathy is more aggressive,” than other childhood forms of arthritis, she observed.
Dr. Foley noted that Down arthropathy was first reported in the medical literature about 30 years ago and crude estimates suggested a prevalence of around 8.7 cases per 1,000 children versus 1 per 1,000 for JIA. However, the research she presented put the crude point prevalence at 18-21 per 1,000 children.
Dr. Foley presented the findings of an observational study conducted in the Republic of Ireland in which children with trisomy 21 and their families were identified from a variety of sources and invited to participate. After completion of a screening questionnaire and an appointment local to the participants, children who were suspected of having arthritis were invited to attend a consultant appointment. They underwent a clinical management pathway developed for JIA because no specific pathway had been developed for the children at that time, with follow-up appointments held every 3-6 months depending on the child’s needs.
Over an 18-month period, 503 children with trisomy 21 and a mean age of 8 years were screened. They had a range of musculoskeletal anomalies, the most common of which were flat feet in almost all the children (91.1%), inflammatory arthritis in 7.1%, and scoliosis in 4.8%. Many other problems occurred, with an incidence of 1.5% or less for each.
A total of 22 new cases of Down arthropathy have been identified to date, in addition to 11 at the clinic who predated the start of the study. About 75% have come through the screening clinics and the rest through pediatricians’ referral.
“It is a challenging disease both in terms of diagnosis and management,” Dr. Foley said. Of all the identified children, 91% had poor language skills or nonverbal communication and 15% had autism spectrum disorder.
On average, the time to diagnosis of the arthropathy was 1.7 years versus 0.74 years for a control group of 33 children with JIA. This is likely an underestimation, however, as 42% of the children or parents in the Down arthropathy cohort were unable to give a date on which symptoms had started.
Dr. Foley reported that the majority of trisomy 21 children had presented with polyarticular arthritis, mostly involving the proximal interphalangeal joints of the hands (78.6% of cases), or the wrists (53.6% of cases). There was significant small joint involvement (88% vs. 43% of the JIA cohort), and higher restricted joint counts (4.5 vs. 2.0). There were also differences in erythrocyte sedimentation rate and C-reactive protein at diagnosis, with these being “barely raised” in children with Down arthropathy versus children with JIA, so unlikely to aid a diagnosis. Children were also found to be rheumatoid factor negative.
Two-thirds of Down arthropathy cases had x-ray changes at presentation versus 24% of the JIA group, of which 29% versus 9.5% were erosive.
Treatment is complicated by drug-related side effects, with many children unable to tolerate methotrexate, Dr. Foley said. In the Irish cohort, treatment with methotrexate led to nausea in 75%, compared with 7.1% of the JIA children. Although reports are limited, methotrexate intolerance has been shown in children with trisomy 21, so there could be a genetic or metabolic reason behind this. Dr. Foley noted that they manage this problem by starting methotrexate on the lowest possible doses (10 mg/m2) and co-administering the antiemetic ondansetron. They have a low threshold for switching to an anti-TNF drug if needed, and have also started giving biologic drugs to some newly diagnosed children.
“The take-home message is to think outside of the Down syndrome box and don’t just blame everything on Down syndrome,” Dr. Foley said. As it may be challenging to examine a child, she suggested looking at the hands first because they are the most likely to be affected.
“We feel that a musculoskeletal assessment should be part of the annual surveillance for all children with Down syndrome,” she concluded.
As for who should conduct such an assessment, Dr. Foley suggested that general pediatricians who are regularly seeing these children for other health checks should perform it. However, as one delegate observed, nonrheumatology professionals may need a little training and guidance, as musculoskeletal assessments can be difficult. Looking only at the hands, and potentially the feet, may be one solution.
The study has raised a number of questions and future research will be needed to further characterize the arthritis and to determine how best to diagnose and treat it, noted Dr. Foley, who indicated that she had no conflicts of interest.
AT RHEUMATOLOGY 2016
Key clinical point:A musculoskeletal assessment should be part of the annual surveillance for all children with Down syndrome to look for arthritis.
Major finding: Arthritis in children with Down syndrome typically presents as polyarticular inflammation in the hands and wrists.
Data source: Observational study of 33 children with Down arthropathy and 33 with juvenile idiopathic arthritis living in Ireland.
Disclosures: Dr. Foley had no conflicts of interest.

Search is on for cases of aggressive, ruxolitinib-associated skin cancers
ORLANDO – The hematologic cancer drug ruxolitinib seems to be associated with cases of aggressive nonmelanoma skin cancer.
After treating a very aggressive squamous cell carcinoma in a 55-year-old man treated with ruxolitinib for polycythemia vera, and hearing firsthand of three other similar cases, Dr. Fiona Zwald is collecting additional data on the association. She intends to publish these cases in a monograph as a warning to dermatologists, hematologists, oncologists, and other physicians who manage patients with hematologic malignancies, she said at the annual meeting of the American College of Mohs Surgery.
The prescribing information for ruxolitinib (Jakafi, Incyte Pharmaceuticals; Jakavi, Novartis) was updated in 2014 to warn that patients taking the drug face an increased risk of nonmelanoma skin cancers. The label also recommends that physicians inspect the skin regularly and urge patients to be alert for and report any new or changing lesions.
Despite the warnings and recommendations, cases are occurring – and some are quite serious, said Dr. Zwald, a Mohs surgeon in Atlanta.
“People should know this is actually happening. If you have experience with this medication, please let us know so we can compile this report. We are trying to assess the number of skin cancers before and after initiating this medication,” she said.
Ruxolitinib is an inhibitor of Janus kinase with a special affinity for the JAK1 and JAK2 subtypes. Like other cytokine-signaling molecules, their function depends on cell context; it may inhibit cell growth in one setting, and, in another, stimulate it. Ruxolitinib was initially approved in 2011 for the treatment of intermediate- and high-risk myelofibrosis, including primary myelofibrosis, post–polycythemia vera myelofibrosis, and post–essential thrombocythemia myelofibrosis.
In 2014, indications for ruxolitinib were expanded to include treatment of patients with polycythemia vera who have had an inadequate response to or are intolerant of hydroxyurea.
Dr. Zwald’s patient had a 10-year history of polycythemia vera. He was initially well controlled on the standard hydroxyurea treatment. In the meantime, he began working as a caddy at a major U.S. golf club. He developed many facial squamous cell carcinomas that were treated with excision and radiation. A year before he presented to Dr. Zwald, he stopped responding to hydroxyurea and was placed on ruxolitinib.
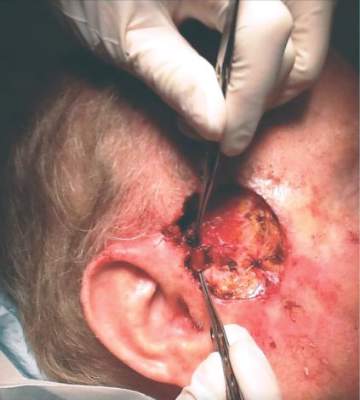
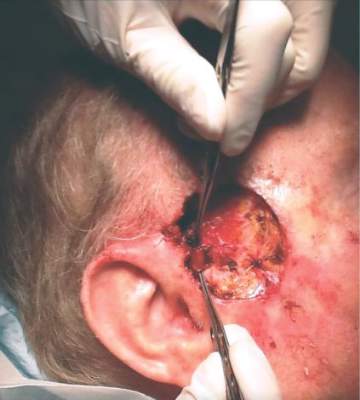
The patient presented with a 4-cm ulcerated lesion over part of his right temple and to the right helical crus; the lesion had developed over 3 months. Dr. Zwald consulted with the patient’s medical oncologist; treatment with ruxolitinib continued, albeit at a reduced dosage in light of recent events.
She performed Mohs surgery on the patient. It was a challenging case, she said, not the least because adequate anesthesia could not be achieved with local anesthetic. Preoperative staging showed no nodal spread.
“He did, unfortunately demonstrate a large, indurated mass located over one branch of the superficial temporal artery. At the helical crus there was an area of bound-down, fixed tumor. Knowing that I would not be able to fully resect this, I passed him on to the operating room,” Dr. Zwald said. “This tumor was found to extend down to the parotid capsule, but margins were clear.” The surgical defect was successfully repaired with a split-thickness skin graft.
The tumor recurred about 3 months later, and the patient underwent another surgery.
“This time we could not get clear surgical margins, and the tumor was approaching the external auditory meatus. Surgery was abandoned due to fears of complications to that area,” she said.
She presented the case at tumor board, during which she and her colleagues discussed adjuvant radiation. They initially abandoned this idea because he had already had so much radiation to his face. After the second surgery, they decide to proceed with radiation. “The next conversation we have will be whether to add another adjuvant therapy to treatment.”
She sent out the case and requests for feedback to the International Transplant Skin Cancer Collaborative, an 800-member consortium of dermatologists and Mohs surgeons who take care of transplant patients. She received information on three additional cases of aggressive squamous cell carcinoma (SCC) associated with ruxolitinib treatment:
• A patient with myelodysplastic syndrome with aggressive scalp SCC with cutaneous metastases.
• A patient with undifferentiated pleomorphic sarcoma of the scalp, several cutaneous SCCs.
• A patient with a myelodysplastic syndrome with in-transit metastases and explosive cutaneous SCCs. The patient has had the ruxolitinib dose reduced and may be switched to capecitabine.
Dr. Zwald noted that her patient was at risk for aggressive skin cancers for reasons in addition to ruxolitinib treatment.
“He was already immunosuppressed from his malignancy. He was on hydroxyurea, a drug that’s a cumulative phototoxin, and he’s out in the sun playing golf every day, and then was put on ruxolitinib. But the question we face now is how to try and stop this medication so we can get better treatment for him which will, of course, be very difficult.”
To contribute to Dr. Zwald’s case series, please email her at [email protected].
She had no relevant financial disclosures.
On Twitter @Alz_Gal
ORLANDO – The hematologic cancer drug ruxolitinib seems to be associated with cases of aggressive nonmelanoma skin cancer.
After treating a very aggressive squamous cell carcinoma in a 55-year-old man treated with ruxolitinib for polycythemia vera, and hearing firsthand of three other similar cases, Dr. Fiona Zwald is collecting additional data on the association. She intends to publish these cases in a monograph as a warning to dermatologists, hematologists, oncologists, and other physicians who manage patients with hematologic malignancies, she said at the annual meeting of the American College of Mohs Surgery.
The prescribing information for ruxolitinib (Jakafi, Incyte Pharmaceuticals; Jakavi, Novartis) was updated in 2014 to warn that patients taking the drug face an increased risk of nonmelanoma skin cancers. The label also recommends that physicians inspect the skin regularly and urge patients to be alert for and report any new or changing lesions.
Despite the warnings and recommendations, cases are occurring – and some are quite serious, said Dr. Zwald, a Mohs surgeon in Atlanta.
“People should know this is actually happening. If you have experience with this medication, please let us know so we can compile this report. We are trying to assess the number of skin cancers before and after initiating this medication,” she said.
Ruxolitinib is an inhibitor of Janus kinase with a special affinity for the JAK1 and JAK2 subtypes. Like other cytokine-signaling molecules, their function depends on cell context; it may inhibit cell growth in one setting, and, in another, stimulate it. Ruxolitinib was initially approved in 2011 for the treatment of intermediate- and high-risk myelofibrosis, including primary myelofibrosis, post–polycythemia vera myelofibrosis, and post–essential thrombocythemia myelofibrosis.
In 2014, indications for ruxolitinib were expanded to include treatment of patients with polycythemia vera who have had an inadequate response to or are intolerant of hydroxyurea.
Dr. Zwald’s patient had a 10-year history of polycythemia vera. He was initially well controlled on the standard hydroxyurea treatment. In the meantime, he began working as a caddy at a major U.S. golf club. He developed many facial squamous cell carcinomas that were treated with excision and radiation. A year before he presented to Dr. Zwald, he stopped responding to hydroxyurea and was placed on ruxolitinib.
The patient presented with a 4-cm ulcerated lesion over part of his right temple and to the right helical crus; the lesion had developed over 3 months. Dr. Zwald consulted with the patient’s medical oncologist; treatment with ruxolitinib continued, albeit at a reduced dosage in light of recent events.
She performed Mohs surgery on the patient. It was a challenging case, she said, not the least because adequate anesthesia could not be achieved with local anesthetic. Preoperative staging showed no nodal spread.
“He did, unfortunately demonstrate a large, indurated mass located over one branch of the superficial temporal artery. At the helical crus there was an area of bound-down, fixed tumor. Knowing that I would not be able to fully resect this, I passed him on to the operating room,” Dr. Zwald said. “This tumor was found to extend down to the parotid capsule, but margins were clear.” The surgical defect was successfully repaired with a split-thickness skin graft.
The tumor recurred about 3 months later, and the patient underwent another surgery.
“This time we could not get clear surgical margins, and the tumor was approaching the external auditory meatus. Surgery was abandoned due to fears of complications to that area,” she said.
She presented the case at tumor board, during which she and her colleagues discussed adjuvant radiation. They initially abandoned this idea because he had already had so much radiation to his face. After the second surgery, they decide to proceed with radiation. “The next conversation we have will be whether to add another adjuvant therapy to treatment.”
She sent out the case and requests for feedback to the International Transplant Skin Cancer Collaborative, an 800-member consortium of dermatologists and Mohs surgeons who take care of transplant patients. She received information on three additional cases of aggressive squamous cell carcinoma (SCC) associated with ruxolitinib treatment:
• A patient with myelodysplastic syndrome with aggressive scalp SCC with cutaneous metastases.
• A patient with undifferentiated pleomorphic sarcoma of the scalp, several cutaneous SCCs.
• A patient with a myelodysplastic syndrome with in-transit metastases and explosive cutaneous SCCs. The patient has had the ruxolitinib dose reduced and may be switched to capecitabine.
Dr. Zwald noted that her patient was at risk for aggressive skin cancers for reasons in addition to ruxolitinib treatment.
“He was already immunosuppressed from his malignancy. He was on hydroxyurea, a drug that’s a cumulative phototoxin, and he’s out in the sun playing golf every day, and then was put on ruxolitinib. But the question we face now is how to try and stop this medication so we can get better treatment for him which will, of course, be very difficult.”
To contribute to Dr. Zwald’s case series, please email her at [email protected].
She had no relevant financial disclosures.
On Twitter @Alz_Gal
ORLANDO – The hematologic cancer drug ruxolitinib seems to be associated with cases of aggressive nonmelanoma skin cancer.
After treating a very aggressive squamous cell carcinoma in a 55-year-old man treated with ruxolitinib for polycythemia vera, and hearing firsthand of three other similar cases, Dr. Fiona Zwald is collecting additional data on the association. She intends to publish these cases in a monograph as a warning to dermatologists, hematologists, oncologists, and other physicians who manage patients with hematologic malignancies, she said at the annual meeting of the American College of Mohs Surgery.
The prescribing information for ruxolitinib (Jakafi, Incyte Pharmaceuticals; Jakavi, Novartis) was updated in 2014 to warn that patients taking the drug face an increased risk of nonmelanoma skin cancers. The label also recommends that physicians inspect the skin regularly and urge patients to be alert for and report any new or changing lesions.
Despite the warnings and recommendations, cases are occurring – and some are quite serious, said Dr. Zwald, a Mohs surgeon in Atlanta.
“People should know this is actually happening. If you have experience with this medication, please let us know so we can compile this report. We are trying to assess the number of skin cancers before and after initiating this medication,” she said.
Ruxolitinib is an inhibitor of Janus kinase with a special affinity for the JAK1 and JAK2 subtypes. Like other cytokine-signaling molecules, their function depends on cell context; it may inhibit cell growth in one setting, and, in another, stimulate it. Ruxolitinib was initially approved in 2011 for the treatment of intermediate- and high-risk myelofibrosis, including primary myelofibrosis, post–polycythemia vera myelofibrosis, and post–essential thrombocythemia myelofibrosis.
In 2014, indications for ruxolitinib were expanded to include treatment of patients with polycythemia vera who have had an inadequate response to or are intolerant of hydroxyurea.
Dr. Zwald’s patient had a 10-year history of polycythemia vera. He was initially well controlled on the standard hydroxyurea treatment. In the meantime, he began working as a caddy at a major U.S. golf club. He developed many facial squamous cell carcinomas that were treated with excision and radiation. A year before he presented to Dr. Zwald, he stopped responding to hydroxyurea and was placed on ruxolitinib.
The patient presented with a 4-cm ulcerated lesion over part of his right temple and to the right helical crus; the lesion had developed over 3 months. Dr. Zwald consulted with the patient’s medical oncologist; treatment with ruxolitinib continued, albeit at a reduced dosage in light of recent events.
She performed Mohs surgery on the patient. It was a challenging case, she said, not the least because adequate anesthesia could not be achieved with local anesthetic. Preoperative staging showed no nodal spread.
“He did, unfortunately demonstrate a large, indurated mass located over one branch of the superficial temporal artery. At the helical crus there was an area of bound-down, fixed tumor. Knowing that I would not be able to fully resect this, I passed him on to the operating room,” Dr. Zwald said. “This tumor was found to extend down to the parotid capsule, but margins were clear.” The surgical defect was successfully repaired with a split-thickness skin graft.
The tumor recurred about 3 months later, and the patient underwent another surgery.
“This time we could not get clear surgical margins, and the tumor was approaching the external auditory meatus. Surgery was abandoned due to fears of complications to that area,” she said.
She presented the case at tumor board, during which she and her colleagues discussed adjuvant radiation. They initially abandoned this idea because he had already had so much radiation to his face. After the second surgery, they decide to proceed with radiation. “The next conversation we have will be whether to add another adjuvant therapy to treatment.”
She sent out the case and requests for feedback to the International Transplant Skin Cancer Collaborative, an 800-member consortium of dermatologists and Mohs surgeons who take care of transplant patients. She received information on three additional cases of aggressive squamous cell carcinoma (SCC) associated with ruxolitinib treatment:
• A patient with myelodysplastic syndrome with aggressive scalp SCC with cutaneous metastases.
• A patient with undifferentiated pleomorphic sarcoma of the scalp, several cutaneous SCCs.
• A patient with a myelodysplastic syndrome with in-transit metastases and explosive cutaneous SCCs. The patient has had the ruxolitinib dose reduced and may be switched to capecitabine.
Dr. Zwald noted that her patient was at risk for aggressive skin cancers for reasons in addition to ruxolitinib treatment.
“He was already immunosuppressed from his malignancy. He was on hydroxyurea, a drug that’s a cumulative phototoxin, and he’s out in the sun playing golf every day, and then was put on ruxolitinib. But the question we face now is how to try and stop this medication so we can get better treatment for him which will, of course, be very difficult.”
To contribute to Dr. Zwald’s case series, please email her at [email protected].
She had no relevant financial disclosures.
On Twitter @Alz_Gal
AT THE ACMS ANNUAL MEETING
Proposals Pave the Way for New Drugs
To promote achievable solutions in the ongoing debate on drug financing, Anthem, Inc. and Eli Lilly and Company are offering two policy proposals, which are detailed in “Discovering New Medicines and New Ways to Pay for Them,” published on the Health Affairs blog.
The first proposal calls for clarifying federal regulation to reduce perceived barriers impeding conversations between health benefit companies and biopharmaceutical companies about drugs prior to the drugs being approved for sale.
The second proposal calls for changes to federal laws and regulations to mitigate the barriers that make it difficult to move toward value-based contracting.
“A change in policies could open the door to new opportunities for hospitalists and their employers to create more high-value care,” says Sam Nussbaum, MD, Anthem clinical advisor. “Today, hospitals are paid for seeing patients. What if hospitals participated in a value-based arrangement with manufacturers and insurers that included treating patients with a specific condition with a new therapy proven to be more effective in producing better health outcomes, including keeping patients out of the hospital?”
Reference
- Nussbaum S, Ricks D. Discovering new medicines and new ways to pay for them. Health Policy Lab. Available at: http://healthaffairs.org/blog/2016/01/29/discovering-new-medicines-and-new-ways-to-pay-for-them/. Accessed February 15, 2016.
To promote achievable solutions in the ongoing debate on drug financing, Anthem, Inc. and Eli Lilly and Company are offering two policy proposals, which are detailed in “Discovering New Medicines and New Ways to Pay for Them,” published on the Health Affairs blog.
The first proposal calls for clarifying federal regulation to reduce perceived barriers impeding conversations between health benefit companies and biopharmaceutical companies about drugs prior to the drugs being approved for sale.
The second proposal calls for changes to federal laws and regulations to mitigate the barriers that make it difficult to move toward value-based contracting.
“A change in policies could open the door to new opportunities for hospitalists and their employers to create more high-value care,” says Sam Nussbaum, MD, Anthem clinical advisor. “Today, hospitals are paid for seeing patients. What if hospitals participated in a value-based arrangement with manufacturers and insurers that included treating patients with a specific condition with a new therapy proven to be more effective in producing better health outcomes, including keeping patients out of the hospital?”
Reference
- Nussbaum S, Ricks D. Discovering new medicines and new ways to pay for them. Health Policy Lab. Available at: http://healthaffairs.org/blog/2016/01/29/discovering-new-medicines-and-new-ways-to-pay-for-them/. Accessed February 15, 2016.
To promote achievable solutions in the ongoing debate on drug financing, Anthem, Inc. and Eli Lilly and Company are offering two policy proposals, which are detailed in “Discovering New Medicines and New Ways to Pay for Them,” published on the Health Affairs blog.
The first proposal calls for clarifying federal regulation to reduce perceived barriers impeding conversations between health benefit companies and biopharmaceutical companies about drugs prior to the drugs being approved for sale.
The second proposal calls for changes to federal laws and regulations to mitigate the barriers that make it difficult to move toward value-based contracting.
“A change in policies could open the door to new opportunities for hospitalists and their employers to create more high-value care,” says Sam Nussbaum, MD, Anthem clinical advisor. “Today, hospitals are paid for seeing patients. What if hospitals participated in a value-based arrangement with manufacturers and insurers that included treating patients with a specific condition with a new therapy proven to be more effective in producing better health outcomes, including keeping patients out of the hospital?”
Reference
- Nussbaum S, Ricks D. Discovering new medicines and new ways to pay for them. Health Policy Lab. Available at: http://healthaffairs.org/blog/2016/01/29/discovering-new-medicines-and-new-ways-to-pay-for-them/. Accessed February 15, 2016.
Video Feedback Can Be a Helpful Tool for QI, Patient Safety
Procedures are the most expensive item in healthcare, but tremendous variation remains in quality.
“In part that’ s because we have weak systems of peer support and in part because medicine sanctions a physician to do procedures, and then for the next 40 or 50 years, a surgeon can receive no input and not change their technique even though the field changes,” says Martin Makary, MD, MPH, professor of surgery and health policy and management at Johns Hopkins University in Baltimore.
Video could be used to address this, he suggests in an editorial called “Video Transparency: A Powerful Tool for Patient Safety and Quality Improvement” in the January 2016 BMJ Quality & Safety.
“In areas of excellence outside of medicine—football, aviation—they use video and video feedback for educational purposes. In healthcare, we can also use video to learn,” he says. “In surgical care, we can actually predict outcomes based on independent review of procedure video, but we just choose not to record videos because we don’ t have the infrastructure set up to provide feedback.”
When it has been done, he says, it’ s been received with enthusiasm. This doesn’ t mean cameras in primary-care clinics monitoring physicians.
“We’ re talking about the video-based procedures being recorded, not being erased with the next procedure that’ s done,” he says. “In the past, we couldn’ t do this with videotapes, but now with the capacity of memory and video data storage, there’ s an opportunity to leave the ‘ record’ button on on the video-based procedures that are already taking place.”
Reference
- Joo S, Xu T, Makary MA. Video transparency: a powerful tool for patient safety and quality improvement [published online ahead of print January 12, 2016]. BMJ Qual Saf,doi:10.1136/bmjqs-2015-005058.
Procedures are the most expensive item in healthcare, but tremendous variation remains in quality.
“In part that’ s because we have weak systems of peer support and in part because medicine sanctions a physician to do procedures, and then for the next 40 or 50 years, a surgeon can receive no input and not change their technique even though the field changes,” says Martin Makary, MD, MPH, professor of surgery and health policy and management at Johns Hopkins University in Baltimore.
Video could be used to address this, he suggests in an editorial called “Video Transparency: A Powerful Tool for Patient Safety and Quality Improvement” in the January 2016 BMJ Quality & Safety.
“In areas of excellence outside of medicine—football, aviation—they use video and video feedback for educational purposes. In healthcare, we can also use video to learn,” he says. “In surgical care, we can actually predict outcomes based on independent review of procedure video, but we just choose not to record videos because we don’ t have the infrastructure set up to provide feedback.”
When it has been done, he says, it’ s been received with enthusiasm. This doesn’ t mean cameras in primary-care clinics monitoring physicians.
“We’ re talking about the video-based procedures being recorded, not being erased with the next procedure that’ s done,” he says. “In the past, we couldn’ t do this with videotapes, but now with the capacity of memory and video data storage, there’ s an opportunity to leave the ‘ record’ button on on the video-based procedures that are already taking place.”
Reference
- Joo S, Xu T, Makary MA. Video transparency: a powerful tool for patient safety and quality improvement [published online ahead of print January 12, 2016]. BMJ Qual Saf,doi:10.1136/bmjqs-2015-005058.
Procedures are the most expensive item in healthcare, but tremendous variation remains in quality.
“In part that’ s because we have weak systems of peer support and in part because medicine sanctions a physician to do procedures, and then for the next 40 or 50 years, a surgeon can receive no input and not change their technique even though the field changes,” says Martin Makary, MD, MPH, professor of surgery and health policy and management at Johns Hopkins University in Baltimore.
Video could be used to address this, he suggests in an editorial called “Video Transparency: A Powerful Tool for Patient Safety and Quality Improvement” in the January 2016 BMJ Quality & Safety.
“In areas of excellence outside of medicine—football, aviation—they use video and video feedback for educational purposes. In healthcare, we can also use video to learn,” he says. “In surgical care, we can actually predict outcomes based on independent review of procedure video, but we just choose not to record videos because we don’ t have the infrastructure set up to provide feedback.”
When it has been done, he says, it’ s been received with enthusiasm. This doesn’ t mean cameras in primary-care clinics monitoring physicians.
“We’ re talking about the video-based procedures being recorded, not being erased with the next procedure that’ s done,” he says. “In the past, we couldn’ t do this with videotapes, but now with the capacity of memory and video data storage, there’ s an opportunity to leave the ‘ record’ button on on the video-based procedures that are already taking place.”
Reference
- Joo S, Xu T, Makary MA. Video transparency: a powerful tool for patient safety and quality improvement [published online ahead of print January 12, 2016]. BMJ Qual Saf,doi:10.1136/bmjqs-2015-005058.
FDA authorizes first commercial Zika test
Photo by Juan D. Alfonso
The US Food and Drug Administration (FDA) has granted Emergency Use Authorization (EUA) for another test designed to detect Zika virus infection.
The test, Zika Virus RNA Qualitative Real-Time RT-PCR test (Zika RT-PCR test), is intended for the qualitative detection of RNA from the Zika virus in human serum specimens from patients meeting criteria for testing outlined by the Centers for Disease Control and Prevention (CDC).
The Zika RT-PCR test is the first test from a commercial laboratory provider to be granted an EUA for testing patients for Zika virus RNA. The test was developed by Focus Diagnostics, Inc., a subsidiary of Quest Diagnostics.
About the EUA
The Zika RT-PCR test has not been FDA cleared or approved. An EUA allows the use of unapproved medical products or unapproved uses of approved medical products in an emergency.
The products must be used to diagnose, treat, or prevent serious or life-threatening conditions caused by chemical, biological, radiological, or nuclear threat agents, when there are no adequate alternatives.
The FDA issued the EUA for the Zika RT-PCR test based on data submitted by Focus Diagnostics, Inc., and on the US Secretary of Health and Human Services’ (HHS) declaration that circumstances exist to justify the emergency use of in vitro diagnostic tests for the detection of Zika virus and/or diagnosis of Zika virus infection.
This EUA will terminate when the HHS Secretary’s declaration terminates, unless the FDA revokes it sooner.
Until now, the only Zika tests authorized by the FDA under EUA were available from the CDC and were only used in qualified laboratories designated by the CDC. These are the Trioplex Real-time RT-PCR Assay and the Zika IgM Antibody Capture Enzyme-Linked Immunosorbent Assay (Zika MAC-ELISA).
About the test
Quest Diagnostics plans to make the Zika RT-PCR test broadly available for patient testing early in the week of May 2.
The Zika RT-PCR test is intended for use by clinical laboratory personnel qualified by state and federal regulations who have received specific training on the use of the test in qualified laboratories designated by Focus Diagnostics, Inc., and certified under the Clinical Laboratory Improvement Amendments of 1988 (CLIA) to perform high-complexity tests.
The test can potentially be performed at any CLIA high-complexity laboratory in the Quest Diagnostics network, which includes several dozen CLIA high-complexity labs in the US, including in Toa Baja, Puerto Rico.
Within the US, positive results of this test must be reported to the CDC.
The CDC recommends RT-PCR testing for Zika infection during approximately the first 7 days of the onset of symptoms for certain patients, including:
- Individuals with symptoms suggestive of Zika infection who have traveled within the last 2 weeks to an area with ongoing transmission
- Asymptomatic pregnant women with a history of residence in or travel to areas of active Zika infection
- Asymptomatic pregnant women whose male sexual partners have traveled to or lived in an area of active Zika infection
- Infants born to mothers who live in or traveled to areas with Zika virus transmission during their pregnancy, including both molecular and serologic testing of infants who are being evaluated for evidence of a congenital Zika virus infection.
A negative test result does not preclude infection, and additional serological testing to evaluate the body’s immune response to infection may be considered within 2 to 12 weeks after symptom onset.
For more information on the Zika RT-PCR test, visit www.QuestDiagnostics.com/Zika. 
Photo by Juan D. Alfonso
The US Food and Drug Administration (FDA) has granted Emergency Use Authorization (EUA) for another test designed to detect Zika virus infection.
The test, Zika Virus RNA Qualitative Real-Time RT-PCR test (Zika RT-PCR test), is intended for the qualitative detection of RNA from the Zika virus in human serum specimens from patients meeting criteria for testing outlined by the Centers for Disease Control and Prevention (CDC).
The Zika RT-PCR test is the first test from a commercial laboratory provider to be granted an EUA for testing patients for Zika virus RNA. The test was developed by Focus Diagnostics, Inc., a subsidiary of Quest Diagnostics.
About the EUA
The Zika RT-PCR test has not been FDA cleared or approved. An EUA allows the use of unapproved medical products or unapproved uses of approved medical products in an emergency.
The products must be used to diagnose, treat, or prevent serious or life-threatening conditions caused by chemical, biological, radiological, or nuclear threat agents, when there are no adequate alternatives.
The FDA issued the EUA for the Zika RT-PCR test based on data submitted by Focus Diagnostics, Inc., and on the US Secretary of Health and Human Services’ (HHS) declaration that circumstances exist to justify the emergency use of in vitro diagnostic tests for the detection of Zika virus and/or diagnosis of Zika virus infection.
This EUA will terminate when the HHS Secretary’s declaration terminates, unless the FDA revokes it sooner.
Until now, the only Zika tests authorized by the FDA under EUA were available from the CDC and were only used in qualified laboratories designated by the CDC. These are the Trioplex Real-time RT-PCR Assay and the Zika IgM Antibody Capture Enzyme-Linked Immunosorbent Assay (Zika MAC-ELISA).
About the test
Quest Diagnostics plans to make the Zika RT-PCR test broadly available for patient testing early in the week of May 2.
The Zika RT-PCR test is intended for use by clinical laboratory personnel qualified by state and federal regulations who have received specific training on the use of the test in qualified laboratories designated by Focus Diagnostics, Inc., and certified under the Clinical Laboratory Improvement Amendments of 1988 (CLIA) to perform high-complexity tests.
The test can potentially be performed at any CLIA high-complexity laboratory in the Quest Diagnostics network, which includes several dozen CLIA high-complexity labs in the US, including in Toa Baja, Puerto Rico.
Within the US, positive results of this test must be reported to the CDC.
The CDC recommends RT-PCR testing for Zika infection during approximately the first 7 days of the onset of symptoms for certain patients, including:
- Individuals with symptoms suggestive of Zika infection who have traveled within the last 2 weeks to an area with ongoing transmission
- Asymptomatic pregnant women with a history of residence in or travel to areas of active Zika infection
- Asymptomatic pregnant women whose male sexual partners have traveled to or lived in an area of active Zika infection
- Infants born to mothers who live in or traveled to areas with Zika virus transmission during their pregnancy, including both molecular and serologic testing of infants who are being evaluated for evidence of a congenital Zika virus infection.
A negative test result does not preclude infection, and additional serological testing to evaluate the body’s immune response to infection may be considered within 2 to 12 weeks after symptom onset.
For more information on the Zika RT-PCR test, visit www.QuestDiagnostics.com/Zika.
Photo by Juan D. Alfonso
The US Food and Drug Administration (FDA) has granted Emergency Use Authorization (EUA) for another test designed to detect Zika virus infection.
The test, Zika Virus RNA Qualitative Real-Time RT-PCR test (Zika RT-PCR test), is intended for the qualitative detection of RNA from the Zika virus in human serum specimens from patients meeting criteria for testing outlined by the Centers for Disease Control and Prevention (CDC).
The Zika RT-PCR test is the first test from a commercial laboratory provider to be granted an EUA for testing patients for Zika virus RNA. The test was developed by Focus Diagnostics, Inc., a subsidiary of Quest Diagnostics.
About the EUA
The Zika RT-PCR test has not been FDA cleared or approved. An EUA allows the use of unapproved medical products or unapproved uses of approved medical products in an emergency.
The products must be used to diagnose, treat, or prevent serious or life-threatening conditions caused by chemical, biological, radiological, or nuclear threat agents, when there are no adequate alternatives.
The FDA issued the EUA for the Zika RT-PCR test based on data submitted by Focus Diagnostics, Inc., and on the US Secretary of Health and Human Services’ (HHS) declaration that circumstances exist to justify the emergency use of in vitro diagnostic tests for the detection of Zika virus and/or diagnosis of Zika virus infection.
This EUA will terminate when the HHS Secretary’s declaration terminates, unless the FDA revokes it sooner.
Until now, the only Zika tests authorized by the FDA under EUA were available from the CDC and were only used in qualified laboratories designated by the CDC. These are the Trioplex Real-time RT-PCR Assay and the Zika IgM Antibody Capture Enzyme-Linked Immunosorbent Assay (Zika MAC-ELISA).
About the test
Quest Diagnostics plans to make the Zika RT-PCR test broadly available for patient testing early in the week of May 2.
The Zika RT-PCR test is intended for use by clinical laboratory personnel qualified by state and federal regulations who have received specific training on the use of the test in qualified laboratories designated by Focus Diagnostics, Inc., and certified under the Clinical Laboratory Improvement Amendments of 1988 (CLIA) to perform high-complexity tests.
The test can potentially be performed at any CLIA high-complexity laboratory in the Quest Diagnostics network, which includes several dozen CLIA high-complexity labs in the US, including in Toa Baja, Puerto Rico.
Within the US, positive results of this test must be reported to the CDC.
The CDC recommends RT-PCR testing for Zika infection during approximately the first 7 days of the onset of symptoms for certain patients, including:
- Individuals with symptoms suggestive of Zika infection who have traveled within the last 2 weeks to an area with ongoing transmission
- Asymptomatic pregnant women with a history of residence in or travel to areas of active Zika infection
- Asymptomatic pregnant women whose male sexual partners have traveled to or lived in an area of active Zika infection
- Infants born to mothers who live in or traveled to areas with Zika virus transmission during their pregnancy, including both molecular and serologic testing of infants who are being evaluated for evidence of a congenital Zika virus infection.
A negative test result does not preclude infection, and additional serological testing to evaluate the body’s immune response to infection may be considered within 2 to 12 weeks after symptom onset.
For more information on the Zika RT-PCR test, visit www.QuestDiagnostics.com/Zika.
Functional Status and Readmission
A continuing focus on readmission prevention as a means to improve quality and reduce waste and costs has led to abundant research on the identification of factors that put older patients at risk for readmission.[1, 2] Recently, research has focused on the development of prediction tools that are based on information from electronic health records (EHR) and that enable early, at‐admission, identification of patients at high risk for readmission.[3, 4, 5] Through such identification, patients are already targeted for inclusion in readmission‐prevention interventions early in their hospital stay.[6, 7] Yet, the ability to rely on these early‐identification tools is contingent on the stability of risk during the hospital stay. Of the in‐hospital factors that can affect readmission, change in functioning has been identified as a potentially major contributor, especially in older patients.[8]
Older adults' deterioration in functioning is a common, troubling phenomenon. Approximately 20% of patients older than 70 years and hospitalized for a medical illness deteriorate in functioning during the hospitalization.[9] Recent evidence points to the contribution of functioning to 30‐day readmission risk, with studies showing that pre‐ or posthospitalization functional impairment is associated with a 1.5 to 3 times greater likelihood of readmission.[10, 11, 12, 13] Whether in‐hospital changes in functioning add to patients' baseline risk, however, is unknown. The only readmission study that examined functional decline during hospitalization was a retrospective study performed in a population of older adults receiving rehabilitation services and therefore may not be generalizable to acutely hospitalized adults.[14] To fill the current knowledge gap, we examined whether in‐hospital functional decline significantly contributes to at‐admission readmission risk factors in its ability to accurately identify high readmission risk in older adults hospitalized in internal medicine units.
METHODS
Design and Participants
Previously collected data from a prospective cohort study, Hospitalization Process Effects on Functional Outcomes and Recovery (HoPE‐FOR), designed to assess the effect of hospitalization‐care processes on functional outcomes in older adults, were combined with EHR data. The population considered for recruitment to HoPE‐FOR comprised older patients (aged 70 years) admitted during the period 2009 to 2011 to 1 of the 8 internal medicine wards at 2 tertiary medical centers in Israel. Patients recruited for the study had an unplanned admission, and were not completely dependent in their basic functions. Cognitively impaired patients (scoring 5 or less on the Short Portable Mental Status Questionnaire [SPMSQ][15]) who had no available caregiver and patients admitted for stroke, coma, or respiratory failure requiring mechanical ventilation were not eligible for participation in the study. The recruitment process for the study is fully described elsewhere.[16, 17]
At‐admission functional, cognitive, mental, and nutritional status were assessed during the first 48 hours of hospitalization. Additional functional assessment was performed at discharge. Data on severity of acute disease, length of stay (LOS), and mortality were collected from the hospitals' EHR. Preadmission healthcare utilization and readmission information were retrieved from the EHR database of Clalit Health Services (Clalit), a large not‐for‐profit integrated healthcare provider and insurer in Israel; more than 80% of the HoPE‐FOR population were Clalit members.
Of the 969 community‐dwelling participants recruited to the HoPE‐FOR study, a subset of 758 (78%) members of Clalit was used for the current study, as data on readmissions to any general hospital were accurately and readily available from Clalit's EHR system.[18] Of those, we excluded 199 due to the following reasons: 13 (2%) died during the hospitalization, 46 (6%) transferred to another ward, 16 (2%) were discharged to a postacute care facility, and 124 (16%) dropped‐out from the HoPE‐FOR study during the hospitalization (due to unavailability because of intensive tests or procedures[16]) or had missing data on the main variables, leaving a final sample of 559 participants. The admission functional, cognitive, and clinical status; LOS; and readmission rates of the participants who dropped‐out were comparable to those of participants retained in the final sample except for albumin levels and age (see Supporting Information, Appendix A, in the online version of this article). The study was approved by the institutional reviews boards of each of the hospitals, Clalit, and the Israeli Ministry of Health.
Variables and Instruments
Outcome Measure
Readmission was defined as any unplanned hospitalization at any of 27 general hospitals in Israel, occurring within 30 days of discharge from the index hospitalization.
Predictors
We collected information on baseline and in‐hospital characteristics. Baseline characteristics included chronic clinical conditions known as risk factors for readmission; number of different drugs as classified by the fifth level of the Anatomical Therapeutic Chemical classification system; number of hospitalizations in the year preceding the index hospitalization; clinical, functional, cognitive, mental, and nutritional status at admission; and sociodemographic characteristics.
Chronic conditions included: congestive heart failure (HF), chronic renal failure (CRF), chronic obstructive pulmonary disease (COPD), diabetes mellitus, ischemic heart disease, arrhythmia, malignancy, and asthma, and were retrieved from the Clalit's EHR data warehouse.[19] Severity of acute disease was assessed with the Acute Physiology and Chronic Health Evaluation.[20] Functional status was measured as self‐reported independence in performing basic activities of daily living (ADL),[21] using the modified Barthel Index (mBI).[22] The mBI consists of 10 items including personal hygiene, bathing, eating, toileting, dressing, chair/bed transfers, ambulation, stair climbing, and bowel and bladder control. Each item is ranked on 5‐point scale, indicating the amount of assistance required in functional independence in each task. The scores are summarized into a total score ranging from 0 (totally dependent) to 100 (fully independent).
Cognitive status was assessed using the SPMSQ.[15] Mental status was assessed based on self‐report of depressive and anxiety symptoms using the 10‐item Tucker's short Zung Instrument (TSZI)[23] and the 10‐item Anxiety Symptoms Questionnaire Short Anxiety Screening Test (SAST),[24] respectively. Both the TSZI and the SAST were validated in Hebrew as screening tools in older adults.[24, 25]
Assessment of nutritional status included malnutrition risk (Malnutrition Universal Screening Tool [MUST]) and admission serum albumin level (g/dL). MUST provides classification into 3 malnutrition risk groups: low (being overweight or obese, with no loss of weight or loss of less than 5% of the weight and without expectation of fasting), medium (normal body mass index [BMI] or weight loss of 510%), and high (normal BMI and inadequate weight loss or malnutrition by BMI and/or 10% weight loss and/or expectations of fasting).[26] Classification of BMI in the current study was according to thresholds for older adults.[27]
In‐hospital risk factors include LOS, a well‐known risk factor of readmission[28] and ADL decline during the index hospitalization. ADL decline was defined as the change in mBI score, calculated by subtracting the discharge score from the at‐admission score and transforming negative scores (functional improvement) to 0.
Statistical Analysis
The relationship between each of the study variables and readmission was examined using 2 tests for categorical variables and t tests for continuous variables. We took a conservative approach, and used a 0.10 threshold level in univariate analysis to decide on variable inclusion in the multivariate models. To examine the at‐admission readmission risk, baseline multivariate logistic regression was modeled with all pre‐ or at‐admission variables that were associated with readmission risk in the univariate analysis. To capture the contribution of in‐hospital data on readmission risk, the at‐discharge multivariate logistic regression was constructed by adding in‐hospital risk factors to the baseline model. To capture the odds of clinically significant functional decline that is equivalent to functional loss in 1 ADL task,[29] we divided the original mBI decline score by 10. Adjusted odds ratios (OR) and 95% confidence intervals (CI) were estimated for each predictor. We used the bootstrapping technique[30] (100 bootstrap subsamples) to test the ADL parameter estimates of both models. The calibration of both models was determined by the Hosmer‐Lemeshow test. The discrimination of the baseline model was compared with that of the at‐discharge model using the C statistic.[31] We derived the prediction score for each patient by adding the coefficients of all applicable factors from the baseline and at‐discharge multivariate logistic regression models and categorized patients' risk of readmission into 5 groups: very low (019th centile), low (2039th centile), medium (4059th percentile), high (6079th percentile), very high (8099th percentile) and extremely high (9099th percentile). We also examined whether when comparing the at‐admission versus discharge model, new patients are identified as high risk (top 10% and 20% of risk score), as these are the patients who are targeted for intervention. Analysis was performed using IBM SPSS Statistical package version 21.0 (IBM, Armonk, NY) and Stata version 10 (StataCorp, College Station, TX).
RESULTS
Table 1 presents the baseline and in‐hospital characteristics of participants with and without readmissions. The sample includes 559 community‐dwelling older adults (49% men) aged 70 to 98 years (mean age 79 years). One‐third (36%) of the participants were fully independent in ADL at admission. Eighty‐five (15.2%) patients were readmitted within 30 days of discharge. Participants who were readmitted had lower at‐admission ADL levels; had 1 more hospitalization in the previous year; and were more likely to have HF, CRF, arrhythmia, and malignancy, and to be at risk of malnutrition, than those who were not readmitted. Participants who were readmitted were more likely to suffer from functional decline during the index hospitalization. No significant differences were found in living arrangements or in at‐admission mental and cognitive status.
| Characteristic | Entire Cohort, N = 559 | No Readmission, n = 474 | 30‐Day Readmission, n = 85 | P Value |
|---|---|---|---|---|
| ||||
| Baseline characteristics | ||||
| Sociodemographic characteristics | ||||
| Age, y, mean SD | 78.8 5.6 | 78.7 5.6 | 79.7 6.6 | 0.19 |
| Male, n (%) | 274 (49.0) | 222 (46.8) | 52 (61.2) | 0.015 |
| Living alone, n (%) | 167 (29.9) | 148 (31.2) | 19 (22.4) | 0.10 |
| Education, y, mean SD | 9.6 5.0 | 9.8 4.9 | 8.7 5.3 | 0.074 |
| Chronic condition, n (%) | ||||
| Congestive heart failure | 169 (30.2) | 130 (27.4) | 39 (45.9) | 0.001 |
| Chronic renal failure | 188 (33.6) | 138 (29.1) | 50 (58.8) | 0.001 |
| Chronic obstructive pulmonary disease | 93 (16.6) | 77 (16.2) | 16 (18.8) | 0.56 |
| Diabetes mellitus | 249 (44.5) | 212 (44.7) | 37 (43.5) | 0.84 |
| Ischemic heart disease | 353 (63.1) | 295 (62.2) | 58 (68.2) | 0.29 |
| Arrhythmia | 242 (43.3) | 192 (40.5) | 50 (58.8) | 0.002 |
| Malignancy | 176 (31.5) | 132 (27.8) | 44 (51.8) | 0.001 |
| Asthma | 72 (12.9) | 61 (12.9) | 11 (12.9) | 0.99 |
| No. of medications prescribed year before index hospitalization, mean SD | 12.1 5.7 | 11.9 5.5 | 13.7 6.3 | 0.007 |
| Prior hospitalizations | ||||
| No. of hospitalizations the year before index hospitalization, mean SD | 1.2 1.6 | 1.00 1.3 | 2.20 2.2 | 0.001 |
| At‐admission health status | ||||
| APACHE II (071), mean SD | 11.5 4.4 | 11.2 4.2 | 12.9 4.6 | 0.003 |
| ADL (mBI) (0100), mean SD | 76.9 28.9 | 78.4 28.4 | 68.7 30.4 | 0.004 |
| Cognitive impairment (SPMSQ 5), n (%) | 8.1 2.2 | 8.1 2.2 | 7.9 2.2 | 0.32 |
| Depression symptoms (TZI 70), n (%) | 106 (19.0) | 89 (18.8) | 17 (20.0) | 0.85 |
| Anxiety symptoms (SAST 24), n (%) | 138 (24.7) | 115 (24.3) | 23 (27.1) | 0.63 |
| Risk of malnutrition (MUST), n (%) | 0.002 | |||
| Low risk | 177 (31.7) | 163 (34.4) | 14 (16.5) | |
| Moderate risk | 169 (30.2) | 142 (30.0) | 27 (31.8) | |
| High risk | 213 (38.1) | 169 (35.7) | 44 (51.8) | |
| Serum albumin (g/dL) (1.54.9), mean SD | 3.4 0.5 | 3.3 0.5 | 3.0 0.5 | 0.001 |
| In‐hospital risk factors | ||||
| ADL decline (mBI) (0100), mean SD | 3.2 8.7 | 2.6 7.4 | 7.0 13.2 | 0.003 |
| Length of stay (130), mean SD | 5.7 3.7 | 5.6 3.4 | 6.7 5.1 | 0.055 |
Multivariate analysis (Table 2) shows that higher at‐admission mBI score was associated with lower odds of readmission (OR for 1‐unit increase: 0.99, 95% CI: 0.98‐0.99). Other predictors of higher readmission risk were: high or medium at‐admission risk of malnutrition, malignancy, CRF, each additional hospitalization during the previous year, and lower albumin levels. Severity of illness and demographic characteristics were not significantly associated with readmission.
| Characteristic | Baseline Model | Discharge Model | ||
|---|---|---|---|---|
| OR (95% CI) | P Value | OR (95% CI) | P Value | |
| ||||
| Male | 1.57 (0.892.77) | 0.12 | 1.75 (0.983.15) | 0.06 |
| Living alone | 1.04 (0.551.95) | 0.91 | 1.06 (0.562.01) | 0.86 |
| Education (years) | 0.98 (0.921.03) | 0.33 | 0.98 (0.931.03) | 0.38 |
| Chronic conditions | ||||
| Chronic renal failure | 2.54 (1.394.66) | 0.003 | 2.51 (1.364.64) | 0.003 |
| Malignancy | 2.45 (1.384.32) | 0.002 | 2.35 (1.324.18) | 0.004 |
| Congestive heart failure | 1.84 (1.983.46) | 0.06 | 1.83 (0.973.46) | 0.06 |
| Arrhythmia | 1.64 (0.922.93) | 0.10 | 1.66 (0.953.00) | 0.09 |
| No. of medications prescribed year before index admission | 0.98 (0.931.04) | 0.50 | 0.98 (0.931.04) | 0.51 |
| APACHE II | 0.98 (0.921.04) | 0.49 | 0.97 (0.911.04) | 0.36 |
| No. of hospitalizations year before index admission | 1.27 (1.091.48) | 0.002 | 1.26 (1.081.46) | 0.004 |
| Risk of malnutrition (MUST) | ||||
| Low | Ref | Ref | ||
| Moderate | 2.21 (1.054.66) | 0.042 | 2.10 (0.984.46) | 0.055 |
| High | 3.01 (1.486.12) | 0.002 | 2.88 (1.415.91) | 0.004 |
| Serum albumin (g/dL) | 0.41 (0.240.69) | 0.001 | 0.50 (0.300.83) | 0.03 |
| At‐admission ADL | 0.99 (0.980.99) | 0.037 | 0.99 (0.980.99) | 0.025 |
| In‐hospital ADL decline* | 1.32 (1.021.72) | 0.034 | ||
| Length of stay | 1.02 (0.951.09) | 0.66 | ||
| Model fit | C statistic = 0.81 | C statistic = 0.81 | ||
The at‐discharge model that combined the baseline model and in‐hospital risk factors showed that in‐hospital (from admission to discharge) ADL decline was significantly associated with readmission, as a 10‐point decrease in the mBI from admission to discharge was associated with 1.32 (95% CI: 1.02‐1.72) greater odds of readmission. LOS was not significantly associated with readmission, after controlling for baseline health status and in‐hospital ADL decline. All other predictors did not markedly change from the baseline to the at‐discharge model either in significance levels or in magnitude.
The discriminatory power of the baseline model was good (C statistic=0.81). Adding ADL decline and LOS did not change the discriminatory power of the model (C statistic=0.81). The P value of the Hosmer‐Lemeshow test equaled 0.67 for the baseline model and 0.48 for the at‐discharge model, indicating good calibration of both models. The P values for the regression coefficients of bootstrap inference assessing the relationship between the at‐admission and in‐hospital ADL decline odds of readmission remained stable (P 0.05).
Classification of patients into risk categories by the baseline model and the discharge model (Table 3) shows that identifying patients in the top‐tier category (20th highest percentile) according to information available before or at admission does not detect 6/111 (5.4%) of patients who would have been categorized as highest‐risk if information on ADL decline had been incorporated in the predictive algorithm. Additional partitioning of the top fifth group into 2 tiers (8089th and 9099th percentiles) shows that selection of patients in the top 10% of the baseline risk score would not have detected 7/55 (12.7%) patients who would have been identified as high risk at discharge (data not shown).
| Discharge Model Risk Group | |||||||
|---|---|---|---|---|---|---|---|
| 0 | 1 | 2 | 3 | 4 | Total No. | ||
| |||||||
| Baseline model risk group | 0 | 99 (89.2) | 11 (9.8) | 0 | 1 (0.9) | 0 | 111 |
| 1 | 12 (10.8) | 88 (78.6) | 12 (10.7) | 0 | 0 | 112 | |
| 2 | 0 | 13 (11.6) | 90 (80.4) | 8 (7.1) | 1 (0.9) | 112 | |
| 3 | 0 | 0 | 10 (8.9) | 98 (86.7) | 5 (4.5) | 113 | |
| 4 | 0 | 0 | 0 | 6 (5.3) | 105 (94.6) | 111 | |
| Total no. | 111 | 112 | 112 | 113 | 111 | ||
DISCUSSION
To our knowledge, ours is the first empirical test of the simultaneous role of functioning along the hospitalization course in explaining readmission risk.[8] Our results show that at‐admission lower functional status and in‐hospital functional decline are significant predictors of early unplanned readmission in older adults, beyond other well‐known risk factors.
The major purpose of this study was to examine whether at‐admission data can be used to detect high‐risk patients for potential inclusion in readmission prevention interventions, or whether changes in ADL occurring during the index hospitalization could affect patients' risk, therefore necessitating an additional assessment at discharge. Our results show that some patients would not have been detected at admission, as their in‐hospital ADL decline affects their at‐discharge risk. Nonetheless, this is a small group (only 5% of patients if a targeting threshold of the highest 20% risk is used). Our findings also show that information on ADL decline during the index hospitalization does not contribute to the accuracy of readmission‐risk prediction in a model that utilizes data on prior hospitalizations, baseline nutritional and functional status, and chronic morbidity (CRF and malignancy). Our results are consistent with previous studies showing the association between baseline,[11, 13, 32] or at‐admission[13] functional status and readmission. However, these studies did not analyze the related contribution of in‐hospital functioning to readmission risk, which was recently suggested as a feature that may significantly affect readmission risk, especially in older patients.[8]
Our findings are also congruent with those of a study in which LOS was not significantly associated with readmission in an elderly population.[33] Our null finding can be explained by the broad set of pre‐ and at‐admission variables, such as nutritional and functional status as well as in‐hospital functional decline, included in our model, making LOS a less significant contributor than in more parsimonious models.[28]
Our results also show that malnutrition contributes to readmission risk beyond other well‐known risk factors. Previous studies showed that malnutrition in the elderly is associated with early readmission.[11, 34] These studies, however, did not examine other well‐known risk factors, such as previous hospitalizations, which were tested in our study, precluding identification of the contribution of malnutrition beyond other well‐known risks.
Our findings should be interpreted in light of several limitations. First, the functional, nutritional, and cognitive data were collected from participants' self‐reports, which are prone to recall bias. Nonetheless, self‐report is often used in large‐scale studies, which preclude actual performance measurement.[21] Second, our sample is of adults aged 70 years or older, and may not be representative of the 65 and older population, which is the target population for many readmission reduction interventions.[35] Yet, participants were from a relatively high‐functioning group of patients who were discharged to their homes, thus may resemble the over age 65 years group. Moreover, these inclusion criteria may have affected their readmission rates, which at 15% are lower than the average reported in other older adult populations.[36] Nonetheless, a more heterogenic sample (in terms of baseline functional status) is needed to address the association between in‐hospital functional change and readmissions as well as the discrimination of the model. Third, the attrition rate (16%) might impact the predictive ability of the models, as patients dropped‐out from the study might have had higher in‐hospital deterioration. However, no significant differences between study sample and dropped‐out patients in the wide range of baseline characteristics except for age and baseline albumin levels were found. Fourth, the unique characteristics of the Israeli healthcare system may affect study's generalizability. The high hospital‐bed occupancy rate, stretched to the limit at 99%, which is much higher than in other developed countries,[37] may affect readmission rates and risk. Nonetheless, our findings may be of relevance to other populations and healthcare systems, as variables included in our model have been previously shown to affect readmission risk in other settings,[4, 6] and the percent of in‐hospital ADL decline is similar to that reported by others.[9] Future studies should examine the significance of in‐hospital functioning in other older adult populations, such as greater mix of baseline functioning and myocardial infarction, HF, and COPD patients, that have been emphasized for readmission prevention by the Centers for Medicare and Medicaid Services.
CONCLUSIONS
This study shows that although both functional status and functional decline are significant predictors of readmission, in‐hospital functional decline did not contribute to the discriminative ability of the model, beyond the risk factors known at admission: malnutrition, prior hospitalizations, and being previously diagnosed with CRF or malignancy. These findings call attention to the ability to predict readmission early in the index hospitalization, to enable early intervention in targeted high‐risk patients. Nonetheless, further at‐discharge functional assessment can detect additional patients whose readmission risk changes during the index hospitalization and who should be considered for inclusion in readmission reduction interventions. As suggested in previous prediction models,[3, 38] most of the at‐admission variables examined in this study, including patient‐reported measures such as functioning, are readily available in the EHR or during the at‐admission intake.[39, 40] In settings where these assessments are not routinely performed, their implementation should be considered. These tools could be used to potentially identify patients at high risk of readmission, and accordingly, address physical function as part of routine medical care and during the acute hospitalization, and tailor adequate follow‐up care after discharge.[11]
Disclosures: This work was supported by the Israeli Science Foundation (grant number 565/08); Clalit Health Services(grant number 04‐121/2010); and the Israel National Institute for Health Policy Research (thesis scholarship number 35/2012). The funding agencies had no role in the design and conduct of this study, the analysis or interpretation of the data, or the preparation of the manuscript. The authors report no conflicts of interest.
- , , , , . Determinants of preventable readmissions in the United States: a systematic review. Implement Sci. 2010;5:1–27.
- , , , , , . Risk factors for hospital readmissions in elderly patients: a systematic review. QJM. 2011;104:639–651.
- , , , , , . Predicting 30‐day readmissions with preadmission electronic health record data. Med Care. 2015;53:283–289.
- , , , et al. Electronic medical record‐based multicondition models to predict the risk of 30 day readmission or death among adult medicine patients: validation and comparison to existing models. BMC Med Inform Decis Mak. 2015;15:39.
- , , , et al. An automated model to identify heart failure patients at risk for 30‐day readmission or death using electronic medical record data. Med Care. 2010;48:981–988.
- , , , , , . Development of a predictive model to identify inpatients at risk of re‐admission within 30 days of discharge (PARR‐30). BMJ Open. 2012;2:10.
- , , , et al. So many options, where do we start? An overview of the care transitions literature. J Hosp Med. 2016;11(3):221–230.
- , . Functional status—an important but overlooked variable in the readmissions equation. J Hosp Med. 2014;9:330–331.
- , , , et al. Loss of independence in activities of daily living in older adults hospitalized with medical illnesses: increased vulnerability with age. J Am Geriatr Soc. 2003;51:451–458.
- , , , et al. Hospital readmission among older medical patients in Hong Kong. J R Coll Physicians Lond. 1999;33:153–156.
- , , , . Functional impairment and hospital readmission in Medicare seniors. JAMA Intern Med. 2015;175:559–565.
- , , , , , . Association of impaired functional status at hospital discharge and subsequent rehospitalization. J Hosp Med. 2014;9:277–282.
- , , , et al. Incidence and main factors associated with early unplanned hospital readmission among French medical inpatients aged 75 and over admitted through emergency units. Age Ageing. 2008;37:416–422.
- , , , et al. Predictors of rehospitalization among elderly patients admitted to a rehabilitation hospital: the role of polypharmacy, functional status, and length of stay. J Am Med Dir Assoc. 2013;14:761–767.
- . A short portable mental status questionnaire for the assessment of organic brain deficit in elderly patients. J Am Geriatr Soc. 1975;23:433–441.
- , , , , , . Low mobility during hospitalization and functional decline in older adults. J Am Geriatr Soc. 2011;59:266–273.
- , , , , . Hospital associated functional decline: the role of hospitalization processes beyond individual risk factors. J Am Geriatr Soc. 2015;63:55–62.
- , , , . Health information exchange systems and length of stay in readmissions to a different hospital [published online December 29, 2015]. J Hosp Med. doi: 10.1002/jhm.2535.
- , . Prevalence of selected chronic diseases in Israel. Isr Med Assoc J. 2001;3:404–408.
- , , , . APACHE II: a severity of disease classification system. Crit Care Med. 1985;13:818–829.
- , , , , , . Functional status before hospitalization in acutely ill older adults: validity and clinical importance of retrospective reports. J Am Geriatr Soc. 2000;48:164–169.
- , , . Improving the sensitivity of the Barthel index for stroke rehabilitation. J Clin Epidemiol. 1989;42:703–709.
- , , , . Validation of a brief screening test for depression in the elderly. Age Ageing. 1987;16:139–144.
- , , , . Short Anxiety Screening Test—a brief instrument for detecting anxiety in the elderly. Int J Geriatr Psychiatry. 1999;14:1062–1071.
- , , , . Does the presence of anxiety affect the validity of a screening test for depression in the elderly? Int J Geriatr Psychiatry. 2002;17:309–314.
- . The ‘MUST’ report. Nutritional screening of adults: a multidisciplinary responsibility (executive summary). Available at: http://www.bapen.org.uk/pdfs/must/must_exec_sum.pdf. Accessed July 10, 2015.
- , , , , . Body mass index, weight change, and death in older adults: the systolic hypertension in the elderly program. Am J Epidemiol. 2002;156:132–138.
- , , , , et al. Derivation and validation of an index to predict early death or unplanned readmission after discharge from hospital to the community. CMAJ. 2010;182:551–557.
- , , , , . Variability in measuring (instrumental) activities of daily living functioning and functional decline in hospitalized older medical patients: a systematic review. J Clin Epidemiol. 2011;64:619–627.
- , , , , , . Internal validation of predictive models: efficiency of some procedures for logistic regression analysis. J Clin Epidemiol. 2001;54:774–781.
- , , , et al. Risk prediction models for hospital readmission: a systematic review. JAMA. 2011;306:1688–1698.
- , , , et al. Functional status and hospital readmissions using the medical expenditure panel survey. J Gen Intern Med. 2015;30:965–972.
- , , , . Predicting readmissions: poor performance of the LACE index in an older UK population. Age Ageing. 2012;41:784–789.
- , , , , . Risk factors for 30‐day hospital readmission in patients ≥65 years of age. Proc (Bayl Univ Med Cent). 2008;21:363–372.
- Center for Outcomes Research 360:1418–1428.
- , , , , . Managing the increasing shortage of acute care hospital beds in Israel. J Eval Clin Pract. 2015;21:79–84.
- , , , . Case finding for patients at risk of readmission to hospital: development of algorithm to identify high risk patients. BMJ. 2006;333:327.
- , , . Measuring nutritional risk in hospitals. Clin Epidemiol. 2010;2:209–216.
- , , , , . When do patient‐reported outcome measures inform readmission risk? J Hosp Med. 2015;10:294–300.
A continuing focus on readmission prevention as a means to improve quality and reduce waste and costs has led to abundant research on the identification of factors that put older patients at risk for readmission.[1, 2] Recently, research has focused on the development of prediction tools that are based on information from electronic health records (EHR) and that enable early, at‐admission, identification of patients at high risk for readmission.[3, 4, 5] Through such identification, patients are already targeted for inclusion in readmission‐prevention interventions early in their hospital stay.[6, 7] Yet, the ability to rely on these early‐identification tools is contingent on the stability of risk during the hospital stay. Of the in‐hospital factors that can affect readmission, change in functioning has been identified as a potentially major contributor, especially in older patients.[8]
Older adults' deterioration in functioning is a common, troubling phenomenon. Approximately 20% of patients older than 70 years and hospitalized for a medical illness deteriorate in functioning during the hospitalization.[9] Recent evidence points to the contribution of functioning to 30‐day readmission risk, with studies showing that pre‐ or posthospitalization functional impairment is associated with a 1.5 to 3 times greater likelihood of readmission.[10, 11, 12, 13] Whether in‐hospital changes in functioning add to patients' baseline risk, however, is unknown. The only readmission study that examined functional decline during hospitalization was a retrospective study performed in a population of older adults receiving rehabilitation services and therefore may not be generalizable to acutely hospitalized adults.[14] To fill the current knowledge gap, we examined whether in‐hospital functional decline significantly contributes to at‐admission readmission risk factors in its ability to accurately identify high readmission risk in older adults hospitalized in internal medicine units.
METHODS
Design and Participants
Previously collected data from a prospective cohort study, Hospitalization Process Effects on Functional Outcomes and Recovery (HoPE‐FOR), designed to assess the effect of hospitalization‐care processes on functional outcomes in older adults, were combined with EHR data. The population considered for recruitment to HoPE‐FOR comprised older patients (aged 70 years) admitted during the period 2009 to 2011 to 1 of the 8 internal medicine wards at 2 tertiary medical centers in Israel. Patients recruited for the study had an unplanned admission, and were not completely dependent in their basic functions. Cognitively impaired patients (scoring 5 or less on the Short Portable Mental Status Questionnaire [SPMSQ][15]) who had no available caregiver and patients admitted for stroke, coma, or respiratory failure requiring mechanical ventilation were not eligible for participation in the study. The recruitment process for the study is fully described elsewhere.[16, 17]
At‐admission functional, cognitive, mental, and nutritional status were assessed during the first 48 hours of hospitalization. Additional functional assessment was performed at discharge. Data on severity of acute disease, length of stay (LOS), and mortality were collected from the hospitals' EHR. Preadmission healthcare utilization and readmission information were retrieved from the EHR database of Clalit Health Services (Clalit), a large not‐for‐profit integrated healthcare provider and insurer in Israel; more than 80% of the HoPE‐FOR population were Clalit members.
Of the 969 community‐dwelling participants recruited to the HoPE‐FOR study, a subset of 758 (78%) members of Clalit was used for the current study, as data on readmissions to any general hospital were accurately and readily available from Clalit's EHR system.[18] Of those, we excluded 199 due to the following reasons: 13 (2%) died during the hospitalization, 46 (6%) transferred to another ward, 16 (2%) were discharged to a postacute care facility, and 124 (16%) dropped‐out from the HoPE‐FOR study during the hospitalization (due to unavailability because of intensive tests or procedures[16]) or had missing data on the main variables, leaving a final sample of 559 participants. The admission functional, cognitive, and clinical status; LOS; and readmission rates of the participants who dropped‐out were comparable to those of participants retained in the final sample except for albumin levels and age (see Supporting Information, Appendix A, in the online version of this article). The study was approved by the institutional reviews boards of each of the hospitals, Clalit, and the Israeli Ministry of Health.
Variables and Instruments
Outcome Measure
Readmission was defined as any unplanned hospitalization at any of 27 general hospitals in Israel, occurring within 30 days of discharge from the index hospitalization.
Predictors
We collected information on baseline and in‐hospital characteristics. Baseline characteristics included chronic clinical conditions known as risk factors for readmission; number of different drugs as classified by the fifth level of the Anatomical Therapeutic Chemical classification system; number of hospitalizations in the year preceding the index hospitalization; clinical, functional, cognitive, mental, and nutritional status at admission; and sociodemographic characteristics.
Chronic conditions included: congestive heart failure (HF), chronic renal failure (CRF), chronic obstructive pulmonary disease (COPD), diabetes mellitus, ischemic heart disease, arrhythmia, malignancy, and asthma, and were retrieved from the Clalit's EHR data warehouse.[19] Severity of acute disease was assessed with the Acute Physiology and Chronic Health Evaluation.[20] Functional status was measured as self‐reported independence in performing basic activities of daily living (ADL),[21] using the modified Barthel Index (mBI).[22] The mBI consists of 10 items including personal hygiene, bathing, eating, toileting, dressing, chair/bed transfers, ambulation, stair climbing, and bowel and bladder control. Each item is ranked on 5‐point scale, indicating the amount of assistance required in functional independence in each task. The scores are summarized into a total score ranging from 0 (totally dependent) to 100 (fully independent).
Cognitive status was assessed using the SPMSQ.[15] Mental status was assessed based on self‐report of depressive and anxiety symptoms using the 10‐item Tucker's short Zung Instrument (TSZI)[23] and the 10‐item Anxiety Symptoms Questionnaire Short Anxiety Screening Test (SAST),[24] respectively. Both the TSZI and the SAST were validated in Hebrew as screening tools in older adults.[24, 25]
Assessment of nutritional status included malnutrition risk (Malnutrition Universal Screening Tool [MUST]) and admission serum albumin level (g/dL). MUST provides classification into 3 malnutrition risk groups: low (being overweight or obese, with no loss of weight or loss of less than 5% of the weight and without expectation of fasting), medium (normal body mass index [BMI] or weight loss of 510%), and high (normal BMI and inadequate weight loss or malnutrition by BMI and/or 10% weight loss and/or expectations of fasting).[26] Classification of BMI in the current study was according to thresholds for older adults.[27]
In‐hospital risk factors include LOS, a well‐known risk factor of readmission[28] and ADL decline during the index hospitalization. ADL decline was defined as the change in mBI score, calculated by subtracting the discharge score from the at‐admission score and transforming negative scores (functional improvement) to 0.
Statistical Analysis
The relationship between each of the study variables and readmission was examined using 2 tests for categorical variables and t tests for continuous variables. We took a conservative approach, and used a 0.10 threshold level in univariate analysis to decide on variable inclusion in the multivariate models. To examine the at‐admission readmission risk, baseline multivariate logistic regression was modeled with all pre‐ or at‐admission variables that were associated with readmission risk in the univariate analysis. To capture the contribution of in‐hospital data on readmission risk, the at‐discharge multivariate logistic regression was constructed by adding in‐hospital risk factors to the baseline model. To capture the odds of clinically significant functional decline that is equivalent to functional loss in 1 ADL task,[29] we divided the original mBI decline score by 10. Adjusted odds ratios (OR) and 95% confidence intervals (CI) were estimated for each predictor. We used the bootstrapping technique[30] (100 bootstrap subsamples) to test the ADL parameter estimates of both models. The calibration of both models was determined by the Hosmer‐Lemeshow test. The discrimination of the baseline model was compared with that of the at‐discharge model using the C statistic.[31] We derived the prediction score for each patient by adding the coefficients of all applicable factors from the baseline and at‐discharge multivariate logistic regression models and categorized patients' risk of readmission into 5 groups: very low (019th centile), low (2039th centile), medium (4059th percentile), high (6079th percentile), very high (8099th percentile) and extremely high (9099th percentile). We also examined whether when comparing the at‐admission versus discharge model, new patients are identified as high risk (top 10% and 20% of risk score), as these are the patients who are targeted for intervention. Analysis was performed using IBM SPSS Statistical package version 21.0 (IBM, Armonk, NY) and Stata version 10 (StataCorp, College Station, TX).
RESULTS
Table 1 presents the baseline and in‐hospital characteristics of participants with and without readmissions. The sample includes 559 community‐dwelling older adults (49% men) aged 70 to 98 years (mean age 79 years). One‐third (36%) of the participants were fully independent in ADL at admission. Eighty‐five (15.2%) patients were readmitted within 30 days of discharge. Participants who were readmitted had lower at‐admission ADL levels; had 1 more hospitalization in the previous year; and were more likely to have HF, CRF, arrhythmia, and malignancy, and to be at risk of malnutrition, than those who were not readmitted. Participants who were readmitted were more likely to suffer from functional decline during the index hospitalization. No significant differences were found in living arrangements or in at‐admission mental and cognitive status.
| Characteristic | Entire Cohort, N = 559 | No Readmission, n = 474 | 30‐Day Readmission, n = 85 | P Value |
|---|---|---|---|---|
| ||||
| Baseline characteristics | ||||
| Sociodemographic characteristics | ||||
| Age, y, mean SD | 78.8 5.6 | 78.7 5.6 | 79.7 6.6 | 0.19 |
| Male, n (%) | 274 (49.0) | 222 (46.8) | 52 (61.2) | 0.015 |
| Living alone, n (%) | 167 (29.9) | 148 (31.2) | 19 (22.4) | 0.10 |
| Education, y, mean SD | 9.6 5.0 | 9.8 4.9 | 8.7 5.3 | 0.074 |
| Chronic condition, n (%) | ||||
| Congestive heart failure | 169 (30.2) | 130 (27.4) | 39 (45.9) | 0.001 |
| Chronic renal failure | 188 (33.6) | 138 (29.1) | 50 (58.8) | 0.001 |
| Chronic obstructive pulmonary disease | 93 (16.6) | 77 (16.2) | 16 (18.8) | 0.56 |
| Diabetes mellitus | 249 (44.5) | 212 (44.7) | 37 (43.5) | 0.84 |
| Ischemic heart disease | 353 (63.1) | 295 (62.2) | 58 (68.2) | 0.29 |
| Arrhythmia | 242 (43.3) | 192 (40.5) | 50 (58.8) | 0.002 |
| Malignancy | 176 (31.5) | 132 (27.8) | 44 (51.8) | 0.001 |
| Asthma | 72 (12.9) | 61 (12.9) | 11 (12.9) | 0.99 |
| No. of medications prescribed year before index hospitalization, mean SD | 12.1 5.7 | 11.9 5.5 | 13.7 6.3 | 0.007 |
| Prior hospitalizations | ||||
| No. of hospitalizations the year before index hospitalization, mean SD | 1.2 1.6 | 1.00 1.3 | 2.20 2.2 | 0.001 |
| At‐admission health status | ||||
| APACHE II (071), mean SD | 11.5 4.4 | 11.2 4.2 | 12.9 4.6 | 0.003 |
| ADL (mBI) (0100), mean SD | 76.9 28.9 | 78.4 28.4 | 68.7 30.4 | 0.004 |
| Cognitive impairment (SPMSQ 5), n (%) | 8.1 2.2 | 8.1 2.2 | 7.9 2.2 | 0.32 |
| Depression symptoms (TZI 70), n (%) | 106 (19.0) | 89 (18.8) | 17 (20.0) | 0.85 |
| Anxiety symptoms (SAST 24), n (%) | 138 (24.7) | 115 (24.3) | 23 (27.1) | 0.63 |
| Risk of malnutrition (MUST), n (%) | 0.002 | |||
| Low risk | 177 (31.7) | 163 (34.4) | 14 (16.5) | |
| Moderate risk | 169 (30.2) | 142 (30.0) | 27 (31.8) | |
| High risk | 213 (38.1) | 169 (35.7) | 44 (51.8) | |
| Serum albumin (g/dL) (1.54.9), mean SD | 3.4 0.5 | 3.3 0.5 | 3.0 0.5 | 0.001 |
| In‐hospital risk factors | ||||
| ADL decline (mBI) (0100), mean SD | 3.2 8.7 | 2.6 7.4 | 7.0 13.2 | 0.003 |
| Length of stay (130), mean SD | 5.7 3.7 | 5.6 3.4 | 6.7 5.1 | 0.055 |
Multivariate analysis (Table 2) shows that higher at‐admission mBI score was associated with lower odds of readmission (OR for 1‐unit increase: 0.99, 95% CI: 0.98‐0.99). Other predictors of higher readmission risk were: high or medium at‐admission risk of malnutrition, malignancy, CRF, each additional hospitalization during the previous year, and lower albumin levels. Severity of illness and demographic characteristics were not significantly associated with readmission.
| Characteristic | Baseline Model | Discharge Model | ||
|---|---|---|---|---|
| OR (95% CI) | P Value | OR (95% CI) | P Value | |
| ||||
| Male | 1.57 (0.892.77) | 0.12 | 1.75 (0.983.15) | 0.06 |
| Living alone | 1.04 (0.551.95) | 0.91 | 1.06 (0.562.01) | 0.86 |
| Education (years) | 0.98 (0.921.03) | 0.33 | 0.98 (0.931.03) | 0.38 |
| Chronic conditions | ||||
| Chronic renal failure | 2.54 (1.394.66) | 0.003 | 2.51 (1.364.64) | 0.003 |
| Malignancy | 2.45 (1.384.32) | 0.002 | 2.35 (1.324.18) | 0.004 |
| Congestive heart failure | 1.84 (1.983.46) | 0.06 | 1.83 (0.973.46) | 0.06 |
| Arrhythmia | 1.64 (0.922.93) | 0.10 | 1.66 (0.953.00) | 0.09 |
| No. of medications prescribed year before index admission | 0.98 (0.931.04) | 0.50 | 0.98 (0.931.04) | 0.51 |
| APACHE II | 0.98 (0.921.04) | 0.49 | 0.97 (0.911.04) | 0.36 |
| No. of hospitalizations year before index admission | 1.27 (1.091.48) | 0.002 | 1.26 (1.081.46) | 0.004 |
| Risk of malnutrition (MUST) | ||||
| Low | Ref | Ref | ||
| Moderate | 2.21 (1.054.66) | 0.042 | 2.10 (0.984.46) | 0.055 |
| High | 3.01 (1.486.12) | 0.002 | 2.88 (1.415.91) | 0.004 |
| Serum albumin (g/dL) | 0.41 (0.240.69) | 0.001 | 0.50 (0.300.83) | 0.03 |
| At‐admission ADL | 0.99 (0.980.99) | 0.037 | 0.99 (0.980.99) | 0.025 |
| In‐hospital ADL decline* | 1.32 (1.021.72) | 0.034 | ||
| Length of stay | 1.02 (0.951.09) | 0.66 | ||
| Model fit | C statistic = 0.81 | C statistic = 0.81 | ||
The at‐discharge model that combined the baseline model and in‐hospital risk factors showed that in‐hospital (from admission to discharge) ADL decline was significantly associated with readmission, as a 10‐point decrease in the mBI from admission to discharge was associated with 1.32 (95% CI: 1.02‐1.72) greater odds of readmission. LOS was not significantly associated with readmission, after controlling for baseline health status and in‐hospital ADL decline. All other predictors did not markedly change from the baseline to the at‐discharge model either in significance levels or in magnitude.
The discriminatory power of the baseline model was good (C statistic=0.81). Adding ADL decline and LOS did not change the discriminatory power of the model (C statistic=0.81). The P value of the Hosmer‐Lemeshow test equaled 0.67 for the baseline model and 0.48 for the at‐discharge model, indicating good calibration of both models. The P values for the regression coefficients of bootstrap inference assessing the relationship between the at‐admission and in‐hospital ADL decline odds of readmission remained stable (P 0.05).
Classification of patients into risk categories by the baseline model and the discharge model (Table 3) shows that identifying patients in the top‐tier category (20th highest percentile) according to information available before or at admission does not detect 6/111 (5.4%) of patients who would have been categorized as highest‐risk if information on ADL decline had been incorporated in the predictive algorithm. Additional partitioning of the top fifth group into 2 tiers (8089th and 9099th percentiles) shows that selection of patients in the top 10% of the baseline risk score would not have detected 7/55 (12.7%) patients who would have been identified as high risk at discharge (data not shown).
| Discharge Model Risk Group | |||||||
|---|---|---|---|---|---|---|---|
| 0 | 1 | 2 | 3 | 4 | Total No. | ||
| |||||||
| Baseline model risk group | 0 | 99 (89.2) | 11 (9.8) | 0 | 1 (0.9) | 0 | 111 |
| 1 | 12 (10.8) | 88 (78.6) | 12 (10.7) | 0 | 0 | 112 | |
| 2 | 0 | 13 (11.6) | 90 (80.4) | 8 (7.1) | 1 (0.9) | 112 | |
| 3 | 0 | 0 | 10 (8.9) | 98 (86.7) | 5 (4.5) | 113 | |
| 4 | 0 | 0 | 0 | 6 (5.3) | 105 (94.6) | 111 | |
| Total no. | 111 | 112 | 112 | 113 | 111 | ||
DISCUSSION
To our knowledge, ours is the first empirical test of the simultaneous role of functioning along the hospitalization course in explaining readmission risk.[8] Our results show that at‐admission lower functional status and in‐hospital functional decline are significant predictors of early unplanned readmission in older adults, beyond other well‐known risk factors.
The major purpose of this study was to examine whether at‐admission data can be used to detect high‐risk patients for potential inclusion in readmission prevention interventions, or whether changes in ADL occurring during the index hospitalization could affect patients' risk, therefore necessitating an additional assessment at discharge. Our results show that some patients would not have been detected at admission, as their in‐hospital ADL decline affects their at‐discharge risk. Nonetheless, this is a small group (only 5% of patients if a targeting threshold of the highest 20% risk is used). Our findings also show that information on ADL decline during the index hospitalization does not contribute to the accuracy of readmission‐risk prediction in a model that utilizes data on prior hospitalizations, baseline nutritional and functional status, and chronic morbidity (CRF and malignancy). Our results are consistent with previous studies showing the association between baseline,[11, 13, 32] or at‐admission[13] functional status and readmission. However, these studies did not analyze the related contribution of in‐hospital functioning to readmission risk, which was recently suggested as a feature that may significantly affect readmission risk, especially in older patients.[8]
Our findings are also congruent with those of a study in which LOS was not significantly associated with readmission in an elderly population.[33] Our null finding can be explained by the broad set of pre‐ and at‐admission variables, such as nutritional and functional status as well as in‐hospital functional decline, included in our model, making LOS a less significant contributor than in more parsimonious models.[28]
Our results also show that malnutrition contributes to readmission risk beyond other well‐known risk factors. Previous studies showed that malnutrition in the elderly is associated with early readmission.[11, 34] These studies, however, did not examine other well‐known risk factors, such as previous hospitalizations, which were tested in our study, precluding identification of the contribution of malnutrition beyond other well‐known risks.
Our findings should be interpreted in light of several limitations. First, the functional, nutritional, and cognitive data were collected from participants' self‐reports, which are prone to recall bias. Nonetheless, self‐report is often used in large‐scale studies, which preclude actual performance measurement.[21] Second, our sample is of adults aged 70 years or older, and may not be representative of the 65 and older population, which is the target population for many readmission reduction interventions.[35] Yet, participants were from a relatively high‐functioning group of patients who were discharged to their homes, thus may resemble the over age 65 years group. Moreover, these inclusion criteria may have affected their readmission rates, which at 15% are lower than the average reported in other older adult populations.[36] Nonetheless, a more heterogenic sample (in terms of baseline functional status) is needed to address the association between in‐hospital functional change and readmissions as well as the discrimination of the model. Third, the attrition rate (16%) might impact the predictive ability of the models, as patients dropped‐out from the study might have had higher in‐hospital deterioration. However, no significant differences between study sample and dropped‐out patients in the wide range of baseline characteristics except for age and baseline albumin levels were found. Fourth, the unique characteristics of the Israeli healthcare system may affect study's generalizability. The high hospital‐bed occupancy rate, stretched to the limit at 99%, which is much higher than in other developed countries,[37] may affect readmission rates and risk. Nonetheless, our findings may be of relevance to other populations and healthcare systems, as variables included in our model have been previously shown to affect readmission risk in other settings,[4, 6] and the percent of in‐hospital ADL decline is similar to that reported by others.[9] Future studies should examine the significance of in‐hospital functioning in other older adult populations, such as greater mix of baseline functioning and myocardial infarction, HF, and COPD patients, that have been emphasized for readmission prevention by the Centers for Medicare and Medicaid Services.
CONCLUSIONS
This study shows that although both functional status and functional decline are significant predictors of readmission, in‐hospital functional decline did not contribute to the discriminative ability of the model, beyond the risk factors known at admission: malnutrition, prior hospitalizations, and being previously diagnosed with CRF or malignancy. These findings call attention to the ability to predict readmission early in the index hospitalization, to enable early intervention in targeted high‐risk patients. Nonetheless, further at‐discharge functional assessment can detect additional patients whose readmission risk changes during the index hospitalization and who should be considered for inclusion in readmission reduction interventions. As suggested in previous prediction models,[3, 38] most of the at‐admission variables examined in this study, including patient‐reported measures such as functioning, are readily available in the EHR or during the at‐admission intake.[39, 40] In settings where these assessments are not routinely performed, their implementation should be considered. These tools could be used to potentially identify patients at high risk of readmission, and accordingly, address physical function as part of routine medical care and during the acute hospitalization, and tailor adequate follow‐up care after discharge.[11]
Disclosures: This work was supported by the Israeli Science Foundation (grant number 565/08); Clalit Health Services(grant number 04‐121/2010); and the Israel National Institute for Health Policy Research (thesis scholarship number 35/2012). The funding agencies had no role in the design and conduct of this study, the analysis or interpretation of the data, or the preparation of the manuscript. The authors report no conflicts of interest.
A continuing focus on readmission prevention as a means to improve quality and reduce waste and costs has led to abundant research on the identification of factors that put older patients at risk for readmission.[1, 2] Recently, research has focused on the development of prediction tools that are based on information from electronic health records (EHR) and that enable early, at‐admission, identification of patients at high risk for readmission.[3, 4, 5] Through such identification, patients are already targeted for inclusion in readmission‐prevention interventions early in their hospital stay.[6, 7] Yet, the ability to rely on these early‐identification tools is contingent on the stability of risk during the hospital stay. Of the in‐hospital factors that can affect readmission, change in functioning has been identified as a potentially major contributor, especially in older patients.[8]
Older adults' deterioration in functioning is a common, troubling phenomenon. Approximately 20% of patients older than 70 years and hospitalized for a medical illness deteriorate in functioning during the hospitalization.[9] Recent evidence points to the contribution of functioning to 30‐day readmission risk, with studies showing that pre‐ or posthospitalization functional impairment is associated with a 1.5 to 3 times greater likelihood of readmission.[10, 11, 12, 13] Whether in‐hospital changes in functioning add to patients' baseline risk, however, is unknown. The only readmission study that examined functional decline during hospitalization was a retrospective study performed in a population of older adults receiving rehabilitation services and therefore may not be generalizable to acutely hospitalized adults.[14] To fill the current knowledge gap, we examined whether in‐hospital functional decline significantly contributes to at‐admission readmission risk factors in its ability to accurately identify high readmission risk in older adults hospitalized in internal medicine units.
METHODS
Design and Participants
Previously collected data from a prospective cohort study, Hospitalization Process Effects on Functional Outcomes and Recovery (HoPE‐FOR), designed to assess the effect of hospitalization‐care processes on functional outcomes in older adults, were combined with EHR data. The population considered for recruitment to HoPE‐FOR comprised older patients (aged 70 years) admitted during the period 2009 to 2011 to 1 of the 8 internal medicine wards at 2 tertiary medical centers in Israel. Patients recruited for the study had an unplanned admission, and were not completely dependent in their basic functions. Cognitively impaired patients (scoring 5 or less on the Short Portable Mental Status Questionnaire [SPMSQ][15]) who had no available caregiver and patients admitted for stroke, coma, or respiratory failure requiring mechanical ventilation were not eligible for participation in the study. The recruitment process for the study is fully described elsewhere.[16, 17]
At‐admission functional, cognitive, mental, and nutritional status were assessed during the first 48 hours of hospitalization. Additional functional assessment was performed at discharge. Data on severity of acute disease, length of stay (LOS), and mortality were collected from the hospitals' EHR. Preadmission healthcare utilization and readmission information were retrieved from the EHR database of Clalit Health Services (Clalit), a large not‐for‐profit integrated healthcare provider and insurer in Israel; more than 80% of the HoPE‐FOR population were Clalit members.
Of the 969 community‐dwelling participants recruited to the HoPE‐FOR study, a subset of 758 (78%) members of Clalit was used for the current study, as data on readmissions to any general hospital were accurately and readily available from Clalit's EHR system.[18] Of those, we excluded 199 due to the following reasons: 13 (2%) died during the hospitalization, 46 (6%) transferred to another ward, 16 (2%) were discharged to a postacute care facility, and 124 (16%) dropped‐out from the HoPE‐FOR study during the hospitalization (due to unavailability because of intensive tests or procedures[16]) or had missing data on the main variables, leaving a final sample of 559 participants. The admission functional, cognitive, and clinical status; LOS; and readmission rates of the participants who dropped‐out were comparable to those of participants retained in the final sample except for albumin levels and age (see Supporting Information, Appendix A, in the online version of this article). The study was approved by the institutional reviews boards of each of the hospitals, Clalit, and the Israeli Ministry of Health.
Variables and Instruments
Outcome Measure
Readmission was defined as any unplanned hospitalization at any of 27 general hospitals in Israel, occurring within 30 days of discharge from the index hospitalization.
Predictors
We collected information on baseline and in‐hospital characteristics. Baseline characteristics included chronic clinical conditions known as risk factors for readmission; number of different drugs as classified by the fifth level of the Anatomical Therapeutic Chemical classification system; number of hospitalizations in the year preceding the index hospitalization; clinical, functional, cognitive, mental, and nutritional status at admission; and sociodemographic characteristics.
Chronic conditions included: congestive heart failure (HF), chronic renal failure (CRF), chronic obstructive pulmonary disease (COPD), diabetes mellitus, ischemic heart disease, arrhythmia, malignancy, and asthma, and were retrieved from the Clalit's EHR data warehouse.[19] Severity of acute disease was assessed with the Acute Physiology and Chronic Health Evaluation.[20] Functional status was measured as self‐reported independence in performing basic activities of daily living (ADL),[21] using the modified Barthel Index (mBI).[22] The mBI consists of 10 items including personal hygiene, bathing, eating, toileting, dressing, chair/bed transfers, ambulation, stair climbing, and bowel and bladder control. Each item is ranked on 5‐point scale, indicating the amount of assistance required in functional independence in each task. The scores are summarized into a total score ranging from 0 (totally dependent) to 100 (fully independent).
Cognitive status was assessed using the SPMSQ.[15] Mental status was assessed based on self‐report of depressive and anxiety symptoms using the 10‐item Tucker's short Zung Instrument (TSZI)[23] and the 10‐item Anxiety Symptoms Questionnaire Short Anxiety Screening Test (SAST),[24] respectively. Both the TSZI and the SAST were validated in Hebrew as screening tools in older adults.[24, 25]
Assessment of nutritional status included malnutrition risk (Malnutrition Universal Screening Tool [MUST]) and admission serum albumin level (g/dL). MUST provides classification into 3 malnutrition risk groups: low (being overweight or obese, with no loss of weight or loss of less than 5% of the weight and without expectation of fasting), medium (normal body mass index [BMI] or weight loss of 510%), and high (normal BMI and inadequate weight loss or malnutrition by BMI and/or 10% weight loss and/or expectations of fasting).[26] Classification of BMI in the current study was according to thresholds for older adults.[27]
In‐hospital risk factors include LOS, a well‐known risk factor of readmission[28] and ADL decline during the index hospitalization. ADL decline was defined as the change in mBI score, calculated by subtracting the discharge score from the at‐admission score and transforming negative scores (functional improvement) to 0.
Statistical Analysis
The relationship between each of the study variables and readmission was examined using 2 tests for categorical variables and t tests for continuous variables. We took a conservative approach, and used a 0.10 threshold level in univariate analysis to decide on variable inclusion in the multivariate models. To examine the at‐admission readmission risk, baseline multivariate logistic regression was modeled with all pre‐ or at‐admission variables that were associated with readmission risk in the univariate analysis. To capture the contribution of in‐hospital data on readmission risk, the at‐discharge multivariate logistic regression was constructed by adding in‐hospital risk factors to the baseline model. To capture the odds of clinically significant functional decline that is equivalent to functional loss in 1 ADL task,[29] we divided the original mBI decline score by 10. Adjusted odds ratios (OR) and 95% confidence intervals (CI) were estimated for each predictor. We used the bootstrapping technique[30] (100 bootstrap subsamples) to test the ADL parameter estimates of both models. The calibration of both models was determined by the Hosmer‐Lemeshow test. The discrimination of the baseline model was compared with that of the at‐discharge model using the C statistic.[31] We derived the prediction score for each patient by adding the coefficients of all applicable factors from the baseline and at‐discharge multivariate logistic regression models and categorized patients' risk of readmission into 5 groups: very low (019th centile), low (2039th centile), medium (4059th percentile), high (6079th percentile), very high (8099th percentile) and extremely high (9099th percentile). We also examined whether when comparing the at‐admission versus discharge model, new patients are identified as high risk (top 10% and 20% of risk score), as these are the patients who are targeted for intervention. Analysis was performed using IBM SPSS Statistical package version 21.0 (IBM, Armonk, NY) and Stata version 10 (StataCorp, College Station, TX).
RESULTS
Table 1 presents the baseline and in‐hospital characteristics of participants with and without readmissions. The sample includes 559 community‐dwelling older adults (49% men) aged 70 to 98 years (mean age 79 years). One‐third (36%) of the participants were fully independent in ADL at admission. Eighty‐five (15.2%) patients were readmitted within 30 days of discharge. Participants who were readmitted had lower at‐admission ADL levels; had 1 more hospitalization in the previous year; and were more likely to have HF, CRF, arrhythmia, and malignancy, and to be at risk of malnutrition, than those who were not readmitted. Participants who were readmitted were more likely to suffer from functional decline during the index hospitalization. No significant differences were found in living arrangements or in at‐admission mental and cognitive status.
| Characteristic | Entire Cohort, N = 559 | No Readmission, n = 474 | 30‐Day Readmission, n = 85 | P Value |
|---|---|---|---|---|
| ||||
| Baseline characteristics | ||||
| Sociodemographic characteristics | ||||
| Age, y, mean SD | 78.8 5.6 | 78.7 5.6 | 79.7 6.6 | 0.19 |
| Male, n (%) | 274 (49.0) | 222 (46.8) | 52 (61.2) | 0.015 |
| Living alone, n (%) | 167 (29.9) | 148 (31.2) | 19 (22.4) | 0.10 |
| Education, y, mean SD | 9.6 5.0 | 9.8 4.9 | 8.7 5.3 | 0.074 |
| Chronic condition, n (%) | ||||
| Congestive heart failure | 169 (30.2) | 130 (27.4) | 39 (45.9) | 0.001 |
| Chronic renal failure | 188 (33.6) | 138 (29.1) | 50 (58.8) | 0.001 |
| Chronic obstructive pulmonary disease | 93 (16.6) | 77 (16.2) | 16 (18.8) | 0.56 |
| Diabetes mellitus | 249 (44.5) | 212 (44.7) | 37 (43.5) | 0.84 |
| Ischemic heart disease | 353 (63.1) | 295 (62.2) | 58 (68.2) | 0.29 |
| Arrhythmia | 242 (43.3) | 192 (40.5) | 50 (58.8) | 0.002 |
| Malignancy | 176 (31.5) | 132 (27.8) | 44 (51.8) | 0.001 |
| Asthma | 72 (12.9) | 61 (12.9) | 11 (12.9) | 0.99 |
| No. of medications prescribed year before index hospitalization, mean SD | 12.1 5.7 | 11.9 5.5 | 13.7 6.3 | 0.007 |
| Prior hospitalizations | ||||
| No. of hospitalizations the year before index hospitalization, mean SD | 1.2 1.6 | 1.00 1.3 | 2.20 2.2 | 0.001 |
| At‐admission health status | ||||
| APACHE II (071), mean SD | 11.5 4.4 | 11.2 4.2 | 12.9 4.6 | 0.003 |
| ADL (mBI) (0100), mean SD | 76.9 28.9 | 78.4 28.4 | 68.7 30.4 | 0.004 |
| Cognitive impairment (SPMSQ 5), n (%) | 8.1 2.2 | 8.1 2.2 | 7.9 2.2 | 0.32 |
| Depression symptoms (TZI 70), n (%) | 106 (19.0) | 89 (18.8) | 17 (20.0) | 0.85 |
| Anxiety symptoms (SAST 24), n (%) | 138 (24.7) | 115 (24.3) | 23 (27.1) | 0.63 |
| Risk of malnutrition (MUST), n (%) | 0.002 | |||
| Low risk | 177 (31.7) | 163 (34.4) | 14 (16.5) | |
| Moderate risk | 169 (30.2) | 142 (30.0) | 27 (31.8) | |
| High risk | 213 (38.1) | 169 (35.7) | 44 (51.8) | |
| Serum albumin (g/dL) (1.54.9), mean SD | 3.4 0.5 | 3.3 0.5 | 3.0 0.5 | 0.001 |
| In‐hospital risk factors | ||||
| ADL decline (mBI) (0100), mean SD | 3.2 8.7 | 2.6 7.4 | 7.0 13.2 | 0.003 |
| Length of stay (130), mean SD | 5.7 3.7 | 5.6 3.4 | 6.7 5.1 | 0.055 |
Multivariate analysis (Table 2) shows that higher at‐admission mBI score was associated with lower odds of readmission (OR for 1‐unit increase: 0.99, 95% CI: 0.98‐0.99). Other predictors of higher readmission risk were: high or medium at‐admission risk of malnutrition, malignancy, CRF, each additional hospitalization during the previous year, and lower albumin levels. Severity of illness and demographic characteristics were not significantly associated with readmission.
| Characteristic | Baseline Model | Discharge Model | ||
|---|---|---|---|---|
| OR (95% CI) | P Value | OR (95% CI) | P Value | |
| ||||
| Male | 1.57 (0.892.77) | 0.12 | 1.75 (0.983.15) | 0.06 |
| Living alone | 1.04 (0.551.95) | 0.91 | 1.06 (0.562.01) | 0.86 |
| Education (years) | 0.98 (0.921.03) | 0.33 | 0.98 (0.931.03) | 0.38 |
| Chronic conditions | ||||
| Chronic renal failure | 2.54 (1.394.66) | 0.003 | 2.51 (1.364.64) | 0.003 |
| Malignancy | 2.45 (1.384.32) | 0.002 | 2.35 (1.324.18) | 0.004 |
| Congestive heart failure | 1.84 (1.983.46) | 0.06 | 1.83 (0.973.46) | 0.06 |
| Arrhythmia | 1.64 (0.922.93) | 0.10 | 1.66 (0.953.00) | 0.09 |
| No. of medications prescribed year before index admission | 0.98 (0.931.04) | 0.50 | 0.98 (0.931.04) | 0.51 |
| APACHE II | 0.98 (0.921.04) | 0.49 | 0.97 (0.911.04) | 0.36 |
| No. of hospitalizations year before index admission | 1.27 (1.091.48) | 0.002 | 1.26 (1.081.46) | 0.004 |
| Risk of malnutrition (MUST) | ||||
| Low | Ref | Ref | ||
| Moderate | 2.21 (1.054.66) | 0.042 | 2.10 (0.984.46) | 0.055 |
| High | 3.01 (1.486.12) | 0.002 | 2.88 (1.415.91) | 0.004 |
| Serum albumin (g/dL) | 0.41 (0.240.69) | 0.001 | 0.50 (0.300.83) | 0.03 |
| At‐admission ADL | 0.99 (0.980.99) | 0.037 | 0.99 (0.980.99) | 0.025 |
| In‐hospital ADL decline* | 1.32 (1.021.72) | 0.034 | ||
| Length of stay | 1.02 (0.951.09) | 0.66 | ||
| Model fit | C statistic = 0.81 | C statistic = 0.81 | ||
The at‐discharge model that combined the baseline model and in‐hospital risk factors showed that in‐hospital (from admission to discharge) ADL decline was significantly associated with readmission, as a 10‐point decrease in the mBI from admission to discharge was associated with 1.32 (95% CI: 1.02‐1.72) greater odds of readmission. LOS was not significantly associated with readmission, after controlling for baseline health status and in‐hospital ADL decline. All other predictors did not markedly change from the baseline to the at‐discharge model either in significance levels or in magnitude.
The discriminatory power of the baseline model was good (C statistic=0.81). Adding ADL decline and LOS did not change the discriminatory power of the model (C statistic=0.81). The P value of the Hosmer‐Lemeshow test equaled 0.67 for the baseline model and 0.48 for the at‐discharge model, indicating good calibration of both models. The P values for the regression coefficients of bootstrap inference assessing the relationship between the at‐admission and in‐hospital ADL decline odds of readmission remained stable (P 0.05).
Classification of patients into risk categories by the baseline model and the discharge model (Table 3) shows that identifying patients in the top‐tier category (20th highest percentile) according to information available before or at admission does not detect 6/111 (5.4%) of patients who would have been categorized as highest‐risk if information on ADL decline had been incorporated in the predictive algorithm. Additional partitioning of the top fifth group into 2 tiers (8089th and 9099th percentiles) shows that selection of patients in the top 10% of the baseline risk score would not have detected 7/55 (12.7%) patients who would have been identified as high risk at discharge (data not shown).
| Discharge Model Risk Group | |||||||
|---|---|---|---|---|---|---|---|
| 0 | 1 | 2 | 3 | 4 | Total No. | ||
| |||||||
| Baseline model risk group | 0 | 99 (89.2) | 11 (9.8) | 0 | 1 (0.9) | 0 | 111 |
| 1 | 12 (10.8) | 88 (78.6) | 12 (10.7) | 0 | 0 | 112 | |
| 2 | 0 | 13 (11.6) | 90 (80.4) | 8 (7.1) | 1 (0.9) | 112 | |
| 3 | 0 | 0 | 10 (8.9) | 98 (86.7) | 5 (4.5) | 113 | |
| 4 | 0 | 0 | 0 | 6 (5.3) | 105 (94.6) | 111 | |
| Total no. | 111 | 112 | 112 | 113 | 111 | ||
DISCUSSION
To our knowledge, ours is the first empirical test of the simultaneous role of functioning along the hospitalization course in explaining readmission risk.[8] Our results show that at‐admission lower functional status and in‐hospital functional decline are significant predictors of early unplanned readmission in older adults, beyond other well‐known risk factors.
The major purpose of this study was to examine whether at‐admission data can be used to detect high‐risk patients for potential inclusion in readmission prevention interventions, or whether changes in ADL occurring during the index hospitalization could affect patients' risk, therefore necessitating an additional assessment at discharge. Our results show that some patients would not have been detected at admission, as their in‐hospital ADL decline affects their at‐discharge risk. Nonetheless, this is a small group (only 5% of patients if a targeting threshold of the highest 20% risk is used). Our findings also show that information on ADL decline during the index hospitalization does not contribute to the accuracy of readmission‐risk prediction in a model that utilizes data on prior hospitalizations, baseline nutritional and functional status, and chronic morbidity (CRF and malignancy). Our results are consistent with previous studies showing the association between baseline,[11, 13, 32] or at‐admission[13] functional status and readmission. However, these studies did not analyze the related contribution of in‐hospital functioning to readmission risk, which was recently suggested as a feature that may significantly affect readmission risk, especially in older patients.[8]
Our findings are also congruent with those of a study in which LOS was not significantly associated with readmission in an elderly population.[33] Our null finding can be explained by the broad set of pre‐ and at‐admission variables, such as nutritional and functional status as well as in‐hospital functional decline, included in our model, making LOS a less significant contributor than in more parsimonious models.[28]
Our results also show that malnutrition contributes to readmission risk beyond other well‐known risk factors. Previous studies showed that malnutrition in the elderly is associated with early readmission.[11, 34] These studies, however, did not examine other well‐known risk factors, such as previous hospitalizations, which were tested in our study, precluding identification of the contribution of malnutrition beyond other well‐known risks.
Our findings should be interpreted in light of several limitations. First, the functional, nutritional, and cognitive data were collected from participants' self‐reports, which are prone to recall bias. Nonetheless, self‐report is often used in large‐scale studies, which preclude actual performance measurement.[21] Second, our sample is of adults aged 70 years or older, and may not be representative of the 65 and older population, which is the target population for many readmission reduction interventions.[35] Yet, participants were from a relatively high‐functioning group of patients who were discharged to their homes, thus may resemble the over age 65 years group. Moreover, these inclusion criteria may have affected their readmission rates, which at 15% are lower than the average reported in other older adult populations.[36] Nonetheless, a more heterogenic sample (in terms of baseline functional status) is needed to address the association between in‐hospital functional change and readmissions as well as the discrimination of the model. Third, the attrition rate (16%) might impact the predictive ability of the models, as patients dropped‐out from the study might have had higher in‐hospital deterioration. However, no significant differences between study sample and dropped‐out patients in the wide range of baseline characteristics except for age and baseline albumin levels were found. Fourth, the unique characteristics of the Israeli healthcare system may affect study's generalizability. The high hospital‐bed occupancy rate, stretched to the limit at 99%, which is much higher than in other developed countries,[37] may affect readmission rates and risk. Nonetheless, our findings may be of relevance to other populations and healthcare systems, as variables included in our model have been previously shown to affect readmission risk in other settings,[4, 6] and the percent of in‐hospital ADL decline is similar to that reported by others.[9] Future studies should examine the significance of in‐hospital functioning in other older adult populations, such as greater mix of baseline functioning and myocardial infarction, HF, and COPD patients, that have been emphasized for readmission prevention by the Centers for Medicare and Medicaid Services.
CONCLUSIONS
This study shows that although both functional status and functional decline are significant predictors of readmission, in‐hospital functional decline did not contribute to the discriminative ability of the model, beyond the risk factors known at admission: malnutrition, prior hospitalizations, and being previously diagnosed with CRF or malignancy. These findings call attention to the ability to predict readmission early in the index hospitalization, to enable early intervention in targeted high‐risk patients. Nonetheless, further at‐discharge functional assessment can detect additional patients whose readmission risk changes during the index hospitalization and who should be considered for inclusion in readmission reduction interventions. As suggested in previous prediction models,[3, 38] most of the at‐admission variables examined in this study, including patient‐reported measures such as functioning, are readily available in the EHR or during the at‐admission intake.[39, 40] In settings where these assessments are not routinely performed, their implementation should be considered. These tools could be used to potentially identify patients at high risk of readmission, and accordingly, address physical function as part of routine medical care and during the acute hospitalization, and tailor adequate follow‐up care after discharge.[11]
Disclosures: This work was supported by the Israeli Science Foundation (grant number 565/08); Clalit Health Services(grant number 04‐121/2010); and the Israel National Institute for Health Policy Research (thesis scholarship number 35/2012). The funding agencies had no role in the design and conduct of this study, the analysis or interpretation of the data, or the preparation of the manuscript. The authors report no conflicts of interest.
- , , , , . Determinants of preventable readmissions in the United States: a systematic review. Implement Sci. 2010;5:1–27.
- , , , , , . Risk factors for hospital readmissions in elderly patients: a systematic review. QJM. 2011;104:639–651.
- , , , , , . Predicting 30‐day readmissions with preadmission electronic health record data. Med Care. 2015;53:283–289.
- , , , et al. Electronic medical record‐based multicondition models to predict the risk of 30 day readmission or death among adult medicine patients: validation and comparison to existing models. BMC Med Inform Decis Mak. 2015;15:39.
- , , , et al. An automated model to identify heart failure patients at risk for 30‐day readmission or death using electronic medical record data. Med Care. 2010;48:981–988.
- , , , , , . Development of a predictive model to identify inpatients at risk of re‐admission within 30 days of discharge (PARR‐30). BMJ Open. 2012;2:10.
- , , , et al. So many options, where do we start? An overview of the care transitions literature. J Hosp Med. 2016;11(3):221–230.
- , . Functional status—an important but overlooked variable in the readmissions equation. J Hosp Med. 2014;9:330–331.
- , , , et al. Loss of independence in activities of daily living in older adults hospitalized with medical illnesses: increased vulnerability with age. J Am Geriatr Soc. 2003;51:451–458.
- , , , et al. Hospital readmission among older medical patients in Hong Kong. J R Coll Physicians Lond. 1999;33:153–156.
- , , , . Functional impairment and hospital readmission in Medicare seniors. JAMA Intern Med. 2015;175:559–565.
- , , , , , . Association of impaired functional status at hospital discharge and subsequent rehospitalization. J Hosp Med. 2014;9:277–282.
- , , , et al. Incidence and main factors associated with early unplanned hospital readmission among French medical inpatients aged 75 and over admitted through emergency units. Age Ageing. 2008;37:416–422.
- , , , et al. Predictors of rehospitalization among elderly patients admitted to a rehabilitation hospital: the role of polypharmacy, functional status, and length of stay. J Am Med Dir Assoc. 2013;14:761–767.
- . A short portable mental status questionnaire for the assessment of organic brain deficit in elderly patients. J Am Geriatr Soc. 1975;23:433–441.
- , , , , , . Low mobility during hospitalization and functional decline in older adults. J Am Geriatr Soc. 2011;59:266–273.
- , , , , . Hospital associated functional decline: the role of hospitalization processes beyond individual risk factors. J Am Geriatr Soc. 2015;63:55–62.
- , , , . Health information exchange systems and length of stay in readmissions to a different hospital [published online December 29, 2015]. J Hosp Med. doi: 10.1002/jhm.2535.
- , . Prevalence of selected chronic diseases in Israel. Isr Med Assoc J. 2001;3:404–408.
- , , , . APACHE II: a severity of disease classification system. Crit Care Med. 1985;13:818–829.
- , , , , , . Functional status before hospitalization in acutely ill older adults: validity and clinical importance of retrospective reports. J Am Geriatr Soc. 2000;48:164–169.
- , , . Improving the sensitivity of the Barthel index for stroke rehabilitation. J Clin Epidemiol. 1989;42:703–709.
- , , , . Validation of a brief screening test for depression in the elderly. Age Ageing. 1987;16:139–144.
- , , , . Short Anxiety Screening Test—a brief instrument for detecting anxiety in the elderly. Int J Geriatr Psychiatry. 1999;14:1062–1071.
- , , , . Does the presence of anxiety affect the validity of a screening test for depression in the elderly? Int J Geriatr Psychiatry. 2002;17:309–314.
- . The ‘MUST’ report. Nutritional screening of adults: a multidisciplinary responsibility (executive summary). Available at: http://www.bapen.org.uk/pdfs/must/must_exec_sum.pdf. Accessed July 10, 2015.
- , , , , . Body mass index, weight change, and death in older adults: the systolic hypertension in the elderly program. Am J Epidemiol. 2002;156:132–138.
- , , , , et al. Derivation and validation of an index to predict early death or unplanned readmission after discharge from hospital to the community. CMAJ. 2010;182:551–557.
- , , , , . Variability in measuring (instrumental) activities of daily living functioning and functional decline in hospitalized older medical patients: a systematic review. J Clin Epidemiol. 2011;64:619–627.
- , , , , , . Internal validation of predictive models: efficiency of some procedures for logistic regression analysis. J Clin Epidemiol. 2001;54:774–781.
- , , , et al. Risk prediction models for hospital readmission: a systematic review. JAMA. 2011;306:1688–1698.
- , , , et al. Functional status and hospital readmissions using the medical expenditure panel survey. J Gen Intern Med. 2015;30:965–972.
- , , , . Predicting readmissions: poor performance of the LACE index in an older UK population. Age Ageing. 2012;41:784–789.
- , , , , . Risk factors for 30‐day hospital readmission in patients ≥65 years of age. Proc (Bayl Univ Med Cent). 2008;21:363–372.
- Center for Outcomes Research 360:1418–1428.
- , , , , . Managing the increasing shortage of acute care hospital beds in Israel. J Eval Clin Pract. 2015;21:79–84.
- , , , . Case finding for patients at risk of readmission to hospital: development of algorithm to identify high risk patients. BMJ. 2006;333:327.
- , , . Measuring nutritional risk in hospitals. Clin Epidemiol. 2010;2:209–216.
- , , , , . When do patient‐reported outcome measures inform readmission risk? J Hosp Med. 2015;10:294–300.
- , , , , . Determinants of preventable readmissions in the United States: a systematic review. Implement Sci. 2010;5:1–27.
- , , , , , . Risk factors for hospital readmissions in elderly patients: a systematic review. QJM. 2011;104:639–651.
- , , , , , . Predicting 30‐day readmissions with preadmission electronic health record data. Med Care. 2015;53:283–289.
- , , , et al. Electronic medical record‐based multicondition models to predict the risk of 30 day readmission or death among adult medicine patients: validation and comparison to existing models. BMC Med Inform Decis Mak. 2015;15:39.
- , , , et al. An automated model to identify heart failure patients at risk for 30‐day readmission or death using electronic medical record data. Med Care. 2010;48:981–988.
- , , , , , . Development of a predictive model to identify inpatients at risk of re‐admission within 30 days of discharge (PARR‐30). BMJ Open. 2012;2:10.
- , , , et al. So many options, where do we start? An overview of the care transitions literature. J Hosp Med. 2016;11(3):221–230.
- , . Functional status—an important but overlooked variable in the readmissions equation. J Hosp Med. 2014;9:330–331.
- , , , et al. Loss of independence in activities of daily living in older adults hospitalized with medical illnesses: increased vulnerability with age. J Am Geriatr Soc. 2003;51:451–458.
- , , , et al. Hospital readmission among older medical patients in Hong Kong. J R Coll Physicians Lond. 1999;33:153–156.
- , , , . Functional impairment and hospital readmission in Medicare seniors. JAMA Intern Med. 2015;175:559–565.
- , , , , , . Association of impaired functional status at hospital discharge and subsequent rehospitalization. J Hosp Med. 2014;9:277–282.
- , , , et al. Incidence and main factors associated with early unplanned hospital readmission among French medical inpatients aged 75 and over admitted through emergency units. Age Ageing. 2008;37:416–422.
- , , , et al. Predictors of rehospitalization among elderly patients admitted to a rehabilitation hospital: the role of polypharmacy, functional status, and length of stay. J Am Med Dir Assoc. 2013;14:761–767.
- . A short portable mental status questionnaire for the assessment of organic brain deficit in elderly patients. J Am Geriatr Soc. 1975;23:433–441.
- , , , , , . Low mobility during hospitalization and functional decline in older adults. J Am Geriatr Soc. 2011;59:266–273.
- , , , , . Hospital associated functional decline: the role of hospitalization processes beyond individual risk factors. J Am Geriatr Soc. 2015;63:55–62.
- , , , . Health information exchange systems and length of stay in readmissions to a different hospital [published online December 29, 2015]. J Hosp Med. doi: 10.1002/jhm.2535.
- , . Prevalence of selected chronic diseases in Israel. Isr Med Assoc J. 2001;3:404–408.
- , , , . APACHE II: a severity of disease classification system. Crit Care Med. 1985;13:818–829.
- , , , , , . Functional status before hospitalization in acutely ill older adults: validity and clinical importance of retrospective reports. J Am Geriatr Soc. 2000;48:164–169.
- , , . Improving the sensitivity of the Barthel index for stroke rehabilitation. J Clin Epidemiol. 1989;42:703–709.
- , , , . Validation of a brief screening test for depression in the elderly. Age Ageing. 1987;16:139–144.
- , , , . Short Anxiety Screening Test—a brief instrument for detecting anxiety in the elderly. Int J Geriatr Psychiatry. 1999;14:1062–1071.
- , , , . Does the presence of anxiety affect the validity of a screening test for depression in the elderly? Int J Geriatr Psychiatry. 2002;17:309–314.
- . The ‘MUST’ report. Nutritional screening of adults: a multidisciplinary responsibility (executive summary). Available at: http://www.bapen.org.uk/pdfs/must/must_exec_sum.pdf. Accessed July 10, 2015.
- , , , , . Body mass index, weight change, and death in older adults: the systolic hypertension in the elderly program. Am J Epidemiol. 2002;156:132–138.
- , , , , et al. Derivation and validation of an index to predict early death or unplanned readmission after discharge from hospital to the community. CMAJ. 2010;182:551–557.
- , , , , . Variability in measuring (instrumental) activities of daily living functioning and functional decline in hospitalized older medical patients: a systematic review. J Clin Epidemiol. 2011;64:619–627.
- , , , , , . Internal validation of predictive models: efficiency of some procedures for logistic regression analysis. J Clin Epidemiol. 2001;54:774–781.
- , , , et al. Risk prediction models for hospital readmission: a systematic review. JAMA. 2011;306:1688–1698.
- , , , et al. Functional status and hospital readmissions using the medical expenditure panel survey. J Gen Intern Med. 2015;30:965–972.
- , , , . Predicting readmissions: poor performance of the LACE index in an older UK population. Age Ageing. 2012;41:784–789.
- , , , , . Risk factors for 30‐day hospital readmission in patients ≥65 years of age. Proc (Bayl Univ Med Cent). 2008;21:363–372.
- Center for Outcomes Research 360:1418–1428.
- , , , , . Managing the increasing shortage of acute care hospital beds in Israel. J Eval Clin Pract. 2015;21:79–84.
- , , , . Case finding for patients at risk of readmission to hospital: development of algorithm to identify high risk patients. BMJ. 2006;333:327.
- , , . Measuring nutritional risk in hospitals. Clin Epidemiol. 2010;2:209–216.
- , , , , . When do patient‐reported outcome measures inform readmission risk? J Hosp Med. 2015;10:294–300.
Hospital Antipsychotic Use
Antipsychotic medications are frequently used off label for management of behavioral symptoms associated with delirium and/or dementia. Despite regulations designed to curb inappropriate prescribing of these medications in nursing homes, substantial levels of use and variation in use have been observed in this setting.[1] Although antipsychotic medications are also frequently used in the hospital, the scope and variation in use have not been adequately investigated. Given the lack of oversight for medication prescribing in the hospital setting and the frequency of delirium, occurring in 15% to 26% of hospitalized older adults,[2, 3, 4] off‐label use of antipsychotic medications and variation in use could be substantial.
Because variation in practice is known to increase in the setting of controversy or lack of clarity regarding appropriate management,[5] large degrees of variation can draw attention to priority areas for clinical effectiveness studies, and the need for guidelines, clinical decision support, or regulatory oversight. In the absence of clear guidelines for the use of antipsychotic medication in nonpsychiatric hospitalized patients, we hypothesized that significant variation in use would persist after controlling for patient characteristics. Using a large, nationally representative cohort of admissions to 300 hospitals from July 2009 to June 2010, we sought to investigate prescribing patterns and hospital variation in use of antipsychotic medications in nonpsychiatric admissions to US hospitals.
METHODS
Setting and Data Collection
We conducted a retrospective cohort study using data from 300 US, nonfederal, acute care facilities contributing to the database maintained by Premier (Premier Healthcare Solutions, Inc., Charlotte, NC). This nationally representative database, created to measure healthcare utilization and quality of care, is drawn from voluntarily participating hospitals and contains data on approximately 1 in every 4 discharges nationwide.[6] Participating hospitals are similar in geographic distribution and urban/rural status to hospitals nationwide, although large, nonteaching hospitals are slightly over‐represented. The study was approved by the institutional review board at Beth Israel Deaconess Medical Center.
Inclusion and Exclusion Criteria
We studied a cohort of all adult (18 years) nonpsychiatric admissions to participating hospitals from July 1, 2009 through June 30, 2010. We excluded patients admitted to a psychiatry service or with any discharge diagnosis of a psychotic disorder (defined by the Elixhauser comorbidity Psychoses: 295.00‐298.9, 299.10‐299.11), because we were interested in use of antipsychotics for conditions other than primary psychiatric disorders. We also excluded patients with a charge for labor and delivery owing to the nonrepresentativeness of this patient population for the general hospitalized patient. We excluded admissions with unknown gender, and admissions with a length of stay greater than 365 days, as these admissions are not representative of the typical admission to an acute care hospital. We also excluded hospitals contributing less than 100 admissions owing to lack of precision in corresponding hospital prescribing rates.
Antipsychotic Medication Utilization
In‐hospital antipsychotic use was ascertained from pharmacy charges, reflecting each medication dispensed during the hospitalization. We categorized antipsychotic medications as typical (haloperidol, loxapine, thioridazine, molindone, thiothixine, pimozide, fluphenazine, trifluoperazine, chlorpromazine, and perphenazine) and atypical (aripiprazole, asenapine, clozapine, iloperidone, lurasidone, olanzapine, paliperidone, quetiapine, risperidone, and ziprasidone) based on classification by the Food and Drug Administration.[7, 8] We excluded prochlorperazine (Compazine) from our typical antipsychotic definition, as this medication is almost exclusively used as an antiemetic.
In the absence of guidelines for use of antipsychotic agents in hospitalized patients, we used the Centers for Medicare and Medicaid Services (CMS) guidelines for long‐term care facilities to define measures of potentially excessive dosing in the hospital setting.[9] These guidelines define the daily dosage levels of antipsychotics above which the medical necessity of the higher dose should be explained in the medical record. We defined any daily dosage above these specified levels as a potentially excessive daily dose.
Characteristics Associated With Use
We investigated the association between antipsychotic use and patient and hospital characteristics, selected based on clinical grounds. Patient characteristics included: (1) demographic variables such as age (65, 6574, 75+ years), gender, self‐reported race, marital status, and primary insurance; (2) admission characteristic variables, including admitting department (surgical vs nonsurgical, defined by a surgical attending of record and presence of operating room charges), whether the patient spent any time in the intensive care unit (ICU), and whether they received mechanical ventilation; and (3) potential indications for use, including delirium (included delirium superimposed upon dementia), dementia (without delirium), and insomnia (see Supporting Information, Appendix, in the online version of this article for International Classification of Diseases, Ninth Revision, Clinical Modification [ICD‐9‐CM] codes). Hospital characteristics included number of beds, urban versus rural status, teaching status, and US Census region.
Statistical Analysis
We report the proportion of admissions with in‐hospital use of any antipsychotic, and the number of days of exposure, overall and stratified by typical and atypical.
We determined potentially excessive dosing by taking the sum of the doses for a specific antipsychotic charged on a given day and comparing it to the CMS guidelines for long‐term care settings described above. We report the percentage of exposed admissions with at least 1 day of potentially excessive dosing.
All multivariable models below were operationalized as generalized estimating equations with a Poisson error term, log link, robust variance estimator,[10] and an exchangeable correlation structure to account for repeated admissions of the same patient.
We investigated patient and hospital characteristics associated with use of any antipsychotic medication using a multivariable model that simultaneously included all patient and hospital characteristics in Table 1 as independent variables.
| % of Cohort | Any Exposure, % | Typical Exposure, % | Atypical Exposure, % | |
|---|---|---|---|---|
| ||||
| Patient characteristics | ||||
| Age group, y | ||||
| 65 | 52.1 | 4.6 | 2.0 | 3.1 |
| 6574 | 18.5 | 5.2 | 2.7 | 3.1 |
| 75+ | 29.4 | 8.8 | 4.6 | 5.4 |
| Gender | ||||
| Male | 43.8 | 6.6 | 3.6 | 3.8 |
| Female | 56.2 | 5.5 | 2.3 | 3.8 |
| Race | ||||
| White | 64.6 | 6.1 | 2.9 | 4.0 |
| Black | 13.5 | 5.5 | 2.8 | 3.3 |
| Hispanic | 5.0 | 4.9 | 2.2 | 3.2 |
| Other | 19.9 | 6.1 | 3.1 | 3.7 |
| Marital Status | ||||
| Married | 42.5 | 4.6 | 2.4 | 2.7 |
| Single | 46.7 | 7.2 | 3.2 | 4.7 |
| Unknown/other | 10.8 | 6.4 | 3.1 | 4.1 |
| Primary insurance | ||||
| Private (commercial) | 28.8 | 3.0 | 1.5 | 1.8 |
| Medicaid | 10.3 | 6.4 | 2.4 | 4.6 |
| Medicare managed | 10.6 | 7.1 | 4.1 | 4.0 |
| Medicare traditional | 40.9 | 8.0 | 3.7 | 5.3 |
| Self‐pay or other | 9.4 | 4.3 | 2.5 | 2.2 |
| Admitting department | ||||
| Surgical | 60.6 | 5.8 | 3.1 | 3.4 |
| Nonsurgical | 39.4 | 6.2 | 2.4 | 4.4 |
| Any ICU stay | 16.6 | 10.4 | 7.2 | 4.9 |
| Mechanical ventilation | 4.7 | 17.4 | 12.9 | 7.9 |
| Diagnoses | ||||
| Delirium | 3.2 | 28.6 | 19.4 | 15.7 |
| Dementia | 3.1 | 27.4 | 12.0 | 20.2 |
| Insomnia | 1.3 | 10.2 | 3.9 | 7.5 |
| Discharge disposition | ||||
| Home | 77.9 | 3.8 | 1.6 | 2.5 |
| SNF/Rehab | 15.5 | 13.7 | 6.8 | 9.0 |
| Hospice | 1.7 | 16.0 | 10.3 | 8.1 |
| Other | 4.9 | 11.6 | 7.6 | 5.7 |
| Hospital characteristics, % | ||||
| No. of beds | ||||
| 200 | 14.1 | 6.1 | 2.8 | 3.8 |
| 201300 | 18.6 | 6.1 | 2.9 | 3.9 |
| 301500 | 37.7 | 5.9 | 2.9 | 3.7 |
| 500+ | 29.7 | 5.9 | 2.8 | 3.8 |
| Population served | ||||
| Urban | 89.4 | 6.0 | 2.9 | 3.8 |
| Rural | 10.6 | 5.8 | 2.4 | 3.9 |
| Teaching status | ||||
| Teaching | 39.2 | 5.8 | 2.9 | 3.7 |
| Nonteaching | 60.8 | 6.0 | 2.8 | 3.9 |
| US Census region | ||||
| West | 16.9 | 5.9 | 3.2 | 3.5 |
| Northeast | 20.1 | 6.1 | 2.9 | 3.9 |
| Midwest | 21.9 | 5.7 | 2.5 | 3.8 |
| South | 41.0 | 6.1 | 2.9 | 3.9 |
To determine hospital variation in antipsychotic use, we first determined the proportion of admissions at each hospital with at least 1 charge for antipsychotic medication. We then divided hospitals into quintiles based on their facility‐level antipsychotic prescribing rates and assigned all admissions to their corresponding hospital quintile. We then used a multivariable model to measure the adjusted association between prescribing quintile and patient‐level receipt of antipsychotic medication, controlling for all patient characteristics listed in Table 1 (except discharge disposition), and comorbidities using the Healthcare Cost and Utilization Project Comorbidity Software version 3.7 (Agency for Healthcare Research and Quality, Rockville, MD).[11] We used the lowest prescribing quintile as the reference group. We also report in the Supporting Information, Appendix, in the online version of this article, the distribution of prescribing rates for the hospitals in our cohort before and after adjustment for patient characteristics. For both approaches, we conducted stratified analyses in admissions with delirium and dementia.
All analyses were carried out using SAS software (SAS Institute Inc., Cary, NC).
RESULTS
Admission Characteristics
There were 3,190,934 admissions aged 18 years and over to 300 hospitals from July 1, 2009 to June 30, 2010. After excluding admissions with unknown gender (n = 17), length of stay greater than 365 days (n = 25), charges for labor and delivery (n = 323,111) or a psychiatric attending of record or psychiatric comorbidity (n = 172,669), and admissions to hospitals with fewer than 100 admissions (n = 31), our cohort included 2,695,081 admissions. The median age was 63 years (25th, 75th percentile 48, 77 years), and 1,514,986 (56%) were women. Table 1 shows the overall admission characteristics of the cohort and the percent exposed to antipsychotics among each patient and hospital characteristic.
Antipsychotic Use
There were 160,773 (6%) admissions with antipsychotic exposure. Among exposed admissions, 102,148 (64%) received atypical and 76,979 (48%) received typical antipsychotics, with 18,354 (11%) exposed to both. The median (25th, 75th percentile) length of stay among exposed was 5 days (3, 9 days), and the median (25th, 75th percentile) number of days of exposure was 3 (1, 5 days) overall, 3 days (2, 6 days) for atypical and 2 days (1, 3 days) for typical exposure.
Among admissions aged 65 to 74 years, 25,855 (5%) were exposed. Among admissions aged 75 years or older, 69,792 (9%) were exposed. Among admissions with delirium, exposure occurred in 24,787 (29%), with 13,640 (55%) receiving atypical, 16,828 (68%) receiving typical, and 5681 (23%) exposed to both. Among admissions with dementia, exposure occurred in 23,179 (27%), with 17,068 (74%) receiving atypical, 10,108 (44%) receiving typical, and 3997 (17%) exposed to both.
Use of Specific Drugs and Potentially Excessive Dosing
Table 2 demonstrates the most commonly used antipsychotic medications and the rates of potentially excessive dosing. Quetiapine and olanzapine were the most commonly used atypical antipsychotics, and haloperidol represented the majority of typical antipsychotic use. Among admissions with antipsychotic exposure, 47% received at least 1 potentially excessive daily dose, 18% of those with atypical exposure and 79% of those with typical exposure. Among admissions aged 65 years and up (n = 1,291,375), the prevalence of potentially excessive dosing was almost identical; 46% received at least 1 daily dose in excess of the recommended daily dose, 11% of those with atypical exposure and 79% of those with typical exposure.
| Agent |
Overall Prevalence,N = 2,695,081 |
% of Exposed With Potentially Excessive Dosing* | ||
|---|---|---|---|---|
| Within 100% of Recommended DD* | 101% to 150% of Recommended DD* | >150% of Recommended DD* | ||
| ||||
| Any antipsychotic | 6.0 | 52.9 | 20.2 | 26.9 |
| Atypical | 3.8 | 82.0 | 5.4 | 12.6 |
| Quetiapine (200) | 1.8 | 81.7 | 5.7 | 12.6 |
| Olanzapine (10) | 0.6 | 73.7 | 7.3 | 19.0 |
| Risperidone (2) | 0.9 | 79.2 | 6.8 | 14.0 |
| Other | 0.7 | 98.3 | 0.1 | 1.6 |
| Typical | 2.9 | 21.1 | 37.0 | 41.9 |
| Haloperidol (4) | 2.5 | 13.2 | 41.3 | 45.5 |
| Chlorpromazine (75) | 0.3 | 76.0 | 9.8 | 14.2 |
| Other | 0.4 | 89.1 | 2.9 | 8.0 |
Characteristics Associated With Antipsychotic Use
Among the patient and hospital characteristics included in our analysis, the 5 characteristics most strongly associated with antipsychotic exposure after adjustment were (Table 3): delirium (relative risk [RR]: 2.93, 95% confidence interval [CI]: 2.88‐2.98); dementia (RR: 2.78, 95% CI: 2.72‐2.83); insurance status, with higher risk among patients with traditional Medicare (RR: 2.09, 95% CI: 2.04‐2.13), Medicare managed (RR: 1.98, 95% CI: 1.93‐2.03), Medicaid (RR: 1.84, 95% CI: 1.80‐1.88), and self‐pay/other (RR: 1.26, 95% CI: 1.23‐1.29) compared to private (commercial) insurance; use of mechanical ventilation (RR: 1.84, 95% CI: 1.81‐1.87); and any ICU stay (RR: 1.53, 95% CI: 1.51‐1.55).
| Unadjusted RR of Receiving Any Antipsychotic [95% CI] | Adjusted RR of Receiving Any Antipsychotic [95% CI]* | |
|---|---|---|
| ||
| Age group, y, % | ||
| 65 | Reference | Reference |
| 6574 | 1.12 [1.10,1.14] | 0.74 [0.72, 0.75] |
| 75+ | 1.90 [1.88,1.92] | 1.03 [1.01, 1.05] |
| Gender | ||
| Female | Reference | Reference |
| Male | 1.19 [1.18,1.20] | 1.27 [1.26, 1.28] |
| Race | ||
| White | Reference | Reference |
| Black | 0.91 [0.90,0.92] | 0.85 [0.83, 0.86] |
| Hispanic | 0.80 [0.78,0.82] | 0.79 [0.76, 0.81] |
| Other | 0.99 [0.98,1.00] | 0.96 [0.95, 0.98] |
| Marital status | ||
| Married | Reference | Reference |
| Single | 1.57 [1.55,1.59] | 1.43 [1.42, 1.45] |
| Unknown/other | 1.41 [1.39,1.43] | 1.27 [1.24, 1.29] |
| Primary insurance | ||
| Private (commercial) | Reference | Reference |
| Medicaid | 2.13 [2.09,2.17] | 1.84 [1.80, 1.88] |
| Medicare managed | 2.35 [2.31,2.39] | 1.98 [1.93, 2.03] |
| Medicare traditional | 2.65 [2.61,2.69] | 2.09 [2.04, 2.13] |
| Self‐pay or other | 1.41 [1.38,1.44] | 1.26 [1.23, 1.29] |
| Admitting department | ||
| Surgical | Reference | Reference |
| Nonsurgical | 1.06 [1.05,1.07] | 1.05 [1.03, 1.06] |
| Any ICU stay | 2.05 [2.03,2.07] | 1.53 [1.51, 1.55] |
| Mechanical ventilation | 3.22 [3.18,3.26] | 1.84 [1.81, 1.87] |
| Diagnoses | ||
| Delirium | 5.48 [5.42, 5.45] | 2.93 [2.88, 2.98] |
| Dementia | 5.21 [5.15,5.27] | 2.78 [2.72, 2.83] |
| Insomnia | 1.72 [1.67,1.78] | 1.51 [1.45, 1.57] |
| No. of beds | ||
| 200 | Reference | Reference |
| 201300 | 1.01 [0.99,1.03] | 0.96 [0.94, 0.98] |
| 301500 | 0.98 [0.97,1.00] | 0.93 [0.91, 0.95] |
| 500+ | 0.97 [0.96,0.98] | 0.91 [0.90, 0.93] |
| Population served | ||
| Urban | Reference | Reference |
| Rural | 0.96 [0.95,0.98] | 0.91 [0.89, 0.93] |
| Teaching status | ||
| Teaching | Reference | Reference |
| Nonteaching | 1.03 [1.02,1.04] | 0.98 [0.97, 1.00] |
| US Census region | ||
| West | Reference | Reference |
| Northeast | 1.03 [1.01,1.05] | 1.04 [1.02, 1.06] |
| Midwest | 0.95 [0.94,0.97] | 0.93 [0.91, 0.94] |
| South | 1.02 [1.01,1.03] | 1.07 [1.05, 1.09] |
Hospital Variation in Antipsychotic Use
Figure 1 demonstrates the antipsychotic prescribing rate at each hospital in our cohort, and the corresponding quintiles. Patients admitted to hospitals in the highest prescribing quintile were more than twice as likely to be exposed to antipsychotics compared to patients admitted to hospitals in the lowest prescribing quintile, even after adjustment for patient characteristics and comorbidities (Table 4). This relationship was similar across subgroups of admissions with delirium and dementia (see Supporting Information, Appendix, in the online version of this article for the distribution of hospital antipsychotic prescribing rates before and after adjustment for patient characteristics).
| Admissions, No. (% of Total) | Unadjusted RR of Exposure [95% CI] | Adjusted RR of exposure [95% CI]* | |
|---|---|---|---|
| |||
| Overall | |||
| Q1 | 431,017 (16%) | Reference | Reference |
| Q2 | 630,486 (23%) | 1.67 [1.63, 1.71] | 1.59 [1.55, 1.62] |
| Q3 | 548,337 (20%) | 1.93 [1.88, 1.97] | 1.84 [1.80, 1.88] |
| Q4 | 639,027 (24%) | 2.16 [2.12, 2.21] | 2.07 [2.03, 2.12] |
| Q5 | 446,214 (17%) | 2.83 [2.77, 2.89] | 2.56 [2.50, 2.61] |
| Delirium | |||
| Q1 | 12,878 (15%) | Reference | Reference |
| Q2 | 20,588 (24%) | 1.58 [1.51, 1.65] | 1.58 [1.51, 1.65] |
| Q3 | 17,402 (20%) | 1.71 [1.64, 1.80] | 1.73 [1.65, 1.82] |
| Q4 | 20,943 (24%) | 2.01 [1.92, 2.10] | 1.99 [1.91, 2.08] |
| Q5 | 14,883 (17%) | 2.15 [2.05, 2.25] | 2.16 [2.07, 2.26] |
| Dementia | |||
| Q1 | 28,290 (15%) | Reference | Reference |
| Q2 | 42,018 (22%) | 1.43 [1.36, 1.50] | 1.40 [1.34, 1.47] |
| Q3 | 38,593 (21%) | 1.61 [1.53, 1.69] | 1.59 [1.51, 1.66] |
| Q4 | 44,638 (24%) | 1.69 [1.62, 1.77] | 1.69 [1.61, 1.77] |
| Q5 | 34,442 (18%) | 1.92 [1.83, 2.01] | 1.90 [1.81, 1.99] |
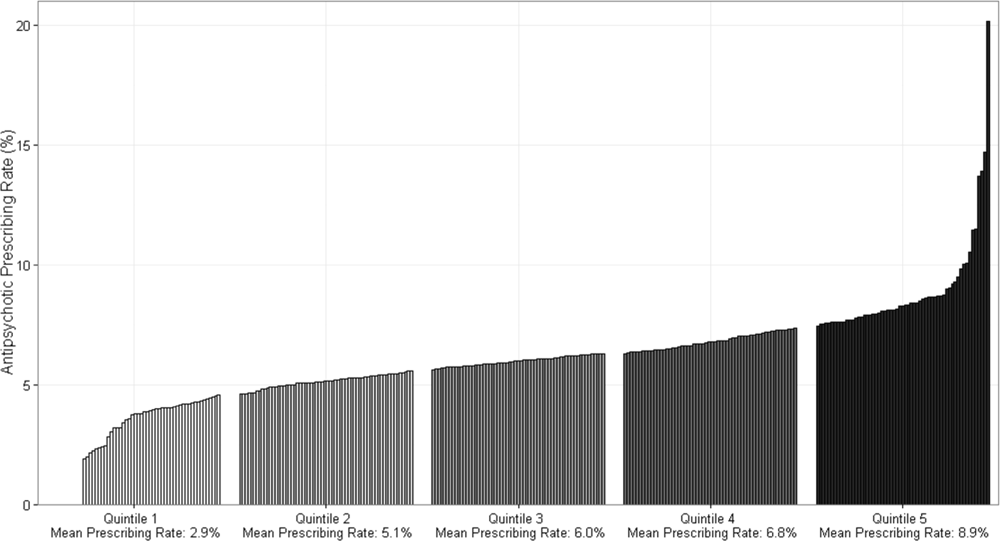
DISCUSSION
In this cohort of nonpsychiatric admissions to 300 US hospitals, antipsychotic medications were used in 6% of admissions, with atypical antipsychotics representing the majority of use. Potentially excessive daily doses based on CMS recommendations for long‐term care facilities occurred in almost half of admissions with any antipsychotic exposure, and in 87% of admissions with haloperidol exposure specifically. We found variation in hospital use of antipsychotics that was not fully accounted for by measured patient characteristics, and which persisted among subgroups of admissions with delirium and/or dementia. Although unmeasured patient characteristics or different billing practices between hospitals are potential explanations, our findings also raise the possibility of different hospital antipsychotic prescribing cultures. These findings provide new information regarding the scope of prescribing in US hospitals, and draw attention to the need for additional studies to better define what constitutes appropriate use of antipsychotics in the hospital setting.
A recent single‐center study at a large academic medical center found an overall antipsychotic exposure rate of 9% of nonpsychiatric admissions.[12] Our finding that 6% of admissions in this multicenter cohort were exposed to antipsychotics is slightly lower, but similar to the previous estimate. Assuming 37 million discharges from US hospitals each year,[13] our study suggests that more than 2 million hospitalized patients receive antipsychotics annually. With around 1.4 million residents in nursing homes on any given day,[14] and an exposure rate of 25% to 30% in that setting,[15, 16, 17] our study suggests that the number of patients exposed in the hospital setting is greater than the number exposed in the nursing home setting, the site of care for which prescribing regulations have been focused thus far.
Because our dataset does not contain preadmission medications, we were unable to specifically investigate new initiation. In the prior single‐center study, approximately 55% of overall use in the hospital setting was new initiation,[12] which would suggest that antipsychotics are newly initiated in around 1 million admissions each year in the hospital. Although we are unable to determine reason for use in our analysis, delirium was a strong predictor of antipsychotic use in our multivariable model, and prior studies have demonstrated delirium to be the most common reason for antipsychotic initiation in hospitalized patients,[12, 18] an indication for which efficacy/effectiveness data are lacking. A recent systematic review of antipsychotics for the treatment of delirium in older adults concluded that because of severe methodological limitations, the small number of existing studies on this topic do not support the use of antipsychotics in the treatment of delirium in older hospitalized adults.[19] Our results further highlight the need for randomized placebo‐controlled trials of antipsychotics in treatment of delirium.
We found variation in antipsychotic use between hospitals that was not fully explained by patient characteristics. Insufficient data to inform clinical decisions surrounding management of agitated delirium/dementia and lack of clear criteria by which to judge appropriateness of antipsychotic use may contribute to this variation. Some variation may relate to resource allocation at different hospitals, and the feasibility of implementing nonpharmacologic management options across settings. Our results collectively highlight the need for studies evaluating the efficacy/effectiveness of antipsychotics in the treatment of delirium and drivers of physician decision‐making in this realm, as well as the need for greater hospital investment in nonpharmacologic delirium‐prevention programs, which have been shown to be effective in prevention of delirium in hospitalized patients.[20]
We observed high levels of potentially excessive daily dosing using cutoffs applied in the long‐term care setting. The majority of the potentially excessive doses were in the setting of typical antipsychotic use, and haloperidol specifically, where doses exceeded 4 mg on at least 1 day in 87% of exposed admissions. Of note, the threshold for haloperidol dosage above which justification is required was decreased from 4 to 2 mg per day in the 2015 update to the CMS guidelines.[21] For the present analysis, we used the guidelines that were contemporaneous to our cohort; we are unable to determine current rates of potentially inappropriate dosages in the present analysis, but given the high prevalence in 2009 to 2010, and the lowering of the dosage threshold since then, it is unlikely that any decrease in use would be enough to substantially reduce the estimate. Whether these high dosages are actually inappropriate in the hospital setting is not established, and we were not able to review medical records to determine whether justification for use of such doses was documented.[22, 23] It is possible that hospitalized patients with altered pharmacodynamics and greater severity of illness could require larger doses of these medications; however, this is an area in need of further investigation, and current critical care guidelines note the lack of sufficient data upon which to justify use of haloperidol in the prevention or treatment of delirium in ICU patients.[24, 25]
The dosages in use are concerning given that the risk of extrapyramidal side effects increases with increasing dose, and prior studies have demonstrated an association between increased dose of antipsychotics and increased risk of other adverse events, including hip fracture and sudden cardiac death.[22, 23] Further, despite these known risks, studies have demonstrated failure to follow recommendations to mitigate risk,[26] such as electrocardiogram monitoring in individuals receiving intravenous haloperidol.[27] Our results suggest that physicians are similarly not following recommendations to use lower doses of haloperidol when treating older patients, given the almost identical incidence of potentially excessive dosing among admissions of patients aged 65 years and older in our cohort.[25] Clinical decision support prompts have been effective at increasing appropriate use of antipsychotic medications in several single‐center analyses,[28, 29, 30] and widespread implementation of such support with a focus on haloperidol dosing should be considered on the basis of our results.
The patient characteristics associated with antipsychotic use in this large, nationally representative analysis are consistent with those identified in prior single‐center analyses.[12, 18] Both prior analyses identified delirium as the most common reason for antipsychotic use, and dementia, intensive care unit stay, and mechanical ventilation were also previously identified as strong predictors of use that we believe hold face validity for the practicing hospitalist. On the other hand, some of the factors associated with antipsychotic use in our model cannot be readily explained, such as insurance status and race, and may be serving as proxies for other variables not included in our analysis. That nonwhite patients are less likely than white patients to receive antipsychotic medications in the hospital has been previously demonstrated,[12] and further investigation to understand this disparity is warranted.
Our study has several additional limitations. First, because our study is observational, the possibility of residual confounding exists, and we cannot rule out that there are other patient factors driving the hospital variation in antipsychotic use that we observed. Second, because guidelines do not exist for antipsychotic dosing in hospitalized patients, we could only comment on potentially excessive dosing, extrapolating from guidelines in the long‐term care setting. Whether such doses are actually excessive in hospitalized patients is not defined. Third, although Premier performs quality checks on charge and ICD‐9‐CM coding data submitted by participating hospitals, the validity of administrative data is uncertain. For example, the use of administrative data to identify delirium diagnoses is likely to have resulted in underestimation of delirium incidence among our different exposure groups. Delirium is likely to be coded more often in the setting of more severe or hyperactive cases, when antipsychotics are more likely to be utilized. This could result in an overestimation of the association between delirium and antipsychotic use. Additionally, differences in coding practices between hospitals for any of the variables in our models could explain some of the variation in antipsychotic prescribing that we observed. Finally, because we were unable to differentiate between new initiation and continuation of a preadmission antipsychotic, some of the variation that we observed is likely to reflect differences in outpatient antipsychotic prescribing practices.
In conclusion, in this large cohort of nonpsychiatric admissions to 300 US hospitals, we found that antipsychotic medication exposure was common, often at high daily doses. Delirium and dementia were the strongest predictors of use among the patient and hospital characteristics examined. The variation in antipsychotic prescribing that we observed was not fully accounted for by measured patient characteristics, and raises the possibility of differing hospital prescribing cultures. Our results draw attention to the need for additional research to better define what constitutes appropriate use of these potentially harmful medications in the hospital setting.
Disclosures: Dr. Herzig had full access to all of the data in the study and takes responsibility for the integrity of the data and the accuracy of the data analysis. Study concept and design: Drs. Herzig, Rothberg, Gurwitz, and Marcantonio. Acquisition of data: Dr. Herzig. Analysis of data: Mr. Guess. Interpretation of data: Drs. Herzig, Rothberg, Gurwitz, Marcantonio, and Mr. Guess. Drafting of the manuscript: Dr. Herzig. Critical revision of the manuscript for important intellectual content: Drs. Rothberg, Gurwitz, Marcantonio, and Mr. Guess. Dr. Herzig was funded by grant number K23AG042459 from the National Institute on Aging. Dr. Marcantonio was funded by grant number K24AG035075 from the National Institute on Aging. The funding organizations had no involvement in any aspect of the study, including design and conduct of the study; collection, management, analysis, and interpretation of the data; and preparation, review, or approval of the manuscript. The authors report no conflicts of interest.
- , , , et al. Variation in nursing home antipsychotic prescribing rates. Arch Intern Med. 2007;167(7):676–683.
- , . Precipitating factors for delirium in hospitalized elderly persons. Predictive model and interrelationship with baseline vulnerability. JAMA. 1996;275(11):852–857.
- , , , , . A predictive model for delirium in hospitalized elderly medical patients based on admission characteristics. Ann Intern Med. 1993;119(6):474–481.
- , , , , , . Delirium in hospitalized older persons: outcomes and predictors. J Am Geriatr Soc. 1994;42(8):809–815.
- , , , . Small‐area variations in the use of common surgical procedures: an international comparison of New England, England, and Norway. N Engl J Med. 1982;307(21):1310–1314.
- Premier Research Services. Available at: https://www.premierinc.com/transforming‐healthcare/healthcare‐performance‐improvement/premier‐research‐services. Accessed March 15, 2016.
- U.S. Food and Drug Administration. Atypical antipsychotic drugs information. Available at: http://www.fda.gov/drugs/drugsafety/postmarketdrugsafetyinformationforpatientsandproviders/ucm094303.htm. Accessed November 1, 2015.
- U.S. Food and Drug Administration. Information on conventional antipsychotics. Available at: http://www.fda.gov/drugs/drugsafety/postmarketdrugsafetyinformationforpatientsandproviders/ucm107211. htm. Accessed November 1, 2015.
- Centers for Medicare and Medicaid Services. State Operations Manual. Appendix PP: guidance to surveyors for long‐term care facilities. Available at: https://www.cms.gov/Medicare/Provider‐Enrollment‐and‐Certification/GuidanceforLawsAndRegulations/Downloads/som107 ap_pp_guidelines_ltcf.pdf. Revised October 14, 2005. Accessed March 15, 2016.
- . A modified Poisson regression approach to prospective studies with binary data. Am J Epidemiol. 2004;159(7):702–706.
- Healthcare Cost and Utilization Project. Comorbidity software, version 3.7. Agency for Healthcare Research and Quality, Rockville, MD. Available at: http://www.hcup‐us.ahrq.gov/toolssoftware/comorbidity/comorbidity.jsp. Accessed March 15, 2016.
- , , , et al. Antipsychotic use in hospitalized adults: rates, indications, and predictors. J Am Geriatr Soc. 2016;64(2):299–305.
- , . Overview of hospital stays in the United States, 2012. HCUP Statistical Brief #180. Agency for Healthcare Research and Quality, Rockville, MD. Available at: http://www.hcup‐us.ahrq.gov/reports/statbriefs/sb180‐Hospitalizations‐United‐States‐2012.pdf. Published October 2014. Accessed June 29, 2015.
- , , , . Long‐term care services in the United States: 2013 overview. Vital Health Stat 3. 2013;(37):1–107. Available at: http://www.cdc.gov/nchs/data/nsltcp/long_term_care_services_2013.pdf. Accessed March 16, 2016.
- , , , et al. The quality of antipsychotic drug prescribing in nursing homes. Arch Intern Med. 2005;165(11):1280–1285.
- , , , , , . Unexplained variation across US nursing homes in antipsychotic prescribing rates. Arch Intern Med. 2010;170(1):89–95.
- , , , , . Broadened use of atypical antipsychotics: safety, effectiveness, and policy challenges. Health Aff (Millwood). 2009;28(5):w770–w781.
- , , , , , . From hospital to community: use of antipsychotics in hospitalized elders. J Hosp Med. 2014;9(12):802–804.
- , , . Antipsychotics in the treatment of delirium in older hospitalized adults: a systematic review. J Am Geriatr Soc. 2011;59(suppl 2):S269–S276.
- , , , et al. Effectiveness of multicomponent nonpharmacological delirium interventions: a meta‐analysis. JAMA Intern Med. 2015;175(4):512–520.
- Centers for Medicare and Medicaid Services. State operations manual, appendix PP: guidance to surveyors for long‐term care facilities. Available at: https://www.cms.gov/Regulations‐and‐Guidance/Guidance/Manuals/downloads/som107ap_pp_guidelines_ltcf.pdf. Revised October 9, 2015. Accessed February 22, 2016.
- , , , , . Psychotropic drug use and the risk of hip fracture. N Engl J Med. 1987;316(7):363–369.
- , , , , . Atypical antipsychotic drugs and the risk of sudden cardiac death. N Engl J Med. 2009;360(3):225–235.
- , , , et al. Clinical practice guidelines for the management of pain, agitation, and delirium in adult patients in the intensive care unit. Crit Care Med. 2013;41(1):263–306.
- , , , , . Haloperidol overdosing in the treatment of agitated hospitalized older people with delirium: a retrospective chart review from a community teaching hospital. Drugs Aging. 2013;30(8):639–644.
- , , , . Unsafe use of intravenous haloperidol: evaluation of recommendation‐concordant care in hospitalized elderly adults. J Am Geriatr Soc. 2013;61(1):160–161.
- U.S. Food and Drug Administration. HALDOL brand of haloperidol injection. Available at: http://www.accessdata.fda.gov/drugsatfda_docs/label/2008/015923s082,018701s057lbl.pdf. Accessed February 23, 2016.
- , , , . Preventing potentially inappropriate medication use in hospitalized older patients with a computerized provider order entry warning system. Arch Intern Med. 2010;170(15):1331–1336.
- , , , et al. A standardized, bundled approach to providing geriatric‐focused acute care. J Am Geriatr Soc. 2014;62(5):936–942.
- , , , . Don't fuel the fire: decreasing intravenous haloperidol use in high risk patients via a customized electronic alert. J Am Med Inform Assoc. 2014;21(6):1109–1112.
Antipsychotic medications are frequently used off label for management of behavioral symptoms associated with delirium and/or dementia. Despite regulations designed to curb inappropriate prescribing of these medications in nursing homes, substantial levels of use and variation in use have been observed in this setting.[1] Although antipsychotic medications are also frequently used in the hospital, the scope and variation in use have not been adequately investigated. Given the lack of oversight for medication prescribing in the hospital setting and the frequency of delirium, occurring in 15% to 26% of hospitalized older adults,[2, 3, 4] off‐label use of antipsychotic medications and variation in use could be substantial.
Because variation in practice is known to increase in the setting of controversy or lack of clarity regarding appropriate management,[5] large degrees of variation can draw attention to priority areas for clinical effectiveness studies, and the need for guidelines, clinical decision support, or regulatory oversight. In the absence of clear guidelines for the use of antipsychotic medication in nonpsychiatric hospitalized patients, we hypothesized that significant variation in use would persist after controlling for patient characteristics. Using a large, nationally representative cohort of admissions to 300 hospitals from July 2009 to June 2010, we sought to investigate prescribing patterns and hospital variation in use of antipsychotic medications in nonpsychiatric admissions to US hospitals.
METHODS
Setting and Data Collection
We conducted a retrospective cohort study using data from 300 US, nonfederal, acute care facilities contributing to the database maintained by Premier (Premier Healthcare Solutions, Inc., Charlotte, NC). This nationally representative database, created to measure healthcare utilization and quality of care, is drawn from voluntarily participating hospitals and contains data on approximately 1 in every 4 discharges nationwide.[6] Participating hospitals are similar in geographic distribution and urban/rural status to hospitals nationwide, although large, nonteaching hospitals are slightly over‐represented. The study was approved by the institutional review board at Beth Israel Deaconess Medical Center.
Inclusion and Exclusion Criteria
We studied a cohort of all adult (18 years) nonpsychiatric admissions to participating hospitals from July 1, 2009 through June 30, 2010. We excluded patients admitted to a psychiatry service or with any discharge diagnosis of a psychotic disorder (defined by the Elixhauser comorbidity Psychoses: 295.00‐298.9, 299.10‐299.11), because we were interested in use of antipsychotics for conditions other than primary psychiatric disorders. We also excluded patients with a charge for labor and delivery owing to the nonrepresentativeness of this patient population for the general hospitalized patient. We excluded admissions with unknown gender, and admissions with a length of stay greater than 365 days, as these admissions are not representative of the typical admission to an acute care hospital. We also excluded hospitals contributing less than 100 admissions owing to lack of precision in corresponding hospital prescribing rates.
Antipsychotic Medication Utilization
In‐hospital antipsychotic use was ascertained from pharmacy charges, reflecting each medication dispensed during the hospitalization. We categorized antipsychotic medications as typical (haloperidol, loxapine, thioridazine, molindone, thiothixine, pimozide, fluphenazine, trifluoperazine, chlorpromazine, and perphenazine) and atypical (aripiprazole, asenapine, clozapine, iloperidone, lurasidone, olanzapine, paliperidone, quetiapine, risperidone, and ziprasidone) based on classification by the Food and Drug Administration.[7, 8] We excluded prochlorperazine (Compazine) from our typical antipsychotic definition, as this medication is almost exclusively used as an antiemetic.
In the absence of guidelines for use of antipsychotic agents in hospitalized patients, we used the Centers for Medicare and Medicaid Services (CMS) guidelines for long‐term care facilities to define measures of potentially excessive dosing in the hospital setting.[9] These guidelines define the daily dosage levels of antipsychotics above which the medical necessity of the higher dose should be explained in the medical record. We defined any daily dosage above these specified levels as a potentially excessive daily dose.
Characteristics Associated With Use
We investigated the association between antipsychotic use and patient and hospital characteristics, selected based on clinical grounds. Patient characteristics included: (1) demographic variables such as age (65, 6574, 75+ years), gender, self‐reported race, marital status, and primary insurance; (2) admission characteristic variables, including admitting department (surgical vs nonsurgical, defined by a surgical attending of record and presence of operating room charges), whether the patient spent any time in the intensive care unit (ICU), and whether they received mechanical ventilation; and (3) potential indications for use, including delirium (included delirium superimposed upon dementia), dementia (without delirium), and insomnia (see Supporting Information, Appendix, in the online version of this article for International Classification of Diseases, Ninth Revision, Clinical Modification [ICD‐9‐CM] codes). Hospital characteristics included number of beds, urban versus rural status, teaching status, and US Census region.
Statistical Analysis
We report the proportion of admissions with in‐hospital use of any antipsychotic, and the number of days of exposure, overall and stratified by typical and atypical.
We determined potentially excessive dosing by taking the sum of the doses for a specific antipsychotic charged on a given day and comparing it to the CMS guidelines for long‐term care settings described above. We report the percentage of exposed admissions with at least 1 day of potentially excessive dosing.
All multivariable models below were operationalized as generalized estimating equations with a Poisson error term, log link, robust variance estimator,[10] and an exchangeable correlation structure to account for repeated admissions of the same patient.
We investigated patient and hospital characteristics associated with use of any antipsychotic medication using a multivariable model that simultaneously included all patient and hospital characteristics in Table 1 as independent variables.
| % of Cohort | Any Exposure, % | Typical Exposure, % | Atypical Exposure, % | |
|---|---|---|---|---|
| ||||
| Patient characteristics | ||||
| Age group, y | ||||
| 65 | 52.1 | 4.6 | 2.0 | 3.1 |
| 6574 | 18.5 | 5.2 | 2.7 | 3.1 |
| 75+ | 29.4 | 8.8 | 4.6 | 5.4 |
| Gender | ||||
| Male | 43.8 | 6.6 | 3.6 | 3.8 |
| Female | 56.2 | 5.5 | 2.3 | 3.8 |
| Race | ||||
| White | 64.6 | 6.1 | 2.9 | 4.0 |
| Black | 13.5 | 5.5 | 2.8 | 3.3 |
| Hispanic | 5.0 | 4.9 | 2.2 | 3.2 |
| Other | 19.9 | 6.1 | 3.1 | 3.7 |
| Marital Status | ||||
| Married | 42.5 | 4.6 | 2.4 | 2.7 |
| Single | 46.7 | 7.2 | 3.2 | 4.7 |
| Unknown/other | 10.8 | 6.4 | 3.1 | 4.1 |
| Primary insurance | ||||
| Private (commercial) | 28.8 | 3.0 | 1.5 | 1.8 |
| Medicaid | 10.3 | 6.4 | 2.4 | 4.6 |
| Medicare managed | 10.6 | 7.1 | 4.1 | 4.0 |
| Medicare traditional | 40.9 | 8.0 | 3.7 | 5.3 |
| Self‐pay or other | 9.4 | 4.3 | 2.5 | 2.2 |
| Admitting department | ||||
| Surgical | 60.6 | 5.8 | 3.1 | 3.4 |
| Nonsurgical | 39.4 | 6.2 | 2.4 | 4.4 |
| Any ICU stay | 16.6 | 10.4 | 7.2 | 4.9 |
| Mechanical ventilation | 4.7 | 17.4 | 12.9 | 7.9 |
| Diagnoses | ||||
| Delirium | 3.2 | 28.6 | 19.4 | 15.7 |
| Dementia | 3.1 | 27.4 | 12.0 | 20.2 |
| Insomnia | 1.3 | 10.2 | 3.9 | 7.5 |
| Discharge disposition | ||||
| Home | 77.9 | 3.8 | 1.6 | 2.5 |
| SNF/Rehab | 15.5 | 13.7 | 6.8 | 9.0 |
| Hospice | 1.7 | 16.0 | 10.3 | 8.1 |
| Other | 4.9 | 11.6 | 7.6 | 5.7 |
| Hospital characteristics, % | ||||
| No. of beds | ||||
| 200 | 14.1 | 6.1 | 2.8 | 3.8 |
| 201300 | 18.6 | 6.1 | 2.9 | 3.9 |
| 301500 | 37.7 | 5.9 | 2.9 | 3.7 |
| 500+ | 29.7 | 5.9 | 2.8 | 3.8 |
| Population served | ||||
| Urban | 89.4 | 6.0 | 2.9 | 3.8 |
| Rural | 10.6 | 5.8 | 2.4 | 3.9 |
| Teaching status | ||||
| Teaching | 39.2 | 5.8 | 2.9 | 3.7 |
| Nonteaching | 60.8 | 6.0 | 2.8 | 3.9 |
| US Census region | ||||
| West | 16.9 | 5.9 | 3.2 | 3.5 |
| Northeast | 20.1 | 6.1 | 2.9 | 3.9 |
| Midwest | 21.9 | 5.7 | 2.5 | 3.8 |
| South | 41.0 | 6.1 | 2.9 | 3.9 |
To determine hospital variation in antipsychotic use, we first determined the proportion of admissions at each hospital with at least 1 charge for antipsychotic medication. We then divided hospitals into quintiles based on their facility‐level antipsychotic prescribing rates and assigned all admissions to their corresponding hospital quintile. We then used a multivariable model to measure the adjusted association between prescribing quintile and patient‐level receipt of antipsychotic medication, controlling for all patient characteristics listed in Table 1 (except discharge disposition), and comorbidities using the Healthcare Cost and Utilization Project Comorbidity Software version 3.7 (Agency for Healthcare Research and Quality, Rockville, MD).[11] We used the lowest prescribing quintile as the reference group. We also report in the Supporting Information, Appendix, in the online version of this article, the distribution of prescribing rates for the hospitals in our cohort before and after adjustment for patient characteristics. For both approaches, we conducted stratified analyses in admissions with delirium and dementia.
All analyses were carried out using SAS software (SAS Institute Inc., Cary, NC).
RESULTS
Admission Characteristics
There were 3,190,934 admissions aged 18 years and over to 300 hospitals from July 1, 2009 to June 30, 2010. After excluding admissions with unknown gender (n = 17), length of stay greater than 365 days (n = 25), charges for labor and delivery (n = 323,111) or a psychiatric attending of record or psychiatric comorbidity (n = 172,669), and admissions to hospitals with fewer than 100 admissions (n = 31), our cohort included 2,695,081 admissions. The median age was 63 years (25th, 75th percentile 48, 77 years), and 1,514,986 (56%) were women. Table 1 shows the overall admission characteristics of the cohort and the percent exposed to antipsychotics among each patient and hospital characteristic.
Antipsychotic Use
There were 160,773 (6%) admissions with antipsychotic exposure. Among exposed admissions, 102,148 (64%) received atypical and 76,979 (48%) received typical antipsychotics, with 18,354 (11%) exposed to both. The median (25th, 75th percentile) length of stay among exposed was 5 days (3, 9 days), and the median (25th, 75th percentile) number of days of exposure was 3 (1, 5 days) overall, 3 days (2, 6 days) for atypical and 2 days (1, 3 days) for typical exposure.
Among admissions aged 65 to 74 years, 25,855 (5%) were exposed. Among admissions aged 75 years or older, 69,792 (9%) were exposed. Among admissions with delirium, exposure occurred in 24,787 (29%), with 13,640 (55%) receiving atypical, 16,828 (68%) receiving typical, and 5681 (23%) exposed to both. Among admissions with dementia, exposure occurred in 23,179 (27%), with 17,068 (74%) receiving atypical, 10,108 (44%) receiving typical, and 3997 (17%) exposed to both.
Use of Specific Drugs and Potentially Excessive Dosing
Table 2 demonstrates the most commonly used antipsychotic medications and the rates of potentially excessive dosing. Quetiapine and olanzapine were the most commonly used atypical antipsychotics, and haloperidol represented the majority of typical antipsychotic use. Among admissions with antipsychotic exposure, 47% received at least 1 potentially excessive daily dose, 18% of those with atypical exposure and 79% of those with typical exposure. Among admissions aged 65 years and up (n = 1,291,375), the prevalence of potentially excessive dosing was almost identical; 46% received at least 1 daily dose in excess of the recommended daily dose, 11% of those with atypical exposure and 79% of those with typical exposure.
| Agent |
Overall Prevalence,N = 2,695,081 |
% of Exposed With Potentially Excessive Dosing* | ||
|---|---|---|---|---|
| Within 100% of Recommended DD* | 101% to 150% of Recommended DD* | >150% of Recommended DD* | ||
| ||||
| Any antipsychotic | 6.0 | 52.9 | 20.2 | 26.9 |
| Atypical | 3.8 | 82.0 | 5.4 | 12.6 |
| Quetiapine (200) | 1.8 | 81.7 | 5.7 | 12.6 |
| Olanzapine (10) | 0.6 | 73.7 | 7.3 | 19.0 |
| Risperidone (2) | 0.9 | 79.2 | 6.8 | 14.0 |
| Other | 0.7 | 98.3 | 0.1 | 1.6 |
| Typical | 2.9 | 21.1 | 37.0 | 41.9 |
| Haloperidol (4) | 2.5 | 13.2 | 41.3 | 45.5 |
| Chlorpromazine (75) | 0.3 | 76.0 | 9.8 | 14.2 |
| Other | 0.4 | 89.1 | 2.9 | 8.0 |
Characteristics Associated With Antipsychotic Use
Among the patient and hospital characteristics included in our analysis, the 5 characteristics most strongly associated with antipsychotic exposure after adjustment were (Table 3): delirium (relative risk [RR]: 2.93, 95% confidence interval [CI]: 2.88‐2.98); dementia (RR: 2.78, 95% CI: 2.72‐2.83); insurance status, with higher risk among patients with traditional Medicare (RR: 2.09, 95% CI: 2.04‐2.13), Medicare managed (RR: 1.98, 95% CI: 1.93‐2.03), Medicaid (RR: 1.84, 95% CI: 1.80‐1.88), and self‐pay/other (RR: 1.26, 95% CI: 1.23‐1.29) compared to private (commercial) insurance; use of mechanical ventilation (RR: 1.84, 95% CI: 1.81‐1.87); and any ICU stay (RR: 1.53, 95% CI: 1.51‐1.55).
| Unadjusted RR of Receiving Any Antipsychotic [95% CI] | Adjusted RR of Receiving Any Antipsychotic [95% CI]* | |
|---|---|---|
| ||
| Age group, y, % | ||
| 65 | Reference | Reference |
| 6574 | 1.12 [1.10,1.14] | 0.74 [0.72, 0.75] |
| 75+ | 1.90 [1.88,1.92] | 1.03 [1.01, 1.05] |
| Gender | ||
| Female | Reference | Reference |
| Male | 1.19 [1.18,1.20] | 1.27 [1.26, 1.28] |
| Race | ||
| White | Reference | Reference |
| Black | 0.91 [0.90,0.92] | 0.85 [0.83, 0.86] |
| Hispanic | 0.80 [0.78,0.82] | 0.79 [0.76, 0.81] |
| Other | 0.99 [0.98,1.00] | 0.96 [0.95, 0.98] |
| Marital status | ||
| Married | Reference | Reference |
| Single | 1.57 [1.55,1.59] | 1.43 [1.42, 1.45] |
| Unknown/other | 1.41 [1.39,1.43] | 1.27 [1.24, 1.29] |
| Primary insurance | ||
| Private (commercial) | Reference | Reference |
| Medicaid | 2.13 [2.09,2.17] | 1.84 [1.80, 1.88] |
| Medicare managed | 2.35 [2.31,2.39] | 1.98 [1.93, 2.03] |
| Medicare traditional | 2.65 [2.61,2.69] | 2.09 [2.04, 2.13] |
| Self‐pay or other | 1.41 [1.38,1.44] | 1.26 [1.23, 1.29] |
| Admitting department | ||
| Surgical | Reference | Reference |
| Nonsurgical | 1.06 [1.05,1.07] | 1.05 [1.03, 1.06] |
| Any ICU stay | 2.05 [2.03,2.07] | 1.53 [1.51, 1.55] |
| Mechanical ventilation | 3.22 [3.18,3.26] | 1.84 [1.81, 1.87] |
| Diagnoses | ||
| Delirium | 5.48 [5.42, 5.45] | 2.93 [2.88, 2.98] |
| Dementia | 5.21 [5.15,5.27] | 2.78 [2.72, 2.83] |
| Insomnia | 1.72 [1.67,1.78] | 1.51 [1.45, 1.57] |
| No. of beds | ||
| 200 | Reference | Reference |
| 201300 | 1.01 [0.99,1.03] | 0.96 [0.94, 0.98] |
| 301500 | 0.98 [0.97,1.00] | 0.93 [0.91, 0.95] |
| 500+ | 0.97 [0.96,0.98] | 0.91 [0.90, 0.93] |
| Population served | ||
| Urban | Reference | Reference |
| Rural | 0.96 [0.95,0.98] | 0.91 [0.89, 0.93] |
| Teaching status | ||
| Teaching | Reference | Reference |
| Nonteaching | 1.03 [1.02,1.04] | 0.98 [0.97, 1.00] |
| US Census region | ||
| West | Reference | Reference |
| Northeast | 1.03 [1.01,1.05] | 1.04 [1.02, 1.06] |
| Midwest | 0.95 [0.94,0.97] | 0.93 [0.91, 0.94] |
| South | 1.02 [1.01,1.03] | 1.07 [1.05, 1.09] |
Hospital Variation in Antipsychotic Use
Figure 1 demonstrates the antipsychotic prescribing rate at each hospital in our cohort, and the corresponding quintiles. Patients admitted to hospitals in the highest prescribing quintile were more than twice as likely to be exposed to antipsychotics compared to patients admitted to hospitals in the lowest prescribing quintile, even after adjustment for patient characteristics and comorbidities (Table 4). This relationship was similar across subgroups of admissions with delirium and dementia (see Supporting Information, Appendix, in the online version of this article for the distribution of hospital antipsychotic prescribing rates before and after adjustment for patient characteristics).
| Admissions, No. (% of Total) | Unadjusted RR of Exposure [95% CI] | Adjusted RR of exposure [95% CI]* | |
|---|---|---|---|
| |||
| Overall | |||
| Q1 | 431,017 (16%) | Reference | Reference |
| Q2 | 630,486 (23%) | 1.67 [1.63, 1.71] | 1.59 [1.55, 1.62] |
| Q3 | 548,337 (20%) | 1.93 [1.88, 1.97] | 1.84 [1.80, 1.88] |
| Q4 | 639,027 (24%) | 2.16 [2.12, 2.21] | 2.07 [2.03, 2.12] |
| Q5 | 446,214 (17%) | 2.83 [2.77, 2.89] | 2.56 [2.50, 2.61] |
| Delirium | |||
| Q1 | 12,878 (15%) | Reference | Reference |
| Q2 | 20,588 (24%) | 1.58 [1.51, 1.65] | 1.58 [1.51, 1.65] |
| Q3 | 17,402 (20%) | 1.71 [1.64, 1.80] | 1.73 [1.65, 1.82] |
| Q4 | 20,943 (24%) | 2.01 [1.92, 2.10] | 1.99 [1.91, 2.08] |
| Q5 | 14,883 (17%) | 2.15 [2.05, 2.25] | 2.16 [2.07, 2.26] |
| Dementia | |||
| Q1 | 28,290 (15%) | Reference | Reference |
| Q2 | 42,018 (22%) | 1.43 [1.36, 1.50] | 1.40 [1.34, 1.47] |
| Q3 | 38,593 (21%) | 1.61 [1.53, 1.69] | 1.59 [1.51, 1.66] |
| Q4 | 44,638 (24%) | 1.69 [1.62, 1.77] | 1.69 [1.61, 1.77] |
| Q5 | 34,442 (18%) | 1.92 [1.83, 2.01] | 1.90 [1.81, 1.99] |
DISCUSSION
In this cohort of nonpsychiatric admissions to 300 US hospitals, antipsychotic medications were used in 6% of admissions, with atypical antipsychotics representing the majority of use. Potentially excessive daily doses based on CMS recommendations for long‐term care facilities occurred in almost half of admissions with any antipsychotic exposure, and in 87% of admissions with haloperidol exposure specifically. We found variation in hospital use of antipsychotics that was not fully accounted for by measured patient characteristics, and which persisted among subgroups of admissions with delirium and/or dementia. Although unmeasured patient characteristics or different billing practices between hospitals are potential explanations, our findings also raise the possibility of different hospital antipsychotic prescribing cultures. These findings provide new information regarding the scope of prescribing in US hospitals, and draw attention to the need for additional studies to better define what constitutes appropriate use of antipsychotics in the hospital setting.
A recent single‐center study at a large academic medical center found an overall antipsychotic exposure rate of 9% of nonpsychiatric admissions.[12] Our finding that 6% of admissions in this multicenter cohort were exposed to antipsychotics is slightly lower, but similar to the previous estimate. Assuming 37 million discharges from US hospitals each year,[13] our study suggests that more than 2 million hospitalized patients receive antipsychotics annually. With around 1.4 million residents in nursing homes on any given day,[14] and an exposure rate of 25% to 30% in that setting,[15, 16, 17] our study suggests that the number of patients exposed in the hospital setting is greater than the number exposed in the nursing home setting, the site of care for which prescribing regulations have been focused thus far.
Because our dataset does not contain preadmission medications, we were unable to specifically investigate new initiation. In the prior single‐center study, approximately 55% of overall use in the hospital setting was new initiation,[12] which would suggest that antipsychotics are newly initiated in around 1 million admissions each year in the hospital. Although we are unable to determine reason for use in our analysis, delirium was a strong predictor of antipsychotic use in our multivariable model, and prior studies have demonstrated delirium to be the most common reason for antipsychotic initiation in hospitalized patients,[12, 18] an indication for which efficacy/effectiveness data are lacking. A recent systematic review of antipsychotics for the treatment of delirium in older adults concluded that because of severe methodological limitations, the small number of existing studies on this topic do not support the use of antipsychotics in the treatment of delirium in older hospitalized adults.[19] Our results further highlight the need for randomized placebo‐controlled trials of antipsychotics in treatment of delirium.
We found variation in antipsychotic use between hospitals that was not fully explained by patient characteristics. Insufficient data to inform clinical decisions surrounding management of agitated delirium/dementia and lack of clear criteria by which to judge appropriateness of antipsychotic use may contribute to this variation. Some variation may relate to resource allocation at different hospitals, and the feasibility of implementing nonpharmacologic management options across settings. Our results collectively highlight the need for studies evaluating the efficacy/effectiveness of antipsychotics in the treatment of delirium and drivers of physician decision‐making in this realm, as well as the need for greater hospital investment in nonpharmacologic delirium‐prevention programs, which have been shown to be effective in prevention of delirium in hospitalized patients.[20]
We observed high levels of potentially excessive daily dosing using cutoffs applied in the long‐term care setting. The majority of the potentially excessive doses were in the setting of typical antipsychotic use, and haloperidol specifically, where doses exceeded 4 mg on at least 1 day in 87% of exposed admissions. Of note, the threshold for haloperidol dosage above which justification is required was decreased from 4 to 2 mg per day in the 2015 update to the CMS guidelines.[21] For the present analysis, we used the guidelines that were contemporaneous to our cohort; we are unable to determine current rates of potentially inappropriate dosages in the present analysis, but given the high prevalence in 2009 to 2010, and the lowering of the dosage threshold since then, it is unlikely that any decrease in use would be enough to substantially reduce the estimate. Whether these high dosages are actually inappropriate in the hospital setting is not established, and we were not able to review medical records to determine whether justification for use of such doses was documented.[22, 23] It is possible that hospitalized patients with altered pharmacodynamics and greater severity of illness could require larger doses of these medications; however, this is an area in need of further investigation, and current critical care guidelines note the lack of sufficient data upon which to justify use of haloperidol in the prevention or treatment of delirium in ICU patients.[24, 25]
The dosages in use are concerning given that the risk of extrapyramidal side effects increases with increasing dose, and prior studies have demonstrated an association between increased dose of antipsychotics and increased risk of other adverse events, including hip fracture and sudden cardiac death.[22, 23] Further, despite these known risks, studies have demonstrated failure to follow recommendations to mitigate risk,[26] such as electrocardiogram monitoring in individuals receiving intravenous haloperidol.[27] Our results suggest that physicians are similarly not following recommendations to use lower doses of haloperidol when treating older patients, given the almost identical incidence of potentially excessive dosing among admissions of patients aged 65 years and older in our cohort.[25] Clinical decision support prompts have been effective at increasing appropriate use of antipsychotic medications in several single‐center analyses,[28, 29, 30] and widespread implementation of such support with a focus on haloperidol dosing should be considered on the basis of our results.
The patient characteristics associated with antipsychotic use in this large, nationally representative analysis are consistent with those identified in prior single‐center analyses.[12, 18] Both prior analyses identified delirium as the most common reason for antipsychotic use, and dementia, intensive care unit stay, and mechanical ventilation were also previously identified as strong predictors of use that we believe hold face validity for the practicing hospitalist. On the other hand, some of the factors associated with antipsychotic use in our model cannot be readily explained, such as insurance status and race, and may be serving as proxies for other variables not included in our analysis. That nonwhite patients are less likely than white patients to receive antipsychotic medications in the hospital has been previously demonstrated,[12] and further investigation to understand this disparity is warranted.
Our study has several additional limitations. First, because our study is observational, the possibility of residual confounding exists, and we cannot rule out that there are other patient factors driving the hospital variation in antipsychotic use that we observed. Second, because guidelines do not exist for antipsychotic dosing in hospitalized patients, we could only comment on potentially excessive dosing, extrapolating from guidelines in the long‐term care setting. Whether such doses are actually excessive in hospitalized patients is not defined. Third, although Premier performs quality checks on charge and ICD‐9‐CM coding data submitted by participating hospitals, the validity of administrative data is uncertain. For example, the use of administrative data to identify delirium diagnoses is likely to have resulted in underestimation of delirium incidence among our different exposure groups. Delirium is likely to be coded more often in the setting of more severe or hyperactive cases, when antipsychotics are more likely to be utilized. This could result in an overestimation of the association between delirium and antipsychotic use. Additionally, differences in coding practices between hospitals for any of the variables in our models could explain some of the variation in antipsychotic prescribing that we observed. Finally, because we were unable to differentiate between new initiation and continuation of a preadmission antipsychotic, some of the variation that we observed is likely to reflect differences in outpatient antipsychotic prescribing practices.
In conclusion, in this large cohort of nonpsychiatric admissions to 300 US hospitals, we found that antipsychotic medication exposure was common, often at high daily doses. Delirium and dementia were the strongest predictors of use among the patient and hospital characteristics examined. The variation in antipsychotic prescribing that we observed was not fully accounted for by measured patient characteristics, and raises the possibility of differing hospital prescribing cultures. Our results draw attention to the need for additional research to better define what constitutes appropriate use of these potentially harmful medications in the hospital setting.
Disclosures: Dr. Herzig had full access to all of the data in the study and takes responsibility for the integrity of the data and the accuracy of the data analysis. Study concept and design: Drs. Herzig, Rothberg, Gurwitz, and Marcantonio. Acquisition of data: Dr. Herzig. Analysis of data: Mr. Guess. Interpretation of data: Drs. Herzig, Rothberg, Gurwitz, Marcantonio, and Mr. Guess. Drafting of the manuscript: Dr. Herzig. Critical revision of the manuscript for important intellectual content: Drs. Rothberg, Gurwitz, Marcantonio, and Mr. Guess. Dr. Herzig was funded by grant number K23AG042459 from the National Institute on Aging. Dr. Marcantonio was funded by grant number K24AG035075 from the National Institute on Aging. The funding organizations had no involvement in any aspect of the study, including design and conduct of the study; collection, management, analysis, and interpretation of the data; and preparation, review, or approval of the manuscript. The authors report no conflicts of interest.
Antipsychotic medications are frequently used off label for management of behavioral symptoms associated with delirium and/or dementia. Despite regulations designed to curb inappropriate prescribing of these medications in nursing homes, substantial levels of use and variation in use have been observed in this setting.[1] Although antipsychotic medications are also frequently used in the hospital, the scope and variation in use have not been adequately investigated. Given the lack of oversight for medication prescribing in the hospital setting and the frequency of delirium, occurring in 15% to 26% of hospitalized older adults,[2, 3, 4] off‐label use of antipsychotic medications and variation in use could be substantial.
Because variation in practice is known to increase in the setting of controversy or lack of clarity regarding appropriate management,[5] large degrees of variation can draw attention to priority areas for clinical effectiveness studies, and the need for guidelines, clinical decision support, or regulatory oversight. In the absence of clear guidelines for the use of antipsychotic medication in nonpsychiatric hospitalized patients, we hypothesized that significant variation in use would persist after controlling for patient characteristics. Using a large, nationally representative cohort of admissions to 300 hospitals from July 2009 to June 2010, we sought to investigate prescribing patterns and hospital variation in use of antipsychotic medications in nonpsychiatric admissions to US hospitals.
METHODS
Setting and Data Collection
We conducted a retrospective cohort study using data from 300 US, nonfederal, acute care facilities contributing to the database maintained by Premier (Premier Healthcare Solutions, Inc., Charlotte, NC). This nationally representative database, created to measure healthcare utilization and quality of care, is drawn from voluntarily participating hospitals and contains data on approximately 1 in every 4 discharges nationwide.[6] Participating hospitals are similar in geographic distribution and urban/rural status to hospitals nationwide, although large, nonteaching hospitals are slightly over‐represented. The study was approved by the institutional review board at Beth Israel Deaconess Medical Center.
Inclusion and Exclusion Criteria
We studied a cohort of all adult (18 years) nonpsychiatric admissions to participating hospitals from July 1, 2009 through June 30, 2010. We excluded patients admitted to a psychiatry service or with any discharge diagnosis of a psychotic disorder (defined by the Elixhauser comorbidity Psychoses: 295.00‐298.9, 299.10‐299.11), because we were interested in use of antipsychotics for conditions other than primary psychiatric disorders. We also excluded patients with a charge for labor and delivery owing to the nonrepresentativeness of this patient population for the general hospitalized patient. We excluded admissions with unknown gender, and admissions with a length of stay greater than 365 days, as these admissions are not representative of the typical admission to an acute care hospital. We also excluded hospitals contributing less than 100 admissions owing to lack of precision in corresponding hospital prescribing rates.
Antipsychotic Medication Utilization
In‐hospital antipsychotic use was ascertained from pharmacy charges, reflecting each medication dispensed during the hospitalization. We categorized antipsychotic medications as typical (haloperidol, loxapine, thioridazine, molindone, thiothixine, pimozide, fluphenazine, trifluoperazine, chlorpromazine, and perphenazine) and atypical (aripiprazole, asenapine, clozapine, iloperidone, lurasidone, olanzapine, paliperidone, quetiapine, risperidone, and ziprasidone) based on classification by the Food and Drug Administration.[7, 8] We excluded prochlorperazine (Compazine) from our typical antipsychotic definition, as this medication is almost exclusively used as an antiemetic.
In the absence of guidelines for use of antipsychotic agents in hospitalized patients, we used the Centers for Medicare and Medicaid Services (CMS) guidelines for long‐term care facilities to define measures of potentially excessive dosing in the hospital setting.[9] These guidelines define the daily dosage levels of antipsychotics above which the medical necessity of the higher dose should be explained in the medical record. We defined any daily dosage above these specified levels as a potentially excessive daily dose.
Characteristics Associated With Use
We investigated the association between antipsychotic use and patient and hospital characteristics, selected based on clinical grounds. Patient characteristics included: (1) demographic variables such as age (65, 6574, 75+ years), gender, self‐reported race, marital status, and primary insurance; (2) admission characteristic variables, including admitting department (surgical vs nonsurgical, defined by a surgical attending of record and presence of operating room charges), whether the patient spent any time in the intensive care unit (ICU), and whether they received mechanical ventilation; and (3) potential indications for use, including delirium (included delirium superimposed upon dementia), dementia (without delirium), and insomnia (see Supporting Information, Appendix, in the online version of this article for International Classification of Diseases, Ninth Revision, Clinical Modification [ICD‐9‐CM] codes). Hospital characteristics included number of beds, urban versus rural status, teaching status, and US Census region.
Statistical Analysis
We report the proportion of admissions with in‐hospital use of any antipsychotic, and the number of days of exposure, overall and stratified by typical and atypical.
We determined potentially excessive dosing by taking the sum of the doses for a specific antipsychotic charged on a given day and comparing it to the CMS guidelines for long‐term care settings described above. We report the percentage of exposed admissions with at least 1 day of potentially excessive dosing.
All multivariable models below were operationalized as generalized estimating equations with a Poisson error term, log link, robust variance estimator,[10] and an exchangeable correlation structure to account for repeated admissions of the same patient.
We investigated patient and hospital characteristics associated with use of any antipsychotic medication using a multivariable model that simultaneously included all patient and hospital characteristics in Table 1 as independent variables.
| % of Cohort | Any Exposure, % | Typical Exposure, % | Atypical Exposure, % | |
|---|---|---|---|---|
| ||||
| Patient characteristics | ||||
| Age group, y | ||||
| 65 | 52.1 | 4.6 | 2.0 | 3.1 |
| 6574 | 18.5 | 5.2 | 2.7 | 3.1 |
| 75+ | 29.4 | 8.8 | 4.6 | 5.4 |
| Gender | ||||
| Male | 43.8 | 6.6 | 3.6 | 3.8 |
| Female | 56.2 | 5.5 | 2.3 | 3.8 |
| Race | ||||
| White | 64.6 | 6.1 | 2.9 | 4.0 |
| Black | 13.5 | 5.5 | 2.8 | 3.3 |
| Hispanic | 5.0 | 4.9 | 2.2 | 3.2 |
| Other | 19.9 | 6.1 | 3.1 | 3.7 |
| Marital Status | ||||
| Married | 42.5 | 4.6 | 2.4 | 2.7 |
| Single | 46.7 | 7.2 | 3.2 | 4.7 |
| Unknown/other | 10.8 | 6.4 | 3.1 | 4.1 |
| Primary insurance | ||||
| Private (commercial) | 28.8 | 3.0 | 1.5 | 1.8 |
| Medicaid | 10.3 | 6.4 | 2.4 | 4.6 |
| Medicare managed | 10.6 | 7.1 | 4.1 | 4.0 |
| Medicare traditional | 40.9 | 8.0 | 3.7 | 5.3 |
| Self‐pay or other | 9.4 | 4.3 | 2.5 | 2.2 |
| Admitting department | ||||
| Surgical | 60.6 | 5.8 | 3.1 | 3.4 |
| Nonsurgical | 39.4 | 6.2 | 2.4 | 4.4 |
| Any ICU stay | 16.6 | 10.4 | 7.2 | 4.9 |
| Mechanical ventilation | 4.7 | 17.4 | 12.9 | 7.9 |
| Diagnoses | ||||
| Delirium | 3.2 | 28.6 | 19.4 | 15.7 |
| Dementia | 3.1 | 27.4 | 12.0 | 20.2 |
| Insomnia | 1.3 | 10.2 | 3.9 | 7.5 |
| Discharge disposition | ||||
| Home | 77.9 | 3.8 | 1.6 | 2.5 |
| SNF/Rehab | 15.5 | 13.7 | 6.8 | 9.0 |
| Hospice | 1.7 | 16.0 | 10.3 | 8.1 |
| Other | 4.9 | 11.6 | 7.6 | 5.7 |
| Hospital characteristics, % | ||||
| No. of beds | ||||
| 200 | 14.1 | 6.1 | 2.8 | 3.8 |
| 201300 | 18.6 | 6.1 | 2.9 | 3.9 |
| 301500 | 37.7 | 5.9 | 2.9 | 3.7 |
| 500+ | 29.7 | 5.9 | 2.8 | 3.8 |
| Population served | ||||
| Urban | 89.4 | 6.0 | 2.9 | 3.8 |
| Rural | 10.6 | 5.8 | 2.4 | 3.9 |
| Teaching status | ||||
| Teaching | 39.2 | 5.8 | 2.9 | 3.7 |
| Nonteaching | 60.8 | 6.0 | 2.8 | 3.9 |
| US Census region | ||||
| West | 16.9 | 5.9 | 3.2 | 3.5 |
| Northeast | 20.1 | 6.1 | 2.9 | 3.9 |
| Midwest | 21.9 | 5.7 | 2.5 | 3.8 |
| South | 41.0 | 6.1 | 2.9 | 3.9 |
To determine hospital variation in antipsychotic use, we first determined the proportion of admissions at each hospital with at least 1 charge for antipsychotic medication. We then divided hospitals into quintiles based on their facility‐level antipsychotic prescribing rates and assigned all admissions to their corresponding hospital quintile. We then used a multivariable model to measure the adjusted association between prescribing quintile and patient‐level receipt of antipsychotic medication, controlling for all patient characteristics listed in Table 1 (except discharge disposition), and comorbidities using the Healthcare Cost and Utilization Project Comorbidity Software version 3.7 (Agency for Healthcare Research and Quality, Rockville, MD).[11] We used the lowest prescribing quintile as the reference group. We also report in the Supporting Information, Appendix, in the online version of this article, the distribution of prescribing rates for the hospitals in our cohort before and after adjustment for patient characteristics. For both approaches, we conducted stratified analyses in admissions with delirium and dementia.
All analyses were carried out using SAS software (SAS Institute Inc., Cary, NC).
RESULTS
Admission Characteristics
There were 3,190,934 admissions aged 18 years and over to 300 hospitals from July 1, 2009 to June 30, 2010. After excluding admissions with unknown gender (n = 17), length of stay greater than 365 days (n = 25), charges for labor and delivery (n = 323,111) or a psychiatric attending of record or psychiatric comorbidity (n = 172,669), and admissions to hospitals with fewer than 100 admissions (n = 31), our cohort included 2,695,081 admissions. The median age was 63 years (25th, 75th percentile 48, 77 years), and 1,514,986 (56%) were women. Table 1 shows the overall admission characteristics of the cohort and the percent exposed to antipsychotics among each patient and hospital characteristic.
Antipsychotic Use
There were 160,773 (6%) admissions with antipsychotic exposure. Among exposed admissions, 102,148 (64%) received atypical and 76,979 (48%) received typical antipsychotics, with 18,354 (11%) exposed to both. The median (25th, 75th percentile) length of stay among exposed was 5 days (3, 9 days), and the median (25th, 75th percentile) number of days of exposure was 3 (1, 5 days) overall, 3 days (2, 6 days) for atypical and 2 days (1, 3 days) for typical exposure.
Among admissions aged 65 to 74 years, 25,855 (5%) were exposed. Among admissions aged 75 years or older, 69,792 (9%) were exposed. Among admissions with delirium, exposure occurred in 24,787 (29%), with 13,640 (55%) receiving atypical, 16,828 (68%) receiving typical, and 5681 (23%) exposed to both. Among admissions with dementia, exposure occurred in 23,179 (27%), with 17,068 (74%) receiving atypical, 10,108 (44%) receiving typical, and 3997 (17%) exposed to both.
Use of Specific Drugs and Potentially Excessive Dosing
Table 2 demonstrates the most commonly used antipsychotic medications and the rates of potentially excessive dosing. Quetiapine and olanzapine were the most commonly used atypical antipsychotics, and haloperidol represented the majority of typical antipsychotic use. Among admissions with antipsychotic exposure, 47% received at least 1 potentially excessive daily dose, 18% of those with atypical exposure and 79% of those with typical exposure. Among admissions aged 65 years and up (n = 1,291,375), the prevalence of potentially excessive dosing was almost identical; 46% received at least 1 daily dose in excess of the recommended daily dose, 11% of those with atypical exposure and 79% of those with typical exposure.
| Agent |
Overall Prevalence,N = 2,695,081 |
% of Exposed With Potentially Excessive Dosing* | ||
|---|---|---|---|---|
| Within 100% of Recommended DD* | 101% to 150% of Recommended DD* | >150% of Recommended DD* | ||
| ||||
| Any antipsychotic | 6.0 | 52.9 | 20.2 | 26.9 |
| Atypical | 3.8 | 82.0 | 5.4 | 12.6 |
| Quetiapine (200) | 1.8 | 81.7 | 5.7 | 12.6 |
| Olanzapine (10) | 0.6 | 73.7 | 7.3 | 19.0 |
| Risperidone (2) | 0.9 | 79.2 | 6.8 | 14.0 |
| Other | 0.7 | 98.3 | 0.1 | 1.6 |
| Typical | 2.9 | 21.1 | 37.0 | 41.9 |
| Haloperidol (4) | 2.5 | 13.2 | 41.3 | 45.5 |
| Chlorpromazine (75) | 0.3 | 76.0 | 9.8 | 14.2 |
| Other | 0.4 | 89.1 | 2.9 | 8.0 |
Characteristics Associated With Antipsychotic Use
Among the patient and hospital characteristics included in our analysis, the 5 characteristics most strongly associated with antipsychotic exposure after adjustment were (Table 3): delirium (relative risk [RR]: 2.93, 95% confidence interval [CI]: 2.88‐2.98); dementia (RR: 2.78, 95% CI: 2.72‐2.83); insurance status, with higher risk among patients with traditional Medicare (RR: 2.09, 95% CI: 2.04‐2.13), Medicare managed (RR: 1.98, 95% CI: 1.93‐2.03), Medicaid (RR: 1.84, 95% CI: 1.80‐1.88), and self‐pay/other (RR: 1.26, 95% CI: 1.23‐1.29) compared to private (commercial) insurance; use of mechanical ventilation (RR: 1.84, 95% CI: 1.81‐1.87); and any ICU stay (RR: 1.53, 95% CI: 1.51‐1.55).
| Unadjusted RR of Receiving Any Antipsychotic [95% CI] | Adjusted RR of Receiving Any Antipsychotic [95% CI]* | |
|---|---|---|
| ||
| Age group, y, % | ||
| 65 | Reference | Reference |
| 6574 | 1.12 [1.10,1.14] | 0.74 [0.72, 0.75] |
| 75+ | 1.90 [1.88,1.92] | 1.03 [1.01, 1.05] |
| Gender | ||
| Female | Reference | Reference |
| Male | 1.19 [1.18,1.20] | 1.27 [1.26, 1.28] |
| Race | ||
| White | Reference | Reference |
| Black | 0.91 [0.90,0.92] | 0.85 [0.83, 0.86] |
| Hispanic | 0.80 [0.78,0.82] | 0.79 [0.76, 0.81] |
| Other | 0.99 [0.98,1.00] | 0.96 [0.95, 0.98] |
| Marital status | ||
| Married | Reference | Reference |
| Single | 1.57 [1.55,1.59] | 1.43 [1.42, 1.45] |
| Unknown/other | 1.41 [1.39,1.43] | 1.27 [1.24, 1.29] |
| Primary insurance | ||
| Private (commercial) | Reference | Reference |
| Medicaid | 2.13 [2.09,2.17] | 1.84 [1.80, 1.88] |
| Medicare managed | 2.35 [2.31,2.39] | 1.98 [1.93, 2.03] |
| Medicare traditional | 2.65 [2.61,2.69] | 2.09 [2.04, 2.13] |
| Self‐pay or other | 1.41 [1.38,1.44] | 1.26 [1.23, 1.29] |
| Admitting department | ||
| Surgical | Reference | Reference |
| Nonsurgical | 1.06 [1.05,1.07] | 1.05 [1.03, 1.06] |
| Any ICU stay | 2.05 [2.03,2.07] | 1.53 [1.51, 1.55] |
| Mechanical ventilation | 3.22 [3.18,3.26] | 1.84 [1.81, 1.87] |
| Diagnoses | ||
| Delirium | 5.48 [5.42, 5.45] | 2.93 [2.88, 2.98] |
| Dementia | 5.21 [5.15,5.27] | 2.78 [2.72, 2.83] |
| Insomnia | 1.72 [1.67,1.78] | 1.51 [1.45, 1.57] |
| No. of beds | ||
| 200 | Reference | Reference |
| 201300 | 1.01 [0.99,1.03] | 0.96 [0.94, 0.98] |
| 301500 | 0.98 [0.97,1.00] | 0.93 [0.91, 0.95] |
| 500+ | 0.97 [0.96,0.98] | 0.91 [0.90, 0.93] |
| Population served | ||
| Urban | Reference | Reference |
| Rural | 0.96 [0.95,0.98] | 0.91 [0.89, 0.93] |
| Teaching status | ||
| Teaching | Reference | Reference |
| Nonteaching | 1.03 [1.02,1.04] | 0.98 [0.97, 1.00] |
| US Census region | ||
| West | Reference | Reference |
| Northeast | 1.03 [1.01,1.05] | 1.04 [1.02, 1.06] |
| Midwest | 0.95 [0.94,0.97] | 0.93 [0.91, 0.94] |
| South | 1.02 [1.01,1.03] | 1.07 [1.05, 1.09] |
Hospital Variation in Antipsychotic Use
Figure 1 demonstrates the antipsychotic prescribing rate at each hospital in our cohort, and the corresponding quintiles. Patients admitted to hospitals in the highest prescribing quintile were more than twice as likely to be exposed to antipsychotics compared to patients admitted to hospitals in the lowest prescribing quintile, even after adjustment for patient characteristics and comorbidities (Table 4). This relationship was similar across subgroups of admissions with delirium and dementia (see Supporting Information, Appendix, in the online version of this article for the distribution of hospital antipsychotic prescribing rates before and after adjustment for patient characteristics).
| Admissions, No. (% of Total) | Unadjusted RR of Exposure [95% CI] | Adjusted RR of exposure [95% CI]* | |
|---|---|---|---|
| |||
| Overall | |||
| Q1 | 431,017 (16%) | Reference | Reference |
| Q2 | 630,486 (23%) | 1.67 [1.63, 1.71] | 1.59 [1.55, 1.62] |
| Q3 | 548,337 (20%) | 1.93 [1.88, 1.97] | 1.84 [1.80, 1.88] |
| Q4 | 639,027 (24%) | 2.16 [2.12, 2.21] | 2.07 [2.03, 2.12] |
| Q5 | 446,214 (17%) | 2.83 [2.77, 2.89] | 2.56 [2.50, 2.61] |
| Delirium | |||
| Q1 | 12,878 (15%) | Reference | Reference |
| Q2 | 20,588 (24%) | 1.58 [1.51, 1.65] | 1.58 [1.51, 1.65] |
| Q3 | 17,402 (20%) | 1.71 [1.64, 1.80] | 1.73 [1.65, 1.82] |
| Q4 | 20,943 (24%) | 2.01 [1.92, 2.10] | 1.99 [1.91, 2.08] |
| Q5 | 14,883 (17%) | 2.15 [2.05, 2.25] | 2.16 [2.07, 2.26] |
| Dementia | |||
| Q1 | 28,290 (15%) | Reference | Reference |
| Q2 | 42,018 (22%) | 1.43 [1.36, 1.50] | 1.40 [1.34, 1.47] |
| Q3 | 38,593 (21%) | 1.61 [1.53, 1.69] | 1.59 [1.51, 1.66] |
| Q4 | 44,638 (24%) | 1.69 [1.62, 1.77] | 1.69 [1.61, 1.77] |
| Q5 | 34,442 (18%) | 1.92 [1.83, 2.01] | 1.90 [1.81, 1.99] |
DISCUSSION
In this cohort of nonpsychiatric admissions to 300 US hospitals, antipsychotic medications were used in 6% of admissions, with atypical antipsychotics representing the majority of use. Potentially excessive daily doses based on CMS recommendations for long‐term care facilities occurred in almost half of admissions with any antipsychotic exposure, and in 87% of admissions with haloperidol exposure specifically. We found variation in hospital use of antipsychotics that was not fully accounted for by measured patient characteristics, and which persisted among subgroups of admissions with delirium and/or dementia. Although unmeasured patient characteristics or different billing practices between hospitals are potential explanations, our findings also raise the possibility of different hospital antipsychotic prescribing cultures. These findings provide new information regarding the scope of prescribing in US hospitals, and draw attention to the need for additional studies to better define what constitutes appropriate use of antipsychotics in the hospital setting.
A recent single‐center study at a large academic medical center found an overall antipsychotic exposure rate of 9% of nonpsychiatric admissions.[12] Our finding that 6% of admissions in this multicenter cohort were exposed to antipsychotics is slightly lower, but similar to the previous estimate. Assuming 37 million discharges from US hospitals each year,[13] our study suggests that more than 2 million hospitalized patients receive antipsychotics annually. With around 1.4 million residents in nursing homes on any given day,[14] and an exposure rate of 25% to 30% in that setting,[15, 16, 17] our study suggests that the number of patients exposed in the hospital setting is greater than the number exposed in the nursing home setting, the site of care for which prescribing regulations have been focused thus far.
Because our dataset does not contain preadmission medications, we were unable to specifically investigate new initiation. In the prior single‐center study, approximately 55% of overall use in the hospital setting was new initiation,[12] which would suggest that antipsychotics are newly initiated in around 1 million admissions each year in the hospital. Although we are unable to determine reason for use in our analysis, delirium was a strong predictor of antipsychotic use in our multivariable model, and prior studies have demonstrated delirium to be the most common reason for antipsychotic initiation in hospitalized patients,[12, 18] an indication for which efficacy/effectiveness data are lacking. A recent systematic review of antipsychotics for the treatment of delirium in older adults concluded that because of severe methodological limitations, the small number of existing studies on this topic do not support the use of antipsychotics in the treatment of delirium in older hospitalized adults.[19] Our results further highlight the need for randomized placebo‐controlled trials of antipsychotics in treatment of delirium.
We found variation in antipsychotic use between hospitals that was not fully explained by patient characteristics. Insufficient data to inform clinical decisions surrounding management of agitated delirium/dementia and lack of clear criteria by which to judge appropriateness of antipsychotic use may contribute to this variation. Some variation may relate to resource allocation at different hospitals, and the feasibility of implementing nonpharmacologic management options across settings. Our results collectively highlight the need for studies evaluating the efficacy/effectiveness of antipsychotics in the treatment of delirium and drivers of physician decision‐making in this realm, as well as the need for greater hospital investment in nonpharmacologic delirium‐prevention programs, which have been shown to be effective in prevention of delirium in hospitalized patients.[20]
We observed high levels of potentially excessive daily dosing using cutoffs applied in the long‐term care setting. The majority of the potentially excessive doses were in the setting of typical antipsychotic use, and haloperidol specifically, where doses exceeded 4 mg on at least 1 day in 87% of exposed admissions. Of note, the threshold for haloperidol dosage above which justification is required was decreased from 4 to 2 mg per day in the 2015 update to the CMS guidelines.[21] For the present analysis, we used the guidelines that were contemporaneous to our cohort; we are unable to determine current rates of potentially inappropriate dosages in the present analysis, but given the high prevalence in 2009 to 2010, and the lowering of the dosage threshold since then, it is unlikely that any decrease in use would be enough to substantially reduce the estimate. Whether these high dosages are actually inappropriate in the hospital setting is not established, and we were not able to review medical records to determine whether justification for use of such doses was documented.[22, 23] It is possible that hospitalized patients with altered pharmacodynamics and greater severity of illness could require larger doses of these medications; however, this is an area in need of further investigation, and current critical care guidelines note the lack of sufficient data upon which to justify use of haloperidol in the prevention or treatment of delirium in ICU patients.[24, 25]
The dosages in use are concerning given that the risk of extrapyramidal side effects increases with increasing dose, and prior studies have demonstrated an association between increased dose of antipsychotics and increased risk of other adverse events, including hip fracture and sudden cardiac death.[22, 23] Further, despite these known risks, studies have demonstrated failure to follow recommendations to mitigate risk,[26] such as electrocardiogram monitoring in individuals receiving intravenous haloperidol.[27] Our results suggest that physicians are similarly not following recommendations to use lower doses of haloperidol when treating older patients, given the almost identical incidence of potentially excessive dosing among admissions of patients aged 65 years and older in our cohort.[25] Clinical decision support prompts have been effective at increasing appropriate use of antipsychotic medications in several single‐center analyses,[28, 29, 30] and widespread implementation of such support with a focus on haloperidol dosing should be considered on the basis of our results.
The patient characteristics associated with antipsychotic use in this large, nationally representative analysis are consistent with those identified in prior single‐center analyses.[12, 18] Both prior analyses identified delirium as the most common reason for antipsychotic use, and dementia, intensive care unit stay, and mechanical ventilation were also previously identified as strong predictors of use that we believe hold face validity for the practicing hospitalist. On the other hand, some of the factors associated with antipsychotic use in our model cannot be readily explained, such as insurance status and race, and may be serving as proxies for other variables not included in our analysis. That nonwhite patients are less likely than white patients to receive antipsychotic medications in the hospital has been previously demonstrated,[12] and further investigation to understand this disparity is warranted.
Our study has several additional limitations. First, because our study is observational, the possibility of residual confounding exists, and we cannot rule out that there are other patient factors driving the hospital variation in antipsychotic use that we observed. Second, because guidelines do not exist for antipsychotic dosing in hospitalized patients, we could only comment on potentially excessive dosing, extrapolating from guidelines in the long‐term care setting. Whether such doses are actually excessive in hospitalized patients is not defined. Third, although Premier performs quality checks on charge and ICD‐9‐CM coding data submitted by participating hospitals, the validity of administrative data is uncertain. For example, the use of administrative data to identify delirium diagnoses is likely to have resulted in underestimation of delirium incidence among our different exposure groups. Delirium is likely to be coded more often in the setting of more severe or hyperactive cases, when antipsychotics are more likely to be utilized. This could result in an overestimation of the association between delirium and antipsychotic use. Additionally, differences in coding practices between hospitals for any of the variables in our models could explain some of the variation in antipsychotic prescribing that we observed. Finally, because we were unable to differentiate between new initiation and continuation of a preadmission antipsychotic, some of the variation that we observed is likely to reflect differences in outpatient antipsychotic prescribing practices.
In conclusion, in this large cohort of nonpsychiatric admissions to 300 US hospitals, we found that antipsychotic medication exposure was common, often at high daily doses. Delirium and dementia were the strongest predictors of use among the patient and hospital characteristics examined. The variation in antipsychotic prescribing that we observed was not fully accounted for by measured patient characteristics, and raises the possibility of differing hospital prescribing cultures. Our results draw attention to the need for additional research to better define what constitutes appropriate use of these potentially harmful medications in the hospital setting.
Disclosures: Dr. Herzig had full access to all of the data in the study and takes responsibility for the integrity of the data and the accuracy of the data analysis. Study concept and design: Drs. Herzig, Rothberg, Gurwitz, and Marcantonio. Acquisition of data: Dr. Herzig. Analysis of data: Mr. Guess. Interpretation of data: Drs. Herzig, Rothberg, Gurwitz, Marcantonio, and Mr. Guess. Drafting of the manuscript: Dr. Herzig. Critical revision of the manuscript for important intellectual content: Drs. Rothberg, Gurwitz, Marcantonio, and Mr. Guess. Dr. Herzig was funded by grant number K23AG042459 from the National Institute on Aging. Dr. Marcantonio was funded by grant number K24AG035075 from the National Institute on Aging. The funding organizations had no involvement in any aspect of the study, including design and conduct of the study; collection, management, analysis, and interpretation of the data; and preparation, review, or approval of the manuscript. The authors report no conflicts of interest.
- , , , et al. Variation in nursing home antipsychotic prescribing rates. Arch Intern Med. 2007;167(7):676–683.
- , . Precipitating factors for delirium in hospitalized elderly persons. Predictive model and interrelationship with baseline vulnerability. JAMA. 1996;275(11):852–857.
- , , , , . A predictive model for delirium in hospitalized elderly medical patients based on admission characteristics. Ann Intern Med. 1993;119(6):474–481.
- , , , , , . Delirium in hospitalized older persons: outcomes and predictors. J Am Geriatr Soc. 1994;42(8):809–815.
- , , , . Small‐area variations in the use of common surgical procedures: an international comparison of New England, England, and Norway. N Engl J Med. 1982;307(21):1310–1314.
- Premier Research Services. Available at: https://www.premierinc.com/transforming‐healthcare/healthcare‐performance‐improvement/premier‐research‐services. Accessed March 15, 2016.
- U.S. Food and Drug Administration. Atypical antipsychotic drugs information. Available at: http://www.fda.gov/drugs/drugsafety/postmarketdrugsafetyinformationforpatientsandproviders/ucm094303.htm. Accessed November 1, 2015.
- U.S. Food and Drug Administration. Information on conventional antipsychotics. Available at: http://www.fda.gov/drugs/drugsafety/postmarketdrugsafetyinformationforpatientsandproviders/ucm107211. htm. Accessed November 1, 2015.
- Centers for Medicare and Medicaid Services. State Operations Manual. Appendix PP: guidance to surveyors for long‐term care facilities. Available at: https://www.cms.gov/Medicare/Provider‐Enrollment‐and‐Certification/GuidanceforLawsAndRegulations/Downloads/som107 ap_pp_guidelines_ltcf.pdf. Revised October 14, 2005. Accessed March 15, 2016.
- . A modified Poisson regression approach to prospective studies with binary data. Am J Epidemiol. 2004;159(7):702–706.
- Healthcare Cost and Utilization Project. Comorbidity software, version 3.7. Agency for Healthcare Research and Quality, Rockville, MD. Available at: http://www.hcup‐us.ahrq.gov/toolssoftware/comorbidity/comorbidity.jsp. Accessed March 15, 2016.
- , , , et al. Antipsychotic use in hospitalized adults: rates, indications, and predictors. J Am Geriatr Soc. 2016;64(2):299–305.
- , . Overview of hospital stays in the United States, 2012. HCUP Statistical Brief #180. Agency for Healthcare Research and Quality, Rockville, MD. Available at: http://www.hcup‐us.ahrq.gov/reports/statbriefs/sb180‐Hospitalizations‐United‐States‐2012.pdf. Published October 2014. Accessed June 29, 2015.
- , , , . Long‐term care services in the United States: 2013 overview. Vital Health Stat 3. 2013;(37):1–107. Available at: http://www.cdc.gov/nchs/data/nsltcp/long_term_care_services_2013.pdf. Accessed March 16, 2016.
- , , , et al. The quality of antipsychotic drug prescribing in nursing homes. Arch Intern Med. 2005;165(11):1280–1285.
- , , , , , . Unexplained variation across US nursing homes in antipsychotic prescribing rates. Arch Intern Med. 2010;170(1):89–95.
- , , , , . Broadened use of atypical antipsychotics: safety, effectiveness, and policy challenges. Health Aff (Millwood). 2009;28(5):w770–w781.
- , , , , , . From hospital to community: use of antipsychotics in hospitalized elders. J Hosp Med. 2014;9(12):802–804.
- , , . Antipsychotics in the treatment of delirium in older hospitalized adults: a systematic review. J Am Geriatr Soc. 2011;59(suppl 2):S269–S276.
- , , , et al. Effectiveness of multicomponent nonpharmacological delirium interventions: a meta‐analysis. JAMA Intern Med. 2015;175(4):512–520.
- Centers for Medicare and Medicaid Services. State operations manual, appendix PP: guidance to surveyors for long‐term care facilities. Available at: https://www.cms.gov/Regulations‐and‐Guidance/Guidance/Manuals/downloads/som107ap_pp_guidelines_ltcf.pdf. Revised October 9, 2015. Accessed February 22, 2016.
- , , , , . Psychotropic drug use and the risk of hip fracture. N Engl J Med. 1987;316(7):363–369.
- , , , , . Atypical antipsychotic drugs and the risk of sudden cardiac death. N Engl J Med. 2009;360(3):225–235.
- , , , et al. Clinical practice guidelines for the management of pain, agitation, and delirium in adult patients in the intensive care unit. Crit Care Med. 2013;41(1):263–306.
- , , , , . Haloperidol overdosing in the treatment of agitated hospitalized older people with delirium: a retrospective chart review from a community teaching hospital. Drugs Aging. 2013;30(8):639–644.
- , , , . Unsafe use of intravenous haloperidol: evaluation of recommendation‐concordant care in hospitalized elderly adults. J Am Geriatr Soc. 2013;61(1):160–161.
- U.S. Food and Drug Administration. HALDOL brand of haloperidol injection. Available at: http://www.accessdata.fda.gov/drugsatfda_docs/label/2008/015923s082,018701s057lbl.pdf. Accessed February 23, 2016.
- , , , . Preventing potentially inappropriate medication use in hospitalized older patients with a computerized provider order entry warning system. Arch Intern Med. 2010;170(15):1331–1336.
- , , , et al. A standardized, bundled approach to providing geriatric‐focused acute care. J Am Geriatr Soc. 2014;62(5):936–942.
- , , , . Don't fuel the fire: decreasing intravenous haloperidol use in high risk patients via a customized electronic alert. J Am Med Inform Assoc. 2014;21(6):1109–1112.
- , , , et al. Variation in nursing home antipsychotic prescribing rates. Arch Intern Med. 2007;167(7):676–683.
- , . Precipitating factors for delirium in hospitalized elderly persons. Predictive model and interrelationship with baseline vulnerability. JAMA. 1996;275(11):852–857.
- , , , , . A predictive model for delirium in hospitalized elderly medical patients based on admission characteristics. Ann Intern Med. 1993;119(6):474–481.
- , , , , , . Delirium in hospitalized older persons: outcomes and predictors. J Am Geriatr Soc. 1994;42(8):809–815.
- , , , . Small‐area variations in the use of common surgical procedures: an international comparison of New England, England, and Norway. N Engl J Med. 1982;307(21):1310–1314.
- Premier Research Services. Available at: https://www.premierinc.com/transforming‐healthcare/healthcare‐performance‐improvement/premier‐research‐services. Accessed March 15, 2016.
- U.S. Food and Drug Administration. Atypical antipsychotic drugs information. Available at: http://www.fda.gov/drugs/drugsafety/postmarketdrugsafetyinformationforpatientsandproviders/ucm094303.htm. Accessed November 1, 2015.
- U.S. Food and Drug Administration. Information on conventional antipsychotics. Available at: http://www.fda.gov/drugs/drugsafety/postmarketdrugsafetyinformationforpatientsandproviders/ucm107211. htm. Accessed November 1, 2015.
- Centers for Medicare and Medicaid Services. State Operations Manual. Appendix PP: guidance to surveyors for long‐term care facilities. Available at: https://www.cms.gov/Medicare/Provider‐Enrollment‐and‐Certification/GuidanceforLawsAndRegulations/Downloads/som107 ap_pp_guidelines_ltcf.pdf. Revised October 14, 2005. Accessed March 15, 2016.
- . A modified Poisson regression approach to prospective studies with binary data. Am J Epidemiol. 2004;159(7):702–706.
- Healthcare Cost and Utilization Project. Comorbidity software, version 3.7. Agency for Healthcare Research and Quality, Rockville, MD. Available at: http://www.hcup‐us.ahrq.gov/toolssoftware/comorbidity/comorbidity.jsp. Accessed March 15, 2016.
- , , , et al. Antipsychotic use in hospitalized adults: rates, indications, and predictors. J Am Geriatr Soc. 2016;64(2):299–305.
- , . Overview of hospital stays in the United States, 2012. HCUP Statistical Brief #180. Agency for Healthcare Research and Quality, Rockville, MD. Available at: http://www.hcup‐us.ahrq.gov/reports/statbriefs/sb180‐Hospitalizations‐United‐States‐2012.pdf. Published October 2014. Accessed June 29, 2015.
- , , , . Long‐term care services in the United States: 2013 overview. Vital Health Stat 3. 2013;(37):1–107. Available at: http://www.cdc.gov/nchs/data/nsltcp/long_term_care_services_2013.pdf. Accessed March 16, 2016.
- , , , et al. The quality of antipsychotic drug prescribing in nursing homes. Arch Intern Med. 2005;165(11):1280–1285.
- , , , , , . Unexplained variation across US nursing homes in antipsychotic prescribing rates. Arch Intern Med. 2010;170(1):89–95.
- , , , , . Broadened use of atypical antipsychotics: safety, effectiveness, and policy challenges. Health Aff (Millwood). 2009;28(5):w770–w781.
- , , , , , . From hospital to community: use of antipsychotics in hospitalized elders. J Hosp Med. 2014;9(12):802–804.
- , , . Antipsychotics in the treatment of delirium in older hospitalized adults: a systematic review. J Am Geriatr Soc. 2011;59(suppl 2):S269–S276.
- , , , et al. Effectiveness of multicomponent nonpharmacological delirium interventions: a meta‐analysis. JAMA Intern Med. 2015;175(4):512–520.
- Centers for Medicare and Medicaid Services. State operations manual, appendix PP: guidance to surveyors for long‐term care facilities. Available at: https://www.cms.gov/Regulations‐and‐Guidance/Guidance/Manuals/downloads/som107ap_pp_guidelines_ltcf.pdf. Revised October 9, 2015. Accessed February 22, 2016.
- , , , , . Psychotropic drug use and the risk of hip fracture. N Engl J Med. 1987;316(7):363–369.
- , , , , . Atypical antipsychotic drugs and the risk of sudden cardiac death. N Engl J Med. 2009;360(3):225–235.
- , , , et al. Clinical practice guidelines for the management of pain, agitation, and delirium in adult patients in the intensive care unit. Crit Care Med. 2013;41(1):263–306.
- , , , , . Haloperidol overdosing in the treatment of agitated hospitalized older people with delirium: a retrospective chart review from a community teaching hospital. Drugs Aging. 2013;30(8):639–644.
- , , , . Unsafe use of intravenous haloperidol: evaluation of recommendation‐concordant care in hospitalized elderly adults. J Am Geriatr Soc. 2013;61(1):160–161.
- U.S. Food and Drug Administration. HALDOL brand of haloperidol injection. Available at: http://www.accessdata.fda.gov/drugsatfda_docs/label/2008/015923s082,018701s057lbl.pdf. Accessed February 23, 2016.
- , , , . Preventing potentially inappropriate medication use in hospitalized older patients with a computerized provider order entry warning system. Arch Intern Med. 2010;170(15):1331–1336.
- , , , et al. A standardized, bundled approach to providing geriatric‐focused acute care. J Am Geriatr Soc. 2014;62(5):936–942.
- , , , . Don't fuel the fire: decreasing intravenous haloperidol use in high risk patients via a customized electronic alert. J Am Med Inform Assoc. 2014;21(6):1109–1112.