User login
LETTER: 6 Tips When Practicing Telemedicine
In early 2014, I decided to use the six state licenses I had obtained as a locum tenens physician to start practicing telemedicine. Since then, I have worked with several telemedicine platforms. I have found that telemedicine companies differ dramatically in their overall ease of use for the provider. Here are my top tips for deciding which telemedicine company to work with.

- Technology support: Telemedicine is dependent on technology. If it is difficult to get help from tech support, do not credential with the company. Tech support is your lifeline to your patients. Make sure you can get help right away if you are having problems finishing or starting a consult. Companies that send automatic emails saying they will get back to you within 24 hours are the most difficult to work with.
- Nursing support: All of the telemedicine companies that I have worked with have amazing nurses, but some are overwhelmed with work. Telemedicine nurses are able to connect to your patients via direct callback numbers in a way that you cannot connect. They are able to call in prescriptions to pharmacies if the platform is down or if the patient put in the wrong pharmacy information. Make sure that the company has a nurse that is able to call you back right away. A few telemedicine companies are understaffed with nurses, and it can take hours for a callback. If the key to telemedicine is volume, this is frustrating to deal with.
- Chief complaints: Many telemedicine companies are moving away from making the “chief complaint” visible to providers before choosing to take the consult. For me, this is a big red flag. It can be as simple as, “I have a cold.” I like this because if I see a patient who says, “I have abdominal pain,” I know to triage them first.
- Volume: Telemedicine is great for staying connected to outpatient medicine. If you are looking to work on a telemedicine platform for your main source of income, then volume is key. A lot of telemedicine companies will tell you how many calls they get per day; the key question is how many calls they get for the states that you are licensed in and how many providers they have licensed in those states. If you want higher volume, then ask if they will pay for your license in states with higher needs (some will). If you are willing to pay to be licensed in additional states, make sure the volume is high enough to make that extra out-of-pocket cost worth it.
- Malpractice coverage: Many companies provide malpractice coverage as part of their credentialing package. If they do not, make sure your malpractice coverage covers you for telemedicine.
- Documentation: Documentation during your telemedicine consult is arguably even more important than in an outpatient visit. Everything is on the phone or by video, so make sure, in the subjective area, that you are quoting what the patient is telling you. You are not able to do a physical exam, so your recommendations will be based on what the patient is saying.
Have fun! Telemedicine has been really enjoyable for me. I like being able to have the time to educate my patients about things like antibiotics. I enjoy the technological aspects and understanding all of the different platforms. Telemedicine gives you a unique opportunity to practice your skills from the comfort of your own home. TH
In early 2014, I decided to use the six state licenses I had obtained as a locum tenens physician to start practicing telemedicine. Since then, I have worked with several telemedicine platforms. I have found that telemedicine companies differ dramatically in their overall ease of use for the provider. Here are my top tips for deciding which telemedicine company to work with.
- Technology support: Telemedicine is dependent on technology. If it is difficult to get help from tech support, do not credential with the company. Tech support is your lifeline to your patients. Make sure you can get help right away if you are having problems finishing or starting a consult. Companies that send automatic emails saying they will get back to you within 24 hours are the most difficult to work with.
- Nursing support: All of the telemedicine companies that I have worked with have amazing nurses, but some are overwhelmed with work. Telemedicine nurses are able to connect to your patients via direct callback numbers in a way that you cannot connect. They are able to call in prescriptions to pharmacies if the platform is down or if the patient put in the wrong pharmacy information. Make sure that the company has a nurse that is able to call you back right away. A few telemedicine companies are understaffed with nurses, and it can take hours for a callback. If the key to telemedicine is volume, this is frustrating to deal with.
- Chief complaints: Many telemedicine companies are moving away from making the “chief complaint” visible to providers before choosing to take the consult. For me, this is a big red flag. It can be as simple as, “I have a cold.” I like this because if I see a patient who says, “I have abdominal pain,” I know to triage them first.
- Volume: Telemedicine is great for staying connected to outpatient medicine. If you are looking to work on a telemedicine platform for your main source of income, then volume is key. A lot of telemedicine companies will tell you how many calls they get per day; the key question is how many calls they get for the states that you are licensed in and how many providers they have licensed in those states. If you want higher volume, then ask if they will pay for your license in states with higher needs (some will). If you are willing to pay to be licensed in additional states, make sure the volume is high enough to make that extra out-of-pocket cost worth it.
- Malpractice coverage: Many companies provide malpractice coverage as part of their credentialing package. If they do not, make sure your malpractice coverage covers you for telemedicine.
- Documentation: Documentation during your telemedicine consult is arguably even more important than in an outpatient visit. Everything is on the phone or by video, so make sure, in the subjective area, that you are quoting what the patient is telling you. You are not able to do a physical exam, so your recommendations will be based on what the patient is saying.
Have fun! Telemedicine has been really enjoyable for me. I like being able to have the time to educate my patients about things like antibiotics. I enjoy the technological aspects and understanding all of the different platforms. Telemedicine gives you a unique opportunity to practice your skills from the comfort of your own home. TH
Massage therapy seems to benefit cancer patients

Photo courtesy of Barbara
E. Carver/New York College
of Health Professions
Massage therapy can reduce pain, fatigue, and anxiety in cancer patients, according to a review and meta-analysis published in Pain Medicine.
Massage therapy is commonly used among people seeking pain management, and research has generally supported its use.
However, there has been no published, rigorous review of the available research and evidence for massage therapy’s efficacy for pain populations, especially for cancer populations.
So Courtney Boyd, of the Samueli Institute in Alexandria, Virginia, and her colleagues set out to conduct just such a review.
The team assessed the quality of massage therapy research and evidence for its efficacy in treating pain, function-related quality of life, and health-related quality of life in cancer patients.
The researchers reviewed data from 12 high-quality studies and 4 low-quality studies.
The team said they could not assess health-related quality of life, emotional stress, or activity outcomes because too few of the studies examined these outcomes.
However, the data suggested that massage therapy can effectively reduce pain intensity or severity when compared to no treatment (standardized mean difference [SMD]=-0.20) or active comparators (SMD=-0.55).
Massage therapy also proved effective for reducing fatigue (SMD=-1.06) and anxiety (SMD=-1.24) when compared to active comparators.
Based on these results, the researchers concluded that massage therapy may have beneficial effects in cancer patients, so they should consider it as an option.
However, before definitive clinical conclusions and recommendations can be made at a policy level, specific factors surrounding the massage protocol, as well as selection of appropriate controls and standard outcomes, need to be well-understood. ![]()
Drug granted breakthrough designation for BPDCN

The US Food and Drug Administration (FDA) has granted breakthrough therapy designation for SL-401 in the treatment of blastic plasmacytoid dendritic cell neoplasm (BPDCN).
SL-401 is a targeted therapy directed to the interleukin-3 receptor (IL-3R), which is present in BPDCN and other hematologic malignancies.
SL-401 is composed of human IL-3 coupled to a truncated diphtheria toxin payload that inhibits protein synthesis.
The drug is under development by Stemline Therapeutics, Inc.
About breakthrough designation
The FDA’s breakthrough designation is intended to expedite the development and review of new therapies for serious or life-threatening conditions.
To earn the designation, a treatment must show encouraging early clinical results demonstrating substantial improvement over available therapies with regard to a clinically significant endpoint, or it must fulfill an unmet need.
Phase 2 trial of SL-401
The breakthrough designation for SL-401 was supported by data from a phase 2 trial of patients with BPDCN or acute myeloid leukemia. Results observed in the BPDCN patients were presented at the 2016 EHA Congress (abstract S812).
The study consists of a lead-in dose-escalation stage (stage 1) and subsequent expansion stage (stage 2). In stage 1, patients received SL-401 as a daily intravenous infusion for up to 5 days (7, 9, 12, or 16 μg/kg/day) every 21 days. In stage 2, patients received SL-401 at the optimal stage 1 dose—12 μg/kg.
At the data cut-off, 18 BPDCN patients had received SL-401 at 7 μg/kg (n=3, stage 1) or 12 μg/kg (n=15, 6 in stage 1, 9 in stage 2).
Fifteen of these patients were evaluable for response. The overall response rate was 87% (13/15). All 10 previously untreated BPDCN patients achieved a response, including 7 complete responses (CRs).
All 8 previously untreated BPDCN patients treated at the optimal dose (12 μg/kg) achieved a response, including 6 CRs. Four of these patients were still on SL-401 and in CR at the data cutoff, and 2 had gone on to stem cell transplant.
The most common treatment-related adverse events in the BPDCN patients were transient transaminase elevation (57%), hypoalbuminemia (40%), and transient thrombocytopenia (15%).
In stage 1, two patients had capillary leak syndrome (CLS)—one grade 5 (7 μg/kg) and one grade 4 (12 μg/kg). After this, safety precautions were implemented to minimize the risk of severe CLS. There have been no cases of severe CLS since then. ![]()
Reasons for high cost of prescription drugs in US

Photo courtesy of the CDC
High prescription drug prices in the US have a few causes, according to researchers.
They said causes include the approach the US has taken to granting government-protected monopolies to drug manufacturers, strategies that delay access to generic drugs, and the restriction of price negotiation at a level not observed in other industrialized nations.
The researchers outlined these issues in JAMA.
Aaron S. Kesselheim, MD, of Brigham and Women’s Hospital in Boston, Massachusetts, and his colleagues conducted this research.
The team reviewed the medical and health policy literature from January 2005 to July 2016, looking for articles addressing the sources of drug prices in the US, the justifications and consequences of high prices, and possible solutions.
The researchers found that per-capita prescription drug spending is higher in the US than in all other countries. In 2013, per-capita spending on prescription drugs was $858 in the US, compared with an average of $400 for 19 other industrialized nations.
Dr Kesselheim and his colleagues said prescription drug spending in the US is largely driven by brand-name drug prices that have been increasing in recent years. And drug prices are higher in the US because the US healthcare system allows manufacturers to set their own price for a given product.
In countries with national health insurance systems, on the other hand, a delegated body negotiates drug prices or rejects coverage of products if the price demanded by the manufacturer is excessive in light of the benefit provided. Manufacturers may then decide to offer the drug at a lower price.
The researchers said the most important factor that allows US manufacturers to set high drug prices is market exclusivity. And although cheaper generic drugs can be made available after an exclusivity period has passed, there are strategies for keeping these drugs off the market.
Furthermore, the negotiating power of the payer is constrained by several factors, including the requirement that most government drug payment plans cover nearly all products.
Considering these findings together, Dr Kesselheim and his colleagues said the most realistic short-term strategies to address high drug prices in the US include:
- Enforcing more stringent requirements for market exclusivity rights
- Ensuring timely generic drug availability
- Providing greater opportunities for price negotiation by governmental payers
- Generating more evidence about comparative cost-effectiveness of therapeutic alternatives
- Educating patients, prescribers, payers, and policy makers about these choices.
The researchers said there is little evidence that such policies would hamper innovation. In fact, they might even drive the development of more valuable new therapies rather than rewarding the persistence of older ones. ![]()
Man Shovels Path to Angina
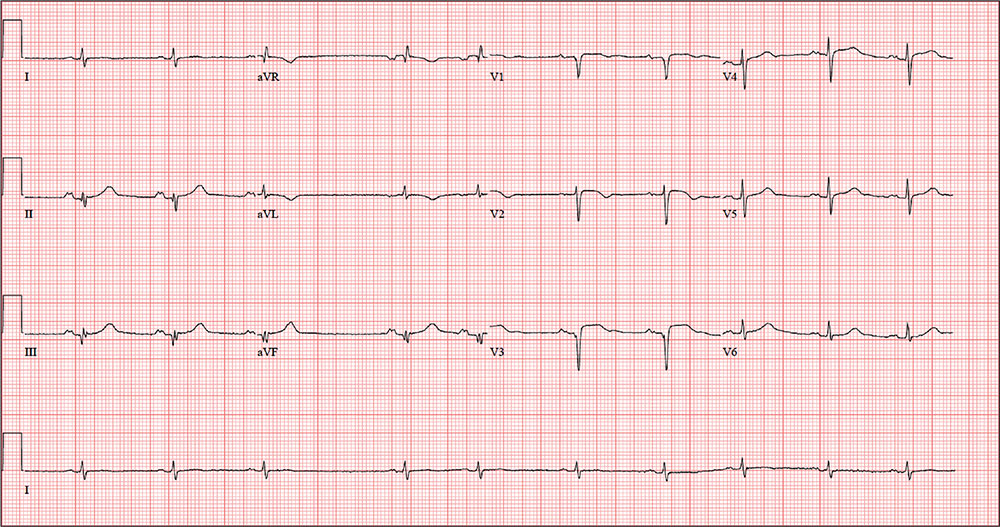
ANSWERThe correct interpretation includes sinus rhythm with blocked premature atrial complexes, left-axis deviation, and serial changes of an evolving anterior MI.
The presence of a P wave without a QRS between the third and fourth QRS complex represents a blocked premature atrial complex. The fifth QRS complex also indicates a premature atrial complex; however, it is not blocked.
Left-axis deviation is evidenced by the R axis of –82°. The loss of an R wave in V1, the poor R-wave progression in V2 and V3, and the ST-T wave changes are all consistent with an evolving anterior MI.
While shoveling gravel several days ago, a 62-year-old man developed exertional angina. Though he stopped to rest, the pain persisted and radiated to his left arm. He called out for help, and his neighbor called 911. The patient was transported via ACLS ambulance to the hospital, where he ruled in for an anterior myocardial infarction (MI). Cardiac catheterization revealed left anterior descending coronary artery stenosis, which was treated with a drug-eluting stent.
One week after discharge, he presents for his first follow-up appointment. He is enrolled in a cardiac rehabilitation program but isn’t scheduled to start for another week. He has not experienced chest pain or discomfort following his MI, and he says he is diligently taking his ß-blocker and nitrates.
This retired Army (Airborne division) officer’s past surgical history is remarkable for multiple fractures in his lower extremities, sustained while skydiving. His past medical history is remarkable for malaria, yellow fever, and hepatitis. Prior to his MI, he had no history of cardiac disease or symptoms.
He is divorced and has no children. His parents are alive and well, with no known cardiac disease. His paternal grandfather died of a stroke associated with atrial fibrillation, but he does not know how his other grandparents died.
The patient was a smoker until five years ago. He consumes two or three glasses of Scotch per week, typically on the weekends. He denies recreational drug use and “doesn’t believe in” holistic or herbal medications.
Current medications include metoprolol, isosorbide dinitrate, and clopidogrel. He has no known drug allergies.
The review of systems is remarkable for fatigue, which he attributes to ß-blocker use. His right groin is sore following his interventional procedure, but the discomfort is resolving.
Vital signs include a blood pressure of 110/64 mm Hg; pulse, 60 beats/min; respiratory rate, 14 breaths/min-1; and temperature, 97.6°F.
On physical exam, his weight is 224 lb and his height is 74 in. He is in good spirits and no distress. The HEENT exam is remarkable for corrective lenses. There is no evidence of thyromegaly or jugular venous distention. The lungs are clear; there are no murmurs, rubs, or gallops, and the abdomen is soft and nontender without organomegaly. The right groin has resolving ecchymosis and a small, palpable, organized hematoma. Peripheral pulses are strong bilaterally, and the neurologic exam is intact.
A follow-up ECG shows a ventricular rate of 61 beats/min; PR interval, 176 ms; QRS duration, 88 ms; QT/QTc interval, 402/404 ms; P axis, 71°; R axis, –82°; and T axis, 84°. What is your interpretation of the ECG?

An Agreeable Girl With a Stubborn Rash
ANSWER
The correct answer is impetigo (choice “a”). Impetigo is almost always secondary to another condition, such as contact or irritant dermatitis, eczema, or dry skin.
DISCUSSION
Impetigo is a superficial bacterial infection usually caused by a combination of strep and staph organisms. It requires a break in the skin to provide a point of entry for the organisms. In young children, scratching and picking at eczema, along with lip licking, exacerbate the barrier-breaching process.
The organisms that cause impetigo are typically benign, but this was not always the case. Prior to WWI, certain strains of strep were capable of triggering an immune response that resulted in kidney damage. These “nephritogenic” strains of the Streptococcus family caused acute post-streptococcal glomerulonephritis (Bright disease), which, at that time, killed thousands each year. Fortunately, these strains are rare now.
In the pre-antibiotic days, when the average person bathed once a week, impetigo was highly contagious and serious enough that whole households were quarantined because of it.
Today, impetigo, once diagnosed, is relatively simple to manage. Mild cases can be treated with application of mupirocin ointment or cream three times a day. In this particular case, a 10-day course of an oral antibiotic (trimethoprim sulfa) was added, and the rash rapidly cleared.

Distraught parents of a 5-year-old girl are at their wit’s end dealing with their daughter’s perioral rash, which first appeared several months ago. Although they’ve consulted three different primary care providers, who rendered several diagnoses and numerous treatments, the rash continues to worsen. The parents worry about scarring, but they are more concerned that the rash may never clear at all.
Her treatments have included oral erythromycin, oral amoxicillin, topical anti-yeast cream, and various petroleum-based and hydrocortisone-containing OTC lip balms. In a moment of desperation, the parents even applied their son’s psoriasis cream (betamethasone) and diaper cream. These, too, had no effect.
Contactants had been considered as a possible source, causing the family to switch toothpaste brands and toothbrushes and eliminate mouthwash use—again, with no change.
Family history includes an atopic brother (eczema, asthma, seasonal allergies). The parents confirm that the patient has very sensitive skin and can’t tolerate many soaps and moisturizers. Before the rash manifested, they noticed she had a tendency to compulsively lick her lips.
The patient is quite fair-skinned, with red hair and blue eyes. The rash, which covers her entire perioral area, is impressively florid, red, and scaly. Focally, several areas of honey-colored crusts can be seen. The vermillion surfaces of the lips are unaffected except for slight focal fissuring. No nodes can be felt in the head or neck. The patient is in good spirits despite all this, and certainly not in any distress.

Pretransplantation mogamulizumab for ATLL raises risk of GVHD
The use of mogamulizumab before allogeneic hematopoietic stem-cell transplantation in aggressive adult T-cell leukemia/lymphoma is associated with an increased risk of acute graft-versus-host disease (GVHD), which leads to an inferior overall survival, investigators report in the Journal of Clinical Oncology.
Mogamulizumab is an anti-CCR4 monoclonal antibody that showed promise in small clinical studies when added to conventional chemotherapy as first-line treatment. It was recently approved for the treatment of adult T-cell leukemia/lymphoma in Japan, and eventually may be approved in the U.S. and other countries, said Shigeo Fuji, MD, of the department of hematopoietic stem-cell transplantation, National Cancer Center Hospital, Tokyo, and his associates.
The agent significantly depleted regulatory T cells for several months in animal models. This prompted concern regarding the possibility of exacerbating GVHD in human patients who don’t respond completely to first-line chemotherapy and then undergo stem-cell transplantation. “However, no direct evidence has demonstrated [regulatory T-cell] depletion in humans,” the investigators noted.
To examine this issue, they assessed clinical outcomes in a cohort of 996 patients across Japan who had aggressive adult T-cell leukemia/lymphoma, were aged 20-69 years, were diagnosed in 2000-2013, and received intensive, multiagent chemotherapy before undergoing allogeneic hematopoietic stem-cell transplantation.
Grade 2-4 acute GVHD developed in 381 of 873 patients who didn’t receive mogamulizumab (43.6%), compared with 47 of 81 patients who did receive the agent (58.0%), for a relative risk of 1.33 (P = .01). Grade 3-4 acute GVHD developed in 150 patients who didn’t receive mogamulizumab (17.2%), compared with 25 who did (30.9%), for an RR of 1.80 (P less than .01) .
The agent not only raised the rate of GVHD, it also increased the severity of the disorder. GVHD was refractory to systemic corticosteroids in 23.5% of patients who didn’t receive mogamulizumab, compared with 48.9% of those who did, for an RR of 2.09 (P less than .01), the investigators reported (J Clin Oncol. 2016. doi: 10.1200/JCO.2016.67.8250).
In addition, 1-year disease-free mortality was 25.1% without mogamulizumab, compared with 43.7% with it. The estimated 1-year overall survival was 49.4% without mogamulizumab, compared with 32.3% with it. And in multivariable analyses, receiving mogamulizumab before undergoing stem-cell transplantation was a significant risk factor for both disease-free mortality (hazard ratio, 1.93) and overall mortality (HR, 1.67).
“All hematologists should take the risks and benefits of mogamulizumab into consideration before they use [it] in transplantation-eligible patients,” Dr. Fuji and his associates said.
FROM THE JOURNAL OF CLINICAL ONCOLOGY
Key clinical point: The use of mogamulizumab before allogeneic hematopoietic stem-cell transplantation in aggressive adult T-cell leukemia/lymphoma was associated with GVHD and increased mortality.
Major finding: Grade 3-4 acute GVHD developed in 17.2% of patients who didn’t receive mogamulizumab, compared with 30.9% who did, for a relative risk of 1.80.
Data source: A retrospective cohort study involving 996 patients with adult T-cell leukemia/lymphoma in Japan.
Disclosures: This study was supported in part by Practical Research for Innovative Cancer Control and the Japan Agency for Medical Research and Development. Dr. Fuji and one associate reported receiving honoraria from Kyowa Hakko Kirin; another associate reported ties to numerous industry sources.
Multifocal effort needed to rein in prescription prices
Enforcing more stringent requirements for exclusivity rights, ensuring timely generic drug availability, and providing greater opportunities for meaningful price negotiation by government payers could help combat high medication costs in the United States, according to an analysis published Aug. 23 in JAMA.
Per capita prescription drug spending in the United States exceeds that in all other countries, largely fueled by brand-name drug prices rising at rates far beyond the consumer price index. For example, in 2013, per capita spending on prescription drugs was $858, compared with an average of $400 for 19 other industrialized nations, according to the analysis conducted by Aaron S. Kesselheim, MD, of Brigham & Women’s Hospital, Boston, and colleagues. In addition, between 2008 and 2015, prices for the most commonly used brand-name drugs in the United States rose by 164%, far more than the consumer price index increased (12%), authors reported (JAMA 2016. doi: 10.1001/jama.2016.11237).

“We found that indeed, drug prices in the United States are much high than anywhere else in the world and the main contributors to that are the U.S. drug marketplace which allows drug companies to charge whatever the market will bear and then in many respects, places limitations on the ability of payers to try to negotiate lower drug prices,” Dr. Kesselheim said in a video interview for JAMA.
To reduce high drug prices, authors propose better federal oversight of drug makers who attempt to extend market exclusivity. For example, changing how the U.S. Patent and Trademark Office interprets novelty and non-obviousness when issuing drug patents could help avoid new secondary patents based on clinically irrelevant changes to active drug products. Other strategies outlined include:
• Decrease industry expenses. Reviews have pointed to the increasing expenditures for drug research and development, with the suggestion that steps be taken to make companies’ investments more efficient.
• Pass state laws permitting substitution of clinically similar drugs within the same class in carefully selected circumstances.
• Increase attention to the generic drug marketplace. Proposed federal legislation would forbid brand-name manufacturers from refusing to share samples of products with generic drug manufacturers for necessary bioequivalence studies.
• Authorize Medicare to negotiate prices of drugs paid for by Medicare Part D plans.
Physicians can also play a role in decreasing drug prices by discussing drug prices and choices with patients and limiting practices such as writing “dispense as written” prescriptions to avoid generic medications, Dr. Kesselheim noted. More education about drug costs and value-based prescribing integrated into physicians’ initial and continuing education could also be beneficial.
“There needs to be more education of patients and physicians about the implications of high drug prices and ways they can ensure that the prescribing they are doing is of highest value,” Dr. Kesselheim said in the video interview.
On Twitter @legal_med
Enforcing more stringent requirements for exclusivity rights, ensuring timely generic drug availability, and providing greater opportunities for meaningful price negotiation by government payers could help combat high medication costs in the United States, according to an analysis published Aug. 23 in JAMA.
Per capita prescription drug spending in the United States exceeds that in all other countries, largely fueled by brand-name drug prices rising at rates far beyond the consumer price index. For example, in 2013, per capita spending on prescription drugs was $858, compared with an average of $400 for 19 other industrialized nations, according to the analysis conducted by Aaron S. Kesselheim, MD, of Brigham & Women’s Hospital, Boston, and colleagues. In addition, between 2008 and 2015, prices for the most commonly used brand-name drugs in the United States rose by 164%, far more than the consumer price index increased (12%), authors reported (JAMA 2016. doi: 10.1001/jama.2016.11237).
“We found that indeed, drug prices in the United States are much high than anywhere else in the world and the main contributors to that are the U.S. drug marketplace which allows drug companies to charge whatever the market will bear and then in many respects, places limitations on the ability of payers to try to negotiate lower drug prices,” Dr. Kesselheim said in a video interview for JAMA.
To reduce high drug prices, authors propose better federal oversight of drug makers who attempt to extend market exclusivity. For example, changing how the U.S. Patent and Trademark Office interprets novelty and non-obviousness when issuing drug patents could help avoid new secondary patents based on clinically irrelevant changes to active drug products. Other strategies outlined include:
• Decrease industry expenses. Reviews have pointed to the increasing expenditures for drug research and development, with the suggestion that steps be taken to make companies’ investments more efficient.
• Pass state laws permitting substitution of clinically similar drugs within the same class in carefully selected circumstances.
• Increase attention to the generic drug marketplace. Proposed federal legislation would forbid brand-name manufacturers from refusing to share samples of products with generic drug manufacturers for necessary bioequivalence studies.
• Authorize Medicare to negotiate prices of drugs paid for by Medicare Part D plans.
Physicians can also play a role in decreasing drug prices by discussing drug prices and choices with patients and limiting practices such as writing “dispense as written” prescriptions to avoid generic medications, Dr. Kesselheim noted. More education about drug costs and value-based prescribing integrated into physicians’ initial and continuing education could also be beneficial.
“There needs to be more education of patients and physicians about the implications of high drug prices and ways they can ensure that the prescribing they are doing is of highest value,” Dr. Kesselheim said in the video interview.
On Twitter @legal_med
FROM JAMA
Key clinical point: Enforcing more stringent requirements for exclusivity rights could lower medication costs.
Major finding: Per capita prescription drug spending in the United States exceeds that in all other countries.
Data source: Analysis of the peer-reviewed medical and health policy literature from January 2015 through July 2016.
Disclosures: Dr. Kesselheim reported no relevant financial conflicts of interest. The study was supported by two independent think tanks.

Most sepsis cases begin outside of the hospital
Sepsis is a medical emergency that begins outside of the hospital in 79% of cases. In addition, 72% of patients with sepsis had recently used healthcare services or had chronic diseases that required frequent medical care.
Those are key findings from a special report in Morbidity and Mortality Weekly Report published by the U.S. Centers for Disease Control and Prevention (Morb Mortal Wkly Rep. 2016 Aug 23. doi: 10.15585/mmwr.mm6533e1).
“The treatment of sepsis is a race against time,” CDC Director Tom Frieden, MD, said during a media teleconference about the report. “We can protect more people from sepsis by informing patients and their families, treating infections promptly, and acting fast when sepsis does occur.”
Each year, between 1 and 3 million people in the United States are diagnosed with sepsis, a syndrome marked by the body’s overwhelming and life-threatening response to an infection, Dr. Frieden said. Of these, 15%-30% will die from the condition, for which there is no blood test. “Health care providers are on the front lines of both sepsis prevention and early recognition,” he emphasized. “Prevention really is possible.” For example, he continued, if a patient with diabetes visits their regular doctor and is found to have increased blood sugar and a small wound on their foot, “this is a prime opportunity to think about infection and reduce the risk of sepsis. In addition to treating the infection, the clinician can inform the patient and family members about how to care for the wound, how to recognize the signs that the infection may be getting worse, and when to seek additional medical care. If the infection gets worse the patient could be at risk for sepsis. Taking the opportunity to both treat and inform patients could save their life, and helping patients know to ask, ‘Could this be sepsis?’ empowers patients and families and could save lives.”
In an effort to describe the characteristics of patients with sepsis, researchers from the CDC and from New York State conducted a retrospective review of medical records from 246 adults and 79 children with sepsis who were treated at four New York hospitals. They found that sepsis most often occurs in patients older than age 65 years and in infants younger than 1 year of age, and the median hospital length of stay is 10 days. Six key signs and symptoms of sepsis were shivering or feeling cold; pain or discomfort; clammy or sweaty skin; being confused or disoriented; shortness of breath, and having a rapid heartbeat. “People with chronic diseases such as diabetes or weakened immune systems from things like tobacco use are at higher risk of sepsis,” Dr. Frieden said. “But even healthy people can develop sepsis from an infection, especially if it’s not treated properly and promptly.”
The four types of infections most commonly associated with sepsis include those involving the lungs, urinary tract, skin, and intestines, while the most common germs that can cause sepsis are Staphylococcus aureus, Escherichia coli (E. coli), and some types of Streptococcus. Infection prevention strategies such as increasing vaccination rates for pneumococcal disease and for influenza are likely to reduce the incidence of sepsis, according to the report. “We could also improve infections by improving handwashing at health care facilities as well as in the community,” Dr. Frieden added. “We can [also] improve recognition of sepsis both in the community and in health care facilities and act fast if sepsis is suspected in a patient. We’ve been able to reduce the rates of some infections that cause sepsis in health care facilities by half, but preventing more infections and stopping the spread of antibiotic resistant infections will protect even more patients from sepsis.”
Mitchell Levy, MD, founding member of the Surviving Sepsis Campaign, said during the teleconference that clinicians have made “tremendous progress in sepsis,” despite current challenges. “First, we now understand the importance of early identification and treatment of sepsis,” he said. “Second, we have seen improved survival through routine screening and treatment that is integrated into the work flow of hospitals. And third, frontline health care providers really do make a difference. What’s clear is that we need to expand these successes to other parts of hospitals and to other care locations.”
Forthcoming free CDC webinars related to sepsis for health care providers include one on Sept. 13 at 3 p.m., ET, entitled “Advances in Sepsis: Protecting Patients Throughout the Lifespan.” Another webinar will be offered on Sept. 22 at 2 p.m., ET, entitled “Empowering Nurses for Early Sepsis Recognition.”
FROM MORBIDITY AND MORTALITY WEEKLY REPORT
Key clinical point: Sepsis is a significant public health and clinical management challenge.
Major finding: Sepsis begins outside of the hospital in 79% of cases.
Data source: A retrospective review of medical records from 246 adults and 79 children with sepsis who were treated at four New York hospitals.
Disclosures: The researchers reported having no financial disclosures.
Zika virus pits pregnant women against time, knowledge gaps
ANNAPOLIS, MD. – The scramble to learn exactly how and when after infection the Zika virus affects the developing fetus has put pregnant women at the center of an unprecedented infectious disease emergency response.
“It’s the most complicated infectious disease response we’ve ever done,” Dana Meaney-Delman, MD, of the Centers for Disease Control and Prevention, told an audience at the annual scientific meeting of the Infectious Diseases Society for Obstetrics and Gynecology. “It’s also the first time an emergency response team has included an ob.gyn.”
Although research into Zika virus is happening at breakneck speed, every finding seems to lead to still more questions. “It’s hard to keep up,” said Dr. Meaney-Delman, who is a Clinical Deputy on the Pregnancy and Birth Defects Task Force, part of the CDC’s Zika virus response.
What is known
What is known is that Zika virus is primarily vector-borne, either manifesting as a mild illness or remaining subclinical. The virus is also communicable through male-to-female sex, female-to-female sex, blood donation, and organ transplantation. Once infected, one is immune; if symptomatic, the presentation clears within a couple of weeks. If a woman is infected during pregnancy, it can be transmitted to the developing fetus, including at the time of birth, according to Dr. Meaney-Delman.

“We know transmission can occur in any trimester. We’ve seen it in the placenta, in amniotic fluid, in the brain, as well as in the brains of infants who have died,” she said.
Whether the virus poses a risk to the fetus around the time of conception is not clear, but Dr. Meaney-Delman said that since other infections such as rubella and cytomegalovirus do pose a risk, the CDC is issuing Zika guidance accordingly.
Despite an initial theory that pregnant women were more susceptible to Zika infection, there is no evidence to date confirming this, but “the combination of mosquitoes and sexual transmission really puts a woman of reproductive age at risk,” said Catherine Y. Spong, MD, who also spoke during the meeting. Dr. Spong is acting director of the National Institute of Child Health and Human Development, part of the National Institutes of Health.
Based on data derived from other flaviviruses, the “good news” is that infected nonpregnant women who later want to conceive do not have a higher risk of bearing a child with Zika-related complications, according to Dr. Meaney-Delman.
Abnormalities seen and unseen
During the initial stages of the Zika outbreak in Brazil, the spiking rate of babies born with microcephaly attracted the most attention; yet it is now apparent that children were also born with a growing list of other Zika-associated pregnancy outcomes that likely were missed at the time, according to Dr. Spong.

“That’s not to say that a child that doesn’t have microcephaly does or doesn’t have some of these other complications. We don’t know; they weren’t studied because they didn’t have the microcephaly,” Dr Spong said. “To get the data right, you need to follow all the children.”
Brain abnormalities such as ventriculomegaly and intracranial calcifications, as well as a range of growth abnormalities, miscarriage, and stillbirth are increasingly associated with infants born to infected women. Data is also beginning to link Zika virus to limb abnormalities, hypertonia, hearing loss, damage to the eyes and central nervous system, and seizures.
The World Health Organization has also noted the involvement of the cardiac, genitourinary, and digestive systems in babies born to infected mothers in Panama and Colombia. “The caveat [to these data], is that all these women were symptomatic,” Dr. Spong said, noting that in Brazil, where the outbreak was first documented, 80% of the infected pregnant women were asymptomatic during the pregnancy.
“Just because the mother has no symptoms, she’s fine? That doesn’t make any sense to me,” Dr. Spong said. “We know that infections in pregnancy can result in long-term outcomes in kids that you don’t have the ability to diagnose at birth. We need to be cognizant of this and we need to study it.”
Although initial theories were that viremia in symptomatic women was likely higher, thus imparting a higher risk of infection in their fetus, Dr. Meaney-Delman said the number of asymptomatic women whose fetuses are affected has debunked this line of thinking.
Risk of infection during pregnancy
As to what the actual risk of Zika virus infection is during pregnancy, “honestly we don’t know,” said Dr. Spong. “There are modeling estimates that [it’s] between 1% and 13% in a first trimester infection, but we don’t have the hard and fast data.”
The Zika in Infants and Pregnancy (ZIP) study, recently launched by the NIH, will provide a prospective look at birth outcomes in 10,000 women aged 15 years and older who will be followed throughout their pregnancies to determine if they become infected with Zika virus, and if so, how infection impacts birth outcomes.
The international, multi-site study will help clarify the timing of risk, Dr. Spong said, and is intended to elucidate pregnancy risks in symptomatic vs. asymptomatic women. The study will also help indicate whether nutritional, socioeconomic status, and other cofactors such as Dengue infection are implicated. Once born, all children in the study will be observed for a year. “Even if they have no abnormalities, after birth there could be developmental delays, or more subtle consequences later on in the child’s life,” Dr. Meaney-Delman said.
Meanwhile, researchers are attempting to map how varying levels of viremia affect transmission. Zika virus has been found in semen after 90 days in at least two studies, “and we don’t know if Zika can be transmitted through other bodily fluids,” Dr. Spong said.
Surveillance data from the CDC’s Zika Pregnancy Registry has shown viremia in symptomatic women can last up to 46 days after onset of symptoms. In at least one asymptomatic pregnant woman, viremia was detected 53 days after exposure. Another study found prolonged viremia – 10 weeks – in a patient who had Zika infection in her first trimester; imaging showed the fetus was developing normally until week 20, when signs of severe brain abnormalities were detected.
The emerging picture of Zika’s potential for prolonged viremia has prompted the CDC to recommend clinicians use reverse transcription–polymerase chain reaction (RT-PCR) testing rather than serologic testing, as it is more sensitive and helps rule out other flavivirus infections, which require different management, Dr. Meaney-Delman said.
Potential mechanisms of action
“It’s clear that the virus does directly infect human cortical neural progenitor cells with very high efficiency, and in doing so, stunts their growth, dysregulates transcription, and causes cell death,” Dr. Spong said.
Researchers have also found that Zika replicates in subgroups of trophoblasts and endothelial cells, and in primary human placental macrophages, resulting in vascular damage and growth restriction. Other research suggests the virus spreads from basal and parietal decidua to chorionic villi and amniochorionic membranes, leading to the theory that uterine-placental suppression of the viral entry cofactor TIM1 could stop transmission to the fetus.
Prevention and management
CDC officials expect the current outbreak to mimic past flavivirus outbreaks which were contained locally in portions of the South and U.S. territories, Dr. Meaney-Delman said. Still, she emphasized that clinicians should screen patients, regardless of location. “Each pregnant women should be assessed for [vector] exposure, travel, and sexual exposure and asked about symptoms consistent with Zika virus,” Dr. Meaney-Delman said.
She also emphasized the importance of patients consistently using insect repellent and using condoms during pregnancy, as Zika has been detected in semen for as long as 6 months. “It’s been very hard to invoke this behavioral change in women, but it’s very effective.”
The CDC continues to update guidance, including how to evaluate newborns for Zika-related defects.
As for what resources might be needed in future to help affected families, in an interview Dr. Meaney-Delman said that depends on information still unknown. “Zika is a public health concern that we should be factoring in long term, but what we do about it will depend upon the outcomes,” she said. “If there are children that are born normal but who have lab evidence of Zika, then we will probably not do much. I don’t think we have a projection yet.”
On Twitter @whitneymcknight
ANNAPOLIS, MD. – The scramble to learn exactly how and when after infection the Zika virus affects the developing fetus has put pregnant women at the center of an unprecedented infectious disease emergency response.
“It’s the most complicated infectious disease response we’ve ever done,” Dana Meaney-Delman, MD, of the Centers for Disease Control and Prevention, told an audience at the annual scientific meeting of the Infectious Diseases Society for Obstetrics and Gynecology. “It’s also the first time an emergency response team has included an ob.gyn.”
Although research into Zika virus is happening at breakneck speed, every finding seems to lead to still more questions. “It’s hard to keep up,” said Dr. Meaney-Delman, who is a Clinical Deputy on the Pregnancy and Birth Defects Task Force, part of the CDC’s Zika virus response.
What is known
What is known is that Zika virus is primarily vector-borne, either manifesting as a mild illness or remaining subclinical. The virus is also communicable through male-to-female sex, female-to-female sex, blood donation, and organ transplantation. Once infected, one is immune; if symptomatic, the presentation clears within a couple of weeks. If a woman is infected during pregnancy, it can be transmitted to the developing fetus, including at the time of birth, according to Dr. Meaney-Delman.
“We know transmission can occur in any trimester. We’ve seen it in the placenta, in amniotic fluid, in the brain, as well as in the brains of infants who have died,” she said.
Whether the virus poses a risk to the fetus around the time of conception is not clear, but Dr. Meaney-Delman said that since other infections such as rubella and cytomegalovirus do pose a risk, the CDC is issuing Zika guidance accordingly.
Despite an initial theory that pregnant women were more susceptible to Zika infection, there is no evidence to date confirming this, but “the combination of mosquitoes and sexual transmission really puts a woman of reproductive age at risk,” said Catherine Y. Spong, MD, who also spoke during the meeting. Dr. Spong is acting director of the National Institute of Child Health and Human Development, part of the National Institutes of Health.
Based on data derived from other flaviviruses, the “good news” is that infected nonpregnant women who later want to conceive do not have a higher risk of bearing a child with Zika-related complications, according to Dr. Meaney-Delman.
Abnormalities seen and unseen
During the initial stages of the Zika outbreak in Brazil, the spiking rate of babies born with microcephaly attracted the most attention; yet it is now apparent that children were also born with a growing list of other Zika-associated pregnancy outcomes that likely were missed at the time, according to Dr. Spong.
“That’s not to say that a child that doesn’t have microcephaly does or doesn’t have some of these other complications. We don’t know; they weren’t studied because they didn’t have the microcephaly,” Dr Spong said. “To get the data right, you need to follow all the children.”
Brain abnormalities such as ventriculomegaly and intracranial calcifications, as well as a range of growth abnormalities, miscarriage, and stillbirth are increasingly associated with infants born to infected women. Data is also beginning to link Zika virus to limb abnormalities, hypertonia, hearing loss, damage to the eyes and central nervous system, and seizures.
The World Health Organization has also noted the involvement of the cardiac, genitourinary, and digestive systems in babies born to infected mothers in Panama and Colombia. “The caveat [to these data], is that all these women were symptomatic,” Dr. Spong said, noting that in Brazil, where the outbreak was first documented, 80% of the infected pregnant women were asymptomatic during the pregnancy.
“Just because the mother has no symptoms, she’s fine? That doesn’t make any sense to me,” Dr. Spong said. “We know that infections in pregnancy can result in long-term outcomes in kids that you don’t have the ability to diagnose at birth. We need to be cognizant of this and we need to study it.”
Although initial theories were that viremia in symptomatic women was likely higher, thus imparting a higher risk of infection in their fetus, Dr. Meaney-Delman said the number of asymptomatic women whose fetuses are affected has debunked this line of thinking.
Risk of infection during pregnancy
As to what the actual risk of Zika virus infection is during pregnancy, “honestly we don’t know,” said Dr. Spong. “There are modeling estimates that [it’s] between 1% and 13% in a first trimester infection, but we don’t have the hard and fast data.”
The Zika in Infants and Pregnancy (ZIP) study, recently launched by the NIH, will provide a prospective look at birth outcomes in 10,000 women aged 15 years and older who will be followed throughout their pregnancies to determine if they become infected with Zika virus, and if so, how infection impacts birth outcomes.
The international, multi-site study will help clarify the timing of risk, Dr. Spong said, and is intended to elucidate pregnancy risks in symptomatic vs. asymptomatic women. The study will also help indicate whether nutritional, socioeconomic status, and other cofactors such as Dengue infection are implicated. Once born, all children in the study will be observed for a year. “Even if they have no abnormalities, after birth there could be developmental delays, or more subtle consequences later on in the child’s life,” Dr. Meaney-Delman said.
Meanwhile, researchers are attempting to map how varying levels of viremia affect transmission. Zika virus has been found in semen after 90 days in at least two studies, “and we don’t know if Zika can be transmitted through other bodily fluids,” Dr. Spong said.
Surveillance data from the CDC’s Zika Pregnancy Registry has shown viremia in symptomatic women can last up to 46 days after onset of symptoms. In at least one asymptomatic pregnant woman, viremia was detected 53 days after exposure. Another study found prolonged viremia – 10 weeks – in a patient who had Zika infection in her first trimester; imaging showed the fetus was developing normally until week 20, when signs of severe brain abnormalities were detected.
The emerging picture of Zika’s potential for prolonged viremia has prompted the CDC to recommend clinicians use reverse transcription–polymerase chain reaction (RT-PCR) testing rather than serologic testing, as it is more sensitive and helps rule out other flavivirus infections, which require different management, Dr. Meaney-Delman said.
Potential mechanisms of action
“It’s clear that the virus does directly infect human cortical neural progenitor cells with very high efficiency, and in doing so, stunts their growth, dysregulates transcription, and causes cell death,” Dr. Spong said.
Researchers have also found that Zika replicates in subgroups of trophoblasts and endothelial cells, and in primary human placental macrophages, resulting in vascular damage and growth restriction. Other research suggests the virus spreads from basal and parietal decidua to chorionic villi and amniochorionic membranes, leading to the theory that uterine-placental suppression of the viral entry cofactor TIM1 could stop transmission to the fetus.
Prevention and management
CDC officials expect the current outbreak to mimic past flavivirus outbreaks which were contained locally in portions of the South and U.S. territories, Dr. Meaney-Delman said. Still, she emphasized that clinicians should screen patients, regardless of location. “Each pregnant women should be assessed for [vector] exposure, travel, and sexual exposure and asked about symptoms consistent with Zika virus,” Dr. Meaney-Delman said.
She also emphasized the importance of patients consistently using insect repellent and using condoms during pregnancy, as Zika has been detected in semen for as long as 6 months. “It’s been very hard to invoke this behavioral change in women, but it’s very effective.”
The CDC continues to update guidance, including how to evaluate newborns for Zika-related defects.
As for what resources might be needed in future to help affected families, in an interview Dr. Meaney-Delman said that depends on information still unknown. “Zika is a public health concern that we should be factoring in long term, but what we do about it will depend upon the outcomes,” she said. “If there are children that are born normal but who have lab evidence of Zika, then we will probably not do much. I don’t think we have a projection yet.”
On Twitter @whitneymcknight
AT IDSOG
