User login
President Mary Thomas Outlines AVAHO Strategic Goals
Mary Thomas, MS, CNS, AOCN, laid out AVAHO’s strategic goals for the coming year. Ms. Thomas pledged to enhance the value of AVAHO to its stakeholders, raise awareness of AVAHO inside and outside the organization, increase membership, and evolve the organization’s business model to ensure financial sustainability.
In closing the meeting, Ms. Thomas encouraged members, “I challenge each and every one of you when you go back to your facility, make sure that everyone that is involved in hematologic and oncologic care at your facility knows about this organization.”
The group is now moving towards the 2017 annual meeting, which will be held in Denver, September 15 to17, 2017. The meeting theme will be grounded in the every-day realities of providing cancer and hematology care in the VA: evidence-based practices that ensure patient values are maintained and utilizing clinical expertise.
Related: AVAHO Education Chair Mary Thomas on the AVAHO Meeting Program
Rusty Crawford, B Pharm, was named president-elect and Karen Clark Griffith, RN, PhD, will continue to be the organization's treasurer. In addition, Drew Moghanaki, MD, MPH; Tina Gill, MA; and William Wachsman, MD; were all elected to the AVAHO Board of Directors.
Outgoing president Anita Aggrawal also announced the creation of a new young investigator grant for research for $10,000, which will be selected in the coming year.
Awards were given for the top poster abstracts presented at the conference. The top poster from Klein and colleagues sought to determine the efficacy of inhibition of mitochondrial antioxidant defense against mesothelioma and whether the cyclin-dependent kinase 4 inhibitor palbociclib sensitizes mesothelioma cells to inhibition of mitochondrial antioxidant defense.
Related: New Protocol Aims to Evaluate Medication Adherence
The second-placed poster from Ahmed Halwani, MD, and colleagues develop a novel approach for extracting, retrieving, and validating clinical lab information from the VA Corporate Data Warehouse, in the hope of utilizing the data for better analysis.
The final poster abstract that was recognized at the conference was created by Cindy Bowman, MSN. The abstract outlined a patient navigation program for veterans with head and neck cancer. The program is focused on “providing holistic patient-centered care, eliminating fragmented care and delays, and decreasing emotional distress and healthcare cost.”
Providing Quality Epilepsy Care for Veterans
Epilepsy is a common and complex neurologic condition marked by recurrent seizures. It has been diagnosed in more than 87,000 veterans enrolled in the VA health care system, 16% of whom have comorbid traumatic brain injury (TBI), and nearly 25% also have posttraumatic stress disorder (PTSD).1 These comorbidities were even more common in Operation Enduring Freedom (OEF), Operation Iraqi Freedom (OIF), and Operation New Dawn (OND) veterans: TBI in 52.6% and PTSD in 70.4%. With 25 drugs for seizures and 2 approved devices, treatment of epilepsy can prove challenging to providers whose goal is to balance seizure control and adverse effects (AEs).
Despite the therapeutic armamentarium, about one-third of people with epilepsy have poorly controlled seizures, and an untold number may experience delays in referral to higher levels of epilepsy care or undergo troubling antiepileptic medication AEs and comorbid psychiatric disorders that have profound impacts on quality of life (QOL).
Quality generally has been defined as “providing the right care to the right patient at the right time and in the right way to achieve the best possible results.”2 Much work has been done over the past 2 decades to identify “the right care” for epilepsy patients.3
The American Academy of Neurology (AAN) has developed evidence-based, clinically focused guidelines on numerous topics, including antiepileptic drugs and women’s health, and has developed quality measure sets.4,5 More broadly, the Institute of Medicine (IOM) proposed 13 recommendations, including improving quality of care, establishing epilepsy centers and an epilepsy care network, educating health professionals about epilepsy, and providing education for people with epilepsy and their families.6
Within the VA, health care for veterans with epilepsy is changing in part by the Epilepsy Centers of Excellence (ECoC), established by federal law. The ECoE’s primary missions are to improve quality of and access to epilepsy specialty care to improve the health and well-being of veteran patients with epilepsy and other seizure disorders through integration of clinical care, outreach, research, and education to VA providers and patients.7
The goal of this article is to outline the key elements of quality epilepsy care and make recommendations for providing quality care in the VA health care system.
Diagnosis and Seizure Types
Quality care for veterans with epilepsy begins with the provider reviewing pertinent history and establishing the clinical characteristics of the patient’s seizures and epilepsy. The provider should ask about the first signs of the seizure or warning (aura), the seizure (ictal period), and the period after the seizure (postictal period). Seizure histories from the patient and observers are critical.
The first step is to define whether the patient’s seizures are generalized, that is, start all over the brain at once, or focal, starting in one area of the brain. The patient’s initial sensation at the onset of a seizure (aura) may help localize onset and define focal seizures. For example, déjà vu sensations often point to seizure onset in the mesial temporal lobe and hippocampus. Focal seizures can spread and cause cognitive dysfunction, including aphasia and amnesia, or evolve into a generalized convulsion (tonic-clonic seizure). Many patients present with a generalized tonic-clonic seizure and have had brief focal seizures that were not considered seizures by the patient or by other providers. This seizure type should be clarified by asking specifically about paroxysmal symptoms. For example, brief periods of confusion that are episodic may be focal seizures. In general, focal seizures are stereotyped and may have a feature that helps in establishing the diagnosis. Many temporal lobe seizures are associated with lip smacking behaviors (oral buccal automatisms).
Tonic-clonic seizures may begin without an aura and are generalized from onset. Patients with this type of seizure may have electroencephalogram (EEG) findings that define a generalized abnormality, which consist of frontocentral spike and wave discharges in the EEG. In the VA population, the first generalized tonic-clonic seizure may occur while in the military. Some of these patients have juvenile myoclonic epilepsy, and a history of brief jerks on waking (myoclonus) may have been occurring but not recognized as seizures. The treatment of seizures, in part, depends on whether they begin focally or are generalized at onset.
Often people with epilepsy have multiple seizure types. The types of seizures should be documented and, if possible, corroborated by a witness. Epileptic seizures tend to be stereotyped and of relatively brief duration, usually < 2 minutes. The period after a seizure may be followed by a more prolonged period of neurologic dysfunction that includes confusion and fatigue. These symptoms may be the only indication that the patient has had a seizure.
At each clinic visit, the characteristics of the patient’s seizures should be reviewed and the frequency of seizures documented. A calendar to track seizure frequency is helpful to understand precipitating factors and response to treatment.
The health care provider (HCP) should look for the cause of a patient’s epilepsy. It is important to ask the patient about family history, age of first seizure, occurrence of febrile seizures, developmental history, past history of meningitis or encephalitis, history of childhood seizures or spells, and history of brain lesions, including tumors, strokes, or TBI. Most patients with epilepsy do not have a clear cause for their epilepsy, but the cause may be clarified with EEG and magnetic resonance imaging (MRI) testing.
EEG and Brain Imaging
All patients with epilepsy should be evaluated with an EEG, and for those with focal epilepsy or undefined epilepsy, with an imaging study of the brain, preferably an MRI. These results should be reviewed at each visit. The EEG may show focal features that are related to neurophysiologic dysfunction, such as slowing that is not definitely epileptiform in character, or show focal spike or sharp waves that are epileptiform in character. Generalized abnormalities may include generalized slowing that is not an epileptiform feature or frontocentral spike wave patterns that are epileptiform in character. The EEG cannot rule out epilepsy, but can rule in the likelihood of epilepsy when definite epileptiform features are present.
Brain imaging can define many conditions that can cause focal epilepsy, and an MRI is more sensitive for defining a number of these conditions (cavernous angiomas, hippocampal sclerosis, developmental migration disorders, and low-grade neoplasms). Significant trauma with signal abnormalities to suggest prior bleeding predispose to epilepsy. When patients are refractory to medical therapy and have imaging findings concordant with EEG onset of seizures, then surgery can be a better treatment.
Adverse Effects
Broad-spectrum drug treatments are efficacious for either generalized or focal seizures, whereas narrow-spectrum treatments are most efficacious for focal seizures (Table 1). The choice of a seizure medication is based on the patient’s seizure type(s) and other comorbid conditions.7 For example, a patient with epilepsy and migraines may do better with a seizure medication that also is used for migraine prophylaxis (valproate or topiramate). In general, seizure control is unlikely to be achieved if patients fail the first 2 medications tried.8 Treating with > 1 medication may improve seizure control but may increase AEs. A review of current seizure medications and their AEs can be found on the ECoE website (http://www.epilepsy.va.gov/Provider_Education.asp).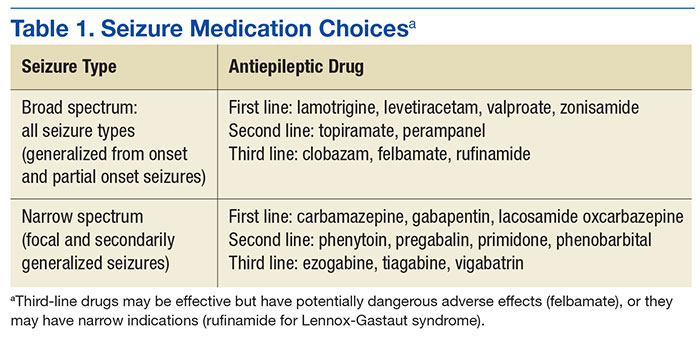
In VA cooperative studies that evaluated seizure medications, the most common reason for discontinuing a drug was the combination of ineffectiveness and AEs.9-11 Addressing AEs is a quality measure for the care of patients with epilepsy. Adverse effects may be dose dependent or idiosyncratic (rashes). Drug levels may help in determining dose-dependent AEs; for example, diplopia with carbamazepine levels above 10 μg/mL. Each patient may have susceptibility to medication AEs that do not exactly match therapeutic levels. When patients have AEs, a reduction in dose or trial of an alternative medication is advised.
Uncontrollable Epilepsy
About one-third of people with epilepsy have uncontrolled seizures, known as medically intractable epilepsy, which may be identified early in their clinical course by failure of the first 2 tolerated medications.8 Patients should be referred to an epilepsy center so their epilepsy can be defined by video EEG monitoring to capture seizures. Unfortunately, in the VA system, this route is often delayed, and patients may not be diagnosed appropriately for years.12 Some of these patients may be considered treatment failures because the right medications were not tried (eg, generalized epilepsy that is treated with narrow-spectrum seizure medications). Juvenile myoclonic epilepsy often may not be controlled by phenytoin or carbamazepine, but valproate, lamotrigine, levetiracetam, and zonisamide may be more effective.
Other patients may not have epilepsy but have psychogenic nonepileptic seizures (PNES). These behavioral seizures do not have an EEG epileptiform correlate. About 25% of patients who undergo prolonged video EEG monitoring have PNES, and seizure medications do not treat these events.12 A smaller percentage of patients have both epileptic and nonepileptic seizures (5%-15%). Psychogenic nonepileptic seizures often occur within the context of traumatic exposure(s) or previous physical or sexual abuse.
In the VA population, PNES is more often associated with PTSD or head trauma history than in patients with epilepsy.13,14 To confirm the diagnosis of PNES, video-EEG capture of the patient’s seizures is required. Because of the increased number of combat veterans with TBI and PTSD, the diagnosis of epilepsy may be difficult without video-EEG monitoring. Management consists of addressing the underlying conversion disorder and recognition and treatment of comorbidities, such as mood, anxiety, personality, or PTSD. Recently, cognitive behavioral-informed psychotherapy (CB-ip) has been shown to be effective in patients with PNES and is available through the VA national telemental health center and at some ECoE sites.15
If a patient with uncontrolled epilepsy has focal seizures, surgical therapy is more likely to result in seizure control than will medical therapy.16,17 This is especially true when other testing, including MRI, positron emission tomography, and neuropsychiatric evaluation, point to a concordance of localization. These patients should be evaluated in a center that can provide surgical therapy and if necessary also record seizures with invasive techniques using electrodes placed directly over the cortex or into the brain to sample deeper structures like the hippocampus or amygdala. Patients who are refractory should be considered for reevaluation every 2 years by a comprehensive epilepsy center.
Unfortunately, some patients have seizures that begin in eloquent cortex, which if removed, leads to undesirable neurologic loss or multifocal seizure onset. In these patients, seizure frequency can be reduced by vagus nerve stimulation or intracranial responsive neurostimulation.18,19
Safety
Epilepsy has inherent risks for injury. Patients and their families often need to be informed about risks and risky behaviors to avoid. A frank discussion about safety is prudent. What to do for the patient during a seizure should be addressed. For convulsive seizures: Protect the patient from injury by placing something soft between the patient’s head and the floor, keep the patient on his or her side; do not restrain the patient or put anything in the mouth; stay calm and time the seizure; as the patient gains consciousness, talk to the patient and be reassuring. For nonconvulsive seizures: Stay with the patient; time the seizure; gently guide the patient away from dangerous situations like streets or stairs; stay with the patient until he or she is back to normal, and reassure the patient.
Driving
People with epilepsy identify driving as one of their major concerns; therefore, it is important for HCPs to properly counsel patients with seizure disorders and their families about driving (Figure).20 In general people with controlled seizures are permitted to drive in every state in the U.S., but people with uncontrolled seizures are restricted from licensure. Despite the desire and necessity to drive for many individuals with epilepsy, seizures while driving pose risks for crashes, which may result in property damage, injuries, and death.21 Factors, such as duration of seizure freedom, help predict the risk for crashes. The legal rules for determining control and administering restrictions are a complex mix of federal and state laws, regulations, and local practices, which vary widely across the country.21,22 The standards also change over time; updated information is available from local state authorities and on good informational sites, such as those of the Epilepsy Foundation. 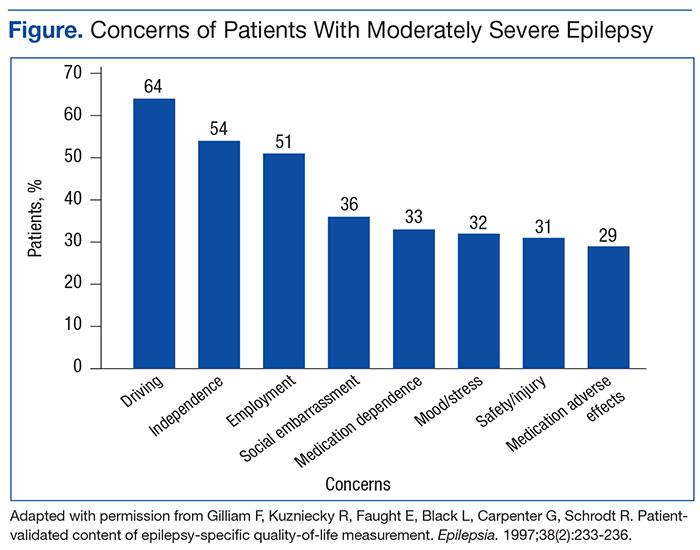
The key standard for determining accident risks is the seizure free interval, which is the duration of time a person with epilepsy has been seizure-free.21-23 In the U.S., the accepted period for seizure freedom varies from about 3 months to 12 months, depending on individual state rules.24
California, Delaware, Nevada, New Jersey, Oregon, and Pennsylvania require mandatory reporting. Generally physician groups in the U.S. and elsewhere oppose such mandatory reporting, because of the concern that their patients will not report their seizures, and thus may not receive appropriate treatment. Indeed, patients with epilepsy often do not tell physicians about their seizures, fearing loss of driving privileges and other social consequences.21,23 Providers should make an effort to determine seizure frequency and whether the patient is being truthful. This information then provides a background for the provider to discuss driving issues.
Injury
People with epilepsy are susceptible to injury during a seizure and need to be counseled regarding safety, particularly when seizures are not well controlled. Hazardous situations include being near stoves or cooking, bathing alone, swimming alone, working at heights without a safety harness, and using power tools.26
Sudden Unexplained Death
Patients with recurrent seizures have an increased risk for accidental fatality and for sudden unexplained death in epilepsy (SUDEP), which accounts for up to 17% of all deaths in people with epilepsy. The risk for sudden death from recurrent seizures increases 2.3 times compared with the risk in the general population.25 A SUDEP is an unexpected death in a person who has epilepsy with no other obvious cause of death.26 Because increased seizure frequency, the presence of tonic-clonic seizures, and other accidental risks of seizures are associated with SUDEP, the subject should be discussed with patients and their families, to encourage adherence to treatment. Epileptologists also discuss these risks with patients and their families when surgical interventions are being considered. The potential risks for injury or SUDEP may offset the surgical risks when pursuing a potentially curative epilepsy procedure.
Women of Childbearing Age
In January 2015, the ECoE started a women veterans epilepsy workgroup with the goal of improving clinical care within the VAHCS to provide education to patients, family members, and VA health care providers about the care of women with epilepsy.
Providers need to be aware that seizure medications that induce certain hepatic enzymes can lead to hormonal contraceptive failure (Table 2).27 Preconception folic acid supplementation (with at least 0.4 mg) should be considered, because it may reduce the risk of major congenital malformations.28 The goal of epilepsy management prior to conception is to maximize seizure control with the optimal seizure medication to avoid the need to make changes during the pregnancy.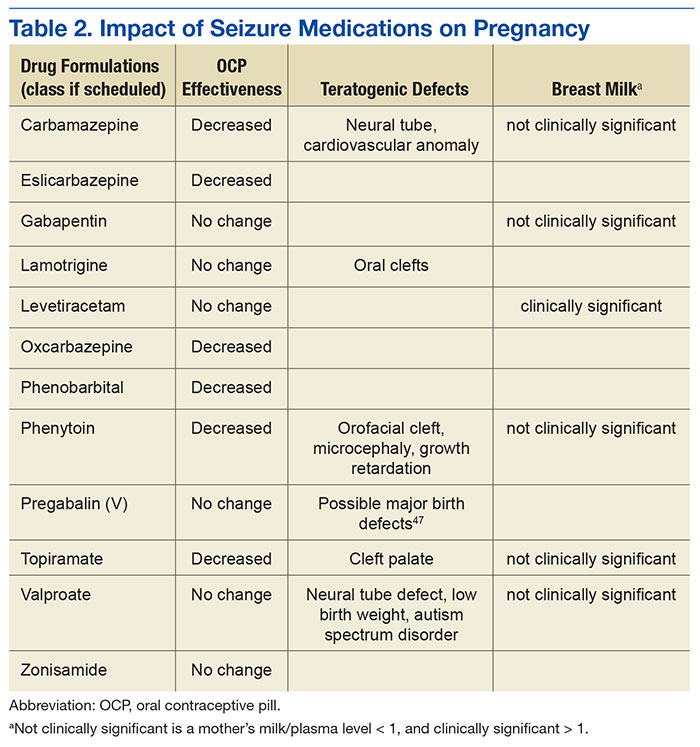
During pregnancy, the volume of distribution increases and seizure medication metabolism may change requiring dose adjustment. The best predictor of seizure frequency during pregnancy is a woman’s epilepsy pattern prior to conception. Seizure freedom for 9 months prior to conception is associated with a 84% to 92% likelihood of seizure freedom throughout the pregnancy.29
International seizure medication pregnancy registries have provided valuable information regarding the risk of major congenital malformation (MCM) of development, which seems to be a consequence of seizure medication therapy and not epilepsy itself. The risk of MCM associated with seizure medication therapy is about 4% to 5% compared with 1.5% to 3% in the general population.30,31 A seizure medication table that supplements the existing VA ECoE information specifically addresses women’s issues with the recognition that recent revisions to the teratogenicity classification have been made by the FDA (Table 2).32 If possible, valproate should be avoided during pregnancy due to its higher rate of MCM and impact on neurocognitive function.33 Obstetrical input is essential in arranging routine prenatal fetal testing. Although women with epilepsy do not have a substantially increased risk of undergoing a cesarean section, delivery in a hospital obstetric unit is advised.
Postpartum women veterans with epilepsy should be encouraged to breast feed since the potential benefits seem to outweigh any established risk of seizure medication exposure to the infant. No relative impact on cognition was found in breastfed infants exposed to a variety of seizure medications.34 Following delivery, vigilance is needed to monitor for sleep deprivation, postpartum depression, and the safe care of the infant.35 Care of women with epilepsy does not end with pregnancy planning, additional important topics include psychiatric comorbidities, catamenial epilepsy, and bone health, which are unique to women veterans with epilepsy.
Identifying Psychiatric Conditions
People with epilepsy have a number of psychiatric comorbidities. Suicide and suicide attempts are 6 to 25 times more common in patients with temporal lobe epilepsy compared with those in the general population.36-38 Although the FDA identified all seizure medications as potential contributors to suicide risk, a recent longitudinal study of suicidal ideation and attempt found that those who received seizure medications were more likely to have suicidal ideation and attempt than those who did not received seizure medications, suggesting that medication may relate to baseline depression or suicidal ideation.39 When seeing patients with epilepsy, screening for suicidal ideation is good practice.
Depression and anxiety disorders are the most common psychiatric comorbidities in people with epilepsy.40,41 About half of people with epilepsy have symptoms of depression, and 40% have anxiety.42 Depression often precedes the diagnosis of epilepsy, and anxiety often is present and related to the fear of having seizures and of social embarrassment.43 People with epilepsy may not self-report these symptoms if not asked directly. Identification of comorbid depression and anxiety should lead to appropriate treatment. The CB-ip being used for PNES also is being used for treatment of epilepsy and its comorbidities.44
Mild traumatic brain injury (mTBI) has a small increased risk of epilepsy.45 Veterans with mTBI that occurs in the context of blasts are set up for the development of PTSD. These veterans may have other mild cognitive symptoms that can be confused with seizures. Furthermore, mTBI and PNES often occur together, more so than do mTBI and epileptic seizures.14 Video-EEG monitoring may be warranted for these patients.
Education and Self-Management
The IOM report on epilepsy identified patient and family education as essential for better epilepsy care.6 Providers should help educate patients about their epilepsy and refer them to resources available online (Table 3). A continuing exchange about their condition and treatment with seizure medications should occur with each visit. People with epilepsy should also receive guidance regarding how to manage their epilepsy and day-to-day issues. Referring, patients to social workers, psychologists, vocational rehabilitation services, and support groups can enhance a patient’s QOL.3,6 The stigma of epilepsy is another burden that can be diminished by attending support groups. Recently, being a part of an online patient community of veterans was found to improve self-management.46 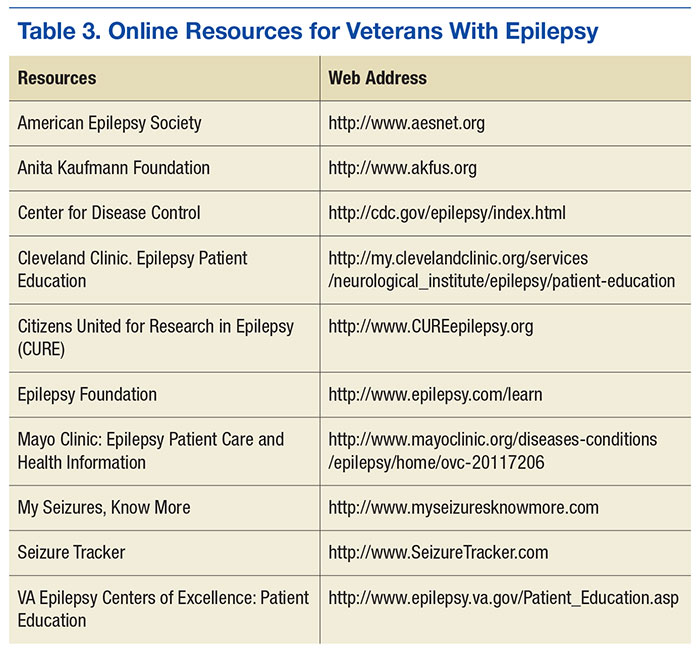
Conclusion
People with epilepsy have many issues that are unique to the condition and, in part, are related to the unpredictable occurrence of seizures and loss of function. Ideally, seizure control provides a normal lifestyle; however, some mood and anxiety comorbidities may persist despite seizure control. Care in the VA system includes access to 16 sites that have programs dedicated to treating veterans with epilepsy and many more consortium sites that interact with the ECoE to provide high-quality patient care (http:\\www.epilepsy.va.gov). The ECoE also provides a readily available resource to optimally manage veterans with epilepsy. Attention to the issues addressed in this article will promote quality care for veterans with epilepsy.
1. Rehman R, Kelly P, Husain AM, Tran TT. Characteristics of veterans diagnosed with seizures within Veterans Health Administration. J Rehabil Res Dev. 2015;52(7):751-762.
2. National Committee for Quality Assurance (NCQA). The essential guide to health care quality. https://www.ncqa.org/Portals/0/Publications/Resource%20Library/NCQA_Primer_web.pdf. Accessed August 9, 2016.
3. Pugh MJ, Berlowitz DR, Montouris GB, et al. What constitutes high quality of care for adults with epilepsy? Neurology. 2007;69(21):2020-2027.
4. Fountain NB, Van Ness PC, Swain-Eng R, Tonn S, Bever CT Jr; American Academy of Neurology Epilepsy Measure Development Panel and the American Medical Association-Convened Physician Consortium for Performance Improvement Independent Measure Development Process. Quality improvement in neurology: AAN epilepsy quality measures: report of the Quality Measurement and Reporting Subcommittee of the American Academy of Neurology. Neurology. 2011;76(1):94-99.
5. Fountain NB, Van Ness PC, Bennett A, et al. Quality improvement in neurology: epilepsy update quality measurement set. Neurology. 2015;84(14):1483-1487.
6. England MJ, Liverman CT, Schultz AM, Strawbridge LM, eds; Committee on the Public Health Dimensions of the Epilepsies, Board on Health Sciences Policy, Institute of Medicine. Epilepsy Across the Spectrum: Promoting Health and Understanding. Washington, DC: The National Academies Press; 2012.
7. Tortorice K, Rutecki P. Principles of Treatment. In: Hussain, AM, Tran TT, eds. Department of Veterans Affairs Epilepsy Manual. San Francisco, CA: Epilepsy Centers of Excellence, Department of Veteran Affairs; 2014:120-127.
8. Kwan P, Brodie MJ. Early Identification of refractory epilepsy. N Engl J Med. 2000;342(5):314-319.
9. Mattson RH, Cramer JA, Collins JF, et al. Comparison of carbamazepine, phenobarbital, phenytoin, and primidone in partial and secondarily generalized tonic-clonic seizures. N Eng J Med. 1985;313(3):145-151.
10. Mattson RH, Cramer JA, Collins JF. A comparison of valproate with carbamazepine for the treatment of complex partial seizures and secondarily generalized tonic-clonic seizures in adults. The Department of Veterans Affairs Epilepsy Cooperative Study No. 264 Group. N Eng J Med. 1992;327(11):765-771.
11. Rowan AJ, Ramsay RE, Collins JF, et al; VA Cooperative Study 428 Group. New onset geriatric epilepsy: a randomized study of gabapentin, lamotrigine, and carbamazepine. Neurology. 2005;64(11):1868-1873.
12. Salinsky M, Spencer D, Boudreau E, Ferguson F. Psychogenic nonepileptic seizures in US veterans. Neurology. 2011;77(10):945-950.
13. Salinsky M, Evrard C, Storzbach D, Pugh MJ. Psychiatric comorbidity in veterans with psychogenic seizures. Epilepsy Behav. 2012;25(3):345-349.
14. Salinsky M, Storzbach D, Goy E, Evrard C. Traumatic brain injury and psychogenic seizures in veterans. J Head Trauma Rehabil. 2015;30(1):E65-E70.
15. LaFrance WC Jr, Baird GL, Barry JJ, et al; NES Treatment Trial (NEST-T) Consortium. Multicenter pilot treatment trial for psychogenic nonepileptic seizures: a randomized clinical trial. JAMA Psychiatry. 2014;71(9):997-1005.
16. Wiebe S, Blume WT, Girvin JP, Eliasziw M; Effectiveness and Efficiency of Surgery for Temporal Lobe Epilepsy Study Group. A randomized, control trial for temporal-lobe epilepsy. N Engl J Med. 2001;345(5):311-318.
17. Engel J Jr, Wiebe S, French J, et al. Practice parameter: temporal lobe and localized neocortical resections for epilepsy. Epilepsia. 2003;44(6):741-751.
18. Morris GL III, Gloss D, Buchhalter J, Mack KJ, Nickels K, Harden C. Evidence-based guideline update: vagus nerve stimulation for the treatment of epilepsy. report of the Guideline Development Subcommittee of the American Academy of Neurology. Neurology. 2013;81(16):1453-1459.
19. Morrell M; RNS System in Epilepsy Study Group. Responsive cortical stimulation for the treatment of medically intractable partial epilepsy. Neurology. 2011;77(13):1295-1304.
20. Gilliam F, Kuzniecky R, Faught E, Black L, Carpenter G, Schrodt R. Patient-validated content of epilepsy-specific quality-of-life measurement. Epilepsia. 1997;38(2):233-236.
21. Krumholz A. Driving issues in epilepsy: past, present, and future. Epilepsy Curr. 2009;9(2):31-35.
22. Krauss GL, Ampaw L, Krumholz A. Individual state driving restrictions for people with epilepsy in the US. Neurology. 2001;57(10):1780-1785.
23. Krauss GL, Krumholz A, Carter RC, Kaplan P. Risk factors for seizure-related motor vehicle crashes in patients with epilepsy. Neurology. 1999;52(7):1324-1329.
24. Consensus statements, sample statutory provisions, and model regulations regarding driver licensing and epilepsy. American Academy of Neurology. American Epilepsy Society, Epilepsy Foundation of America. Epilepsia. 1994:35(3):696-705.
25. Cavazos, JE. SUDEP and Other Risks of Seizures. In: Husain AM, Tran, TT, eds. VA Epilepsy Manual. San Francisco, CA: Epilepsy Centers of Excellence, Department of Veteran Affairs; 2014:206-209.
26. Tolstykh GP, Cavazos JE. Potential mechanisms of sudden unexpected death in epilepsy. Epilepsy Behav. 2013;26(3):410-414.
27. Gaffield ME, Culwell KR, Lee CR. The use of hormonal contraception among women taking anticonvulsant therapy. Contraception. 2011;83(1):16-29.
28. Harden CL, Pennell PB, Koppel BS, et al; American Academy of Neurology; American Epilepsy Society. Practice parameter update: management issues for women with epilepsy—focus on pregnancy (an evidence-based review): vitamin K, folic acid, blood levels, and breast-feeding: report of the Quality Standards Subcommittee and Therapeutics and Technology Assessment Subcommittee of the American Academy of Neurology and the American Epilepsy Society. Neurology. 2009;73(2):142-149.
29. Harden CL, Hopp J, Ting TY, et al; American Academy of Neurology; American Epilepsy Society. Management issues for women with epilepsy-focus on pregnancy (an evidence-based review): 1. Obstetrical complications and change in seizure frequency: report of the Quality Standards Subcommittee and Therapeutics and Technology Assessment Subcommittee of the American Academy of Neurology and the American Epilepsy Society. Epilepsia. 2009;50(5):1229-1236.
30. Artama M, Auvinen A, Raudaskoski T, Isojärvi I, Isojärvi J. Antiepileptic drug use of women with epilepsy and congenital malformations in offspring. Neurology. 2005;64(11):1874-1878.
31. Morrow J, Russell A, Guthrie E, et al. Malformation risks of antiepileptic drugs in pregnancy: a prospective study from the UK Epilepsy and Pregnancy Register. J Neurol Neurosurg Psychiatry. 2006;77(2):193-198.
32. U.S. Food and Drug Administration. Pregnancy and lactation labeling (drugs) final rule. http://www.fda.gov/Drugs/DevelopmentApprovalProcess/DevelopmentResources/Labeling/ucm093307.htm. Published December 3, 2014. Accessed June 27, 2016.
33. Meador KJ, Baker GA, Browning N, et al; NEAD Study Group. Cognitive function at 3 years of age after fetal exposure to antiepileptic drugs. N Engl J Med. 2009;360(16):1597-1605.
34. Meador KH, Baker GA, Browning N, et al; NEAD Study Group. Effects of breastfeeding in children of women taking antiepileptic drugs. Neurology. 2010;75(22):1954-1960.
35. Klein A. The postpartum period in women with epilepsy. Neurol Clin. 2012;30(3):867-875.
36. Harris EC, Barraclough B. Suicide as an outcome for mental disorders. A meta-analysis. Br J Psychiatry. 1997;170:205-228.
37. Jones JE, Hermann BP, Barry JJ, Gilliam FG, Kanner AM, Meador KJ. Rates and risk factors for suicide, suicidal ideation, and suicide attempts in chronic epilepsy. Epilepsy Behav. 2013;4(suppl 3):S31-S38.
38. Christensen J, Vestergaard M, Mortensen PB, Sidenius P, Agerbo E. Epilepsy and risk of suicide: a population-based case-control study. Lancet Neurol. 2007;6(8):693-698.
39. Pugh MJ, Hesdorffer D, Wang CP, et al. Temporal trends in new exposure to antiepileptic drug monotherapy and suicide-related behavior. Neurology. 2013;81(22):1900-1906.
40. Barry JJ, Ettinger AB, Friel P, et al; Advisory Group of the Epilepsy Foundation as part of its Mood Disorder. Consensus statement: the evaluation and treatment of people with epilepsy and affective disorders. Epilepsy Behav. 2008;13(suppl 1):S1-S29.
41. Ottman R, Lipton RB, Ettinger AB, et al. Comorbidities of epilepsy: results from the Epilepsy Comorbidities and Health (EPIC) survey. Epilepsia. 2011;52(2):308-315.
42. Kanner AM. Depression in epilepsy: prevalence, clinical semiology, pathogenic mechanism, and treatment. Biol Psychiatry. 2003;54(3):388-398.
43. Kanner AM. The treatment of depressive disorders in epilepsy: what all neurologists should know. Epilepsia. 2013;54(suppl 1):3-12.
44. Reiter JM, Andrews DJ. A neurobehavioral approach for treatment of complex partial epilepsy: efficacy. Seizure. 2000;9(3):198-203.
45. Pugh MJ, Orman JA, Jaramillo CA, et al. The prevalence of epilepsy and association with traumatic brain Injury in Veterans of the Afghanistan and Iraq Wars. J Head Trauma Rehabil. 2015;30(1):29-37.
46. Hixson JD, Barnes D, Parko K, et al. Patients optimizing epilepsy management via an online community: the POEM Study. Neurology. 2015;85(2):129-136.
47. Winterfeld U, Merlob P, Baud D, et al. Pregnancy outcome following maternal exposure to pregabalin may call for concern. Neurology. 2016;86(24):2251-2257.
Epilepsy is a common and complex neurologic condition marked by recurrent seizures. It has been diagnosed in more than 87,000 veterans enrolled in the VA health care system, 16% of whom have comorbid traumatic brain injury (TBI), and nearly 25% also have posttraumatic stress disorder (PTSD).1 These comorbidities were even more common in Operation Enduring Freedom (OEF), Operation Iraqi Freedom (OIF), and Operation New Dawn (OND) veterans: TBI in 52.6% and PTSD in 70.4%. With 25 drugs for seizures and 2 approved devices, treatment of epilepsy can prove challenging to providers whose goal is to balance seizure control and adverse effects (AEs).
Despite the therapeutic armamentarium, about one-third of people with epilepsy have poorly controlled seizures, and an untold number may experience delays in referral to higher levels of epilepsy care or undergo troubling antiepileptic medication AEs and comorbid psychiatric disorders that have profound impacts on quality of life (QOL).
Quality generally has been defined as “providing the right care to the right patient at the right time and in the right way to achieve the best possible results.”2 Much work has been done over the past 2 decades to identify “the right care” for epilepsy patients.3
The American Academy of Neurology (AAN) has developed evidence-based, clinically focused guidelines on numerous topics, including antiepileptic drugs and women’s health, and has developed quality measure sets.4,5 More broadly, the Institute of Medicine (IOM) proposed 13 recommendations, including improving quality of care, establishing epilepsy centers and an epilepsy care network, educating health professionals about epilepsy, and providing education for people with epilepsy and their families.6
Within the VA, health care for veterans with epilepsy is changing in part by the Epilepsy Centers of Excellence (ECoC), established by federal law. The ECoE’s primary missions are to improve quality of and access to epilepsy specialty care to improve the health and well-being of veteran patients with epilepsy and other seizure disorders through integration of clinical care, outreach, research, and education to VA providers and patients.7
The goal of this article is to outline the key elements of quality epilepsy care and make recommendations for providing quality care in the VA health care system.
Diagnosis and Seizure Types
Quality care for veterans with epilepsy begins with the provider reviewing pertinent history and establishing the clinical characteristics of the patient’s seizures and epilepsy. The provider should ask about the first signs of the seizure or warning (aura), the seizure (ictal period), and the period after the seizure (postictal period). Seizure histories from the patient and observers are critical.
The first step is to define whether the patient’s seizures are generalized, that is, start all over the brain at once, or focal, starting in one area of the brain. The patient’s initial sensation at the onset of a seizure (aura) may help localize onset and define focal seizures. For example, déjà vu sensations often point to seizure onset in the mesial temporal lobe and hippocampus. Focal seizures can spread and cause cognitive dysfunction, including aphasia and amnesia, or evolve into a generalized convulsion (tonic-clonic seizure). Many patients present with a generalized tonic-clonic seizure and have had brief focal seizures that were not considered seizures by the patient or by other providers. This seizure type should be clarified by asking specifically about paroxysmal symptoms. For example, brief periods of confusion that are episodic may be focal seizures. In general, focal seizures are stereotyped and may have a feature that helps in establishing the diagnosis. Many temporal lobe seizures are associated with lip smacking behaviors (oral buccal automatisms).
Tonic-clonic seizures may begin without an aura and are generalized from onset. Patients with this type of seizure may have electroencephalogram (EEG) findings that define a generalized abnormality, which consist of frontocentral spike and wave discharges in the EEG. In the VA population, the first generalized tonic-clonic seizure may occur while in the military. Some of these patients have juvenile myoclonic epilepsy, and a history of brief jerks on waking (myoclonus) may have been occurring but not recognized as seizures. The treatment of seizures, in part, depends on whether they begin focally or are generalized at onset.
Often people with epilepsy have multiple seizure types. The types of seizures should be documented and, if possible, corroborated by a witness. Epileptic seizures tend to be stereotyped and of relatively brief duration, usually < 2 minutes. The period after a seizure may be followed by a more prolonged period of neurologic dysfunction that includes confusion and fatigue. These symptoms may be the only indication that the patient has had a seizure.
At each clinic visit, the characteristics of the patient’s seizures should be reviewed and the frequency of seizures documented. A calendar to track seizure frequency is helpful to understand precipitating factors and response to treatment.
The health care provider (HCP) should look for the cause of a patient’s epilepsy. It is important to ask the patient about family history, age of first seizure, occurrence of febrile seizures, developmental history, past history of meningitis or encephalitis, history of childhood seizures or spells, and history of brain lesions, including tumors, strokes, or TBI. Most patients with epilepsy do not have a clear cause for their epilepsy, but the cause may be clarified with EEG and magnetic resonance imaging (MRI) testing.
EEG and Brain Imaging
All patients with epilepsy should be evaluated with an EEG, and for those with focal epilepsy or undefined epilepsy, with an imaging study of the brain, preferably an MRI. These results should be reviewed at each visit. The EEG may show focal features that are related to neurophysiologic dysfunction, such as slowing that is not definitely epileptiform in character, or show focal spike or sharp waves that are epileptiform in character. Generalized abnormalities may include generalized slowing that is not an epileptiform feature or frontocentral spike wave patterns that are epileptiform in character. The EEG cannot rule out epilepsy, but can rule in the likelihood of epilepsy when definite epileptiform features are present.
Brain imaging can define many conditions that can cause focal epilepsy, and an MRI is more sensitive for defining a number of these conditions (cavernous angiomas, hippocampal sclerosis, developmental migration disorders, and low-grade neoplasms). Significant trauma with signal abnormalities to suggest prior bleeding predispose to epilepsy. When patients are refractory to medical therapy and have imaging findings concordant with EEG onset of seizures, then surgery can be a better treatment.
Adverse Effects
Broad-spectrum drug treatments are efficacious for either generalized or focal seizures, whereas narrow-spectrum treatments are most efficacious for focal seizures (Table 1). The choice of a seizure medication is based on the patient’s seizure type(s) and other comorbid conditions.7 For example, a patient with epilepsy and migraines may do better with a seizure medication that also is used for migraine prophylaxis (valproate or topiramate). In general, seizure control is unlikely to be achieved if patients fail the first 2 medications tried.8 Treating with > 1 medication may improve seizure control but may increase AEs. A review of current seizure medications and their AEs can be found on the ECoE website (http://www.epilepsy.va.gov/Provider_Education.asp).
In VA cooperative studies that evaluated seizure medications, the most common reason for discontinuing a drug was the combination of ineffectiveness and AEs.9-11 Addressing AEs is a quality measure for the care of patients with epilepsy. Adverse effects may be dose dependent or idiosyncratic (rashes). Drug levels may help in determining dose-dependent AEs; for example, diplopia with carbamazepine levels above 10 μg/mL. Each patient may have susceptibility to medication AEs that do not exactly match therapeutic levels. When patients have AEs, a reduction in dose or trial of an alternative medication is advised.
Uncontrollable Epilepsy
About one-third of people with epilepsy have uncontrolled seizures, known as medically intractable epilepsy, which may be identified early in their clinical course by failure of the first 2 tolerated medications.8 Patients should be referred to an epilepsy center so their epilepsy can be defined by video EEG monitoring to capture seizures. Unfortunately, in the VA system, this route is often delayed, and patients may not be diagnosed appropriately for years.12 Some of these patients may be considered treatment failures because the right medications were not tried (eg, generalized epilepsy that is treated with narrow-spectrum seizure medications). Juvenile myoclonic epilepsy often may not be controlled by phenytoin or carbamazepine, but valproate, lamotrigine, levetiracetam, and zonisamide may be more effective.
Other patients may not have epilepsy but have psychogenic nonepileptic seizures (PNES). These behavioral seizures do not have an EEG epileptiform correlate. About 25% of patients who undergo prolonged video EEG monitoring have PNES, and seizure medications do not treat these events.12 A smaller percentage of patients have both epileptic and nonepileptic seizures (5%-15%). Psychogenic nonepileptic seizures often occur within the context of traumatic exposure(s) or previous physical or sexual abuse.
In the VA population, PNES is more often associated with PTSD or head trauma history than in patients with epilepsy.13,14 To confirm the diagnosis of PNES, video-EEG capture of the patient’s seizures is required. Because of the increased number of combat veterans with TBI and PTSD, the diagnosis of epilepsy may be difficult without video-EEG monitoring. Management consists of addressing the underlying conversion disorder and recognition and treatment of comorbidities, such as mood, anxiety, personality, or PTSD. Recently, cognitive behavioral-informed psychotherapy (CB-ip) has been shown to be effective in patients with PNES and is available through the VA national telemental health center and at some ECoE sites.15
If a patient with uncontrolled epilepsy has focal seizures, surgical therapy is more likely to result in seizure control than will medical therapy.16,17 This is especially true when other testing, including MRI, positron emission tomography, and neuropsychiatric evaluation, point to a concordance of localization. These patients should be evaluated in a center that can provide surgical therapy and if necessary also record seizures with invasive techniques using electrodes placed directly over the cortex or into the brain to sample deeper structures like the hippocampus or amygdala. Patients who are refractory should be considered for reevaluation every 2 years by a comprehensive epilepsy center.
Unfortunately, some patients have seizures that begin in eloquent cortex, which if removed, leads to undesirable neurologic loss or multifocal seizure onset. In these patients, seizure frequency can be reduced by vagus nerve stimulation or intracranial responsive neurostimulation.18,19
Safety
Epilepsy has inherent risks for injury. Patients and their families often need to be informed about risks and risky behaviors to avoid. A frank discussion about safety is prudent. What to do for the patient during a seizure should be addressed. For convulsive seizures: Protect the patient from injury by placing something soft between the patient’s head and the floor, keep the patient on his or her side; do not restrain the patient or put anything in the mouth; stay calm and time the seizure; as the patient gains consciousness, talk to the patient and be reassuring. For nonconvulsive seizures: Stay with the patient; time the seizure; gently guide the patient away from dangerous situations like streets or stairs; stay with the patient until he or she is back to normal, and reassure the patient.
Driving
People with epilepsy identify driving as one of their major concerns; therefore, it is important for HCPs to properly counsel patients with seizure disorders and their families about driving (Figure).20 In general people with controlled seizures are permitted to drive in every state in the U.S., but people with uncontrolled seizures are restricted from licensure. Despite the desire and necessity to drive for many individuals with epilepsy, seizures while driving pose risks for crashes, which may result in property damage, injuries, and death.21 Factors, such as duration of seizure freedom, help predict the risk for crashes. The legal rules for determining control and administering restrictions are a complex mix of federal and state laws, regulations, and local practices, which vary widely across the country.21,22 The standards also change over time; updated information is available from local state authorities and on good informational sites, such as those of the Epilepsy Foundation.
The key standard for determining accident risks is the seizure free interval, which is the duration of time a person with epilepsy has been seizure-free.21-23 In the U.S., the accepted period for seizure freedom varies from about 3 months to 12 months, depending on individual state rules.24
California, Delaware, Nevada, New Jersey, Oregon, and Pennsylvania require mandatory reporting. Generally physician groups in the U.S. and elsewhere oppose such mandatory reporting, because of the concern that their patients will not report their seizures, and thus may not receive appropriate treatment. Indeed, patients with epilepsy often do not tell physicians about their seizures, fearing loss of driving privileges and other social consequences.21,23 Providers should make an effort to determine seizure frequency and whether the patient is being truthful. This information then provides a background for the provider to discuss driving issues.
Injury
People with epilepsy are susceptible to injury during a seizure and need to be counseled regarding safety, particularly when seizures are not well controlled. Hazardous situations include being near stoves or cooking, bathing alone, swimming alone, working at heights without a safety harness, and using power tools.26
Sudden Unexplained Death
Patients with recurrent seizures have an increased risk for accidental fatality and for sudden unexplained death in epilepsy (SUDEP), which accounts for up to 17% of all deaths in people with epilepsy. The risk for sudden death from recurrent seizures increases 2.3 times compared with the risk in the general population.25 A SUDEP is an unexpected death in a person who has epilepsy with no other obvious cause of death.26 Because increased seizure frequency, the presence of tonic-clonic seizures, and other accidental risks of seizures are associated with SUDEP, the subject should be discussed with patients and their families, to encourage adherence to treatment. Epileptologists also discuss these risks with patients and their families when surgical interventions are being considered. The potential risks for injury or SUDEP may offset the surgical risks when pursuing a potentially curative epilepsy procedure.
Women of Childbearing Age
In January 2015, the ECoE started a women veterans epilepsy workgroup with the goal of improving clinical care within the VAHCS to provide education to patients, family members, and VA health care providers about the care of women with epilepsy.
Providers need to be aware that seizure medications that induce certain hepatic enzymes can lead to hormonal contraceptive failure (Table 2).27 Preconception folic acid supplementation (with at least 0.4 mg) should be considered, because it may reduce the risk of major congenital malformations.28 The goal of epilepsy management prior to conception is to maximize seizure control with the optimal seizure medication to avoid the need to make changes during the pregnancy.
During pregnancy, the volume of distribution increases and seizure medication metabolism may change requiring dose adjustment. The best predictor of seizure frequency during pregnancy is a woman’s epilepsy pattern prior to conception. Seizure freedom for 9 months prior to conception is associated with a 84% to 92% likelihood of seizure freedom throughout the pregnancy.29
International seizure medication pregnancy registries have provided valuable information regarding the risk of major congenital malformation (MCM) of development, which seems to be a consequence of seizure medication therapy and not epilepsy itself. The risk of MCM associated with seizure medication therapy is about 4% to 5% compared with 1.5% to 3% in the general population.30,31 A seizure medication table that supplements the existing VA ECoE information specifically addresses women’s issues with the recognition that recent revisions to the teratogenicity classification have been made by the FDA (Table 2).32 If possible, valproate should be avoided during pregnancy due to its higher rate of MCM and impact on neurocognitive function.33 Obstetrical input is essential in arranging routine prenatal fetal testing. Although women with epilepsy do not have a substantially increased risk of undergoing a cesarean section, delivery in a hospital obstetric unit is advised.
Postpartum women veterans with epilepsy should be encouraged to breast feed since the potential benefits seem to outweigh any established risk of seizure medication exposure to the infant. No relative impact on cognition was found in breastfed infants exposed to a variety of seizure medications.34 Following delivery, vigilance is needed to monitor for sleep deprivation, postpartum depression, and the safe care of the infant.35 Care of women with epilepsy does not end with pregnancy planning, additional important topics include psychiatric comorbidities, catamenial epilepsy, and bone health, which are unique to women veterans with epilepsy.
Identifying Psychiatric Conditions
People with epilepsy have a number of psychiatric comorbidities. Suicide and suicide attempts are 6 to 25 times more common in patients with temporal lobe epilepsy compared with those in the general population.36-38 Although the FDA identified all seizure medications as potential contributors to suicide risk, a recent longitudinal study of suicidal ideation and attempt found that those who received seizure medications were more likely to have suicidal ideation and attempt than those who did not received seizure medications, suggesting that medication may relate to baseline depression or suicidal ideation.39 When seeing patients with epilepsy, screening for suicidal ideation is good practice.
Depression and anxiety disorders are the most common psychiatric comorbidities in people with epilepsy.40,41 About half of people with epilepsy have symptoms of depression, and 40% have anxiety.42 Depression often precedes the diagnosis of epilepsy, and anxiety often is present and related to the fear of having seizures and of social embarrassment.43 People with epilepsy may not self-report these symptoms if not asked directly. Identification of comorbid depression and anxiety should lead to appropriate treatment. The CB-ip being used for PNES also is being used for treatment of epilepsy and its comorbidities.44
Mild traumatic brain injury (mTBI) has a small increased risk of epilepsy.45 Veterans with mTBI that occurs in the context of blasts are set up for the development of PTSD. These veterans may have other mild cognitive symptoms that can be confused with seizures. Furthermore, mTBI and PNES often occur together, more so than do mTBI and epileptic seizures.14 Video-EEG monitoring may be warranted for these patients.
Education and Self-Management
The IOM report on epilepsy identified patient and family education as essential for better epilepsy care.6 Providers should help educate patients about their epilepsy and refer them to resources available online (Table 3). A continuing exchange about their condition and treatment with seizure medications should occur with each visit. People with epilepsy should also receive guidance regarding how to manage their epilepsy and day-to-day issues. Referring, patients to social workers, psychologists, vocational rehabilitation services, and support groups can enhance a patient’s QOL.3,6 The stigma of epilepsy is another burden that can be diminished by attending support groups. Recently, being a part of an online patient community of veterans was found to improve self-management.46
Conclusion
People with epilepsy have many issues that are unique to the condition and, in part, are related to the unpredictable occurrence of seizures and loss of function. Ideally, seizure control provides a normal lifestyle; however, some mood and anxiety comorbidities may persist despite seizure control. Care in the VA system includes access to 16 sites that have programs dedicated to treating veterans with epilepsy and many more consortium sites that interact with the ECoE to provide high-quality patient care (http:\\www.epilepsy.va.gov). The ECoE also provides a readily available resource to optimally manage veterans with epilepsy. Attention to the issues addressed in this article will promote quality care for veterans with epilepsy.
1. Rehman R, Kelly P, Husain AM, Tran TT. Characteristics of veterans diagnosed with seizures within Veterans Health Administration. J Rehabil Res Dev. 2015;52(7):751-762.
2. National Committee for Quality Assurance (NCQA). The essential guide to health care quality. https://www.ncqa.org/Portals/0/Publications/Resource%20Library/NCQA_Primer_web.pdf. Accessed August 9, 2016.
3. Pugh MJ, Berlowitz DR, Montouris GB, et al. What constitutes high quality of care for adults with epilepsy? Neurology. 2007;69(21):2020-2027.
4. Fountain NB, Van Ness PC, Swain-Eng R, Tonn S, Bever CT Jr; American Academy of Neurology Epilepsy Measure Development Panel and the American Medical Association-Convened Physician Consortium for Performance Improvement Independent Measure Development Process. Quality improvement in neurology: AAN epilepsy quality measures: report of the Quality Measurement and Reporting Subcommittee of the American Academy of Neurology. Neurology. 2011;76(1):94-99.
5. Fountain NB, Van Ness PC, Bennett A, et al. Quality improvement in neurology: epilepsy update quality measurement set. Neurology. 2015;84(14):1483-1487.
6. England MJ, Liverman CT, Schultz AM, Strawbridge LM, eds; Committee on the Public Health Dimensions of the Epilepsies, Board on Health Sciences Policy, Institute of Medicine. Epilepsy Across the Spectrum: Promoting Health and Understanding. Washington, DC: The National Academies Press; 2012.
7. Tortorice K, Rutecki P. Principles of Treatment. In: Hussain, AM, Tran TT, eds. Department of Veterans Affairs Epilepsy Manual. San Francisco, CA: Epilepsy Centers of Excellence, Department of Veteran Affairs; 2014:120-127.
8. Kwan P, Brodie MJ. Early Identification of refractory epilepsy. N Engl J Med. 2000;342(5):314-319.
9. Mattson RH, Cramer JA, Collins JF, et al. Comparison of carbamazepine, phenobarbital, phenytoin, and primidone in partial and secondarily generalized tonic-clonic seizures. N Eng J Med. 1985;313(3):145-151.
10. Mattson RH, Cramer JA, Collins JF. A comparison of valproate with carbamazepine for the treatment of complex partial seizures and secondarily generalized tonic-clonic seizures in adults. The Department of Veterans Affairs Epilepsy Cooperative Study No. 264 Group. N Eng J Med. 1992;327(11):765-771.
11. Rowan AJ, Ramsay RE, Collins JF, et al; VA Cooperative Study 428 Group. New onset geriatric epilepsy: a randomized study of gabapentin, lamotrigine, and carbamazepine. Neurology. 2005;64(11):1868-1873.
12. Salinsky M, Spencer D, Boudreau E, Ferguson F. Psychogenic nonepileptic seizures in US veterans. Neurology. 2011;77(10):945-950.
13. Salinsky M, Evrard C, Storzbach D, Pugh MJ. Psychiatric comorbidity in veterans with psychogenic seizures. Epilepsy Behav. 2012;25(3):345-349.
14. Salinsky M, Storzbach D, Goy E, Evrard C. Traumatic brain injury and psychogenic seizures in veterans. J Head Trauma Rehabil. 2015;30(1):E65-E70.
15. LaFrance WC Jr, Baird GL, Barry JJ, et al; NES Treatment Trial (NEST-T) Consortium. Multicenter pilot treatment trial for psychogenic nonepileptic seizures: a randomized clinical trial. JAMA Psychiatry. 2014;71(9):997-1005.
16. Wiebe S, Blume WT, Girvin JP, Eliasziw M; Effectiveness and Efficiency of Surgery for Temporal Lobe Epilepsy Study Group. A randomized, control trial for temporal-lobe epilepsy. N Engl J Med. 2001;345(5):311-318.
17. Engel J Jr, Wiebe S, French J, et al. Practice parameter: temporal lobe and localized neocortical resections for epilepsy. Epilepsia. 2003;44(6):741-751.
18. Morris GL III, Gloss D, Buchhalter J, Mack KJ, Nickels K, Harden C. Evidence-based guideline update: vagus nerve stimulation for the treatment of epilepsy. report of the Guideline Development Subcommittee of the American Academy of Neurology. Neurology. 2013;81(16):1453-1459.
19. Morrell M; RNS System in Epilepsy Study Group. Responsive cortical stimulation for the treatment of medically intractable partial epilepsy. Neurology. 2011;77(13):1295-1304.
20. Gilliam F, Kuzniecky R, Faught E, Black L, Carpenter G, Schrodt R. Patient-validated content of epilepsy-specific quality-of-life measurement. Epilepsia. 1997;38(2):233-236.
21. Krumholz A. Driving issues in epilepsy: past, present, and future. Epilepsy Curr. 2009;9(2):31-35.
22. Krauss GL, Ampaw L, Krumholz A. Individual state driving restrictions for people with epilepsy in the US. Neurology. 2001;57(10):1780-1785.
23. Krauss GL, Krumholz A, Carter RC, Kaplan P. Risk factors for seizure-related motor vehicle crashes in patients with epilepsy. Neurology. 1999;52(7):1324-1329.
24. Consensus statements, sample statutory provisions, and model regulations regarding driver licensing and epilepsy. American Academy of Neurology. American Epilepsy Society, Epilepsy Foundation of America. Epilepsia. 1994:35(3):696-705.
25. Cavazos, JE. SUDEP and Other Risks of Seizures. In: Husain AM, Tran, TT, eds. VA Epilepsy Manual. San Francisco, CA: Epilepsy Centers of Excellence, Department of Veteran Affairs; 2014:206-209.
26. Tolstykh GP, Cavazos JE. Potential mechanisms of sudden unexpected death in epilepsy. Epilepsy Behav. 2013;26(3):410-414.
27. Gaffield ME, Culwell KR, Lee CR. The use of hormonal contraception among women taking anticonvulsant therapy. Contraception. 2011;83(1):16-29.
28. Harden CL, Pennell PB, Koppel BS, et al; American Academy of Neurology; American Epilepsy Society. Practice parameter update: management issues for women with epilepsy—focus on pregnancy (an evidence-based review): vitamin K, folic acid, blood levels, and breast-feeding: report of the Quality Standards Subcommittee and Therapeutics and Technology Assessment Subcommittee of the American Academy of Neurology and the American Epilepsy Society. Neurology. 2009;73(2):142-149.
29. Harden CL, Hopp J, Ting TY, et al; American Academy of Neurology; American Epilepsy Society. Management issues for women with epilepsy-focus on pregnancy (an evidence-based review): 1. Obstetrical complications and change in seizure frequency: report of the Quality Standards Subcommittee and Therapeutics and Technology Assessment Subcommittee of the American Academy of Neurology and the American Epilepsy Society. Epilepsia. 2009;50(5):1229-1236.
30. Artama M, Auvinen A, Raudaskoski T, Isojärvi I, Isojärvi J. Antiepileptic drug use of women with epilepsy and congenital malformations in offspring. Neurology. 2005;64(11):1874-1878.
31. Morrow J, Russell A, Guthrie E, et al. Malformation risks of antiepileptic drugs in pregnancy: a prospective study from the UK Epilepsy and Pregnancy Register. J Neurol Neurosurg Psychiatry. 2006;77(2):193-198.
32. U.S. Food and Drug Administration. Pregnancy and lactation labeling (drugs) final rule. http://www.fda.gov/Drugs/DevelopmentApprovalProcess/DevelopmentResources/Labeling/ucm093307.htm. Published December 3, 2014. Accessed June 27, 2016.
33. Meador KJ, Baker GA, Browning N, et al; NEAD Study Group. Cognitive function at 3 years of age after fetal exposure to antiepileptic drugs. N Engl J Med. 2009;360(16):1597-1605.
34. Meador KH, Baker GA, Browning N, et al; NEAD Study Group. Effects of breastfeeding in children of women taking antiepileptic drugs. Neurology. 2010;75(22):1954-1960.
35. Klein A. The postpartum period in women with epilepsy. Neurol Clin. 2012;30(3):867-875.
36. Harris EC, Barraclough B. Suicide as an outcome for mental disorders. A meta-analysis. Br J Psychiatry. 1997;170:205-228.
37. Jones JE, Hermann BP, Barry JJ, Gilliam FG, Kanner AM, Meador KJ. Rates and risk factors for suicide, suicidal ideation, and suicide attempts in chronic epilepsy. Epilepsy Behav. 2013;4(suppl 3):S31-S38.
38. Christensen J, Vestergaard M, Mortensen PB, Sidenius P, Agerbo E. Epilepsy and risk of suicide: a population-based case-control study. Lancet Neurol. 2007;6(8):693-698.
39. Pugh MJ, Hesdorffer D, Wang CP, et al. Temporal trends in new exposure to antiepileptic drug monotherapy and suicide-related behavior. Neurology. 2013;81(22):1900-1906.
40. Barry JJ, Ettinger AB, Friel P, et al; Advisory Group of the Epilepsy Foundation as part of its Mood Disorder. Consensus statement: the evaluation and treatment of people with epilepsy and affective disorders. Epilepsy Behav. 2008;13(suppl 1):S1-S29.
41. Ottman R, Lipton RB, Ettinger AB, et al. Comorbidities of epilepsy: results from the Epilepsy Comorbidities and Health (EPIC) survey. Epilepsia. 2011;52(2):308-315.
42. Kanner AM. Depression in epilepsy: prevalence, clinical semiology, pathogenic mechanism, and treatment. Biol Psychiatry. 2003;54(3):388-398.
43. Kanner AM. The treatment of depressive disorders in epilepsy: what all neurologists should know. Epilepsia. 2013;54(suppl 1):3-12.
44. Reiter JM, Andrews DJ. A neurobehavioral approach for treatment of complex partial epilepsy: efficacy. Seizure. 2000;9(3):198-203.
45. Pugh MJ, Orman JA, Jaramillo CA, et al. The prevalence of epilepsy and association with traumatic brain Injury in Veterans of the Afghanistan and Iraq Wars. J Head Trauma Rehabil. 2015;30(1):29-37.
46. Hixson JD, Barnes D, Parko K, et al. Patients optimizing epilepsy management via an online community: the POEM Study. Neurology. 2015;85(2):129-136.
47. Winterfeld U, Merlob P, Baud D, et al. Pregnancy outcome following maternal exposure to pregabalin may call for concern. Neurology. 2016;86(24):2251-2257.
Moonshot Takes Center Stage
Signs of progress around the Cancer Moonshot were already apparent at the AVAHO annual meeting, held in Dallas, Texas last week. According to Deborah K. Mayer, PhD, RN, AOCN FAAN, Director of Cancer Survivorship and professor in the University of North Carolina School of Nursing and a member of the Cancer Moonshot Blue Ribbon Panel, the overarching goal was to “bring about a decade’s worth of advances in 5 years, making more therapies available to more patients, while also improving the ability to prevent cancer and detect it at an early stage,” accordint to Dr. Mayer. The effort was as much an effort to jump start efforts to increase access to high-quality care and to energize new research
Related: Innovation and Cancer Moonshot Highlight AVAHO Conference
In June 2016, nearly 400 cancer researchers, oncologists, nurses, patients, advocates and others met, and > 7,000 more came together at hospitals, community care centers, businesses, and in family rooms at more than 170 local summits in all 50 states, Puerto Rico, Guam, and Washington, D.C. Coming out of the meeting, the Blue Ribbon Panel articulated 5 strategic goals for the Moonshot: to catalyze new scientific breakthroughs, unleash the power of data, accelerate bringing new therapies to patients, strengthen prevention and diagnosis, and improve patient access and care.
Michael J Kelley, MD, VHA’s National Program Director for Oncology has represented the VA in Moonshot. Dr. Kelley provided an overview of the VA programs that are being accelerated by the Moonshot initiative and highlighted the specifics of how the Moonshot impacts cancer care at the VA.
Related: VA/DoD to Help Lead New Cancer Initiative
One of the programs emerging out of the Moonshot is the development of virtual cancer centers. Importantly, the virtual cancer center aims to serve veteran patients in VA facilities, as well as those who access care through the Veterans Choice Program, and reduce disparities in care based on the location of that care by spreading the medical home/patient aligned care team model. The VA hopes to be able to meet those goals through the expansion and standardization of clinical care pathways for cancer diagnosis and treatment and the use of multidisciplinary tumor boards for all veterans regardless of the patient’s geographic location.
Although the VA Precision Oncology Program (POP) predates the Moonshot, it is now receiving more support and is expected to roll out nationwide in 2016. The primary goal of POP is to better match patients to treatments using genetic testing for more accurate understanding of patient’s cancer and appropriate treatment options that fit with their genetic profile. The program utilizes national testing to decrease cost and increase uniformity, provides for molecular oncology consultation services for better test result interpretation, and improved access to drugs, including off-label and investigational treatments.
Related: White House Budget Invests in Cancer, VA Hiring, and TRICARE
One of the most interesting initiatives to emerge out of the Moonshot is the Applied Proteogenomics Organizational Learning and Outcomes (APOLLO) Consortium, which combines VA, DoD, and the National Cancer Institute (NCI). Together the 3 agencies are leveraging advanced research methods in proteogenomics to “more rapidly identify unique targets and pathways of cancer for detection and intervention.” According to Kelley, APOLLO will be focused on lung cancer initially, but the program is expected to expand rapidly. Data culled from the VA Million Veteran Program, POP, the Murtha Cancer Center at Walter Reed, and elsewhere will be analyzed to help push patients into appropriate clinical trials. The ultimate goal is to generate better data on prognosis and response for patients with specific genetic profiles.
One of the challenges that VA has is getting patients into clinical trials. Currently many facilities participate in only 1 clinical, and the mean number of trials per facility was only 3.4 trials per facility. To help improve access to clinical trials and the enrollment of patients in trials, the use of a VA centralized institutional review board is being expanded.
Building Better Models for Innovation in Health Care
Geoffrey S.F. Ling, MD, PhD, former director of the Biological Technologies Office at the Defense Advanced Research Projects Agency (DARPA), delivered a keynote address at the Association of VA Hematology and Oncology (AVAHO) 12th annual meeting on the theme of bringing better models for innovation to health care. According to Ling, DARPA was able to rapidly develop advanced prosthetics from concept through FDA approval to manufacturing within 8 years. The prosthetics provide greater control and can be neurologically controlled. “When you open a door, amazing things happen,” he argued.
Related:Microprocessor Knee and Power Foot Combination in a Transfemoral Amputee
The key, according to Dr. Ling is that funders need to learn how to say yes, adequately resource innovators, provide milestones and time lines, fail early and fast, closely manage projects, and identify and transition to commercialization partners.
In a wide ranging presentation, Ling discussed many of the challenges posed by the Wars in Iraq and Afghanistan and how DARPA responded to emerging health care delivery needs. You can create the greatest impact beginning by solving a specific problem, “solutions are most efficient and quickly achieved through milestone driven research,” he argued. DARPA was responsible for setting in motion a broad array of innovations from GPS and night optical vision to portable ultrasounds and the self-driving car.
Dr. Ling is currently the COO and founder of On Demand Pharmacy, a company that is developing a machine for manufacturing on-demand small batches of small-molecule (generic) pharmaceuticals.
Related: Advances in Prosthetics Restore High Levels of Physical Activity
Federal Practitioner sat down with Dr. Ling to discuss the implications of using the DARPA model of fostering innovation for the cancer moonshot and the potential impact of on-demand pharmacy in the military and globally.
IHS Joins Forces With Cancer Center
IHS is partnering with the renowned Roswell Park Cancer Institute to reduce cancer’s impact on American Indian and Alaska Native communities.
Related: IHS Pilots Improved Version of Health Records
Roswell Park, founded in 1898, is one of the first cancer centers in the U.S. to be named a National Cancer Institute-designated comprehensive cancer center. It will collaborate with IHS in research addressing health disparities; cancer risk reduction, prevention, and early detection; cancer-related medical care; community outreach and training, and expanded career and education opportunities in oncology for Native Americans.
IHS will use its resources and expertise to facilitate “relationships of trust” among Roswell Park and the members and leaders of native communities. Those relationships will allow them to ascertain needs and address disparities that are unique or prevalent in native communities, IHS says.
Related: IHS and CMS Partner for Patient Safety Improvements
Rodney Haring, PhD, MSW, assistant professor of oncology in the Office of Cancer Health Disparities Research at Roswell Park, member of the Seneca Nation, and a delegate to the American Indian and Alaska Native Health Research Advisory Council in HHS, says, “The values and traditions of Native American culture will inform and enhance our efforts to reduce the devastating burden of cancer, not only in Native communities but for everyone.”
IHS Awards Funding for Health Care Self-Governance
Native American tribes have the right to assume responsibility for providing health care to their members and to operate and manage health care programs or services previously provided by IHS, subject to certain requirements. As part of an annual IHS cooperative agreement to support this, IHS has awarded $767,000 to 7 tribes and tribal organizations for self-governance planning and negotiation activities.
The Planning Cooperative Agreement funding will go to Salt River Pima-Maricopa Indian Community, Arizona; Ak-Chin Indian Community, Arizona; White Earth Band of Chippewa Indians, Minnesota; Northwest Portland Area Indian Health Board, Oregon; Pinoleville Pomo Nation, California; and Lake County Tribal Health Consortium, Inc, California. The money will be used for legal and budgetary research and internal tribal government planning related to the administration of health care programs.
The Negotiation Cooperative Agreement funding goes to the Ponca Tribe of Indians of Oklahoma. That money helps defray costs related to preparing for the self-governance program negotiations. Negotiations provide an opportunity for the tribal and federal negotiation teams to work together in good faith to enhance each self-governance agreement, IHS says.
More than one-third (about $1.8 billion) of the total annual IHS funding for American Indian and Alaska Native health is now transferred directly to tribes to operate and manage health programs or services. Of the 567 federally recognized tribes, 354 participate and have negotiated 90 compacts and 115 funding agreements.
The partnership between IHS and self-governance tribes, says IHS Principal Deputy Director Mary Smith, is a “shining example of cooperation in providing access to quality health care.”
How anti-CD44 antibodies fight AML
Image by Lance Liotta
New research appears to explain how antibodies that target CD44 fight acute myeloid leukemia (AML).
Previous research showed that anti-CD44 antibodies inhibit proliferation and induce differentiation in AML, but it wasn’t clear how or why this happens.
The new study suggests anti-CD44 antibodies work by inhibiting 2 “major players” of the PI3K/Akt/mTOR pathway—mTORC1 and mTORC2.
Jasmeen Merzaban, PhD, of King Abdullah University of Science and Technology in Thuwal, Saudi Arabia, and her colleagues described this discovery in a letter to Leukemia.
The researchers tested an anti-CD44 antibody known as A3D8 in cell lines representing different AML subtypes (HL60, THP-1, and KG1a) as well as a mouse model of AML.
In these experiments, A3D8 inhibited proliferation and induced differentiation in AML cells. This was accompanied by a decrease in phosphorylation of the mTORC1 and mTORC2 complexes, which was strongly correlated with inhibition of the PI3K/Akt pathway.
The researchers said this finding is important because a complete shutdown of mTOR signaling is probably needed to disrupt the multiple feedback loops that can fuel AML growth, and drugs that only inhibit one of these complexes have, in the past, failed to demonstrate a therapeutic benefit for patients with AML.
“A growing body of evidence suggests that a broader inhibitor would result in a more potent therapeutic effect,” Dr Merzaban said.
She and her colleagues believe an anti-CD44 antibody like A3D8 might just be that type of inhibitor.
They also noted that A3D8 was able to induce differentiation in different subtypes of AML and did not seem to present any toxicity issues.
“We show that the anti-CD44 antibody used for our studies had no effect on normal blood cells,” said Samah Gadhoum, PhD, a research scientist in Dr Merzaban’s lab.
“However, more work is needed to carefully determine the effect of these antibodies on other cells and other cellular functions within the body.”
The researchers are now conducting follow-up experiments, but they believe their results support the use of anti-CD44 antibodies to treat different types of AML. ![]()
Patients may have high expectations of phase 1 trials

Photo courtesy of NCI Clinical
Center/Mathews Media Group
Expectations may not correspond to reality for cancer patients considering enrollment in phase 1 trials, according to a study published in Cancer.
The study showed that, even after consulting with clinicians, nearly half of patients expected their tumors would shrink during the trial, and some patients expected to be cured.
In reality, the typical response rates of phase 1 cancer trials range from 4% to 20%, and patients survive for a median of 6 months.
Udai Banerji, MD, PhD, of The Institute of Cancer Research in London, England, and his colleagues conducted this study.
The team explored patients’ motivations for considering participation in phase 1 trials and assessed their expectations both before and after they consulted with clinicians.
The study included 396 patients who were considering enrollment in a phase 1 trial. All of these patients completed questionnaires prior to a consultation with a clinician, and 301 completed an abbreviated follow-up questionnaire after their consultation.
A majority of the patients said they were willing to enroll in a trial—72% pre-consultation and 84% after.
Before their consultation, 84% of patients ranked the possibility of tumor shrinkage as the most important reason for considering a phase 1 trial.
Fifty-six percent of patients said the most important reason was a lack of alternative treatments, 44% said it was their physician’s recommendation, and 38% said it was the possibility that the research might benefit others. (Patients could give the same rank to multiple reasons.)
Before their consultation, 43% of patients predicted their tumors would shrink if they participated in a trial. After the consultation, this increased to 47%, and 14% of patients thought they would be cured by participating in the trial. (Patients were not asked about the possibility of cure in the pre-consultation questionnaire.)
Before their consultation, 71% of patients said they expected moderate side effects related to the treatment being tested. This increased to 77% after the consultation. Only 11% of patients expected severe side effects pre-consultation, a figure that decreased to 7% after consultation.
Before consultation, about half of patients did not expect that weekly hospital visits would be required for participation in the trial. After the consultation, 93% of patients expected weekly visits.
“There is a positive message in this [study], which is that 84% of patients are willing to participate in phase 1 oncology studies after a discussion with clinical and nursing staff who lay out the conservative estimates of benefit and requirements of hospital visits,” Dr Banerji said.
“This is good for current and future patients and cancer medicine in general. [However,] the high percentage of patients expecting their tumors to shrink was a sobering finding. This creates a challenge for healthcare professionals to manage expectations but to do so without being patronizing or dismissing human hope.” ![]()
BET inhibitors could improve production of iPSCs

Image from Salk Institute
A study published in Cell Reports indicates that BET inhibitors can improve the reprogramming of human fibroblasts to create induced pluripotent stem cells (iPSCs).
According to researchers, this improvement in reprogramming can increase the yield of iPSCs from fibroblasts and enhance the quality of the iPSCs by ensuring that more somatic genes are efficiently turned down or turned off during reprogramming.
Study author Kejin Hu, PhD, of the University of Alabama at Birmingham, said the factors that are commonly used to create iPSCs from fibroblasts face a reprogramming barrier.
“If we can lower the barrier, we can enhance the reprogramming efficiency,” he explained. “My strategy is to use chemicals to erase the transcriptional program specific to the starting cells.”
Dr Hu and his colleagues found that BET-specific chemical inhibitors were effective in this regard.
For example, a low concentration of the BET inhibitor JQ1:
- Downregulated 390 fibroblast-specific genes when applied to naïve human fibroblasts
- Downregulated 651 fibroblast-specific genes when applied to human fibroblasts during reprogramming
- Increased the efficiency of successful reprogramming of human fibroblasts to iPSCs by 20-fold.
The researchers also found that fibroblasts change shape when treated with JQ1.
The cells transform from a long spindle shape to polygonal or rounded cells, which shows loss of fibroblast identity and transition to pluripotent stem cells. Presumably, genes that are needed to maintain the spindle shape are downregulated by JQ1.
Dr Hu proposed the following model to explain his team’s findings.
During normal cell division, active fibroblast genes are “bookmarked” by the attachment of BET proteins to acetylated chromatin during the mitotic phases, while RNA Polymerase II drops off of the chromatin.
At the start of interphase, these bookmarks guide the polymerase back to the genes, and they are transcribed by RNA Polymerase II.
In contrast, when JQ1 is added, the active fibroblast genes are de-bookmarked by the interaction of JQ1 with the BET proteins during the mitotic phases of cell division.
This “erases” the epigenetic memory of fibroblast gene expression, which, in turn, results in loss of fibroblast gene transcription when interphase returns.
This also increases the success of reprogramming into iPSCs. ![]()
National ALS Biorepository Opens
The prevalence of amyotrophic lateral sclerosis (ALS) seems to have gone up—from 4.7 cases per 100,000 in 2012 to 5.0 cases per 100,000 in 2013. But “seems” is the operative word, according to researchers writing in the August 5, 2016, Morbidity and Mortality Weekly Report. It is more likely that the increase is attributable to better detection methods, remarked Paul Mehta, MD, medical epidemiologist and principal investigator of the National ALS Registry and lead author of the report.
Related: A Combined Treatment Protocol for Patients With Diabetic Peripheral Neuropathy
He also credits greater public awareness of the registry, which is the only available data source that can be used to estimate the prevalence of ALS in the U.S. Because ALS is not a nationally notifiable disease, the registry uses administrative data from Medicare, Medicaid, and the VHA to determine “definite” cases. It also uses a secure web portal (https://wwwn.cdc.gov/als/) to identify cases not included in the national administrative databases.
Related: Amyotrophic Lateral Sclerosis, Nutrition, and Feeding Tube Placement
This fall, the registry will launch the National ALS Biorepository, which will store samples (eg, blood, hair, or saliva) from home visits and postmortem collection (eg, brain, bone, spinal cord). Currently, the few existing ALS biorepositories largely rely on samples from specific clinics or medical practices or clinical trials. The specimens for National ALS Biorepository will be collected from a geographically representative sample of people with ALS. The specimens will be used for research, such as genetic analysis, identification of biomarkers, and exposure to environmental toxic substances.
The full report is available at www.cdc.gov/mmwr/index2016.html.