User login
VIDEO: Watson helps oncologists sleuth out best options in breast cancer
SAN ANTONIO – Every day, practicing oncologists sort through mountains of data from treatment guidelines, clinical trials, protocols, and algorithms to make the best possible therapeutic decisions for their patients.
At Manipal Hospitals in Bangalore, India, those decisions are informed with the aid of Watson for Oncology (WFO), a software platform developed by IBM in concert with clinicians and investigators at Memorial Sloan Kettering Cancer Center in New York City.
In this video interview at the San Antonio Breast Cancer Symposium, S.P. Somashekhar, MBBS, MS, MCH, chairman of the Manipal Comprehensive Cancer Center, discusses how the system is used by the members of the center’s multidisciplinary tumor board to inform decision making. He also describes results of a study he presented at the symposium that shows a relatively high degree of concordance between clinician and WFO choices in the treatment of patients with local breast cancer but less agreement when it comes to the management of metastatic disease, for which there is no universal standard of care.
The video associated with this article is no longer available on this site. Please view all of our videos on the MDedge YouTube channel
AT SABCS 2016

History of complex regional pain syndrome increases risk of secondary CRPS
Secondary complex regional pain syndrome is significantly more likely in people currently experiencing CRPS in an unrelated extremity than in the general population, according to Ellen Satteson, MD, and her associates.
In a study of 93 patients with CRPS, 20.4% developed secondary CRPS in another extremity. Twenty patients in the primary CRPS group experienced a secondary inciting event. Of this group, 75% developed secondary CRPS. CRPS in all four extremities occurred in six patients, of whom five had inciting events for each extremity.
The odds ratio for secondary CRPS in the study group compared to the general population was found to be 1,069.6, while the OR for CRPS after an inciting event compared to the general population was 11.7.
“An odds ratio of over 1,000 when comparing the reported population incidence of CRPS to the rate of secondary CRPS documented in this study strongly suggests that patients with a history of CRPS may be at considerable risk of developing secondary CRPS ... Additional, prospective studies with standardized follow-up to assess for subsequent injuries and secondary CRPS, however, are needed to better elucidate the significance of this risk,” the investigators noted.
Find the study in the Scandinavian Journal of Pain (doi: 10.1016/j.sjpain.2016.10.005).
FROM THE SCANDINAVIAN JOURNAL OF PAIN
More evidence shows ties between early inflammation, schizophrenia risk in adulthood
Increases in inflammatory markers during acute psychosis suggest that higher C-reactive protein levels in adolescence may play an important role in subsequent schizophrenia by age 27, but more study is needed, results from a longitudinal study suggest.
“Inflammatory pathways may offer important new prevention and intervention targets for schizophrenia,” wrote Stephen A. Metcalf of the University of Cambridge (England) and his coauthors, most of whom are based in Finland (Brain Behav Immun. 2017 Jan;59:253-9).
The birth cohort consisted of 99% of the live births in two northern Finland provinces between July 1985 and June 1986. Investigators studied 6,362 individuals within the cohort who had gone on to have their blood sampled at age 15 or 16 years and measured for levels of serum C-reactive protein (CRP).
Increased levels of CRP are associated with antipsychotic-naive first-episode psychosis and acute psychotic relapse. However, “it is difficult to ascertain the direction of association between inflammation and schizophrenia from cross-sectional data. Longitudinal studies of inflammatory markers and subsequent psychotic illness are scarce but are necessary to establish whether the increase in circulating inflammatory markers is a cause or consequence of illness,” wrote Mr. Metcalf and his coauthors.
The investigators searched Finnish hospital records for cases and ICD-10 diagnoses of nonaffective psychosis, including schizophrenia, for the years 1994 to 2012 for CRP-measured members of the birth cohort, spanning ages 8-27 years. With the records collected, they sorted the participants for analysis into the following three groups: schizophrenia (n = 22), nonschizophrenia nonaffective psychosis (n = 66), and no psychosis (n = 6,274).
“The adjusted [odds ratio] for schizophrenia by age 27 years for each standard deviation increase in CRP levels at age 15/16 years was 1.25 (95% confidence interval, 1.07-1.46), which was consistent with a linear, dose-response relationship (P = 0.23),” Mr. Metcalf and his coauthors wrote. Participants with high levels of CRP at baseline (greater than 3 mg/L), compared with low levels (less than 1 mg/L), were more likely to develop schizophrenia (adjusted OR, 4.25; 95% CI, 1.30-13.93).
The investigators adjusted their regression models for age, sex, body mass index, maternal education, smoking, and alcohol use. “To exclude reverse causality (i.e., schizophrenia leading to elevated CRP), we repeated the analyses after removing participants who had developed schizophrenia within one year of CRP assay.”
The findings build on those from a longitudinal study in Denmark on increased risks for schizophrenia associated with higher CRP levels (Schizophr Bull. 2014 Sep;40[5]:1117-27). The authors cautioned that the current findings must be replicated elsewhere.
The authors disclosed several individual funding sources, but none played a role in the study.
FROM BRAIN, BEHAVIOR, AND IMMUNITY
Phase I results move Alzheimer’s candidate drug aducanumab into phase III trials
SAN DIEGO – The antiamyloid antibody aducanumab significantly reduced amyloid brain plaques in Alzheimer’s disease patients who entered a second year of therapy in an open-label extension trial.
Plaque volume declined in a time- and dose-dependent manner, with a bit of movement even among patients who crossed over to the lowest 1-mg/kg dose after a year of taking placebo in the phase Ib PRIME study, Samantha Haeberlein, PhD, reported at the Clinical Trials on Alzheimer’s Disease conference.
The linear declines in plaque burden were dramatic enough to draw a collective gasp of appreciation from the packed auditorium. But the cognitive and functional data of aducanumab (Biogen), while deemed encouraging, were not as striking. The Clinical Dementia Rating Scale-sum of boxes (CDR-SB) and the Mini-Mental State Examination (MMSE) showed dose-dependent slowing of decline, but the drug’s effect approached statistical significance only among those who finished 2 years on 10 mg/kg aducanumab infused every 4 weeks. This group experienced relative stability of MMSE scores, which dropped only about 1 point from baseline, and also showed the greatest decline in amyloid plaque volume.
Biogen deemed this result on the MMSE, which represented a 3.27-point separation from the 1-mg/kg dose group, as “nominally significant,” with a P value noted as “less than .05.”
However, the finding must be viewed with extreme caution, said Dr. Haeberlein, Biogen’s vice president of clinical development. There were only 15 subjects in this group, and the study was not primarily intended to examine cognition.
“I must emphasize once again that these are exploratory data and these sample sizes are very small for these types of assessments,” she said. “Nonetheless, we find them informative.”
MMSE changes in the other dosing groups of 1, 3, and 6 mg/kg were not statistically significant at the end of the study. There were not any significant findings on the CDR-SB measure.
Alzheimer’s Association reaction
Maria C. Carrillo, PhD, chief science officer of the Alzheimer’s Association, was cautiously optimistic.
“For MMSE, the original placebo group continued to decline even when they switched to the 1-mg/kg treatment, and by a significant number of points. The 1- to 3-mg/kg switching group is interesting, as they do get a little bit of a bump. But we also had the 6-mg/kg arm continuing to decline in MMSE and not improve as much as the others, which is strange. It’s aberrant, but the same thing we saw in the first study report. The 10-mg/kg group, though, stays almost at baseline. That’s pretty amazing. Impressive. Again, small numbers but very encouraging.”
Full 12-month results
Biogen presented two aducanumab abstracts at the meeting, both describing its 12-month phase Ib PRIME study and its 12-month, open-label extension study. The drug is a monoclonal human antibody derived from B cells collected from a cohort of cognitively normal elderly subjects and cognitively impaired elderly subjects who exhibited unusually slow decline, according to the company. It binds to fibrillar and oligomeric amyloid aggregates, thus directly reducing amyloid plaque in the brain.
PRIME enrolled 165 patients with prodromal or mild Alzheimer’s disease. Importantly, all of the subjects had brain amyloid proven by PET imaging. PRIME is the first randomized trial of an antiamyloid compound to enroll a pure amyloid-positive cohort. These subjects were randomized to placebo or aducanumab at 1, 3, 6, or 10 mg/kg for 1 year. PRIME’s primary outcomes were safety and tolerability. The cognitive and functional outcomes, not usually assessed in a phase Ib study, were exploratory.
They must also be interpreted in light of the very small numbers, about 30 patients in each dosing group at baseline. In addition, just 69 patients finished the entire 24-month dosing period, leaving only 15-23 patients in each group by the end of the study.
Vissia Viglietta, MD, Biogen’s senior medical director of clinical development, presented the 12-month data. At 52 weeks, all dosing groups, even the 1 mg/kg, saw statistically significant reductions in amyloid plaque, compared with placebo. These changes were dose-dependent; the 10-mg/kg group had the largest reduction, with a P value of less than .001.
There also were dose-dependent changes in the CDR-SB and MMSE, and some of these reached statistical significance.
On the CDR-SB, patients taking placebo declined by an average of 1.89 points. Declines in the 1-, 3-, and 6-mg/kg groups were not significant relative to placebo. However, the 10-mg/kg arm experienced a significant separation from placebo, declining an average of 0.63 points (P less than .05).
The story was similar for the MMSE. Patients taking placebo declined by 2.45 points. The decline was 2.2 points in the 1-mg/kg group; 0.75 in the 3-mg/kg group; and 0.55 in the 10-mg/kg group. The only statistically significant results relative to placebo occurred with the 10-mg/kg group (P less than .05).
The 6-mg/kg group didn’t fit this pattern though, losing an average of 2 points. Biogen has been unable to explain this, but some researchers suggest such an outlying result isn’t surprising, given the small numbers in each group and the exploratory nature of the cognitive analysis.
Amyloid-related imaging abnormalities (ARIA), an inflammatory reaction thought to be related to the removal of amyloid plaque, were the most common adverse event (n = 27). Most of these (22) were in apolipoprotein E4 allele carriers.
Two patients in the placebo arm died, as well as one in the 10-mg/kg arm, but it was not considered related to the study drug. There were no significant changes in hematology, chemistry, urinalysis, electrocardiogram, or vital signs.
Open-label extension results
Dr. Haeberlein focused on the subsequent 12-month, open-label extension trial, which enrolled 117 of the randomized cohort. In this study, patients who had been taking placebo were switched to either 3- or 6-mg/kg aducanumab. Patients who had taken 1 mg/kg were switched to 3 mg/kg. By the end, the remaining patients had taken the antibody for 2 years.
By 24 months, all the dosing groups showed a continued, linear reduction of amyloid plaques. Even those who switched from placebo to 3 mg/kg started to experience plaque reduction, although of a lesser magnitude than with the higher doses.
While still expressing caution, Dr. Haeberlein framed the CDR-SB results as very positive. The placebo and 1-mg/kg switchers continued to progress, but for those who continued on the 3-, 6-, and 10-mg/kg doses, “we saw a saw a numerical slowing of disease progression at both 18 and 24 months.”
However, none of the changes in CDR-SB scores reached statistical significance.
The numbers were somewhat more encouraging in the MMSE analysis. The 3- and 10-mg/kg groups began to separate at 12 months. By 24 months, the 10-mg/kg group had lost about 1 point on the MMSE while there were declines of about 2 points in the 3-mg/kg group and about 3 points in the 1-mg/kg group. Again, the 6-mg/kg group was an outlier, losing about 5 points.
“We already observed that this group behaved differently at 12 months on this endpoint, and we saw that particular cohort continued to follow that trend,” Dr. Haeberlein said.
There were 16 cases of ARIA in the extension trial. Eight were ARIA accompanied by vascular edema (ARIA-E) and these all occurred in the placebo and 1-mg/kg switchers. Three patients discontinued due to ARIA-E.
The remaining eight cases of ARIA were accompanied by microhemorrhage (ARIA-H); these were distributed among all of the dosage groups.
One patient with ARIA-E experienced a seizure and transient loss of pulse. Dr. Haeberlein didn’t elaborate on the possible cause of this event. Two additional patients died, with neither death judged related to the study medication.
The safety data, combined with the reduction of amyloid plaque and hints of cognitive and functional benefit, are enough to continue developing aducanumab, Dr. Haeberlein said. Biogen is recruiting 2,700 subjects with mild cognitive impairment or mild Alzheimer’s for identical phase III studies dubbed ENGAGE and EMERGE.
On Twitter @alz_gal
AT CTAD
Key clinical point:
Major finding: Aducanumab 10 mg/kg was associated with a near-stabilization of the MMSE score over 24 months in 15 patients in an open-label extension of a phase Ib study.
Data source: A 2-year study consisting of a 12-month, randomized, dose-finding, placebo-controlled trial, followed by 12 months of open-label treatment at four different doses.
Disclosures: Dr. Haeberlein and Dr. Viglietta are employees of Biogen, which is developing the molecule.
“Where’s the Music?” Using Music Therapy for Pain Management
Staff at the Malcolm Randall VAMC (MRVAMC) outpatient pain clinic in Gainesville, Florida, found that procedures to reduce a patient’s pain could initially cause pain and anxiety. Typical nursing care plans involved measures to reduce anxiety in patients undergoing interventional procedures expected to produce pain, including identifying and reinforcing coping strategies, providing reassurance and comfort, and giving patients clear explanations slowly and calmly. The MRVAMC nursing staff therefore also advocated to add music therapy to the existing plan.
Background
As part of a quality improvement (QI) project, the authors conducted a literature search to find scientific evidence for the use of music therapy. Multiple medical databases were analyzed to find studies that included total time, dose of sedative medications, pain scores, patient experience, and willingness to repeat the same procedure in the future with use of music vs no music.1 The literature review revealed that music therapy demonstrated effectiveness in decreasing anxiety and pain, supporting relaxation, reducing sedation medication during procedures, and improving patient satisfaction.
As a result of the literature search the authors conducted a prospective, randomized controlled study to investigate music therapy as an adjunct intervention during painful procedures.
Radiofrequency Lesioning
One of the more common (and most painful) procedures performed at MRVAMC is radiofrequency lesioning (RFL).The procedure uses electrical pulses to block nerves for pain relief. Using fluoroscopy, the physician inserts a needle adjacent to the nerve that innervates the facet joint. The sensory and motor nerves are stimulated, causing a tingling or buzzing sensation and tapping. Once the tip of the needle is placed in the correct location, electrical pulses (small radiofrequency currents) are passed through the needle. A lesion is formed that temporarily interrupts the pain messages that the nerve sends to the brain. The procedure can take between30 and 60 minutes, which is longer than most pain clinic procedures.
Radiofrequency lesioning controls pain caused by degenerative disc disease, facet arthropathy, sacroiliac joints, stellate ganglions, and other nerve conditions. Due to the length of the RFL procedure, patients may experience pain and anxiety (as well as other complications, such as vasovagal responses).
The clinic staff anticipated that there would be 20 RFL procedures scheduled per week and selected it as the study procedure for 3 reasons: procedure length, high level of pain, and frequency performed.
After receiving approval from the University of Florida Institutional Review Board and VA Research and Development, the MRVAMC pain clinic initiated the study from September 2013 to April 2014. The purpose of the study was to measure the effects of music on patient’s self-reported anxiety and pain levels before and after nonsedating lumbar RFL.
Methods
Study Design
Veterans aged between 21 and 88 years who were scheduled to return for lumbar RFL and who did not require sedation were invited to participate. Sixty participants consented. The music group had 21 men and 2 women. The no-music group had 19 men and 2 women. Table 1 summarizes descriptive data. Table 2 describes the results of the comparison analysis. Patients were randomly assigned to either the music intervention group or no-music g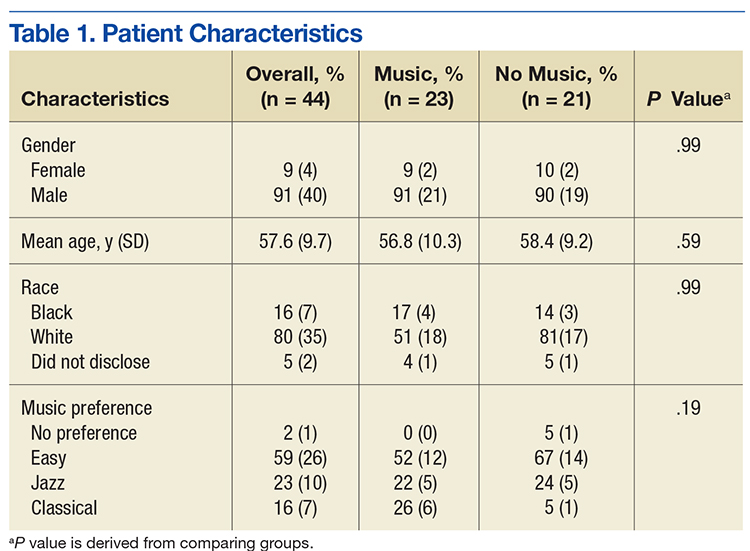
The study tools included the global anxiety VAS (GA-VAS) for pain and anxiety and a yes/no self-reported question, “Did music help?” for participants in the music group. Evaluation of the GA-VAS demonstrated reliability and validity and were patient friendly.2,3 Pain was recorded using a Likert scale of 0 for no pain and 10 for severe pain. Anxiety was recorded using a Likert scale of 0 for no anxiety and 4 for extreme anxiety.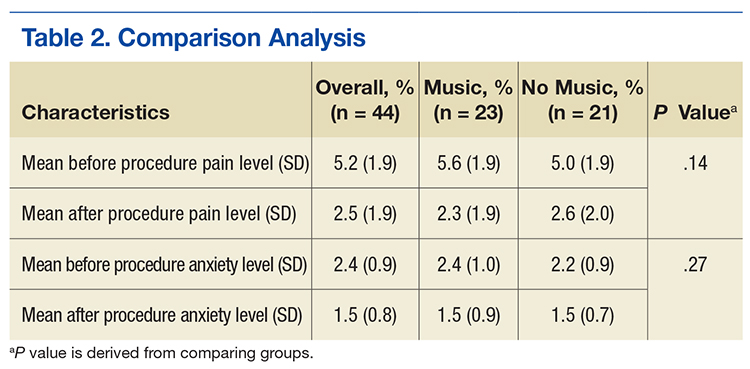
Study subjects were recruited from patients who were on a maintenance lumbar RFL schedule, did not require sedation, and were willing to participate. If sedation was required, the patient was excluded from the study. Returning patients scheduled for RFL were informed about the music study and asked whether they were interested in participating. If they agreed, the study was explained in full, and informed consent was obtained prior to the day of their scheduled procedure. After obtaining informed consent, participants were asked to choose a music genre from 3 options: easy listening, jazz, or classical. Participants received a sealed envelope identifying their group (30 envelopes were created for each group) to be opened by the procedure nurse on the day of the procedure.4,5
Sixty participants consented to participate in the study. Of these 60 patients, 44 were studied. The 16 patients who did not participate had either a change in procedure or did not show for the appointment.
Data Collection
On procedure day, all participants completed the anxiety scale as well as a VAS pain scale (which is the MRVAMC standard of care), preoperatively and postprocedure. Envelopes were opened prior to going into the procedure room to prevent prior knowledge of who was assigned to the music group. Participants in the music intervention group listened to their preselected music on a portable CD player in the procedure room. The music was played softly so the patient could still hear and respond to the physicians instructions during the procedure. The no-music group received everything that the music intervention group received except for music (standard care throughout procedure, which consisted of nurse monitoring, measures to reduce fear and anxiety, and comfort measures). Procedures were performed with local anesthesia; neither group received moderate sedation.
Gender, age, and self-reported pain scores (before and after the lumber RFL procedure) were recorded in the patient’s chart and entered into the study database. Patients in both groups were queried before and after the procedure using the VAS to measure their pain and anxiety levels. Participants in the music intervention group were asked whether they felt that the music helped. They also were asked to provide feedback about their experience. Data were stored in locked filing cabinets, and all forms were de-identified.
Statistical Analysis
SAS version 9.2 (Cary, NC) was used for all analyses. Data were inspected for out-of-range values. The Fisher exact test was used to compare groups on categorical measures. An independent sample t test was used to compare groups on the age variable. Difference scores (formed by subtracting the after score from the before score) were analyzed using paired t tests. Analysis of covariance was used to test for significant group differences on the outcome variables of pain and anxiety with group as the independent variable and the preprocedure measure as the covariate. The level of significance was set at .05, and all testing was 2 sided.
Results
Of the 60 consenting patients, 44 participated in the study.Twenty-three were randomized to the music intervention and 21 to the no-music control group. Both pain and anxiety were significantly reduced (P < .0001) in the total sample (n = 44). The mean (SD) decrease in pain for all participants was 2.80 points (2.31) on a VAS of 0 to 10 and 0.86 points (0.93) decrease in anxiety. In the music intervention group, the mean decrease in pain and anxiety was 3.22 (2.66) and 1.00 (0.85), respectively. In the no-music group, the mean decrease in pain and anxiety was 2.33 (1.80) and 0.69 (1.00), respectively. The magnitude of pain decrease was larger in the music intervention group; however, the difference did not reach statistical significance.
Discussion
Although there was not a statistically significant difference in pain or anxiety reduction due to group assignment, a 2-point reduction in self-reported pain or anxiety may be considered clinically important and has been supported in older studies.6 Importantly, 87% of participants in the music intervention group reported that listening to music was helpful during the procedure (Figure 1).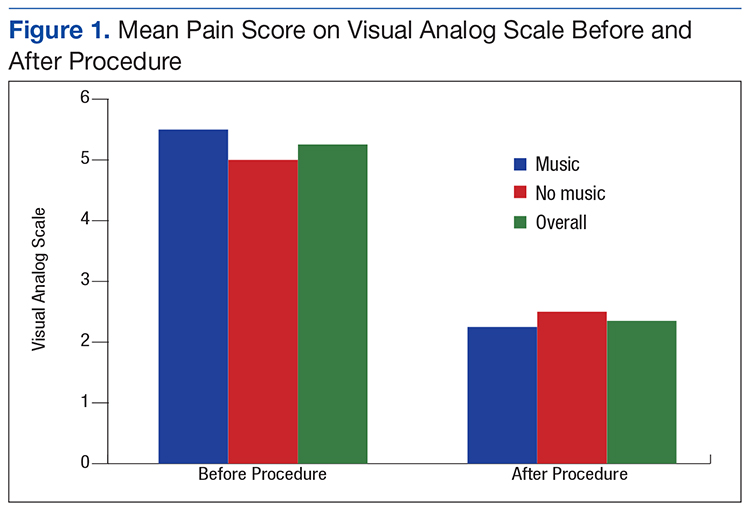
Anxiety levels were not as high as expected when measured before and after the procedure, perhaps due to improvements in patient education and continuity of care (Figure 2). Since all participants were returning patients, they already were familiar with the procedure and the staff. Staff turnover rate is very low at this clinic, which may have contributed to the low anxiety rates among participants at baseline. Other contributing factors included good communication, expert technique, and teamwork.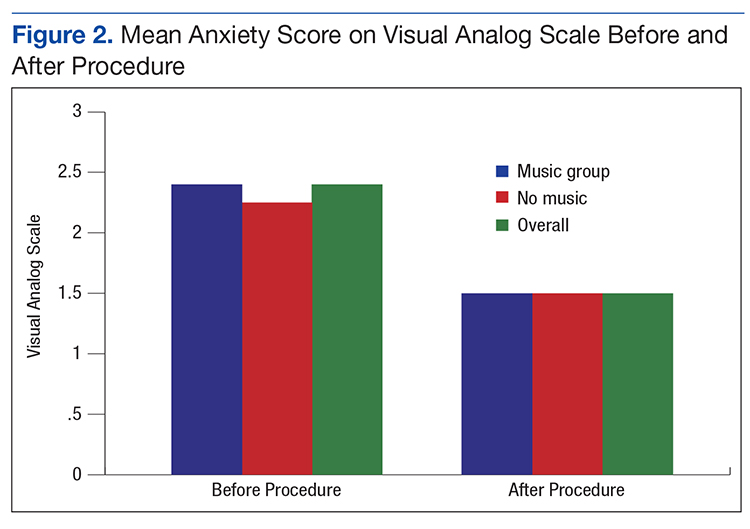
During the study, few negative comments were noted. One participant did not hear the music due to faulty equipment setup. Another participant commented that the physician doing the procedure made negative remarks about the music the patient selected. A third participant commented that the music was too loud, and he was unable to hear the doctor’s instructions, indicating a need for guidelines.
There were many positive comments by participants in the music intervention group. Nurses reported comments such as “The music really helps”; “The music was great, but rock ‘n’ roll would be better”; and “Can I bring my own [music] next time?” Many patients returning for procedures frequently asked, “Where is the music?”
Limitations
Of the 60 consenting patients, only 44 participated, possibly lowering the power of the study to detect significant findings. During the study, the physician staff was reduced, resulting in fewer RFLs performed and causing the study to take longer to conduct and with fewer opportunities to recruit participants.
The CD players used for the study were old, and because earbuds could not be used, volume was difficult to modulate consistently. Earbuds were not used because patient participation was required during the procedure. Also, having only 3 music genres to choose from limited the participant’s choice.
Conclusion
Research supporting the use of music therapy to increase patient comfort is widely accepted and practiced.7 Music therapy is readily available, low risk, inexpensive, and does not require intense training by staff. It may reduce the need for moderate sedation and improve the overall patient experience. During the study, the MRVAMC nursing staff gained a greater appreciation of evidence-based practice; staff are more engaged in QI, based on their personal involvement in research.
Because 87% of the music therapy participants reported that music was helpful, the MRVAMC pain clinic plans to implement music therapy as a standard of care during RFL procedures and all procedure appointments. Music therapy may help reduce pain and anxiety during painful procedures. The goal is to continually increase patient satisfaction and overall procedure experience through integration of evidence-based practice.
Acknowledgments
The authors thank the study team who helped consent participants, perform the experiment, and gather and analyze data. They also acknowledge the pain clinic physicians, Dr. Egle Bavry and Dr. Heidi Goldstein, for their support throughout the study. Special thanks goes to Daniel Prince for his technical support.
1. Bechtold ML, Perez RA, Puli SR, Marshall JB. Effect of music on patients undergoing outpatient colonoscopy. World J Gastroenterol. 2006;12(45):7309-7312.
2. Miller SD, Duncan BL, Brown J, Sparks JA, Claud DA. The outcome rating scale: a preliminary study of the reliability, validity, and feasibility of a brief visual analog measure. J Brief Ther. 2003;2(2):91-100.
3. Williams VS, Morlock RJ, Feltner D. Psychometric evaluation of a visual analog scale for the assessment of anxiety. Health Qual Life Outcomes. 2010;8:57.
4. Dettori J. The random allocation process: two things you need to know. Evid Based Spine Care J. 2010;1(3):7-9.
5. Farrokhyar F, Bajammal S, Kahnamoui K, Bhandari M. Ensuring balanced groups in surgical trials. Can J Surg. 2010;53(6):418-423.
6. Hägg O, Fritzell P, Nordwall A; Swedish Lumbar Spine Study Group. The clinical importance of changes in outcome scores after treatment for chronic low back pain. Eur Spine J. 2003;12(1):12-20.
7. Sonke J. Music and the arts in health: a perspective from the United States. Music Arts Action. 2011;3(2):5-14
Staff at the Malcolm Randall VAMC (MRVAMC) outpatient pain clinic in Gainesville, Florida, found that procedures to reduce a patient’s pain could initially cause pain and anxiety. Typical nursing care plans involved measures to reduce anxiety in patients undergoing interventional procedures expected to produce pain, including identifying and reinforcing coping strategies, providing reassurance and comfort, and giving patients clear explanations slowly and calmly. The MRVAMC nursing staff therefore also advocated to add music therapy to the existing plan.
Background
As part of a quality improvement (QI) project, the authors conducted a literature search to find scientific evidence for the use of music therapy. Multiple medical databases were analyzed to find studies that included total time, dose of sedative medications, pain scores, patient experience, and willingness to repeat the same procedure in the future with use of music vs no music.1 The literature review revealed that music therapy demonstrated effectiveness in decreasing anxiety and pain, supporting relaxation, reducing sedation medication during procedures, and improving patient satisfaction.
As a result of the literature search the authors conducted a prospective, randomized controlled study to investigate music therapy as an adjunct intervention during painful procedures.
Radiofrequency Lesioning
One of the more common (and most painful) procedures performed at MRVAMC is radiofrequency lesioning (RFL).The procedure uses electrical pulses to block nerves for pain relief. Using fluoroscopy, the physician inserts a needle adjacent to the nerve that innervates the facet joint. The sensory and motor nerves are stimulated, causing a tingling or buzzing sensation and tapping. Once the tip of the needle is placed in the correct location, electrical pulses (small radiofrequency currents) are passed through the needle. A lesion is formed that temporarily interrupts the pain messages that the nerve sends to the brain. The procedure can take between30 and 60 minutes, which is longer than most pain clinic procedures.
Radiofrequency lesioning controls pain caused by degenerative disc disease, facet arthropathy, sacroiliac joints, stellate ganglions, and other nerve conditions. Due to the length of the RFL procedure, patients may experience pain and anxiety (as well as other complications, such as vasovagal responses).
The clinic staff anticipated that there would be 20 RFL procedures scheduled per week and selected it as the study procedure for 3 reasons: procedure length, high level of pain, and frequency performed.
After receiving approval from the University of Florida Institutional Review Board and VA Research and Development, the MRVAMC pain clinic initiated the study from September 2013 to April 2014. The purpose of the study was to measure the effects of music on patient’s self-reported anxiety and pain levels before and after nonsedating lumbar RFL.
Methods
Study Design
Veterans aged between 21 and 88 years who were scheduled to return for lumbar RFL and who did not require sedation were invited to participate. Sixty participants consented. The music group had 21 men and 2 women. The no-music group had 19 men and 2 women. Table 1 summarizes descriptive data. Table 2 describes the results of the comparison analysis. Patients were randomly assigned to either the music intervention group or no-music g
The study tools included the global anxiety VAS (GA-VAS) for pain and anxiety and a yes/no self-reported question, “Did music help?” for participants in the music group. Evaluation of the GA-VAS demonstrated reliability and validity and were patient friendly.2,3 Pain was recorded using a Likert scale of 0 for no pain and 10 for severe pain. Anxiety was recorded using a Likert scale of 0 for no anxiety and 4 for extreme anxiety.
Study subjects were recruited from patients who were on a maintenance lumbar RFL schedule, did not require sedation, and were willing to participate. If sedation was required, the patient was excluded from the study. Returning patients scheduled for RFL were informed about the music study and asked whether they were interested in participating. If they agreed, the study was explained in full, and informed consent was obtained prior to the day of their scheduled procedure. After obtaining informed consent, participants were asked to choose a music genre from 3 options: easy listening, jazz, or classical. Participants received a sealed envelope identifying their group (30 envelopes were created for each group) to be opened by the procedure nurse on the day of the procedure.4,5
Sixty participants consented to participate in the study. Of these 60 patients, 44 were studied. The 16 patients who did not participate had either a change in procedure or did not show for the appointment.
Data Collection
On procedure day, all participants completed the anxiety scale as well as a VAS pain scale (which is the MRVAMC standard of care), preoperatively and postprocedure. Envelopes were opened prior to going into the procedure room to prevent prior knowledge of who was assigned to the music group. Participants in the music intervention group listened to their preselected music on a portable CD player in the procedure room. The music was played softly so the patient could still hear and respond to the physicians instructions during the procedure. The no-music group received everything that the music intervention group received except for music (standard care throughout procedure, which consisted of nurse monitoring, measures to reduce fear and anxiety, and comfort measures). Procedures were performed with local anesthesia; neither group received moderate sedation.
Gender, age, and self-reported pain scores (before and after the lumber RFL procedure) were recorded in the patient’s chart and entered into the study database. Patients in both groups were queried before and after the procedure using the VAS to measure their pain and anxiety levels. Participants in the music intervention group were asked whether they felt that the music helped. They also were asked to provide feedback about their experience. Data were stored in locked filing cabinets, and all forms were de-identified.
Statistical Analysis
SAS version 9.2 (Cary, NC) was used for all analyses. Data were inspected for out-of-range values. The Fisher exact test was used to compare groups on categorical measures. An independent sample t test was used to compare groups on the age variable. Difference scores (formed by subtracting the after score from the before score) were analyzed using paired t tests. Analysis of covariance was used to test for significant group differences on the outcome variables of pain and anxiety with group as the independent variable and the preprocedure measure as the covariate. The level of significance was set at .05, and all testing was 2 sided.
Results
Of the 60 consenting patients, 44 participated in the study.Twenty-three were randomized to the music intervention and 21 to the no-music control group. Both pain and anxiety were significantly reduced (P < .0001) in the total sample (n = 44). The mean (SD) decrease in pain for all participants was 2.80 points (2.31) on a VAS of 0 to 10 and 0.86 points (0.93) decrease in anxiety. In the music intervention group, the mean decrease in pain and anxiety was 3.22 (2.66) and 1.00 (0.85), respectively. In the no-music group, the mean decrease in pain and anxiety was 2.33 (1.80) and 0.69 (1.00), respectively. The magnitude of pain decrease was larger in the music intervention group; however, the difference did not reach statistical significance.
Discussion
Although there was not a statistically significant difference in pain or anxiety reduction due to group assignment, a 2-point reduction in self-reported pain or anxiety may be considered clinically important and has been supported in older studies.6 Importantly, 87% of participants in the music intervention group reported that listening to music was helpful during the procedure (Figure 1).
Anxiety levels were not as high as expected when measured before and after the procedure, perhaps due to improvements in patient education and continuity of care (Figure 2). Since all participants were returning patients, they already were familiar with the procedure and the staff. Staff turnover rate is very low at this clinic, which may have contributed to the low anxiety rates among participants at baseline. Other contributing factors included good communication, expert technique, and teamwork.
During the study, few negative comments were noted. One participant did not hear the music due to faulty equipment setup. Another participant commented that the physician doing the procedure made negative remarks about the music the patient selected. A third participant commented that the music was too loud, and he was unable to hear the doctor’s instructions, indicating a need for guidelines.
There were many positive comments by participants in the music intervention group. Nurses reported comments such as “The music really helps”; “The music was great, but rock ‘n’ roll would be better”; and “Can I bring my own [music] next time?” Many patients returning for procedures frequently asked, “Where is the music?”
Limitations
Of the 60 consenting patients, only 44 participated, possibly lowering the power of the study to detect significant findings. During the study, the physician staff was reduced, resulting in fewer RFLs performed and causing the study to take longer to conduct and with fewer opportunities to recruit participants.
The CD players used for the study were old, and because earbuds could not be used, volume was difficult to modulate consistently. Earbuds were not used because patient participation was required during the procedure. Also, having only 3 music genres to choose from limited the participant’s choice.
Conclusion
Research supporting the use of music therapy to increase patient comfort is widely accepted and practiced.7 Music therapy is readily available, low risk, inexpensive, and does not require intense training by staff. It may reduce the need for moderate sedation and improve the overall patient experience. During the study, the MRVAMC nursing staff gained a greater appreciation of evidence-based practice; staff are more engaged in QI, based on their personal involvement in research.
Because 87% of the music therapy participants reported that music was helpful, the MRVAMC pain clinic plans to implement music therapy as a standard of care during RFL procedures and all procedure appointments. Music therapy may help reduce pain and anxiety during painful procedures. The goal is to continually increase patient satisfaction and overall procedure experience through integration of evidence-based practice.
Acknowledgments
The authors thank the study team who helped consent participants, perform the experiment, and gather and analyze data. They also acknowledge the pain clinic physicians, Dr. Egle Bavry and Dr. Heidi Goldstein, for their support throughout the study. Special thanks goes to Daniel Prince for his technical support.
1. Bechtold ML, Perez RA, Puli SR, Marshall JB. Effect of music on patients undergoing outpatient colonoscopy. World J Gastroenterol. 2006;12(45):7309-7312.
2. Miller SD, Duncan BL, Brown J, Sparks JA, Claud DA. The outcome rating scale: a preliminary study of the reliability, validity, and feasibility of a brief visual analog measure. J Brief Ther. 2003;2(2):91-100.
3. Williams VS, Morlock RJ, Feltner D. Psychometric evaluation of a visual analog scale for the assessment of anxiety. Health Qual Life Outcomes. 2010;8:57.
4. Dettori J. The random allocation process: two things you need to know. Evid Based Spine Care J. 2010;1(3):7-9.
5. Farrokhyar F, Bajammal S, Kahnamoui K, Bhandari M. Ensuring balanced groups in surgical trials. Can J Surg. 2010;53(6):418-423.
6. Hägg O, Fritzell P, Nordwall A; Swedish Lumbar Spine Study Group. The clinical importance of changes in outcome scores after treatment for chronic low back pain. Eur Spine J. 2003;12(1):12-20.
7. Sonke J. Music and the arts in health: a perspective from the United States. Music Arts Action. 2011;3(2):5-14
MDS patients with mutated IDH2 benefit from enasidenib

Photo courtesy of ASH
SAN DIEGO—Daily treatment with enasidenib monotherapy in patients with mutated IDH2-positive myelodysplastic syndromes (MDS) induced responses in the majority of patients treated, according to a presentation at the 2016 ASH Annual Meeting.
The study was a portion of a larger phase 1/2 trial of the agent in patients with acute myeloid leukemia (AML) and other hematologic malignancies, so the subset was relatively small, numbering 17 patients.
Nevertheless, enasidenib was well tolerated and induced responses in these predominantly higher-risk patients.
Enasidenib (AG-221/CC-9007) is a selective, oral, potent inhibitor of mutant IDH2 (mIDH2), which produces 2-HG and thus alters DNA methylation and blocks cellular differentiation of hematopoietic progenitor cells.
Approximately 15% of AML patients and 5% of MDS patients have mIDH2. So investigators undertook the study to evaluate the safety and efficacy of enasidenib monotherapy in these diseases.
Eytan Stein, MD, of Memorial Sloan Kettering Cancer Center in New York, New York, presented the analysis of enasidenib in mIDH2-positive MDS patients as abstract 343.*
Study design
MDS patients were allowed to enroll during the dose-escalation and expansion phase of the study, Dr Stein explained.
Patients had to be 18 or older and have an advanced hematologic malignancy with mutated IDH2—relapsed or refractory AML, relapsed or refractory MDS, untreated AML, or other hematologic malignancy with mIDH2.
MDS patients could not be candidates for other therapies, had to be IPSS-R high risk, and had to have relapsed or refractory RAEB-1/RAEB-2 disease.
Investigators also performed co-molecular profiling using next-generation sequencing with a FoundationOne® Heme Panel.
All patients received daily oral enasidenib at 100 mg daily in 28-day cycles.
Patient characteristics
The study accrued a total of 239 patients—176 with relapsed or refractory AML, 37 with untreated AML, 9 with another hematologic malignancy, and 17 with MDS.
The median age of the MDS patients was 67 (range, 45-78), and 71% were male. All had the IDH2 mutation, 88% had R140 mutations, and 12% had R172.
Thirteen patients (76%) had an ECOG performance status of 0-1, and 4 (24%) had a performance status of 2.
A little more than a third (35%) of patients had 2 or more prior anti-cancer regimens.
Two patients (12%) received prior lenalidomide therapy, 8 (47%) received other treatments, including sorafenib (n=2) and vosaroxin, epoetin alfa, pracinostat, cytarabine plus clofarabine, ruxolitinib, and rigosertib (n=1 each). Four patients (24%) were untreated.
“I want to make the point,” Dr Stein said, “that, of those patients, three quarters of them, 76% [n=13], had received a prior hypomethylating agent, really understanding that this is a very poor-risk group of patients that we are studying here.”
About half of patients (47%) had intermediate-2/high IPSS risk status, good MDS cytogenetic risk, and high/very high IPSS-R risk status.
Adverse events
Grade 3-4 treatment-emergent adverse events (AEs) occurring in 2 or more patients were hyperbilirubinemia (n=5), pneumonia (n=4), thrombocytopenia (n=4), anemia (n=3), hypokalemia (n=3), dyspnea (n=2), and tumor lysis syndrome (n=2).
“As I’ve said in a number of meetings where I’ve talked about IDH2 inhibitors, and specifically enasidenib, the hyperbilirubinemia that is seen with this drug is an indirect hyperbilirubinemia,” Dr Stein said.
“A known off-target effect of this drug is inhibition of the UGT1a1 enzyme, which conjugates bilirubin, and this indirect hyperbilirubinemia, which is typically relatively mild [and] does not appear to have any clinical sequelae.”
Investigators considered 9 of the AEs reported for 6 patients to be drug-related.
Four serious enasidenib-related AEs included tumor lysis syndrome (n=2), increased blood bilirubin (n=1), and transaminitis (n=1).
There were no treatment-related deaths.
Response and survival
Ten of 17 patients (59%) achieved an overall response, defined as complete response (CR) plus partial response, plus marrow CR, plus hematologic improvement (HI).
One patient achieved CR, 1 had a partial response, 3 had marrow CR, and 5 had HI.
Dr Stein noted that, of the 13 patients who had received prior hypomethylating agent therapy, 7 (54%) had a response with enasidenib.
Of the patients who attained HI, 2 had trilineage and 2 had bilineage improvement.
The median time to response was 21 days (range, 10-87), and the median number of treatment cycles was 3.0.
Patients remained on study for up to 24 months. Four patients in hematologic remission are still on study, and 3 patients proceeded to stem cell or bone marrow transplant, Dr Stein said.
Two patients discontinued because of investigator decision, and 8 discontinued therapy due to death or disease progression.
The limitation of the study regarding overall survival, Dr Stein said, is that the number is very small.
At a median follow-up of 7.5 months, the median overall survival was not reached.
“So I’m not arguing that this is the end word of this,” he said. “This is going to be dynamic as more patients come on these studies. But I think it’s a nice indication that this treatment appears to be well-tolerated and doing good for a large subset of patients.”
Co-occurring mutations
The investigators also analyzed co-occurring mutations in 13 MDS patients.
The small patient population prevented the investigators from making definitive conclusions regarding potential correlations between response and co-mutations.
Nevertheless, Dr Stein said the analysis revealed something “very, very intriguing.”
He noted that 7 patients had ASXL1 mutations, and “those are typically patients who are bad actors.”
“Five of those 7 patients had a response,” Dr Stein said. “And of those 5, 3 of them had received a prior hypomethylating agent. I think it’s at least food for thought that you can salvage a patient who has failed a hypomethylating agent, with poor risk disease. I think this is very, very exciting.”
Celgene Corporation and its collaborator, Agios Pharmaceuticals, sponsored the trial. ![]()
*Information in the abstract differs from the presentation.
Combo improves ORR, PFS in relapsed/refractory CLL

Image by Mary Ann Thompson
Adding an anti-CD37 molecule to treatment with bendamustine can improve outcomes in patients with relapsed/refractory chronic lymphocytic leukemia (CLL), according to research published in the British Journal of Haematology.
In a phase 2 trial, researchers found that combining the anti-CD37 molecule otlertuzumab with bendamustine significantly improved overall response rates (ORRs) and progression-free survival (PFS) when compared to bendamustine alone.
“We’re very encouraged by the phase 2 data, which demonstrated a significant increase in median progression-free survival, from approximately 10 to 16 months in patients receiving combination otlertuzumab/bendamustine therapy,” said Marvin L. White, president and chief executive officer of Aptevo Therapeutics Inc, the company developing otlertuzumab.
“These data, coupled with additional results from ongoing studies of otlertuzumab used in combination with current CLL therapies, should help position otlertuzumab for a potential partnership to advance into phase 3 clinical development.”
The phase 2 trial was sponsored by Emergent Product Development Seattle LLC. Aptevo Therapeutics is a spin-off of Emergent Biosolutions.
About otlertuzumab
Otlertuzumab (formerly TRU-016) is a humanized, monospecific ADAPTIR™ molecule that targets CD37.
Aptevo Therapeutics says the company is applying its ADAPTIR technology to develop immuno-oncology candidates that focus on redirected T-cell cytotoxicity. ADAPTIR technology can be used to generate immunotherapeutics with unique mechanisms of action, including targeted cytokine delivery, targeting 2 cell surface receptors, or neutralization of multiple soluble proteins.
According to Aptevo, otlertuzumab mediates death of CD37-expressing cells through various mechanisms, including direct cell death, antibody-dependent cell-mediated cytotoxicity, and phagocytosis. Otlertuzumab is being investigated as part of combination therapies for the treatment of CLL.
Study design
This phase 2 study enrolled 65 patients with relapsed/refractory CLL—32 who received a combination of otlertuzumab and bendamustine and 33 who received bendamustine alone.
Patients in the combination arm received otlertuzumab at 20 mg/kg weekly by intravenous infusion for two 28-day cycles, then every 14 days for four 28-day cycles.
Patients in both arms received intravenous bendamustine at 70 mg/m2 on days 1 and 2 of each cycle for up to six 28-day cycles. Dosing was adjusted according to neutrophil and platelet counts.
The study’s primary endpoint was ORR (per IWCLL criteria), and secondary endpoints included PFS and safety.
Patient characteristics
The researchers said the treatment arms were generally well balanced. However, patients in the combination arm were older, had more prior treatment regimens, a longer time from diagnosis, and more bulky disease. More patients in the control arm were Rai stage III or IV.
Two patients in the combination arm and 5 in the control arm had 17p deletion. Four patients in the combination arm and 6 in the control arm had TP53 mutations.
There were 5 patients in the combination arm and 3 in the control arm who were refractory to their prior treatment.
In both arms, patients received a median of 6 cycles of study treatment. Bendamustine exposure was similar between the arms—a median of 143 days. The median treatment duration for otlertuzumab was 156 days.
Seven patients (22%) in the combination arm and 12 (36%) in the control arm discontinued treatment early.
In the combination arm, 3 patients discontinued due to adverse events (AEs), 3 due to disease progression, and 1 patient withdrew to have a stem cell transplant.
In the control arm, 7 patients discontinued due to AEs, 3 due to progression, 1 withdrew for an unspecified reason, and 1 patient died of acute heart failure.
Response and survival
The ORR was 69% in the combination arm and 39% in the control arm (P=0.025).
In the combination arm, 3 patients (9%) had a complete response (CR), 1 patient had a CR with incomplete marrow recovery, and 19 (59%) had a partial response.
In the control arm, 1 patient (3%) had a CR and 12 (36%) had a partial response.
The median PFS was 15.9 months in the combination arm and 10.2 months in the control arm (P=0.0192).
The median overall survival was not reached in either arm. After 2 years of follow-up, there were no deaths in the combination arm and 3 deaths in the control arm.
Safety
Ninety-one percent of patients in the combination arm and 100% of those in the control arm experienced an AE. Serious AEs occurred in 31% and 45%, respectively.
Severe neutropenia was more frequent in the combination arm than the control arm (56% vs 39%), as was severe thrombocytopenia (19% vs 15%).
However, there were fewer grade 3/4 infections in the combination arm than the control arm (13% vs 27%). And 2 patients in the control arm had febrile neutropenia, but there were no cases in the combination arm.
“These latest data show the combination of otlertuzumab and bendamustine is well tolerated and significantly increases the response rate and PFS in patients with relapsed or refractory CLL,” said Scott Stromatt, MD, study director and chief medical officer for Aptevo.
“Consequently, we are now exploring the utility of otlertuzumab in combination with additional CLL therapies to evaluate clinical benefit in distinct CLL patient subgroups.” ![]()
Testimonial
The video associated with this article is no longer available on this site. Please view all of our videos on the MDedge YouTube channel
The video associated with this article is no longer available on this site. Please view all of our videos on the MDedge YouTube channel
The video associated with this article is no longer available on this site. Please view all of our videos on the MDedge YouTube channel

CHMP recommends authorization of rituximab biosimilar

Photo by Linda Bartlett
The European Medicines Agency’s Committee for Medicinal Products for Human Use (CHMP) has recommended that the rituximab biosimilar Truxima receive marketing authorization for the treatment of several conditions.
The CHMP said studies have shown that Truxima is comparable to the reference product, Mabthera, which was authorized for use in the European Union in 1998.
The active substance in both products is the anti-CD20 monoclonal antibody rituximab.
Truxima is being developed by Celltrion Healthcare Hungary Kft.
The CHMP’s recommendation for Truxima will be reviewed by the European Commission, which normally issues its decision on a product within 67 days of the time the CHMP adopts its opinion.
If the European Commission grants marketing authorization for Truxima, it will be available as a 500 mg concentrate for solution for infusion.
The CHMP has recommended marketing authorization for Truxima in the treatment of non-Hodgkin lymphoma, chronic lymphocytic leukemia, rheumatoid arthritis, and granulomatosis with polyangiitis and microscopic polyangiitis.
The full indications are as follows.
Non-Hodgkin lymphoma
Truxima is indicated for use in combination with chemotherapy to treat previously untreated patients with stage III-IV follicular lymphoma.
Truxima maintenance therapy is indicated for the treatment of follicular lymphoma patients responding to induction therapy.
Truxima monotherapy is indicated for treatment of patients with stage III-IV follicular lymphoma who are chemo-resistant or are in their second or subsequent relapse after chemotherapy.
Truxima is indicated for use in combination with CHOP (cyclophosphamide, doxorubicin, vincristine, prednisolone) for the treatment of patients with CD20-positive diffuse large B-cell lymphoma.
Chronic lymphocytic leukemia
Truxima in combination with chemotherapy is indicated for the treatment of patients with previously untreated and relapsed/refractory chronic lymphocytic leukemia.
The CHMP noted that only limited data are available on efficacy and safety for patients previously treated with monoclonal antibodies, including Truxima, or patients refractory to previous Truxima plus chemotherapy.
Rheumatoid arthritis
Truxima in combination with methotrexate is indicated for the treatment of adults with severe active rheumatoid arthritis who have had an inadequate response or cannot tolerate other disease-modifying anti-rheumatic drugs, including one or more tumor necrosis factor inhibitor therapies.
The CHMP noted that Truxima has been shown to reduce the rate of progression of joint damage as measured by X-ray and to improve physical function, when given in combination with methotrexate.
Granulomatosis with polyangiitis and microscopic polyangiitis
Truxima in combination with glucocorticoids is indicated for the induction of remission in adults with severe, active granulomatosis with polyangiitis and microscopic polyangiitis.
The CHMP proposed that Truxima be administered under the close supervision of an experienced healthcare professional and in an environment where full resuscitation facilities are immediately available. ![]()
CHMP recommends approval of topical gel for MF

mycosis fungoides
The European Medicines Agency’s Committee for Medicinal Products for Human Use (CHMP) has recommended that chlormethine gel (Ledaga®) be approved for use in adults with mycosis fungoides (MF).
Ledaga is a hybrid medicine of Caryolysine, which has been approved for use in the European Union since 1946.
Ledaga contains the same active substance as Caryolysine but is a gel intended for cutaneous use.
The active substance of Ledaga is chlormethine, a bifunctional alkylating agent that inhibits rapidly proliferating cells.
Hybrid drug applications rely, in part, on the results of preclinical tests and clinical trials for a reference product and, in part, on new data.
The CHMP said studies have demonstrated the satisfactory quality of Ledaga. Since Ledaga is administered as a topical agent and results in no systemic exposure, a bioequivalence study versus the reference product, Caryolysine, was not required.
The CHMP’s recommendation for Ledaga will be reviewed by the European Commission, which is expected to issue a final decision by the end of February 2017.
If approved, Ledaga will be available as a 160 μg/g gel.
Actelion Pharmaceuticals Ltd, the company developing Ledaga, has agreed to a list of recommendations from the CHMP (post-authorization measures) with regard to the release of Ledaga in Europe.
Subject to the agreed recommendations and achieving market access in different countries, a potential first launch of Ledaga could occur at the end of 2017, at the earliest.
Phase 2 study
The CHMP’s positive opinion of Ledaga is based on results of a multicenter, randomized, observer-blinded, active-controlled study of patients with stage I and IIA MF. Results from this phase 2 study were published in JAMA Dermatology.
The study enrolled 260 patients who were randomized 1:1 to receive topical treatment with Ledaga or compounded control—chlormethine HCl 0.02% compounded in Aquaphor® ointment—once daily for up to 12 months.
A response was defined as at least a 50% improvement in the baseline Composite Assessment of Index Lesion Severity score.
In the intent-to-treat population, 59% (76/130) of patients who received Ledaga achieved a clinical response, compared to 48% (62/130) of patients treated with the compounded control. The rate of complete response was 14% (n=18) and 12% (n=15), respectively.
Patients who were treated for at least 6 months were included in the efficacy-evaluable population. In this population, 77% (69/90) of patients who received Ledaga achieved a clinical response, compared to 59% (56/95) of patients treated with the compounded control. The rate of complete response was 19% (n=17) and 15% (n=14), respectively.
Reductions in mean lesion severity were seen as early as 4 weeks into the study, with further reductions observed with continuing therapy. The time to first confirmed response favored Ledaga.
The most frequent adverse reactions reported with Ledaga were skin-related—dermatitis (55%; eg, skin irritation, erythema, rash, urticaria, skin-burning sensation, pain of the skin), pruritus (20%), skin infections (12%), skin ulceration and blistering (6%), and skin hyperpigmentation (6%).
No systemic absorption of chlormethine was detected with treatment. ![]()