User login
Should women of childbearing age eat a plant-based diet?
The prospective cohort study followed 11,459 women older than 18 years and evaluated their diet from the beginning using a validated questionnaire about the frequency and quality of plant-based foods. The participants had taken part in the Nurses’ Health Study II (1991-2009). From responses on the questionnaire, the investigators calculated the plant-based diet index (PDI) even among participants with an omnivorous diet. A higher score indicated greater adherence to the PDI.
“We wanted to know how one’s diet leading up to pregnancy influences the pregnancy, so we monitored women for virtually their entire reproductive life – almost 20 years – and gained an awareness of their typical diet before pregnancy,” study author Jorge E. Chavarro, MD, ScD, told this news organization. Dr. Chavarro is a professor of nutrition, epidemiology, and medicine at Harvard Medical School, Boston, and Harvard University’s School of Public Health in Cambridge, Mass. He researches how nutrition and lifestyle influence reproductive health and overall lifelong health in women.
Analysis of the data from the Nurses’ Health Study II revealed that as the proportion of animal products in diets decreased and the proportion of plant-based products increased, the risk of women experiencing hypertensive disorders of pregnancy decreased as well. Women in the highest PDI quintile had a significantly lower risk of hypertensive disorders of pregnancy, in comparison with those in the lowest quintile (relative risk, 0.76). This association was slightly stronger for pregnancy-related hypertension (RR, 0.77) than for preeclampsia (RR, 0.80).
Women in the highest PDI quintile had a 24% lower risk of hypertensive disorders of pregnancy than those in the lowest quintile; the risk of pregnancy-related hypertension decreased in a linear fashion as PDI increased, while the relationship of PDI to preeclampsia was restricted to women in the quintile with the highest adherence.
“It was clearer for pregnancy-related hypertension than for preeclampsia, but a diet made up primarily of plant-based foods seemed to be protective for both,” said Dr. Chavarro. He added that in addition to the problems these conditions cause during pregnancy, both increase the risk of subsequently developing other chronic diseases. “Could it be that modifiable lifestyle factors before and during pregnancy may not only help reduce problems during gestation but also prevent women’s health problems years later? That was the general motivation for this study.”
Mercedes Sotos-Prieto, PhD, a researcher at the Autonomous University of Madrid and an associate professor at Harvard University’s School of Public Health, told this news organization that the study’s methodology was very robust and that the investigators utilized appropriate statistical techniques for the analysis. She highlighted the fact that they used a validated food frequency questionnaire. She believes the study is also important because of the population group it focused on. “There has always been greater resistance when it comes to the diet of pregnant women, and the same is true for older adults. But we have seen that this type of diet, if it’s a quality diet, may be associated with health benefits.” She did not participate in the study.
Dr. Sotos-Prieto has a doctorate in nutritional epidemiology and public health. She works with large epidemiologic cohorts, such as the cohort of American nurses on which this study was based, and ENRICA, a cohort that is representative of the Spanish population and the population of older adults. She is the author of other studies that, like this one, found an association between a plant-based diet and a lower risk of frailty, both in the study involving American nurses and in a study involving a cohort of individuals aged 60 years or older in Spain (ENRICA-1).
Dr. Sotos-Prieto is also principal investigator on a project assessing the risk of cardiovascular disease based on modifiable lifestyles. For this project, the researchers created a tool, the healthy heart test, that can be used to evaluate diet quality “in 5 minutes, because we all know that doctors don’t have any time.” She thinks this test could be implemented in clinical practice to identify lifestyle behaviors that can be improved, such as by replacing refined cereals with whole grains or increasing legume consumption.
Tomatoes and French fries
The greatest benefit of a plant-based diet comes from the diet overall, not from any single food item. That said, these studies use a scoring system to reflect which items are healthy and which are not.
Diet was assessed every 4 years, starting in 1991, using a semiquantitative food frequency questionnaire that recorded the consumption of 131 foods and drinks during the previous year. The researchers determined the average frequency with which participants consumed each food. Eighteen food groups were sorted into three categories: healthy plant-based foods (whole grains, fruits, vegetables, nuts, legumes, vegetable oils, tea, and coffee), unhealthy plant-based foods (fruit juices, refined grains, potatoes, sugary drinks, sweets, and desserts), and animal-based foods (dairy, eggs, fish or shellfish, meat, and various foods of animal origin).
Healthy plant-based foods were given positive scores, while less healthy plant-based foods and the animal-based food groups were given negative scores. The consumption of each food group was classified into PDI using quintiles.
Women in the highest PDI quintile had a significantly lower risk for hypertensive disorders of pregnancy, compared with women in the lowest quintile. There was a negative dose-response relationship between PDI and risk of the disease. “A vegetarian diet isn’t necessarily healthier than a nonvegetarian diet if it’s made up of superfluous foods like French fries and soft drinks,” said Dr. Sotos-Prieto. “The difference lies in the quality of the plant-based foods. That’s what makes the difference between a healthy and an unhealthy diet.”
Give up meat?
Dr. Chavarro said that removing meat from his dinner menu 22 years ago was one of the hardest things he ever did. “Now, it’s no problem,” he said. But he understands that there are people for whom changing the diet by replacing animal products with nonanimal products is difficult. But meat need not be entirely abandoned.
“The women in the highest quintile aren’t necessarily vegetarian or vegan, but they consume much fewer animal-based foods than the others,” he noted. He added that vegetarian or vegan diets are not incompatible with a healthy pregnancy. “All vegans know how to get vitamin B12 from supplements.”
Diet or weight loss?
Much of the benefit observed in the study appears to be related to better weight control. The body mass index between dietary assessment and pregnancy accounted for 39% of the relationship between PDI and hypertensive disorders of pregnancy and 48% of the relationship between PDI and pregnancy-related hypertension.
“Part of the association seems to be explained by better weight control over long periods,” explained Dr. Chavarro. Women who adopted diets with more plant-based foods gained weight more slowly than those who consumed more animal-based foods. “They are different in terms of their weight trajectory over many years. So, part of the association that we observe is related to better long-term weight control. But the other half of the association is attributable to the diet itself and not necessarily to weight.” The authors suggest mechanisms of action such as endothelial dysfunction, inflammation, or blood pressure before pregnancy to explain the association.
Dr. Sotos-Prieto believes that this point is “extremely relevant.” In her opinion, it reveals that controlling weight at the start of pregnancy is important for pregnant women. Weight control may also improve other factors, like gestational diabetes. “I think preventive measures should focus on that. These results show that interventions are needed to increase the likelihood of going into pregnancy with an appropriate weight. And this includes modifying diet.”
Generalizable results?
More than 90% of the participants in the Nurses’ Health Study were White, not Hispanic. Can the results be extrapolated to other populations? “The answer: The study needs to be repeated in other populations,” said Dr. Chavarro, “and that’s going to take time. But even without that information, I think we can use this study to inform other populations, regardless of ethnicity.”
Dr. Sotos-Prieto admitted that this hypothesis has not yet been tested in the Spanish population, but she is the author of a similar study that followed nearly 12,000 Spanish adults for a decade using the same PDI. In this study, every 10-point increase in PDI was associated with a 14% lower risk of mortality from any cause (hazard ratio, 0.86) and a 37% lower risk of death from cardiovascular disease (HR, 0.63). She also believes that the recommendations derived from the study could be generalized to other populations “as long as each country’s culture is taken into account, to see how it can be culturally adapted. If it’s a population that consumes a lot of refined cereals, for example, make small changes to whole grains.”
Weighing the evidence
The study has strengths and limitations, owing to its methodology, and Dr. Chavarro himself recognizes that “in terms of hypertensive disorders of pregnancy specifically, this won’t be the last word.” But there is a pressing need to find answers.
The American College of Obstetricians and Gynecologists and the World Health Organization encourage women to follow healthy diets before and during pregnancy. But they provide little guidance on what constitutes a healthy diet when it comes to minimizing the risks of adverse pregnancy outcomes. “They are quite ambiguous and vague,” said Dr. Chavarro.
These new findings suggest that plant-based diets may be one such strategy, particularly because some evidence was found that these diets may be beneficial for women older than 35 years, who are considered a high-risk group.
“There are certainly many ways to eat healthily, but if we think about these pregnancy complications that can have serious consequences for the mother and the fetus, we might consider this as a healthy diet option,” Dr. Chavarro noted.
But is the evidence robust enough to recommend that patients make changes? “Ideally, there will be more studies,” stated Dr. Chavarro. “There are two ways to understand the problem. One is not making recommendations until you have three controlled clinical trials, which, even with the willingness and funding to do so, will take 15-20 years. But if we have to provide the best available information to those who need it today, I think these are solid results for guiding behavior.
“It’s always better if we can make decisions based on solid, incontrovertible information. But it’s not always available, and you must learn to live in both worlds and make decisions with uncertainties,” he concluded.
Dr. Sotos-Prieto and Dr. Chavarro have disclosed no relevant financial relationships.
This article was translated from the Medscape Spanish Edition. A version of this article first appeared on Medscape.com.
FROM AMERICAN JOURNAL OF OBSTETRICS AND GYNECOLOGY
How PCPs are penalized for positive outcomes from lifestyle change
The Centers for Medicare & Medicaid Services 2022 National Quality Strategy is described as an “ambitious long-term initiative that aims to promote the highest quality outcomes and safest care for all individuals.” It is a commendable goal for an overburdened U.S. health care system that spends more than other high-income counties yet experiences poorer outcomes. But whole-person, person-centered care cannot be achieved under current misaligned quality measures that fail to measure what we purport to value: the quintuple aim of improved health outcomes, cost savings, patient satisfaction, clinician well-being, and health equity.
Lifestyle first
Clinical practice guidelines for many chronic diseases recommend lifestyle intervention as the first and optimal treatment. A growing body of evidence supports lifestyle behavior interventions to treat and, when used intensively, even reverse common chronic conditions such as cardiovascular disease, obesity, and type 2 diabetes, while also providing effective prevention for those conditions. However, no current quality measures consider lifestyle interventions. In fact, some quality measures unintentionally penalize physicians for successfully treating or reversing disease through lifestyle behavior interventions while rewarding clinicians for meeting process measures – usually adherence to medication – regardless of whether health outcomes improved.
Rewarding medication adherence for the treatment of diseases in which lifestyle is a primary therapy (such as hypertension), combined with other health care constraints (lack of lifestyle education, time to spend with patients, and infrastructure support) incentivizes physicians to skip the conversation about lifestyle changes and go straight to medication prescription. Meanwhile, the clinician who takes the extra time to guide a patient toward lifestyle interventions that could treat their current disease and prevent future diseases – without side effects – is penalized.
Misaligned quality measures like these can stifle clinical judgment and risk reducing the practice of medicine to mindless box-checking. In many cases, patients are not even informed that lifestyle behavior change may be a treatment option (much less the first recommended option) for their conditions. This delivery of care is not person-centered and, in fact, may raise questions about the adequacy of informed treatment consent.
Reimbursement barriers
Lifestyle medicine is a growing medical specialty that uses therapeutic lifestyle interventions as a primary modality to treat chronic conditions. Since certification began in 2017, almost 2500 US physicians and 1000 nonphysician health professionals have earned certification. Health systems, including the U.S. military, are increasingly integrating lifestyle medicine. There have been advancements since one survey found that more than half of lifestyle medicine clinicians reported receiving no reimbursement for lifestyle behavior interventions. However, barriers, especially in fee-for-service systems, still inhibit many patients from receiving insurance coverage for comprehensive, interdisciplinary, and whole-person treatments called intensive therapeutic lifestyle change (ITLC) programs.
Existing comprehensive lifestyle programs that patients are eligible for (ie, the Diabetes Prevention Program and intensive behavioral therapy) are often so poorly reimbursed that clinicians and health systems decline to offer them. An example of a well-reimbursed ITLC program is intensive cardiac rehabilitation (ICR), which remains underutilized and limited to a narrow segment of patients, despite ICR›s proven benefits for managing comorbid risk factors such as hemoglobin A1c and weight. Even when lifestyle intervention programs are available and patients are eligible to participate (often through shared medical appointments), patient copays for the frequent visits required to achieve and sustain behavior change – or the lack of reimbursement for interdisciplinary team members – discourage engagement.
Penalizing successful outcomes
Despite the fact that lifestyle behaviors are top contributors to health and, conversely, contribute to up to 80% of chronic diseases, few quality measures focus on screening for lifestyle factors or treating diseases with lifestyle interventions. An example of an existing quality measure is screening or treatment for harmful substance use.
Specific quality measures that penalize lifestyle medicine approaches include pharmacotherapy for type 2 diabetes, dyslipidemia, osteoporosis, and gout as well as approaches to rheumatoid arthritis.
Statins offer a useful example of the conundrum faced by clinicians who want to offer lifestyle interventions. A lifestyle medicine primary care physician had a patient covered by Medicare Advantage who was diagnosed with hyperlipidemia. The patient had total cholesterol of 226 and a triglycerides level of 132. Instead of prescribing the routine statin, the physician prescribed lifestyle behavior modifications. Within 3 weeks, the patient›s total cholesterol improved to 171 and triglycerides to 75. This was a great success for the delighted patient. However, the CMS 5-Star Rating System assigned the primary care physician a grade of C rather than A, which put the physician›s 5-star rating at risk. Why? Because the system bases its score largely on medication compliance. The physician was penalized despite achieving the optimal health outcome, and at a lower cost than with medication. This misalignment does not incentivize patient-centered care because it disregards patient preference, shared decision-making, and evidence-based practice.
Risk adjustment
Rather than automatically managing disease with ever-increasing quantities of costly medications and procedures, lifestyle medicine clinicians first pursue a goal of health restoration when appropriate. But Medicare risk adjustment incentivizes physicians to manage rather than reverse disease. How much Medicare pays health plans is determined in part by how sick the patients are; the sicker the patient, the more Medicare pays, because those patients› costs are expected to be higher. This ensures that health plans are not penalized for enrolling sicker patients. But a physician utilizing diet alone to achieve remission in a patient with type 2 diabetes is penalized financially because, when the risk is adjusted, diabetes is no longer listed among the patient›s conditions. So, Medicare pays the physician less money. That misalignment incentivizes clinicians to manage the symptoms of type 2 diabetes rather than achieve remission, despite remission being the ideal clinical outcome.
Realigning quality measures
Quality measures were developed to quantify health care processes and outcomes, and to ensure the delivery of safe care to all patients. However, over time the number of quality measures has swelled to 2500, evolving into a confusing, time-consuming, and even soul-crushing responsibility for the physician.
Instead of relying heavily on process measures, we must incentivize outcome measures that honor patient autonomy and allow clinicians to offer lifestyle intervention as the first line of treatment. Risk-score calculations should be adjusted so that we stop incentivizing disease management and penalizing disease reversal.
CMS’s proposed development of “a universal foundation” of quality measures is an opportunity to begin the realignment of quality measures and values. This foundation is intended to establish more consistent and meaningful measures, reduce clinician burnout by streamlining the reporting process, and advance health equity. For this change to be successful, it is vital that lifestyle behavior interventions – optimal nutrition, physical activity, restorative sleep, social connections, stress management, and avoidance of harmful substances – become the foundation of universal quality measures. This will ensure that every clinician is incentivized to discuss lifestyle behaviors with patients and pursue the first clinical step recommended by clinical practice guidelines for most chronic diseases. Only then can we truly deliver high-value, whole-person, person-centered care and achieve the quintuple aim.
Dr. Patel is president-elect, American College of Lifestyle Medicine; Lifestyle Medicine Medical Director, Wellvana Health, Midland, Tex. She has disclosed no relevant financial relationships.
A version of this article first appeared on Medscape.com.
‘We’re halfway home’: UCSF’s Dr. Stephen Hauser sketches MS future
MILAN – University of California, San Francisco, neurology professor Stephen Hauser, MD, told colleagues in a highlighted lecture at the 9th Joint ECTRIMS-ACTRIMS meeting.
Going forward, the MS field should emphasize identifying early biomarkers of MS, Dr. Hauser said.
He noted that many experts had anticipated “that, if we could intervene early in the relapsing phase of the disease, we would stabilize neurodegeneration and patient disability. But one of the big surprises was that that was not the case. Instead, the observed course was that by silencing relapses and focal inflammation, a clinically silent, slow, insidious progression continues during the relapsing phase of disease in patients who are not having ongoing relapses.”
Even as focal activity detected via MRI is silenced, “progression continues” he said. “This remains the great unsolved challenge.”

Dr. Hauser asked colleagues to consider a three-stage model of MS that begins with benign autoimmunity followed by pathogenic autoimmunity with subclinical tissue damage. The third stage is clinical autoimmunity.
How can you determine who’s at risk? Genetics can only fill in part of the picture because they can’t pinpoint exactly who’s likely to develop the disease. “In other autoimmune diseases, serologic autoantibodies have been by far the most effective biomarkers,” he said. “There is real-world support – not only in mice – for the concept that autoimmunity begins as a highly focused immune response that then spreads over time.”
In systemic lupus erythematosus, the cascade toward disease begins about 9 years before clinical presentation, he said. It’s 7 months in type 1 diabetes, and 20 years in rheumatoid arthritis. “These have been enormously powerful in designing both observational and therapeutic studies to try to interrupt autoimmunity at the earliest possible stage.”
What can be done if a MS biomarker is developed and shows that a person is at risk? Dr. Hauser highlighted how the anti-CD3 antibody teplizumab has been developed – and Food and Drug Administration approved – to greatly reduce the risk of type 1 diabetes in high-risk patients. Per a 2021 study, a single-14-day course of the drug was linked to lowering the risk of disease over a median 923 days by more than 50% (hazard ratio, 0.457; P < 0.01). Half of those who received the drug were free of diabetes versus just 22% of those treated by placebo.
“We’ve not yet had those serologic biomarkers in MS. But I’d like to show you that maybe we are getting close to having them,” Dr. Hauser said. He pointed to new research into a U.S. Department of Defense serum repository that’s turned up “a pretty rock-solid prediagnostic biomarker specific to MS.”
Moving on to therapy, Dr. Hauser said it’s clear that “the earlier that we treat, the more likely we are to have a large response. Highly effective therapies delivered as first-line therapies have better long-term outcomes for disability then does a graded approach that doesn’t begin with high-efficacy therapy.”
What constitutes a cure?
What else needs to be done going forward? Dr. Hauser called for the MS field to develop a definition of cure. “We should take the lead from cancer therapeutics, where they define what a cure means.” In B-cell leukemia, for example, patients are considered cured “if they remain completely disease-free in terms of clinical symptoms and biomarkers of clonal proliferation for 4 years. They have less than a 1% lifetime risk of relapse. They’re essentially cured. Our equivalent could also be developed for MS.”
He highlighted the IMPACT MS phase 4 trial, a small single-center study of ocrelizumab, which just finished enrollment and will examine the effect of the drug on treatment-naive patients at the moment of their first-ever attack. The primary endpoint is oligoclonal bands in 3 years. “I think more of these studies will probably follow,” Dr. Hauser said.
Is intervention possible at the presymptomatic stage? Targets could be members of families with multiple affected relatives who test positive for the predictive antibody signature and who have a high genetic score, he said. “We could do perhaps an Epstein-Barr virus intervention trial in this population. Then, if we have the courage and are more confident in our biomarkers, perhaps even a therapeutic trial, as has been done in these other diseases.”
As for next-generation therapies, “we’ll need to neutralize multiple cell types, especially in later disease,” he said. Bruton tyrosine kinase inhibitors “seem to be a class of drugs that was designed for the MS patient because they not only hit B cells, but also the plasmablasts that CD20s don’t hit and are the main component of the humoral pathology in chronic MS lesions.”
Dr. Hauser discloses scientific board (Accure, Alector, Annexon), board of directors (Neurona), consulting (BD, Moderna, NGM Bio), and travel reimbursement/writing support (Roche and Novartis).
MILAN – University of California, San Francisco, neurology professor Stephen Hauser, MD, told colleagues in a highlighted lecture at the 9th Joint ECTRIMS-ACTRIMS meeting.
Going forward, the MS field should emphasize identifying early biomarkers of MS, Dr. Hauser said.
He noted that many experts had anticipated “that, if we could intervene early in the relapsing phase of the disease, we would stabilize neurodegeneration and patient disability. But one of the big surprises was that that was not the case. Instead, the observed course was that by silencing relapses and focal inflammation, a clinically silent, slow, insidious progression continues during the relapsing phase of disease in patients who are not having ongoing relapses.”
Even as focal activity detected via MRI is silenced, “progression continues” he said. “This remains the great unsolved challenge.”
Dr. Hauser asked colleagues to consider a three-stage model of MS that begins with benign autoimmunity followed by pathogenic autoimmunity with subclinical tissue damage. The third stage is clinical autoimmunity.
How can you determine who’s at risk? Genetics can only fill in part of the picture because they can’t pinpoint exactly who’s likely to develop the disease. “In other autoimmune diseases, serologic autoantibodies have been by far the most effective biomarkers,” he said. “There is real-world support – not only in mice – for the concept that autoimmunity begins as a highly focused immune response that then spreads over time.”
In systemic lupus erythematosus, the cascade toward disease begins about 9 years before clinical presentation, he said. It’s 7 months in type 1 diabetes, and 20 years in rheumatoid arthritis. “These have been enormously powerful in designing both observational and therapeutic studies to try to interrupt autoimmunity at the earliest possible stage.”
What can be done if a MS biomarker is developed and shows that a person is at risk? Dr. Hauser highlighted how the anti-CD3 antibody teplizumab has been developed – and Food and Drug Administration approved – to greatly reduce the risk of type 1 diabetes in high-risk patients. Per a 2021 study, a single-14-day course of the drug was linked to lowering the risk of disease over a median 923 days by more than 50% (hazard ratio, 0.457; P < 0.01). Half of those who received the drug were free of diabetes versus just 22% of those treated by placebo.
“We’ve not yet had those serologic biomarkers in MS. But I’d like to show you that maybe we are getting close to having them,” Dr. Hauser said. He pointed to new research into a U.S. Department of Defense serum repository that’s turned up “a pretty rock-solid prediagnostic biomarker specific to MS.”
Moving on to therapy, Dr. Hauser said it’s clear that “the earlier that we treat, the more likely we are to have a large response. Highly effective therapies delivered as first-line therapies have better long-term outcomes for disability then does a graded approach that doesn’t begin with high-efficacy therapy.”
What constitutes a cure?
What else needs to be done going forward? Dr. Hauser called for the MS field to develop a definition of cure. “We should take the lead from cancer therapeutics, where they define what a cure means.” In B-cell leukemia, for example, patients are considered cured “if they remain completely disease-free in terms of clinical symptoms and biomarkers of clonal proliferation for 4 years. They have less than a 1% lifetime risk of relapse. They’re essentially cured. Our equivalent could also be developed for MS.”
He highlighted the IMPACT MS phase 4 trial, a small single-center study of ocrelizumab, which just finished enrollment and will examine the effect of the drug on treatment-naive patients at the moment of their first-ever attack. The primary endpoint is oligoclonal bands in 3 years. “I think more of these studies will probably follow,” Dr. Hauser said.
Is intervention possible at the presymptomatic stage? Targets could be members of families with multiple affected relatives who test positive for the predictive antibody signature and who have a high genetic score, he said. “We could do perhaps an Epstein-Barr virus intervention trial in this population. Then, if we have the courage and are more confident in our biomarkers, perhaps even a therapeutic trial, as has been done in these other diseases.”
As for next-generation therapies, “we’ll need to neutralize multiple cell types, especially in later disease,” he said. Bruton tyrosine kinase inhibitors “seem to be a class of drugs that was designed for the MS patient because they not only hit B cells, but also the plasmablasts that CD20s don’t hit and are the main component of the humoral pathology in chronic MS lesions.”
Dr. Hauser discloses scientific board (Accure, Alector, Annexon), board of directors (Neurona), consulting (BD, Moderna, NGM Bio), and travel reimbursement/writing support (Roche and Novartis).
AT ECTRIMS 2023

Implementing shared decision making in labor and delivery: TeamBirth is a model for person-centered birthing care
CASE The TeamBirth experience: Making a difference
“At a community hospital in Washington where we had implemented TeamBirth (a labor and delivery shared decision making model), a patient, her partner, a labor and delivery nurse, and myself (an ObGyn) were making a plan for the patient’s induction of labor admission. I asked the patient, a 29-year-old (G2P1001), how we could improve her care in relation to her first birth. Her answer was simple: I want to be treated with respect. Her partner went on to describe their past experience in which the provider was inappropriately texting while in between the patient’s knees during delivery. Our team had the opportunity to undo some of the trauma from her first birth. That’s what I like about TeamBirth. It gives every patient the opportunity, regardless of their background, to define safety and participate in their care experience.”
–Angela Chien, MD, Obstetrician and Quality Improvement leader, Washington
Unfortunately, disrespect and mistreatment are far from an anomaly in the obstetrics setting. In a systematic review of respectful maternity care, the World Health Organization delineated 7 dimensions of maternal mistreatment: physical abuse, sexual abuse, verbal abuse, stigma and discrimination, failure to meet professional standards of care, poor rapport between women and providers, and poor conditions and constraints presented by the health system.1 In 2019, the Giving Voice to Mothers study showed that 17% of birthing people in the United States reported experiencing 1 or more types of maternal mistreatment.2 Rates of mistreatment were disproportionately greater in populations of color, hospital-based births, and among those with social, economic, or health challenges.2 It is well known that Black and African American and American Indian and Alaska Native populations experience the rare events of severe maternal morbidity and mortality more frequently than their White counterparts; the disproportionate burden of mistreatment is lesser known and far more common.
Overlooking the longitudinal harm of a negative birth experience has cascading impact. While an empowering perinatal experience can foster preventive screening and management of chronic disease, a poor experience conversely can seed mistrust at an individual, generational, and community level.
The patient quality enterprise is beginning to shift attention toward maternal experience with the development of PREMs (patient-reported experience measures), PROMs (patient-reported outcome measures), and novel validated scales that assess autonomy and trust.3 Development of a maternal Consumer Assessment of Healthcare Providers and Systems (CAHPS) survey on childbirth is forthcoming.4 Of course, continuing to prioritize physical safety through initiatives on blood pressure monitoring and severe maternal morbidity and mortality remains paramount. Yet emotional and psychological safety also must be recognized as essential pillars of patient safety. Transgressions related to autonomy and dignity, as well as racism, sexism, classicism, and ableism, should be treated as “adverse and never events.”5
How the TeamBirth model works
Shared decision making (SDM) is cited in medical pedagogy as the solution to respectfullyrecognizing social context, integrating subjective experience, and honoring patient autonomy.6 The onus has always been on individual clinicians to exercise SDM. A new practice model, TeamBirth, embeds SDM into the culture and workflow. It offers a behavioral framework to mitigate implicit bias and operationalizes SDM tools, such that every patient is an empowered participant in their care.
TeamBirth was created through Ariadne Labs’ Delivery Decisions Initiative, a research and social impact program that designs, tests, and scales transformative, systems-level solutions that promote quality, equity, and dignity in childbirth. By the end of 2023, TeamBirth will be implemented in more than 100 hospitals across the United States, cumulatively touching over 200,000 lives. (For more information on the TeamBirth model, view the “Why TeamBirth” video at: https://www.youtube.com/watch?v=EoVrSaGk7gc.)
The tenets of TeamBirth are enacted through a patient-facing, shared whiteboard or dry-erase planning board in the labor room (FIGURE 1). Research has demonstrated how dry-erase boards in clinical settings can support safety and dignity in care, especially to improve patient-provider communication, teamwork, and patient satisfaction.7,8 The planning board is initially filled out by a clinical team member and is updated during team “huddles” throughout labor.

Huddles are care plan discussions with the full care team (the patient, nurse, doula and/or other support person(s), delivering provider, and interpreter or social worker as needed). At a minimum, huddles occur on admission, with changes to the clinical course and care plan, and at the request of any team member. Huddles can transpire through in-person, virtual, or phone communication.9 The concept builds on interdisciplinary and patient-centered rounding and establishes a communication system that is suited to the dynamic environment and amplified patient autonomy unique to labor and delivery. Dr. Bob Barbieri, a steadfast leader and champion of TeamBirth implementation at Brigham and Women’s Hospital in Boston (and the Editor in Chief of OBG M
Continue to: Patient response to TeamBirth is positive...
Patient response to TeamBirth is positive
Patients and providers alike have endorsed TeamBirth. In initial pilot testing across 4 sites, 99% of all patients surveyed “definitely” or “somewhat” had the role they wanted in making decisions about their labor.9
In partnership with the Oklahoma Perinatal Quality Improvement Collaborative (OPQIC), the impact of TeamBirth was assessed in a statewide patient cohort (n = 3,121) using the validated Mothers Autonomy in Decision Making (MADM) scale created by the Birth Place Lab at the University of British Columbia. The percentage of patients who scored in the highest MADM quartile was 31.3% higher for patients who indicated participation in a huddle during labor compared with those who did not participate in a huddle. This trend held across all racial and ethnic groups: For example, 93% of non-Hispanic Black/African American patients who had a TeamBirth huddle reported high autonomy, a nearly 20 percentage point increase from those without a huddle (FIGURE 2). Similarly, a higher percentage of agreement was observed across all 7 items in the MADM scale for patients who reported a TeamBirth huddle (FIGURE 3). TeamBirth’s effect has been observed across surveys and multiple validated metrics.
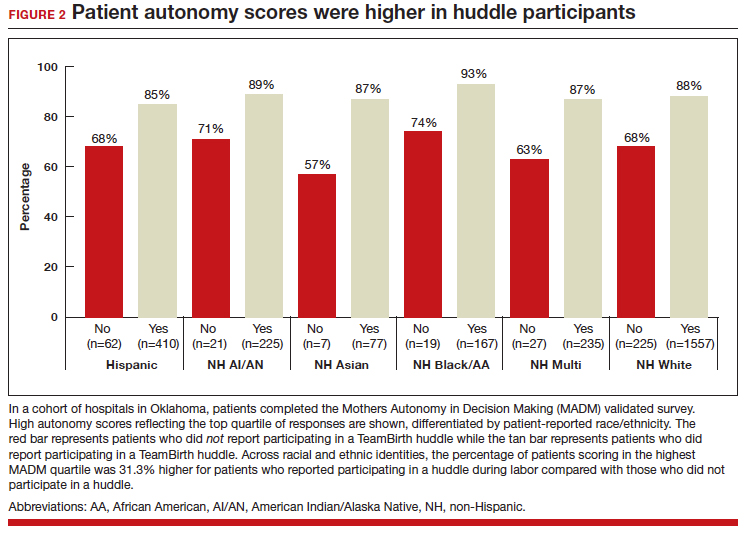
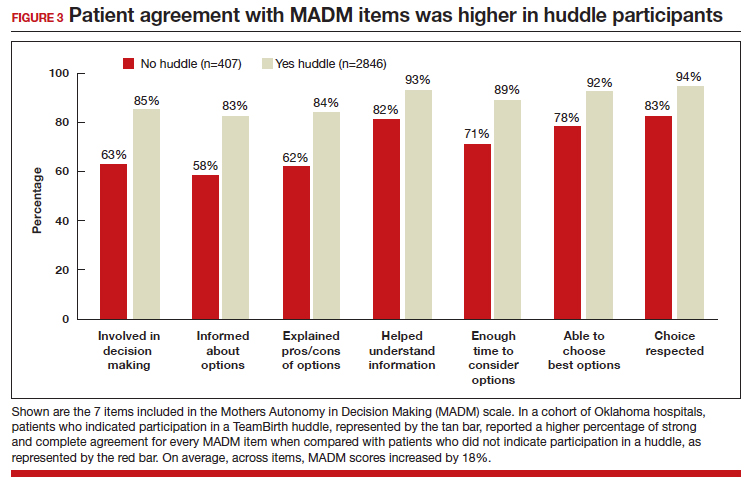
Data collection related to TeamBirth continues to be ongoing, with reported values retrieved on July 14, 2023. Rigorous review of patient-reported outcomes is forthcoming, and assessing impact on clinical outcomes, such as NTSV (nulliparous, term, singleton vertex) cesarean delivery rates and severe maternal morbidity, is on the horizon.
Qualitative survey responses reinforce how patients value TeamBirth and appreciate huddles and whiteboards.
Continue to: Patient testimonials...
Patient testimonials
The following testimonials were obtained from a TeamBirth survey that patients in participating Massachusetts hospitals completed in the postpartum unit prior to discharge.
According to one patient, “TeamBirth is great, feels like all obstacles are covered by multiple people with many talents, expertise. Feels like mom is part of the process, much different than my delivery 2 years ago when I felt like things were decided for me/I was ‘told’ what we were doing and questioned if I felt uneasy about it…. We felt safe and like all things were covered no matter what may happen.”
Another patient, also at a Massachusetts hospital, offered these comments about TeamBirth: “The entire staff was very genuine and my experience the best it could be. They deserve updated whiteboards in every room. I found them to be very useful.”
The clinician perspective
To be certain, clinician workflow must be a consideration for any practice change. The feasibility, acceptability, and safety of the TeamBirth model to clinicians was validated through a study at 4 community hospitals across the United States in which TeamBirth had been implemented in the 8 months prior.9
The clinician response rate was an impressive 78%. Ninety percent of clinicians, including physicians, midwives, and nurses, indicated that they would “definitely” (68%) or “probably” (22%) recommend TeamBirth for use in other labor and delivery units. None of the clinicians surveyed (n = 375) reported that TeamBirth negatively impacted care delivery.9
Obstetricians also provided qualitative commentary, noting that, while at times huddling infringed on efficiency, it also enhanced staff fulfillment. An obstetrician at a Massachusetts hospital observed, “Overall I think [TeamBirth is] helpful in slowing us down a little bit to really make sure that we’re providing the human part of the care, like the communication, and not just the medical care. And I think most providers value the human part and the communication. You know, we all think most providers value good communication with the patients, but when you’re in the middle of running around doing a bunch of stuff, you don’t always remember to prioritize it. And I think that at the end of the day…when you know you’ve communicated well with your patients, you end up feeling better about what you’re doing.”
As with most cross-sectional survey studies, selection bias remains an important caveat; patients and providers may decide to complete or not complete voluntary surveys based on particularly positive or negative experiences.
Metrics aside, obstetricians have an ethical duty to provide dignified and safe care, both physically and psychologically. Collectively, as a specialty, we share the responsibility to mitigate maternal mistreatment. As individuals, we can prevent perpetuation of birth trauma and foster healing and empowerment, one patient at a time, by employing tenets of TeamBirth.
To connect with Delivery Decisions Initiative, visit our website: https://www.ariadnelabs.org/deliverydecisions-initiative/ or contact: deliverydecisions@ ariadnelabs.org
Steps for implementing the TeamBirth model
To incorporate TeamBirth into your practice:
- Make patients the “team captain” and center them as the primary decision maker.
- Elicit patient preferences and subjective experiences to develop a collaborative plan on admission and when changes occur in clinical status.
- Round with and utilize the expertise of the full care team—nurse and midwife or obstetrician, as well as support person(s) and/or doula, learners, interpreter, and social worker as applicable.
- Ensure that the patient knows the names and roles of the care team members and provide updates at shift change.
- If your birthing rooms have a whiteboard, use it to keep the patient and team informed of the plan.
- Delineate status updates by maternal condition, fetal condition, and labor progress.
- Provide explicit permission for patients to call for a team huddle at any time and encourage support from their support people and/or doula. ●
This project is supported by:
- The Oklahoma Department of Health as part of the State Maternal Health Innovation Program Grant, Maternal and Child Health Bureau, Health Resources and Services Administration, Department of Health and Human Services.
- The Health Resources and Services Administration (HRSA) of the U.S. Department of Health and Human Services (HHS) as part of an award to the Oklahoma State Department of Health. The contents are those of the author(s) and do not necessarily represent the official views of, nor an endorsement, by HRSA, HHS, or the U.S. Government. For more information, please visit HRSA.gov.
- The Health Resources and Services Administration (HRSA) of the U.S. Department of Health and Human Services (HHS) under grant T76MC00001 and entitled Training Grant in Maternal and Child Health.
- Point32 Health’s Clinical Innovation Fund.
Data included in this article was collected and analyzed in partnership with the Oklahoma Perinatal Quality Improvement Collaborative, Department of OB/GYN, University of Oklahoma Health Sciences Center, Oklahoma City.
- Bohren MA, Vogel JP, Hunter EC, et al. The mistreatment of women during childbirth in health facilities globally: a mixedmethods systematic review. PLoS Med. 2015;12:e100184. doi:10.1371/journal.pmed.1001847
- Vedam S, Stoll K, Taiwo TK, et al. The Giving Voice to Mothers study: inequity and mistreatment during pregnancy and childbirth in the United States. Reprod Health. 2019;16. doi:10.1186/s12978-019-0729-2
- Kemmerer A, Alteras T. Evolving the maternal health quality measurement enterprise to support the communitybased maternity model. Maternal Health Hub. April 25, 2023. Accessed September 13, 2023. https:/www .maternalhealthhub.org
- Potential CAHPS survey to assess patients’ prenatal and childbirth care experiences. Agency for Healthcare Research and Quality. March 2023. Accessed September 13, 2023. https://www.ahrq.gov/news/cahps-comments-sought.html
- Lyndon A, Davis DA, Sharma AE, et al. Emotional safety is patient safety. BMJ Qual Saf. 2023;32:369-372. doi:10.1136 /bmjqs-2022-015573
- American College of Obstetricians and Gynecologists. ACOG Committee Opinion No. 819. Informed consent and shared decision making in obstetrics and gynecology. Obstet Gynecol. 2021;137:e34-e41. Accessed September 13, 2023. https://www.acog.org/clinical/clinical-guidance /committee-opinion/articles/2021/02/informed -consent-and-shared-decision-making-in-obstetrics-and -gynecology
- Goyal AA, Tur K, Mann J, et al. Do bedside visual tools improve patient and caregiver satisfaction? A systematic review of the literature. J Hosp Med. 2017;12:930-936. doi:10.12788 /jhm.2871
- Sehgal NL, Green A, Vidyarthi AR, et al. Patient whiteboards as a communication tool in the hospital setting: a survey of practices and recommendations. J Hosp Med. 2010;5:234-239. doi:10.1002/jhm.638
- Weiseth A, Plough A, Aggarwal R, et al. Improving communication and teamwork during labor: a feasibility, acceptability, and safety study. Birth. 2022:49:637-647. doi:10.1111/birt.12630
CASE The TeamBirth experience: Making a difference
“At a community hospital in Washington where we had implemented TeamBirth (a labor and delivery shared decision making model), a patient, her partner, a labor and delivery nurse, and myself (an ObGyn) were making a plan for the patient’s induction of labor admission. I asked the patient, a 29-year-old (G2P1001), how we could improve her care in relation to her first birth. Her answer was simple: I want to be treated with respect. Her partner went on to describe their past experience in which the provider was inappropriately texting while in between the patient’s knees during delivery. Our team had the opportunity to undo some of the trauma from her first birth. That’s what I like about TeamBirth. It gives every patient the opportunity, regardless of their background, to define safety and participate in their care experience.”
–Angela Chien, MD, Obstetrician and Quality Improvement leader, Washington
Unfortunately, disrespect and mistreatment are far from an anomaly in the obstetrics setting. In a systematic review of respectful maternity care, the World Health Organization delineated 7 dimensions of maternal mistreatment: physical abuse, sexual abuse, verbal abuse, stigma and discrimination, failure to meet professional standards of care, poor rapport between women and providers, and poor conditions and constraints presented by the health system.1 In 2019, the Giving Voice to Mothers study showed that 17% of birthing people in the United States reported experiencing 1 or more types of maternal mistreatment.2 Rates of mistreatment were disproportionately greater in populations of color, hospital-based births, and among those with social, economic, or health challenges.2 It is well known that Black and African American and American Indian and Alaska Native populations experience the rare events of severe maternal morbidity and mortality more frequently than their White counterparts; the disproportionate burden of mistreatment is lesser known and far more common.
Overlooking the longitudinal harm of a negative birth experience has cascading impact. While an empowering perinatal experience can foster preventive screening and management of chronic disease, a poor experience conversely can seed mistrust at an individual, generational, and community level.
The patient quality enterprise is beginning to shift attention toward maternal experience with the development of PREMs (patient-reported experience measures), PROMs (patient-reported outcome measures), and novel validated scales that assess autonomy and trust.3 Development of a maternal Consumer Assessment of Healthcare Providers and Systems (CAHPS) survey on childbirth is forthcoming.4 Of course, continuing to prioritize physical safety through initiatives on blood pressure monitoring and severe maternal morbidity and mortality remains paramount. Yet emotional and psychological safety also must be recognized as essential pillars of patient safety. Transgressions related to autonomy and dignity, as well as racism, sexism, classicism, and ableism, should be treated as “adverse and never events.”5
How the TeamBirth model works
Shared decision making (SDM) is cited in medical pedagogy as the solution to respectfullyrecognizing social context, integrating subjective experience, and honoring patient autonomy.6 The onus has always been on individual clinicians to exercise SDM. A new practice model, TeamBirth, embeds SDM into the culture and workflow. It offers a behavioral framework to mitigate implicit bias and operationalizes SDM tools, such that every patient is an empowered participant in their care.
TeamBirth was created through Ariadne Labs’ Delivery Decisions Initiative, a research and social impact program that designs, tests, and scales transformative, systems-level solutions that promote quality, equity, and dignity in childbirth. By the end of 2023, TeamBirth will be implemented in more than 100 hospitals across the United States, cumulatively touching over 200,000 lives. (For more information on the TeamBirth model, view the “Why TeamBirth” video at: https://www.youtube.com/watch?v=EoVrSaGk7gc.)
The tenets of TeamBirth are enacted through a patient-facing, shared whiteboard or dry-erase planning board in the labor room (FIGURE 1). Research has demonstrated how dry-erase boards in clinical settings can support safety and dignity in care, especially to improve patient-provider communication, teamwork, and patient satisfaction.7,8 The planning board is initially filled out by a clinical team member and is updated during team “huddles” throughout labor.
Huddles are care plan discussions with the full care team (the patient, nurse, doula and/or other support person(s), delivering provider, and interpreter or social worker as needed). At a minimum, huddles occur on admission, with changes to the clinical course and care plan, and at the request of any team member. Huddles can transpire through in-person, virtual, or phone communication.9 The concept builds on interdisciplinary and patient-centered rounding and establishes a communication system that is suited to the dynamic environment and amplified patient autonomy unique to labor and delivery. Dr. Bob Barbieri, a steadfast leader and champion of TeamBirth implementation at Brigham and Women’s Hospital in Boston (and the Editor in Chief of OBG M
Continue to: Patient response to TeamBirth is positive...
Patient response to TeamBirth is positive
Patients and providers alike have endorsed TeamBirth. In initial pilot testing across 4 sites, 99% of all patients surveyed “definitely” or “somewhat” had the role they wanted in making decisions about their labor.9
In partnership with the Oklahoma Perinatal Quality Improvement Collaborative (OPQIC), the impact of TeamBirth was assessed in a statewide patient cohort (n = 3,121) using the validated Mothers Autonomy in Decision Making (MADM) scale created by the Birth Place Lab at the University of British Columbia. The percentage of patients who scored in the highest MADM quartile was 31.3% higher for patients who indicated participation in a huddle during labor compared with those who did not participate in a huddle. This trend held across all racial and ethnic groups: For example, 93% of non-Hispanic Black/African American patients who had a TeamBirth huddle reported high autonomy, a nearly 20 percentage point increase from those without a huddle (FIGURE 2). Similarly, a higher percentage of agreement was observed across all 7 items in the MADM scale for patients who reported a TeamBirth huddle (FIGURE 3). TeamBirth’s effect has been observed across surveys and multiple validated metrics.
Data collection related to TeamBirth continues to be ongoing, with reported values retrieved on July 14, 2023. Rigorous review of patient-reported outcomes is forthcoming, and assessing impact on clinical outcomes, such as NTSV (nulliparous, term, singleton vertex) cesarean delivery rates and severe maternal morbidity, is on the horizon.
Qualitative survey responses reinforce how patients value TeamBirth and appreciate huddles and whiteboards.
Continue to: Patient testimonials...
Patient testimonials
The following testimonials were obtained from a TeamBirth survey that patients in participating Massachusetts hospitals completed in the postpartum unit prior to discharge.
According to one patient, “TeamBirth is great, feels like all obstacles are covered by multiple people with many talents, expertise. Feels like mom is part of the process, much different than my delivery 2 years ago when I felt like things were decided for me/I was ‘told’ what we were doing and questioned if I felt uneasy about it…. We felt safe and like all things were covered no matter what may happen.”
Another patient, also at a Massachusetts hospital, offered these comments about TeamBirth: “The entire staff was very genuine and my experience the best it could be. They deserve updated whiteboards in every room. I found them to be very useful.”
The clinician perspective
To be certain, clinician workflow must be a consideration for any practice change. The feasibility, acceptability, and safety of the TeamBirth model to clinicians was validated through a study at 4 community hospitals across the United States in which TeamBirth had been implemented in the 8 months prior.9
The clinician response rate was an impressive 78%. Ninety percent of clinicians, including physicians, midwives, and nurses, indicated that they would “definitely” (68%) or “probably” (22%) recommend TeamBirth for use in other labor and delivery units. None of the clinicians surveyed (n = 375) reported that TeamBirth negatively impacted care delivery.9
Obstetricians also provided qualitative commentary, noting that, while at times huddling infringed on efficiency, it also enhanced staff fulfillment. An obstetrician at a Massachusetts hospital observed, “Overall I think [TeamBirth is] helpful in slowing us down a little bit to really make sure that we’re providing the human part of the care, like the communication, and not just the medical care. And I think most providers value the human part and the communication. You know, we all think most providers value good communication with the patients, but when you’re in the middle of running around doing a bunch of stuff, you don’t always remember to prioritize it. And I think that at the end of the day…when you know you’ve communicated well with your patients, you end up feeling better about what you’re doing.”
As with most cross-sectional survey studies, selection bias remains an important caveat; patients and providers may decide to complete or not complete voluntary surveys based on particularly positive or negative experiences.
Metrics aside, obstetricians have an ethical duty to provide dignified and safe care, both physically and psychologically. Collectively, as a specialty, we share the responsibility to mitigate maternal mistreatment. As individuals, we can prevent perpetuation of birth trauma and foster healing and empowerment, one patient at a time, by employing tenets of TeamBirth.
To connect with Delivery Decisions Initiative, visit our website: https://www.ariadnelabs.org/deliverydecisions-initiative/ or contact: deliverydecisions@ ariadnelabs.org
Steps for implementing the TeamBirth model
To incorporate TeamBirth into your practice:
- Make patients the “team captain” and center them as the primary decision maker.
- Elicit patient preferences and subjective experiences to develop a collaborative plan on admission and when changes occur in clinical status.
- Round with and utilize the expertise of the full care team—nurse and midwife or obstetrician, as well as support person(s) and/or doula, learners, interpreter, and social worker as applicable.
- Ensure that the patient knows the names and roles of the care team members and provide updates at shift change.
- If your birthing rooms have a whiteboard, use it to keep the patient and team informed of the plan.
- Delineate status updates by maternal condition, fetal condition, and labor progress.
- Provide explicit permission for patients to call for a team huddle at any time and encourage support from their support people and/or doula. ●
This project is supported by:
- The Oklahoma Department of Health as part of the State Maternal Health Innovation Program Grant, Maternal and Child Health Bureau, Health Resources and Services Administration, Department of Health and Human Services.
- The Health Resources and Services Administration (HRSA) of the U.S. Department of Health and Human Services (HHS) as part of an award to the Oklahoma State Department of Health. The contents are those of the author(s) and do not necessarily represent the official views of, nor an endorsement, by HRSA, HHS, or the U.S. Government. For more information, please visit HRSA.gov.
- The Health Resources and Services Administration (HRSA) of the U.S. Department of Health and Human Services (HHS) under grant T76MC00001 and entitled Training Grant in Maternal and Child Health.
- Point32 Health’s Clinical Innovation Fund.
Data included in this article was collected and analyzed in partnership with the Oklahoma Perinatal Quality Improvement Collaborative, Department of OB/GYN, University of Oklahoma Health Sciences Center, Oklahoma City.
- Bohren MA, Vogel JP, Hunter EC, et al. The mistreatment of women during childbirth in health facilities globally: a mixedmethods systematic review. PLoS Med. 2015;12:e100184. doi:10.1371/journal.pmed.1001847
- Vedam S, Stoll K, Taiwo TK, et al. The Giving Voice to Mothers study: inequity and mistreatment during pregnancy and childbirth in the United States. Reprod Health. 2019;16. doi:10.1186/s12978-019-0729-2
- Kemmerer A, Alteras T. Evolving the maternal health quality measurement enterprise to support the communitybased maternity model. Maternal Health Hub. April 25, 2023. Accessed September 13, 2023. https:/www .maternalhealthhub.org
- Potential CAHPS survey to assess patients’ prenatal and childbirth care experiences. Agency for Healthcare Research and Quality. March 2023. Accessed September 13, 2023. https://www.ahrq.gov/news/cahps-comments-sought.html
- Lyndon A, Davis DA, Sharma AE, et al. Emotional safety is patient safety. BMJ Qual Saf. 2023;32:369-372. doi:10.1136 /bmjqs-2022-015573
- American College of Obstetricians and Gynecologists. ACOG Committee Opinion No. 819. Informed consent and shared decision making in obstetrics and gynecology. Obstet Gynecol. 2021;137:e34-e41. Accessed September 13, 2023. https://www.acog.org/clinical/clinical-guidance /committee-opinion/articles/2021/02/informed -consent-and-shared-decision-making-in-obstetrics-and -gynecology
- Goyal AA, Tur K, Mann J, et al. Do bedside visual tools improve patient and caregiver satisfaction? A systematic review of the literature. J Hosp Med. 2017;12:930-936. doi:10.12788 /jhm.2871
- Sehgal NL, Green A, Vidyarthi AR, et al. Patient whiteboards as a communication tool in the hospital setting: a survey of practices and recommendations. J Hosp Med. 2010;5:234-239. doi:10.1002/jhm.638
- Weiseth A, Plough A, Aggarwal R, et al. Improving communication and teamwork during labor: a feasibility, acceptability, and safety study. Birth. 2022:49:637-647. doi:10.1111/birt.12630

2023 Update on contraception
More US women are using IUDs than ever before. With more use comes the potential for complications and more requests related to non-contraceptive benefits. New information provides contemporary insight into rare IUD complications and the use of hormonal IUDs for treatment of HMB.
The first intrauterine device (IUD) to be approved in the United States, the Lippes Loop, became available in 1964. Sixty years later, more US women are using IUDs than ever before, and numbers are trending upward (FIGURE).1,2 Over the past year, contemporary information has become available to further inform IUD management when pregnancy occurs with an IUD in situ, as well as counseling about device breakage. Additionally, new data help clinicians expand which patients can use a levonorgestrel (LNG) 52-mg IUD for heavy menstrual bleeding (HMB) treatment.
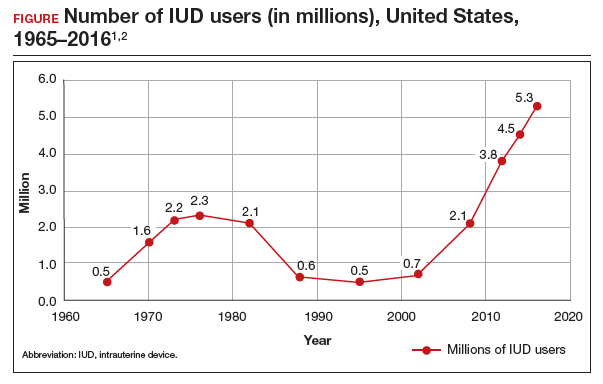
As the total absolute number of IUD users increases, so do the absolute numbers of rare outcomes, such as pregnancy among IUD users. These highly effective contraceptives have a failure rate within the first year after placement ranging from 0.1% for the LNG 52-mg IUD to 0.8% for the copper 380-mm2 IUD.3 Although the possibility for extrauterine gestation is higher when pregnancy occurs while a patient is using an IUD as compared with most other contraceptive methods, most pregnancies that occur with an IUD in situ are intrauterine.4
The high contraceptive efficacy of IUDs make pregnancy with a retained IUD rare; therefore, it is difficult to perform a study with a large enough population to evaluate management of pregnancy complicated by an IUD in situ. Clinical management recommendations for these situations are 20 years old and are supported by limited data from case reports and series with fewer than 200 patients.5,6
Intrauterine device breakage is another rare event that is poorly understood due to the low absolute number of cases. Information about breakage has similarly been limited to case reports and case series.7,8 This past year, contemporary data were published to provide more insight into both intrauterine pregnancy with an IUD in situ and IUD breakage.
Beyond contraception, hormonal IUDs have become a popular and evidence-based treatment option for patients with HMB. The initial LNG 52-mg IUD (Mirena) regulatory approval studies for HMB treatment included data limited to parous patients and users with a body mass index (BMI) less than 35 kg/m2.9 Since that time, no studies have explored these populations. Although current practice has commonly extended use to include patients with these characteristics, we have lacked outcome data. New phase 3 data on the LNG 52-mg IUD (Liletta) included a broader range of participants and provide evidence to support this practice.
Removing retained copper 380-mm2 IUDs improves pregnancy outcomes
Panchal VR, Rau AR, Mandelbaum RS, et al. Pregnancy with retained intrauterine device: national-level assessment of characteristics and outcomes. Am J Obstet Gynecol MFM. 2023;5:101056. doi:10.1016/j.ajogmf.2023.101056
Karakuş SS, Karakuş R, Akalın EE, et al. Pregnancy outcomes with a copper 380 mm2 intrauterine device in place: a retrospective cohort study in Turkey, 2011-2021. Contraception. 2023;125:110090. doi:10.1016/j.contraception.2023.110090
To update our understanding of outcomes of pregnancy with an IUD in situ, Panchal and colleagues performed a cross-sectional study using the Healthcare Cost and Utilization Project’s National Inpatient Sample. This data set represents 85% of US hospital discharges. The population investigated included hospital deliveries from 2016 to 2020 with an ICD-10 (International Classification of Diseases, Tenth Revision) code of retained IUD. Those without the code were assigned to the comparison non-retained IUD group.
The primary outcome studied was the incidence rate of retained IUD, patient and pregnancy characteristics, and delivery outcomes including but not limited to gestational age at delivery, placental abnormalities, intrauterine fetal demise (IUFD), preterm premature rupture of membranes (PPROM), cesarean delivery, postpartum hemorrhage, and hysterectomy.
Outcomes were worse with retained IUD, regardless of IUD removal status
The authors found that an IUD in situ was reported in 1 out of 8,307 pregnancies and was associated with PPROM, fetal malpresentation, IUFD, placental abnormalities including abruption, accreta spectrum, retained placenta, and need for manual removal (TABLE 1). About three-quarters (76.3%) of patients had a term delivery (≥37 weeks).
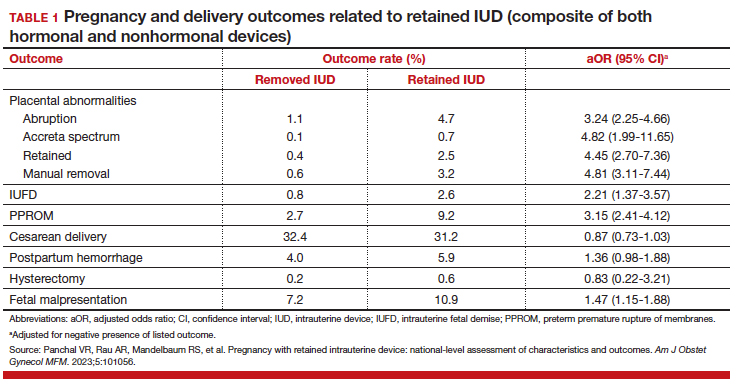
Retained IUD was associated with previable loss, defined as less than 22 weeks’ gestation (adjusted odds ratio [aOR], 5.49; 95% confidence interval [CI], 3.30–9.15) and periviable delivery, defined as 22 to 25 weeks’ gestation (aOR, 2.81; 95% CI, 1.63–4.85). Retained IUD was not associated with preterm delivery beyond 26 weeks’ gestation, cesarean delivery, postpartum hemorrhage, or hysterectomy.
Important limitations of this study are the lack of information on IUD type (copper vs hormonal) and the timing of removal or attempted removal in relation to measured pregnancy outcomes.
Continue to: Removal of copper IUD improves, but does not eliminate, poor pregnancy outcomes...
Removal of copper IUD improves, but does not eliminate, poor pregnancy outcomes
Karakus and colleagues conducted a retrospective cohort study of 233 patients in Turkey with pregnancies that occurred during copper 380-mm2 IUD use from 2011 to 2021. The authors reported that, at the time of first contact with the health system and diagnosis of retained IUD, 18.9% of the pregnancies were ectopic, 13.2% were first trimester losses, and 67.5% were ongoing pregnancies.
The authors assessed outcomes in patients with ongoing pregnancies based on whether or not the IUD was removed or retained. Outcomes included gestational age at delivery and adverse pregnancy outcomes, assessed as a composite of preterm delivery, PPROM, chorioamnionitis, placental abruption, and postpartum hemorrhage.
Of those with ongoing pregnancies, 13.3% chose to have an abortion, leaving 137 (86.7%) with continuing pregnancy. The IUD was able to be removed in 39.4% of the sample, with an average gestational age of 7 weeks at the time of removal.
Compared with those with a retained IUD, patients in the removal group had a lower rate of pregnancy loss (33.3% vs 61.4%; P<.001) and a lower rate of the composite adverse pregnancy outcomes (53.1% vs 27.8%; P=.03). TABLE 2 shows the approximate rate of ongoing pregnancy by gestational age in patients with retained and removed copper 380-mm2 IUDs. Notably, the largest change occurred periviably, with the proportion of patients with an ongoing pregnancy after 26 weeks reducing to about half for patients with a retained IUD as compared with patients with a removed IUD; this proportion of ongoing pregnancies held through the remainder of gestation.
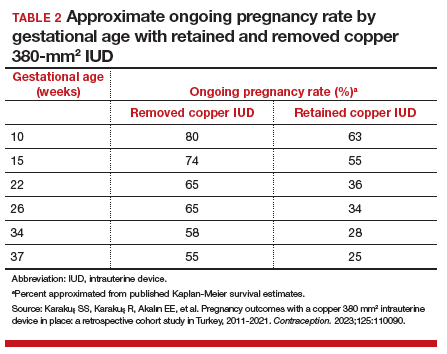
These studies confirm that a retained IUD is a rare outcome, occurring in about 1 in 8,000 pregnancies. Previous US national data from 2010 reported a similar incidence of 1 in 6,203 pregnancies (0.02%).10 Management and counseling depend on the patient’s desire to continue the pregnancy, gestational age, intrauterine IUD location, and ability to see the IUD strings. Contemporary data support management practices created from limited and outdated data, which include device removal (if able) and counseling those who desire to continue pregnancy about high-risk pregnancy complications. Those with a retained IUD should be counseled about increased risk of preterm or previable delivery, IUFD, and placental abnormalities (including accreta spectrum and retained placenta). Specifically, these contemporary data highlight that, beyond approximately 26 weeks’ gestation, the pregnancy loss rate is not different for those with a retained or removed IUD. Obstetric care providers should feel confident in using this more nuanced risk of extreme preterm delivery when counseling future patients. Implications for antepartum care and delivery timing with a retained IUD have not yet been defined.
Do national data reveal more breakage reports for copper 380-mm2 or LNG IUDs?
Latack KR, Nguyen BT. Trends in copper versus hormonal intrauterine device breakage reporting within the United States’ Food and Drug Administration Adverse Event Reporting System. Contraception. 2023;118:109909. doi:10.1016/j.contraception.2022.10.011
Latack and Nguyen reviewed postmarket surveillance data of IUD adverse events in the US Food and Drug Administration’s (FDA) Adverse Event Reporting System (FAERS) from 1998 to 2022. The FAERS is a voluntary, or passive, reporting system.
Study findings
Of the approximately 170,000 IUD-related adverse events reported to the agency during the 24-year timeframe, 25.4% were for copper IUDs and 74.6% were for hormonal IUDs. Slightly more than 4,000 reports were specific for device breakage, which the authors grouped into copper (copper 380-mm2)and hormonal (LNG 52 mg, 19.5 mg, and 13.5 mg) IUDs.
The copper 380-mm2 IUD was 6.19 times more likely to have a breakage report than hormonal IUDs (9.6% vs 1.7%; 95% CI, 5.87–6.53).
The overall proportion of IUD-related adverse events reported to the FDA was about 25% for copper and 75% for hormonal IUDs; this proportion is similar to sales figures, which show that about 15% of IUDs sold in the United States are copper and 85% are hormonal.11 However, the proportion of breakage events reported to the FDA is the inverse, with about 6 times more breakage reports with copper than with hormonal IUDs. Because these data come from a passive reporting system, the true incidence of IUD breakage cannot be assessed. However, these findings should remind clinicians to inform patients about this rare occurrence during counseling at the time of placement and, especially, when preparing for copper IUD removal. As the absolute number of IUD users increases, clinicians may be more likely to encounter this relatively rare event.
Management of IUD breakage is based on expert opinion, and recommendations are varied, ranging from observation to removal using an IUD hook, alligator forceps, manual vacuum aspiration, or hysteroscopy.7,10 Importantly, each individual patient situation will vary depending on the presence or absence of other symptoms and whether or not future pregnancy is desired.
Continue to: Data support the LNG 52-mg IUD for HMB in nulliparous and obese patients...
Data support the LNG 52-mg IUD for HMB in nulliparous and obese patients
Creinin MD, Barnhart KT, Gawron LM, et al. Heavy menstrual bleeding treatment with a levonorgestrel 52-mg intrauterine device. Obstet Gynecol. 2023;141:971-978. doi:10.1097AOG.0000000000005137
Creinin and colleagues conducted a study for US regulatory product approval of the LNG 52-mg IUD (Liletta) for HMB. This multicenter phase 3 open-label clinical trial recruited nonpregnant participants aged 18 to 50 years with HMB at 29 clinical sites in the United States. No BMI cutoff was used.
Baseline menstrual flow data were obtained over 2 to 3 screening cycles by collection of menstrual products and quantification of blood loss using alkaline hematin measurement. Patients with 2 cycles with a blood loss exceeding 80 mL had an IUD placement, with similar flow evaluations during the third and sixth postplacement cycles.
Treatment success was defined as a reduction in blood loss by more than 50% as compared with baseline (during screening) and measured blood loss of less than 80 mL. The enrolled population (n=105) included 28% nulliparous users, with 49% and 28% of participants having a BMI of 30 kg/m2 or higher and higher than 35 kg/m2, respectively.
Treatment highly successful in reducing blood loss
Participants in this trial had a 93% and a 98% reduction in blood loss at the third and sixth cycles of use, respectively. Additionally, during the sixth cycle of use, 19% of users had no bleeding. Treatment success occurred in about 80% of participants overall and occurred regardless of parity or BMI.
To assess a subjective measure of success, participants were asked to evaluate their menstrual bleeding and dysmenorrhea severity, acceptability, and overall impact on quality of life at 3 time points: during prior typical menses, cycle 3, and cycle 6. At cycle 6, all participants reported significantly improved acceptability of bleeding and uterine pain and, importantly, decreased overall menstrual interference with the ability to complete daily activities (TABLE 3).
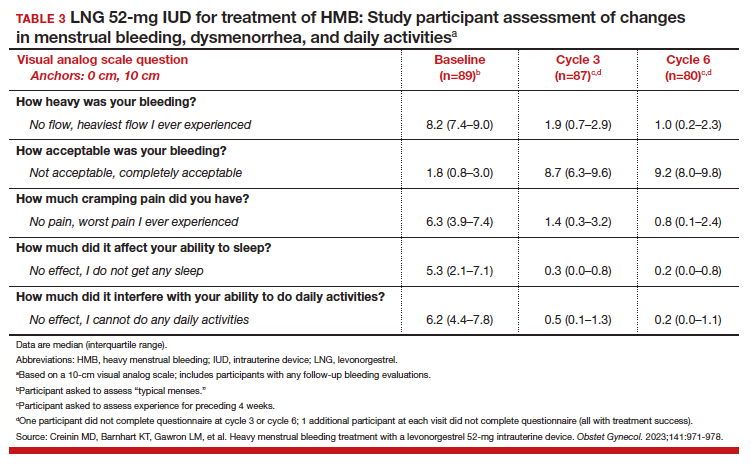
IUD expulsion and replacement rates
Although bleeding greatly decreased in all participants, 13% (n=14) discontinued before cycle 6 due to expulsion or IUD-related symptoms, with the majority citing bleeding irregularities. Expulsion occurred in 9% (n=5) of users, with the majority (2/3) occurring in the first 3 months of use and more commonly in obese and/or parous users. About half of participants with expulsion had the IUD replaced during the study. ●
Interestingly, both LNG 52-mg IUDs have been approved in most countries throughout the world for HMB treatment, and only in the United States was one of the products (Liletta) not approved until this past year. The FDA required more stringent trials than had been previously performed for approval outside of the United States. However, a benefit for clinicians is that this phase 3 study provided data in a contemporary US population. Clinicians can feel confident in counseling and offering the LNG 52-mg IUD as a first-line treatment option for patients with HMB, including those who have never been pregnant or have a BMI greater than 35 kg/m2.
Importantly, though, clinicians should be realistic with all patients that this treatment, although highly effective, is not successful for about 20% of patients by about 6 months of use. For those in whom the treatment is beneficial, the quality-of-life improvement is dramatic. Additionally, this study reminds us that expulsion risk in a population primarily using the IUD for HMB, especially if also obese and/or parous, is higher in the first 6 months of use than patients using the method for contraception. Expulsion occurs in 1.6% of contraception users through 6 months of use.12 These data highlight that IUD expulsion risk is not a fixed number, but instead is modified by patient characteristics. Patients should be counseled regarding the appropriate expulsion risk and that the IUD can be safely replaced should expulsion occur.
- Hubacher D, Kavanaugh M. Historical record-setting trends in IUD use in the United States. Contraception. 2018;98:467470. doi:10.1016/j.contraception.2018.05.016
- Kavanaugh ML, Pliskin E. Use of contraception among reproductive-aged women in the United States, 2014 and 2016. F S Rep. 2020;1:83-93. doi:10.1016/j.xfre.2020.06.006
- Jensen JT, Creinin MD. Speroff & Darney’s Clinical Guide to Contraception. 6th ed. Lippincott Williams & Wilkins; 2020:15.
- Jensen JT, Creinin MD. Speroff & Darney’s Clinical Guide to Contraception. 6th ed. Lippincott Williams & Wilkins; 2020:185.
- Ozgu-Erdinc AS, Tasdemir UG, Uygur D, et al. Outcome of intrauterine pregnancies with intrauterine device in place and effects of device location on prognosis. Contraception. 2014;89:426-430. doi:10.1016/j.contraception.2014.01.002
- Brahmi D, Steenland MW, Renner RM, et al. Pregnancy outcomes with an IUD in situ: a systematic review. Contraception. 2012;85:131-139. doi:10.1016/j.contraception . 2011.06.010
- Wilson S, Tan G, Baylson M, et al. Controversies in family planning: how to manage a fractured IUD. Contraception. 2013;88:599-603. doi:10.1016/j.contraception.2013.07.007
- Fulkerson Schaeffer S, Gimovsky AC, Aly H, et al. Pregnancy and delivery with an intrauterine device in situ: outcomes in the National Inpatient Sample Database. J Matern Fetal Neonatal Med. 2019;32:798-803. doi:10.1080/14767058.2017.1 391783
- Mirena. Prescribing information. Bayer HealthCare Pharmaceuticals. Accessed August 22, 2023. https://www .mirena-us.com/pi
- Myo MG, Nguyen BT. Intrauterine device complications and their management. Curr Obstet Gynecol Rep. 2023;12:88-95. doi.org/10.1007/s13669-023-00357-8
- National Center for Health Statistics (NCHS). 2017-2019 National Survey of Family Growth. Public-Use Data File Documentation. CDC National Center for Health Statistics. Accessed August 28, 2023. https://www.cdc.gov/nchs/data /nsfg/NSFG-2017-2019-UG-MainText-508.pdf
- Gilliam ML, Jensen JT, Eisenberg DL, et al. Relationship of parity and prior cesarean delivery to levonorgestrel 52 mg intrauterine system expulsion over 6 years. Contraception. 2021;103:444-449. doi: 10.1016/j.contraception.2021.02.013
More US women are using IUDs than ever before. With more use comes the potential for complications and more requests related to non-contraceptive benefits. New information provides contemporary insight into rare IUD complications and the use of hormonal IUDs for treatment of HMB.
The first intrauterine device (IUD) to be approved in the United States, the Lippes Loop, became available in 1964. Sixty years later, more US women are using IUDs than ever before, and numbers are trending upward (FIGURE).1,2 Over the past year, contemporary information has become available to further inform IUD management when pregnancy occurs with an IUD in situ, as well as counseling about device breakage. Additionally, new data help clinicians expand which patients can use a levonorgestrel (LNG) 52-mg IUD for heavy menstrual bleeding (HMB) treatment.
As the total absolute number of IUD users increases, so do the absolute numbers of rare outcomes, such as pregnancy among IUD users. These highly effective contraceptives have a failure rate within the first year after placement ranging from 0.1% for the LNG 52-mg IUD to 0.8% for the copper 380-mm2 IUD.3 Although the possibility for extrauterine gestation is higher when pregnancy occurs while a patient is using an IUD as compared with most other contraceptive methods, most pregnancies that occur with an IUD in situ are intrauterine.4
The high contraceptive efficacy of IUDs make pregnancy with a retained IUD rare; therefore, it is difficult to perform a study with a large enough population to evaluate management of pregnancy complicated by an IUD in situ. Clinical management recommendations for these situations are 20 years old and are supported by limited data from case reports and series with fewer than 200 patients.5,6
Intrauterine device breakage is another rare event that is poorly understood due to the low absolute number of cases. Information about breakage has similarly been limited to case reports and case series.7,8 This past year, contemporary data were published to provide more insight into both intrauterine pregnancy with an IUD in situ and IUD breakage.
Beyond contraception, hormonal IUDs have become a popular and evidence-based treatment option for patients with HMB. The initial LNG 52-mg IUD (Mirena) regulatory approval studies for HMB treatment included data limited to parous patients and users with a body mass index (BMI) less than 35 kg/m2.9 Since that time, no studies have explored these populations. Although current practice has commonly extended use to include patients with these characteristics, we have lacked outcome data. New phase 3 data on the LNG 52-mg IUD (Liletta) included a broader range of participants and provide evidence to support this practice.
Removing retained copper 380-mm2 IUDs improves pregnancy outcomes
Panchal VR, Rau AR, Mandelbaum RS, et al. Pregnancy with retained intrauterine device: national-level assessment of characteristics and outcomes. Am J Obstet Gynecol MFM. 2023;5:101056. doi:10.1016/j.ajogmf.2023.101056
Karakuş SS, Karakuş R, Akalın EE, et al. Pregnancy outcomes with a copper 380 mm2 intrauterine device in place: a retrospective cohort study in Turkey, 2011-2021. Contraception. 2023;125:110090. doi:10.1016/j.contraception.2023.110090
To update our understanding of outcomes of pregnancy with an IUD in situ, Panchal and colleagues performed a cross-sectional study using the Healthcare Cost and Utilization Project’s National Inpatient Sample. This data set represents 85% of US hospital discharges. The population investigated included hospital deliveries from 2016 to 2020 with an ICD-10 (International Classification of Diseases, Tenth Revision) code of retained IUD. Those without the code were assigned to the comparison non-retained IUD group.
The primary outcome studied was the incidence rate of retained IUD, patient and pregnancy characteristics, and delivery outcomes including but not limited to gestational age at delivery, placental abnormalities, intrauterine fetal demise (IUFD), preterm premature rupture of membranes (PPROM), cesarean delivery, postpartum hemorrhage, and hysterectomy.
Outcomes were worse with retained IUD, regardless of IUD removal status
The authors found that an IUD in situ was reported in 1 out of 8,307 pregnancies and was associated with PPROM, fetal malpresentation, IUFD, placental abnormalities including abruption, accreta spectrum, retained placenta, and need for manual removal (TABLE 1). About three-quarters (76.3%) of patients had a term delivery (≥37 weeks).
Retained IUD was associated with previable loss, defined as less than 22 weeks’ gestation (adjusted odds ratio [aOR], 5.49; 95% confidence interval [CI], 3.30–9.15) and periviable delivery, defined as 22 to 25 weeks’ gestation (aOR, 2.81; 95% CI, 1.63–4.85). Retained IUD was not associated with preterm delivery beyond 26 weeks’ gestation, cesarean delivery, postpartum hemorrhage, or hysterectomy.
Important limitations of this study are the lack of information on IUD type (copper vs hormonal) and the timing of removal or attempted removal in relation to measured pregnancy outcomes.
Continue to: Removal of copper IUD improves, but does not eliminate, poor pregnancy outcomes...
Removal of copper IUD improves, but does not eliminate, poor pregnancy outcomes
Karakus and colleagues conducted a retrospective cohort study of 233 patients in Turkey with pregnancies that occurred during copper 380-mm2 IUD use from 2011 to 2021. The authors reported that, at the time of first contact with the health system and diagnosis of retained IUD, 18.9% of the pregnancies were ectopic, 13.2% were first trimester losses, and 67.5% were ongoing pregnancies.
The authors assessed outcomes in patients with ongoing pregnancies based on whether or not the IUD was removed or retained. Outcomes included gestational age at delivery and adverse pregnancy outcomes, assessed as a composite of preterm delivery, PPROM, chorioamnionitis, placental abruption, and postpartum hemorrhage.
Of those with ongoing pregnancies, 13.3% chose to have an abortion, leaving 137 (86.7%) with continuing pregnancy. The IUD was able to be removed in 39.4% of the sample, with an average gestational age of 7 weeks at the time of removal.
Compared with those with a retained IUD, patients in the removal group had a lower rate of pregnancy loss (33.3% vs 61.4%; P<.001) and a lower rate of the composite adverse pregnancy outcomes (53.1% vs 27.8%; P=.03). TABLE 2 shows the approximate rate of ongoing pregnancy by gestational age in patients with retained and removed copper 380-mm2 IUDs. Notably, the largest change occurred periviably, with the proportion of patients with an ongoing pregnancy after 26 weeks reducing to about half for patients with a retained IUD as compared with patients with a removed IUD; this proportion of ongoing pregnancies held through the remainder of gestation.
These studies confirm that a retained IUD is a rare outcome, occurring in about 1 in 8,000 pregnancies. Previous US national data from 2010 reported a similar incidence of 1 in 6,203 pregnancies (0.02%).10 Management and counseling depend on the patient’s desire to continue the pregnancy, gestational age, intrauterine IUD location, and ability to see the IUD strings. Contemporary data support management practices created from limited and outdated data, which include device removal (if able) and counseling those who desire to continue pregnancy about high-risk pregnancy complications. Those with a retained IUD should be counseled about increased risk of preterm or previable delivery, IUFD, and placental abnormalities (including accreta spectrum and retained placenta). Specifically, these contemporary data highlight that, beyond approximately 26 weeks’ gestation, the pregnancy loss rate is not different for those with a retained or removed IUD. Obstetric care providers should feel confident in using this more nuanced risk of extreme preterm delivery when counseling future patients. Implications for antepartum care and delivery timing with a retained IUD have not yet been defined.
Do national data reveal more breakage reports for copper 380-mm2 or LNG IUDs?
Latack KR, Nguyen BT. Trends in copper versus hormonal intrauterine device breakage reporting within the United States’ Food and Drug Administration Adverse Event Reporting System. Contraception. 2023;118:109909. doi:10.1016/j.contraception.2022.10.011
Latack and Nguyen reviewed postmarket surveillance data of IUD adverse events in the US Food and Drug Administration’s (FDA) Adverse Event Reporting System (FAERS) from 1998 to 2022. The FAERS is a voluntary, or passive, reporting system.
Study findings
Of the approximately 170,000 IUD-related adverse events reported to the agency during the 24-year timeframe, 25.4% were for copper IUDs and 74.6% were for hormonal IUDs. Slightly more than 4,000 reports were specific for device breakage, which the authors grouped into copper (copper 380-mm2)and hormonal (LNG 52 mg, 19.5 mg, and 13.5 mg) IUDs.
The copper 380-mm2 IUD was 6.19 times more likely to have a breakage report than hormonal IUDs (9.6% vs 1.7%; 95% CI, 5.87–6.53).
The overall proportion of IUD-related adverse events reported to the FDA was about 25% for copper and 75% for hormonal IUDs; this proportion is similar to sales figures, which show that about 15% of IUDs sold in the United States are copper and 85% are hormonal.11 However, the proportion of breakage events reported to the FDA is the inverse, with about 6 times more breakage reports with copper than with hormonal IUDs. Because these data come from a passive reporting system, the true incidence of IUD breakage cannot be assessed. However, these findings should remind clinicians to inform patients about this rare occurrence during counseling at the time of placement and, especially, when preparing for copper IUD removal. As the absolute number of IUD users increases, clinicians may be more likely to encounter this relatively rare event.
Management of IUD breakage is based on expert opinion, and recommendations are varied, ranging from observation to removal using an IUD hook, alligator forceps, manual vacuum aspiration, or hysteroscopy.7,10 Importantly, each individual patient situation will vary depending on the presence or absence of other symptoms and whether or not future pregnancy is desired.
Continue to: Data support the LNG 52-mg IUD for HMB in nulliparous and obese patients...
Data support the LNG 52-mg IUD for HMB in nulliparous and obese patients
Creinin MD, Barnhart KT, Gawron LM, et al. Heavy menstrual bleeding treatment with a levonorgestrel 52-mg intrauterine device. Obstet Gynecol. 2023;141:971-978. doi:10.1097AOG.0000000000005137
Creinin and colleagues conducted a study for US regulatory product approval of the LNG 52-mg IUD (Liletta) for HMB. This multicenter phase 3 open-label clinical trial recruited nonpregnant participants aged 18 to 50 years with HMB at 29 clinical sites in the United States. No BMI cutoff was used.
Baseline menstrual flow data were obtained over 2 to 3 screening cycles by collection of menstrual products and quantification of blood loss using alkaline hematin measurement. Patients with 2 cycles with a blood loss exceeding 80 mL had an IUD placement, with similar flow evaluations during the third and sixth postplacement cycles.
Treatment success was defined as a reduction in blood loss by more than 50% as compared with baseline (during screening) and measured blood loss of less than 80 mL. The enrolled population (n=105) included 28% nulliparous users, with 49% and 28% of participants having a BMI of 30 kg/m2 or higher and higher than 35 kg/m2, respectively.
Treatment highly successful in reducing blood loss
Participants in this trial had a 93% and a 98% reduction in blood loss at the third and sixth cycles of use, respectively. Additionally, during the sixth cycle of use, 19% of users had no bleeding. Treatment success occurred in about 80% of participants overall and occurred regardless of parity or BMI.
To assess a subjective measure of success, participants were asked to evaluate their menstrual bleeding and dysmenorrhea severity, acceptability, and overall impact on quality of life at 3 time points: during prior typical menses, cycle 3, and cycle 6. At cycle 6, all participants reported significantly improved acceptability of bleeding and uterine pain and, importantly, decreased overall menstrual interference with the ability to complete daily activities (TABLE 3).
IUD expulsion and replacement rates
Although bleeding greatly decreased in all participants, 13% (n=14) discontinued before cycle 6 due to expulsion or IUD-related symptoms, with the majority citing bleeding irregularities. Expulsion occurred in 9% (n=5) of users, with the majority (2/3) occurring in the first 3 months of use and more commonly in obese and/or parous users. About half of participants with expulsion had the IUD replaced during the study. ●
Interestingly, both LNG 52-mg IUDs have been approved in most countries throughout the world for HMB treatment, and only in the United States was one of the products (Liletta) not approved until this past year. The FDA required more stringent trials than had been previously performed for approval outside of the United States. However, a benefit for clinicians is that this phase 3 study provided data in a contemporary US population. Clinicians can feel confident in counseling and offering the LNG 52-mg IUD as a first-line treatment option for patients with HMB, including those who have never been pregnant or have a BMI greater than 35 kg/m2.
Importantly, though, clinicians should be realistic with all patients that this treatment, although highly effective, is not successful for about 20% of patients by about 6 months of use. For those in whom the treatment is beneficial, the quality-of-life improvement is dramatic. Additionally, this study reminds us that expulsion risk in a population primarily using the IUD for HMB, especially if also obese and/or parous, is higher in the first 6 months of use than patients using the method for contraception. Expulsion occurs in 1.6% of contraception users through 6 months of use.12 These data highlight that IUD expulsion risk is not a fixed number, but instead is modified by patient characteristics. Patients should be counseled regarding the appropriate expulsion risk and that the IUD can be safely replaced should expulsion occur.
- Hubacher D, Kavanaugh M. Historical record-setting trends in IUD use in the United States. Contraception. 2018;98:467470. doi:10.1016/j.contraception.2018.05.016
- Kavanaugh ML, Pliskin E. Use of contraception among reproductive-aged women in the United States, 2014 and 2016. F S Rep. 2020;1:83-93. doi:10.1016/j.xfre.2020.06.006
- Jensen JT, Creinin MD. Speroff & Darney’s Clinical Guide to Contraception. 6th ed. Lippincott Williams & Wilkins; 2020:15.
- Jensen JT, Creinin MD. Speroff & Darney’s Clinical Guide to Contraception. 6th ed. Lippincott Williams & Wilkins; 2020:185.
- Ozgu-Erdinc AS, Tasdemir UG, Uygur D, et al. Outcome of intrauterine pregnancies with intrauterine device in place and effects of device location on prognosis. Contraception. 2014;89:426-430. doi:10.1016/j.contraception.2014.01.002
- Brahmi D, Steenland MW, Renner RM, et al. Pregnancy outcomes with an IUD in situ: a systematic review. Contraception. 2012;85:131-139. doi:10.1016/j.contraception . 2011.06.010
- Wilson S, Tan G, Baylson M, et al. Controversies in family planning: how to manage a fractured IUD. Contraception. 2013;88:599-603. doi:10.1016/j.contraception.2013.07.007
- Fulkerson Schaeffer S, Gimovsky AC, Aly H, et al. Pregnancy and delivery with an intrauterine device in situ: outcomes in the National Inpatient Sample Database. J Matern Fetal Neonatal Med. 2019;32:798-803. doi:10.1080/14767058.2017.1 391783
- Mirena. Prescribing information. Bayer HealthCare Pharmaceuticals. Accessed August 22, 2023. https://www .mirena-us.com/pi
- Myo MG, Nguyen BT. Intrauterine device complications and their management. Curr Obstet Gynecol Rep. 2023;12:88-95. doi.org/10.1007/s13669-023-00357-8
- National Center for Health Statistics (NCHS). 2017-2019 National Survey of Family Growth. Public-Use Data File Documentation. CDC National Center for Health Statistics. Accessed August 28, 2023. https://www.cdc.gov/nchs/data /nsfg/NSFG-2017-2019-UG-MainText-508.pdf
- Gilliam ML, Jensen JT, Eisenberg DL, et al. Relationship of parity and prior cesarean delivery to levonorgestrel 52 mg intrauterine system expulsion over 6 years. Contraception. 2021;103:444-449. doi: 10.1016/j.contraception.2021.02.013

Next up in MS trials: More insight into progressive disease
MILAN – , neurologist Jeremy Chataway, MD, PhD, of University College London and Queen Square Multiple Sclerosis Center told colleagues at the 9th Joint ECTRIMS-ACTRIMS meeting.

“They’re all very different, and I think that’s exciting,” he said. “It’s a rich trial environment.”
The problem: At a median of almost 3 years in treatment for primary progressive MS, “we know that about a third of patients will progress despite on being on anti-inflammatory treatment. The same is true for secondary progressive MS. That is the hard core of what we have to think about. We want to improve the efficacy gap between control and active.”
First, Dr. Chataway highlighted the MS-STAT2 trial of simvastatin (Zocor), an inexpensive statin used to lower cholesterol. He is one of the leaders of the 3-year, multicenter, double-blind, randomized, placebo-controlled study, which is testing whether 80-mg daily doses of simvastatin will slow MS progression.
As Dr. Chataway noted, an earlier study – MS-STAT1 – found less brain atrophy in patients who took a high dose of the drug, which was “well tolerated and safe.”
Vascular morbidity drives disability and mortality in MS. “This is low-hanging fruit because we have the tools to do something about it,” he said. “There’s an opportunity here to add into our treatment paradigms across people with MS by actively treating their vascular comorbidity. It will have an effect.”
Recruitment for a trial of this approach is complete, and study results are expected in 2024 and 2025, Dr. Chataway said.
Another new study is exploring the possible effects of the antioxidant lipoic acid, also known as alpha-lipoic acid. As Dr. Chataway noted, a 2017 single-center, randomized, double-blind pilot study of daily oral 1,200 mg lipoic acid versus placebo linked the intervention to a dramatic lowering of brain atrophy – by about 50%.
The new LAPMS study, sponsored by the Veterans Administration, will explore whether lipoic acid affects walking ability, clinical outcome, and brain atrophy, Dr. Chataway said. Results from phase 2 are expected in a year or two, he said.
Dr. Chataway also highlighted one of his own trials, the OCTOPUS study, a multiarm, multistage study that will examine multiple drugs to treat progressive MS. It’s starting with metformin and will look at lipoic acid too, he said.
He also noted the phase 2 CALLIPER trial, which has completed enrollment and expects to provide top-line data in 2025. The multicenter, randomized, double-blind, placebo-controlled will test vidofludimus calcium in patients with progressive MS.
Finally, Dr. Chataway highlighted the randomized, double-blind, placebo-controlled, add-on phase 2 NACPMS trial of n-acetyl cysteine and the phase 1 randomized, double-blind, placebo-controlled trial of SAR443820, a central nervous system penetrant oral RIPK1 inhibitor.
Dr. Chataway discloses grants (UK Multiple Sclerosis Society, National Multiple Sclerosis Society, Efficacy and Mechanism Evaluation Board, Health Technology Assessment, Multiple Sclerosis Trials Collaboration, and Rosetrees Trust), advisory board service (Azadyne, Biogen, Lucid, Janssen, Merck, NervGen, Novartis, and Roche), other support (National Institute of Health Research Support, University College London Hospitals Biomedical Research Centers funding scheme), and serving as an trial investigator (Canadian MS Society, Ionis, Novartis, and Roche).
MILAN – , neurologist Jeremy Chataway, MD, PhD, of University College London and Queen Square Multiple Sclerosis Center told colleagues at the 9th Joint ECTRIMS-ACTRIMS meeting.
“They’re all very different, and I think that’s exciting,” he said. “It’s a rich trial environment.”
The problem: At a median of almost 3 years in treatment for primary progressive MS, “we know that about a third of patients will progress despite on being on anti-inflammatory treatment. The same is true for secondary progressive MS. That is the hard core of what we have to think about. We want to improve the efficacy gap between control and active.”
First, Dr. Chataway highlighted the MS-STAT2 trial of simvastatin (Zocor), an inexpensive statin used to lower cholesterol. He is one of the leaders of the 3-year, multicenter, double-blind, randomized, placebo-controlled study, which is testing whether 80-mg daily doses of simvastatin will slow MS progression.
As Dr. Chataway noted, an earlier study – MS-STAT1 – found less brain atrophy in patients who took a high dose of the drug, which was “well tolerated and safe.”
Vascular morbidity drives disability and mortality in MS. “This is low-hanging fruit because we have the tools to do something about it,” he said. “There’s an opportunity here to add into our treatment paradigms across people with MS by actively treating their vascular comorbidity. It will have an effect.”
Recruitment for a trial of this approach is complete, and study results are expected in 2024 and 2025, Dr. Chataway said.
Another new study is exploring the possible effects of the antioxidant lipoic acid, also known as alpha-lipoic acid. As Dr. Chataway noted, a 2017 single-center, randomized, double-blind pilot study of daily oral 1,200 mg lipoic acid versus placebo linked the intervention to a dramatic lowering of brain atrophy – by about 50%.
The new LAPMS study, sponsored by the Veterans Administration, will explore whether lipoic acid affects walking ability, clinical outcome, and brain atrophy, Dr. Chataway said. Results from phase 2 are expected in a year or two, he said.
Dr. Chataway also highlighted one of his own trials, the OCTOPUS study, a multiarm, multistage study that will examine multiple drugs to treat progressive MS. It’s starting with metformin and will look at lipoic acid too, he said.
He also noted the phase 2 CALLIPER trial, which has completed enrollment and expects to provide top-line data in 2025. The multicenter, randomized, double-blind, placebo-controlled will test vidofludimus calcium in patients with progressive MS.
Finally, Dr. Chataway highlighted the randomized, double-blind, placebo-controlled, add-on phase 2 NACPMS trial of n-acetyl cysteine and the phase 1 randomized, double-blind, placebo-controlled trial of SAR443820, a central nervous system penetrant oral RIPK1 inhibitor.
Dr. Chataway discloses grants (UK Multiple Sclerosis Society, National Multiple Sclerosis Society, Efficacy and Mechanism Evaluation Board, Health Technology Assessment, Multiple Sclerosis Trials Collaboration, and Rosetrees Trust), advisory board service (Azadyne, Biogen, Lucid, Janssen, Merck, NervGen, Novartis, and Roche), other support (National Institute of Health Research Support, University College London Hospitals Biomedical Research Centers funding scheme), and serving as an trial investigator (Canadian MS Society, Ionis, Novartis, and Roche).
AT ECTRIMS 2023

Topical botanical drug coacillium curbs childhood alopecia
Considerable hair regrowth can be achieved in children with alopecia areata with the use of a novel plant-based drug, according to research presented during the first late-breaking news session at the annual congress of the European Academy of Dermatology and Venereology.
(–8.0%), with a significant 31% overall difference (P < .0001).
“Coacillium cutaneous solution was used for the first time for treatment of alopecia areata and also for the first time used in a pediatric population,” the presenting investigator Ulrike Blume-Peytavi, MD, said at the meeting.
“It’s well tolerated, and in fact what is interesting is, it has a durable response, even after treatment discontinuation,” added Dr. Blume-Peytavi, who is the deputy head of the department of dermatology, venereology and allergology at Charité-Universitätsmedizin Berlin.
Backing the botanical?
Paola Pasquali, MD, a dermatologist at Pius Hospital de Valls in Spain, who cochaired the session where the findings were presented, commented, “Thank you for showing that chocolate is great! I knew it. It is fantastic to see how chocolate is used.”
Dr. Pasquali was referring to the coacillium ingredient Theobroma cacao extract. The seeds of T. cacao, or the cocoa tree, are used to make various types of chocolate products. Theobroma cacao is one of four plant extracts that make up coacillium, the others being Allium cepa (onion), Citrus limon (lemon), and Paullinia cupana (guaraná, a source of caffeine).
The four plant extracts are classified as “generally regarded as safe” (GRAS), Dr. Blume-Peytavi observed, noting that the development of coacillium fell under the category of a prescription botanical drug as set out by the U.S. Food and Drug Administration or a herbal medicinal product as set out by the European Medicines Agency.
But how does it work?
The botanical’s mode of action of acting positively on hair follicle cycling and endothelial cell activation was called into question, however, by Emma Guttman-Yassky, MD, PhD, who was in the audience.
She asked, “So how do you explain that, after three large studies with topical JAK inhibitors that did not work actually in alopecia areata because it’s very hard to penetrate the scalp for a topical [drug], this one works?”
Dr. Guttman-Yassky, professor of dermatology and immunology at the Icahn School of Medicine at Mount Sinai, New York, added: “Looking at the ingredients, to me, it seems that it’s more like a DPCP [diphenylcyclopropenone]-like reaction.”
DPCP, which has been used to treat alopecia, purportedly works by stimulating the immune response to target the skin surface – causing an allergic reaction – rather than the hair follicle.
It’s an interesting question as to how a molecule penetrates the hair follicle, and it depends on the size of the molecule, Dr. Blume-Peytavi responded.
“We have done a lot of studies on follicular penetration, and we are quite aware that you need a certain size of the molecule,” she said. Between 14 and 200 nanometers appears to produce “the best penetrators,” she observed.
Dr. Blume-Peytavi commented that even after topical JAK inhibitors are applied, the molecules that penetrate do not remain in the local area for very long, yet still produce an inhibitory signaling effect.
No scalp irritation was seen in the trial, which suggests that coacillium is not working in the same way as DPCP, Dr. Blume-Peytavi countered.
Evaluating efficacy and safety: The RAAINBOW study
Dr. Blume-Peytavi acknowledged that JAK inhibitors were “a tremendous advance in treating severe and very severe alopecia areata,” but because of their benefit-to-risk ratio, there was still an unmet need for new treatments, particularly in children, in whom drug safety is of critical importance.
Having a drug that could be given safely and also have an effect early on in the disease, while it is still at a mild to moderate stage, would be of considerable value, Dr. Blume-Peytavi maintained.
The RAAINBOW study was a randomized, double-blind, phase 2/3 trial conducted at 12 sites in Germany and three other countries between March 2018 and March 2022 to evaluate the efficacy and safety of coacillium in the treatment of children and adolescents with moderate to severe alopecia areata.
In all, 62 children aged 2-18 years (mean age, 11 years) participated; 42 were treated twice daily with coacillium cutaneous solution 22.5% and 20 received placebo for 24 weeks. Treatment was then stopped, and participants followed for another 24 weeks off treatment to check for disease relapse, bringing the total study duration up to 48 weeks.
Baseline characteristics were “relatively comparable for severity,” Dr. Blume-Peytavi said. Most of the children had severe alopecia areata (57% for coacillium and 65% for placebo); the remainder had moderate disease (43% vs. 35%, respectively).
The average SALT scores at the start of treatment were 56 in the coacillium group and 62 in the placebo group, and a respective 44 and 61 at the end of 24 weeks’ treatment.
Perhaps the most important results, Dr. Blume-Peytavi said, was that at 48 weeks of follow-up, which was 24 weeks after treatment had been discontinued, the mean SALT scores were 29 for coacillium and 56 for placebo (P < .0001).
“You can see the improvement in the treated group is continuing even without treatment. However, the placebo group stays relatively about the same range,” she said.
Overall, 82% of patients treated with coacillium and 37% of those who received placebo experienced hair growth after treatment had stopped, and by week 48, a respective 46.7% vs. 9.1% had a SALT score of 20 or less, and 30.0% vs. 0% had a SALT score of 10 or less.
No safety concerns were raised, with no serious treatment-related reactions, no immunosuppressant-like reactions, and no steroidlike side effects.
Beyond the RAAINBOW
Larger studies are needed, Dr. Blume-Peytavi said. According to developer Legacy Healthcare’s website, coacillium cutaneous solution is not being developed just for childhood alopecia areata. It is also under investigation as a treatment for persistent chemotherapy-induced alopecia, atopic dermatitis, and psoriasis. In addition, an oral solution is being tested for cancer-related fatigue.
The study was funded by Legacy Healthcare. Dr. Blume-Peytavi has received research funding and acts as an advisor to the company, among others; four of the study’s coauthors are employees of the company. Dr. Pasquali and Dr. Guttman-Yassky were not involved in the study and had no relevant financial ties to disclose.
A version of this article first appeared on Medscape.com.
AT THE EADV CONGRESS
Cannabis use growing among menopausal women
PHILADELPHIA – presented at the annual meeting of the Menopause Society (formerly The North American Menopause Society).
Though most women reported using cannabis for recreational reasons, 13% used it only for medical reasons, most often for chronic pain, anxiety, sleep, and stress.
“These findings highlight the importance of recognizing and discussing cannabis use in the health care setting, and the need for additional research to evaluate the potential harms and/or benefits of use in this vulnerable population,” Carolyn J. Gibson, PhD, MPH, a staff psychologist in women’s health at the San Francisco VA Health Care System and an assistant professor of psychiatry and behavioral sciences at the University of California, San Francisco, told attendees.
As cannabis has become more accessible, with its use legalized in 38 states and Washington, D.C., the proportion of U.S. adults using it has doubled over about a decade, from 6% in 2007 to 12% in 2019, Dr. Gibson said. Further, women aged 50 and older are among the fastest-growing groups of users of cannabis, and it’s being increasingly used – and marketed – for treating menopause-related and aging-related symptoms, including insomnia, anxiety, and chronic pain, she said.
“With these decisions to use cannabis, medically or for these other purposes, there’s this perception that it’s harmless,” Dr. Gibson said. Yet potential health risks associated with cannabis include the usual health effects associated with any kind of smoking as well as dependence in those who use it more frequently and/or develop a tolerance for it. She noted that average THC potency has increased over time, and acute risks for using cannabis with high levels of THC – at least 15% or at least 10 mg – can include anxiety/panic, confusion, disturbing/intrusive thoughts, psychosis, and effects on coordination and cognition. She also acknowledged, however, that most of the data available on risks come from studies of men and younger adults rather than older women.
Given the growing normalization of cannabis use, Dr. Gibson’s team sought to better understand prevalence of use as well as types of use and reasons for use in perimenopasual and postmenopausal women. They analyzed data from a cross-sectional survey of women and gender-diverse members, aged 45-64, of Ipsos KnowledgePanel, an online panel with more than 60,000 participating members in the United States.
All the respondents identified themselves as female at birth and had not used gender-affirming therapy or undergone gender-affirming surgery. The survey included questions on sociodemographics, menopause status, frequency of cannabis use, types of cannabis used, reasons for using cannabis, and use of cannabis in the previous 30 days. The 5,174 respondents were an average 55 years old and predominantly non-Hispanic white (63%), with 13% non-Hispanic Black and 16% Hispanic. Two-thirds of the women reported working full- or part-time (67%) and two-thirds were postmenopausal (68%), with 64% reporting experiencing menopause symptoms.
About two in five respondents (42%) had ever used cannabis in any form, most often smoking it (83%) or consuming edibles (51%). Among those who had ever used it, 30% reported having smoked it daily or nearly daily for at least a year at some point.
Ten percent of respondents had used cannabis in the past month, again primarily smoking (56%) or edibles (52%), though 39% said they used it in more than one form, including vaping, dabbing, or topical use. Nearly half (46%) of the respondents who smoked cannabis recently did not know the THC potency of what they consumed, and just over 20% of those consuming edibles didn’t know the THC potency of what they used. However, about a third of those taking edibles used cannabis with less than 10 mg of THC, and a little over a quarter used edibles with 10 mg of THC.
Within the 10% who had used cannabis in the past month, nearly a third (31%) of respondents – or around 3.1% of the total sample – reported smoking cannabis daily or almost daily, and 19% (or 1.9% of the overall sample) consumed cannabis edibles daily or almost daily.
Most of the respondents who used cannabis said it was for recreational use (62%), but a quarter (25%) reported using it for both recreational and medical reasons, and 13% used it only for medical reasons. The most common reason women used cannabis was to treat chronic pain (28%), followed by nearly as many women reporting cannabis use for anxiety (24%), sleep (22%), and stress (22%). Six percent of women used cannabis specifically for menopause-related sleep and mood problems.
Given the growing use of cannabis in this population and the dearth of data on its effects in older women, Dr. Gibson highlighted the need for research examining the potential benefits and harms of cannabis for menopausal women.
Not risk-free
Susan D. Reed, MD, MPH, MSCP, a professor emeritus of ob.gyn. at the University of Washington, Seattle, and president of the Menopause Society, found the study well-executed and was not surprised by how many respondents had ever used cannabis.

“What did surprise me was that nearly a third reported daily use for at least 1 year and that 38% were medical marijuana users, not just recreational,” Dr. Reed said in an interview. The proportions of women using cannabis for menopausal symptoms or using it daily are concerning, she added.
“These individuals are at risk for dependence and health risks related to marijuana use,” Dr. Reed said. “Providers should always ask patients about OTC products, herbals, supplements, cannabis use, and alternative management of menopausal symptoms to better understand patient preferences for menopausal symptom therapies, so that treatment plans can be discussed with individual patient preferences in mind. We need to start with where the patient is coming from.”
Data presented throughout the conference has shown how people are “disillusioned with the care they are receiving for menopause,” Dr. Reed added. “It is so difficult to distinguish truth from myths based on information gained through social media, family, and friends, and that often is where most people are getting their information.”
Physicians often have not received adequate training on how to provide people with accurate information about menopause and managing menopausal symptoms, so she advises patients and physicians to visit reliable sites such as the Menopause Society, the Swan Study, and My Menoplan.
The research was funded by the Tobacco-Related Disease Research Program and the Veterans Administration. Dr. Gibson has provided unpaid consultation to Astellas Pharmaceuticals. Dr. Reed has received research support from Bayer and receives royalties from UpToDate.
PHILADELPHIA – presented at the annual meeting of the Menopause Society (formerly The North American Menopause Society).
Though most women reported using cannabis for recreational reasons, 13% used it only for medical reasons, most often for chronic pain, anxiety, sleep, and stress.
“These findings highlight the importance of recognizing and discussing cannabis use in the health care setting, and the need for additional research to evaluate the potential harms and/or benefits of use in this vulnerable population,” Carolyn J. Gibson, PhD, MPH, a staff psychologist in women’s health at the San Francisco VA Health Care System and an assistant professor of psychiatry and behavioral sciences at the University of California, San Francisco, told attendees.
As cannabis has become more accessible, with its use legalized in 38 states and Washington, D.C., the proportion of U.S. adults using it has doubled over about a decade, from 6% in 2007 to 12% in 2019, Dr. Gibson said. Further, women aged 50 and older are among the fastest-growing groups of users of cannabis, and it’s being increasingly used – and marketed – for treating menopause-related and aging-related symptoms, including insomnia, anxiety, and chronic pain, she said.
“With these decisions to use cannabis, medically or for these other purposes, there’s this perception that it’s harmless,” Dr. Gibson said. Yet potential health risks associated with cannabis include the usual health effects associated with any kind of smoking as well as dependence in those who use it more frequently and/or develop a tolerance for it. She noted that average THC potency has increased over time, and acute risks for using cannabis with high levels of THC – at least 15% or at least 10 mg – can include anxiety/panic, confusion, disturbing/intrusive thoughts, psychosis, and effects on coordination and cognition. She also acknowledged, however, that most of the data available on risks come from studies of men and younger adults rather than older women.
Given the growing normalization of cannabis use, Dr. Gibson’s team sought to better understand prevalence of use as well as types of use and reasons for use in perimenopasual and postmenopausal women. They analyzed data from a cross-sectional survey of women and gender-diverse members, aged 45-64, of Ipsos KnowledgePanel, an online panel with more than 60,000 participating members in the United States.
All the respondents identified themselves as female at birth and had not used gender-affirming therapy or undergone gender-affirming surgery. The survey included questions on sociodemographics, menopause status, frequency of cannabis use, types of cannabis used, reasons for using cannabis, and use of cannabis in the previous 30 days. The 5,174 respondents were an average 55 years old and predominantly non-Hispanic white (63%), with 13% non-Hispanic Black and 16% Hispanic. Two-thirds of the women reported working full- or part-time (67%) and two-thirds were postmenopausal (68%), with 64% reporting experiencing menopause symptoms.
About two in five respondents (42%) had ever used cannabis in any form, most often smoking it (83%) or consuming edibles (51%). Among those who had ever used it, 30% reported having smoked it daily or nearly daily for at least a year at some point.
Ten percent of respondents had used cannabis in the past month, again primarily smoking (56%) or edibles (52%), though 39% said they used it in more than one form, including vaping, dabbing, or topical use. Nearly half (46%) of the respondents who smoked cannabis recently did not know the THC potency of what they consumed, and just over 20% of those consuming edibles didn’t know the THC potency of what they used. However, about a third of those taking edibles used cannabis with less than 10 mg of THC, and a little over a quarter used edibles with 10 mg of THC.
Within the 10% who had used cannabis in the past month, nearly a third (31%) of respondents – or around 3.1% of the total sample – reported smoking cannabis daily or almost daily, and 19% (or 1.9% of the overall sample) consumed cannabis edibles daily or almost daily.
Most of the respondents who used cannabis said it was for recreational use (62%), but a quarter (25%) reported using it for both recreational and medical reasons, and 13% used it only for medical reasons. The most common reason women used cannabis was to treat chronic pain (28%), followed by nearly as many women reporting cannabis use for anxiety (24%), sleep (22%), and stress (22%). Six percent of women used cannabis specifically for menopause-related sleep and mood problems.
Given the growing use of cannabis in this population and the dearth of data on its effects in older women, Dr. Gibson highlighted the need for research examining the potential benefits and harms of cannabis for menopausal women.
Not risk-free
Susan D. Reed, MD, MPH, MSCP, a professor emeritus of ob.gyn. at the University of Washington, Seattle, and president of the Menopause Society, found the study well-executed and was not surprised by how many respondents had ever used cannabis.
“What did surprise me was that nearly a third reported daily use for at least 1 year and that 38% were medical marijuana users, not just recreational,” Dr. Reed said in an interview. The proportions of women using cannabis for menopausal symptoms or using it daily are concerning, she added.
“These individuals are at risk for dependence and health risks related to marijuana use,” Dr. Reed said. “Providers should always ask patients about OTC products, herbals, supplements, cannabis use, and alternative management of menopausal symptoms to better understand patient preferences for menopausal symptom therapies, so that treatment plans can be discussed with individual patient preferences in mind. We need to start with where the patient is coming from.”
Data presented throughout the conference has shown how people are “disillusioned with the care they are receiving for menopause,” Dr. Reed added. “It is so difficult to distinguish truth from myths based on information gained through social media, family, and friends, and that often is where most people are getting their information.”
Physicians often have not received adequate training on how to provide people with accurate information about menopause and managing menopausal symptoms, so she advises patients and physicians to visit reliable sites such as the Menopause Society, the Swan Study, and My Menoplan.
The research was funded by the Tobacco-Related Disease Research Program and the Veterans Administration. Dr. Gibson has provided unpaid consultation to Astellas Pharmaceuticals. Dr. Reed has received research support from Bayer and receives royalties from UpToDate.
AT NAMS 2023
Bone degradation measure can sway osteoporosis diagnosis
Assessing a key aspect of bone architecture, for which clinicians can now be reimbursed under Medicare, can significantly improve the ability to predict a patient’s risk for bone fracture.
Although bone mineral density (BMD) is traditionally used to identify patients with osteoporosis or low bone mass, some physicians have begun incorporating the trabecular bone score (TBS) into their exams.
At the Cleveland Clinic Center for Specialized Women’s Health, factoring in the TBS changed the diagnosis for 16% of 432 patients, according to Holly Thacker, MD, the center’s director.
“Importantly, 11% got worse diagnoses, and I use that in terms of prioritizing treatment,” Dr. Thacker said in an interview. The ability to determine how degraded the bone microarchitecture is through a software system “is a huge advance.”
Dr. Thacker described her center’s experience with the technology at the annual meeting of the Menopause Society (formerly The North American Menopause Society).
While BMD captures the amount of minerals like calcium in the skeleton, TBS assesses the underlying microarchitecture by looking at the distribution of shades of gray on dual-energy x-ray absorptiometry (DXA) scans.
Based on the TBS, patients’ bones are classified as normal, partially degraded, or degraded. Among the 432 patients who received a TBS analysis in 2022, 3% shifted from a normal diagnosis to osteopenia, 8% worsened from osteopenia to osteoporosis, 4% went from osteopenia to normal, and 1.6% downgraded from osteoporosis to osteopenia, Dr. Thacker reported.
The new test may also provide some reassurance for female patients who have thinner bones, which may raise alarms based on BMD. TBS, however, may show that the structure of the bone looks normal.
“When you know that the microarchitecture is normal, you’re a lot less concerned that they actually have a bone disease of osteoporosis,” Dr. Thacker said.
Conversely, unexpectedly degraded bone raises questions.
“That makes you go back and say [to the patient]: ‘Have you been on steroids? Were you malnourished? Is there some other metabolic problem? Have you had some calcium disorder?’ ” Dr. Thacker said.
Dr. Thacker leverages the TBS to help patients obtain effective therapy, typically an anabolic agent followed by antiresorptive medication.
“When I see a patient who not only has osteoporosis on bone density but has completely degraded bone architecture, it’s a lot easier for me to make the argument to the insurance company that this patient is at grave risk for a low trauma fracture and bad outcome without the best treatment,” Dr. Thacker said.
10-year-old tech, recently covered
The Food and Drug Administration approved TBS software in 2012, but Medicare only recently started paying for it.
Medimaps Group, a company that markets imaging software to calculate TBS, announced in 2022 that reimbursement from the Centers for Medicare & Medicaid Services was available, at $41.53 on the Physician Fee Schedule and $82.61 on the Hospital Outpatient Prospective Payment Schedule.
“Reimbursement through CMS is an important endorsement of the clinical value of TBS for clinicians and their patients,” Didier Hans, PhD, MBA, the CEO of Medimaps, said in a statement at the time. He noted that more than 600,000 TBS procedures were being performed in the United States each year.
Nevertheless, the initial investment in purchasing the software may be a barrier for health systems.
“We are the first and only site in our health system to offer TBS, as this is an extra expense and not uniformly reimbursed by insurers,” Dr. Thacker reported at the meeting.
Potential drawbacks
The TBS software used in Dr. Thacker’s study has been validated only in Asian and White patients between certain ages and weights, meaning the system is not designed to be used for other populations. Other researchers have highlighted a need for trabecular bone scoring to be validated more broadly. The authors of a recent analysis, however, suggest that TBS can be used the same way no matter a patient’s race.
TBS “is going to be most helpful in those with osteopenia who are right near the threshold for treatment,” said Marcella Donovan Walker, MD, MS, in a presentation on bone quality at the meeting.
Many studies have shown that TBS “provides additive information to bone density,” said Dr. Walker, a professor of medicine in the division of endocrinology at Columbia University, New York. For example, a large study of women in Manitoba found that, regardless of whether their bone density was normal, osteopenic, or osteoporotic, those with a low TBS had a much higher risk for fracture.
‘Opportunistic screening’ with CT?
TBS relies on the same DXA scans that are used to calculate bone mineral density, so obtaining the score does not add time or radiation to the scanning process, Dr. Thacker said.
But many patients who should receive DXA scans do not, which adds to the promise of “opportunistic screening” for osteoporosis, Dr. Walker said. With this approach, physicians would analyze a CT scan that a patient received for another purpose, such as to investigate abdominal pain or chest pain.
“In these images is information about the bone,” Dr. Walker said.
Researchers have used high-resolution peripheral quantitative CT to perform finite element analysis, where a computer program simulates compression of the bone to create a measure of bone stiffness and determine the load required for a break.
One study found that including those elements predicted fractures better than bone mineral density or the Fracture Risk Assessment Tool alone, Dr. Walker noted.
Other aspects of bone quality include how many cracks are in the bone, the amount of adipose in the marrow space, and the rate at which bone is broken down and rebuilt. But Dr. Walker suggested that the longstanding focus on bone mineral density in clinical practice makes sense.
“By far, bone mass is the most important bone quality,” Dr. Walker said.
Dr. Thacker is the executive director of the nonprofit Speaking of Women’s Health. Dr. Walker reported receiving funding from the National Institute of Arthritis and Musculoskeletal and Skin Diseases and Amgen.
A version of this article first appeared on Medscape.com.
FROM NAMS 2023