User login
Association Between Anemia and Fatigue in Hospitalized Patients: Does the Measure of Anemia Matter?
Fatigue is the most common clinical symptom of anemia and is a significant concern to patients.1,2 In ambulatory patients, lower hemoglobin (Hb) concentration is associated with increased fatigue.2,3 Accordingly, therapies that treat anemia by increasing Hb concentration, such as erythropoiesis stimulating agents,4-7 often use fatigue as an outcome measure.
In hospitalized patients, transfusion of red blood cell increases Hb concentration and is the primary treatment for anemia. However, the extent to which transfusion and changes in Hb concentration affect hospitalized patients’ fatigue levels is not well established. Guidelines support transfusing patients with symptoms of anemia, such as fatigue, on the assumption that the increased oxygen delivery will improve the symptoms of anemia. While transfusion studies in hospitalized patients have consistently reported that transfusion at lower or “restrictive” Hb concentrations is safe compared with transfusion at higher Hb concentrations,8-10 these studies have mainly used cardiac events and mortality as outcomes rather than patient symptoms, such as fatigue. Nevertheless, they have resulted in hospitals increasingly adopting restrictive transfusion policies that discourage transfusion at higher Hb levels.11,12 Consequently, the rate of transfusion in hospitalized patients has decreased,13 raising questions of whether some patients with lower Hb concentrations may experience increased fatigue as a result of restrictive transfusion policies. Fatigue among hospitalized patients is important not only because it is an adverse symptom but because it may result in decreased activity levels, deconditioning, and losses in functional status.14,15While the effect of alternative transfusion policies on fatigue in hospitalized patients could be answered by a randomized clinical trial using fatigue and functional status as outcomes, an important first step is to assess whether the Hb concentration of hospitalized patients is associated with their fatigue level during hospitalization. Because hospitalized patients often have acute illnesses that can cause fatigue in and of themselves, it is possible that anemia is not associated with fatigue in hospitalized patients despite anemia’s association with fatigue in ambulatory patients. Additionally, Hb concentration varies during hospitalization,16 raising the question of what measures of Hb during hospitalization might be most associated with anemia-related fatigue.
The objective of this study is to explore multiple Hb measures in hospitalized medical patients with anemia and test whether any of these Hb measures are associated with patients’ fatigue level.
METHODS
Study Design
We performed a prospective, observational study of hospitalized patients with anemia on the general medicine services at The University of Chicago Medical Center (UCMC). The institutional review board approved the study procedures, and all study subjects provided informed consent.
Study Eligibility
Between April 2014 and June 2015, all general medicine inpatients were approached for written consent for The University of Chicago Hospitalist Project,17 a research infrastructure at UCMC. Among patients consenting to participate in the Hospitalist Project, patients were eligible if they had Hb <9 g/dL at any point during their hospitalization and were age ≥50 years. Hb concentration of <9 g/dL was chosen to include the range of Hb values covered by most restrictive transfusion policies.8-10,18 Age ≥50 years was an inclusion criteria because anemia is more strongly associated with poor outcomes, including functional impairment, among older patients compared with younger patients.14,19-21 If patients were not eligible for inclusion at the time of consent for the Hospitalist Project, their Hb values were reviewed twice daily until hospital discharge to assess if their Hb was <9 g/dL. Proxies were sought to answer questions for patients who failed the Short Portable Mental Status Questionnaire.22
Patient Demographic Data Collection
Research assistants abstracted patient age and sex from the electronic health record (EHR), and asked patients to self-identify their race. The individual comorbidities included as part of the Charlson Comorbidity Index were identified using International Classification of Diseases, 9th Revision codes from hospital administrative data for each encounter and specifically included the following: myocardial infarction, congestive heart failure, peripheral vascular disease, cerebrovascular disease, dementia, chronic pulmonary disease, rheumatic disease, peptic ulcer disease, liver disease, diabetes, hemiplegia and/or paraplegia, renal disease, cancer, and human immunodeficiency virus/acquired immunodeficiency syndrome.23 We also used Healthcare Cost and Utilization Project (www.hcup-us.ahrq.gov/toolssoftware/ccs/ccs.jsp) diagnosis categories to identify whether patients had sickle cell (SC) anemia, gastrointestinal bleeding (GIB), or a depressive disorder (DD) because these conditions are associated with anemia (SC and GIB) and fatigue (DD).24
Measuring Anemia
Hb measures were available only when hospital providers ordered them as part of routine practice. The first Hb concentration <9 g/dL during a patient’s hospitalization, which made them eligible for study participation, was obtained through manual review of the EHR. All additional Hb values during the patient’s hospitalization were obtained from the hospital’s administrative data mart. All Hb values collected for each patient during the hospitalization were used to calculate summary measures of Hb during the hospitalization, including the mean Hb, median Hb, minimum Hb, maximum Hb, admission (first recorded) Hb, and discharge (last recorded) Hb. Hb measures were analyzed both as a continuous variable and as a categorical variable created by dividing the continuous Hb measures into integer ranges of 3 groups of approximately the same size.
Measuring Fatigue
Our primary outcome was patients’ level of fatigue reported during hospitalization, measured using the Functional Assessment of Chronic Illness Therapy (FACIT)-Anemia questionnaire. Fatigue was measured using a 13-question fatigue subscale,1,2,25 which measures fatigue within the past 7 days. Scores on the fatigue subscale range from 0 to 52, with lower scores reflecting greater levels of fatigue. As soon as patients met the eligibility criteria for study participation during their hospitalization (age ≥50 years and Hb <9 g/dL), they were approached to answer the FACIT questions. Values for missing data in the fatigue subscale for individual subjects were filled in using a prorated score from their answered questions as long as >50% of the items in the fatigue subscale were answered, in accordance with recommendations for addressing missing data in the FACIT.26 Fatigue was analyzed as a continuous variable and as a dichotomous variable created by dividing the sample into high (FACIT <27) and low (FACIT ≥27) levels of fatigue based on the median FACIT score of the population. Previous literature has shown a FACIT fatigue subscale score between 23 and 26 to be associated with an Eastern Cooperative Oncology Group (ECOG)27 C Performance Status rating of 2 to 33 compared to scores ≥27.
Statistical Analysis
Statistical analysis was performed using Stata statistical software (StataCorp, College Station, Texas). Descriptive statistics were used to characterize patient demographics. Analysis of variance was used to test for differences in the mean fatigue levels across Hb measures. χ2 tests were performed to test for associations between high fatigue levels and the Hb measures. Multivariable analysis, including both linear and logistic regression models, were used to test the association of Hb concentration and fatigue. P values <0.05 using a 2-tailed test were deemed statistically significant.
RESULTS
Patient Characteristics
During the study period, 8559 patients were admitted to the general medicine service. Of those, 5073 (59%) consented for participation in the Hospitalist Project, and 3670 (72%) completed the Hospitalist Project inpatient interview. Of these patients, 1292 (35%) had Hb <9 g/dL, and 784 (61%) were 50 years or older and completed the FACIT questionnaire.
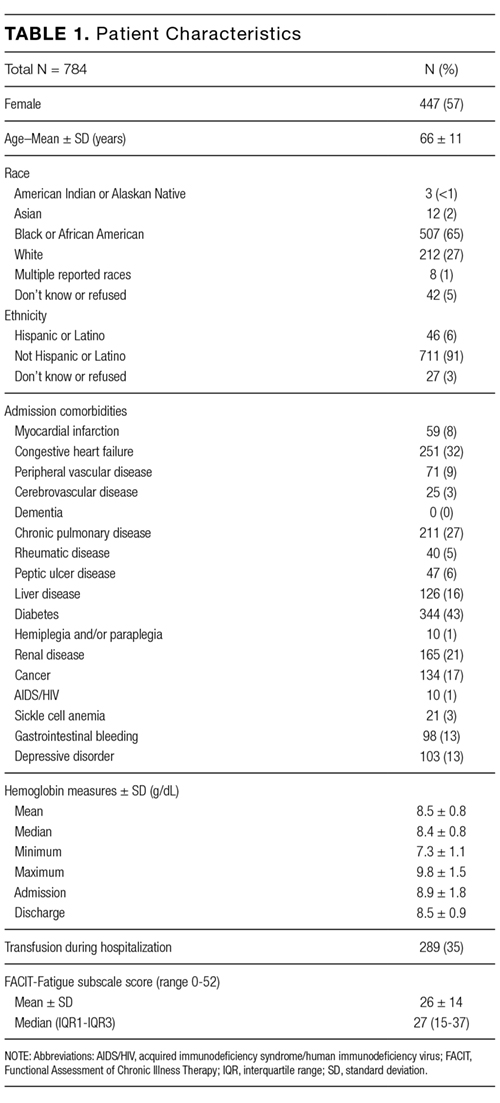
Table 1 reports the demographic characteristics and comorbidities for the sample, the mean (standard deviation [SD]) for the 6 Hb measures, and mean (SD) and median FACIT scores.
Bivariate Association of Fatigue and Hb
Categorizing patients into low, middle, or high Hb for each of the 6 Hb measures, minimum Hb was strongly associated with fatigue, with a weaker association for mean Hb and no statistically significant association for the other measures.
Minimum Hb
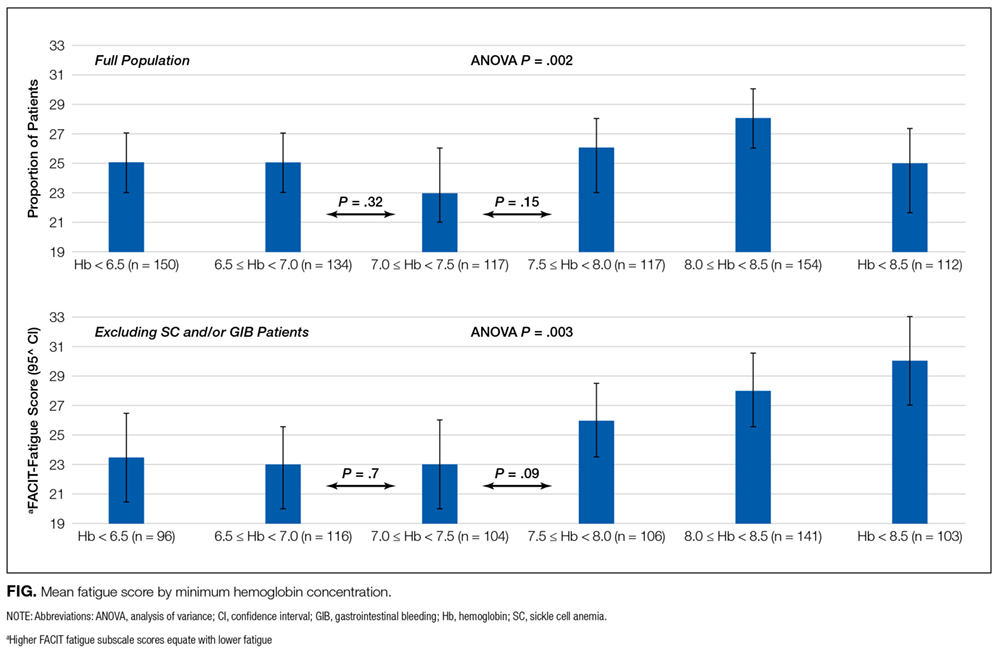
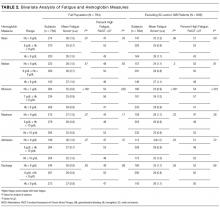
Patients with a minimum Hb <7 g/dL and patients with Hb 7-8 g/dL had higher fatigue levels (FACIT = 25 for each) than patients with a minimum Hb ≥8 g/dL (FACIT = 29; P < 0.001; Table 2). When excluding patients with SC and/or GIB because their average minimum Hb differed from the average minimum Hb of the full population (P < 0.001), patients with a minimum Hb <7 g/dL or 7-8 g/dL had even higher fatigue levels (FACIT = 23 and FACIT = 24, respectively), with no change in the fatigue level of patients with a minimum Hb ≥8 g/dL (FACIT = 29; P < 0.001; Table 2). Lower minimum Hb continued to be associated with higher fatigue levels when analyzed in 0.5 g/dL increments (Figure).
Mean Hb and Other Measures
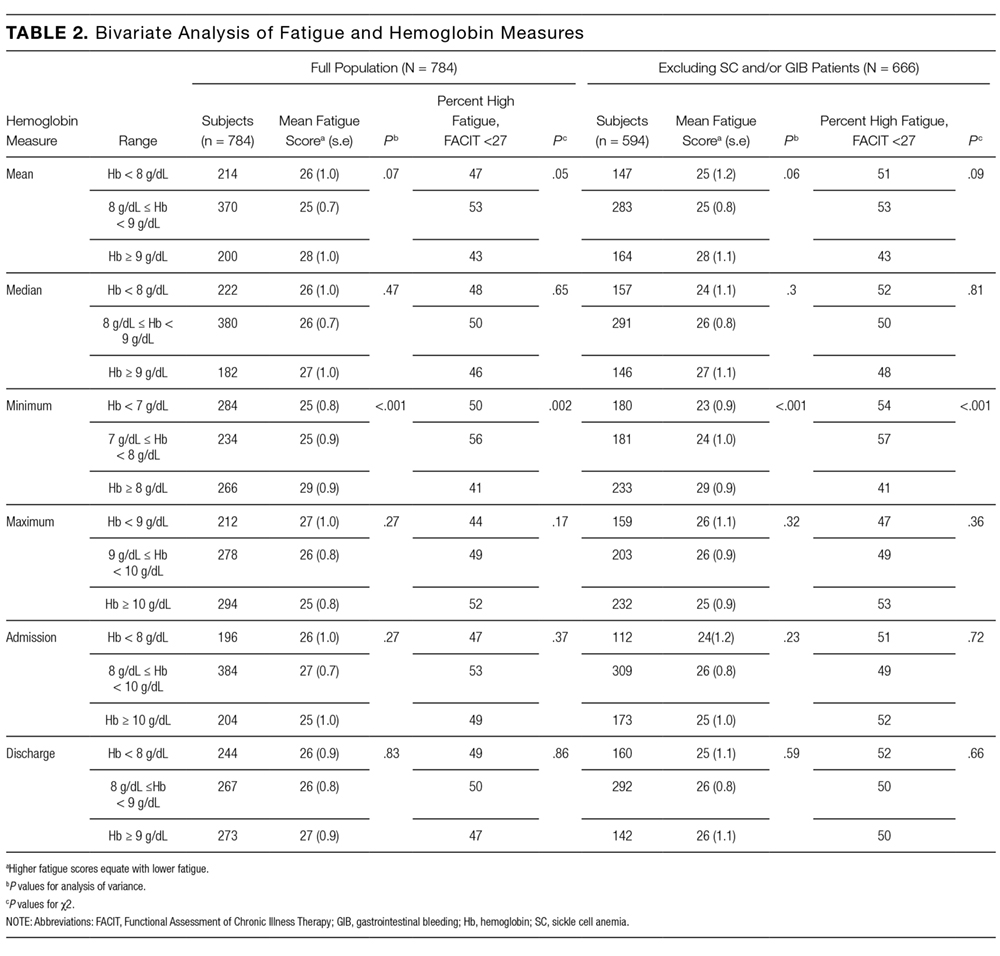
Fatigue levels were high for 47% of patients with a mean Hb <8g /dL and 53% of patients with a mean Hb 8-9 g/dL compared with 43% of patients with a mean Hb ≥9 g/dL (P = 0.05). However, the association between high fatigue and mean Hb was not statistically significant when patients with SC and/or GIB were excluded (Table 2). None of the other 4 Hb measures was significantly associated with fatigue.
Linear Regression of Fatigue on Hb
In linear regression models, minimum Hb consistently predicted patient fatigue, mean Hb had a less robust association with fatigue, and the other Hb measures were not associated with patient fatigue. Increases in minimum Hb (analyzed as a continuous variable) were associated with reduced fatigue (higher FACIT score; β = 1.4; P = 0.005). In models in which minimum Hb was a categorical variable, patients with a minimum Hb of <7 g/dL or 7-8 g/dL had greater fatigue (lower FACIT score) than patients whose minimum Hb was ≥8 g/dL (Hb <7 g/dL: β = −4.2; P ≤ 0.001; Hb 7-8 g/dL: β = −4.1; P < 0.001). These results control for patients’ age, sex, individual comorbidities, and whether their minimum Hb occurred before or after the measurement of fatigue during hospitalization (Model 1), and the results are unchanged when also controlling for the number of Hb laboratory draws patients had during their hospitalization (Model 2; Table 3). In a stratified analysis excluding patients with either SC and/or GIB, changes in minimum Hb were associated with larger changes in patient fatigue levels (Supplemental Table 1). We also stratified our analysis to include only patients whose minimum Hb occurred before the measurement of their fatigue level during hospitalization to avoid a spurious association of fatigue with minimum Hb occurring after fatigue was measured. In both Models 1 and 2, minimum Hb remained a predictor of patients’ fatigue levels with similar effect sizes, although in Model 2, the results did not quite reach a statistically significant level, in part due to larger confidence intervals from the smaller sample size of this stratified analysis (Supplemental Table 2a). We further stratified this analysis to include only patients whose transfusion, if they received one, occurred after their minimum Hb and the measurement of their fatigue level to account for the possibility that a transfusion could affect the fatigue level patients report. In this analysis, most of the estimates of the effect of minimum Hb on fatigue were larger than those seen when only analyzing patients whose minimum Hb occurred before the measurement of their fatigue level, although again, the smaller sample size of this additional stratified analysis does produce larger confidence intervals for these estimates (Supplemental Table 2b).
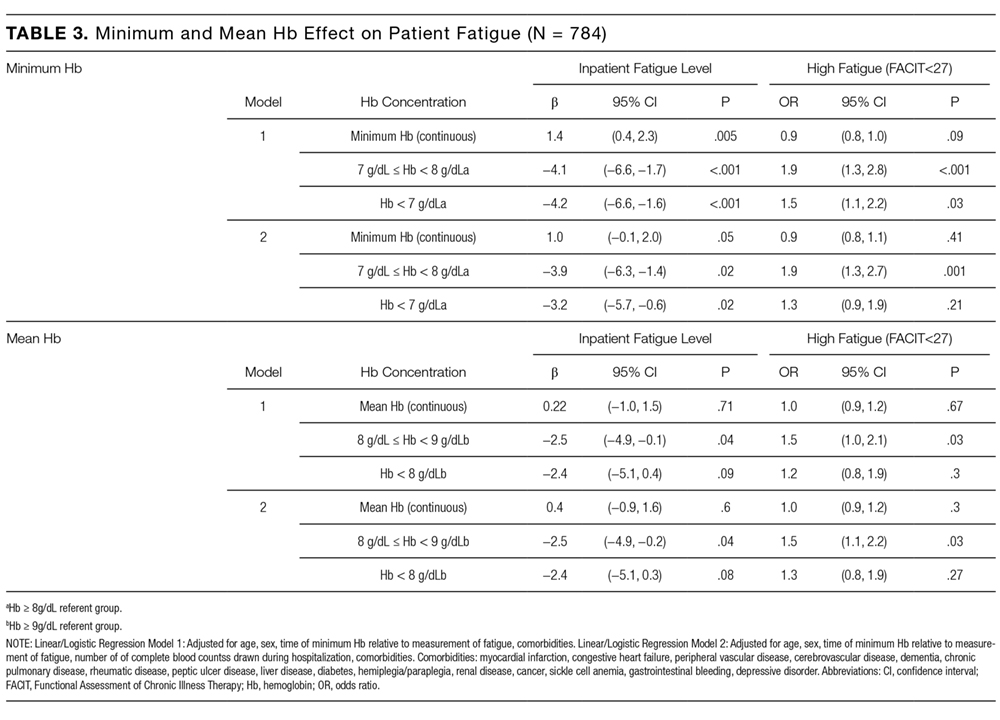
No Hb measure other than minimum or mean had significant association with patient fatigue levels in linear regression models.
Logistic Regression of High Fatigue Level on Hb
Using logistic regression, minimum Hb analyzed as a categorical variable predicted increased odds of a high fatigue level. Patients with a minimum Hb <7 g/dL were 50% (odds ratio [OR] = 1.5; P = 0.03) more likely to have high fatigue and patients with a minimum Hb 7-8 g/dL were 90% (OR = 1.9; P < 0.001) more likely to have high fatigue compared with patients with a minimum Hb ≥8 g/dL in Model 1. These results were similar in Model 2, although the effect was only statistically significant in the 7-8 g/dL Hb group (Table 3). When excluding SC and/or GIB patients, the odds of having high fatigue as minimum Hb decreased were the same or higher for both models compared to the full population of patients. However, again, in Model 2, the effect was only statistically significant in the 7-8 g/dL Hb group (Supplemental Table 1).
Patients with a mean Hb <8 g/dL were 20% to 30% more likely to have high fatigue and patients with mean Hb 8-9 g/dL were 50% more likely to have high fatigue compared with patients with a mean Hb ≥9 g/dL, but the effects were only statistically significant for patients with a mean Hb 8-9 g/dL in both Models 1 and 2 (Table 3). These results were similar when excluding patients with SC and/or GIB, but they were only significant for patients with a mean Hb 8-9 g/dL in Model 1 and patients with a mean Hb <8 g/dL in the Model 2 (Supplemental Table 3).
DISCUSSION
These results demonstrate that minimum Hb during hospitalization is associated with fatigue in hospitalized patients age ≥50 years, and the association is stronger among patients without SC and/or GIB as comorbidities. The analysis of Hb as a continuous and categorical variable and the use of both linear and logistic regression models support the robustness of these associations and illuminate their clinical significance. For example, in linear regression with minimum Hb a continuous variable, the coefficient of 1.4 suggests that an increase of 2 g/dL in Hb, as might be expected from transfusion of 2 units of red blood cells, would be associated with about a 3-point improvement in fatigue. Additionally, as a categorical variable, a minimum Hb ≥8 g/dL compared with a minimum Hb <7 g/dL or 7-8 g/dL is associated with a 3- to 4-point improvement in fatigue. Previous literature suggests that a difference of 3 in the FACIT score is the minimum clinically important difference in fatigue,3 and changes in minimum Hb in either model predict changes in fatigue that are in the range of potential clinical significance.
The clinical significance of the findings is also reflected in the results of the logistic regressions, which may be mapped to potential effects on functional status. Specifically, the odds of having a high fatigue level (FACIT <27) increase 90% for persons with a minimum Hb 7–8 g/dL compared with persons with a minimum Hb ≥8 g/dL. For persons with a minimum Hb <7 g/dL, point estimates suggest a smaller (50%) increase in the odds of high fatigue, but the 95% confidence interval overlaps heavily with the estimate of patients whose minimum Hb is 7-8 g/dL. While it might be expected that patients with a minimum Hb <7 g/dL have greater levels of fatigue compared with patients with a minimum Hb 7-8 g/dL, we did not observe such a pattern. One reason may be that the confidence intervals of our estimated effects are wide enough that we cannot exclude such a pattern. Another possible explanation is that in both groups, the fatigue levels are sufficiently severe, such that the difference in their fatigue levels may not be clinically meaningful. For example, a FACIT score of 23 to 26 has been shown to be associated with an ECOG performance status of 2 to 3, requiring bed rest for at least part of the day.3 Therefore, patients with a minimum Hb 7-8 g/dL (mean FACIT score = 24; Table 2) or a minimum Hb of <7 g/dL (mean FACIT score = 23; Table 2) are already functionally limited to the point of being partially bed bound, such that further decreases in their Hb may not produce additional fatigue in part because they reduce their activity sufficiently to prevent an increase in fatigue. In such cases, the potential benefits of increased Hb may be better assessed by measuring fatigue in response to a specific and provoked activity level, a concept known as fatigability.20
That minimum Hb is more strongly associated with fatigue than any other measure of Hb during hospitalization may not be surprising. Mean, median, maximum, and discharge Hb may all be affected by transfusion during hospitalization that could affect fatigue. Admission Hb may not reflect true oxygen-carrying capacity because of hemoconcentration.
The association between Hb and fatigue in hospitalized patients is important because increased fatigue could contribute to slower clinical recovery in hospitalized patients. Additionally, increased fatigue during hospitalization and at hospital discharge could exacerbate the known deleterious consequences of fatigue on patients and their health outcomes14,15 after hospital discharge. Although one previous study, the Functional Outcomes in Cardiovascular Patients Undergoing Surgical Hip Fracture Repair (FOCUS)8 trial, did not report differences in patients’ fatigue levels at 30 and 60 days postdischarge when transfused at restrictive (8 g/dL) compared with liberal (10 g/dL) Hb thresholds, confidence in the validity of this finding is reduced by the fact that more than half of the patients were lost to follow-up at the 30- and 60-day time points. Further, patients in the restrictive transfusion arm of FOCUS were transfused to maintain Hb levels at or above 8 g/dL. This transfusion threshold of 8 g/dL may have mitigated the high levels of fatigue that are seen in our study when patients’ Hb drops below 8 g/dL, and maintaining a Hb level of 7 g/dL is now the standard of care in stable hospitalized patients. Lastly, FOCUS was limited to postoperative hip fracture patients, and the generalizability of FOCUS to hospitalized medicine patients with anemia is limited.
Therefore, our results support guideline suggestions that practitioners incorporate the presence of patient symptoms such as fatigue into transfusion decisions, particularly if patients’ Hb is <8 g/dL.18 Though reasonable, the suggestion to incorporate symptoms such as fatigue into transfusion decisions has not been strongly supported by evidence so far, and it may often be neglected in practice. Definitive evidence to support such recommendations would benefit from study through an optimal trial18 that incorporates symptoms into decision making. Our findings add support for a study of transfusion strategies that incorporates patients’ fatigue level in addition to Hb concentration.
This study has several limitations. Although our sample size is large and includes patients with a range of comorbidities that we believe are representative of hospitalized general medicine patients, as a single-center, observational study, our results may not be generalizable to other centers. Additionally, although these data support a reliable association between hospitalized patients’ minimum Hb and fatigue level, the observational design of this study cannot prove that this relationship is causal. Also, patients’ Hb values were measured at the discretion of their clinician, and therefore, the measures of Hb were not uniformly measured for participating patients. In addition, fatigue was only measured at one time point during a patient’s hospitalization, and it is possible that patients’ fatigue levels change during hospitalization in relation to variables we did not consider. Finally, our study was not designed to assess the association of Hb with longer-term functional outcomes, which may be of greater concern than fatigue.
CONCLUSION
In hospitalized patients ≥50 years old, minimum Hb is reliably associated with patients’ fatigue level. Patients whose minimum Hb is <8 g/dL experience higher fatigue levels compared to patients whose minimum Hb is ≥8 g/dL. Additional studies are warranted to understand if patients may benefit from improved fatigue levels by correcting their anemia through transfusion.
Disclosure
Dr. Prochaska is supported by an Agency for Healthcare Research and Quality Patient-Centered Outcomes Research Institutional K12 Award (1K12HS023007-01, principal investigator Meltzer). Dr. Meltzer is supported by a National Institutes of Health Clinical and Translational Science Award (2UL1TR000430-06, principal investigator Solway) and a grant from the Patient-Centered Outcomes Research Network in support of the Chicago Patient-Centered Outcomes Research Network. The authors report no conflicts of interest.
1. Yellen SB, Cella DF, Webster K, Blendowski C, Kaplan E. Measuring fatigue and other anemia-related symptoms with the Functional Assessment of Cancer Therapy (FACT) measurement system. J Pain Symptom Manage. 1997;13(2):63-74. PubMed
2. Cella D, Lai JS, Chang CH, Peterman A, Slavin M. Fatigue in cancer patients compared with fatigue in the general United States population. Cancer. 2002;94(2):528-538. doi:10.1002/cncr.10245. PubMed
3. Cella D, Eton DT, Lai J-S, Peterman AH, Merkel DE. Combining anchor and distribution-based methods to derive minimal clinically important differences on the Functional Assessment of Cancer Therapy (FACT) anemia and fatigue scales. J Pain Symptom Manage. 2002;24(6):547-561. PubMed
4. Tonelli M, Hemmelgarn B, Reiman T, et al. Benefits and harms of erythropoiesis-stimulating agents for anemia related to cancer: a meta-analysis. CMAJ Can Med Assoc J J Assoc Medicale Can. 2009;180(11):E62-E71. doi:10.1503/cmaj.090470. PubMed
5. Foley RN, Curtis BM, Parfrey PS. Erythropoietin Therapy, Hemoglobin Targets, and Quality of Life in Healthy Hemodialysis Patients: A Randomized Trial. Clin J Am Soc Nephrol. 2009;4(4):726-733. doi:10.2215/CJN.04950908. PubMed
6. Keown PA, Churchill DN, Poulin-Costello M, et al. Dialysis patients treated with Epoetin alfa show improved anemia symptoms: A new analysis of the Canadian Erythropoietin Study Group trial. Hemodial Int Int Symp Home Hemodial. 2010;14(2):168-173. doi:10.1111/j.1542-4758.2009.00422.x. PubMed
7. Palmer SC, Saglimbene V, Mavridis D, et al. Erythropoiesis-stimulating agents for anaemia in adults with chronic kidney disease: a network meta-analysis. Cochrane Database Syst Rev. 2014:CD010590. PubMed
8. Carson JL, Terrin ML, Noveck H, et al. Liberal or Restrictive Transfusion in high-risk patients after hip surgery. N Engl J Med. 2011;365(26):2453-2462. doi:10.1056/NEJMoa1012452. PubMed
9. Holst LB, Haase N, Wetterslev J, et al. Transfusion requirements in septic shock (TRISS) trial – comparing the effects and safety of liberal versus restrictive red blood cell transfusion in septic shock patients in the ICU: protocol for a randomised controlled trial. Trials. 2013;14:150. doi:10.1186/1745-6215-14-150. PubMed
10. Hébert PC, Wells G, Blajchman MA, et al. A multicenter, randomized, controlled clinical trial of transfusion requirements in critical care. N Engl J Med. 1999;340(6):409-417. doi:10.1056/NEJM199902113400601. PubMed
11. Corwin HL, Theus JW, Cargile CS, Lang NP. Red blood cell transfusion: Impact of an education program and a clinical guideline on transfusion practice. J Hosp Med. 2014;9(12):745-749. doi:10.1002/jhm.2237. PubMed
12. Saxena, S, editor. The Transfusion Committee: Putting Patient Safety First, 2nd Edition. Bethesda (MD): American Association of Blood Banks; 2013.
13. The 2011 National Blood Collection and Utilization Report. http://www.hhs.gov/ash/bloodsafety/2011-nbcus.pdf. Accessed August 16, 2017.
14. Vestergaard S, Nayfield SG, Patel KV, et al. Fatigue in a Representative Population of Older Persons and Its Association With Functional Impairment, Functional Limitation, and Disability. J Gerontol A Biol Sci Med Sci. 2009;64A(1):76-82. doi:10.1093/gerona/gln017. PubMed
15. Gill TM, Desai MM, Gahbauer EA, Holford TR, Williams CS. Restricted activity among community-living older persons: incidence, precipitants, and health care utilization. Ann Intern Med. 2001;135(5):313-321. PubMed
16. Koch CG, Li L, Sun Z, et al. Hospital-acquired anemia: Prevalence, outcomes, and healthcare implications. J Hosp Med. 2013;8(9):506-512. doi:10.1002/jhm.2061. PubMed
17. Meltzer D, Manning WG, Morrison J, et al. Effects of Physician Experience on Costs and Outcomes on an Academic General Medicine Service: Results of a Trial of Hospitalists. Ann Intern Med. 2002;137(11):866-874. doi:10.7326/0003-4819-137-11-200212030-00007. PubMed
18. Carson JL, Grossman BJ, Kleinman S, et al. Red Blood Cell Transfusion: A Clinical Practice Guideline From the AABB*. Ann Intern Med. 2012;157(1):49-58. doi:10.7326/0003-4819-157-1-201206190-00429. PubMed
19. Moreh E, Jacobs JM, Stessman J. Fatigue, function, and mortality in older adults. J Gerontol A Biol Sci Med Sci. 2010;65(8):887-895. doi:10.1093/gerona/glq064. PubMed
20. Eldadah BA. Fatigue and Fatigability in Older Adults. PM&R. 2010;2(5):406-413. doi:10.1016/j.pmrj.2010.03.022. PubMed
21. Hardy SE, Studenski SA. Fatigue Predicts Mortality among Older Adults. J Am Geriatr Soc. 2008;56(10):1910-1914. doi:10.1111/j.1532-5415.2008.01957.x. PubMed
22. Pfeiffer E. A short portable mental status questionnaire for the assessment of organic brain deficit in elderly patients. J Am Geriatr Soc. 1975;23(10):433-441. PubMed
23. Quan H, Sundararajan V, Halfon P, et al. Coding algorithms for defining comorbidities in ICD-9-CM and ICD-10 administrative data. Med Care. 2005;43(11):1130-1139. PubMed
24. HCUP Clinical Classifications Software (CCS) for ICD-9-CM. Healthcare Cost and Utilization Project (HCUP). 2006-2009. Agency for Healthcare Research and Quality, Rockville, MD. https://www.hcup-us.ahrq.gov/toolssoftware/ccs/ccs.jsp. Accessed November 22, 2016.
25. Cella DF, Tulsky DS, Gray G, et al. The Functional Assessment of Cancer Therapy scale: development and validation of the general measure. J Clin Oncol Off J Am Soc Clin Oncol. 1993;11(3):570-579. PubMed
26. Webster K, Cella D, Yost K. The Functional Assessment of Chronic Illness Therapy (FACIT) Measurement System: properties, applications, and interpretation. Health Qual Life Outcomes. 2003;1:79. doi:10.1186/1477-7525-1-79. PubMed
27. Oken MMMD a, Creech RHMD b, Tormey DCMD, et al. Toxicity and response criteria of the Eastern Cooperative Oncology Group. J Clin Oncol. 1982;5(6):649-656. PubMed
Fatigue is the most common clinical symptom of anemia and is a significant concern to patients.1,2 In ambulatory patients, lower hemoglobin (Hb) concentration is associated with increased fatigue.2,3 Accordingly, therapies that treat anemia by increasing Hb concentration, such as erythropoiesis stimulating agents,4-7 often use fatigue as an outcome measure.
In hospitalized patients, transfusion of red blood cell increases Hb concentration and is the primary treatment for anemia. However, the extent to which transfusion and changes in Hb concentration affect hospitalized patients’ fatigue levels is not well established. Guidelines support transfusing patients with symptoms of anemia, such as fatigue, on the assumption that the increased oxygen delivery will improve the symptoms of anemia. While transfusion studies in hospitalized patients have consistently reported that transfusion at lower or “restrictive” Hb concentrations is safe compared with transfusion at higher Hb concentrations,8-10 these studies have mainly used cardiac events and mortality as outcomes rather than patient symptoms, such as fatigue. Nevertheless, they have resulted in hospitals increasingly adopting restrictive transfusion policies that discourage transfusion at higher Hb levels.11,12 Consequently, the rate of transfusion in hospitalized patients has decreased,13 raising questions of whether some patients with lower Hb concentrations may experience increased fatigue as a result of restrictive transfusion policies. Fatigue among hospitalized patients is important not only because it is an adverse symptom but because it may result in decreased activity levels, deconditioning, and losses in functional status.14,15While the effect of alternative transfusion policies on fatigue in hospitalized patients could be answered by a randomized clinical trial using fatigue and functional status as outcomes, an important first step is to assess whether the Hb concentration of hospitalized patients is associated with their fatigue level during hospitalization. Because hospitalized patients often have acute illnesses that can cause fatigue in and of themselves, it is possible that anemia is not associated with fatigue in hospitalized patients despite anemia’s association with fatigue in ambulatory patients. Additionally, Hb concentration varies during hospitalization,16 raising the question of what measures of Hb during hospitalization might be most associated with anemia-related fatigue.
The objective of this study is to explore multiple Hb measures in hospitalized medical patients with anemia and test whether any of these Hb measures are associated with patients’ fatigue level.
METHODS
Study Design
We performed a prospective, observational study of hospitalized patients with anemia on the general medicine services at The University of Chicago Medical Center (UCMC). The institutional review board approved the study procedures, and all study subjects provided informed consent.
Study Eligibility
Between April 2014 and June 2015, all general medicine inpatients were approached for written consent for The University of Chicago Hospitalist Project,17 a research infrastructure at UCMC. Among patients consenting to participate in the Hospitalist Project, patients were eligible if they had Hb <9 g/dL at any point during their hospitalization and were age ≥50 years. Hb concentration of <9 g/dL was chosen to include the range of Hb values covered by most restrictive transfusion policies.8-10,18 Age ≥50 years was an inclusion criteria because anemia is more strongly associated with poor outcomes, including functional impairment, among older patients compared with younger patients.14,19-21 If patients were not eligible for inclusion at the time of consent for the Hospitalist Project, their Hb values were reviewed twice daily until hospital discharge to assess if their Hb was <9 g/dL. Proxies were sought to answer questions for patients who failed the Short Portable Mental Status Questionnaire.22
Patient Demographic Data Collection
Research assistants abstracted patient age and sex from the electronic health record (EHR), and asked patients to self-identify their race. The individual comorbidities included as part of the Charlson Comorbidity Index were identified using International Classification of Diseases, 9th Revision codes from hospital administrative data for each encounter and specifically included the following: myocardial infarction, congestive heart failure, peripheral vascular disease, cerebrovascular disease, dementia, chronic pulmonary disease, rheumatic disease, peptic ulcer disease, liver disease, diabetes, hemiplegia and/or paraplegia, renal disease, cancer, and human immunodeficiency virus/acquired immunodeficiency syndrome.23 We also used Healthcare Cost and Utilization Project (www.hcup-us.ahrq.gov/toolssoftware/ccs/ccs.jsp) diagnosis categories to identify whether patients had sickle cell (SC) anemia, gastrointestinal bleeding (GIB), or a depressive disorder (DD) because these conditions are associated with anemia (SC and GIB) and fatigue (DD).24
Measuring Anemia
Hb measures were available only when hospital providers ordered them as part of routine practice. The first Hb concentration <9 g/dL during a patient’s hospitalization, which made them eligible for study participation, was obtained through manual review of the EHR. All additional Hb values during the patient’s hospitalization were obtained from the hospital’s administrative data mart. All Hb values collected for each patient during the hospitalization were used to calculate summary measures of Hb during the hospitalization, including the mean Hb, median Hb, minimum Hb, maximum Hb, admission (first recorded) Hb, and discharge (last recorded) Hb. Hb measures were analyzed both as a continuous variable and as a categorical variable created by dividing the continuous Hb measures into integer ranges of 3 groups of approximately the same size.
Measuring Fatigue
Our primary outcome was patients’ level of fatigue reported during hospitalization, measured using the Functional Assessment of Chronic Illness Therapy (FACIT)-Anemia questionnaire. Fatigue was measured using a 13-question fatigue subscale,1,2,25 which measures fatigue within the past 7 days. Scores on the fatigue subscale range from 0 to 52, with lower scores reflecting greater levels of fatigue. As soon as patients met the eligibility criteria for study participation during their hospitalization (age ≥50 years and Hb <9 g/dL), they were approached to answer the FACIT questions. Values for missing data in the fatigue subscale for individual subjects were filled in using a prorated score from their answered questions as long as >50% of the items in the fatigue subscale were answered, in accordance with recommendations for addressing missing data in the FACIT.26 Fatigue was analyzed as a continuous variable and as a dichotomous variable created by dividing the sample into high (FACIT <27) and low (FACIT ≥27) levels of fatigue based on the median FACIT score of the population. Previous literature has shown a FACIT fatigue subscale score between 23 and 26 to be associated with an Eastern Cooperative Oncology Group (ECOG)27 C Performance Status rating of 2 to 33 compared to scores ≥27.
Statistical Analysis
Statistical analysis was performed using Stata statistical software (StataCorp, College Station, Texas). Descriptive statistics were used to characterize patient demographics. Analysis of variance was used to test for differences in the mean fatigue levels across Hb measures. χ2 tests were performed to test for associations between high fatigue levels and the Hb measures. Multivariable analysis, including both linear and logistic regression models, were used to test the association of Hb concentration and fatigue. P values <0.05 using a 2-tailed test were deemed statistically significant.
RESULTS
Patient Characteristics
During the study period, 8559 patients were admitted to the general medicine service. Of those, 5073 (59%) consented for participation in the Hospitalist Project, and 3670 (72%) completed the Hospitalist Project inpatient interview. Of these patients, 1292 (35%) had Hb <9 g/dL, and 784 (61%) were 50 years or older and completed the FACIT questionnaire.
Table 1 reports the demographic characteristics and comorbidities for the sample, the mean (standard deviation [SD]) for the 6 Hb measures, and mean (SD) and median FACIT scores.
Bivariate Association of Fatigue and Hb
Categorizing patients into low, middle, or high Hb for each of the 6 Hb measures, minimum Hb was strongly associated with fatigue, with a weaker association for mean Hb and no statistically significant association for the other measures.
Minimum Hb
Patients with a minimum Hb <7 g/dL and patients with Hb 7-8 g/dL had higher fatigue levels (FACIT = 25 for each) than patients with a minimum Hb ≥8 g/dL (FACIT = 29; P < 0.001; Table 2). When excluding patients with SC and/or GIB because their average minimum Hb differed from the average minimum Hb of the full population (P < 0.001), patients with a minimum Hb <7 g/dL or 7-8 g/dL had even higher fatigue levels (FACIT = 23 and FACIT = 24, respectively), with no change in the fatigue level of patients with a minimum Hb ≥8 g/dL (FACIT = 29; P < 0.001; Table 2). Lower minimum Hb continued to be associated with higher fatigue levels when analyzed in 0.5 g/dL increments (Figure).
Mean Hb and Other Measures
Fatigue levels were high for 47% of patients with a mean Hb <8g /dL and 53% of patients with a mean Hb 8-9 g/dL compared with 43% of patients with a mean Hb ≥9 g/dL (P = 0.05). However, the association between high fatigue and mean Hb was not statistically significant when patients with SC and/or GIB were excluded (Table 2). None of the other 4 Hb measures was significantly associated with fatigue.
Linear Regression of Fatigue on Hb
In linear regression models, minimum Hb consistently predicted patient fatigue, mean Hb had a less robust association with fatigue, and the other Hb measures were not associated with patient fatigue. Increases in minimum Hb (analyzed as a continuous variable) were associated with reduced fatigue (higher FACIT score; β = 1.4; P = 0.005). In models in which minimum Hb was a categorical variable, patients with a minimum Hb of <7 g/dL or 7-8 g/dL had greater fatigue (lower FACIT score) than patients whose minimum Hb was ≥8 g/dL (Hb <7 g/dL: β = −4.2; P ≤ 0.001; Hb 7-8 g/dL: β = −4.1; P < 0.001). These results control for patients’ age, sex, individual comorbidities, and whether their minimum Hb occurred before or after the measurement of fatigue during hospitalization (Model 1), and the results are unchanged when also controlling for the number of Hb laboratory draws patients had during their hospitalization (Model 2; Table 3). In a stratified analysis excluding patients with either SC and/or GIB, changes in minimum Hb were associated with larger changes in patient fatigue levels (Supplemental Table 1). We also stratified our analysis to include only patients whose minimum Hb occurred before the measurement of their fatigue level during hospitalization to avoid a spurious association of fatigue with minimum Hb occurring after fatigue was measured. In both Models 1 and 2, minimum Hb remained a predictor of patients’ fatigue levels with similar effect sizes, although in Model 2, the results did not quite reach a statistically significant level, in part due to larger confidence intervals from the smaller sample size of this stratified analysis (Supplemental Table 2a). We further stratified this analysis to include only patients whose transfusion, if they received one, occurred after their minimum Hb and the measurement of their fatigue level to account for the possibility that a transfusion could affect the fatigue level patients report. In this analysis, most of the estimates of the effect of minimum Hb on fatigue were larger than those seen when only analyzing patients whose minimum Hb occurred before the measurement of their fatigue level, although again, the smaller sample size of this additional stratified analysis does produce larger confidence intervals for these estimates (Supplemental Table 2b).
No Hb measure other than minimum or mean had significant association with patient fatigue levels in linear regression models.
Logistic Regression of High Fatigue Level on Hb
Using logistic regression, minimum Hb analyzed as a categorical variable predicted increased odds of a high fatigue level. Patients with a minimum Hb <7 g/dL were 50% (odds ratio [OR] = 1.5; P = 0.03) more likely to have high fatigue and patients with a minimum Hb 7-8 g/dL were 90% (OR = 1.9; P < 0.001) more likely to have high fatigue compared with patients with a minimum Hb ≥8 g/dL in Model 1. These results were similar in Model 2, although the effect was only statistically significant in the 7-8 g/dL Hb group (Table 3). When excluding SC and/or GIB patients, the odds of having high fatigue as minimum Hb decreased were the same or higher for both models compared to the full population of patients. However, again, in Model 2, the effect was only statistically significant in the 7-8 g/dL Hb group (Supplemental Table 1).
Patients with a mean Hb <8 g/dL were 20% to 30% more likely to have high fatigue and patients with mean Hb 8-9 g/dL were 50% more likely to have high fatigue compared with patients with a mean Hb ≥9 g/dL, but the effects were only statistically significant for patients with a mean Hb 8-9 g/dL in both Models 1 and 2 (Table 3). These results were similar when excluding patients with SC and/or GIB, but they were only significant for patients with a mean Hb 8-9 g/dL in Model 1 and patients with a mean Hb <8 g/dL in the Model 2 (Supplemental Table 3).
DISCUSSION
These results demonstrate that minimum Hb during hospitalization is associated with fatigue in hospitalized patients age ≥50 years, and the association is stronger among patients without SC and/or GIB as comorbidities. The analysis of Hb as a continuous and categorical variable and the use of both linear and logistic regression models support the robustness of these associations and illuminate their clinical significance. For example, in linear regression with minimum Hb a continuous variable, the coefficient of 1.4 suggests that an increase of 2 g/dL in Hb, as might be expected from transfusion of 2 units of red blood cells, would be associated with about a 3-point improvement in fatigue. Additionally, as a categorical variable, a minimum Hb ≥8 g/dL compared with a minimum Hb <7 g/dL or 7-8 g/dL is associated with a 3- to 4-point improvement in fatigue. Previous literature suggests that a difference of 3 in the FACIT score is the minimum clinically important difference in fatigue,3 and changes in minimum Hb in either model predict changes in fatigue that are in the range of potential clinical significance.
The clinical significance of the findings is also reflected in the results of the logistic regressions, which may be mapped to potential effects on functional status. Specifically, the odds of having a high fatigue level (FACIT <27) increase 90% for persons with a minimum Hb 7–8 g/dL compared with persons with a minimum Hb ≥8 g/dL. For persons with a minimum Hb <7 g/dL, point estimates suggest a smaller (50%) increase in the odds of high fatigue, but the 95% confidence interval overlaps heavily with the estimate of patients whose minimum Hb is 7-8 g/dL. While it might be expected that patients with a minimum Hb <7 g/dL have greater levels of fatigue compared with patients with a minimum Hb 7-8 g/dL, we did not observe such a pattern. One reason may be that the confidence intervals of our estimated effects are wide enough that we cannot exclude such a pattern. Another possible explanation is that in both groups, the fatigue levels are sufficiently severe, such that the difference in their fatigue levels may not be clinically meaningful. For example, a FACIT score of 23 to 26 has been shown to be associated with an ECOG performance status of 2 to 3, requiring bed rest for at least part of the day.3 Therefore, patients with a minimum Hb 7-8 g/dL (mean FACIT score = 24; Table 2) or a minimum Hb of <7 g/dL (mean FACIT score = 23; Table 2) are already functionally limited to the point of being partially bed bound, such that further decreases in their Hb may not produce additional fatigue in part because they reduce their activity sufficiently to prevent an increase in fatigue. In such cases, the potential benefits of increased Hb may be better assessed by measuring fatigue in response to a specific and provoked activity level, a concept known as fatigability.20
That minimum Hb is more strongly associated with fatigue than any other measure of Hb during hospitalization may not be surprising. Mean, median, maximum, and discharge Hb may all be affected by transfusion during hospitalization that could affect fatigue. Admission Hb may not reflect true oxygen-carrying capacity because of hemoconcentration.
The association between Hb and fatigue in hospitalized patients is important because increased fatigue could contribute to slower clinical recovery in hospitalized patients. Additionally, increased fatigue during hospitalization and at hospital discharge could exacerbate the known deleterious consequences of fatigue on patients and their health outcomes14,15 after hospital discharge. Although one previous study, the Functional Outcomes in Cardiovascular Patients Undergoing Surgical Hip Fracture Repair (FOCUS)8 trial, did not report differences in patients’ fatigue levels at 30 and 60 days postdischarge when transfused at restrictive (8 g/dL) compared with liberal (10 g/dL) Hb thresholds, confidence in the validity of this finding is reduced by the fact that more than half of the patients were lost to follow-up at the 30- and 60-day time points. Further, patients in the restrictive transfusion arm of FOCUS were transfused to maintain Hb levels at or above 8 g/dL. This transfusion threshold of 8 g/dL may have mitigated the high levels of fatigue that are seen in our study when patients’ Hb drops below 8 g/dL, and maintaining a Hb level of 7 g/dL is now the standard of care in stable hospitalized patients. Lastly, FOCUS was limited to postoperative hip fracture patients, and the generalizability of FOCUS to hospitalized medicine patients with anemia is limited.
Therefore, our results support guideline suggestions that practitioners incorporate the presence of patient symptoms such as fatigue into transfusion decisions, particularly if patients’ Hb is <8 g/dL.18 Though reasonable, the suggestion to incorporate symptoms such as fatigue into transfusion decisions has not been strongly supported by evidence so far, and it may often be neglected in practice. Definitive evidence to support such recommendations would benefit from study through an optimal trial18 that incorporates symptoms into decision making. Our findings add support for a study of transfusion strategies that incorporates patients’ fatigue level in addition to Hb concentration.
This study has several limitations. Although our sample size is large and includes patients with a range of comorbidities that we believe are representative of hospitalized general medicine patients, as a single-center, observational study, our results may not be generalizable to other centers. Additionally, although these data support a reliable association between hospitalized patients’ minimum Hb and fatigue level, the observational design of this study cannot prove that this relationship is causal. Also, patients’ Hb values were measured at the discretion of their clinician, and therefore, the measures of Hb were not uniformly measured for participating patients. In addition, fatigue was only measured at one time point during a patient’s hospitalization, and it is possible that patients’ fatigue levels change during hospitalization in relation to variables we did not consider. Finally, our study was not designed to assess the association of Hb with longer-term functional outcomes, which may be of greater concern than fatigue.
CONCLUSION
In hospitalized patients ≥50 years old, minimum Hb is reliably associated with patients’ fatigue level. Patients whose minimum Hb is <8 g/dL experience higher fatigue levels compared to patients whose minimum Hb is ≥8 g/dL. Additional studies are warranted to understand if patients may benefit from improved fatigue levels by correcting their anemia through transfusion.
Disclosure
Dr. Prochaska is supported by an Agency for Healthcare Research and Quality Patient-Centered Outcomes Research Institutional K12 Award (1K12HS023007-01, principal investigator Meltzer). Dr. Meltzer is supported by a National Institutes of Health Clinical and Translational Science Award (2UL1TR000430-06, principal investigator Solway) and a grant from the Patient-Centered Outcomes Research Network in support of the Chicago Patient-Centered Outcomes Research Network. The authors report no conflicts of interest.
Fatigue is the most common clinical symptom of anemia and is a significant concern to patients.1,2 In ambulatory patients, lower hemoglobin (Hb) concentration is associated with increased fatigue.2,3 Accordingly, therapies that treat anemia by increasing Hb concentration, such as erythropoiesis stimulating agents,4-7 often use fatigue as an outcome measure.
In hospitalized patients, transfusion of red blood cell increases Hb concentration and is the primary treatment for anemia. However, the extent to which transfusion and changes in Hb concentration affect hospitalized patients’ fatigue levels is not well established. Guidelines support transfusing patients with symptoms of anemia, such as fatigue, on the assumption that the increased oxygen delivery will improve the symptoms of anemia. While transfusion studies in hospitalized patients have consistently reported that transfusion at lower or “restrictive” Hb concentrations is safe compared with transfusion at higher Hb concentrations,8-10 these studies have mainly used cardiac events and mortality as outcomes rather than patient symptoms, such as fatigue. Nevertheless, they have resulted in hospitals increasingly adopting restrictive transfusion policies that discourage transfusion at higher Hb levels.11,12 Consequently, the rate of transfusion in hospitalized patients has decreased,13 raising questions of whether some patients with lower Hb concentrations may experience increased fatigue as a result of restrictive transfusion policies. Fatigue among hospitalized patients is important not only because it is an adverse symptom but because it may result in decreased activity levels, deconditioning, and losses in functional status.14,15While the effect of alternative transfusion policies on fatigue in hospitalized patients could be answered by a randomized clinical trial using fatigue and functional status as outcomes, an important first step is to assess whether the Hb concentration of hospitalized patients is associated with their fatigue level during hospitalization. Because hospitalized patients often have acute illnesses that can cause fatigue in and of themselves, it is possible that anemia is not associated with fatigue in hospitalized patients despite anemia’s association with fatigue in ambulatory patients. Additionally, Hb concentration varies during hospitalization,16 raising the question of what measures of Hb during hospitalization might be most associated with anemia-related fatigue.
The objective of this study is to explore multiple Hb measures in hospitalized medical patients with anemia and test whether any of these Hb measures are associated with patients’ fatigue level.
METHODS
Study Design
We performed a prospective, observational study of hospitalized patients with anemia on the general medicine services at The University of Chicago Medical Center (UCMC). The institutional review board approved the study procedures, and all study subjects provided informed consent.
Study Eligibility
Between April 2014 and June 2015, all general medicine inpatients were approached for written consent for The University of Chicago Hospitalist Project,17 a research infrastructure at UCMC. Among patients consenting to participate in the Hospitalist Project, patients were eligible if they had Hb <9 g/dL at any point during their hospitalization and were age ≥50 years. Hb concentration of <9 g/dL was chosen to include the range of Hb values covered by most restrictive transfusion policies.8-10,18 Age ≥50 years was an inclusion criteria because anemia is more strongly associated with poor outcomes, including functional impairment, among older patients compared with younger patients.14,19-21 If patients were not eligible for inclusion at the time of consent for the Hospitalist Project, their Hb values were reviewed twice daily until hospital discharge to assess if their Hb was <9 g/dL. Proxies were sought to answer questions for patients who failed the Short Portable Mental Status Questionnaire.22
Patient Demographic Data Collection
Research assistants abstracted patient age and sex from the electronic health record (EHR), and asked patients to self-identify their race. The individual comorbidities included as part of the Charlson Comorbidity Index were identified using International Classification of Diseases, 9th Revision codes from hospital administrative data for each encounter and specifically included the following: myocardial infarction, congestive heart failure, peripheral vascular disease, cerebrovascular disease, dementia, chronic pulmonary disease, rheumatic disease, peptic ulcer disease, liver disease, diabetes, hemiplegia and/or paraplegia, renal disease, cancer, and human immunodeficiency virus/acquired immunodeficiency syndrome.23 We also used Healthcare Cost and Utilization Project (www.hcup-us.ahrq.gov/toolssoftware/ccs/ccs.jsp) diagnosis categories to identify whether patients had sickle cell (SC) anemia, gastrointestinal bleeding (GIB), or a depressive disorder (DD) because these conditions are associated with anemia (SC and GIB) and fatigue (DD).24
Measuring Anemia
Hb measures were available only when hospital providers ordered them as part of routine practice. The first Hb concentration <9 g/dL during a patient’s hospitalization, which made them eligible for study participation, was obtained through manual review of the EHR. All additional Hb values during the patient’s hospitalization were obtained from the hospital’s administrative data mart. All Hb values collected for each patient during the hospitalization were used to calculate summary measures of Hb during the hospitalization, including the mean Hb, median Hb, minimum Hb, maximum Hb, admission (first recorded) Hb, and discharge (last recorded) Hb. Hb measures were analyzed both as a continuous variable and as a categorical variable created by dividing the continuous Hb measures into integer ranges of 3 groups of approximately the same size.
Measuring Fatigue
Our primary outcome was patients’ level of fatigue reported during hospitalization, measured using the Functional Assessment of Chronic Illness Therapy (FACIT)-Anemia questionnaire. Fatigue was measured using a 13-question fatigue subscale,1,2,25 which measures fatigue within the past 7 days. Scores on the fatigue subscale range from 0 to 52, with lower scores reflecting greater levels of fatigue. As soon as patients met the eligibility criteria for study participation during their hospitalization (age ≥50 years and Hb <9 g/dL), they were approached to answer the FACIT questions. Values for missing data in the fatigue subscale for individual subjects were filled in using a prorated score from their answered questions as long as >50% of the items in the fatigue subscale were answered, in accordance with recommendations for addressing missing data in the FACIT.26 Fatigue was analyzed as a continuous variable and as a dichotomous variable created by dividing the sample into high (FACIT <27) and low (FACIT ≥27) levels of fatigue based on the median FACIT score of the population. Previous literature has shown a FACIT fatigue subscale score between 23 and 26 to be associated with an Eastern Cooperative Oncology Group (ECOG)27 C Performance Status rating of 2 to 33 compared to scores ≥27.
Statistical Analysis
Statistical analysis was performed using Stata statistical software (StataCorp, College Station, Texas). Descriptive statistics were used to characterize patient demographics. Analysis of variance was used to test for differences in the mean fatigue levels across Hb measures. χ2 tests were performed to test for associations between high fatigue levels and the Hb measures. Multivariable analysis, including both linear and logistic regression models, were used to test the association of Hb concentration and fatigue. P values <0.05 using a 2-tailed test were deemed statistically significant.
RESULTS
Patient Characteristics
During the study period, 8559 patients were admitted to the general medicine service. Of those, 5073 (59%) consented for participation in the Hospitalist Project, and 3670 (72%) completed the Hospitalist Project inpatient interview. Of these patients, 1292 (35%) had Hb <9 g/dL, and 784 (61%) were 50 years or older and completed the FACIT questionnaire.
Table 1 reports the demographic characteristics and comorbidities for the sample, the mean (standard deviation [SD]) for the 6 Hb measures, and mean (SD) and median FACIT scores.
Bivariate Association of Fatigue and Hb
Categorizing patients into low, middle, or high Hb for each of the 6 Hb measures, minimum Hb was strongly associated with fatigue, with a weaker association for mean Hb and no statistically significant association for the other measures.
Minimum Hb
Patients with a minimum Hb <7 g/dL and patients with Hb 7-8 g/dL had higher fatigue levels (FACIT = 25 for each) than patients with a minimum Hb ≥8 g/dL (FACIT = 29; P < 0.001; Table 2). When excluding patients with SC and/or GIB because their average minimum Hb differed from the average minimum Hb of the full population (P < 0.001), patients with a minimum Hb <7 g/dL or 7-8 g/dL had even higher fatigue levels (FACIT = 23 and FACIT = 24, respectively), with no change in the fatigue level of patients with a minimum Hb ≥8 g/dL (FACIT = 29; P < 0.001; Table 2). Lower minimum Hb continued to be associated with higher fatigue levels when analyzed in 0.5 g/dL increments (Figure).
Mean Hb and Other Measures
Fatigue levels were high for 47% of patients with a mean Hb <8g /dL and 53% of patients with a mean Hb 8-9 g/dL compared with 43% of patients with a mean Hb ≥9 g/dL (P = 0.05). However, the association between high fatigue and mean Hb was not statistically significant when patients with SC and/or GIB were excluded (Table 2). None of the other 4 Hb measures was significantly associated with fatigue.
Linear Regression of Fatigue on Hb
In linear regression models, minimum Hb consistently predicted patient fatigue, mean Hb had a less robust association with fatigue, and the other Hb measures were not associated with patient fatigue. Increases in minimum Hb (analyzed as a continuous variable) were associated with reduced fatigue (higher FACIT score; β = 1.4; P = 0.005). In models in which minimum Hb was a categorical variable, patients with a minimum Hb of <7 g/dL or 7-8 g/dL had greater fatigue (lower FACIT score) than patients whose minimum Hb was ≥8 g/dL (Hb <7 g/dL: β = −4.2; P ≤ 0.001; Hb 7-8 g/dL: β = −4.1; P < 0.001). These results control for patients’ age, sex, individual comorbidities, and whether their minimum Hb occurred before or after the measurement of fatigue during hospitalization (Model 1), and the results are unchanged when also controlling for the number of Hb laboratory draws patients had during their hospitalization (Model 2; Table 3). In a stratified analysis excluding patients with either SC and/or GIB, changes in minimum Hb were associated with larger changes in patient fatigue levels (Supplemental Table 1). We also stratified our analysis to include only patients whose minimum Hb occurred before the measurement of their fatigue level during hospitalization to avoid a spurious association of fatigue with minimum Hb occurring after fatigue was measured. In both Models 1 and 2, minimum Hb remained a predictor of patients’ fatigue levels with similar effect sizes, although in Model 2, the results did not quite reach a statistically significant level, in part due to larger confidence intervals from the smaller sample size of this stratified analysis (Supplemental Table 2a). We further stratified this analysis to include only patients whose transfusion, if they received one, occurred after their minimum Hb and the measurement of their fatigue level to account for the possibility that a transfusion could affect the fatigue level patients report. In this analysis, most of the estimates of the effect of minimum Hb on fatigue were larger than those seen when only analyzing patients whose minimum Hb occurred before the measurement of their fatigue level, although again, the smaller sample size of this additional stratified analysis does produce larger confidence intervals for these estimates (Supplemental Table 2b).
No Hb measure other than minimum or mean had significant association with patient fatigue levels in linear regression models.
Logistic Regression of High Fatigue Level on Hb
Using logistic regression, minimum Hb analyzed as a categorical variable predicted increased odds of a high fatigue level. Patients with a minimum Hb <7 g/dL were 50% (odds ratio [OR] = 1.5; P = 0.03) more likely to have high fatigue and patients with a minimum Hb 7-8 g/dL were 90% (OR = 1.9; P < 0.001) more likely to have high fatigue compared with patients with a minimum Hb ≥8 g/dL in Model 1. These results were similar in Model 2, although the effect was only statistically significant in the 7-8 g/dL Hb group (Table 3). When excluding SC and/or GIB patients, the odds of having high fatigue as minimum Hb decreased were the same or higher for both models compared to the full population of patients. However, again, in Model 2, the effect was only statistically significant in the 7-8 g/dL Hb group (Supplemental Table 1).
Patients with a mean Hb <8 g/dL were 20% to 30% more likely to have high fatigue and patients with mean Hb 8-9 g/dL were 50% more likely to have high fatigue compared with patients with a mean Hb ≥9 g/dL, but the effects were only statistically significant for patients with a mean Hb 8-9 g/dL in both Models 1 and 2 (Table 3). These results were similar when excluding patients with SC and/or GIB, but they were only significant for patients with a mean Hb 8-9 g/dL in Model 1 and patients with a mean Hb <8 g/dL in the Model 2 (Supplemental Table 3).
DISCUSSION
These results demonstrate that minimum Hb during hospitalization is associated with fatigue in hospitalized patients age ≥50 years, and the association is stronger among patients without SC and/or GIB as comorbidities. The analysis of Hb as a continuous and categorical variable and the use of both linear and logistic regression models support the robustness of these associations and illuminate their clinical significance. For example, in linear regression with minimum Hb a continuous variable, the coefficient of 1.4 suggests that an increase of 2 g/dL in Hb, as might be expected from transfusion of 2 units of red blood cells, would be associated with about a 3-point improvement in fatigue. Additionally, as a categorical variable, a minimum Hb ≥8 g/dL compared with a minimum Hb <7 g/dL or 7-8 g/dL is associated with a 3- to 4-point improvement in fatigue. Previous literature suggests that a difference of 3 in the FACIT score is the minimum clinically important difference in fatigue,3 and changes in minimum Hb in either model predict changes in fatigue that are in the range of potential clinical significance.
The clinical significance of the findings is also reflected in the results of the logistic regressions, which may be mapped to potential effects on functional status. Specifically, the odds of having a high fatigue level (FACIT <27) increase 90% for persons with a minimum Hb 7–8 g/dL compared with persons with a minimum Hb ≥8 g/dL. For persons with a minimum Hb <7 g/dL, point estimates suggest a smaller (50%) increase in the odds of high fatigue, but the 95% confidence interval overlaps heavily with the estimate of patients whose minimum Hb is 7-8 g/dL. While it might be expected that patients with a minimum Hb <7 g/dL have greater levels of fatigue compared with patients with a minimum Hb 7-8 g/dL, we did not observe such a pattern. One reason may be that the confidence intervals of our estimated effects are wide enough that we cannot exclude such a pattern. Another possible explanation is that in both groups, the fatigue levels are sufficiently severe, such that the difference in their fatigue levels may not be clinically meaningful. For example, a FACIT score of 23 to 26 has been shown to be associated with an ECOG performance status of 2 to 3, requiring bed rest for at least part of the day.3 Therefore, patients with a minimum Hb 7-8 g/dL (mean FACIT score = 24; Table 2) or a minimum Hb of <7 g/dL (mean FACIT score = 23; Table 2) are already functionally limited to the point of being partially bed bound, such that further decreases in their Hb may not produce additional fatigue in part because they reduce their activity sufficiently to prevent an increase in fatigue. In such cases, the potential benefits of increased Hb may be better assessed by measuring fatigue in response to a specific and provoked activity level, a concept known as fatigability.20
That minimum Hb is more strongly associated with fatigue than any other measure of Hb during hospitalization may not be surprising. Mean, median, maximum, and discharge Hb may all be affected by transfusion during hospitalization that could affect fatigue. Admission Hb may not reflect true oxygen-carrying capacity because of hemoconcentration.
The association between Hb and fatigue in hospitalized patients is important because increased fatigue could contribute to slower clinical recovery in hospitalized patients. Additionally, increased fatigue during hospitalization and at hospital discharge could exacerbate the known deleterious consequences of fatigue on patients and their health outcomes14,15 after hospital discharge. Although one previous study, the Functional Outcomes in Cardiovascular Patients Undergoing Surgical Hip Fracture Repair (FOCUS)8 trial, did not report differences in patients’ fatigue levels at 30 and 60 days postdischarge when transfused at restrictive (8 g/dL) compared with liberal (10 g/dL) Hb thresholds, confidence in the validity of this finding is reduced by the fact that more than half of the patients were lost to follow-up at the 30- and 60-day time points. Further, patients in the restrictive transfusion arm of FOCUS were transfused to maintain Hb levels at or above 8 g/dL. This transfusion threshold of 8 g/dL may have mitigated the high levels of fatigue that are seen in our study when patients’ Hb drops below 8 g/dL, and maintaining a Hb level of 7 g/dL is now the standard of care in stable hospitalized patients. Lastly, FOCUS was limited to postoperative hip fracture patients, and the generalizability of FOCUS to hospitalized medicine patients with anemia is limited.
Therefore, our results support guideline suggestions that practitioners incorporate the presence of patient symptoms such as fatigue into transfusion decisions, particularly if patients’ Hb is <8 g/dL.18 Though reasonable, the suggestion to incorporate symptoms such as fatigue into transfusion decisions has not been strongly supported by evidence so far, and it may often be neglected in practice. Definitive evidence to support such recommendations would benefit from study through an optimal trial18 that incorporates symptoms into decision making. Our findings add support for a study of transfusion strategies that incorporates patients’ fatigue level in addition to Hb concentration.
This study has several limitations. Although our sample size is large and includes patients with a range of comorbidities that we believe are representative of hospitalized general medicine patients, as a single-center, observational study, our results may not be generalizable to other centers. Additionally, although these data support a reliable association between hospitalized patients’ minimum Hb and fatigue level, the observational design of this study cannot prove that this relationship is causal. Also, patients’ Hb values were measured at the discretion of their clinician, and therefore, the measures of Hb were not uniformly measured for participating patients. In addition, fatigue was only measured at one time point during a patient’s hospitalization, and it is possible that patients’ fatigue levels change during hospitalization in relation to variables we did not consider. Finally, our study was not designed to assess the association of Hb with longer-term functional outcomes, which may be of greater concern than fatigue.
CONCLUSION
In hospitalized patients ≥50 years old, minimum Hb is reliably associated with patients’ fatigue level. Patients whose minimum Hb is <8 g/dL experience higher fatigue levels compared to patients whose minimum Hb is ≥8 g/dL. Additional studies are warranted to understand if patients may benefit from improved fatigue levels by correcting their anemia through transfusion.
Disclosure
Dr. Prochaska is supported by an Agency for Healthcare Research and Quality Patient-Centered Outcomes Research Institutional K12 Award (1K12HS023007-01, principal investigator Meltzer). Dr. Meltzer is supported by a National Institutes of Health Clinical and Translational Science Award (2UL1TR000430-06, principal investigator Solway) and a grant from the Patient-Centered Outcomes Research Network in support of the Chicago Patient-Centered Outcomes Research Network. The authors report no conflicts of interest.
1. Yellen SB, Cella DF, Webster K, Blendowski C, Kaplan E. Measuring fatigue and other anemia-related symptoms with the Functional Assessment of Cancer Therapy (FACT) measurement system. J Pain Symptom Manage. 1997;13(2):63-74. PubMed
2. Cella D, Lai JS, Chang CH, Peterman A, Slavin M. Fatigue in cancer patients compared with fatigue in the general United States population. Cancer. 2002;94(2):528-538. doi:10.1002/cncr.10245. PubMed
3. Cella D, Eton DT, Lai J-S, Peterman AH, Merkel DE. Combining anchor and distribution-based methods to derive minimal clinically important differences on the Functional Assessment of Cancer Therapy (FACT) anemia and fatigue scales. J Pain Symptom Manage. 2002;24(6):547-561. PubMed
4. Tonelli M, Hemmelgarn B, Reiman T, et al. Benefits and harms of erythropoiesis-stimulating agents for anemia related to cancer: a meta-analysis. CMAJ Can Med Assoc J J Assoc Medicale Can. 2009;180(11):E62-E71. doi:10.1503/cmaj.090470. PubMed
5. Foley RN, Curtis BM, Parfrey PS. Erythropoietin Therapy, Hemoglobin Targets, and Quality of Life in Healthy Hemodialysis Patients: A Randomized Trial. Clin J Am Soc Nephrol. 2009;4(4):726-733. doi:10.2215/CJN.04950908. PubMed
6. Keown PA, Churchill DN, Poulin-Costello M, et al. Dialysis patients treated with Epoetin alfa show improved anemia symptoms: A new analysis of the Canadian Erythropoietin Study Group trial. Hemodial Int Int Symp Home Hemodial. 2010;14(2):168-173. doi:10.1111/j.1542-4758.2009.00422.x. PubMed
7. Palmer SC, Saglimbene V, Mavridis D, et al. Erythropoiesis-stimulating agents for anaemia in adults with chronic kidney disease: a network meta-analysis. Cochrane Database Syst Rev. 2014:CD010590. PubMed
8. Carson JL, Terrin ML, Noveck H, et al. Liberal or Restrictive Transfusion in high-risk patients after hip surgery. N Engl J Med. 2011;365(26):2453-2462. doi:10.1056/NEJMoa1012452. PubMed
9. Holst LB, Haase N, Wetterslev J, et al. Transfusion requirements in septic shock (TRISS) trial – comparing the effects and safety of liberal versus restrictive red blood cell transfusion in septic shock patients in the ICU: protocol for a randomised controlled trial. Trials. 2013;14:150. doi:10.1186/1745-6215-14-150. PubMed
10. Hébert PC, Wells G, Blajchman MA, et al. A multicenter, randomized, controlled clinical trial of transfusion requirements in critical care. N Engl J Med. 1999;340(6):409-417. doi:10.1056/NEJM199902113400601. PubMed
11. Corwin HL, Theus JW, Cargile CS, Lang NP. Red blood cell transfusion: Impact of an education program and a clinical guideline on transfusion practice. J Hosp Med. 2014;9(12):745-749. doi:10.1002/jhm.2237. PubMed
12. Saxena, S, editor. The Transfusion Committee: Putting Patient Safety First, 2nd Edition. Bethesda (MD): American Association of Blood Banks; 2013.
13. The 2011 National Blood Collection and Utilization Report. http://www.hhs.gov/ash/bloodsafety/2011-nbcus.pdf. Accessed August 16, 2017.
14. Vestergaard S, Nayfield SG, Patel KV, et al. Fatigue in a Representative Population of Older Persons and Its Association With Functional Impairment, Functional Limitation, and Disability. J Gerontol A Biol Sci Med Sci. 2009;64A(1):76-82. doi:10.1093/gerona/gln017. PubMed
15. Gill TM, Desai MM, Gahbauer EA, Holford TR, Williams CS. Restricted activity among community-living older persons: incidence, precipitants, and health care utilization. Ann Intern Med. 2001;135(5):313-321. PubMed
16. Koch CG, Li L, Sun Z, et al. Hospital-acquired anemia: Prevalence, outcomes, and healthcare implications. J Hosp Med. 2013;8(9):506-512. doi:10.1002/jhm.2061. PubMed
17. Meltzer D, Manning WG, Morrison J, et al. Effects of Physician Experience on Costs and Outcomes on an Academic General Medicine Service: Results of a Trial of Hospitalists. Ann Intern Med. 2002;137(11):866-874. doi:10.7326/0003-4819-137-11-200212030-00007. PubMed
18. Carson JL, Grossman BJ, Kleinman S, et al. Red Blood Cell Transfusion: A Clinical Practice Guideline From the AABB*. Ann Intern Med. 2012;157(1):49-58. doi:10.7326/0003-4819-157-1-201206190-00429. PubMed
19. Moreh E, Jacobs JM, Stessman J. Fatigue, function, and mortality in older adults. J Gerontol A Biol Sci Med Sci. 2010;65(8):887-895. doi:10.1093/gerona/glq064. PubMed
20. Eldadah BA. Fatigue and Fatigability in Older Adults. PM&R. 2010;2(5):406-413. doi:10.1016/j.pmrj.2010.03.022. PubMed
21. Hardy SE, Studenski SA. Fatigue Predicts Mortality among Older Adults. J Am Geriatr Soc. 2008;56(10):1910-1914. doi:10.1111/j.1532-5415.2008.01957.x. PubMed
22. Pfeiffer E. A short portable mental status questionnaire for the assessment of organic brain deficit in elderly patients. J Am Geriatr Soc. 1975;23(10):433-441. PubMed
23. Quan H, Sundararajan V, Halfon P, et al. Coding algorithms for defining comorbidities in ICD-9-CM and ICD-10 administrative data. Med Care. 2005;43(11):1130-1139. PubMed
24. HCUP Clinical Classifications Software (CCS) for ICD-9-CM. Healthcare Cost and Utilization Project (HCUP). 2006-2009. Agency for Healthcare Research and Quality, Rockville, MD. https://www.hcup-us.ahrq.gov/toolssoftware/ccs/ccs.jsp. Accessed November 22, 2016.
25. Cella DF, Tulsky DS, Gray G, et al. The Functional Assessment of Cancer Therapy scale: development and validation of the general measure. J Clin Oncol Off J Am Soc Clin Oncol. 1993;11(3):570-579. PubMed
26. Webster K, Cella D, Yost K. The Functional Assessment of Chronic Illness Therapy (FACIT) Measurement System: properties, applications, and interpretation. Health Qual Life Outcomes. 2003;1:79. doi:10.1186/1477-7525-1-79. PubMed
27. Oken MMMD a, Creech RHMD b, Tormey DCMD, et al. Toxicity and response criteria of the Eastern Cooperative Oncology Group. J Clin Oncol. 1982;5(6):649-656. PubMed
1. Yellen SB, Cella DF, Webster K, Blendowski C, Kaplan E. Measuring fatigue and other anemia-related symptoms with the Functional Assessment of Cancer Therapy (FACT) measurement system. J Pain Symptom Manage. 1997;13(2):63-74. PubMed
2. Cella D, Lai JS, Chang CH, Peterman A, Slavin M. Fatigue in cancer patients compared with fatigue in the general United States population. Cancer. 2002;94(2):528-538. doi:10.1002/cncr.10245. PubMed
3. Cella D, Eton DT, Lai J-S, Peterman AH, Merkel DE. Combining anchor and distribution-based methods to derive minimal clinically important differences on the Functional Assessment of Cancer Therapy (FACT) anemia and fatigue scales. J Pain Symptom Manage. 2002;24(6):547-561. PubMed
4. Tonelli M, Hemmelgarn B, Reiman T, et al. Benefits and harms of erythropoiesis-stimulating agents for anemia related to cancer: a meta-analysis. CMAJ Can Med Assoc J J Assoc Medicale Can. 2009;180(11):E62-E71. doi:10.1503/cmaj.090470. PubMed
5. Foley RN, Curtis BM, Parfrey PS. Erythropoietin Therapy, Hemoglobin Targets, and Quality of Life in Healthy Hemodialysis Patients: A Randomized Trial. Clin J Am Soc Nephrol. 2009;4(4):726-733. doi:10.2215/CJN.04950908. PubMed
6. Keown PA, Churchill DN, Poulin-Costello M, et al. Dialysis patients treated with Epoetin alfa show improved anemia symptoms: A new analysis of the Canadian Erythropoietin Study Group trial. Hemodial Int Int Symp Home Hemodial. 2010;14(2):168-173. doi:10.1111/j.1542-4758.2009.00422.x. PubMed
7. Palmer SC, Saglimbene V, Mavridis D, et al. Erythropoiesis-stimulating agents for anaemia in adults with chronic kidney disease: a network meta-analysis. Cochrane Database Syst Rev. 2014:CD010590. PubMed
8. Carson JL, Terrin ML, Noveck H, et al. Liberal or Restrictive Transfusion in high-risk patients after hip surgery. N Engl J Med. 2011;365(26):2453-2462. doi:10.1056/NEJMoa1012452. PubMed
9. Holst LB, Haase N, Wetterslev J, et al. Transfusion requirements in septic shock (TRISS) trial – comparing the effects and safety of liberal versus restrictive red blood cell transfusion in septic shock patients in the ICU: protocol for a randomised controlled trial. Trials. 2013;14:150. doi:10.1186/1745-6215-14-150. PubMed
10. Hébert PC, Wells G, Blajchman MA, et al. A multicenter, randomized, controlled clinical trial of transfusion requirements in critical care. N Engl J Med. 1999;340(6):409-417. doi:10.1056/NEJM199902113400601. PubMed
11. Corwin HL, Theus JW, Cargile CS, Lang NP. Red blood cell transfusion: Impact of an education program and a clinical guideline on transfusion practice. J Hosp Med. 2014;9(12):745-749. doi:10.1002/jhm.2237. PubMed
12. Saxena, S, editor. The Transfusion Committee: Putting Patient Safety First, 2nd Edition. Bethesda (MD): American Association of Blood Banks; 2013.
13. The 2011 National Blood Collection and Utilization Report. http://www.hhs.gov/ash/bloodsafety/2011-nbcus.pdf. Accessed August 16, 2017.
14. Vestergaard S, Nayfield SG, Patel KV, et al. Fatigue in a Representative Population of Older Persons and Its Association With Functional Impairment, Functional Limitation, and Disability. J Gerontol A Biol Sci Med Sci. 2009;64A(1):76-82. doi:10.1093/gerona/gln017. PubMed
15. Gill TM, Desai MM, Gahbauer EA, Holford TR, Williams CS. Restricted activity among community-living older persons: incidence, precipitants, and health care utilization. Ann Intern Med. 2001;135(5):313-321. PubMed
16. Koch CG, Li L, Sun Z, et al. Hospital-acquired anemia: Prevalence, outcomes, and healthcare implications. J Hosp Med. 2013;8(9):506-512. doi:10.1002/jhm.2061. PubMed
17. Meltzer D, Manning WG, Morrison J, et al. Effects of Physician Experience on Costs and Outcomes on an Academic General Medicine Service: Results of a Trial of Hospitalists. Ann Intern Med. 2002;137(11):866-874. doi:10.7326/0003-4819-137-11-200212030-00007. PubMed
18. Carson JL, Grossman BJ, Kleinman S, et al. Red Blood Cell Transfusion: A Clinical Practice Guideline From the AABB*. Ann Intern Med. 2012;157(1):49-58. doi:10.7326/0003-4819-157-1-201206190-00429. PubMed
19. Moreh E, Jacobs JM, Stessman J. Fatigue, function, and mortality in older adults. J Gerontol A Biol Sci Med Sci. 2010;65(8):887-895. doi:10.1093/gerona/glq064. PubMed
20. Eldadah BA. Fatigue and Fatigability in Older Adults. PM&R. 2010;2(5):406-413. doi:10.1016/j.pmrj.2010.03.022. PubMed
21. Hardy SE, Studenski SA. Fatigue Predicts Mortality among Older Adults. J Am Geriatr Soc. 2008;56(10):1910-1914. doi:10.1111/j.1532-5415.2008.01957.x. PubMed
22. Pfeiffer E. A short portable mental status questionnaire for the assessment of organic brain deficit in elderly patients. J Am Geriatr Soc. 1975;23(10):433-441. PubMed
23. Quan H, Sundararajan V, Halfon P, et al. Coding algorithms for defining comorbidities in ICD-9-CM and ICD-10 administrative data. Med Care. 2005;43(11):1130-1139. PubMed
24. HCUP Clinical Classifications Software (CCS) for ICD-9-CM. Healthcare Cost and Utilization Project (HCUP). 2006-2009. Agency for Healthcare Research and Quality, Rockville, MD. https://www.hcup-us.ahrq.gov/toolssoftware/ccs/ccs.jsp. Accessed November 22, 2016.
25. Cella DF, Tulsky DS, Gray G, et al. The Functional Assessment of Cancer Therapy scale: development and validation of the general measure. J Clin Oncol Off J Am Soc Clin Oncol. 1993;11(3):570-579. PubMed
26. Webster K, Cella D, Yost K. The Functional Assessment of Chronic Illness Therapy (FACIT) Measurement System: properties, applications, and interpretation. Health Qual Life Outcomes. 2003;1:79. doi:10.1186/1477-7525-1-79. PubMed
27. Oken MMMD a, Creech RHMD b, Tormey DCMD, et al. Toxicity and response criteria of the Eastern Cooperative Oncology Group. J Clin Oncol. 1982;5(6):649-656. PubMed
© 2017 Society of Hospital Medicine
Trends in Hospitalization for Opioid Overdose among Rural Compared to Urban Residents of the United States, 2007-2014
Background
Hospitalizations and deaths due to opioid overdose have increased over the last decades, straining the healthcare system and generating substantial costs.1-4Hospitalizations for overdose also represent opportunities to intervene in the opioid epidemic by linking patients to resources for nonpharmacologic chronic pain treatment resources or substance use treatment services during and following hospitalization.5,6Studies of trends in the frequency of hospitalizations for opioid overdose in rural and urban areas are necessary to inform planning and resource allocation for inpatient and postdischarge transitional care.
Nonmedical opioid use and opioid-related deaths and injuries appear to be higher in rural areas.7,8 As well, rural areas tend to be more under-resourced in terms of substance abuse treatment and chronic pain specialty services.9,10 Contemporaneous with rising opioid use has been an increasing trend of rural hospital closures.11 This may compound the impact of opioid-related hospitalizations on remaining rural hospitals and lead to increasing reliance on more distant, urban hospitals to treat and discharge patients with overdoses. Rural residents who are admitted or transferred to urban hospitals may face distinct challenges. Similarly, urban hospitals may struggle during discharge planning to link patients to substance use treatment services in less familiar rural communities.
To better define the differential impact of the opioid epidemic based on patient rurality, we described trends in rates of hospitalization for opioid overdose among rural residents compared with urban residents of the United States. We separated hospitalizations into those due to overdose of prescription opioids, and those related to heroin. Among rural residents who overdosed on opioids, we examined trends in admission to rural versus urban hospitals.
METHODS
Data Source
We analyzed data from the National Inpatient Sample (NIS) from 2007 to 2014, developed by the Healthcare Cost and Utilization Project (HCUP). NIS yields nationally representative estimates of inpatient stays in community hospitals in the United States, regardless of payer. Rehabilitation and long-term care hospital stays are excluded. Prior to 2012, NIS included data on all discharges from a 20% sample of hospitals. Beginning in 2012, NIS included a 20% sample of discharges from all HCUP hospitals. We used weights to estimate trends in the total number of hospital admissions for heroin and prescription opioid overdose (POD) in the US by year, accounting for the change in sampling design in 2012 as recommended by HCUP. Standard errors for estimates accounted for the complex sample design.12 We used data from the US Census American Community Survey on the US population in rural versus urban areas for each year to calculate overdose admission rates per 100,000 residents.
Target Population
Following methods applied in previous analyses of NIS data,1,4,13 we identified hospitalizations for heroin or POD based on International Classification of Diseases 9th Clinical Modification (ICD-9-CM) codes. We use the lay term “overdose” to refer to admissions defined by the medical term “poisoning.” In each year between 2007 and 2013, we determined the total number of admissions due to heroin or prescription opioid by considering ICD-9CM codes 965.00 (poisoning by opium), 965.01 (poisoning by heroin), or 965.09 (poisoning by other opiates and related narcotics); or E code E850.0 (accidental poisoning by heroin); or 850.2 (accidental poisoning by opiates and related narcotics) in any position. We defined admissions for heroin overdose (HOD) as 965.01 or E code of E850.0 in any position, and admissions for POD not related to heroin as 965.00, or 965.09, or E code 850.2 in any position excluding admissions with any heroin-related code 965.01 or E code E850.0 or E935.0 (adverse effects of heroin). We excluded hospitalizations in which a patient was transferred out to another acute care facility to avoid duplicate counting.
Analysis
We classified these admissions based on patient residence in a rural versus urban area. NIS contained a variable representing rural versus urban patient residence based on the county-level framework maintained by the Office of Management and Budget, supplemented with information from Urban Influence Codes developed by the Economic Research Service of the US Department of Agriculture.14 We used this information to create a 3-level variable for patient residence: rural (ie, nonmetropolitan areas with a population less than 50,000), small metropolitan (ie, metropolitan areas with a population of 50,000–999,999), and large metropolitan (ie, metropolitan areas with a population of 1,000,000 or greater). We explored further separating categories (eg, breaking rural into micropolitan population centers and other), but this did not further discriminate admission rates.
For each study year, we combined results on overdose admissions with data on the total populations for each of these 3 areas in the US based on American Community Survey data in order to calculate rates of each type of admission per 100,000 persons. To compare pharmaceutical opioids to heroin, we examined pharmaceutical-only overdoses and heroin-only overdoses. We also examined patient age, sex, race and/or ethnicity, and whether they were admitted to a rural or urban hospital based on the hospital location code contained in NIS, and compared these characteristics across residence categories; we presented characteristics for years 2012 to 2014 combined as recent characteristics are most relevant.
The authors had full access to and take full responsibility for the integrity of the data. All analyses were conducted using SAS statistical software version 9.2 (SAS Institute, Cary, North Carolina). The study was reviewed by the University of Iowa Institutional Review Board and the Iowa City Veterans Affairs Healthcare System Research and Development Committee and was judged human subject research exempt.
RESULTS
Characteristics of Patients with Opioids Overdose Admissions
Opioid Overdose Admission Trends by Patient Residence
Opioid Overdose Admissions among Rural Residents to Urban and Rural Hospitals
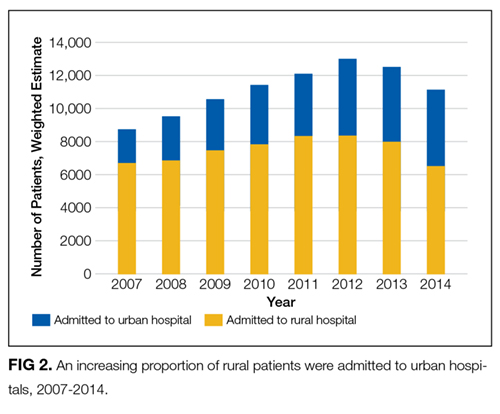
DISCUSSION
Up until 2013, hospital admissions for POD occurred at a higher rate among rural US residents than their urban counterparts. Rates of admission of rural residents for POD have decreased since 2012; a similar trend was not observed among urban residents. Over this same interval, rates of hospitalization for HOD among rural residents continued to increase.
Hospital admission is one sequela of harm related to opioid use: patients experiencing opioid overdose or poisoning may be treated by emergency responders, in emergency departments or on observation status, or may die prior to receiving medical attention or presenting for hospital admission. Factors potentially driving the trends described include patient behaviors, opioid availability, prehospital and hospital treatment practices, and hospital closures. Recent work describing increased opioid overdose deaths15 and high opioid-related mortality in rural areas16 suggests that overdose admission and death rates may be divergent. Changing policies governing naloxone availability and administration17 and ongoing trends in rural hospital closures11 may differentially affect the rates at which rural and urban residents who experience overdose are hospitalized.
Hospital admission also represents a potential point-of-entry into subsequent treatment to reduce risk of further opioid-related harms. Decreasing rates of admission could conceivably result in decreasing opportunities to engage in care. Rural and urban patient populations are distinct; an understanding of these distinctions may help to inform how hospitals structure inpatient treatment and discharge planning for overdose patients. Overdose is likely to suggest either an underlying substance use disorder or a chronic pain condition requiring risky levels of prescribed opioids, and therefore is indicative of a persistent condition requiring follow-up care. Thus, there is a need for treatment models and transition care systems aimed at providing adequate care for these populations both in the acute setting and following hospital discharge. The increasing proportion of rural residents admitted to urban hospitals with opioid overdoses highlights the need for urban hospitals to develop relationships with substance use treatment and chronic pain services in rural areas to facilitate linkage to treatment at discharge.
Limitations of this study include the use of ICD-9-CM codes from administrative data to identify hospitalizations for prescription opioid and heroin overdose. While we have used the common term “overdose,” opioid adverse events may occasion hospitalization in the absence of overdose or as a result of patients taking opioid doses in the quantity prescribed. As such, the term overdose does not necessarily imply the behavior of intentional or unintentional excess use. Additionally, coding depends on providers diagnosing and documenting conditions and may be subject to secular trends independent of overdose prevalence. We included data through 2014, the most recent year of data available at time of analyses.
CONCLUSION
Hospitals can expect to continue to treat patients presenting with opioid overdose. As overdose is likely to suggest either an underlying substance use disorder or a chronic pain condition requiring risky levels of prescribed opioids, there will be a need for treatment models and transition care systems to provide adequate care for these populations both in the acute setting and following hospital discharge. Rates of admission among rural residents declined during the last 2 years of the study period, and rural residents who were hospitalized for opioid overdose were increasingly receiving care in urban hospitals. While factors driving these trends remain to be elucidated, the trends themselves highlight a need to consider the differential challenges facing rural and urban residents who overdose. Access to resources and transportation and other challenges are distinct in urban and rural areas, with rural areas being less likely to have providers in addiction medicine, psychiatry, and pain specialties. Efforts to address these challenges will need to explore models and solutions applicable to differentially resourced hospital and postdischarge settings.
Disclosure
The work reported here was supported by the Department of Veterans Affairs, Veterans Health Administration, Office of Rural Health, Veterans Rural Health Resource Center-Central Region, and the Health Services Research and Development Service through the Comprehensive Access and Delivery Research and Evaluation Center (HFP 04-149). This manuscript is not under review elsewhere and there is no prior publication or presentation of manuscript contents. The views expressed in this article are those of the authors and do not necessarily represent the views of the Department of Veterans Affairs. The authors report no conflict of interest in regards to this study. Data: Available to researchers with VA accreditation. Statistical Code: Available to interested readers by contacting Dr. Ohl. Protocol: Available to interested readers by contacting Dr. Ohl.
1. Ronan MV, Herzig SJ. Hospitalizations Related To Opioid Abuse/Dependence And Associated Serious Infections Increased Sharply, 2002-12. Health Aff (Millwood). 2016;35:832-837. PubMed
2. Florence CS, Zhou C, Luo F, Xu L. The Economic Burden of Prescription Opioid Overdose, Abuse, and Dependence in the United States, 2013. Med Care. 2016;54:901-906. PubMed
3. Jennifer PS, Michael JW, Douglas H, John M, Michael DH. The Critical Care Crisis of Opioid Overdoses in the U.S. In: C95 OUTSTANDING EPIDEMIOLOGY AND HEALTH SERVICES RESEARCH IN CRITICAL CARE: American Thoracic Society 2016 International Conference; 2016 May 13-18; San Francisco, CA:A6146-A.
4. Owens PL, Barrett ML, Weiss AJ, Washington RE, Kronick R. Hospital Inpatient Utilization Related to Opioid Overuse Among Adults, 1993-2012: Statistical Brief #177. Healthcare Cost and Utilization Project (HCUP) Statistical Briefs; 2006. https://www.hcup-us.ahrq.gov/reports/statbriefs/sb177-Hospitalizations-for-Opioid-Overuse.jsp. Accessed January 4, 2017
5. Fanucchi L, Lofwall MR. Putting Parity into Practice - Integrating Opioid-Use Disorder Treatment into the Hospital Setting. N Engl J Med. 2016;375:811-813. PubMed
6. Liebschutz JM, Crooks D, Herman D, et al. Buprenorphine treatment for hospitalized, opioid-dependent patients: a randomized clinical trial. JAMA Intern Med. 2014;174:1369-1376. PubMed
7. Keyes KM, Cerda M, Brady JE, Havens JR, Galea S. Understanding the rural-urban differences in nonmedical prescription opioid use and abuse in the United States. Am J Public Health. 2014;104:e52-e59. PubMed
8. Rigg KK, Monnat SM. Urban vs. rural differences in prescription opioid misuse among adults in the United States: informing region specific drug policies and interventions. Int J Drug Policy. 2015;26:484-491. PubMed
9. Ellis AR, Konrad TR, Thomas KC, Morrissey JP. County-level estimates of mental health professional supply in the United States. Psychiatr Serv. 2009;60:1315-1322. PubMed
10. Rosenblatt RA, Andrilla CH, Catlin M, Larson EH. Geographic and specialty distribution of US physicians trained to treat opioid use disorder. Ann Fam Med. 2015;13:23-26. PubMed
11. Kaufman BG, Thomas SR, Randolph RK, et al. The Rising Rate of Rural Hospital Closures. J Rural Health. 2016;32:35-43. PubMed
12. Houchens RL DR, A Elixhauser. Using the HCUP National Inpatient Sample to Estimate Trends: U.S. Agency for Healthcare Research and Quality; 2015. Report No.: 2006-05
13. Unick GJ, Rosenblum D, Mars S, Ciccarone D. Intertwined epidemics: national demographic trends in hospitalizations for heroin- and opioid-related overdoses, 1993-2009. PLoS One. 2013;8:e54496.
14. Urban Influence Codes. USDA, 2016. https://www.ers.usda.gov/data-products/urban-influence-codes.aspx. Accessed January 4, 2017
15. Rudd RA, Seth P, David F, Scholl L. Increases in Drug and Opioid-Involved Overdose Deaths - United States, 2010-2015. MMWR Morb Mortal Wkly Rep. 2016;65:1445-1452. PubMed
16. Case A, Deaton A. Rising morbidity and mortality in midlife among white non-Hispanic Americans in the 21st century. Proc Natl Acad Sci U S A. 2015;112:15078-15083. PubMed
17. Davis CS, Southwell JK, Niehaus VR, Walley AY, Dailey MW. Emergency medical services naloxone access: a national systematic legal review. Acad Emerg Med. 2014;21:1173-1177. PubMed
Background
Hospitalizations and deaths due to opioid overdose have increased over the last decades, straining the healthcare system and generating substantial costs.1-4Hospitalizations for overdose also represent opportunities to intervene in the opioid epidemic by linking patients to resources for nonpharmacologic chronic pain treatment resources or substance use treatment services during and following hospitalization.5,6Studies of trends in the frequency of hospitalizations for opioid overdose in rural and urban areas are necessary to inform planning and resource allocation for inpatient and postdischarge transitional care.
Nonmedical opioid use and opioid-related deaths and injuries appear to be higher in rural areas.7,8 As well, rural areas tend to be more under-resourced in terms of substance abuse treatment and chronic pain specialty services.9,10 Contemporaneous with rising opioid use has been an increasing trend of rural hospital closures.11 This may compound the impact of opioid-related hospitalizations on remaining rural hospitals and lead to increasing reliance on more distant, urban hospitals to treat and discharge patients with overdoses. Rural residents who are admitted or transferred to urban hospitals may face distinct challenges. Similarly, urban hospitals may struggle during discharge planning to link patients to substance use treatment services in less familiar rural communities.
To better define the differential impact of the opioid epidemic based on patient rurality, we described trends in rates of hospitalization for opioid overdose among rural residents compared with urban residents of the United States. We separated hospitalizations into those due to overdose of prescription opioids, and those related to heroin. Among rural residents who overdosed on opioids, we examined trends in admission to rural versus urban hospitals.
METHODS
Data Source
We analyzed data from the National Inpatient Sample (NIS) from 2007 to 2014, developed by the Healthcare Cost and Utilization Project (HCUP). NIS yields nationally representative estimates of inpatient stays in community hospitals in the United States, regardless of payer. Rehabilitation and long-term care hospital stays are excluded. Prior to 2012, NIS included data on all discharges from a 20% sample of hospitals. Beginning in 2012, NIS included a 20% sample of discharges from all HCUP hospitals. We used weights to estimate trends in the total number of hospital admissions for heroin and prescription opioid overdose (POD) in the US by year, accounting for the change in sampling design in 2012 as recommended by HCUP. Standard errors for estimates accounted for the complex sample design.12 We used data from the US Census American Community Survey on the US population in rural versus urban areas for each year to calculate overdose admission rates per 100,000 residents.
Target Population
Following methods applied in previous analyses of NIS data,1,4,13 we identified hospitalizations for heroin or POD based on International Classification of Diseases 9th Clinical Modification (ICD-9-CM) codes. We use the lay term “overdose” to refer to admissions defined by the medical term “poisoning.” In each year between 2007 and 2013, we determined the total number of admissions due to heroin or prescription opioid by considering ICD-9CM codes 965.00 (poisoning by opium), 965.01 (poisoning by heroin), or 965.09 (poisoning by other opiates and related narcotics); or E code E850.0 (accidental poisoning by heroin); or 850.2 (accidental poisoning by opiates and related narcotics) in any position. We defined admissions for heroin overdose (HOD) as 965.01 or E code of E850.0 in any position, and admissions for POD not related to heroin as 965.00, or 965.09, or E code 850.2 in any position excluding admissions with any heroin-related code 965.01 or E code E850.0 or E935.0 (adverse effects of heroin). We excluded hospitalizations in which a patient was transferred out to another acute care facility to avoid duplicate counting.
Analysis
We classified these admissions based on patient residence in a rural versus urban area. NIS contained a variable representing rural versus urban patient residence based on the county-level framework maintained by the Office of Management and Budget, supplemented with information from Urban Influence Codes developed by the Economic Research Service of the US Department of Agriculture.14 We used this information to create a 3-level variable for patient residence: rural (ie, nonmetropolitan areas with a population less than 50,000), small metropolitan (ie, metropolitan areas with a population of 50,000–999,999), and large metropolitan (ie, metropolitan areas with a population of 1,000,000 or greater). We explored further separating categories (eg, breaking rural into micropolitan population centers and other), but this did not further discriminate admission rates.
For each study year, we combined results on overdose admissions with data on the total populations for each of these 3 areas in the US based on American Community Survey data in order to calculate rates of each type of admission per 100,000 persons. To compare pharmaceutical opioids to heroin, we examined pharmaceutical-only overdoses and heroin-only overdoses. We also examined patient age, sex, race and/or ethnicity, and whether they were admitted to a rural or urban hospital based on the hospital location code contained in NIS, and compared these characteristics across residence categories; we presented characteristics for years 2012 to 2014 combined as recent characteristics are most relevant.
The authors had full access to and take full responsibility for the integrity of the data. All analyses were conducted using SAS statistical software version 9.2 (SAS Institute, Cary, North Carolina). The study was reviewed by the University of Iowa Institutional Review Board and the Iowa City Veterans Affairs Healthcare System Research and Development Committee and was judged human subject research exempt.
RESULTS
Characteristics of Patients with Opioids Overdose Admissions
Opioid Overdose Admission Trends by Patient Residence
Opioid Overdose Admissions among Rural Residents to Urban and Rural Hospitals
DISCUSSION
Up until 2013, hospital admissions for POD occurred at a higher rate among rural US residents than their urban counterparts. Rates of admission of rural residents for POD have decreased since 2012; a similar trend was not observed among urban residents. Over this same interval, rates of hospitalization for HOD among rural residents continued to increase.
Hospital admission is one sequela of harm related to opioid use: patients experiencing opioid overdose or poisoning may be treated by emergency responders, in emergency departments or on observation status, or may die prior to receiving medical attention or presenting for hospital admission. Factors potentially driving the trends described include patient behaviors, opioid availability, prehospital and hospital treatment practices, and hospital closures. Recent work describing increased opioid overdose deaths15 and high opioid-related mortality in rural areas16 suggests that overdose admission and death rates may be divergent. Changing policies governing naloxone availability and administration17 and ongoing trends in rural hospital closures11 may differentially affect the rates at which rural and urban residents who experience overdose are hospitalized.
Hospital admission also represents a potential point-of-entry into subsequent treatment to reduce risk of further opioid-related harms. Decreasing rates of admission could conceivably result in decreasing opportunities to engage in care. Rural and urban patient populations are distinct; an understanding of these distinctions may help to inform how hospitals structure inpatient treatment and discharge planning for overdose patients. Overdose is likely to suggest either an underlying substance use disorder or a chronic pain condition requiring risky levels of prescribed opioids, and therefore is indicative of a persistent condition requiring follow-up care. Thus, there is a need for treatment models and transition care systems aimed at providing adequate care for these populations both in the acute setting and following hospital discharge. The increasing proportion of rural residents admitted to urban hospitals with opioid overdoses highlights the need for urban hospitals to develop relationships with substance use treatment and chronic pain services in rural areas to facilitate linkage to treatment at discharge.
Limitations of this study include the use of ICD-9-CM codes from administrative data to identify hospitalizations for prescription opioid and heroin overdose. While we have used the common term “overdose,” opioid adverse events may occasion hospitalization in the absence of overdose or as a result of patients taking opioid doses in the quantity prescribed. As such, the term overdose does not necessarily imply the behavior of intentional or unintentional excess use. Additionally, coding depends on providers diagnosing and documenting conditions and may be subject to secular trends independent of overdose prevalence. We included data through 2014, the most recent year of data available at time of analyses.
CONCLUSION
Hospitals can expect to continue to treat patients presenting with opioid overdose. As overdose is likely to suggest either an underlying substance use disorder or a chronic pain condition requiring risky levels of prescribed opioids, there will be a need for treatment models and transition care systems to provide adequate care for these populations both in the acute setting and following hospital discharge. Rates of admission among rural residents declined during the last 2 years of the study period, and rural residents who were hospitalized for opioid overdose were increasingly receiving care in urban hospitals. While factors driving these trends remain to be elucidated, the trends themselves highlight a need to consider the differential challenges facing rural and urban residents who overdose. Access to resources and transportation and other challenges are distinct in urban and rural areas, with rural areas being less likely to have providers in addiction medicine, psychiatry, and pain specialties. Efforts to address these challenges will need to explore models and solutions applicable to differentially resourced hospital and postdischarge settings.
Disclosure
The work reported here was supported by the Department of Veterans Affairs, Veterans Health Administration, Office of Rural Health, Veterans Rural Health Resource Center-Central Region, and the Health Services Research and Development Service through the Comprehensive Access and Delivery Research and Evaluation Center (HFP 04-149). This manuscript is not under review elsewhere and there is no prior publication or presentation of manuscript contents. The views expressed in this article are those of the authors and do not necessarily represent the views of the Department of Veterans Affairs. The authors report no conflict of interest in regards to this study. Data: Available to researchers with VA accreditation. Statistical Code: Available to interested readers by contacting Dr. Ohl. Protocol: Available to interested readers by contacting Dr. Ohl.
Background
Hospitalizations and deaths due to opioid overdose have increased over the last decades, straining the healthcare system and generating substantial costs.1-4Hospitalizations for overdose also represent opportunities to intervene in the opioid epidemic by linking patients to resources for nonpharmacologic chronic pain treatment resources or substance use treatment services during and following hospitalization.5,6Studies of trends in the frequency of hospitalizations for opioid overdose in rural and urban areas are necessary to inform planning and resource allocation for inpatient and postdischarge transitional care.
Nonmedical opioid use and opioid-related deaths and injuries appear to be higher in rural areas.7,8 As well, rural areas tend to be more under-resourced in terms of substance abuse treatment and chronic pain specialty services.9,10 Contemporaneous with rising opioid use has been an increasing trend of rural hospital closures.11 This may compound the impact of opioid-related hospitalizations on remaining rural hospitals and lead to increasing reliance on more distant, urban hospitals to treat and discharge patients with overdoses. Rural residents who are admitted or transferred to urban hospitals may face distinct challenges. Similarly, urban hospitals may struggle during discharge planning to link patients to substance use treatment services in less familiar rural communities.
To better define the differential impact of the opioid epidemic based on patient rurality, we described trends in rates of hospitalization for opioid overdose among rural residents compared with urban residents of the United States. We separated hospitalizations into those due to overdose of prescription opioids, and those related to heroin. Among rural residents who overdosed on opioids, we examined trends in admission to rural versus urban hospitals.
METHODS
Data Source
We analyzed data from the National Inpatient Sample (NIS) from 2007 to 2014, developed by the Healthcare Cost and Utilization Project (HCUP). NIS yields nationally representative estimates of inpatient stays in community hospitals in the United States, regardless of payer. Rehabilitation and long-term care hospital stays are excluded. Prior to 2012, NIS included data on all discharges from a 20% sample of hospitals. Beginning in 2012, NIS included a 20% sample of discharges from all HCUP hospitals. We used weights to estimate trends in the total number of hospital admissions for heroin and prescription opioid overdose (POD) in the US by year, accounting for the change in sampling design in 2012 as recommended by HCUP. Standard errors for estimates accounted for the complex sample design.12 We used data from the US Census American Community Survey on the US population in rural versus urban areas for each year to calculate overdose admission rates per 100,000 residents.
Target Population
Following methods applied in previous analyses of NIS data,1,4,13 we identified hospitalizations for heroin or POD based on International Classification of Diseases 9th Clinical Modification (ICD-9-CM) codes. We use the lay term “overdose” to refer to admissions defined by the medical term “poisoning.” In each year between 2007 and 2013, we determined the total number of admissions due to heroin or prescription opioid by considering ICD-9CM codes 965.00 (poisoning by opium), 965.01 (poisoning by heroin), or 965.09 (poisoning by other opiates and related narcotics); or E code E850.0 (accidental poisoning by heroin); or 850.2 (accidental poisoning by opiates and related narcotics) in any position. We defined admissions for heroin overdose (HOD) as 965.01 or E code of E850.0 in any position, and admissions for POD not related to heroin as 965.00, or 965.09, or E code 850.2 in any position excluding admissions with any heroin-related code 965.01 or E code E850.0 or E935.0 (adverse effects of heroin). We excluded hospitalizations in which a patient was transferred out to another acute care facility to avoid duplicate counting.
Analysis
We classified these admissions based on patient residence in a rural versus urban area. NIS contained a variable representing rural versus urban patient residence based on the county-level framework maintained by the Office of Management and Budget, supplemented with information from Urban Influence Codes developed by the Economic Research Service of the US Department of Agriculture.14 We used this information to create a 3-level variable for patient residence: rural (ie, nonmetropolitan areas with a population less than 50,000), small metropolitan (ie, metropolitan areas with a population of 50,000–999,999), and large metropolitan (ie, metropolitan areas with a population of 1,000,000 or greater). We explored further separating categories (eg, breaking rural into micropolitan population centers and other), but this did not further discriminate admission rates.
For each study year, we combined results on overdose admissions with data on the total populations for each of these 3 areas in the US based on American Community Survey data in order to calculate rates of each type of admission per 100,000 persons. To compare pharmaceutical opioids to heroin, we examined pharmaceutical-only overdoses and heroin-only overdoses. We also examined patient age, sex, race and/or ethnicity, and whether they were admitted to a rural or urban hospital based on the hospital location code contained in NIS, and compared these characteristics across residence categories; we presented characteristics for years 2012 to 2014 combined as recent characteristics are most relevant.
The authors had full access to and take full responsibility for the integrity of the data. All analyses were conducted using SAS statistical software version 9.2 (SAS Institute, Cary, North Carolina). The study was reviewed by the University of Iowa Institutional Review Board and the Iowa City Veterans Affairs Healthcare System Research and Development Committee and was judged human subject research exempt.
RESULTS
Characteristics of Patients with Opioids Overdose Admissions
Opioid Overdose Admission Trends by Patient Residence
Opioid Overdose Admissions among Rural Residents to Urban and Rural Hospitals
DISCUSSION
Up until 2013, hospital admissions for POD occurred at a higher rate among rural US residents than their urban counterparts. Rates of admission of rural residents for POD have decreased since 2012; a similar trend was not observed among urban residents. Over this same interval, rates of hospitalization for HOD among rural residents continued to increase.
Hospital admission is one sequela of harm related to opioid use: patients experiencing opioid overdose or poisoning may be treated by emergency responders, in emergency departments or on observation status, or may die prior to receiving medical attention or presenting for hospital admission. Factors potentially driving the trends described include patient behaviors, opioid availability, prehospital and hospital treatment practices, and hospital closures. Recent work describing increased opioid overdose deaths15 and high opioid-related mortality in rural areas16 suggests that overdose admission and death rates may be divergent. Changing policies governing naloxone availability and administration17 and ongoing trends in rural hospital closures11 may differentially affect the rates at which rural and urban residents who experience overdose are hospitalized.
Hospital admission also represents a potential point-of-entry into subsequent treatment to reduce risk of further opioid-related harms. Decreasing rates of admission could conceivably result in decreasing opportunities to engage in care. Rural and urban patient populations are distinct; an understanding of these distinctions may help to inform how hospitals structure inpatient treatment and discharge planning for overdose patients. Overdose is likely to suggest either an underlying substance use disorder or a chronic pain condition requiring risky levels of prescribed opioids, and therefore is indicative of a persistent condition requiring follow-up care. Thus, there is a need for treatment models and transition care systems aimed at providing adequate care for these populations both in the acute setting and following hospital discharge. The increasing proportion of rural residents admitted to urban hospitals with opioid overdoses highlights the need for urban hospitals to develop relationships with substance use treatment and chronic pain services in rural areas to facilitate linkage to treatment at discharge.
Limitations of this study include the use of ICD-9-CM codes from administrative data to identify hospitalizations for prescription opioid and heroin overdose. While we have used the common term “overdose,” opioid adverse events may occasion hospitalization in the absence of overdose or as a result of patients taking opioid doses in the quantity prescribed. As such, the term overdose does not necessarily imply the behavior of intentional or unintentional excess use. Additionally, coding depends on providers diagnosing and documenting conditions and may be subject to secular trends independent of overdose prevalence. We included data through 2014, the most recent year of data available at time of analyses.
CONCLUSION
Hospitals can expect to continue to treat patients presenting with opioid overdose. As overdose is likely to suggest either an underlying substance use disorder or a chronic pain condition requiring risky levels of prescribed opioids, there will be a need for treatment models and transition care systems to provide adequate care for these populations both in the acute setting and following hospital discharge. Rates of admission among rural residents declined during the last 2 years of the study period, and rural residents who were hospitalized for opioid overdose were increasingly receiving care in urban hospitals. While factors driving these trends remain to be elucidated, the trends themselves highlight a need to consider the differential challenges facing rural and urban residents who overdose. Access to resources and transportation and other challenges are distinct in urban and rural areas, with rural areas being less likely to have providers in addiction medicine, psychiatry, and pain specialties. Efforts to address these challenges will need to explore models and solutions applicable to differentially resourced hospital and postdischarge settings.
Disclosure
The work reported here was supported by the Department of Veterans Affairs, Veterans Health Administration, Office of Rural Health, Veterans Rural Health Resource Center-Central Region, and the Health Services Research and Development Service through the Comprehensive Access and Delivery Research and Evaluation Center (HFP 04-149). This manuscript is not under review elsewhere and there is no prior publication or presentation of manuscript contents. The views expressed in this article are those of the authors and do not necessarily represent the views of the Department of Veterans Affairs. The authors report no conflict of interest in regards to this study. Data: Available to researchers with VA accreditation. Statistical Code: Available to interested readers by contacting Dr. Ohl. Protocol: Available to interested readers by contacting Dr. Ohl.
1. Ronan MV, Herzig SJ. Hospitalizations Related To Opioid Abuse/Dependence And Associated Serious Infections Increased Sharply, 2002-12. Health Aff (Millwood). 2016;35:832-837. PubMed
2. Florence CS, Zhou C, Luo F, Xu L. The Economic Burden of Prescription Opioid Overdose, Abuse, and Dependence in the United States, 2013. Med Care. 2016;54:901-906. PubMed
3. Jennifer PS, Michael JW, Douglas H, John M, Michael DH. The Critical Care Crisis of Opioid Overdoses in the U.S. In: C95 OUTSTANDING EPIDEMIOLOGY AND HEALTH SERVICES RESEARCH IN CRITICAL CARE: American Thoracic Society 2016 International Conference; 2016 May 13-18; San Francisco, CA:A6146-A.
4. Owens PL, Barrett ML, Weiss AJ, Washington RE, Kronick R. Hospital Inpatient Utilization Related to Opioid Overuse Among Adults, 1993-2012: Statistical Brief #177. Healthcare Cost and Utilization Project (HCUP) Statistical Briefs; 2006. https://www.hcup-us.ahrq.gov/reports/statbriefs/sb177-Hospitalizations-for-Opioid-Overuse.jsp. Accessed January 4, 2017
5. Fanucchi L, Lofwall MR. Putting Parity into Practice - Integrating Opioid-Use Disorder Treatment into the Hospital Setting. N Engl J Med. 2016;375:811-813. PubMed
6. Liebschutz JM, Crooks D, Herman D, et al. Buprenorphine treatment for hospitalized, opioid-dependent patients: a randomized clinical trial. JAMA Intern Med. 2014;174:1369-1376. PubMed
7. Keyes KM, Cerda M, Brady JE, Havens JR, Galea S. Understanding the rural-urban differences in nonmedical prescription opioid use and abuse in the United States. Am J Public Health. 2014;104:e52-e59. PubMed
8. Rigg KK, Monnat SM. Urban vs. rural differences in prescription opioid misuse among adults in the United States: informing region specific drug policies and interventions. Int J Drug Policy. 2015;26:484-491. PubMed
9. Ellis AR, Konrad TR, Thomas KC, Morrissey JP. County-level estimates of mental health professional supply in the United States. Psychiatr Serv. 2009;60:1315-1322. PubMed
10. Rosenblatt RA, Andrilla CH, Catlin M, Larson EH. Geographic and specialty distribution of US physicians trained to treat opioid use disorder. Ann Fam Med. 2015;13:23-26. PubMed
11. Kaufman BG, Thomas SR, Randolph RK, et al. The Rising Rate of Rural Hospital Closures. J Rural Health. 2016;32:35-43. PubMed
12. Houchens RL DR, A Elixhauser. Using the HCUP National Inpatient Sample to Estimate Trends: U.S. Agency for Healthcare Research and Quality; 2015. Report No.: 2006-05
13. Unick GJ, Rosenblum D, Mars S, Ciccarone D. Intertwined epidemics: national demographic trends in hospitalizations for heroin- and opioid-related overdoses, 1993-2009. PLoS One. 2013;8:e54496.
14. Urban Influence Codes. USDA, 2016. https://www.ers.usda.gov/data-products/urban-influence-codes.aspx. Accessed January 4, 2017
15. Rudd RA, Seth P, David F, Scholl L. Increases in Drug and Opioid-Involved Overdose Deaths - United States, 2010-2015. MMWR Morb Mortal Wkly Rep. 2016;65:1445-1452. PubMed
16. Case A, Deaton A. Rising morbidity and mortality in midlife among white non-Hispanic Americans in the 21st century. Proc Natl Acad Sci U S A. 2015;112:15078-15083. PubMed
17. Davis CS, Southwell JK, Niehaus VR, Walley AY, Dailey MW. Emergency medical services naloxone access: a national systematic legal review. Acad Emerg Med. 2014;21:1173-1177. PubMed
1. Ronan MV, Herzig SJ. Hospitalizations Related To Opioid Abuse/Dependence And Associated Serious Infections Increased Sharply, 2002-12. Health Aff (Millwood). 2016;35:832-837. PubMed
2. Florence CS, Zhou C, Luo F, Xu L. The Economic Burden of Prescription Opioid Overdose, Abuse, and Dependence in the United States, 2013. Med Care. 2016;54:901-906. PubMed
3. Jennifer PS, Michael JW, Douglas H, John M, Michael DH. The Critical Care Crisis of Opioid Overdoses in the U.S. In: C95 OUTSTANDING EPIDEMIOLOGY AND HEALTH SERVICES RESEARCH IN CRITICAL CARE: American Thoracic Society 2016 International Conference; 2016 May 13-18; San Francisco, CA:A6146-A.
4. Owens PL, Barrett ML, Weiss AJ, Washington RE, Kronick R. Hospital Inpatient Utilization Related to Opioid Overuse Among Adults, 1993-2012: Statistical Brief #177. Healthcare Cost and Utilization Project (HCUP) Statistical Briefs; 2006. https://www.hcup-us.ahrq.gov/reports/statbriefs/sb177-Hospitalizations-for-Opioid-Overuse.jsp. Accessed January 4, 2017
5. Fanucchi L, Lofwall MR. Putting Parity into Practice - Integrating Opioid-Use Disorder Treatment into the Hospital Setting. N Engl J Med. 2016;375:811-813. PubMed
6. Liebschutz JM, Crooks D, Herman D, et al. Buprenorphine treatment for hospitalized, opioid-dependent patients: a randomized clinical trial. JAMA Intern Med. 2014;174:1369-1376. PubMed
7. Keyes KM, Cerda M, Brady JE, Havens JR, Galea S. Understanding the rural-urban differences in nonmedical prescription opioid use and abuse in the United States. Am J Public Health. 2014;104:e52-e59. PubMed
8. Rigg KK, Monnat SM. Urban vs. rural differences in prescription opioid misuse among adults in the United States: informing region specific drug policies and interventions. Int J Drug Policy. 2015;26:484-491. PubMed
9. Ellis AR, Konrad TR, Thomas KC, Morrissey JP. County-level estimates of mental health professional supply in the United States. Psychiatr Serv. 2009;60:1315-1322. PubMed
10. Rosenblatt RA, Andrilla CH, Catlin M, Larson EH. Geographic and specialty distribution of US physicians trained to treat opioid use disorder. Ann Fam Med. 2015;13:23-26. PubMed
11. Kaufman BG, Thomas SR, Randolph RK, et al. The Rising Rate of Rural Hospital Closures. J Rural Health. 2016;32:35-43. PubMed
12. Houchens RL DR, A Elixhauser. Using the HCUP National Inpatient Sample to Estimate Trends: U.S. Agency for Healthcare Research and Quality; 2015. Report No.: 2006-05
13. Unick GJ, Rosenblum D, Mars S, Ciccarone D. Intertwined epidemics: national demographic trends in hospitalizations for heroin- and opioid-related overdoses, 1993-2009. PLoS One. 2013;8:e54496.
14. Urban Influence Codes. USDA, 2016. https://www.ers.usda.gov/data-products/urban-influence-codes.aspx. Accessed January 4, 2017
15. Rudd RA, Seth P, David F, Scholl L. Increases in Drug and Opioid-Involved Overdose Deaths - United States, 2010-2015. MMWR Morb Mortal Wkly Rep. 2016;65:1445-1452. PubMed
16. Case A, Deaton A. Rising morbidity and mortality in midlife among white non-Hispanic Americans in the 21st century. Proc Natl Acad Sci U S A. 2015;112:15078-15083. PubMed
17. Davis CS, Southwell JK, Niehaus VR, Walley AY, Dailey MW. Emergency medical services naloxone access: a national systematic legal review. Acad Emerg Med. 2014;21:1173-1177. PubMed
© 2017 Society of Hospital Medicine
Reducing Overtreatment without Backsliding
Quality improvement is a key component of hospital medicine. The naïve assumption implicit in many quality improvement efforts is that physicians are highly trained scientists who, when shown a better way with a new practice guideline, will logically change their practice accordingly. In real life, mere education often doesn’t change behavior. This human quirk is an endless surprise to some physicians but is just standard fare for those with a Master’s of Business Administration.
This has especially been true when the change involves eliminating ineffective practices when there are no economic incentives to replace them with a new drug or test. For instance, the prescription of inappropriate antibiotics for adults with bronchitis1 remained unchanged despite 40 years of scientific evidence that the practice is ineffective, although there is clear evidence that it leads to dangerous antibiotic resistance, and regardless of 15 years of educational efforts by the government.
A common paradigm for progress is Everett Rogers’ theory on the diffusion of innovation.2 There are innovators and early adopters for any new idea and also laggards. When the innovation involves clinical decision making, research shows that human thought processes are not necessarily linear or logical.3 Changing prescribing habits is difficult. Various methodologies can be used to nudge4 people to modify their behavior. I recommend that all hospitalists who perform quality improvement read the 3 books cited in this paragraph. (Better yet, read an executive summary of each of the books. The original books are long and repetitive.)
The Value in Pediatrics (VIP) bronchiolitis collaborative created a virtual peer group to share experiences, benchmark process measures, and collectively problem solve issues in order to provide evidence-based care for infants with bronchiolitis. Their efforts were successful and published in January 2016.5 The multicenter project markedly reduced use, at their home institutions, of unnecessary and ineffective treatments. Those bootstrap efforts in hospital medicine compare favorably with the gigantic 4-year study6 published a month later, which documents similar efforts of a Primary Care Practice Research Network project to reduce inappropriate prescribing of antibiotics for simple upper respiratory infections in the outpatient world. There are many parallels between those 2 projects. Both yield insight into management methods that can reduce overtreatment.
The next logical question that a skeptical hospital Chief Executive Officer would ask is, “Will these improved behaviors continue once the research projects are over?” All doctors are familiar with backsliding when it comes to alcoholism, smoking, and dieting. Bad habits often return.
The first sentence of the discussion section in the article by Shadman et al.7 says it all. “To our knowledge, this is the first report of sustained improvements in care achieved through a multiinstitutional quality improvement collaborative of community and academic hospitals focused on bronchiolitis care.” The history of medicine has many examples where a multicenter study has led to the adoption of new treatments or new diagnostic tests. The typical progress of medicine has been the replacement of less effective treatments with better ones. But it is rare and difficult to eliminate, without substitution, ineffective treatments once they are in widespread use. This is the challenge facing the Choosing Wisely™ approach. Established habits of overtesting, overdiagnosis and overtreatment are refractory to correction, other than by replacing retirees with a new generation of physicians.
The confirmation that the previously announced improvements are being sustained will encourage other hospital groups to adopt some of the management methodology of the VIP bronchiolitis collaborative. The collaborative aimed to change medical practice but didn’t identify which of the many management techniques it employed led to behaviors being sustainably changed. The aforementioned much larger (and far more expensive) outpatient project by Meeker et al.6 was designed to tease out which of 3 management methodologies promoted the most change. I anticipate those authors will publish their sustainability data in the near future.
The Shadman et al.7 article is limited by weak statistical measures. The P values for the sustainability in the bottom row of Table 1 probe whether any backsliding was statistically different from 0. Because there are no corresponding power calculations, I don’t find those helpful. Given that only 9 centers continued to submit data, the lack of statistical significance may reflect wide error bars rather than small changes in clinical behavior. However, by comparing the confidence intervals for the process measures during the sustainability period to the means at baseline, one can deduce that clinically significant changes were achieved and that clinically significant backsliding did not occur over the following year.
Another limitation is that the 9 hospitals involved were still collecting and submitting data. As a result, the Hawthorne Effect (people behave differently when they know they are being observed) is still very active and may temporarily be preventing regression in behavior.
The study authors admit the limitation that there may be selection bias in the groups that chose to work the extra year. The authors do a reasonable job trying to find evidence of that selection bias and don’t find it. However, all participants in the original study were self selected and dedicated to a cause, so extrapolating these results to less motivated physician groups may be suspect. Despite those limitations, the evidence for sustainability in eliminating overtreatment is encouraging for anyone involved in Choosing Wisely™endeavors.
Disclosure
The author reports no conflicts of interest.
1. Barnett ML, Linder JA. Antibiotic prescribing for adults with acute bronchitis in the United States, 1996-2010. JAMA. 2014;311(19):2020-2021. PubMed
2. Rogers EM. Diffusion of Innovations. 5th ed. New York: Free Press; 2003.
3. Kahneman D. Thinking, fast and slow. New York: Farrar, Straus and Giroux; 2011.
4. Thaler RH, Sunstein CR. Nudge. Improving decisions about health, wealth, and happiness. New York: Penguin Books; 2009.
5. Ralston SL, Garber MD, Rice-Conboy E, et al. A multicenter collaborative to reduce unnecessary care in inpatient bronchiolitis. Pediatrics. 2016;137(1):e20150851. PubMed
6. Meeker D, Linder JA, Fox CR, et al. Effect of behavioral interventions on inappropriate antibiotic prescribing among primary care practices. A randomized clinical trial. JAMA. 2016;315(6):562-570. PubMed
7. Shadman KA, Ralston SL, Garber MD. Sustainability in the AAP bronchiolitis quality improvement project. J Hosp Med. 2017;12(11):905-910. PubMed
Quality improvement is a key component of hospital medicine. The naïve assumption implicit in many quality improvement efforts is that physicians are highly trained scientists who, when shown a better way with a new practice guideline, will logically change their practice accordingly. In real life, mere education often doesn’t change behavior. This human quirk is an endless surprise to some physicians but is just standard fare for those with a Master’s of Business Administration.
This has especially been true when the change involves eliminating ineffective practices when there are no economic incentives to replace them with a new drug or test. For instance, the prescription of inappropriate antibiotics for adults with bronchitis1 remained unchanged despite 40 years of scientific evidence that the practice is ineffective, although there is clear evidence that it leads to dangerous antibiotic resistance, and regardless of 15 years of educational efforts by the government.
A common paradigm for progress is Everett Rogers’ theory on the diffusion of innovation.2 There are innovators and early adopters for any new idea and also laggards. When the innovation involves clinical decision making, research shows that human thought processes are not necessarily linear or logical.3 Changing prescribing habits is difficult. Various methodologies can be used to nudge4 people to modify their behavior. I recommend that all hospitalists who perform quality improvement read the 3 books cited in this paragraph. (Better yet, read an executive summary of each of the books. The original books are long and repetitive.)
The Value in Pediatrics (VIP) bronchiolitis collaborative created a virtual peer group to share experiences, benchmark process measures, and collectively problem solve issues in order to provide evidence-based care for infants with bronchiolitis. Their efforts were successful and published in January 2016.5 The multicenter project markedly reduced use, at their home institutions, of unnecessary and ineffective treatments. Those bootstrap efforts in hospital medicine compare favorably with the gigantic 4-year study6 published a month later, which documents similar efforts of a Primary Care Practice Research Network project to reduce inappropriate prescribing of antibiotics for simple upper respiratory infections in the outpatient world. There are many parallels between those 2 projects. Both yield insight into management methods that can reduce overtreatment.
The next logical question that a skeptical hospital Chief Executive Officer would ask is, “Will these improved behaviors continue once the research projects are over?” All doctors are familiar with backsliding when it comes to alcoholism, smoking, and dieting. Bad habits often return.
The first sentence of the discussion section in the article by Shadman et al.7 says it all. “To our knowledge, this is the first report of sustained improvements in care achieved through a multiinstitutional quality improvement collaborative of community and academic hospitals focused on bronchiolitis care.” The history of medicine has many examples where a multicenter study has led to the adoption of new treatments or new diagnostic tests. The typical progress of medicine has been the replacement of less effective treatments with better ones. But it is rare and difficult to eliminate, without substitution, ineffective treatments once they are in widespread use. This is the challenge facing the Choosing Wisely™ approach. Established habits of overtesting, overdiagnosis and overtreatment are refractory to correction, other than by replacing retirees with a new generation of physicians.
The confirmation that the previously announced improvements are being sustained will encourage other hospital groups to adopt some of the management methodology of the VIP bronchiolitis collaborative. The collaborative aimed to change medical practice but didn’t identify which of the many management techniques it employed led to behaviors being sustainably changed. The aforementioned much larger (and far more expensive) outpatient project by Meeker et al.6 was designed to tease out which of 3 management methodologies promoted the most change. I anticipate those authors will publish their sustainability data in the near future.
The Shadman et al.7 article is limited by weak statistical measures. The P values for the sustainability in the bottom row of Table 1 probe whether any backsliding was statistically different from 0. Because there are no corresponding power calculations, I don’t find those helpful. Given that only 9 centers continued to submit data, the lack of statistical significance may reflect wide error bars rather than small changes in clinical behavior. However, by comparing the confidence intervals for the process measures during the sustainability period to the means at baseline, one can deduce that clinically significant changes were achieved and that clinically significant backsliding did not occur over the following year.
Another limitation is that the 9 hospitals involved were still collecting and submitting data. As a result, the Hawthorne Effect (people behave differently when they know they are being observed) is still very active and may temporarily be preventing regression in behavior.
The study authors admit the limitation that there may be selection bias in the groups that chose to work the extra year. The authors do a reasonable job trying to find evidence of that selection bias and don’t find it. However, all participants in the original study were self selected and dedicated to a cause, so extrapolating these results to less motivated physician groups may be suspect. Despite those limitations, the evidence for sustainability in eliminating overtreatment is encouraging for anyone involved in Choosing Wisely™endeavors.
Disclosure
The author reports no conflicts of interest.
Quality improvement is a key component of hospital medicine. The naïve assumption implicit in many quality improvement efforts is that physicians are highly trained scientists who, when shown a better way with a new practice guideline, will logically change their practice accordingly. In real life, mere education often doesn’t change behavior. This human quirk is an endless surprise to some physicians but is just standard fare for those with a Master’s of Business Administration.
This has especially been true when the change involves eliminating ineffective practices when there are no economic incentives to replace them with a new drug or test. For instance, the prescription of inappropriate antibiotics for adults with bronchitis1 remained unchanged despite 40 years of scientific evidence that the practice is ineffective, although there is clear evidence that it leads to dangerous antibiotic resistance, and regardless of 15 years of educational efforts by the government.
A common paradigm for progress is Everett Rogers’ theory on the diffusion of innovation.2 There are innovators and early adopters for any new idea and also laggards. When the innovation involves clinical decision making, research shows that human thought processes are not necessarily linear or logical.3 Changing prescribing habits is difficult. Various methodologies can be used to nudge4 people to modify their behavior. I recommend that all hospitalists who perform quality improvement read the 3 books cited in this paragraph. (Better yet, read an executive summary of each of the books. The original books are long and repetitive.)
The Value in Pediatrics (VIP) bronchiolitis collaborative created a virtual peer group to share experiences, benchmark process measures, and collectively problem solve issues in order to provide evidence-based care for infants with bronchiolitis. Their efforts were successful and published in January 2016.5 The multicenter project markedly reduced use, at their home institutions, of unnecessary and ineffective treatments. Those bootstrap efforts in hospital medicine compare favorably with the gigantic 4-year study6 published a month later, which documents similar efforts of a Primary Care Practice Research Network project to reduce inappropriate prescribing of antibiotics for simple upper respiratory infections in the outpatient world. There are many parallels between those 2 projects. Both yield insight into management methods that can reduce overtreatment.
The next logical question that a skeptical hospital Chief Executive Officer would ask is, “Will these improved behaviors continue once the research projects are over?” All doctors are familiar with backsliding when it comes to alcoholism, smoking, and dieting. Bad habits often return.
The first sentence of the discussion section in the article by Shadman et al.7 says it all. “To our knowledge, this is the first report of sustained improvements in care achieved through a multiinstitutional quality improvement collaborative of community and academic hospitals focused on bronchiolitis care.” The history of medicine has many examples where a multicenter study has led to the adoption of new treatments or new diagnostic tests. The typical progress of medicine has been the replacement of less effective treatments with better ones. But it is rare and difficult to eliminate, without substitution, ineffective treatments once they are in widespread use. This is the challenge facing the Choosing Wisely™ approach. Established habits of overtesting, overdiagnosis and overtreatment are refractory to correction, other than by replacing retirees with a new generation of physicians.
The confirmation that the previously announced improvements are being sustained will encourage other hospital groups to adopt some of the management methodology of the VIP bronchiolitis collaborative. The collaborative aimed to change medical practice but didn’t identify which of the many management techniques it employed led to behaviors being sustainably changed. The aforementioned much larger (and far more expensive) outpatient project by Meeker et al.6 was designed to tease out which of 3 management methodologies promoted the most change. I anticipate those authors will publish their sustainability data in the near future.
The Shadman et al.7 article is limited by weak statistical measures. The P values for the sustainability in the bottom row of Table 1 probe whether any backsliding was statistically different from 0. Because there are no corresponding power calculations, I don’t find those helpful. Given that only 9 centers continued to submit data, the lack of statistical significance may reflect wide error bars rather than small changes in clinical behavior. However, by comparing the confidence intervals for the process measures during the sustainability period to the means at baseline, one can deduce that clinically significant changes were achieved and that clinically significant backsliding did not occur over the following year.
Another limitation is that the 9 hospitals involved were still collecting and submitting data. As a result, the Hawthorne Effect (people behave differently when they know they are being observed) is still very active and may temporarily be preventing regression in behavior.
The study authors admit the limitation that there may be selection bias in the groups that chose to work the extra year. The authors do a reasonable job trying to find evidence of that selection bias and don’t find it. However, all participants in the original study were self selected and dedicated to a cause, so extrapolating these results to less motivated physician groups may be suspect. Despite those limitations, the evidence for sustainability in eliminating overtreatment is encouraging for anyone involved in Choosing Wisely™endeavors.
Disclosure
The author reports no conflicts of interest.
1. Barnett ML, Linder JA. Antibiotic prescribing for adults with acute bronchitis in the United States, 1996-2010. JAMA. 2014;311(19):2020-2021. PubMed
2. Rogers EM. Diffusion of Innovations. 5th ed. New York: Free Press; 2003.
3. Kahneman D. Thinking, fast and slow. New York: Farrar, Straus and Giroux; 2011.
4. Thaler RH, Sunstein CR. Nudge. Improving decisions about health, wealth, and happiness. New York: Penguin Books; 2009.
5. Ralston SL, Garber MD, Rice-Conboy E, et al. A multicenter collaborative to reduce unnecessary care in inpatient bronchiolitis. Pediatrics. 2016;137(1):e20150851. PubMed
6. Meeker D, Linder JA, Fox CR, et al. Effect of behavioral interventions on inappropriate antibiotic prescribing among primary care practices. A randomized clinical trial. JAMA. 2016;315(6):562-570. PubMed
7. Shadman KA, Ralston SL, Garber MD. Sustainability in the AAP bronchiolitis quality improvement project. J Hosp Med. 2017;12(11):905-910. PubMed
1. Barnett ML, Linder JA. Antibiotic prescribing for adults with acute bronchitis in the United States, 1996-2010. JAMA. 2014;311(19):2020-2021. PubMed
2. Rogers EM. Diffusion of Innovations. 5th ed. New York: Free Press; 2003.
3. Kahneman D. Thinking, fast and slow. New York: Farrar, Straus and Giroux; 2011.
4. Thaler RH, Sunstein CR. Nudge. Improving decisions about health, wealth, and happiness. New York: Penguin Books; 2009.
5. Ralston SL, Garber MD, Rice-Conboy E, et al. A multicenter collaborative to reduce unnecessary care in inpatient bronchiolitis. Pediatrics. 2016;137(1):e20150851. PubMed
6. Meeker D, Linder JA, Fox CR, et al. Effect of behavioral interventions on inappropriate antibiotic prescribing among primary care practices. A randomized clinical trial. JAMA. 2016;315(6):562-570. PubMed
7. Shadman KA, Ralston SL, Garber MD. Sustainability in the AAP bronchiolitis quality improvement project. J Hosp Med. 2017;12(11):905-910. PubMed
© 2017 Society of Hospital Medicine
Sustainability in the AAP Bronchiolitis Quality Improvement Project
Acute viral bronchiolitis is the most common cause of hospitalization for children less than 1 year of age.1 Overuse of ineffective therapies has persisted despite the existence of the evidence-based American Academy of Pediatrics (AAP) clinical practice guideline (CPG), which recommends primarily supportive care.2-8 Adherence to the AAP CPG recommendations for management of bronchiolitis improved significantly through the AAP’s Bronchiolitis Quality Improvement Project (BQIP), a 12-month, multiinstitutional collaborative of community and free-standing children’s hospitals.9 This subsequent study investigates if these improvements were sustained after completion of the formal 12-month project.
Published multiinstitutional bronchiolitis quality improvement (QI) work is limited to 1 study5 that describes the results of a single intervention season at academic medical centers. Multiyear bronchiolitis QI projects are limited to single-center studies, and results have been mixed.5,6,8,10-13 One study11 observed continued improvement in bronchodilator use in subsequent seasons, whereas a second study10 observed a return to baseline bronchodilator use in the following season. Mittal6 observed inconsistent improvements in key bronchiolitis measures during postintervention seasons.
Our specific aim was to assess the sustainability of improvements in bronchiolitis management at participating institutions 1 year following completion of the AAP BQIP collaborative.9 Because no studies demonstrate the most effective way to support long-term improvement through a QI collaborative, we hypothesized that the initial collaborative activities, which were designed to build the capacity of local interdisciplinary teams while providing standardized evidence-based care pathways, would lead to performance in the subsequent season at levels similar to or better than those observed during the active phase of the collaborative, without additional project interventions.
METHODS
Study Design and Setting
This was a follow-up study of the AAP Quality Improvement Innovation Networks project entitled “A Quality Collaborative for Improving Hospital Compliance with the AAP Bronchiolitis Guideline” (BQIP).9 The AAP Institutional Review Board approved this project.
Twenty-one multidisciplinary, hospital-based teams participated in the BQIP collaborative and provided monthly data during the January through March bronchiolitis season. Teams submitted 2013 baseline data and 2014 intervention data. Nine sites provided 2015 sustainability data following the completion of the collaborative.
Participants
Hospital encounters with a primary diagnosis of acute viral bronchiolitis were eligible for inclusion among patients from 1 month to 2 years of age. Encounters were excluded for prematurity (<35 weeks gestational age), congenital heart disease, bronchopulmonary dysplasia, genetic, congenital or neuromuscular abnormalities, and pediatric intensive-care admission.
Data Collection
Hospital characteristics were collected, including hospital type (academic, community), bed size, location (urban, rural), hospital distributions of race/ethnicity and public payer, cases of bronchiolitis per year, presence of an electronic medical record and a pediatric respiratory therapist, and self-rated QI knowledge of the multidisciplinary team (very knowledgeable, knowledgeable, and somewhat knowledgeable). A trained member at each site collected data through structured chart review in baseline, intervention, and sustainability bronchiolitis seasons for January, February, and March. Site members reviewed the first 20 charts per month that met the inclusion criteria or all charts if there were fewer than 20 eligible encounters. Sites input data about key quality measures into the AAP’s Quality Improvement Data Aggregator, a web-based data repository.
Intervention
The BQIP project was designed as a virtual collaborative consisting of monthly education webinars about QI methods and bronchiolitis management, opportunities for collaboration via teleconference and e-mail listserv, and individual site-coaching by e-mail or telephone.9 A change package was shared with sites that included examples of evidence-based pathways, ordersets, a respiratory scoring tool, communication tools for parents and referring physicians, and slide sets for individual site education efforts. Following completion of the collaborative, written resources remained available to participants, although virtual collaboration ceased and no additional project interventions to promote sustainability were introduced.
Bronchiolitis Process and Outcome Measures
Process measures following admission included the following: severity assessment using a respiratory score, respiratory score use to assess response to bronchodilators, bronchodilator use, bronchodilator doses, steroid doses per patient encounter, chest radiographs per encounter, and presence of an order to transition to intermittent pulse oximetry monitoring. Outcome measures included length of stay and readmissions within 72 hours.
Analysis
Changes among baseline-, intervention-, and sustainability-season data were assessed using generalized linear mixed-effects models with random effect for study sites. Negative binomial models were used for count variables to allow for overdispersion. Length of stay was log-transformed to achieve a normal distribution. We also analyzed each site individually to assess whether sustained improvements were the result of broad sustainability across all sites or whether they represented an aggregation of some sites that continued to improve while other sites actually worsened.
To address any bias introduced by the voluntary and incomplete participation of sites in the sustainability season, we planned a priori to conduct 3 additional analyses. First, we compared the characteristics of sites that did participate in the sustainability season with those that did not participate by using Chi-squared tests for differences in proportions and t tests for differences in means. Second, we determined whether the baseline-season process and outcome measures were different between sites that did and did not participate using descriptive statistics. Third, we assessed whether improvements between the baseline and intervention seasons were different between sites that did and did not participate using a linear mixed-effects model for normally distributed outcomes and generalized linear mixed-effects model with site-specific random effects for nonnormally distributed outcomes. All study outcomes were summarized in terms of model-adjusted means along with the corresponding 95% confidence intervals. All P values are 2-sided, and P < 0.05 was used to define statistical significance. Data analyses were conducted using SAS software (SAS Institute Inc., Cary, North Carolina) version 9.4.
RESULTS
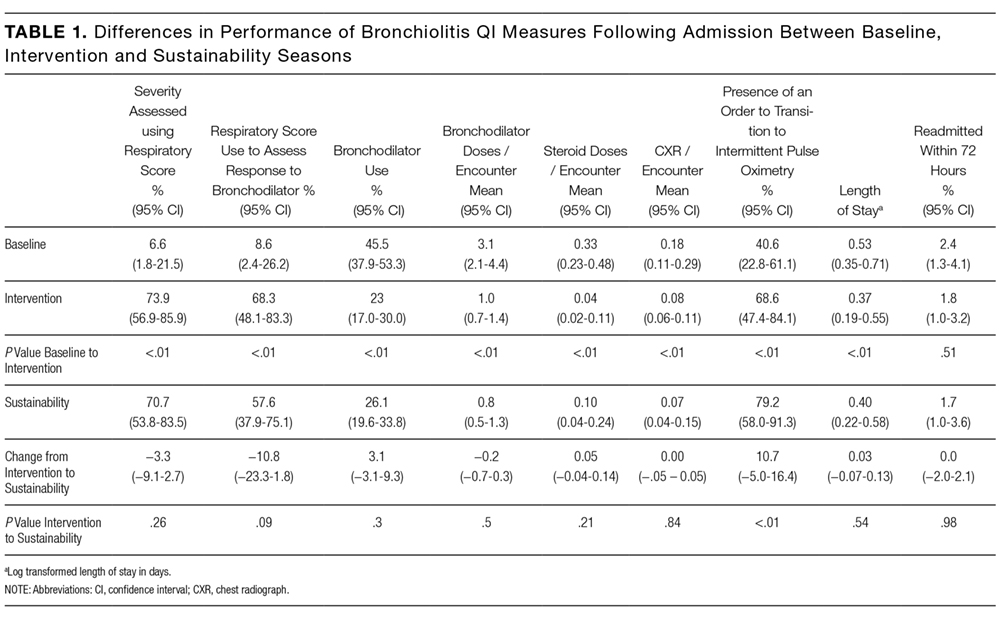
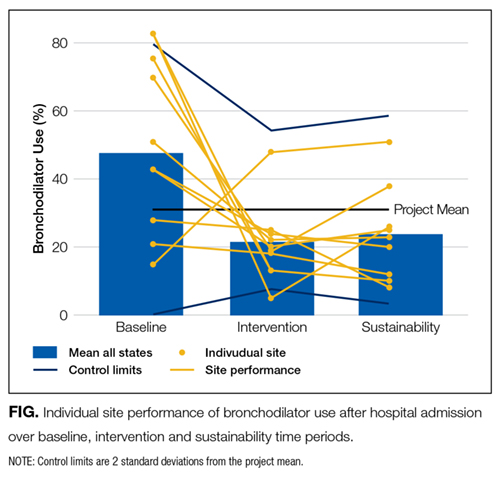

Differences in baseline bronchiolitis quality measures between sites that did and did not participate in the sustainability season are displayed in Table 3. Sustainability sites had significantly lower baseline use of a respiratory score, both to assess severity of illness at any point after hospitalization as well as to assess responsiveness following bronchodilator treatments (P < 0.001). At baseline they also had fewer orders for intermittent pulse oximetry use (P = 0.01) and fewer doses of bronchodilators per encounter (P = 0.04). Sites were not significantly different in their baseline use of bronchodilators, oral steroid doses, or chest radiographs. Sites that participated in the sustainability season demonstated larger magnitude improvement between baseline and intervention seasons for respiratory score use (P < 0.001 for any use and P = 0.02 to assess bronchodilator responsiveness; Appendix 1b).
DISCUSSION

To our knowledge, this is the first report of sustained improvements in care achieved through a multiinstitutional QI collaborative of community and academic hospitals focused on bronchiolitis care. We found that overall sites participating in a national bronchiolitis QI project sustained improvements in key bronchiolitis quality measures for 1 year following the project’s completion. For the aggregate group no measures worsened, and one measure, orders for intermittent pulse oximetry monitoring, continued to increase during the sustainability season. Furthermore, the sustained improvements were primarily the result of consistent sustained performance of each individual site, as opposed to averages wherein some sites worsened while others improved (Appendix 1a). These findings suggest that designing a collaborative approach, which provides an evidence-based best-practice toolkit while building the QI capacity of local interdisciplinary teams, can support performance gains that persist beyond the project’s active phase.
There are a number of possible reasons why improvements were sustained following the collaborative. The BQIP requirement for institutional leadership buy-in may have motivated accountability to local leaders in subsequent bronchiolitis seasons at each site. We suspect that culture change such as flattened hierarchies through multidisciplinary teams,14 which empowered nurse and respiratory therapy staff, may have facilitated consistent use of tools created locally. The synergy of interdisciplinary teams composed of physician, nurse, and respiratory therapy champions may have created accountability to perpetuate the previous year’s efforts.15 In addition, the sites adopted elements of the evidence-based toolkit, such as pathways,16,17 forcing function tools13,18 and order sets that limited management decision options and bronchodilator use contingent on respiratory scores,9,19 which may have driven desired behaviors.
Moreover, the 2014 AAP CPG for the management of bronchiolitis,20 released prior to the sustainability bronchiolitis season, may have underscored the key concepts of the collaborative. Similarly, national exposure of best practices for bronchiolitis management, including the 3 widespread Choosing Wisely recommendations related to bronchiolitis,21 might have been a compelling reason for sites to maintain their improvement efforts and contribute to secular trends toward decreasing interventions in bronchiolitis management nationally.3 Lastly, the mechanisms developed for local data collection may have created opportunities at each site to conduct ongoing evaluation of performance on key bronchiolitis quality measures through data-driven feedback systems.22 Our study highlights the need for additional research in order to understand why improvements are or are not sustained.
Even with substantial, sustained improvements in this initiative, further reduction in unnecessary care may be possible. Findings from previous studies suggest that even multifaceted QI interventions, including provider education, guidelines and use of respiratory scores, may only modestly reduce bronchodilators, steroids, and chest radiograph use.8,13 To achieve continued improvements in bronchiolitis care, additional active efforts may be needed to develop new interventions that target root causes for areas of overuse at individual sites.
Future multiinstitutional collaboratives might benefit their participants if they include a focus on helping sites develop skills to ensure that local improvement activities continue after the collaborative phases are completed. Proactively scheduling intermittent check-ins with collaborative members to discuss experiences with both sustainability and ongoing improvement may be valuable and likely needs to be incorporated into the initial collaborative planning.
As these sustainability data represent a subset of 9 of the original 21 BQIP sites, there is concern for potential selection bias related to factors that could have motivated sites to participate in the sustainability season’s data collection and simultaneously influenced their performance. These concerns were mitigated to some extent through 3 specific analyses: finding limited differences in hospital characteristics, baseline performance in key bronchiolitis measures, and performance change from baseline to intervention seasons between sites that did and did not participate in the sustainability season.
Notably, sites that participated in the sustainability phase actually had lower baseline respiratory score use and fewer orders for intermittent pulse oximetry at baseline. Theoretically, if participation in the collaborative highlighted this disparity for these sites, it could have been a motivating factor for their continued participation and sustained performance across these measures. Similarly, sites that recognized their higher baseline performance through participation in the collaborative might have felt less motivation to participate in ongoing data collection during the sustainability season. Whether they might have also sustained, declined, or continued improving is not known. Additionally, the magnitude of improvement in the collaborative period might have also motivated ongoing participation during the sustainability phase. For example, although all sites improved in score use during the collaborative, sites participating in the sustainability season demonstrated significantly more improvement in these measures. Sites with a higher magnitude of improvement in collaborative measures might have more enthusiasm about the project, more commitment to the project activities, or feel a sense of obligation to respond to requests for additional data collection.
This work has several limitations. Selection bias may limit generalizability of the results, as sites that did not participate in the sustainability season may have had different results than those that did participate. It is unknown whether sites that regressed toward their baseline were deterred from participating in the sustainability season. The analyses that we were able to preform, however, suggest that the 2 groups were similar in their characteristics as well as in their baseline and improvement performance.
We have limited knowledge of the local improvement work that sites conducted between the completion of the collaborative and the sustainability season. Site-specific factors may have influenced improvement sustainability. For example, qualitative research with the original group found that team engagement had a quantitative association with better performance, but only for the bronchodilator use measure.23 Sites were responsible for their own data collection, and despite attempts to centralize and standardize the process, data collection inconsistencies may have occurred. For instance, it is unknown how closely that orders for intermittent pulse oximetry correlate with intermittent use at the bedside. Lastly, the absence of a control group limits examination of the causal relationships of interventions and the influence of secular trends.
CONCLUSIONS
Improvements gained during the BQIP collaborative were sustained at 1 year following completion of the collaborative. These findings are encouraging, as national QI collaborative efforts are increasingly common. Our findings suggest that opportunities exist to even further reduce unnecessary care in the management of bronchiolitis. Such opportunities highlight the importance of integrating strategies to both measure sustainability and plan for ongoing independent local activities after completion of the collaborative. Future efforts should focus on supporting local sites to continue individual practice-improvement as they transition from collaborative to independent quality initiatives.
Acknowledgments
The authors thank the 21 hospitals that participated in the BQIP collaborative, and in particular the 9 hospital teams that contributed sustainability data for their ongoing dedication. There was no external funding for this manuscript.
Disclosure
The authors report no financial conflicts of interest.
1. Healthcare Cost and Utilization Project (HCUP) KID Trends Supplemental File. Agency for Healthcare Research and Quality website. http://hcupnet.ahrq.gov/HCUPnet.jsp?Id=2C331B13FB40957D&Form=DispTab&JS=Y&Action=Accept. 2012. Accessed July 21, 2016.
2. Ralston S, Parikh K, Goodman D. Benchmarking overuse of medical interventions for bronchiolitis. JAMA Pediatr. 2015;169:805-806. PubMed
3. Parikh K, Hall M, Teach SJ. Bronchiolitis management before and after the AAP guidelines. Pediatrics. 2014;133:e1-e7. PubMed
4. Johnson LW, Robles J, Hudgins A, Osburn S, Martin D, Thompson A. Management of bronchiolitis in the emergency department: impact of evidence-based guidelines? Pediatrics. 2013;131 Suppl 1:S103-S109. PubMed
5. Kotagal UR, Robbins JM, Kini NM, Schoettker PJ, Atherton HD, Kirschbaum MS. Impact of a bronchiolitis guideline: a multisite demonstration project. Chest. 2002;121:1789-1797. PubMed
6. Mittal V, Darnell C, Walsh B, et al. Inpatient bronchiolitis guideline implementation and resource utilization. Pediatrics. 2014;133:e730-e737. PubMed
7. Mittal V, Hall M, Morse R, et al. Impact of inpatient bronchiolitis clinical practice guideline implementation on testing and treatment. J Pediatr. 2014;165:570.e3-576.e3. PubMed
8. Ralston S, Garber M, Narang S, et al. Decreasing unnecessary utilization in acute bronchiolitis care: results from the value in inpatient pediatrics network. J Hosp Med. 2013;8:25-30. PubMed
9. Ralston SL, Garber MD, Rice-Conboy E, et al. A multicenter collaborative to reduce unnecessary care in inpatient bronchiolitis. Pediatrics. 2016;137. PubMed
10. Perlstein PH, Kotagal UR, Schoettker PJ, et al. Sustaining the implementation of an evidence-based guideline for bronchiolitis. Arch Pediatr Adolesc Med. 2000;154:1001-1007. PubMed
11. Walker C, Danby S, Turner S. Impact of a bronchiolitis clinical care pathway on treatment and hospital stay. Eur J Pediatr. 2012;171:827-832. PubMed
12. Cheney J, Barber S, Altamirano L, et al. A clinical pathway for bronchiolitis is effective in reducing readmission rates. J Pediatr. 2005;147:622-626. PubMed
13. Ralston S, Comick A, Nichols E, Parker D, Lanter P. Effectiveness of quality improvement in hospitalization for bronchiolitis: a systematic review. Pediatrics. 2014;134:571-581. PubMed
14. Schwartz RW, Tumblin TF. The power of servant leadership to transform health care organizations for the 21st-century economy. Arch Surg. 2002;137:1419-1427; discussion 27. PubMed
15. Schalock RL, Verdugo M, Lee T. A systematic approach to an organization’s sustainability. Eval Program Plann. 2016;56:56-63. PubMed
16. Wilson SD, Dahl BB, Wells RD. An evidence-based clinical pathway for bronchiolitis safely reduces antibiotic overuse. Am J Med Qual. 2002;17:195-199. PubMed
17. Muething S, Schoettker PJ, Gerhardt WE, Atherton HD, Britto MT, Kotagal UR. Decreasing overuse of therapies in the treatment of bronchiolitis by incorporating evidence at the point of care. J Pediatr. 2004;144:703-710. PubMed
18. Streiff MB, Carolan HT, Hobson DB, et al. Lessons from the Johns Hopkins multi-disciplinary venous thromboembolism (VTE) prevention collaborative. BMJ. 2012;344:e3935. PubMed
19. Todd J, Bertoch D, Dolan S. Use of a large national database for comparative evaluation of the effect of a bronchiolitis/viral pneumonia clinical care guideline on patient outcome and resource utilization. Arch Pediatr Adolesc Med. 2002;156:1086-1090. PubMed
20. Ralston SL, Lieberthal AS, Meissner HC, et al. Clinical practice guideline: the diagnosis, management, and prevention of bronchiolitis. Pediatrics. 2014;134:e1474-e1502. PubMed
21. Quinonez RA, Garber MD, Schroeder AR, et al. Choosing wisely in pediatric hospital medicine: five opportunities for improved healthcare value. J Hosp Med. 2013;8:479-485. PubMed
22. Stone S, Lee HC, Sharek PJ. Perceived factors associated with sustained improvement following participation in a multicenter quality improvement collaborative. Jt Comm J Qual Patient Saf. 2016;42:309-315. PubMed
23. Ralston SL, Atwood EC, Garber MD, Holmes AV. What works to reduce unnecessary care for bronchiolitis? A qualitative analysis of a national collaborative. Acad Pediatr. 2017;17(2):198-204. PubMed
Acute viral bronchiolitis is the most common cause of hospitalization for children less than 1 year of age.1 Overuse of ineffective therapies has persisted despite the existence of the evidence-based American Academy of Pediatrics (AAP) clinical practice guideline (CPG), which recommends primarily supportive care.2-8 Adherence to the AAP CPG recommendations for management of bronchiolitis improved significantly through the AAP’s Bronchiolitis Quality Improvement Project (BQIP), a 12-month, multiinstitutional collaborative of community and free-standing children’s hospitals.9 This subsequent study investigates if these improvements were sustained after completion of the formal 12-month project.
Published multiinstitutional bronchiolitis quality improvement (QI) work is limited to 1 study5 that describes the results of a single intervention season at academic medical centers. Multiyear bronchiolitis QI projects are limited to single-center studies, and results have been mixed.5,6,8,10-13 One study11 observed continued improvement in bronchodilator use in subsequent seasons, whereas a second study10 observed a return to baseline bronchodilator use in the following season. Mittal6 observed inconsistent improvements in key bronchiolitis measures during postintervention seasons.
Our specific aim was to assess the sustainability of improvements in bronchiolitis management at participating institutions 1 year following completion of the AAP BQIP collaborative.9 Because no studies demonstrate the most effective way to support long-term improvement through a QI collaborative, we hypothesized that the initial collaborative activities, which were designed to build the capacity of local interdisciplinary teams while providing standardized evidence-based care pathways, would lead to performance in the subsequent season at levels similar to or better than those observed during the active phase of the collaborative, without additional project interventions.
METHODS
Study Design and Setting
This was a follow-up study of the AAP Quality Improvement Innovation Networks project entitled “A Quality Collaborative for Improving Hospital Compliance with the AAP Bronchiolitis Guideline” (BQIP).9 The AAP Institutional Review Board approved this project.
Twenty-one multidisciplinary, hospital-based teams participated in the BQIP collaborative and provided monthly data during the January through March bronchiolitis season. Teams submitted 2013 baseline data and 2014 intervention data. Nine sites provided 2015 sustainability data following the completion of the collaborative.
Participants
Hospital encounters with a primary diagnosis of acute viral bronchiolitis were eligible for inclusion among patients from 1 month to 2 years of age. Encounters were excluded for prematurity (<35 weeks gestational age), congenital heart disease, bronchopulmonary dysplasia, genetic, congenital or neuromuscular abnormalities, and pediatric intensive-care admission.
Data Collection
Hospital characteristics were collected, including hospital type (academic, community), bed size, location (urban, rural), hospital distributions of race/ethnicity and public payer, cases of bronchiolitis per year, presence of an electronic medical record and a pediatric respiratory therapist, and self-rated QI knowledge of the multidisciplinary team (very knowledgeable, knowledgeable, and somewhat knowledgeable). A trained member at each site collected data through structured chart review in baseline, intervention, and sustainability bronchiolitis seasons for January, February, and March. Site members reviewed the first 20 charts per month that met the inclusion criteria or all charts if there were fewer than 20 eligible encounters. Sites input data about key quality measures into the AAP’s Quality Improvement Data Aggregator, a web-based data repository.
Intervention
The BQIP project was designed as a virtual collaborative consisting of monthly education webinars about QI methods and bronchiolitis management, opportunities for collaboration via teleconference and e-mail listserv, and individual site-coaching by e-mail or telephone.9 A change package was shared with sites that included examples of evidence-based pathways, ordersets, a respiratory scoring tool, communication tools for parents and referring physicians, and slide sets for individual site education efforts. Following completion of the collaborative, written resources remained available to participants, although virtual collaboration ceased and no additional project interventions to promote sustainability were introduced.
Bronchiolitis Process and Outcome Measures
Process measures following admission included the following: severity assessment using a respiratory score, respiratory score use to assess response to bronchodilators, bronchodilator use, bronchodilator doses, steroid doses per patient encounter, chest radiographs per encounter, and presence of an order to transition to intermittent pulse oximetry monitoring. Outcome measures included length of stay and readmissions within 72 hours.
Analysis
Changes among baseline-, intervention-, and sustainability-season data were assessed using generalized linear mixed-effects models with random effect for study sites. Negative binomial models were used for count variables to allow for overdispersion. Length of stay was log-transformed to achieve a normal distribution. We also analyzed each site individually to assess whether sustained improvements were the result of broad sustainability across all sites or whether they represented an aggregation of some sites that continued to improve while other sites actually worsened.
To address any bias introduced by the voluntary and incomplete participation of sites in the sustainability season, we planned a priori to conduct 3 additional analyses. First, we compared the characteristics of sites that did participate in the sustainability season with those that did not participate by using Chi-squared tests for differences in proportions and t tests for differences in means. Second, we determined whether the baseline-season process and outcome measures were different between sites that did and did not participate using descriptive statistics. Third, we assessed whether improvements between the baseline and intervention seasons were different between sites that did and did not participate using a linear mixed-effects model for normally distributed outcomes and generalized linear mixed-effects model with site-specific random effects for nonnormally distributed outcomes. All study outcomes were summarized in terms of model-adjusted means along with the corresponding 95% confidence intervals. All P values are 2-sided, and P < 0.05 was used to define statistical significance. Data analyses were conducted using SAS software (SAS Institute Inc., Cary, North Carolina) version 9.4.
RESULTS
Differences in baseline bronchiolitis quality measures between sites that did and did not participate in the sustainability season are displayed in Table 3. Sustainability sites had significantly lower baseline use of a respiratory score, both to assess severity of illness at any point after hospitalization as well as to assess responsiveness following bronchodilator treatments (P < 0.001). At baseline they also had fewer orders for intermittent pulse oximetry use (P = 0.01) and fewer doses of bronchodilators per encounter (P = 0.04). Sites were not significantly different in their baseline use of bronchodilators, oral steroid doses, or chest radiographs. Sites that participated in the sustainability season demonstated larger magnitude improvement between baseline and intervention seasons for respiratory score use (P < 0.001 for any use and P = 0.02 to assess bronchodilator responsiveness; Appendix 1b).
DISCUSSION
To our knowledge, this is the first report of sustained improvements in care achieved through a multiinstitutional QI collaborative of community and academic hospitals focused on bronchiolitis care. We found that overall sites participating in a national bronchiolitis QI project sustained improvements in key bronchiolitis quality measures for 1 year following the project’s completion. For the aggregate group no measures worsened, and one measure, orders for intermittent pulse oximetry monitoring, continued to increase during the sustainability season. Furthermore, the sustained improvements were primarily the result of consistent sustained performance of each individual site, as opposed to averages wherein some sites worsened while others improved (Appendix 1a). These findings suggest that designing a collaborative approach, which provides an evidence-based best-practice toolkit while building the QI capacity of local interdisciplinary teams, can support performance gains that persist beyond the project’s active phase.
There are a number of possible reasons why improvements were sustained following the collaborative. The BQIP requirement for institutional leadership buy-in may have motivated accountability to local leaders in subsequent bronchiolitis seasons at each site. We suspect that culture change such as flattened hierarchies through multidisciplinary teams,14 which empowered nurse and respiratory therapy staff, may have facilitated consistent use of tools created locally. The synergy of interdisciplinary teams composed of physician, nurse, and respiratory therapy champions may have created accountability to perpetuate the previous year’s efforts.15 In addition, the sites adopted elements of the evidence-based toolkit, such as pathways,16,17 forcing function tools13,18 and order sets that limited management decision options and bronchodilator use contingent on respiratory scores,9,19 which may have driven desired behaviors.
Moreover, the 2014 AAP CPG for the management of bronchiolitis,20 released prior to the sustainability bronchiolitis season, may have underscored the key concepts of the collaborative. Similarly, national exposure of best practices for bronchiolitis management, including the 3 widespread Choosing Wisely recommendations related to bronchiolitis,21 might have been a compelling reason for sites to maintain their improvement efforts and contribute to secular trends toward decreasing interventions in bronchiolitis management nationally.3 Lastly, the mechanisms developed for local data collection may have created opportunities at each site to conduct ongoing evaluation of performance on key bronchiolitis quality measures through data-driven feedback systems.22 Our study highlights the need for additional research in order to understand why improvements are or are not sustained.
Even with substantial, sustained improvements in this initiative, further reduction in unnecessary care may be possible. Findings from previous studies suggest that even multifaceted QI interventions, including provider education, guidelines and use of respiratory scores, may only modestly reduce bronchodilators, steroids, and chest radiograph use.8,13 To achieve continued improvements in bronchiolitis care, additional active efforts may be needed to develop new interventions that target root causes for areas of overuse at individual sites.
Future multiinstitutional collaboratives might benefit their participants if they include a focus on helping sites develop skills to ensure that local improvement activities continue after the collaborative phases are completed. Proactively scheduling intermittent check-ins with collaborative members to discuss experiences with both sustainability and ongoing improvement may be valuable and likely needs to be incorporated into the initial collaborative planning.
As these sustainability data represent a subset of 9 of the original 21 BQIP sites, there is concern for potential selection bias related to factors that could have motivated sites to participate in the sustainability season’s data collection and simultaneously influenced their performance. These concerns were mitigated to some extent through 3 specific analyses: finding limited differences in hospital characteristics, baseline performance in key bronchiolitis measures, and performance change from baseline to intervention seasons between sites that did and did not participate in the sustainability season.
Notably, sites that participated in the sustainability phase actually had lower baseline respiratory score use and fewer orders for intermittent pulse oximetry at baseline. Theoretically, if participation in the collaborative highlighted this disparity for these sites, it could have been a motivating factor for their continued participation and sustained performance across these measures. Similarly, sites that recognized their higher baseline performance through participation in the collaborative might have felt less motivation to participate in ongoing data collection during the sustainability season. Whether they might have also sustained, declined, or continued improving is not known. Additionally, the magnitude of improvement in the collaborative period might have also motivated ongoing participation during the sustainability phase. For example, although all sites improved in score use during the collaborative, sites participating in the sustainability season demonstrated significantly more improvement in these measures. Sites with a higher magnitude of improvement in collaborative measures might have more enthusiasm about the project, more commitment to the project activities, or feel a sense of obligation to respond to requests for additional data collection.
This work has several limitations. Selection bias may limit generalizability of the results, as sites that did not participate in the sustainability season may have had different results than those that did participate. It is unknown whether sites that regressed toward their baseline were deterred from participating in the sustainability season. The analyses that we were able to preform, however, suggest that the 2 groups were similar in their characteristics as well as in their baseline and improvement performance.
We have limited knowledge of the local improvement work that sites conducted between the completion of the collaborative and the sustainability season. Site-specific factors may have influenced improvement sustainability. For example, qualitative research with the original group found that team engagement had a quantitative association with better performance, but only for the bronchodilator use measure.23 Sites were responsible for their own data collection, and despite attempts to centralize and standardize the process, data collection inconsistencies may have occurred. For instance, it is unknown how closely that orders for intermittent pulse oximetry correlate with intermittent use at the bedside. Lastly, the absence of a control group limits examination of the causal relationships of interventions and the influence of secular trends.
CONCLUSIONS
Improvements gained during the BQIP collaborative were sustained at 1 year following completion of the collaborative. These findings are encouraging, as national QI collaborative efforts are increasingly common. Our findings suggest that opportunities exist to even further reduce unnecessary care in the management of bronchiolitis. Such opportunities highlight the importance of integrating strategies to both measure sustainability and plan for ongoing independent local activities after completion of the collaborative. Future efforts should focus on supporting local sites to continue individual practice-improvement as they transition from collaborative to independent quality initiatives.
Acknowledgments
The authors thank the 21 hospitals that participated in the BQIP collaborative, and in particular the 9 hospital teams that contributed sustainability data for their ongoing dedication. There was no external funding for this manuscript.
Disclosure
The authors report no financial conflicts of interest.
Acute viral bronchiolitis is the most common cause of hospitalization for children less than 1 year of age.1 Overuse of ineffective therapies has persisted despite the existence of the evidence-based American Academy of Pediatrics (AAP) clinical practice guideline (CPG), which recommends primarily supportive care.2-8 Adherence to the AAP CPG recommendations for management of bronchiolitis improved significantly through the AAP’s Bronchiolitis Quality Improvement Project (BQIP), a 12-month, multiinstitutional collaborative of community and free-standing children’s hospitals.9 This subsequent study investigates if these improvements were sustained after completion of the formal 12-month project.
Published multiinstitutional bronchiolitis quality improvement (QI) work is limited to 1 study5 that describes the results of a single intervention season at academic medical centers. Multiyear bronchiolitis QI projects are limited to single-center studies, and results have been mixed.5,6,8,10-13 One study11 observed continued improvement in bronchodilator use in subsequent seasons, whereas a second study10 observed a return to baseline bronchodilator use in the following season. Mittal6 observed inconsistent improvements in key bronchiolitis measures during postintervention seasons.
Our specific aim was to assess the sustainability of improvements in bronchiolitis management at participating institutions 1 year following completion of the AAP BQIP collaborative.9 Because no studies demonstrate the most effective way to support long-term improvement through a QI collaborative, we hypothesized that the initial collaborative activities, which were designed to build the capacity of local interdisciplinary teams while providing standardized evidence-based care pathways, would lead to performance in the subsequent season at levels similar to or better than those observed during the active phase of the collaborative, without additional project interventions.
METHODS
Study Design and Setting
This was a follow-up study of the AAP Quality Improvement Innovation Networks project entitled “A Quality Collaborative for Improving Hospital Compliance with the AAP Bronchiolitis Guideline” (BQIP).9 The AAP Institutional Review Board approved this project.
Twenty-one multidisciplinary, hospital-based teams participated in the BQIP collaborative and provided monthly data during the January through March bronchiolitis season. Teams submitted 2013 baseline data and 2014 intervention data. Nine sites provided 2015 sustainability data following the completion of the collaborative.
Participants
Hospital encounters with a primary diagnosis of acute viral bronchiolitis were eligible for inclusion among patients from 1 month to 2 years of age. Encounters were excluded for prematurity (<35 weeks gestational age), congenital heart disease, bronchopulmonary dysplasia, genetic, congenital or neuromuscular abnormalities, and pediatric intensive-care admission.
Data Collection
Hospital characteristics were collected, including hospital type (academic, community), bed size, location (urban, rural), hospital distributions of race/ethnicity and public payer, cases of bronchiolitis per year, presence of an electronic medical record and a pediatric respiratory therapist, and self-rated QI knowledge of the multidisciplinary team (very knowledgeable, knowledgeable, and somewhat knowledgeable). A trained member at each site collected data through structured chart review in baseline, intervention, and sustainability bronchiolitis seasons for January, February, and March. Site members reviewed the first 20 charts per month that met the inclusion criteria or all charts if there were fewer than 20 eligible encounters. Sites input data about key quality measures into the AAP’s Quality Improvement Data Aggregator, a web-based data repository.
Intervention
The BQIP project was designed as a virtual collaborative consisting of monthly education webinars about QI methods and bronchiolitis management, opportunities for collaboration via teleconference and e-mail listserv, and individual site-coaching by e-mail or telephone.9 A change package was shared with sites that included examples of evidence-based pathways, ordersets, a respiratory scoring tool, communication tools for parents and referring physicians, and slide sets for individual site education efforts. Following completion of the collaborative, written resources remained available to participants, although virtual collaboration ceased and no additional project interventions to promote sustainability were introduced.
Bronchiolitis Process and Outcome Measures
Process measures following admission included the following: severity assessment using a respiratory score, respiratory score use to assess response to bronchodilators, bronchodilator use, bronchodilator doses, steroid doses per patient encounter, chest radiographs per encounter, and presence of an order to transition to intermittent pulse oximetry monitoring. Outcome measures included length of stay and readmissions within 72 hours.
Analysis
Changes among baseline-, intervention-, and sustainability-season data were assessed using generalized linear mixed-effects models with random effect for study sites. Negative binomial models were used for count variables to allow for overdispersion. Length of stay was log-transformed to achieve a normal distribution. We also analyzed each site individually to assess whether sustained improvements were the result of broad sustainability across all sites or whether they represented an aggregation of some sites that continued to improve while other sites actually worsened.
To address any bias introduced by the voluntary and incomplete participation of sites in the sustainability season, we planned a priori to conduct 3 additional analyses. First, we compared the characteristics of sites that did participate in the sustainability season with those that did not participate by using Chi-squared tests for differences in proportions and t tests for differences in means. Second, we determined whether the baseline-season process and outcome measures were different between sites that did and did not participate using descriptive statistics. Third, we assessed whether improvements between the baseline and intervention seasons were different between sites that did and did not participate using a linear mixed-effects model for normally distributed outcomes and generalized linear mixed-effects model with site-specific random effects for nonnormally distributed outcomes. All study outcomes were summarized in terms of model-adjusted means along with the corresponding 95% confidence intervals. All P values are 2-sided, and P < 0.05 was used to define statistical significance. Data analyses were conducted using SAS software (SAS Institute Inc., Cary, North Carolina) version 9.4.
RESULTS
Differences in baseline bronchiolitis quality measures between sites that did and did not participate in the sustainability season are displayed in Table 3. Sustainability sites had significantly lower baseline use of a respiratory score, both to assess severity of illness at any point after hospitalization as well as to assess responsiveness following bronchodilator treatments (P < 0.001). At baseline they also had fewer orders for intermittent pulse oximetry use (P = 0.01) and fewer doses of bronchodilators per encounter (P = 0.04). Sites were not significantly different in their baseline use of bronchodilators, oral steroid doses, or chest radiographs. Sites that participated in the sustainability season demonstated larger magnitude improvement between baseline and intervention seasons for respiratory score use (P < 0.001 for any use and P = 0.02 to assess bronchodilator responsiveness; Appendix 1b).
DISCUSSION
To our knowledge, this is the first report of sustained improvements in care achieved through a multiinstitutional QI collaborative of community and academic hospitals focused on bronchiolitis care. We found that overall sites participating in a national bronchiolitis QI project sustained improvements in key bronchiolitis quality measures for 1 year following the project’s completion. For the aggregate group no measures worsened, and one measure, orders for intermittent pulse oximetry monitoring, continued to increase during the sustainability season. Furthermore, the sustained improvements were primarily the result of consistent sustained performance of each individual site, as opposed to averages wherein some sites worsened while others improved (Appendix 1a). These findings suggest that designing a collaborative approach, which provides an evidence-based best-practice toolkit while building the QI capacity of local interdisciplinary teams, can support performance gains that persist beyond the project’s active phase.
There are a number of possible reasons why improvements were sustained following the collaborative. The BQIP requirement for institutional leadership buy-in may have motivated accountability to local leaders in subsequent bronchiolitis seasons at each site. We suspect that culture change such as flattened hierarchies through multidisciplinary teams,14 which empowered nurse and respiratory therapy staff, may have facilitated consistent use of tools created locally. The synergy of interdisciplinary teams composed of physician, nurse, and respiratory therapy champions may have created accountability to perpetuate the previous year’s efforts.15 In addition, the sites adopted elements of the evidence-based toolkit, such as pathways,16,17 forcing function tools13,18 and order sets that limited management decision options and bronchodilator use contingent on respiratory scores,9,19 which may have driven desired behaviors.
Moreover, the 2014 AAP CPG for the management of bronchiolitis,20 released prior to the sustainability bronchiolitis season, may have underscored the key concepts of the collaborative. Similarly, national exposure of best practices for bronchiolitis management, including the 3 widespread Choosing Wisely recommendations related to bronchiolitis,21 might have been a compelling reason for sites to maintain their improvement efforts and contribute to secular trends toward decreasing interventions in bronchiolitis management nationally.3 Lastly, the mechanisms developed for local data collection may have created opportunities at each site to conduct ongoing evaluation of performance on key bronchiolitis quality measures through data-driven feedback systems.22 Our study highlights the need for additional research in order to understand why improvements are or are not sustained.
Even with substantial, sustained improvements in this initiative, further reduction in unnecessary care may be possible. Findings from previous studies suggest that even multifaceted QI interventions, including provider education, guidelines and use of respiratory scores, may only modestly reduce bronchodilators, steroids, and chest radiograph use.8,13 To achieve continued improvements in bronchiolitis care, additional active efforts may be needed to develop new interventions that target root causes for areas of overuse at individual sites.
Future multiinstitutional collaboratives might benefit their participants if they include a focus on helping sites develop skills to ensure that local improvement activities continue after the collaborative phases are completed. Proactively scheduling intermittent check-ins with collaborative members to discuss experiences with both sustainability and ongoing improvement may be valuable and likely needs to be incorporated into the initial collaborative planning.
As these sustainability data represent a subset of 9 of the original 21 BQIP sites, there is concern for potential selection bias related to factors that could have motivated sites to participate in the sustainability season’s data collection and simultaneously influenced their performance. These concerns were mitigated to some extent through 3 specific analyses: finding limited differences in hospital characteristics, baseline performance in key bronchiolitis measures, and performance change from baseline to intervention seasons between sites that did and did not participate in the sustainability season.
Notably, sites that participated in the sustainability phase actually had lower baseline respiratory score use and fewer orders for intermittent pulse oximetry at baseline. Theoretically, if participation in the collaborative highlighted this disparity for these sites, it could have been a motivating factor for their continued participation and sustained performance across these measures. Similarly, sites that recognized their higher baseline performance through participation in the collaborative might have felt less motivation to participate in ongoing data collection during the sustainability season. Whether they might have also sustained, declined, or continued improving is not known. Additionally, the magnitude of improvement in the collaborative period might have also motivated ongoing participation during the sustainability phase. For example, although all sites improved in score use during the collaborative, sites participating in the sustainability season demonstrated significantly more improvement in these measures. Sites with a higher magnitude of improvement in collaborative measures might have more enthusiasm about the project, more commitment to the project activities, or feel a sense of obligation to respond to requests for additional data collection.
This work has several limitations. Selection bias may limit generalizability of the results, as sites that did not participate in the sustainability season may have had different results than those that did participate. It is unknown whether sites that regressed toward their baseline were deterred from participating in the sustainability season. The analyses that we were able to preform, however, suggest that the 2 groups were similar in their characteristics as well as in their baseline and improvement performance.
We have limited knowledge of the local improvement work that sites conducted between the completion of the collaborative and the sustainability season. Site-specific factors may have influenced improvement sustainability. For example, qualitative research with the original group found that team engagement had a quantitative association with better performance, but only for the bronchodilator use measure.23 Sites were responsible for their own data collection, and despite attempts to centralize and standardize the process, data collection inconsistencies may have occurred. For instance, it is unknown how closely that orders for intermittent pulse oximetry correlate with intermittent use at the bedside. Lastly, the absence of a control group limits examination of the causal relationships of interventions and the influence of secular trends.
CONCLUSIONS
Improvements gained during the BQIP collaborative were sustained at 1 year following completion of the collaborative. These findings are encouraging, as national QI collaborative efforts are increasingly common. Our findings suggest that opportunities exist to even further reduce unnecessary care in the management of bronchiolitis. Such opportunities highlight the importance of integrating strategies to both measure sustainability and plan for ongoing independent local activities after completion of the collaborative. Future efforts should focus on supporting local sites to continue individual practice-improvement as they transition from collaborative to independent quality initiatives.
Acknowledgments
The authors thank the 21 hospitals that participated in the BQIP collaborative, and in particular the 9 hospital teams that contributed sustainability data for their ongoing dedication. There was no external funding for this manuscript.
Disclosure
The authors report no financial conflicts of interest.
1. Healthcare Cost and Utilization Project (HCUP) KID Trends Supplemental File. Agency for Healthcare Research and Quality website. http://hcupnet.ahrq.gov/HCUPnet.jsp?Id=2C331B13FB40957D&Form=DispTab&JS=Y&Action=Accept. 2012. Accessed July 21, 2016.
2. Ralston S, Parikh K, Goodman D. Benchmarking overuse of medical interventions for bronchiolitis. JAMA Pediatr. 2015;169:805-806. PubMed
3. Parikh K, Hall M, Teach SJ. Bronchiolitis management before and after the AAP guidelines. Pediatrics. 2014;133:e1-e7. PubMed
4. Johnson LW, Robles J, Hudgins A, Osburn S, Martin D, Thompson A. Management of bronchiolitis in the emergency department: impact of evidence-based guidelines? Pediatrics. 2013;131 Suppl 1:S103-S109. PubMed
5. Kotagal UR, Robbins JM, Kini NM, Schoettker PJ, Atherton HD, Kirschbaum MS. Impact of a bronchiolitis guideline: a multisite demonstration project. Chest. 2002;121:1789-1797. PubMed
6. Mittal V, Darnell C, Walsh B, et al. Inpatient bronchiolitis guideline implementation and resource utilization. Pediatrics. 2014;133:e730-e737. PubMed
7. Mittal V, Hall M, Morse R, et al. Impact of inpatient bronchiolitis clinical practice guideline implementation on testing and treatment. J Pediatr. 2014;165:570.e3-576.e3. PubMed
8. Ralston S, Garber M, Narang S, et al. Decreasing unnecessary utilization in acute bronchiolitis care: results from the value in inpatient pediatrics network. J Hosp Med. 2013;8:25-30. PubMed
9. Ralston SL, Garber MD, Rice-Conboy E, et al. A multicenter collaborative to reduce unnecessary care in inpatient bronchiolitis. Pediatrics. 2016;137. PubMed
10. Perlstein PH, Kotagal UR, Schoettker PJ, et al. Sustaining the implementation of an evidence-based guideline for bronchiolitis. Arch Pediatr Adolesc Med. 2000;154:1001-1007. PubMed
11. Walker C, Danby S, Turner S. Impact of a bronchiolitis clinical care pathway on treatment and hospital stay. Eur J Pediatr. 2012;171:827-832. PubMed
12. Cheney J, Barber S, Altamirano L, et al. A clinical pathway for bronchiolitis is effective in reducing readmission rates. J Pediatr. 2005;147:622-626. PubMed
13. Ralston S, Comick A, Nichols E, Parker D, Lanter P. Effectiveness of quality improvement in hospitalization for bronchiolitis: a systematic review. Pediatrics. 2014;134:571-581. PubMed
14. Schwartz RW, Tumblin TF. The power of servant leadership to transform health care organizations for the 21st-century economy. Arch Surg. 2002;137:1419-1427; discussion 27. PubMed
15. Schalock RL, Verdugo M, Lee T. A systematic approach to an organization’s sustainability. Eval Program Plann. 2016;56:56-63. PubMed
16. Wilson SD, Dahl BB, Wells RD. An evidence-based clinical pathway for bronchiolitis safely reduces antibiotic overuse. Am J Med Qual. 2002;17:195-199. PubMed
17. Muething S, Schoettker PJ, Gerhardt WE, Atherton HD, Britto MT, Kotagal UR. Decreasing overuse of therapies in the treatment of bronchiolitis by incorporating evidence at the point of care. J Pediatr. 2004;144:703-710. PubMed
18. Streiff MB, Carolan HT, Hobson DB, et al. Lessons from the Johns Hopkins multi-disciplinary venous thromboembolism (VTE) prevention collaborative. BMJ. 2012;344:e3935. PubMed
19. Todd J, Bertoch D, Dolan S. Use of a large national database for comparative evaluation of the effect of a bronchiolitis/viral pneumonia clinical care guideline on patient outcome and resource utilization. Arch Pediatr Adolesc Med. 2002;156:1086-1090. PubMed
20. Ralston SL, Lieberthal AS, Meissner HC, et al. Clinical practice guideline: the diagnosis, management, and prevention of bronchiolitis. Pediatrics. 2014;134:e1474-e1502. PubMed
21. Quinonez RA, Garber MD, Schroeder AR, et al. Choosing wisely in pediatric hospital medicine: five opportunities for improved healthcare value. J Hosp Med. 2013;8:479-485. PubMed
22. Stone S, Lee HC, Sharek PJ. Perceived factors associated with sustained improvement following participation in a multicenter quality improvement collaborative. Jt Comm J Qual Patient Saf. 2016;42:309-315. PubMed
23. Ralston SL, Atwood EC, Garber MD, Holmes AV. What works to reduce unnecessary care for bronchiolitis? A qualitative analysis of a national collaborative. Acad Pediatr. 2017;17(2):198-204. PubMed
1. Healthcare Cost and Utilization Project (HCUP) KID Trends Supplemental File. Agency for Healthcare Research and Quality website. http://hcupnet.ahrq.gov/HCUPnet.jsp?Id=2C331B13FB40957D&Form=DispTab&JS=Y&Action=Accept. 2012. Accessed July 21, 2016.
2. Ralston S, Parikh K, Goodman D. Benchmarking overuse of medical interventions for bronchiolitis. JAMA Pediatr. 2015;169:805-806. PubMed
3. Parikh K, Hall M, Teach SJ. Bronchiolitis management before and after the AAP guidelines. Pediatrics. 2014;133:e1-e7. PubMed
4. Johnson LW, Robles J, Hudgins A, Osburn S, Martin D, Thompson A. Management of bronchiolitis in the emergency department: impact of evidence-based guidelines? Pediatrics. 2013;131 Suppl 1:S103-S109. PubMed
5. Kotagal UR, Robbins JM, Kini NM, Schoettker PJ, Atherton HD, Kirschbaum MS. Impact of a bronchiolitis guideline: a multisite demonstration project. Chest. 2002;121:1789-1797. PubMed
6. Mittal V, Darnell C, Walsh B, et al. Inpatient bronchiolitis guideline implementation and resource utilization. Pediatrics. 2014;133:e730-e737. PubMed
7. Mittal V, Hall M, Morse R, et al. Impact of inpatient bronchiolitis clinical practice guideline implementation on testing and treatment. J Pediatr. 2014;165:570.e3-576.e3. PubMed
8. Ralston S, Garber M, Narang S, et al. Decreasing unnecessary utilization in acute bronchiolitis care: results from the value in inpatient pediatrics network. J Hosp Med. 2013;8:25-30. PubMed
9. Ralston SL, Garber MD, Rice-Conboy E, et al. A multicenter collaborative to reduce unnecessary care in inpatient bronchiolitis. Pediatrics. 2016;137. PubMed
10. Perlstein PH, Kotagal UR, Schoettker PJ, et al. Sustaining the implementation of an evidence-based guideline for bronchiolitis. Arch Pediatr Adolesc Med. 2000;154:1001-1007. PubMed
11. Walker C, Danby S, Turner S. Impact of a bronchiolitis clinical care pathway on treatment and hospital stay. Eur J Pediatr. 2012;171:827-832. PubMed
12. Cheney J, Barber S, Altamirano L, et al. A clinical pathway for bronchiolitis is effective in reducing readmission rates. J Pediatr. 2005;147:622-626. PubMed
13. Ralston S, Comick A, Nichols E, Parker D, Lanter P. Effectiveness of quality improvement in hospitalization for bronchiolitis: a systematic review. Pediatrics. 2014;134:571-581. PubMed
14. Schwartz RW, Tumblin TF. The power of servant leadership to transform health care organizations for the 21st-century economy. Arch Surg. 2002;137:1419-1427; discussion 27. PubMed
15. Schalock RL, Verdugo M, Lee T. A systematic approach to an organization’s sustainability. Eval Program Plann. 2016;56:56-63. PubMed
16. Wilson SD, Dahl BB, Wells RD. An evidence-based clinical pathway for bronchiolitis safely reduces antibiotic overuse. Am J Med Qual. 2002;17:195-199. PubMed
17. Muething S, Schoettker PJ, Gerhardt WE, Atherton HD, Britto MT, Kotagal UR. Decreasing overuse of therapies in the treatment of bronchiolitis by incorporating evidence at the point of care. J Pediatr. 2004;144:703-710. PubMed
18. Streiff MB, Carolan HT, Hobson DB, et al. Lessons from the Johns Hopkins multi-disciplinary venous thromboembolism (VTE) prevention collaborative. BMJ. 2012;344:e3935. PubMed
19. Todd J, Bertoch D, Dolan S. Use of a large national database for comparative evaluation of the effect of a bronchiolitis/viral pneumonia clinical care guideline on patient outcome and resource utilization. Arch Pediatr Adolesc Med. 2002;156:1086-1090. PubMed
20. Ralston SL, Lieberthal AS, Meissner HC, et al. Clinical practice guideline: the diagnosis, management, and prevention of bronchiolitis. Pediatrics. 2014;134:e1474-e1502. PubMed
21. Quinonez RA, Garber MD, Schroeder AR, et al. Choosing wisely in pediatric hospital medicine: five opportunities for improved healthcare value. J Hosp Med. 2013;8:479-485. PubMed
22. Stone S, Lee HC, Sharek PJ. Perceived factors associated with sustained improvement following participation in a multicenter quality improvement collaborative. Jt Comm J Qual Patient Saf. 2016;42:309-315. PubMed
23. Ralston SL, Atwood EC, Garber MD, Holmes AV. What works to reduce unnecessary care for bronchiolitis? A qualitative analysis of a national collaborative. Acad Pediatr. 2017;17(2):198-204. PubMed
© 2017 Society of Hospital Medicine
Low Health Literacy and Transitional Care Needs: Beyond Screening
Health literacy (HL) is the ability of individuals to obtain, process, and understand health information in a way that enables them to make health decisions.1 Approximately one-third of adults in the United States are considered to have inadequate HL,2 and its prevalence is even higher among hospitalized patients.3 Low HL has been associated with higher rates of hospital readmission4 and higher mortality.5,6 Inadequate HL has been identified as a barrier to communication and is associated with poorer outcomes for communication-sensitive behaviors, such as adherence to medications, chronic disease self-efficacy and self-management,7-10 and understanding hospital discharge instructions.11,12 It has been largely understood that the association between HL and hospital outcomes has been mediated by these communication challenges.
In this issue of the journal, Boyle et al.13 demonstrate that inadequate HL is not only a communication barrier but also an indicator of other social support needs during a transition from the hospital. In particular, the authors found that hospitalized patients with inadequate HL had needs in more social support domains than those with adequate HL. After multivariable adjustment for sociodemographic factors that likely impact social support, such as age and marital status, inadequate HL remained associated specifically with insufficient caregiver support and transportation barriers. These findings suggest that, along with the more direct comprehension barriers previously associated with inadequate HL, the identified social support needs may mediate prior established associations between inadequate HL and poor health outcomes.
In fact, it remains an open question how best to intervene to improve care transitions for patients with social needs and low HL. The recent focus of HL interventions in the literature has been on “universal precautions,” such as the teach-back technique, to ensure patient comprehension of information, and writing patient informational materials at a low literacy level.14
Meanwhile, the focus of care transition interventions has been on transition coaching or case management in the hospital, medication reconciliation prior to discharge, and postdischarge telephone calls from pharmacists or nurses, often utilizing the HL “universal precautions.”18-20 While these approaches have been impactful to improve discharge preparedness and decrease readmission rates,21 they may not adequately address individual social support and social service needs when the patient leaves the hospital.
Recently, the National Academy of Medicine published the Accountable Health Community Screening Tool, designed to screen for the following 5 areas of unmet social need that are known to be impactful for health: housing stability, food insecurity, transportation needs, utility needs, and interpersonal violence.22 This screener is being used as part of the Center for Medicare & Medicaid Services’ Accountable Health Communities Model and is being tested by the Center for Medicare and Medicaid Innovation (CMMI). The goal of the CMMI evaluation is to test whether systematically identifying social service needs and closing the gap between clinical care and community services for patients with the highest levels of need will improve health outcomes.
Screening for HL and social determinants in the hospital will not, in and of itself, improve the quality of care transitions or prevent subsequent readmissions, morbidity, or mortality. However, measurement is the first step toward identifying individuals with the greatest need and can help direct hospitals’ utilization of limited resources, such as transition managers. The CMMI Accountable Health Communities Model evaluation will provide hospital and healthcare systems with best practices for building clinical–social services networks and connecting at-risk patients with high levels of need to appropriate services in the community.
No longer can a patient’s hospital care end with writing prescriptions and scheduling follow-up appointments. For some, using teach-back and low literacy-appropriate discharge materials will be enough; others will require a postdischarge telephone call to review medications and symptoms and ensure follow-up. But for those highest-risk patients, connection to a network of ongoing community social support will be necessary to guide their transition back to health in the community.
Disclosure
The author reports no conflicts of interest.
1. Quick Guide to Health Literacy. Office of Disease Prevention and Health Promotion: Health Communication Activities. US Department of Health & Human Services. https://health.gov/communication/literacy/quickguide/default.htm. Accessed June 24, 2017.
2. Kutner M, Greenberg E, Jin Y, Paulsen C. The Health Literacy of America’s Adults: Results from the 2003 National Assessment of Adult Literacy. Washington, DC: National Center for Education Statistics, 2006. Contract No.: Report No.: NCES 2006.483.
3. Baker DW, Gazmararian JA, Williams MV, et al. Functional health literacy and the risk of hospital admission among Medicare managed care enrollees. Am J Public Health. 2002;92(8):1278-1283. PubMed
4. Mitchell SE, Sadikova E, Jack BW, Paasche-Orlow MK. Health literacy and 30-day postdischarge hospital utilization. J Health Commun. 2012;17 Suppl 3:325-338. PubMed
5. Peterson PN, Shetterly SM, Clarke CL, et al. Health literacy and outcomes among patients with heart failure. JAMA. 2011;305(16):1695-1701. PubMed
6. Sudore RL, Yaffe K, Satterfield S, et al. Limited literacy and mortality in the elderly: the health, aging, and body composition study. J Gen Intern Med. 2006;21(8):806-812.. PubMed
7. Fransen MP, von Wagner C, Essink-Bot ML. Diabetes self-management in patients with low health literacy: ordering findings from literature in a health literacy framework. Patient Educ Couns. 2012;88(1):44-53 PubMed
8. Hahn EA, Burns JL, Jacobs EA, et al. Health Literacy and Patient-Reported Outcomes: A Cross-Sectional Study of Underserved English- and Spanish-Speaking Patients With Type 2 Diabetes. J Health Commun. 2015;20(Suppl )2:4-15 PubMed
9. Lindquist LA, Go L, Fleisher J, Jain N, Friesema E, Baker DW. Relationship of health literacy to intentional and unintentional non-adherence of hospital discharge medications. J Gen Intern Med. 2012;27(2):173-178. PubMed
10. McCarthy DM, Waite KR, Curtis LM, Engel KG, Baker DW, Wolf MS. What did the doctor say? Health literacy and recall of medical instructions. Med Care. 2012;50(4):277-282. PubMed
11. Choudhry AJ, Baghdadi YM, Wagie AE, et al. Readability of discharge summaries: with what level of information are we dismissing our patients? Am J Surg. 2016;211(3):631-636. PubMed
12. Kripalani S, Jacobson TA, Mugalla IC, Cawthon CR, Niesner KJ, Vaccarino V. Health literacy and the quality of physician-patient communication during hospitalization. J Hosp Med. 2010;5(5):269-275. PubMed
13. Boyle J, Speroff T, Workey K, et al. Low health literacy is associated with increased transitional care needs in hospitalized patients. J Hosp Med. 2017;12(11):918-927. Published online first September 20, 2017. PubMed
14. Brega AG, Barnard J, Weiss BD, et al. AHRQ Health Literacy Universal Precautions Tooklit, Second Edition. Rockville, MD: Agency for Healthcare Research and Quality, 2015. Report No.: Contract No.: AHRQ Publication No.: 15-0023.
15. Griffey RT, Shin N, Jones S, et al. The impact of teach-back on comprehension of discharge instructions and satisfaction among emergency patients with limited health literacy: A randomized, controlled study. J Commun Healthc. 2015;8(1):10-21. PubMed
16. Marcantoni JR, Finney K, Lane MA. Using health literacy guidelines to improve discharge education and the post-hospital transition: a quality improvement project. Am J Med Qual. 2014;29(1):86. PubMed
17. Samuels-Kalow M, Hardy E, Rhodes K, Mollen C. “Like a dialogue”: Teach-back in the emergency department. Patient Educ Couns. 2016;99(4):549-554. PubMed
18. Coleman EA, Parry C, Chalmers S, Min SJ. The care transitions intervention: results of a randomized controlled trial. Arch Intern Med. 2006;166(17):1822-1828. PubMed
19. Jack BW, Chetty VK, Anthony D, et al. A reengineered hospital discharge program to decrease rehospitalization: a randomized trial. Ann Intern Med. 2009;150(3):178-187. PubMed
20. Tang N, Fujimoto J, Karliner L. Evaluation of a primary care-based post-discharge phone call program: keeping the primary care practice at the center of post-hospitalization care transition. J Gen Intern Med. 2014;29(11):1513-1518. PubMed
21. Gonçalves-Bradley DC, Lannin NA, Clemson LM, Cameron ID, Shepperd S. Discharge planning from hospital. Cochrane Database Syst Rev. 2016(1):CD000313. PubMed
22. Billioux A, Verlander K, Anthony S, Alley D. Standardized screening for health-related social needs in clinical settings: The accountable health communities screening tool. National Academy of Medicine. Discsussion Paper, 2017.
Health literacy (HL) is the ability of individuals to obtain, process, and understand health information in a way that enables them to make health decisions.1 Approximately one-third of adults in the United States are considered to have inadequate HL,2 and its prevalence is even higher among hospitalized patients.3 Low HL has been associated with higher rates of hospital readmission4 and higher mortality.5,6 Inadequate HL has been identified as a barrier to communication and is associated with poorer outcomes for communication-sensitive behaviors, such as adherence to medications, chronic disease self-efficacy and self-management,7-10 and understanding hospital discharge instructions.11,12 It has been largely understood that the association between HL and hospital outcomes has been mediated by these communication challenges.
In this issue of the journal, Boyle et al.13 demonstrate that inadequate HL is not only a communication barrier but also an indicator of other social support needs during a transition from the hospital. In particular, the authors found that hospitalized patients with inadequate HL had needs in more social support domains than those with adequate HL. After multivariable adjustment for sociodemographic factors that likely impact social support, such as age and marital status, inadequate HL remained associated specifically with insufficient caregiver support and transportation barriers. These findings suggest that, along with the more direct comprehension barriers previously associated with inadequate HL, the identified social support needs may mediate prior established associations between inadequate HL and poor health outcomes.
In fact, it remains an open question how best to intervene to improve care transitions for patients with social needs and low HL. The recent focus of HL interventions in the literature has been on “universal precautions,” such as the teach-back technique, to ensure patient comprehension of information, and writing patient informational materials at a low literacy level.14
Meanwhile, the focus of care transition interventions has been on transition coaching or case management in the hospital, medication reconciliation prior to discharge, and postdischarge telephone calls from pharmacists or nurses, often utilizing the HL “universal precautions.”18-20 While these approaches have been impactful to improve discharge preparedness and decrease readmission rates,21 they may not adequately address individual social support and social service needs when the patient leaves the hospital.
Recently, the National Academy of Medicine published the Accountable Health Community Screening Tool, designed to screen for the following 5 areas of unmet social need that are known to be impactful for health: housing stability, food insecurity, transportation needs, utility needs, and interpersonal violence.22 This screener is being used as part of the Center for Medicare & Medicaid Services’ Accountable Health Communities Model and is being tested by the Center for Medicare and Medicaid Innovation (CMMI). The goal of the CMMI evaluation is to test whether systematically identifying social service needs and closing the gap between clinical care and community services for patients with the highest levels of need will improve health outcomes.
Screening for HL and social determinants in the hospital will not, in and of itself, improve the quality of care transitions or prevent subsequent readmissions, morbidity, or mortality. However, measurement is the first step toward identifying individuals with the greatest need and can help direct hospitals’ utilization of limited resources, such as transition managers. The CMMI Accountable Health Communities Model evaluation will provide hospital and healthcare systems with best practices for building clinical–social services networks and connecting at-risk patients with high levels of need to appropriate services in the community.
No longer can a patient’s hospital care end with writing prescriptions and scheduling follow-up appointments. For some, using teach-back and low literacy-appropriate discharge materials will be enough; others will require a postdischarge telephone call to review medications and symptoms and ensure follow-up. But for those highest-risk patients, connection to a network of ongoing community social support will be necessary to guide their transition back to health in the community.
Disclosure
The author reports no conflicts of interest.
Health literacy (HL) is the ability of individuals to obtain, process, and understand health information in a way that enables them to make health decisions.1 Approximately one-third of adults in the United States are considered to have inadequate HL,2 and its prevalence is even higher among hospitalized patients.3 Low HL has been associated with higher rates of hospital readmission4 and higher mortality.5,6 Inadequate HL has been identified as a barrier to communication and is associated with poorer outcomes for communication-sensitive behaviors, such as adherence to medications, chronic disease self-efficacy and self-management,7-10 and understanding hospital discharge instructions.11,12 It has been largely understood that the association between HL and hospital outcomes has been mediated by these communication challenges.
In this issue of the journal, Boyle et al.13 demonstrate that inadequate HL is not only a communication barrier but also an indicator of other social support needs during a transition from the hospital. In particular, the authors found that hospitalized patients with inadequate HL had needs in more social support domains than those with adequate HL. After multivariable adjustment for sociodemographic factors that likely impact social support, such as age and marital status, inadequate HL remained associated specifically with insufficient caregiver support and transportation barriers. These findings suggest that, along with the more direct comprehension barriers previously associated with inadequate HL, the identified social support needs may mediate prior established associations between inadequate HL and poor health outcomes.
In fact, it remains an open question how best to intervene to improve care transitions for patients with social needs and low HL. The recent focus of HL interventions in the literature has been on “universal precautions,” such as the teach-back technique, to ensure patient comprehension of information, and writing patient informational materials at a low literacy level.14
Meanwhile, the focus of care transition interventions has been on transition coaching or case management in the hospital, medication reconciliation prior to discharge, and postdischarge telephone calls from pharmacists or nurses, often utilizing the HL “universal precautions.”18-20 While these approaches have been impactful to improve discharge preparedness and decrease readmission rates,21 they may not adequately address individual social support and social service needs when the patient leaves the hospital.
Recently, the National Academy of Medicine published the Accountable Health Community Screening Tool, designed to screen for the following 5 areas of unmet social need that are known to be impactful for health: housing stability, food insecurity, transportation needs, utility needs, and interpersonal violence.22 This screener is being used as part of the Center for Medicare & Medicaid Services’ Accountable Health Communities Model and is being tested by the Center for Medicare and Medicaid Innovation (CMMI). The goal of the CMMI evaluation is to test whether systematically identifying social service needs and closing the gap between clinical care and community services for patients with the highest levels of need will improve health outcomes.
Screening for HL and social determinants in the hospital will not, in and of itself, improve the quality of care transitions or prevent subsequent readmissions, morbidity, or mortality. However, measurement is the first step toward identifying individuals with the greatest need and can help direct hospitals’ utilization of limited resources, such as transition managers. The CMMI Accountable Health Communities Model evaluation will provide hospital and healthcare systems with best practices for building clinical–social services networks and connecting at-risk patients with high levels of need to appropriate services in the community.
No longer can a patient’s hospital care end with writing prescriptions and scheduling follow-up appointments. For some, using teach-back and low literacy-appropriate discharge materials will be enough; others will require a postdischarge telephone call to review medications and symptoms and ensure follow-up. But for those highest-risk patients, connection to a network of ongoing community social support will be necessary to guide their transition back to health in the community.
Disclosure
The author reports no conflicts of interest.
1. Quick Guide to Health Literacy. Office of Disease Prevention and Health Promotion: Health Communication Activities. US Department of Health & Human Services. https://health.gov/communication/literacy/quickguide/default.htm. Accessed June 24, 2017.
2. Kutner M, Greenberg E, Jin Y, Paulsen C. The Health Literacy of America’s Adults: Results from the 2003 National Assessment of Adult Literacy. Washington, DC: National Center for Education Statistics, 2006. Contract No.: Report No.: NCES 2006.483.
3. Baker DW, Gazmararian JA, Williams MV, et al. Functional health literacy and the risk of hospital admission among Medicare managed care enrollees. Am J Public Health. 2002;92(8):1278-1283. PubMed
4. Mitchell SE, Sadikova E, Jack BW, Paasche-Orlow MK. Health literacy and 30-day postdischarge hospital utilization. J Health Commun. 2012;17 Suppl 3:325-338. PubMed
5. Peterson PN, Shetterly SM, Clarke CL, et al. Health literacy and outcomes among patients with heart failure. JAMA. 2011;305(16):1695-1701. PubMed
6. Sudore RL, Yaffe K, Satterfield S, et al. Limited literacy and mortality in the elderly: the health, aging, and body composition study. J Gen Intern Med. 2006;21(8):806-812.. PubMed
7. Fransen MP, von Wagner C, Essink-Bot ML. Diabetes self-management in patients with low health literacy: ordering findings from literature in a health literacy framework. Patient Educ Couns. 2012;88(1):44-53 PubMed
8. Hahn EA, Burns JL, Jacobs EA, et al. Health Literacy and Patient-Reported Outcomes: A Cross-Sectional Study of Underserved English- and Spanish-Speaking Patients With Type 2 Diabetes. J Health Commun. 2015;20(Suppl )2:4-15 PubMed
9. Lindquist LA, Go L, Fleisher J, Jain N, Friesema E, Baker DW. Relationship of health literacy to intentional and unintentional non-adherence of hospital discharge medications. J Gen Intern Med. 2012;27(2):173-178. PubMed
10. McCarthy DM, Waite KR, Curtis LM, Engel KG, Baker DW, Wolf MS. What did the doctor say? Health literacy and recall of medical instructions. Med Care. 2012;50(4):277-282. PubMed
11. Choudhry AJ, Baghdadi YM, Wagie AE, et al. Readability of discharge summaries: with what level of information are we dismissing our patients? Am J Surg. 2016;211(3):631-636. PubMed
12. Kripalani S, Jacobson TA, Mugalla IC, Cawthon CR, Niesner KJ, Vaccarino V. Health literacy and the quality of physician-patient communication during hospitalization. J Hosp Med. 2010;5(5):269-275. PubMed
13. Boyle J, Speroff T, Workey K, et al. Low health literacy is associated with increased transitional care needs in hospitalized patients. J Hosp Med. 2017;12(11):918-927. Published online first September 20, 2017. PubMed
14. Brega AG, Barnard J, Weiss BD, et al. AHRQ Health Literacy Universal Precautions Tooklit, Second Edition. Rockville, MD: Agency for Healthcare Research and Quality, 2015. Report No.: Contract No.: AHRQ Publication No.: 15-0023.
15. Griffey RT, Shin N, Jones S, et al. The impact of teach-back on comprehension of discharge instructions and satisfaction among emergency patients with limited health literacy: A randomized, controlled study. J Commun Healthc. 2015;8(1):10-21. PubMed
16. Marcantoni JR, Finney K, Lane MA. Using health literacy guidelines to improve discharge education and the post-hospital transition: a quality improvement project. Am J Med Qual. 2014;29(1):86. PubMed
17. Samuels-Kalow M, Hardy E, Rhodes K, Mollen C. “Like a dialogue”: Teach-back in the emergency department. Patient Educ Couns. 2016;99(4):549-554. PubMed
18. Coleman EA, Parry C, Chalmers S, Min SJ. The care transitions intervention: results of a randomized controlled trial. Arch Intern Med. 2006;166(17):1822-1828. PubMed
19. Jack BW, Chetty VK, Anthony D, et al. A reengineered hospital discharge program to decrease rehospitalization: a randomized trial. Ann Intern Med. 2009;150(3):178-187. PubMed
20. Tang N, Fujimoto J, Karliner L. Evaluation of a primary care-based post-discharge phone call program: keeping the primary care practice at the center of post-hospitalization care transition. J Gen Intern Med. 2014;29(11):1513-1518. PubMed
21. Gonçalves-Bradley DC, Lannin NA, Clemson LM, Cameron ID, Shepperd S. Discharge planning from hospital. Cochrane Database Syst Rev. 2016(1):CD000313. PubMed
22. Billioux A, Verlander K, Anthony S, Alley D. Standardized screening for health-related social needs in clinical settings: The accountable health communities screening tool. National Academy of Medicine. Discsussion Paper, 2017.
1. Quick Guide to Health Literacy. Office of Disease Prevention and Health Promotion: Health Communication Activities. US Department of Health & Human Services. https://health.gov/communication/literacy/quickguide/default.htm. Accessed June 24, 2017.
2. Kutner M, Greenberg E, Jin Y, Paulsen C. The Health Literacy of America’s Adults: Results from the 2003 National Assessment of Adult Literacy. Washington, DC: National Center for Education Statistics, 2006. Contract No.: Report No.: NCES 2006.483.
3. Baker DW, Gazmararian JA, Williams MV, et al. Functional health literacy and the risk of hospital admission among Medicare managed care enrollees. Am J Public Health. 2002;92(8):1278-1283. PubMed
4. Mitchell SE, Sadikova E, Jack BW, Paasche-Orlow MK. Health literacy and 30-day postdischarge hospital utilization. J Health Commun. 2012;17 Suppl 3:325-338. PubMed
5. Peterson PN, Shetterly SM, Clarke CL, et al. Health literacy and outcomes among patients with heart failure. JAMA. 2011;305(16):1695-1701. PubMed
6. Sudore RL, Yaffe K, Satterfield S, et al. Limited literacy and mortality in the elderly: the health, aging, and body composition study. J Gen Intern Med. 2006;21(8):806-812.. PubMed
7. Fransen MP, von Wagner C, Essink-Bot ML. Diabetes self-management in patients with low health literacy: ordering findings from literature in a health literacy framework. Patient Educ Couns. 2012;88(1):44-53 PubMed
8. Hahn EA, Burns JL, Jacobs EA, et al. Health Literacy and Patient-Reported Outcomes: A Cross-Sectional Study of Underserved English- and Spanish-Speaking Patients With Type 2 Diabetes. J Health Commun. 2015;20(Suppl )2:4-15 PubMed
9. Lindquist LA, Go L, Fleisher J, Jain N, Friesema E, Baker DW. Relationship of health literacy to intentional and unintentional non-adherence of hospital discharge medications. J Gen Intern Med. 2012;27(2):173-178. PubMed
10. McCarthy DM, Waite KR, Curtis LM, Engel KG, Baker DW, Wolf MS. What did the doctor say? Health literacy and recall of medical instructions. Med Care. 2012;50(4):277-282. PubMed
11. Choudhry AJ, Baghdadi YM, Wagie AE, et al. Readability of discharge summaries: with what level of information are we dismissing our patients? Am J Surg. 2016;211(3):631-636. PubMed
12. Kripalani S, Jacobson TA, Mugalla IC, Cawthon CR, Niesner KJ, Vaccarino V. Health literacy and the quality of physician-patient communication during hospitalization. J Hosp Med. 2010;5(5):269-275. PubMed
13. Boyle J, Speroff T, Workey K, et al. Low health literacy is associated with increased transitional care needs in hospitalized patients. J Hosp Med. 2017;12(11):918-927. Published online first September 20, 2017. PubMed
14. Brega AG, Barnard J, Weiss BD, et al. AHRQ Health Literacy Universal Precautions Tooklit, Second Edition. Rockville, MD: Agency for Healthcare Research and Quality, 2015. Report No.: Contract No.: AHRQ Publication No.: 15-0023.
15. Griffey RT, Shin N, Jones S, et al. The impact of teach-back on comprehension of discharge instructions and satisfaction among emergency patients with limited health literacy: A randomized, controlled study. J Commun Healthc. 2015;8(1):10-21. PubMed
16. Marcantoni JR, Finney K, Lane MA. Using health literacy guidelines to improve discharge education and the post-hospital transition: a quality improvement project. Am J Med Qual. 2014;29(1):86. PubMed
17. Samuels-Kalow M, Hardy E, Rhodes K, Mollen C. “Like a dialogue”: Teach-back in the emergency department. Patient Educ Couns. 2016;99(4):549-554. PubMed
18. Coleman EA, Parry C, Chalmers S, Min SJ. The care transitions intervention: results of a randomized controlled trial. Arch Intern Med. 2006;166(17):1822-1828. PubMed
19. Jack BW, Chetty VK, Anthony D, et al. A reengineered hospital discharge program to decrease rehospitalization: a randomized trial. Ann Intern Med. 2009;150(3):178-187. PubMed
20. Tang N, Fujimoto J, Karliner L. Evaluation of a primary care-based post-discharge phone call program: keeping the primary care practice at the center of post-hospitalization care transition. J Gen Intern Med. 2014;29(11):1513-1518. PubMed
21. Gonçalves-Bradley DC, Lannin NA, Clemson LM, Cameron ID, Shepperd S. Discharge planning from hospital. Cochrane Database Syst Rev. 2016(1):CD000313. PubMed
22. Billioux A, Verlander K, Anthony S, Alley D. Standardized screening for health-related social needs in clinical settings: The accountable health communities screening tool. National Academy of Medicine. Discsussion Paper, 2017.
© 2017 Society of Hospital Medicine
Low Health Literacy Is Associated with Increased Transitional Care Needs in Hospitalized Patients
A special concern since the institution of hospital readmission penalties1 is the transitions in care of a patient from one care setting to another, often at hospital discharge. Burke et al.2 proposed a framework for an ideal transition in care (ITC) to study and improve transitions from the hospital to home. The features in the ITC were identified based upon their inclusion in the interventions that improved discharge outcomes.3-5 Inspired by the ITC and other patient risk tools,6 we identified 10 domains of transitional care needs ([TCN] specified below), which we define as patient-centered risk factors that should be addressed to foster a safe and effective transition in care.7
One particularly important risk factor in patient self-management at transition points is health literacy, a patient’s ability to obtain, understand, and use basic health information and services. Low health literacy affects approximately 26% to 36% of adults in the United States.8,9 Health literacy is associated with many factors that may affect successful navigation of care transitions, including doctor-patient communication,10,11 understanding of the medication regimen,12 and self-management.13-15 Research has also demonstrated an association between low health literacy and poor outcomes after hospital discharge, including medication errors,16 30-day hospital readmission,17 and mortality.18 Transitional care initiatives have begun to incorporate health literacy into patient risk assessments6 and provide specific attention to low health literacy in interventions to reduce adverse drug events and readmission.4,19 Training programs for medical students and nurses advise teaching skills in health literacy as part of fostering effective transitions in care.20,21
Although low health literacy is generally recognized as a barrier to patient education and self-management, little is known about whether patients with low health literacy are more likely to have other risk factors that could further increase their risk for poor transitions in care. A better understanding of associated risks would inform and improve patient care. We hypothesized that TCNs are more common among patients with low health literacy, as compared with those with adequate health literacy. We also aimed to describe the relationship between low health literacy and specific TCNs in order to guide clinical care and future interventions.
METHODS
Setting
The present study is a cross-sectional analysis of data from a quality improvement (QI) intervention that was performed at Vanderbilt University Medical Center, a tertiary care facility in Nashville, Tennessee. The QI intervention, My Health Team (MHT), was funded by the Centers for Medicare and Medicaid Services Innovation Award program. The overall MHT program included outpatient care coordination for chronic disease management as well as a transitional care program that was designed to reduce hospital readmission. The latter included an inpatient needs assessment (which provided data for the present analysis), inpatient intervention, and postdischarge phone follow-up. The MHT initiative was reviewed by the institutional review board (IRB), which deemed it a QI program and granted a waiver of informed consent. The present secondary data analysis was reviewed and approved by the IRB.
Sample
Patients were identified for inclusion in the MHT transitions of care program if the presenting problem for hospital admission was pneumonia, chronic obstructive pulmonary disease (COPD) exacerbation, or decompensated heart failure, as determined by the review of clinical documentation by nurse transition care coordinators (TCCs). Adults over the age of 18 years were eligible, though priority was given to patients aged 65 years or older. This study includes the first inpatient encounter between June 2013 and December 31, 2014, for patients having a completed needs assessment and documentation of health literacy data in the medical record.
Data Collection
TCN assessment was developed from published patient risk tools and the ITC framework.2,6,22 The assessment has 10 domains composed of 49 individual items as follows: (1) caregiver support (caregiver support not sufficient for patient needs), (2) transportation (relies on public or others for transportation and misses medical care because of transportation), (3) health care utilization (no primary care physician, unplanned hospitalization in the last year, emergency department [ED] visit in the last 6 months, or home health services in the last 60 days), (4) high-risk medical comorbidities (malnutrition or body mass index <18.5, renal failure, chronic pain, diabetes, heart failure, COPD, or stroke), (5) medication management provider or caregiver concern (cannot provide medication list, >10 preadmission medications, high-risk medications [eg, insulin, warfarin], poor medication understanding, or adherence issue identified), (6) medical devices (vascular access, urinary catheter, wounds, or home supplemental oxygen), (7) functional status (weakness of extremities, limited extremity range of motion, difficulty with mobility, falls at home, or activities of daily living challenges), (8) mental health comorbidities (over the past month has felt down, depressed, or hopeless or over the past month has felt little interest or pleasure in doing things, high-risk alcohol use, or high-risk substance use), (9) communication (limited English proficiency or at risk for limited health literacy), and (10) financial resources (no health insurance, skips or rations medicines because of cost, misses medical care because of cost, or misses medical care because of job).
The 49 items of the TCN assessment were documented as being present or absent by nurse TCCs at the time patients were enrolled in the transitional care program, based on patient and family interview and chart review, and the items were later extracted for analysis. Patients were determined to have a domain-level need if they reported a need on any individual item within that domain, resulting in a binary score (any need present, absent) for each of the 10 TCN domains.
Health literacy was assessed by using the Brief Health Literacy Screen (BHLS), which is administered routinely by nurses at hospital intake and documented in the medical record, with completion rates of approximately 90%.23 The BHLS is a 3-question subjective health literacy assessment (scoring range 3-15) that has been validated against longer objective measures24 and shown to predict disease control and mortality.18,25 To improve the stability of scores (for patients who completed the BHLS more than once because of repeat hospitalizations) and to reduce missing values, we calculated the patient’s mean BHLS score for assessments obtained between January 1, 2013, and December 31, 2014. Patients were then categorized as having inadequate health literacy (BHLS ≤ 9) or adequate health literacy (BHLS > 9).18,25 Demographic information was extracted from patient records and included age, sex (male/female), marital status (married/without a partner), race (white/nonwhite), and years of education. Income level and primary language were not available for analysis.
Statistical Analysis
Patient characteristics and TCNs were summarized by using the frequency and percentages for categorical variables and the mean and standard deviation (SD) for continuous variables. We compared patient characteristics (age, sex, marital status, race, and education) between health literacy groups (inadequate vs adequate) by using χ2 or analysis of variance as appropriate. We assessed Pearson correlations among the 10 TCN domains, and we examined differences in reported needs for each of 10 TCN domains by the level of health literacy by using the χ2 test. Because the TCN domain of communication included low health literacy as one of its items, we excluded this domain from subsequent analyses. We then compared differences in the number of TCNs documented (scoring range 0-9) by using an independent samples Student t test.
Multivariate logistic regression models were then constructed to examine the independent association of inadequate health literacy with 8 TCN domains while controlling for age, sex, marital status, race, and education. Patients with incomplete demographic data were excluded from these models. Additionally, these analyses excluded 2 TCN domains: the communication domain for reasons noted above and the high-risk medical comorbidity domain because it ended up being positive in 98.4% of patients. Statistical significance was set at an alpha of 0.05. All analyses were performed by using SPSS Statistics for Mac, version 23.0 (IBM Corp., Armonk, New York)
RESULTS

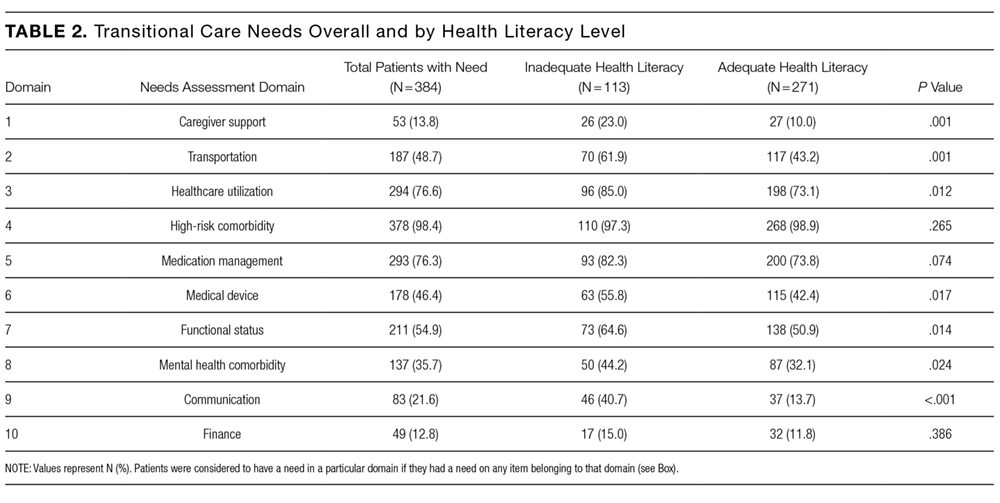
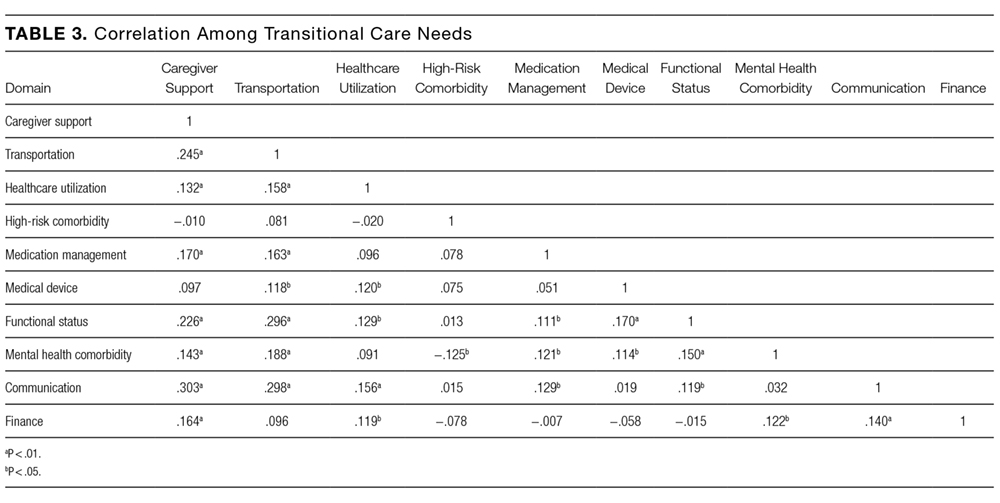
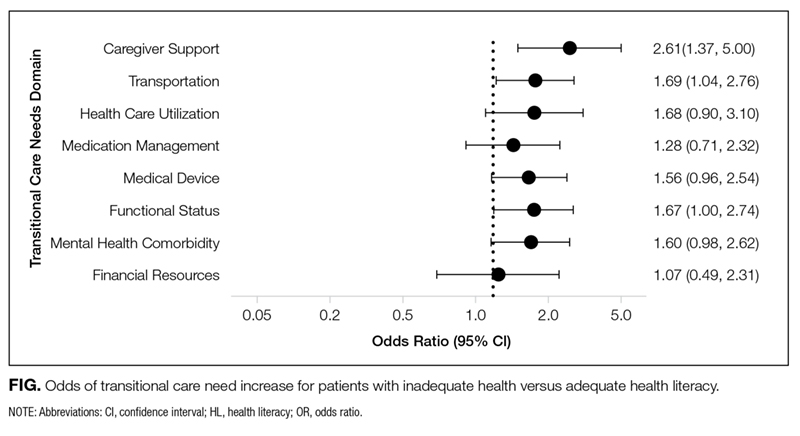
Older age was independently associated with more needs related to medical devices (OR, 1.02; 95% CI, 1.00-1.04), functional status (OR, 1.03; 95% CI, 1.02-1.05), and fewer financial needs (OR, 0.93; 95% CI, 0.91-0.96). Being married or living with a partner was associated with fewer needs related to caregiver support (OR, 0.37; 95% CI, 0.19-0.75) and more device-related needs (OR, 1.60; 95% CI, 1.03-2.49). A higher level of education was associated with fewer transportation needs (OR, 0.89; 95% CI, 0.82-0.97).
DISCUSSION
A structured patient risk factor assessment derived from literature was used to record TCNs in preparation for hospital discharge. On average, patients had needs in about half of the TCN domains (4.6 of 9). The most common areas identified were related to the presence of high-risk comorbidities (98.4%), frequent or prior healthcare utilization (76.6%), medication management (76.3%), functional status (54.9%), and transportation (48.7%). Many of the TCNs were significantly correlated with one another. The prevalence of these needs highlights the importance of using a structured assessment to identify patient concerns so that they may be addressed through discharge planning and follow-up. In addition, using a standardized TCN instrument based on a framework for ITC promotes further research in understanding patient needs and in developing personalized interventions to address them.
As hypothesized, we found that TCNs were more common in patients with inadequate health literacy. After adjustment for demographic factors, inadequate health literacy was significantly associated with transportation barriers and inadequate caregiver support. Analyses also suggested a relationship with needs related to medical devices, functional status, and mental health comorbidities. A review of the literature substantiates a link between inadequate health literacy and these needs and also suggests solutions to address these barriers.
The association with inadequate caregiver support is concerning because there is often a high degree of reliance on caregivers at transitions in care.3-5 Caregivers are routinely called upon to provide assistance with activities that may be difficult for patients with low health literacy, including medication adherence, provider communication, and self-care activities.26,27 Our finding that patients with inadequate health literacy are more likely to have inadequate caregiver support indicates additional vulnerability. This may be because of the absence of a caregiver, or in many cases, the presence of a caregiver who is underprepared to assist with care. Prior research has shown that when caregivers are present, up to 33% have low health literacy, even when they are paid nonfamilial caregivers.26,28 Other studies have noted the inadequacy of information and patient training for caregivers.29,30 Transitional care programs to improve caregiver understanding have been developed31 and have been demonstrated to lower rehospitalization and ED visits.32
Patients with inadequate health literacy were also more likely to have transportation barriers. Lack of transportation has been recorded as a factor in early hospital readmission in patients with chronic disease,33 and it has been shown to have a negative effect on a variety of health outcomes.34 A likely link between readmission and lack of transportation is poor follow-up care. Wheeler et al.35 found that 59% of patients expected difficulty keeping postdischarge appointments because of transportation needs. Instead of expecting patients to navigate their own transportation, the Agency for Healthcare Research and Quality recommends identifying community resources for patients with low health literacy.36
In this sample, inadequate health literacy also had near significant associations with TCNs in the use of medical devices, lower functional status, and mental health comorbidities. The use of a medical device, such as home oxygen, is a risk factor for readmission,37 and early reports suggest that interventions, including education related to home oxygen use, can dramatically reduce these readmissions.38 Lower functional capacity and faster functional decline are associated with inadequate health literacy,39 which may have to do with the inability to appropriately utilize health resources.40 If so, structured discharge planning could alleviate the known connection between functional impairment and hospital readmissions.41 A relationship between low health literacy and depression has been demonstrated repeatedly,42 with worsened symptoms in those with addiction.43 As has been shown in other domains where health literacy is a factor, literacy-focused interventions provide greater benefits to these depressed patients.44
The TCN assessment worked well overall, but certain domains proved less valuable and could be removed in the future. First, it was not useful to separately identify communication barriers, because doing so did not add to information beyond the measurement of health literacy. Second, high-risk comorbidities were ubiquitous within the sample and therefore unhelpful for group comparisons. In hindsight, this is unsurprising because the sample was comprised primarily of elderly patients admitted to medical services. Still, in a younger population or a surgical setting, identifying patients with high-risk medical comorbidities may be more useful.
We acknowledge several limitations of this study. First, the study was performed at a single center, and the TCN assessments were conducted by a small number of registered nurses who received training. Therefore, the results may not generalize to the profile of patient needs at other settings, and the instrument may perform differently when scaled across an organization. Second, the needs assessment was developed for this QI initiative and did not undergo formal validation, although it was developed from published frameworks and similar assessments. Third, for the measure of health literacy, we relied on data collected by nurses as part of their normal workflow. As is often the case with data collected during routine care, the scores are imperfect,45 but they have proven to be a valuable and valid indicator of health literacy in our previous research.18,24,25,46 Fourth, we chose to declare a domain as positive if any item in that domain was positive and to perform a domain-level analysis (for greater clarity). We did not take into account the variable number of items within each domain or attempt to grade their severity, as this would be a subjective exercise and impractical in the discharge planning process. Finally, we were unable to address associations among socioeconomic status,47 primary language,48 and health literacy, because relevant data were not available for this analysis.
CONCLUSION
In this sample of hospitalized patients who were administered a structured needs assessment, patients commonly had needs that placed them at a higher risk of adverse outcomes, such as hospital readmission. Patients with low health literacy had more TCNs that extended beyond the areas that we normally associate with low health literacy, namely patient education and self-management. Healthcare professionals should be aware of the greater likelihood of transportation barriers and inadequate caregiver support among patients with low health literacy. Screening for health literacy and TCN at admission or as part of the discharge planning process will elevate such risks, better positioning clinicians and hospitals to address them as a part of the efforts to ensure a quality transition of care.
Disclosure
This work was funded by the Centers for Medicare and Medicaid Services (1C1CMS330979) and in part by the National Center for Advancing Translational Sciences (2 UL1 TR000445-06). The content is solely the responsibility of the authors and does not necessarily represent official views of the funding agencies, which did not participate in the planning, collection, analysis, or interpretation of data or in the decision to submit for publication.
Dr. Dittus reports personal fees as a board member of the Robert Wood Johnson Foundation Medical Faculty Scholars Program National Advisory Committee; consultancy fees from the University of Virginia, Indiana University, University of Michigan, Northwestern University, Montana State University, and Purdue University; has grants/grants pending from NIH (research grants), PCORI (research grant), CME (innovation award), VA (training grant); payment for lectures including service on speakers bureaus from Corporate Parity (conference organizer) for the Global Hospital Management & Innovation Summit; and other from Medical Decision Making, Inc. (passive owner); all outside the submitted work. Dr. Kripalani has grants from NIH (research grant), PCORI (research grant), and CMS (QI grant); outside the submitted work. All other authors have nothing to disclose.
1. Rau J. Medicare to penalize 2,211 hospitals for excess readmissions. Kaiser Heal News. 2012;13(6):48-49.
2. Burke RE, Kripalani S, Vasilevskis EE, Schnipper JL. Moving beyond readmission penalties: creating an ideal process to improve transitional care. J Hosp Med. 2013;8(2):102-109. PubMed
3. Naylor MD, Brooten D, Campbell R, et al. Comprehensive discharge planning and home follow-up of hospitalized elders. JAMA. 1999;281(7):613-620. PubMed
4. Jack BW, Chetty VK, Anthony D, et al. A reengineered hospital discharge program to decrease rehospitalization. Ann Intern Med. 2009;150(3):178-187. PubMed
5. Coleman EA, Parry C, Chalmers S, Min S. The Care Transitions Intervention. Arch Intern Med. 2006;166(17):1822-1828. PubMed
6. Hansen LO, Greenwald JL, Budnitz T, et al. Project BOOST: effectiveness of a multihospital effort to reduce rehospitalization. J Hosp Med. 2013;8(8):421-427. PubMed
7. Hatch M, Bruce P, Mansolino A, Kripalani S. Transition care coordinators deliver personalized approach. Readmissions News. 2014;3(9):1-4.
8. Paasche-Orlow MK, Parker RM, Gazmararian JA, Nielsen-Bohlman LT, Rudd RR. The prevalence of limited health literacy. J Gen Intern Med. 2005;20(2):175-184. PubMed
9. Kutner M, Greenburg E, Jin Y, et al. The Health Literacy of America’s Adults: Results from the 2003 National Assessment of Adult Literacy. NCES 2006-483. Natl Cent Educ Stat. 2006;6:1-59.
10. Kripalani S, Jacobson TA, Mugalla IC, Cawthon CR, Niesner KJ, Vaccarino V. Health literacy and the quality of physician-patient communication during hospitalization. J Hosp Med. 2010;5(5):269-275. PubMed
11. Goggins KM, Wallston KA., Nwosu S, et al. Health literacy, numeracy, and other characteristics associated with hospitalized patients’ preferences for involvement in decision making. J Health Commun. 2014;19(sup2):29-43. PubMed
12. Marvanova M, Roumie CL, Eden SK, Cawthon C, Schnipper JL, Kripalani S. Health literacy and medication understanding among hospitalized adults. J Hosp Med. 2011;6(9):488-493. PubMed
13. Evangelista LS, Rasmusson KD, Laramee AS, et al. Health literacy and the patient with heart failure—implications for patient care and research: a consensus statement of the Heart Failure Society of America. J Card Fail. 2010;16(1):9-16. PubMed
14. Lindquist LA, Go L, Fleisher J, Jain N, Friesema E, Baker DW. Relationship of health literacy to intentional and unintentional non-adherence of hospital discharge medications. J Gen Intern Med. 2012;27(2):173-178. PubMed
15. Coleman EA, Chugh A, Williams MV, et al. Understanding and execution of discharge instructions. Am J Med Qual. 2013;28(5):383-391. PubMed
16. Mixon AS, Myers AP, Leak CL, et al. Characteristics associated with postdischarge medication errors. Mayo Clin Proc. 2014;89(8):1042-1051. PubMed
17. Mitchell SE, Sadikova E, Jack BW, Paasche-Orlow MK. Health literacy and 30-day postdischarge hospital utilization. J Health Commun. 2012;17(sup3):325-338. PubMed
18. McNaughton CD, Cawthon C, Kripalani S, Liu D, Storrow AB, Roumie CL. Health literacy and mortality: a cohort study of patients hospitalized for acute heart failure. J Am Heart Assoc. 2015;4(5):e001799. PubMed
19. Kripalani S, Roumie CL, Dalal AK, et al. Effect of a pharmacist intervention on clinically important medication errors after hospital discharge: a randomized trial. Ann Intern Med. 2012;157(1):1-10. PubMed
20. Polster D. Patient discharge information: Tools for success. Nursing (Lond). 2015;45(5):42-49. PubMed
21. Bradley SM, Chang D, Fallar R, Karani R. A patient safety and transitions of care curriculum for third-year medical students. Gerontol Geriatr Educ. 2015;36(1):45-57. PubMed
22. Kripalani S, Theobald CN, Anctil B, Vasilevskis EE. Reducing hospital readmission rates: current strategies and future directions. Annu Rev Med. 2014;65:471-485. PubMed
23. Cawthon C, Mion LC, Willens DE, Roumie CL, Kripalani S. Implementing routine health literacy assessment in hospital and primary care patients. Jt Comm J Qual Patient Saf. 2014;40(2):68-76. PubMed
24. Wallston KA, Cawthon C, McNaughton CD, Rothman RL, Osborn CY, Kripalani S. Psychometric properties of the brief health literacy screen in clinical practice. J Gen Intern Med. 2013:1-8. PubMed
25. McNaughton CD, Kripalani S, Cawthon C, Mion LC, Wallston KA, Roumie CL. Association of health literacy with elevated blood pressure: a cohort study of hospitalized patients. Med Care. 2014;52(4):346-353. PubMed
26. Garcia CH, Espinoza SE, Lichtenstein M, Hazuda HP. Health literacy associations between Hispanic elderly patients and their caregivers. J Health Commun. 2013;18 Suppl 1:256-272. PubMed
27. Levin JB, Peterson PN, Dolansky MA, Boxer RS. Health literacy and heart failure management in patient-caregiver dyads. J Card Fail. 2014;20(10):755-761. PubMed
28. Lindquist LA, Jain N, Tam K, Martin GJ, Baker DW. Inadequate health literacy among paid caregivers of seniors. J Gen Intern Med. 2011;26(5):474-479. PubMed
29. Graham CL, Ivey SL, Neuhauser L. From hospital to home: assessing the transitional care needs of vulnerable seniors. Gerontologist. 2009;49(1):23-33. PubMed
30. Foust JB, Vuckovic N, Henriquez E. Hospital to home health care transition: patient, caregiver, and clinician perspectives. West J Nurs Res. 2012;34(2):194-212. PubMed
31. Hahn-Goldberg S, Okrainec K, Huynh T, Zahr N, Abrams H. Co-creating patient-oriented discharge instructions with patients, caregivers, and healthcare providers. J Hosp Med. 2015;10(12):804-807. PubMed
32. Hendrix C, Tepfer S, Forest S, et al. Transitional care partners: a hospital-to-home support for older adults and their caregivers. J Am Assoc Nurse Pract. 2013;25(8):407-414. PubMed
33. Rubin DJ, Donnell-Jackson K, Jhingan R, Golden SH, Paranjape A. Early readmission among patients with diabetes: a qualitative assessment of contributing factors. J Diabetes Complications. 2014;28(6):869-873. PubMed
34. Syed ST, Gerber BS, Sharp LK. Traveling towards disease: transportation barriers to health care access. J Community Health. 2013;38(5):976-993. PubMed
35. Wheeler K, Crawford R, McAdams D, et al. Inpatient to outpatient transfer of diabetes care: perceptions of barriers to postdischarge followup in urban African American patients. Ethn Dis. 2007;17(2):238-243. PubMed
36. Brega A, Barnard J, Mabachi N, et al. AHRQ Health Literacy Universal Precautions Toolkit, Second Edition. Rockville: Agency for Healthcare Research and Qualiy; 2015. https://www.ahrq.gov/professionals/quality-patient-safety/quality-resources/tools/literacy-toolkit/index.html. Accessed August 21, 2017.
37. Sharif R, Parekh TM, Pierson KS, Kuo YF, Sharma G. Predictors of early readmission among patients 40 to 64 years of age hospitalized for chronic obstructive pulmonary disease. Ann Am Thorac Soc. 2014;11(5):685-694. PubMed
38. Carlin B, Wiles K, Easley D, Dskonerwpahsorg DS, Prenner B. Transition of care and rehospitalization rates for patients who require home oxygen therapy following hospitalization. Eur Respir J. 2012;40(Suppl 56):P617.
39. Wolf MS, Gazmararian JA, Baker DW. Health literacy and functional health status among older adults. Arch Intern Med. 2005;165(17):1946-1952. PubMed
40. Smith SG, O’Conor R, Curtis LM, et al. Low health literacy predicts decline in physical function among older adults: findings from the LitCog cohort study. J Epidemiol Community Health. 2015;69(5):474-480. PubMed
41. Greysen SR, Stijacic Cenzer I, Auerbach AD, Covinsky KE. Functional impairment and hospital readmission in medicare seniors. JAMA Intern Med. 2015;175(4):559-565. PubMed
42. Berkman ND, Sheridan SL, Donahue KE, et al. Health literacy interventions and outcomes: an updated systematic review. Evid Rep Technol Assess (Full Rep). 2011;199:1-941. PubMed
43. Lincoln A, Paasche-Orlow M, Cheng D, et al. Impact of health literacy on depressive symptoms and mental health-related quality of life among adults with addiction. J Gen Intern Med. 2006;21(8):818-822. PubMed
44. Weiss BD, Francis L, Senf JH, et al. Literacy education as treatment for depression in patients with limited literacy and depression: a randomized controlled trial. J Gen Intern Med. 2006;21(8):823-828. PubMed
45. Goggins K, Wallston KA, Mion L, Cawthon C, Kripalani S. What patient characteristics influence nurses’ assessment of health literacy? J Health Commun. 2016;21(sup2):105-108. PubMed
46. Scarpato KR, Kappa SF, Goggins KM, et al. The impact of health literacy on surgical outcomes following radical cystectomy. J Health Commun. 2016;21(sup2):99-104.
PubMed
47. Sudore RL, Mehta KM, Simonsick EM, et al. Limited literacy in older people and disparities in health and healthcare access. J Am Geriatr Soc. 2006;54(5):770-776. PubMed
48. Jacobson HE, Hund L, Mas FS. Predictors of English health literacy among US Hispanic immigrants: the importance of language, bilingualism and sociolinguistic environment
A special concern since the institution of hospital readmission penalties1 is the transitions in care of a patient from one care setting to another, often at hospital discharge. Burke et al.2 proposed a framework for an ideal transition in care (ITC) to study and improve transitions from the hospital to home. The features in the ITC were identified based upon their inclusion in the interventions that improved discharge outcomes.3-5 Inspired by the ITC and other patient risk tools,6 we identified 10 domains of transitional care needs ([TCN] specified below), which we define as patient-centered risk factors that should be addressed to foster a safe and effective transition in care.7
One particularly important risk factor in patient self-management at transition points is health literacy, a patient’s ability to obtain, understand, and use basic health information and services. Low health literacy affects approximately 26% to 36% of adults in the United States.8,9 Health literacy is associated with many factors that may affect successful navigation of care transitions, including doctor-patient communication,10,11 understanding of the medication regimen,12 and self-management.13-15 Research has also demonstrated an association between low health literacy and poor outcomes after hospital discharge, including medication errors,16 30-day hospital readmission,17 and mortality.18 Transitional care initiatives have begun to incorporate health literacy into patient risk assessments6 and provide specific attention to low health literacy in interventions to reduce adverse drug events and readmission.4,19 Training programs for medical students and nurses advise teaching skills in health literacy as part of fostering effective transitions in care.20,21
Although low health literacy is generally recognized as a barrier to patient education and self-management, little is known about whether patients with low health literacy are more likely to have other risk factors that could further increase their risk for poor transitions in care. A better understanding of associated risks would inform and improve patient care. We hypothesized that TCNs are more common among patients with low health literacy, as compared with those with adequate health literacy. We also aimed to describe the relationship between low health literacy and specific TCNs in order to guide clinical care and future interventions.
METHODS
Setting
The present study is a cross-sectional analysis of data from a quality improvement (QI) intervention that was performed at Vanderbilt University Medical Center, a tertiary care facility in Nashville, Tennessee. The QI intervention, My Health Team (MHT), was funded by the Centers for Medicare and Medicaid Services Innovation Award program. The overall MHT program included outpatient care coordination for chronic disease management as well as a transitional care program that was designed to reduce hospital readmission. The latter included an inpatient needs assessment (which provided data for the present analysis), inpatient intervention, and postdischarge phone follow-up. The MHT initiative was reviewed by the institutional review board (IRB), which deemed it a QI program and granted a waiver of informed consent. The present secondary data analysis was reviewed and approved by the IRB.
Sample
Patients were identified for inclusion in the MHT transitions of care program if the presenting problem for hospital admission was pneumonia, chronic obstructive pulmonary disease (COPD) exacerbation, or decompensated heart failure, as determined by the review of clinical documentation by nurse transition care coordinators (TCCs). Adults over the age of 18 years were eligible, though priority was given to patients aged 65 years or older. This study includes the first inpatient encounter between June 2013 and December 31, 2014, for patients having a completed needs assessment and documentation of health literacy data in the medical record.
Data Collection
TCN assessment was developed from published patient risk tools and the ITC framework.2,6,22 The assessment has 10 domains composed of 49 individual items as follows: (1) caregiver support (caregiver support not sufficient for patient needs), (2) transportation (relies on public or others for transportation and misses medical care because of transportation), (3) health care utilization (no primary care physician, unplanned hospitalization in the last year, emergency department [ED] visit in the last 6 months, or home health services in the last 60 days), (4) high-risk medical comorbidities (malnutrition or body mass index <18.5, renal failure, chronic pain, diabetes, heart failure, COPD, or stroke), (5) medication management provider or caregiver concern (cannot provide medication list, >10 preadmission medications, high-risk medications [eg, insulin, warfarin], poor medication understanding, or adherence issue identified), (6) medical devices (vascular access, urinary catheter, wounds, or home supplemental oxygen), (7) functional status (weakness of extremities, limited extremity range of motion, difficulty with mobility, falls at home, or activities of daily living challenges), (8) mental health comorbidities (over the past month has felt down, depressed, or hopeless or over the past month has felt little interest or pleasure in doing things, high-risk alcohol use, or high-risk substance use), (9) communication (limited English proficiency or at risk for limited health literacy), and (10) financial resources (no health insurance, skips or rations medicines because of cost, misses medical care because of cost, or misses medical care because of job).
The 49 items of the TCN assessment were documented as being present or absent by nurse TCCs at the time patients were enrolled in the transitional care program, based on patient and family interview and chart review, and the items were later extracted for analysis. Patients were determined to have a domain-level need if they reported a need on any individual item within that domain, resulting in a binary score (any need present, absent) for each of the 10 TCN domains.
Health literacy was assessed by using the Brief Health Literacy Screen (BHLS), which is administered routinely by nurses at hospital intake and documented in the medical record, with completion rates of approximately 90%.23 The BHLS is a 3-question subjective health literacy assessment (scoring range 3-15) that has been validated against longer objective measures24 and shown to predict disease control and mortality.18,25 To improve the stability of scores (for patients who completed the BHLS more than once because of repeat hospitalizations) and to reduce missing values, we calculated the patient’s mean BHLS score for assessments obtained between January 1, 2013, and December 31, 2014. Patients were then categorized as having inadequate health literacy (BHLS ≤ 9) or adequate health literacy (BHLS > 9).18,25 Demographic information was extracted from patient records and included age, sex (male/female), marital status (married/without a partner), race (white/nonwhite), and years of education. Income level and primary language were not available for analysis.
Statistical Analysis
Patient characteristics and TCNs were summarized by using the frequency and percentages for categorical variables and the mean and standard deviation (SD) for continuous variables. We compared patient characteristics (age, sex, marital status, race, and education) between health literacy groups (inadequate vs adequate) by using χ2 or analysis of variance as appropriate. We assessed Pearson correlations among the 10 TCN domains, and we examined differences in reported needs for each of 10 TCN domains by the level of health literacy by using the χ2 test. Because the TCN domain of communication included low health literacy as one of its items, we excluded this domain from subsequent analyses. We then compared differences in the number of TCNs documented (scoring range 0-9) by using an independent samples Student t test.
Multivariate logistic regression models were then constructed to examine the independent association of inadequate health literacy with 8 TCN domains while controlling for age, sex, marital status, race, and education. Patients with incomplete demographic data were excluded from these models. Additionally, these analyses excluded 2 TCN domains: the communication domain for reasons noted above and the high-risk medical comorbidity domain because it ended up being positive in 98.4% of patients. Statistical significance was set at an alpha of 0.05. All analyses were performed by using SPSS Statistics for Mac, version 23.0 (IBM Corp., Armonk, New York)
RESULTS
Older age was independently associated with more needs related to medical devices (OR, 1.02; 95% CI, 1.00-1.04), functional status (OR, 1.03; 95% CI, 1.02-1.05), and fewer financial needs (OR, 0.93; 95% CI, 0.91-0.96). Being married or living with a partner was associated with fewer needs related to caregiver support (OR, 0.37; 95% CI, 0.19-0.75) and more device-related needs (OR, 1.60; 95% CI, 1.03-2.49). A higher level of education was associated with fewer transportation needs (OR, 0.89; 95% CI, 0.82-0.97).
DISCUSSION
A structured patient risk factor assessment derived from literature was used to record TCNs in preparation for hospital discharge. On average, patients had needs in about half of the TCN domains (4.6 of 9). The most common areas identified were related to the presence of high-risk comorbidities (98.4%), frequent or prior healthcare utilization (76.6%), medication management (76.3%), functional status (54.9%), and transportation (48.7%). Many of the TCNs were significantly correlated with one another. The prevalence of these needs highlights the importance of using a structured assessment to identify patient concerns so that they may be addressed through discharge planning and follow-up. In addition, using a standardized TCN instrument based on a framework for ITC promotes further research in understanding patient needs and in developing personalized interventions to address them.
As hypothesized, we found that TCNs were more common in patients with inadequate health literacy. After adjustment for demographic factors, inadequate health literacy was significantly associated with transportation barriers and inadequate caregiver support. Analyses also suggested a relationship with needs related to medical devices, functional status, and mental health comorbidities. A review of the literature substantiates a link between inadequate health literacy and these needs and also suggests solutions to address these barriers.
The association with inadequate caregiver support is concerning because there is often a high degree of reliance on caregivers at transitions in care.3-5 Caregivers are routinely called upon to provide assistance with activities that may be difficult for patients with low health literacy, including medication adherence, provider communication, and self-care activities.26,27 Our finding that patients with inadequate health literacy are more likely to have inadequate caregiver support indicates additional vulnerability. This may be because of the absence of a caregiver, or in many cases, the presence of a caregiver who is underprepared to assist with care. Prior research has shown that when caregivers are present, up to 33% have low health literacy, even when they are paid nonfamilial caregivers.26,28 Other studies have noted the inadequacy of information and patient training for caregivers.29,30 Transitional care programs to improve caregiver understanding have been developed31 and have been demonstrated to lower rehospitalization and ED visits.32
Patients with inadequate health literacy were also more likely to have transportation barriers. Lack of transportation has been recorded as a factor in early hospital readmission in patients with chronic disease,33 and it has been shown to have a negative effect on a variety of health outcomes.34 A likely link between readmission and lack of transportation is poor follow-up care. Wheeler et al.35 found that 59% of patients expected difficulty keeping postdischarge appointments because of transportation needs. Instead of expecting patients to navigate their own transportation, the Agency for Healthcare Research and Quality recommends identifying community resources for patients with low health literacy.36
In this sample, inadequate health literacy also had near significant associations with TCNs in the use of medical devices, lower functional status, and mental health comorbidities. The use of a medical device, such as home oxygen, is a risk factor for readmission,37 and early reports suggest that interventions, including education related to home oxygen use, can dramatically reduce these readmissions.38 Lower functional capacity and faster functional decline are associated with inadequate health literacy,39 which may have to do with the inability to appropriately utilize health resources.40 If so, structured discharge planning could alleviate the known connection between functional impairment and hospital readmissions.41 A relationship between low health literacy and depression has been demonstrated repeatedly,42 with worsened symptoms in those with addiction.43 As has been shown in other domains where health literacy is a factor, literacy-focused interventions provide greater benefits to these depressed patients.44
The TCN assessment worked well overall, but certain domains proved less valuable and could be removed in the future. First, it was not useful to separately identify communication barriers, because doing so did not add to information beyond the measurement of health literacy. Second, high-risk comorbidities were ubiquitous within the sample and therefore unhelpful for group comparisons. In hindsight, this is unsurprising because the sample was comprised primarily of elderly patients admitted to medical services. Still, in a younger population or a surgical setting, identifying patients with high-risk medical comorbidities may be more useful.
We acknowledge several limitations of this study. First, the study was performed at a single center, and the TCN assessments were conducted by a small number of registered nurses who received training. Therefore, the results may not generalize to the profile of patient needs at other settings, and the instrument may perform differently when scaled across an organization. Second, the needs assessment was developed for this QI initiative and did not undergo formal validation, although it was developed from published frameworks and similar assessments. Third, for the measure of health literacy, we relied on data collected by nurses as part of their normal workflow. As is often the case with data collected during routine care, the scores are imperfect,45 but they have proven to be a valuable and valid indicator of health literacy in our previous research.18,24,25,46 Fourth, we chose to declare a domain as positive if any item in that domain was positive and to perform a domain-level analysis (for greater clarity). We did not take into account the variable number of items within each domain or attempt to grade their severity, as this would be a subjective exercise and impractical in the discharge planning process. Finally, we were unable to address associations among socioeconomic status,47 primary language,48 and health literacy, because relevant data were not available for this analysis.
CONCLUSION
In this sample of hospitalized patients who were administered a structured needs assessment, patients commonly had needs that placed them at a higher risk of adverse outcomes, such as hospital readmission. Patients with low health literacy had more TCNs that extended beyond the areas that we normally associate with low health literacy, namely patient education and self-management. Healthcare professionals should be aware of the greater likelihood of transportation barriers and inadequate caregiver support among patients with low health literacy. Screening for health literacy and TCN at admission or as part of the discharge planning process will elevate such risks, better positioning clinicians and hospitals to address them as a part of the efforts to ensure a quality transition of care.
Disclosure
This work was funded by the Centers for Medicare and Medicaid Services (1C1CMS330979) and in part by the National Center for Advancing Translational Sciences (2 UL1 TR000445-06). The content is solely the responsibility of the authors and does not necessarily represent official views of the funding agencies, which did not participate in the planning, collection, analysis, or interpretation of data or in the decision to submit for publication.
Dr. Dittus reports personal fees as a board member of the Robert Wood Johnson Foundation Medical Faculty Scholars Program National Advisory Committee; consultancy fees from the University of Virginia, Indiana University, University of Michigan, Northwestern University, Montana State University, and Purdue University; has grants/grants pending from NIH (research grants), PCORI (research grant), CME (innovation award), VA (training grant); payment for lectures including service on speakers bureaus from Corporate Parity (conference organizer) for the Global Hospital Management & Innovation Summit; and other from Medical Decision Making, Inc. (passive owner); all outside the submitted work. Dr. Kripalani has grants from NIH (research grant), PCORI (research grant), and CMS (QI grant); outside the submitted work. All other authors have nothing to disclose.
A special concern since the institution of hospital readmission penalties1 is the transitions in care of a patient from one care setting to another, often at hospital discharge. Burke et al.2 proposed a framework for an ideal transition in care (ITC) to study and improve transitions from the hospital to home. The features in the ITC were identified based upon their inclusion in the interventions that improved discharge outcomes.3-5 Inspired by the ITC and other patient risk tools,6 we identified 10 domains of transitional care needs ([TCN] specified below), which we define as patient-centered risk factors that should be addressed to foster a safe and effective transition in care.7
One particularly important risk factor in patient self-management at transition points is health literacy, a patient’s ability to obtain, understand, and use basic health information and services. Low health literacy affects approximately 26% to 36% of adults in the United States.8,9 Health literacy is associated with many factors that may affect successful navigation of care transitions, including doctor-patient communication,10,11 understanding of the medication regimen,12 and self-management.13-15 Research has also demonstrated an association between low health literacy and poor outcomes after hospital discharge, including medication errors,16 30-day hospital readmission,17 and mortality.18 Transitional care initiatives have begun to incorporate health literacy into patient risk assessments6 and provide specific attention to low health literacy in interventions to reduce adverse drug events and readmission.4,19 Training programs for medical students and nurses advise teaching skills in health literacy as part of fostering effective transitions in care.20,21
Although low health literacy is generally recognized as a barrier to patient education and self-management, little is known about whether patients with low health literacy are more likely to have other risk factors that could further increase their risk for poor transitions in care. A better understanding of associated risks would inform and improve patient care. We hypothesized that TCNs are more common among patients with low health literacy, as compared with those with adequate health literacy. We also aimed to describe the relationship between low health literacy and specific TCNs in order to guide clinical care and future interventions.
METHODS
Setting
The present study is a cross-sectional analysis of data from a quality improvement (QI) intervention that was performed at Vanderbilt University Medical Center, a tertiary care facility in Nashville, Tennessee. The QI intervention, My Health Team (MHT), was funded by the Centers for Medicare and Medicaid Services Innovation Award program. The overall MHT program included outpatient care coordination for chronic disease management as well as a transitional care program that was designed to reduce hospital readmission. The latter included an inpatient needs assessment (which provided data for the present analysis), inpatient intervention, and postdischarge phone follow-up. The MHT initiative was reviewed by the institutional review board (IRB), which deemed it a QI program and granted a waiver of informed consent. The present secondary data analysis was reviewed and approved by the IRB.
Sample
Patients were identified for inclusion in the MHT transitions of care program if the presenting problem for hospital admission was pneumonia, chronic obstructive pulmonary disease (COPD) exacerbation, or decompensated heart failure, as determined by the review of clinical documentation by nurse transition care coordinators (TCCs). Adults over the age of 18 years were eligible, though priority was given to patients aged 65 years or older. This study includes the first inpatient encounter between June 2013 and December 31, 2014, for patients having a completed needs assessment and documentation of health literacy data in the medical record.
Data Collection
TCN assessment was developed from published patient risk tools and the ITC framework.2,6,22 The assessment has 10 domains composed of 49 individual items as follows: (1) caregiver support (caregiver support not sufficient for patient needs), (2) transportation (relies on public or others for transportation and misses medical care because of transportation), (3) health care utilization (no primary care physician, unplanned hospitalization in the last year, emergency department [ED] visit in the last 6 months, or home health services in the last 60 days), (4) high-risk medical comorbidities (malnutrition or body mass index <18.5, renal failure, chronic pain, diabetes, heart failure, COPD, or stroke), (5) medication management provider or caregiver concern (cannot provide medication list, >10 preadmission medications, high-risk medications [eg, insulin, warfarin], poor medication understanding, or adherence issue identified), (6) medical devices (vascular access, urinary catheter, wounds, or home supplemental oxygen), (7) functional status (weakness of extremities, limited extremity range of motion, difficulty with mobility, falls at home, or activities of daily living challenges), (8) mental health comorbidities (over the past month has felt down, depressed, or hopeless or over the past month has felt little interest or pleasure in doing things, high-risk alcohol use, or high-risk substance use), (9) communication (limited English proficiency or at risk for limited health literacy), and (10) financial resources (no health insurance, skips or rations medicines because of cost, misses medical care because of cost, or misses medical care because of job).
The 49 items of the TCN assessment were documented as being present or absent by nurse TCCs at the time patients were enrolled in the transitional care program, based on patient and family interview and chart review, and the items were later extracted for analysis. Patients were determined to have a domain-level need if they reported a need on any individual item within that domain, resulting in a binary score (any need present, absent) for each of the 10 TCN domains.
Health literacy was assessed by using the Brief Health Literacy Screen (BHLS), which is administered routinely by nurses at hospital intake and documented in the medical record, with completion rates of approximately 90%.23 The BHLS is a 3-question subjective health literacy assessment (scoring range 3-15) that has been validated against longer objective measures24 and shown to predict disease control and mortality.18,25 To improve the stability of scores (for patients who completed the BHLS more than once because of repeat hospitalizations) and to reduce missing values, we calculated the patient’s mean BHLS score for assessments obtained between January 1, 2013, and December 31, 2014. Patients were then categorized as having inadequate health literacy (BHLS ≤ 9) or adequate health literacy (BHLS > 9).18,25 Demographic information was extracted from patient records and included age, sex (male/female), marital status (married/without a partner), race (white/nonwhite), and years of education. Income level and primary language were not available for analysis.
Statistical Analysis
Patient characteristics and TCNs were summarized by using the frequency and percentages for categorical variables and the mean and standard deviation (SD) for continuous variables. We compared patient characteristics (age, sex, marital status, race, and education) between health literacy groups (inadequate vs adequate) by using χ2 or analysis of variance as appropriate. We assessed Pearson correlations among the 10 TCN domains, and we examined differences in reported needs for each of 10 TCN domains by the level of health literacy by using the χ2 test. Because the TCN domain of communication included low health literacy as one of its items, we excluded this domain from subsequent analyses. We then compared differences in the number of TCNs documented (scoring range 0-9) by using an independent samples Student t test.
Multivariate logistic regression models were then constructed to examine the independent association of inadequate health literacy with 8 TCN domains while controlling for age, sex, marital status, race, and education. Patients with incomplete demographic data were excluded from these models. Additionally, these analyses excluded 2 TCN domains: the communication domain for reasons noted above and the high-risk medical comorbidity domain because it ended up being positive in 98.4% of patients. Statistical significance was set at an alpha of 0.05. All analyses were performed by using SPSS Statistics for Mac, version 23.0 (IBM Corp., Armonk, New York)
RESULTS
Older age was independently associated with more needs related to medical devices (OR, 1.02; 95% CI, 1.00-1.04), functional status (OR, 1.03; 95% CI, 1.02-1.05), and fewer financial needs (OR, 0.93; 95% CI, 0.91-0.96). Being married or living with a partner was associated with fewer needs related to caregiver support (OR, 0.37; 95% CI, 0.19-0.75) and more device-related needs (OR, 1.60; 95% CI, 1.03-2.49). A higher level of education was associated with fewer transportation needs (OR, 0.89; 95% CI, 0.82-0.97).
DISCUSSION
A structured patient risk factor assessment derived from literature was used to record TCNs in preparation for hospital discharge. On average, patients had needs in about half of the TCN domains (4.6 of 9). The most common areas identified were related to the presence of high-risk comorbidities (98.4%), frequent or prior healthcare utilization (76.6%), medication management (76.3%), functional status (54.9%), and transportation (48.7%). Many of the TCNs were significantly correlated with one another. The prevalence of these needs highlights the importance of using a structured assessment to identify patient concerns so that they may be addressed through discharge planning and follow-up. In addition, using a standardized TCN instrument based on a framework for ITC promotes further research in understanding patient needs and in developing personalized interventions to address them.
As hypothesized, we found that TCNs were more common in patients with inadequate health literacy. After adjustment for demographic factors, inadequate health literacy was significantly associated with transportation barriers and inadequate caregiver support. Analyses also suggested a relationship with needs related to medical devices, functional status, and mental health comorbidities. A review of the literature substantiates a link between inadequate health literacy and these needs and also suggests solutions to address these barriers.
The association with inadequate caregiver support is concerning because there is often a high degree of reliance on caregivers at transitions in care.3-5 Caregivers are routinely called upon to provide assistance with activities that may be difficult for patients with low health literacy, including medication adherence, provider communication, and self-care activities.26,27 Our finding that patients with inadequate health literacy are more likely to have inadequate caregiver support indicates additional vulnerability. This may be because of the absence of a caregiver, or in many cases, the presence of a caregiver who is underprepared to assist with care. Prior research has shown that when caregivers are present, up to 33% have low health literacy, even when they are paid nonfamilial caregivers.26,28 Other studies have noted the inadequacy of information and patient training for caregivers.29,30 Transitional care programs to improve caregiver understanding have been developed31 and have been demonstrated to lower rehospitalization and ED visits.32
Patients with inadequate health literacy were also more likely to have transportation barriers. Lack of transportation has been recorded as a factor in early hospital readmission in patients with chronic disease,33 and it has been shown to have a negative effect on a variety of health outcomes.34 A likely link between readmission and lack of transportation is poor follow-up care. Wheeler et al.35 found that 59% of patients expected difficulty keeping postdischarge appointments because of transportation needs. Instead of expecting patients to navigate their own transportation, the Agency for Healthcare Research and Quality recommends identifying community resources for patients with low health literacy.36
In this sample, inadequate health literacy also had near significant associations with TCNs in the use of medical devices, lower functional status, and mental health comorbidities. The use of a medical device, such as home oxygen, is a risk factor for readmission,37 and early reports suggest that interventions, including education related to home oxygen use, can dramatically reduce these readmissions.38 Lower functional capacity and faster functional decline are associated with inadequate health literacy,39 which may have to do with the inability to appropriately utilize health resources.40 If so, structured discharge planning could alleviate the known connection between functional impairment and hospital readmissions.41 A relationship between low health literacy and depression has been demonstrated repeatedly,42 with worsened symptoms in those with addiction.43 As has been shown in other domains where health literacy is a factor, literacy-focused interventions provide greater benefits to these depressed patients.44
The TCN assessment worked well overall, but certain domains proved less valuable and could be removed in the future. First, it was not useful to separately identify communication barriers, because doing so did not add to information beyond the measurement of health literacy. Second, high-risk comorbidities were ubiquitous within the sample and therefore unhelpful for group comparisons. In hindsight, this is unsurprising because the sample was comprised primarily of elderly patients admitted to medical services. Still, in a younger population or a surgical setting, identifying patients with high-risk medical comorbidities may be more useful.
We acknowledge several limitations of this study. First, the study was performed at a single center, and the TCN assessments were conducted by a small number of registered nurses who received training. Therefore, the results may not generalize to the profile of patient needs at other settings, and the instrument may perform differently when scaled across an organization. Second, the needs assessment was developed for this QI initiative and did not undergo formal validation, although it was developed from published frameworks and similar assessments. Third, for the measure of health literacy, we relied on data collected by nurses as part of their normal workflow. As is often the case with data collected during routine care, the scores are imperfect,45 but they have proven to be a valuable and valid indicator of health literacy in our previous research.18,24,25,46 Fourth, we chose to declare a domain as positive if any item in that domain was positive and to perform a domain-level analysis (for greater clarity). We did not take into account the variable number of items within each domain or attempt to grade their severity, as this would be a subjective exercise and impractical in the discharge planning process. Finally, we were unable to address associations among socioeconomic status,47 primary language,48 and health literacy, because relevant data were not available for this analysis.
CONCLUSION
In this sample of hospitalized patients who were administered a structured needs assessment, patients commonly had needs that placed them at a higher risk of adverse outcomes, such as hospital readmission. Patients with low health literacy had more TCNs that extended beyond the areas that we normally associate with low health literacy, namely patient education and self-management. Healthcare professionals should be aware of the greater likelihood of transportation barriers and inadequate caregiver support among patients with low health literacy. Screening for health literacy and TCN at admission or as part of the discharge planning process will elevate such risks, better positioning clinicians and hospitals to address them as a part of the efforts to ensure a quality transition of care.
Disclosure
This work was funded by the Centers for Medicare and Medicaid Services (1C1CMS330979) and in part by the National Center for Advancing Translational Sciences (2 UL1 TR000445-06). The content is solely the responsibility of the authors and does not necessarily represent official views of the funding agencies, which did not participate in the planning, collection, analysis, or interpretation of data or in the decision to submit for publication.
Dr. Dittus reports personal fees as a board member of the Robert Wood Johnson Foundation Medical Faculty Scholars Program National Advisory Committee; consultancy fees from the University of Virginia, Indiana University, University of Michigan, Northwestern University, Montana State University, and Purdue University; has grants/grants pending from NIH (research grants), PCORI (research grant), CME (innovation award), VA (training grant); payment for lectures including service on speakers bureaus from Corporate Parity (conference organizer) for the Global Hospital Management & Innovation Summit; and other from Medical Decision Making, Inc. (passive owner); all outside the submitted work. Dr. Kripalani has grants from NIH (research grant), PCORI (research grant), and CMS (QI grant); outside the submitted work. All other authors have nothing to disclose.
1. Rau J. Medicare to penalize 2,211 hospitals for excess readmissions. Kaiser Heal News. 2012;13(6):48-49.
2. Burke RE, Kripalani S, Vasilevskis EE, Schnipper JL. Moving beyond readmission penalties: creating an ideal process to improve transitional care. J Hosp Med. 2013;8(2):102-109. PubMed
3. Naylor MD, Brooten D, Campbell R, et al. Comprehensive discharge planning and home follow-up of hospitalized elders. JAMA. 1999;281(7):613-620. PubMed
4. Jack BW, Chetty VK, Anthony D, et al. A reengineered hospital discharge program to decrease rehospitalization. Ann Intern Med. 2009;150(3):178-187. PubMed
5. Coleman EA, Parry C, Chalmers S, Min S. The Care Transitions Intervention. Arch Intern Med. 2006;166(17):1822-1828. PubMed
6. Hansen LO, Greenwald JL, Budnitz T, et al. Project BOOST: effectiveness of a multihospital effort to reduce rehospitalization. J Hosp Med. 2013;8(8):421-427. PubMed
7. Hatch M, Bruce P, Mansolino A, Kripalani S. Transition care coordinators deliver personalized approach. Readmissions News. 2014;3(9):1-4.
8. Paasche-Orlow MK, Parker RM, Gazmararian JA, Nielsen-Bohlman LT, Rudd RR. The prevalence of limited health literacy. J Gen Intern Med. 2005;20(2):175-184. PubMed
9. Kutner M, Greenburg E, Jin Y, et al. The Health Literacy of America’s Adults: Results from the 2003 National Assessment of Adult Literacy. NCES 2006-483. Natl Cent Educ Stat. 2006;6:1-59.
10. Kripalani S, Jacobson TA, Mugalla IC, Cawthon CR, Niesner KJ, Vaccarino V. Health literacy and the quality of physician-patient communication during hospitalization. J Hosp Med. 2010;5(5):269-275. PubMed
11. Goggins KM, Wallston KA., Nwosu S, et al. Health literacy, numeracy, and other characteristics associated with hospitalized patients’ preferences for involvement in decision making. J Health Commun. 2014;19(sup2):29-43. PubMed
12. Marvanova M, Roumie CL, Eden SK, Cawthon C, Schnipper JL, Kripalani S. Health literacy and medication understanding among hospitalized adults. J Hosp Med. 2011;6(9):488-493. PubMed
13. Evangelista LS, Rasmusson KD, Laramee AS, et al. Health literacy and the patient with heart failure—implications for patient care and research: a consensus statement of the Heart Failure Society of America. J Card Fail. 2010;16(1):9-16. PubMed
14. Lindquist LA, Go L, Fleisher J, Jain N, Friesema E, Baker DW. Relationship of health literacy to intentional and unintentional non-adherence of hospital discharge medications. J Gen Intern Med. 2012;27(2):173-178. PubMed
15. Coleman EA, Chugh A, Williams MV, et al. Understanding and execution of discharge instructions. Am J Med Qual. 2013;28(5):383-391. PubMed
16. Mixon AS, Myers AP, Leak CL, et al. Characteristics associated with postdischarge medication errors. Mayo Clin Proc. 2014;89(8):1042-1051. PubMed
17. Mitchell SE, Sadikova E, Jack BW, Paasche-Orlow MK. Health literacy and 30-day postdischarge hospital utilization. J Health Commun. 2012;17(sup3):325-338. PubMed
18. McNaughton CD, Cawthon C, Kripalani S, Liu D, Storrow AB, Roumie CL. Health literacy and mortality: a cohort study of patients hospitalized for acute heart failure. J Am Heart Assoc. 2015;4(5):e001799. PubMed
19. Kripalani S, Roumie CL, Dalal AK, et al. Effect of a pharmacist intervention on clinically important medication errors after hospital discharge: a randomized trial. Ann Intern Med. 2012;157(1):1-10. PubMed
20. Polster D. Patient discharge information: Tools for success. Nursing (Lond). 2015;45(5):42-49. PubMed
21. Bradley SM, Chang D, Fallar R, Karani R. A patient safety and transitions of care curriculum for third-year medical students. Gerontol Geriatr Educ. 2015;36(1):45-57. PubMed
22. Kripalani S, Theobald CN, Anctil B, Vasilevskis EE. Reducing hospital readmission rates: current strategies and future directions. Annu Rev Med. 2014;65:471-485. PubMed
23. Cawthon C, Mion LC, Willens DE, Roumie CL, Kripalani S. Implementing routine health literacy assessment in hospital and primary care patients. Jt Comm J Qual Patient Saf. 2014;40(2):68-76. PubMed
24. Wallston KA, Cawthon C, McNaughton CD, Rothman RL, Osborn CY, Kripalani S. Psychometric properties of the brief health literacy screen in clinical practice. J Gen Intern Med. 2013:1-8. PubMed
25. McNaughton CD, Kripalani S, Cawthon C, Mion LC, Wallston KA, Roumie CL. Association of health literacy with elevated blood pressure: a cohort study of hospitalized patients. Med Care. 2014;52(4):346-353. PubMed
26. Garcia CH, Espinoza SE, Lichtenstein M, Hazuda HP. Health literacy associations between Hispanic elderly patients and their caregivers. J Health Commun. 2013;18 Suppl 1:256-272. PubMed
27. Levin JB, Peterson PN, Dolansky MA, Boxer RS. Health literacy and heart failure management in patient-caregiver dyads. J Card Fail. 2014;20(10):755-761. PubMed
28. Lindquist LA, Jain N, Tam K, Martin GJ, Baker DW. Inadequate health literacy among paid caregivers of seniors. J Gen Intern Med. 2011;26(5):474-479. PubMed
29. Graham CL, Ivey SL, Neuhauser L. From hospital to home: assessing the transitional care needs of vulnerable seniors. Gerontologist. 2009;49(1):23-33. PubMed
30. Foust JB, Vuckovic N, Henriquez E. Hospital to home health care transition: patient, caregiver, and clinician perspectives. West J Nurs Res. 2012;34(2):194-212. PubMed
31. Hahn-Goldberg S, Okrainec K, Huynh T, Zahr N, Abrams H. Co-creating patient-oriented discharge instructions with patients, caregivers, and healthcare providers. J Hosp Med. 2015;10(12):804-807. PubMed
32. Hendrix C, Tepfer S, Forest S, et al. Transitional care partners: a hospital-to-home support for older adults and their caregivers. J Am Assoc Nurse Pract. 2013;25(8):407-414. PubMed
33. Rubin DJ, Donnell-Jackson K, Jhingan R, Golden SH, Paranjape A. Early readmission among patients with diabetes: a qualitative assessment of contributing factors. J Diabetes Complications. 2014;28(6):869-873. PubMed
34. Syed ST, Gerber BS, Sharp LK. Traveling towards disease: transportation barriers to health care access. J Community Health. 2013;38(5):976-993. PubMed
35. Wheeler K, Crawford R, McAdams D, et al. Inpatient to outpatient transfer of diabetes care: perceptions of barriers to postdischarge followup in urban African American patients. Ethn Dis. 2007;17(2):238-243. PubMed
36. Brega A, Barnard J, Mabachi N, et al. AHRQ Health Literacy Universal Precautions Toolkit, Second Edition. Rockville: Agency for Healthcare Research and Qualiy; 2015. https://www.ahrq.gov/professionals/quality-patient-safety/quality-resources/tools/literacy-toolkit/index.html. Accessed August 21, 2017.
37. Sharif R, Parekh TM, Pierson KS, Kuo YF, Sharma G. Predictors of early readmission among patients 40 to 64 years of age hospitalized for chronic obstructive pulmonary disease. Ann Am Thorac Soc. 2014;11(5):685-694. PubMed
38. Carlin B, Wiles K, Easley D, Dskonerwpahsorg DS, Prenner B. Transition of care and rehospitalization rates for patients who require home oxygen therapy following hospitalization. Eur Respir J. 2012;40(Suppl 56):P617.
39. Wolf MS, Gazmararian JA, Baker DW. Health literacy and functional health status among older adults. Arch Intern Med. 2005;165(17):1946-1952. PubMed
40. Smith SG, O’Conor R, Curtis LM, et al. Low health literacy predicts decline in physical function among older adults: findings from the LitCog cohort study. J Epidemiol Community Health. 2015;69(5):474-480. PubMed
41. Greysen SR, Stijacic Cenzer I, Auerbach AD, Covinsky KE. Functional impairment and hospital readmission in medicare seniors. JAMA Intern Med. 2015;175(4):559-565. PubMed
42. Berkman ND, Sheridan SL, Donahue KE, et al. Health literacy interventions and outcomes: an updated systematic review. Evid Rep Technol Assess (Full Rep). 2011;199:1-941. PubMed
43. Lincoln A, Paasche-Orlow M, Cheng D, et al. Impact of health literacy on depressive symptoms and mental health-related quality of life among adults with addiction. J Gen Intern Med. 2006;21(8):818-822. PubMed
44. Weiss BD, Francis L, Senf JH, et al. Literacy education as treatment for depression in patients with limited literacy and depression: a randomized controlled trial. J Gen Intern Med. 2006;21(8):823-828. PubMed
45. Goggins K, Wallston KA, Mion L, Cawthon C, Kripalani S. What patient characteristics influence nurses’ assessment of health literacy? J Health Commun. 2016;21(sup2):105-108. PubMed
46. Scarpato KR, Kappa SF, Goggins KM, et al. The impact of health literacy on surgical outcomes following radical cystectomy. J Health Commun. 2016;21(sup2):99-104.
PubMed
47. Sudore RL, Mehta KM, Simonsick EM, et al. Limited literacy in older people and disparities in health and healthcare access. J Am Geriatr Soc. 2006;54(5):770-776. PubMed
48. Jacobson HE, Hund L, Mas FS. Predictors of English health literacy among US Hispanic immigrants: the importance of language, bilingualism and sociolinguistic environment
1. Rau J. Medicare to penalize 2,211 hospitals for excess readmissions. Kaiser Heal News. 2012;13(6):48-49.
2. Burke RE, Kripalani S, Vasilevskis EE, Schnipper JL. Moving beyond readmission penalties: creating an ideal process to improve transitional care. J Hosp Med. 2013;8(2):102-109. PubMed
3. Naylor MD, Brooten D, Campbell R, et al. Comprehensive discharge planning and home follow-up of hospitalized elders. JAMA. 1999;281(7):613-620. PubMed
4. Jack BW, Chetty VK, Anthony D, et al. A reengineered hospital discharge program to decrease rehospitalization. Ann Intern Med. 2009;150(3):178-187. PubMed
5. Coleman EA, Parry C, Chalmers S, Min S. The Care Transitions Intervention. Arch Intern Med. 2006;166(17):1822-1828. PubMed
6. Hansen LO, Greenwald JL, Budnitz T, et al. Project BOOST: effectiveness of a multihospital effort to reduce rehospitalization. J Hosp Med. 2013;8(8):421-427. PubMed
7. Hatch M, Bruce P, Mansolino A, Kripalani S. Transition care coordinators deliver personalized approach. Readmissions News. 2014;3(9):1-4.
8. Paasche-Orlow MK, Parker RM, Gazmararian JA, Nielsen-Bohlman LT, Rudd RR. The prevalence of limited health literacy. J Gen Intern Med. 2005;20(2):175-184. PubMed
9. Kutner M, Greenburg E, Jin Y, et al. The Health Literacy of America’s Adults: Results from the 2003 National Assessment of Adult Literacy. NCES 2006-483. Natl Cent Educ Stat. 2006;6:1-59.
10. Kripalani S, Jacobson TA, Mugalla IC, Cawthon CR, Niesner KJ, Vaccarino V. Health literacy and the quality of physician-patient communication during hospitalization. J Hosp Med. 2010;5(5):269-275. PubMed
11. Goggins KM, Wallston KA., Nwosu S, et al. Health literacy, numeracy, and other characteristics associated with hospitalized patients’ preferences for involvement in decision making. J Health Commun. 2014;19(sup2):29-43. PubMed
12. Marvanova M, Roumie CL, Eden SK, Cawthon C, Schnipper JL, Kripalani S. Health literacy and medication understanding among hospitalized adults. J Hosp Med. 2011;6(9):488-493. PubMed
13. Evangelista LS, Rasmusson KD, Laramee AS, et al. Health literacy and the patient with heart failure—implications for patient care and research: a consensus statement of the Heart Failure Society of America. J Card Fail. 2010;16(1):9-16. PubMed
14. Lindquist LA, Go L, Fleisher J, Jain N, Friesema E, Baker DW. Relationship of health literacy to intentional and unintentional non-adherence of hospital discharge medications. J Gen Intern Med. 2012;27(2):173-178. PubMed
15. Coleman EA, Chugh A, Williams MV, et al. Understanding and execution of discharge instructions. Am J Med Qual. 2013;28(5):383-391. PubMed
16. Mixon AS, Myers AP, Leak CL, et al. Characteristics associated with postdischarge medication errors. Mayo Clin Proc. 2014;89(8):1042-1051. PubMed
17. Mitchell SE, Sadikova E, Jack BW, Paasche-Orlow MK. Health literacy and 30-day postdischarge hospital utilization. J Health Commun. 2012;17(sup3):325-338. PubMed
18. McNaughton CD, Cawthon C, Kripalani S, Liu D, Storrow AB, Roumie CL. Health literacy and mortality: a cohort study of patients hospitalized for acute heart failure. J Am Heart Assoc. 2015;4(5):e001799. PubMed
19. Kripalani S, Roumie CL, Dalal AK, et al. Effect of a pharmacist intervention on clinically important medication errors after hospital discharge: a randomized trial. Ann Intern Med. 2012;157(1):1-10. PubMed
20. Polster D. Patient discharge information: Tools for success. Nursing (Lond). 2015;45(5):42-49. PubMed
21. Bradley SM, Chang D, Fallar R, Karani R. A patient safety and transitions of care curriculum for third-year medical students. Gerontol Geriatr Educ. 2015;36(1):45-57. PubMed
22. Kripalani S, Theobald CN, Anctil B, Vasilevskis EE. Reducing hospital readmission rates: current strategies and future directions. Annu Rev Med. 2014;65:471-485. PubMed
23. Cawthon C, Mion LC, Willens DE, Roumie CL, Kripalani S. Implementing routine health literacy assessment in hospital and primary care patients. Jt Comm J Qual Patient Saf. 2014;40(2):68-76. PubMed
24. Wallston KA, Cawthon C, McNaughton CD, Rothman RL, Osborn CY, Kripalani S. Psychometric properties of the brief health literacy screen in clinical practice. J Gen Intern Med. 2013:1-8. PubMed
25. McNaughton CD, Kripalani S, Cawthon C, Mion LC, Wallston KA, Roumie CL. Association of health literacy with elevated blood pressure: a cohort study of hospitalized patients. Med Care. 2014;52(4):346-353. PubMed
26. Garcia CH, Espinoza SE, Lichtenstein M, Hazuda HP. Health literacy associations between Hispanic elderly patients and their caregivers. J Health Commun. 2013;18 Suppl 1:256-272. PubMed
27. Levin JB, Peterson PN, Dolansky MA, Boxer RS. Health literacy and heart failure management in patient-caregiver dyads. J Card Fail. 2014;20(10):755-761. PubMed
28. Lindquist LA, Jain N, Tam K, Martin GJ, Baker DW. Inadequate health literacy among paid caregivers of seniors. J Gen Intern Med. 2011;26(5):474-479. PubMed
29. Graham CL, Ivey SL, Neuhauser L. From hospital to home: assessing the transitional care needs of vulnerable seniors. Gerontologist. 2009;49(1):23-33. PubMed
30. Foust JB, Vuckovic N, Henriquez E. Hospital to home health care transition: patient, caregiver, and clinician perspectives. West J Nurs Res. 2012;34(2):194-212. PubMed
31. Hahn-Goldberg S, Okrainec K, Huynh T, Zahr N, Abrams H. Co-creating patient-oriented discharge instructions with patients, caregivers, and healthcare providers. J Hosp Med. 2015;10(12):804-807. PubMed
32. Hendrix C, Tepfer S, Forest S, et al. Transitional care partners: a hospital-to-home support for older adults and their caregivers. J Am Assoc Nurse Pract. 2013;25(8):407-414. PubMed
33. Rubin DJ, Donnell-Jackson K, Jhingan R, Golden SH, Paranjape A. Early readmission among patients with diabetes: a qualitative assessment of contributing factors. J Diabetes Complications. 2014;28(6):869-873. PubMed
34. Syed ST, Gerber BS, Sharp LK. Traveling towards disease: transportation barriers to health care access. J Community Health. 2013;38(5):976-993. PubMed
35. Wheeler K, Crawford R, McAdams D, et al. Inpatient to outpatient transfer of diabetes care: perceptions of barriers to postdischarge followup in urban African American patients. Ethn Dis. 2007;17(2):238-243. PubMed
36. Brega A, Barnard J, Mabachi N, et al. AHRQ Health Literacy Universal Precautions Toolkit, Second Edition. Rockville: Agency for Healthcare Research and Qualiy; 2015. https://www.ahrq.gov/professionals/quality-patient-safety/quality-resources/tools/literacy-toolkit/index.html. Accessed August 21, 2017.
37. Sharif R, Parekh TM, Pierson KS, Kuo YF, Sharma G. Predictors of early readmission among patients 40 to 64 years of age hospitalized for chronic obstructive pulmonary disease. Ann Am Thorac Soc. 2014;11(5):685-694. PubMed
38. Carlin B, Wiles K, Easley D, Dskonerwpahsorg DS, Prenner B. Transition of care and rehospitalization rates for patients who require home oxygen therapy following hospitalization. Eur Respir J. 2012;40(Suppl 56):P617.
39. Wolf MS, Gazmararian JA, Baker DW. Health literacy and functional health status among older adults. Arch Intern Med. 2005;165(17):1946-1952. PubMed
40. Smith SG, O’Conor R, Curtis LM, et al. Low health literacy predicts decline in physical function among older adults: findings from the LitCog cohort study. J Epidemiol Community Health. 2015;69(5):474-480. PubMed
41. Greysen SR, Stijacic Cenzer I, Auerbach AD, Covinsky KE. Functional impairment and hospital readmission in medicare seniors. JAMA Intern Med. 2015;175(4):559-565. PubMed
42. Berkman ND, Sheridan SL, Donahue KE, et al. Health literacy interventions and outcomes: an updated systematic review. Evid Rep Technol Assess (Full Rep). 2011;199:1-941. PubMed
43. Lincoln A, Paasche-Orlow M, Cheng D, et al. Impact of health literacy on depressive symptoms and mental health-related quality of life among adults with addiction. J Gen Intern Med. 2006;21(8):818-822. PubMed
44. Weiss BD, Francis L, Senf JH, et al. Literacy education as treatment for depression in patients with limited literacy and depression: a randomized controlled trial. J Gen Intern Med. 2006;21(8):823-828. PubMed
45. Goggins K, Wallston KA, Mion L, Cawthon C, Kripalani S. What patient characteristics influence nurses’ assessment of health literacy? J Health Commun. 2016;21(sup2):105-108. PubMed
46. Scarpato KR, Kappa SF, Goggins KM, et al. The impact of health literacy on surgical outcomes following radical cystectomy. J Health Commun. 2016;21(sup2):99-104.
PubMed
47. Sudore RL, Mehta KM, Simonsick EM, et al. Limited literacy in older people and disparities in health and healthcare access. J Am Geriatr Soc. 2006;54(5):770-776. PubMed
48. Jacobson HE, Hund L, Mas FS. Predictors of English health literacy among US Hispanic immigrants: the importance of language, bilingualism and sociolinguistic environment
© 2017 Society of Hospital Medicine
Helping Seniors Plan for Posthospital Discharge Needs Before a Hospitalization Occurs: Results from the Randomized Control Trial of PlanYourLifespan.org
When seniors are discharged from the hospital, many will require additional support and therapy to regain their independence and return safely home.1,2 Most seniors do not understand what their support needs will entail or the differences between therapy choices.3 To complicate the issue, seniors are often incapacitated and unable to make discharge selections for themselves.
Consequently, discharge planners and social workers often explain options to family members and loved ones, who frequently feel overwhelmed.4,5 While often balancing jobs, loved ones are divided between wanting to stay with the senior in the hospital and driving to area skilled nursing facilities (SNFs) for consideration. Discharges are delayed waiting for families to make visits and choose an SNF. Longer lengths of stay are detrimental to seniors due to the increased risks of infection, functional loss, and cognitive decline.6
Although seniors comprised only 12% of the US population in 2003,7 they accounted for one-third of all hospitalizations, over 13.2 million hospital stays.8 Hospital stays for seniors resulted in hospital charges totaling nearly $329 billion, or 43.6% of national hospital bills in 2003.7 Seniors are also high consumers of postacute care services. By 2050, the number of individuals using long-term care services in any setting (eg, at home, assisted living, or SNFs) will be close to 27 million.9-11 With the knowledge that many seniors will be hospitalized and subsequently require services thereafter, we sought to assist seniors in planning for their hospital discharge needs before they were hospitalized.
Our team developed PlanYourLifespan.org (PYL) to facilitate this planning for postdischarge needs and fill the knowledge gap in understanding postdischarge options. With funding from the Patient Centered Outcomes Research Institute, we aimed to test the effectiveness of PYL on improving knowledge of hospital discharge resources among seniors.
METHODS
PlanYourLifespan.org
PlanYourLifespan.org (PYL) educates users on the health crises that often occur with age and connects them to posthospital and home-based resources available locally and nationally. PYL is personalized, dynamic, and adaptable in that all the information can be changed per the senior’s wishes or changing health needs.
Content of PYL
Previously, we conducted focus groups with seniors about current and perceived home needs and aging-in-place. Major themes of what advanced life events (ALEs) would impact aging-in-place were identified as follows: hospitalizations, falls, and Alzheimer’s.12 We organized PYL around these health-related ALEs. Our multidisciplinary team of researchers, seniors, social workers, caregiver agencies, and Area Agencies on Aging representatives then determined what information and resources should be included.
Each section of PYL starts with a video of a senior discussing their real-life personal experiences, with subsections providing interactive information on what seniors can expect, types of resources available to support home needs, and choices to be made. Descriptions of types of settings for therapy, options available, and links to national/local resources (eg, quality indicators for SNFs) are also included. For example, by entering their zip code, users can identify their neighborhood SNFs, closest Area Agency on Aging, and what home caregiver agencies exist in their area.
Users can save their preferences and revisit their choices at any time. To support communication between seniors and their loved ones, a summary of their choices can be printed or e-mailed to relevant parties. For example, a senior uses PYL and can e-mail these choices to family members, which can stimulate a conversation about future posthospital care expectations.
As inadequate health literacy and cognitive impairment are prevalent among seniors, PYL presents information understandable at all levels of health literacy and sensitive to cognitive load.9 There is simplified, large-font, no mouse scrolling and audio available for the visually impaired.
Study Design and Randomization
To test PYL, a 2-armed (attention control [AC] and PYL intervention), parallel, randomized controlled trial was conducted. Participants were randomly assigned to 1 of the 2 conditions via a pregenerated central randomization list using equal (1:1) allocation and random permuted block design to ensure relatively equal allocation throughout the study. The AC condition exposed participants to the National Institute on Aging-sponsored website, Go4Life.nia.nih.gov, an educational website on physical activity for seniors. This website has comparable design and layout to PYL but does not include information about advanced planning. The AC condition controlled for the possibility that regular contact with the study team may improve outcomes in participants randomized to the intervention website.
The trial was conducted from October 2014 to September 2015 in Chicago, Illinois; Fort Wayne, Indiana; and Houston, Texas. Inclusion criteria were as follows: age 65 and older, English-speaking, scoring ≥4 questions correctly on the Brief Cognitive Screen,14 and current self-reported use of a computer or smartphone with internet. Participants were excluded if they had previously participated in the focus groups or beta testing of the PYL website. Community-based patient partners/stakeholders drove subject recruitment in their communities through word of mouth, e-mail bursts, newsletters, and flyers. At the Area Agency on Aging and community centers where services such as food vouchers and case management are provided, participants were recruited on-site and given study information. At the clinical sites, staff referred potential participants. Study materials such as flyers and information sheets were also located in the clinic waiting rooms. The Villages, nonprofit, grassroots, membership organizations that are redefining aging by being a key resource to community members wishing to age in place, heavily relied on electronic recruitment using their regular e-newsletters and e-mail lists to recruit potential participants. Potential subjects were also recruited by distributing flyers at local senior centers and senior housing buildings. Interested seniors contacted research staff who explained the study and assessed their eligibility. If eligible, subjects were scheduled for a face-to-face interview.
At the face-to-face encounter, all study subjects completed a written consent, answered baseline questions, and were randomized to either arm. Next, research staff introduced all study subjects to the website to which they were randomized and provided instructions on its use. Staff were present to assist with questions as needed on navigation but did not assist with decision making for either website. A minimum of 15 minutes and a maximum of 45 minutes was allotted for navigating either website. After navigating their website, participants were administered an immediate in-person posttest survey. One month and 3 months after the face-to-face encounter, research staff contacted all study participants over the phone to complete a follow-up survey. Staff attempted to reach participants up to 3 times by phone. Data were entered into Research Electronic Data Capture survey software.15 This study was approved by the Northwestern University Institutional Review Board.
Understanding of Posthospital Discharge and Home Services
As part of the larger trial, which included behavioural outcomes that will be reported elsewhere, we sought to explore the effects of PYL on participants’ knowledge and understanding of posthospital discharge and home services (UHS). Participants were asked to respond to 6 questions at baseline, immediate posttest, and at the 1- and 3-month follow-up time points. Knowledge items were developed by the study team in conjunction with the patient/partner stakeholders. UHS scores were calculated as the sum of the 6 questions (each scored 0 if incorrect and 1 if correct) with a possible range of 0-6.
Covariates
Demographic information, self-reported health, importance of religion, and existence of a power of attorney, living will, advanced directive (eg, Physician Orders for Life-Sustaining Treatment) were obtained via self-report. Participants were asked about their general and social self-efficacy using the validated Self-efficacy Scale16 and their social support using the Lubben Social Network Scale–6.17 Health literacy was assessed using the Rapid Estimate of Adult Literacy in Medicine–Short Form.18 To measure burden of disease, participant comorbidities were measured using a nonvalidated 9-item dichotomous response condition list, which included some items adapted from the Charlson Comorbidity Index and the Elixhauser Comorbidity Index.
Statistical Analysis
Data analysis included all available data in the intention-to-treat dataset. As UHS was collected at multiple time points up to 3 months postintervention, we employed linear- mixed modeling with random participant effect and fixed arm, time, and time-by-arm interaction terms. The time-by-arm interaction allows for comparison of UHS slopes (or trajectories) across arms. Analyses explored multiple potential covariates, including current utilization of services, physical function, comorbidities, social support, health literacy, self-efficacy, and sociodemographics. Those covariates found to have a significant association (P < 0.05) with outcome were considered for inclusion in the overall model selection process. Ultimately, we developed a final parsimonious, adjusted longitudinal model with primary predictors of time, arm, and their interaction, controlling for only significant baseline variables following a manual backward selection method. All analyses were conducted in SAS software (version 9.4, copyright 2012, The SAS Institute Inc., Cary, North Carolina).
RESULTS
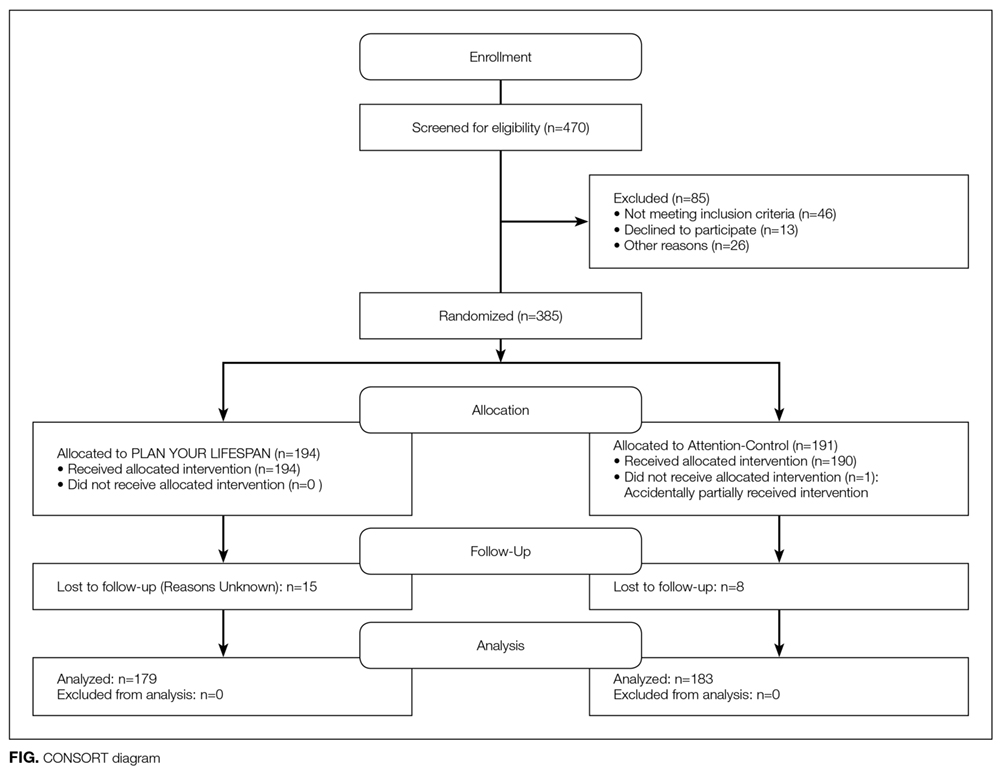
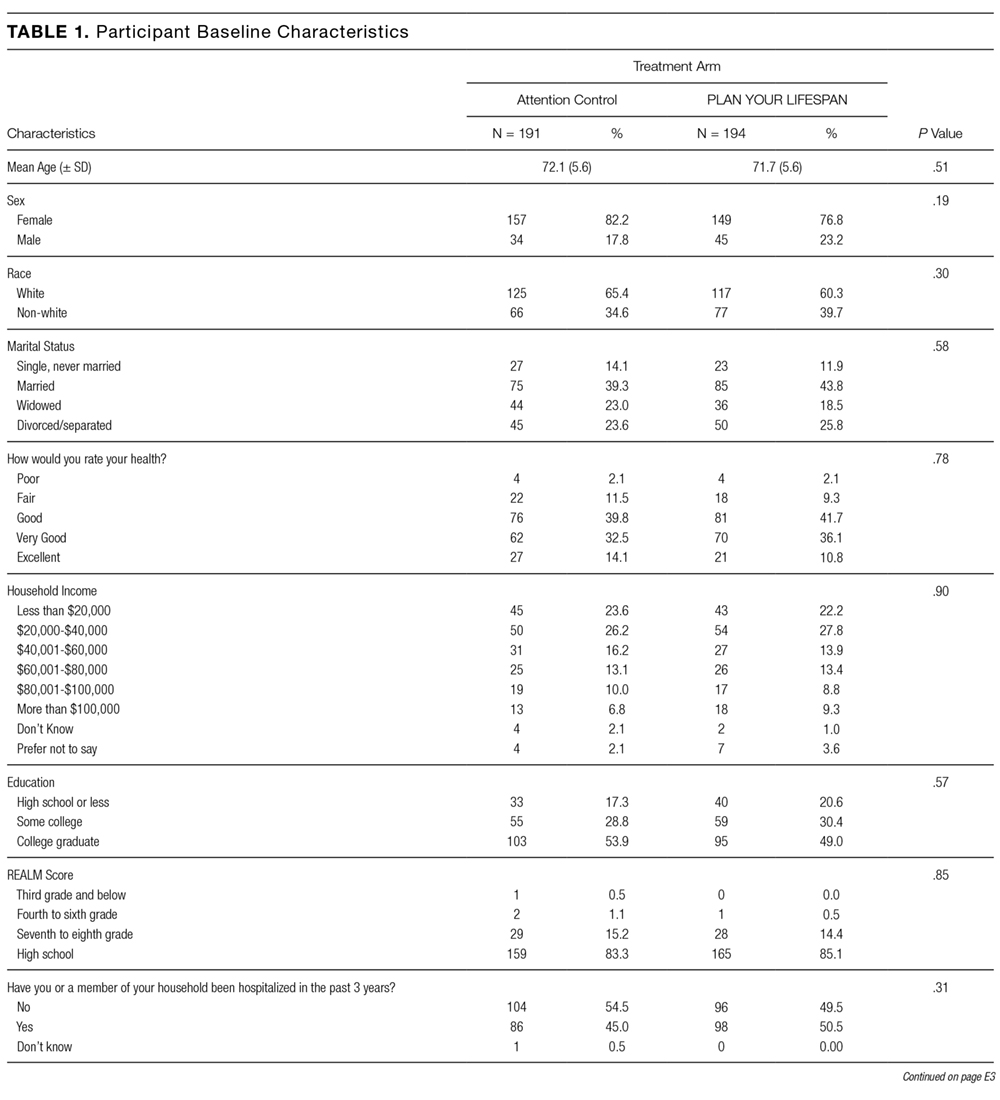
Table 3 illustrates linear mixed model results both failing to adjust and adjusting for potentially influential baseline covariates. In both instances, the interaction term (arm-by-time) was highly significant (P < 0.0001) in predicting UHS score, suggesting that, when compared to the AC arm, the intervention arm exhibited a large mean slope in UHS score over time. That is, understanding home services score tended to increase at a faster rate for those in the active arm. Higher levels of income (P = 0.0191), literacy (P = 0.0036), and education (P = 0.0042) were associated with increased UHS scores; however, male sex (P = 0.0023) and history of high blood pressure (P = 0.0409) or kidney disease (P = 0.0278) were negatively associated with UHS scores.
CONCLUSION/DISCUSSION
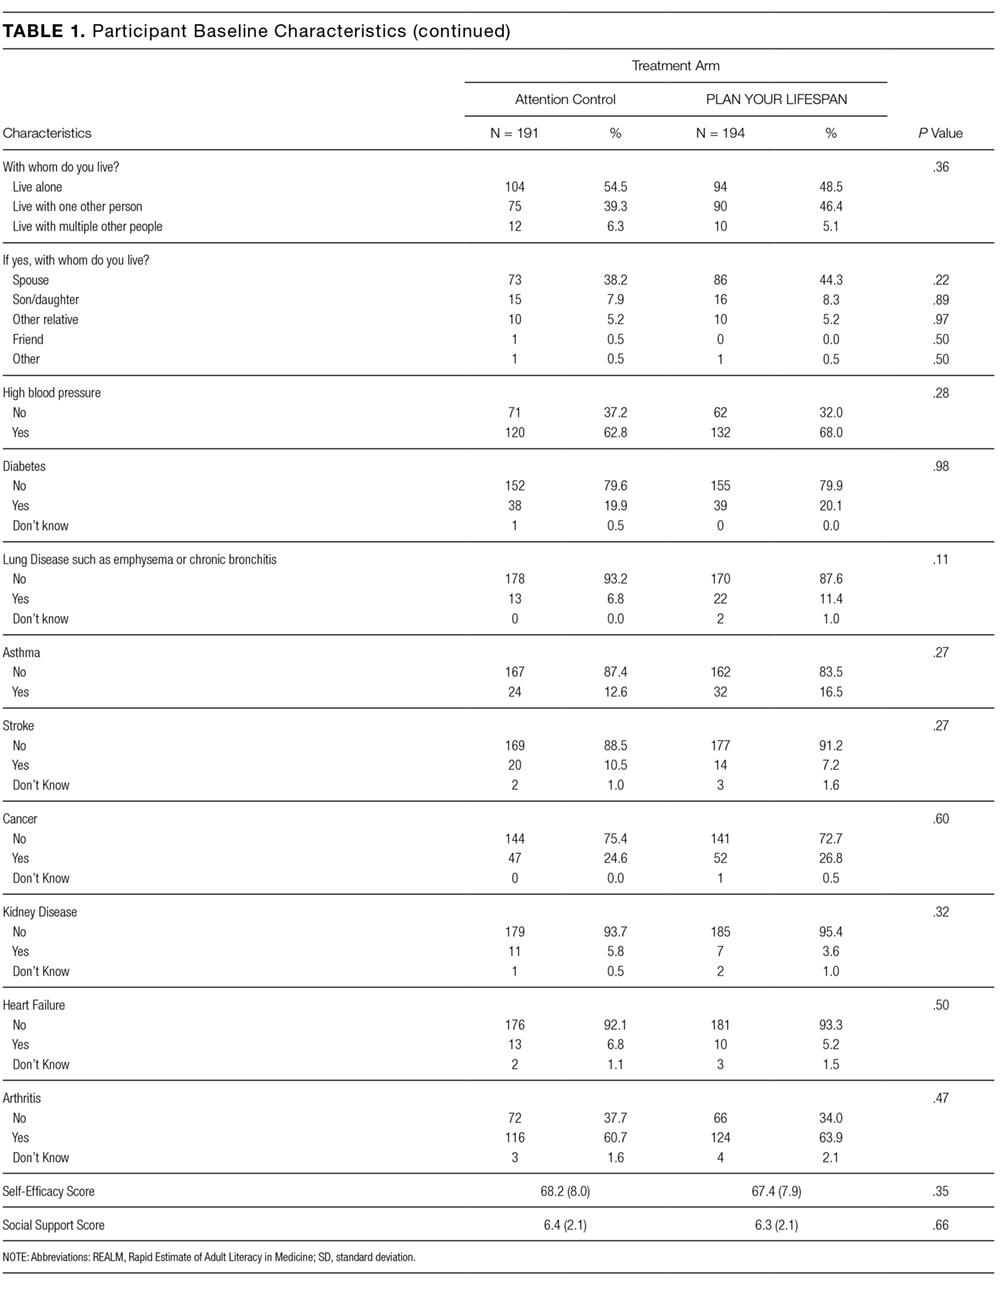
The results of our study show that among seniors, PYL improved their understanding of home-based services and the services that may be required following a hospitalization. Educating seniors about what to expect regarding the transition home from a hospital before a hospitalization even occurs may enable seniors and their families to plan ahead instead of reacting to a hospitalization. PYL, a national, publicly available tool with links to local resources may potentially help in advancing transitional discharge care to prior to a hospitalization.
To our knowledge, this is one of the first websites and trials devoted to planning for seniors’ health trajectory as they age into their 70s, 80s, 90s, and 100s. Clinicians regularly discuss code status and powers of attorney during their end-of-life discussions with patients. We encourage clinicians to ask patients, “What about the 10 to 20 years before you die? Have you considered what you will do if you get sick or need help at home?” While not replacing a social worker, the ability of PYL to connect seniors to local resources makes it somewhat of a “virtual social worker.” With many physician practices unable to afford social workers, PYL provides a free-of-charge means of connecting seniors to area resources.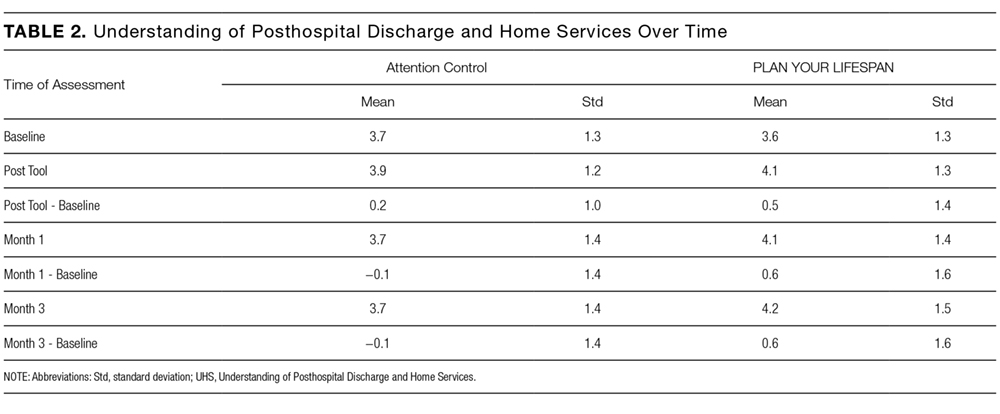
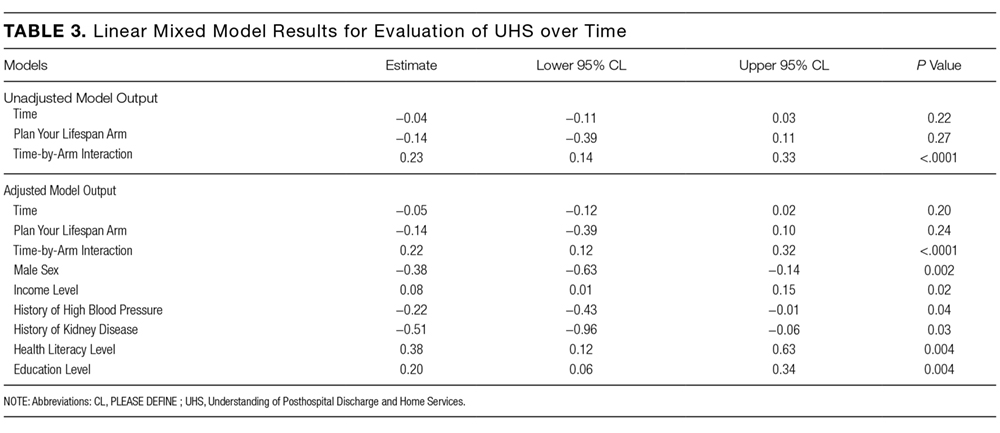
The study participants were in general white, educated, and in reasonably good health. This may be a limitation of this study given that it could impact the generalizability of the study results, as we are unable to know for certain if these same results would be observed with participants who have lower educational levels and are in poor health. Power considerations in this study did not account for comparison of outcomes within specific subgroups so we were unable to assess outcomes in groups such as those with limited health literacy, low social support, or low self-efficacy. The trial was also limited by our inability to collect information on whether or not the knowledge gains observed in the study led to any measureable outcomes. Due to the relatively short follow-up time, we were unable to ascertain whether any study participants were hospitalized during the study follow-up period and if so, if exposure to PYL had any impact on patient anxiety, length of hospital stay, and/or caregiver burden. We were also unable to assess patients’ ability to utilize and carry out their posthospitalization discharge plans if they had one in place. Future studies with longer follow-up are needed to determine these important, measurable outcomes.
Potential implications of planning for a senior’s lifespan are expansive. If hospitalized seniors knew their preferred SNF for subacute rehabilitation on the first day of their hospitalization, hospital lengths of stay could potentially be reduced. If families knew which caregiver agencies, Area Agency on Aging, or Village their senior wished to use, obtaining services would perhaps be easier to accomplish.
Acknowledgments
This work was supported through a Patient-Centered Outcomes Research Institute Award (IH-12-11-4259). Dr. Lindquist and Dr. Ciolino had full access to all of the data in the study and take responsibility for the integrity of the data and the accuracy of the data analysis. Research reported in this publication was also supported, in part, by the National Institutes of Health’s National Center for Advancing Translational Sciences, Grant Number UL1TR000150.
Disclaimer
All statements in this manuscript, including its findings and conclusions, are solely those of the authors and do not necessarily represent the views of the Patient-Centered Outcomes Research Institute, its Board of Governors or Methodology Committee, or the National Institutes of Health.
Disclosure: The authors have nothing to report.
1. Campbell SE, Seymour DG, Primrose WR, ACMEPLUS Project. A systematic literature review of factors affecting outcome in older medical patients admitted to hospital. Age Ageing. 2004;33:110-115. PubMed
2. Forster AJ, Clark HD, Menard A, et al. Adverse events among medical patients after discharge from hospital. CMAJ. 2004; 70:345-349. PubMed
3. Kane RL Finding the right level of posthospital care: “We didn’t realize there was any other option for him”. JAMA. 2011;305(3):284-293. PubMed
4. Shepperd S, McClaran J, Phillips CO, et al. Discharge planning from hospital to home. Cochrane Database Syst Rev. 2010;(1):CD000313. PubMed
5. Horwitz LI, Moriarty JP, Chen C, et al. Quality of discharge practices and patient understanding at an academic medical center. JAMA Intern Med. 2013;173:1715-1722. PubMed
6. Creditor MC. Hazards of hospitalization of the elderly. Ann Intern Med. 1993;118(3):219-223. PubMed
7. U.S. Census Bureau, Population Division, Census 2003. https://www.census.gov/programs-surveys/saipe/data/datasets.2003.html. Originally accessed September 1, 2016.
8. Russo, C. A., Elixhauser, A. Hospitalizations in the Elderly Population, 2003. Statistical Brief #6. May 2006. Agency for Healthcare Research and Quality, Rockville, MD. http://www.hcup-us.ahrq.gov/reports/statbriefs/sb6.pdf. Accessed September 1, 2017.
9 U.S. Department of Health and Human Services, and U.S. Department of Labor. The future supply of long-term care workers in relation to the aging baby boom generation: Report to Congress. Washington, DC: Office of the Assistant Secretary for Planning and Evaluation, 2003. http:aspe.hhs.gov/daltcp/reports/ltcwork.htm. Accessed September 1, 2016.
10. The Henry J. Kaiser Foundation. Long-term Care: Medicaid’s role and challenges [Publication #2172]. Washington, DC: 1999.
11. AARP. Beyond 50.2003: A Report to the Nation on Independent Living and Disability, 2003, http://www.aarp.org/research/health/disabilities/aresearch-import-753.html. Accessed September 1, 2016.
12. Lindquist LA, Ramirez-Zohfeld V, Sunkara P, et al. Advanced Life Events (ALEs) that Impede Aging-in-Place among Seniors. Arch Gerontol Geriatrs. 2016;64:90-95. PubMed
13. Doak CC, Doak LG, Root JH. Teaching Patients with Low Literacy Skills. Philadelphia, PA: JB Lippincott Co.; 1996.
14. Callahan CM, Unverzagt FW, Hui SL, Perkins AJ, Hendrie HC. Six-item screener to identify cognitive impairment among potential subjects for clinical research. Med Care. 2002;40:771-781. PubMed
15. Harris PA, Taylor R, Thielke R, Payne J, Gonzalez N, Gonzalez J, Conde JG. Research electronic data capture (REDCap) - A metadata-driven methodology and workflow process for providing translational research informatics support. J Biomed Inform. 2009;42(2):377-381. PubMed
16. Sherer M, Maddux JE, Mercandante B, Prentice-Dunn S, Jacobs B, Rogers RW. The Self Efficacy Scale: Construction and Validation. Psychol Rep. 1982;51(3):663-671.
17. Lubben JE. Assessing social networks among elderly populations. Fam Community Health. 1988;11(3):42-52.
18. Arozullah AM, Yarnold PR, Bennett CL, et al. Development and validation of the Rapid Estimate of Adult Literacy in Medicine. Medical Care. 2007;45(11):1026-1033. PubMed
When seniors are discharged from the hospital, many will require additional support and therapy to regain their independence and return safely home.1,2 Most seniors do not understand what their support needs will entail or the differences between therapy choices.3 To complicate the issue, seniors are often incapacitated and unable to make discharge selections for themselves.
Consequently, discharge planners and social workers often explain options to family members and loved ones, who frequently feel overwhelmed.4,5 While often balancing jobs, loved ones are divided between wanting to stay with the senior in the hospital and driving to area skilled nursing facilities (SNFs) for consideration. Discharges are delayed waiting for families to make visits and choose an SNF. Longer lengths of stay are detrimental to seniors due to the increased risks of infection, functional loss, and cognitive decline.6
Although seniors comprised only 12% of the US population in 2003,7 they accounted for one-third of all hospitalizations, over 13.2 million hospital stays.8 Hospital stays for seniors resulted in hospital charges totaling nearly $329 billion, or 43.6% of national hospital bills in 2003.7 Seniors are also high consumers of postacute care services. By 2050, the number of individuals using long-term care services in any setting (eg, at home, assisted living, or SNFs) will be close to 27 million.9-11 With the knowledge that many seniors will be hospitalized and subsequently require services thereafter, we sought to assist seniors in planning for their hospital discharge needs before they were hospitalized.
Our team developed PlanYourLifespan.org (PYL) to facilitate this planning for postdischarge needs and fill the knowledge gap in understanding postdischarge options. With funding from the Patient Centered Outcomes Research Institute, we aimed to test the effectiveness of PYL on improving knowledge of hospital discharge resources among seniors.
METHODS
PlanYourLifespan.org
PlanYourLifespan.org (PYL) educates users on the health crises that often occur with age and connects them to posthospital and home-based resources available locally and nationally. PYL is personalized, dynamic, and adaptable in that all the information can be changed per the senior’s wishes or changing health needs.
Content of PYL
Previously, we conducted focus groups with seniors about current and perceived home needs and aging-in-place. Major themes of what advanced life events (ALEs) would impact aging-in-place were identified as follows: hospitalizations, falls, and Alzheimer’s.12 We organized PYL around these health-related ALEs. Our multidisciplinary team of researchers, seniors, social workers, caregiver agencies, and Area Agencies on Aging representatives then determined what information and resources should be included.
Each section of PYL starts with a video of a senior discussing their real-life personal experiences, with subsections providing interactive information on what seniors can expect, types of resources available to support home needs, and choices to be made. Descriptions of types of settings for therapy, options available, and links to national/local resources (eg, quality indicators for SNFs) are also included. For example, by entering their zip code, users can identify their neighborhood SNFs, closest Area Agency on Aging, and what home caregiver agencies exist in their area.
Users can save their preferences and revisit their choices at any time. To support communication between seniors and their loved ones, a summary of their choices can be printed or e-mailed to relevant parties. For example, a senior uses PYL and can e-mail these choices to family members, which can stimulate a conversation about future posthospital care expectations.
As inadequate health literacy and cognitive impairment are prevalent among seniors, PYL presents information understandable at all levels of health literacy and sensitive to cognitive load.9 There is simplified, large-font, no mouse scrolling and audio available for the visually impaired.
Study Design and Randomization
To test PYL, a 2-armed (attention control [AC] and PYL intervention), parallel, randomized controlled trial was conducted. Participants were randomly assigned to 1 of the 2 conditions via a pregenerated central randomization list using equal (1:1) allocation and random permuted block design to ensure relatively equal allocation throughout the study. The AC condition exposed participants to the National Institute on Aging-sponsored website, Go4Life.nia.nih.gov, an educational website on physical activity for seniors. This website has comparable design and layout to PYL but does not include information about advanced planning. The AC condition controlled for the possibility that regular contact with the study team may improve outcomes in participants randomized to the intervention website.
The trial was conducted from October 2014 to September 2015 in Chicago, Illinois; Fort Wayne, Indiana; and Houston, Texas. Inclusion criteria were as follows: age 65 and older, English-speaking, scoring ≥4 questions correctly on the Brief Cognitive Screen,14 and current self-reported use of a computer or smartphone with internet. Participants were excluded if they had previously participated in the focus groups or beta testing of the PYL website. Community-based patient partners/stakeholders drove subject recruitment in their communities through word of mouth, e-mail bursts, newsletters, and flyers. At the Area Agency on Aging and community centers where services such as food vouchers and case management are provided, participants were recruited on-site and given study information. At the clinical sites, staff referred potential participants. Study materials such as flyers and information sheets were also located in the clinic waiting rooms. The Villages, nonprofit, grassroots, membership organizations that are redefining aging by being a key resource to community members wishing to age in place, heavily relied on electronic recruitment using their regular e-newsletters and e-mail lists to recruit potential participants. Potential subjects were also recruited by distributing flyers at local senior centers and senior housing buildings. Interested seniors contacted research staff who explained the study and assessed their eligibility. If eligible, subjects were scheduled for a face-to-face interview.
At the face-to-face encounter, all study subjects completed a written consent, answered baseline questions, and were randomized to either arm. Next, research staff introduced all study subjects to the website to which they were randomized and provided instructions on its use. Staff were present to assist with questions as needed on navigation but did not assist with decision making for either website. A minimum of 15 minutes and a maximum of 45 minutes was allotted for navigating either website. After navigating their website, participants were administered an immediate in-person posttest survey. One month and 3 months after the face-to-face encounter, research staff contacted all study participants over the phone to complete a follow-up survey. Staff attempted to reach participants up to 3 times by phone. Data were entered into Research Electronic Data Capture survey software.15 This study was approved by the Northwestern University Institutional Review Board.
Understanding of Posthospital Discharge and Home Services
As part of the larger trial, which included behavioural outcomes that will be reported elsewhere, we sought to explore the effects of PYL on participants’ knowledge and understanding of posthospital discharge and home services (UHS). Participants were asked to respond to 6 questions at baseline, immediate posttest, and at the 1- and 3-month follow-up time points. Knowledge items were developed by the study team in conjunction with the patient/partner stakeholders. UHS scores were calculated as the sum of the 6 questions (each scored 0 if incorrect and 1 if correct) with a possible range of 0-6.
Covariates
Demographic information, self-reported health, importance of religion, and existence of a power of attorney, living will, advanced directive (eg, Physician Orders for Life-Sustaining Treatment) were obtained via self-report. Participants were asked about their general and social self-efficacy using the validated Self-efficacy Scale16 and their social support using the Lubben Social Network Scale–6.17 Health literacy was assessed using the Rapid Estimate of Adult Literacy in Medicine–Short Form.18 To measure burden of disease, participant comorbidities were measured using a nonvalidated 9-item dichotomous response condition list, which included some items adapted from the Charlson Comorbidity Index and the Elixhauser Comorbidity Index.
Statistical Analysis
Data analysis included all available data in the intention-to-treat dataset. As UHS was collected at multiple time points up to 3 months postintervention, we employed linear- mixed modeling with random participant effect and fixed arm, time, and time-by-arm interaction terms. The time-by-arm interaction allows for comparison of UHS slopes (or trajectories) across arms. Analyses explored multiple potential covariates, including current utilization of services, physical function, comorbidities, social support, health literacy, self-efficacy, and sociodemographics. Those covariates found to have a significant association (P < 0.05) with outcome were considered for inclusion in the overall model selection process. Ultimately, we developed a final parsimonious, adjusted longitudinal model with primary predictors of time, arm, and their interaction, controlling for only significant baseline variables following a manual backward selection method. All analyses were conducted in SAS software (version 9.4, copyright 2012, The SAS Institute Inc., Cary, North Carolina).
RESULTS
Table 3 illustrates linear mixed model results both failing to adjust and adjusting for potentially influential baseline covariates. In both instances, the interaction term (arm-by-time) was highly significant (P < 0.0001) in predicting UHS score, suggesting that, when compared to the AC arm, the intervention arm exhibited a large mean slope in UHS score over time. That is, understanding home services score tended to increase at a faster rate for those in the active arm. Higher levels of income (P = 0.0191), literacy (P = 0.0036), and education (P = 0.0042) were associated with increased UHS scores; however, male sex (P = 0.0023) and history of high blood pressure (P = 0.0409) or kidney disease (P = 0.0278) were negatively associated with UHS scores.
CONCLUSION/DISCUSSION
The results of our study show that among seniors, PYL improved their understanding of home-based services and the services that may be required following a hospitalization. Educating seniors about what to expect regarding the transition home from a hospital before a hospitalization even occurs may enable seniors and their families to plan ahead instead of reacting to a hospitalization. PYL, a national, publicly available tool with links to local resources may potentially help in advancing transitional discharge care to prior to a hospitalization.
To our knowledge, this is one of the first websites and trials devoted to planning for seniors’ health trajectory as they age into their 70s, 80s, 90s, and 100s. Clinicians regularly discuss code status and powers of attorney during their end-of-life discussions with patients. We encourage clinicians to ask patients, “What about the 10 to 20 years before you die? Have you considered what you will do if you get sick or need help at home?” While not replacing a social worker, the ability of PYL to connect seniors to local resources makes it somewhat of a “virtual social worker.” With many physician practices unable to afford social workers, PYL provides a free-of-charge means of connecting seniors to area resources.
The study participants were in general white, educated, and in reasonably good health. This may be a limitation of this study given that it could impact the generalizability of the study results, as we are unable to know for certain if these same results would be observed with participants who have lower educational levels and are in poor health. Power considerations in this study did not account for comparison of outcomes within specific subgroups so we were unable to assess outcomes in groups such as those with limited health literacy, low social support, or low self-efficacy. The trial was also limited by our inability to collect information on whether or not the knowledge gains observed in the study led to any measureable outcomes. Due to the relatively short follow-up time, we were unable to ascertain whether any study participants were hospitalized during the study follow-up period and if so, if exposure to PYL had any impact on patient anxiety, length of hospital stay, and/or caregiver burden. We were also unable to assess patients’ ability to utilize and carry out their posthospitalization discharge plans if they had one in place. Future studies with longer follow-up are needed to determine these important, measurable outcomes.
Potential implications of planning for a senior’s lifespan are expansive. If hospitalized seniors knew their preferred SNF for subacute rehabilitation on the first day of their hospitalization, hospital lengths of stay could potentially be reduced. If families knew which caregiver agencies, Area Agency on Aging, or Village their senior wished to use, obtaining services would perhaps be easier to accomplish.
Acknowledgments
This work was supported through a Patient-Centered Outcomes Research Institute Award (IH-12-11-4259). Dr. Lindquist and Dr. Ciolino had full access to all of the data in the study and take responsibility for the integrity of the data and the accuracy of the data analysis. Research reported in this publication was also supported, in part, by the National Institutes of Health’s National Center for Advancing Translational Sciences, Grant Number UL1TR000150.
Disclaimer
All statements in this manuscript, including its findings and conclusions, are solely those of the authors and do not necessarily represent the views of the Patient-Centered Outcomes Research Institute, its Board of Governors or Methodology Committee, or the National Institutes of Health.
Disclosure: The authors have nothing to report.
When seniors are discharged from the hospital, many will require additional support and therapy to regain their independence and return safely home.1,2 Most seniors do not understand what their support needs will entail or the differences between therapy choices.3 To complicate the issue, seniors are often incapacitated and unable to make discharge selections for themselves.
Consequently, discharge planners and social workers often explain options to family members and loved ones, who frequently feel overwhelmed.4,5 While often balancing jobs, loved ones are divided between wanting to stay with the senior in the hospital and driving to area skilled nursing facilities (SNFs) for consideration. Discharges are delayed waiting for families to make visits and choose an SNF. Longer lengths of stay are detrimental to seniors due to the increased risks of infection, functional loss, and cognitive decline.6
Although seniors comprised only 12% of the US population in 2003,7 they accounted for one-third of all hospitalizations, over 13.2 million hospital stays.8 Hospital stays for seniors resulted in hospital charges totaling nearly $329 billion, or 43.6% of national hospital bills in 2003.7 Seniors are also high consumers of postacute care services. By 2050, the number of individuals using long-term care services in any setting (eg, at home, assisted living, or SNFs) will be close to 27 million.9-11 With the knowledge that many seniors will be hospitalized and subsequently require services thereafter, we sought to assist seniors in planning for their hospital discharge needs before they were hospitalized.
Our team developed PlanYourLifespan.org (PYL) to facilitate this planning for postdischarge needs and fill the knowledge gap in understanding postdischarge options. With funding from the Patient Centered Outcomes Research Institute, we aimed to test the effectiveness of PYL on improving knowledge of hospital discharge resources among seniors.
METHODS
PlanYourLifespan.org
PlanYourLifespan.org (PYL) educates users on the health crises that often occur with age and connects them to posthospital and home-based resources available locally and nationally. PYL is personalized, dynamic, and adaptable in that all the information can be changed per the senior’s wishes or changing health needs.
Content of PYL
Previously, we conducted focus groups with seniors about current and perceived home needs and aging-in-place. Major themes of what advanced life events (ALEs) would impact aging-in-place were identified as follows: hospitalizations, falls, and Alzheimer’s.12 We organized PYL around these health-related ALEs. Our multidisciplinary team of researchers, seniors, social workers, caregiver agencies, and Area Agencies on Aging representatives then determined what information and resources should be included.
Each section of PYL starts with a video of a senior discussing their real-life personal experiences, with subsections providing interactive information on what seniors can expect, types of resources available to support home needs, and choices to be made. Descriptions of types of settings for therapy, options available, and links to national/local resources (eg, quality indicators for SNFs) are also included. For example, by entering their zip code, users can identify their neighborhood SNFs, closest Area Agency on Aging, and what home caregiver agencies exist in their area.
Users can save their preferences and revisit their choices at any time. To support communication between seniors and their loved ones, a summary of their choices can be printed or e-mailed to relevant parties. For example, a senior uses PYL and can e-mail these choices to family members, which can stimulate a conversation about future posthospital care expectations.
As inadequate health literacy and cognitive impairment are prevalent among seniors, PYL presents information understandable at all levels of health literacy and sensitive to cognitive load.9 There is simplified, large-font, no mouse scrolling and audio available for the visually impaired.
Study Design and Randomization
To test PYL, a 2-armed (attention control [AC] and PYL intervention), parallel, randomized controlled trial was conducted. Participants were randomly assigned to 1 of the 2 conditions via a pregenerated central randomization list using equal (1:1) allocation and random permuted block design to ensure relatively equal allocation throughout the study. The AC condition exposed participants to the National Institute on Aging-sponsored website, Go4Life.nia.nih.gov, an educational website on physical activity for seniors. This website has comparable design and layout to PYL but does not include information about advanced planning. The AC condition controlled for the possibility that regular contact with the study team may improve outcomes in participants randomized to the intervention website.
The trial was conducted from October 2014 to September 2015 in Chicago, Illinois; Fort Wayne, Indiana; and Houston, Texas. Inclusion criteria were as follows: age 65 and older, English-speaking, scoring ≥4 questions correctly on the Brief Cognitive Screen,14 and current self-reported use of a computer or smartphone with internet. Participants were excluded if they had previously participated in the focus groups or beta testing of the PYL website. Community-based patient partners/stakeholders drove subject recruitment in their communities through word of mouth, e-mail bursts, newsletters, and flyers. At the Area Agency on Aging and community centers where services such as food vouchers and case management are provided, participants were recruited on-site and given study information. At the clinical sites, staff referred potential participants. Study materials such as flyers and information sheets were also located in the clinic waiting rooms. The Villages, nonprofit, grassroots, membership organizations that are redefining aging by being a key resource to community members wishing to age in place, heavily relied on electronic recruitment using their regular e-newsletters and e-mail lists to recruit potential participants. Potential subjects were also recruited by distributing flyers at local senior centers and senior housing buildings. Interested seniors contacted research staff who explained the study and assessed their eligibility. If eligible, subjects were scheduled for a face-to-face interview.
At the face-to-face encounter, all study subjects completed a written consent, answered baseline questions, and were randomized to either arm. Next, research staff introduced all study subjects to the website to which they were randomized and provided instructions on its use. Staff were present to assist with questions as needed on navigation but did not assist with decision making for either website. A minimum of 15 minutes and a maximum of 45 minutes was allotted for navigating either website. After navigating their website, participants were administered an immediate in-person posttest survey. One month and 3 months after the face-to-face encounter, research staff contacted all study participants over the phone to complete a follow-up survey. Staff attempted to reach participants up to 3 times by phone. Data were entered into Research Electronic Data Capture survey software.15 This study was approved by the Northwestern University Institutional Review Board.
Understanding of Posthospital Discharge and Home Services
As part of the larger trial, which included behavioural outcomes that will be reported elsewhere, we sought to explore the effects of PYL on participants’ knowledge and understanding of posthospital discharge and home services (UHS). Participants were asked to respond to 6 questions at baseline, immediate posttest, and at the 1- and 3-month follow-up time points. Knowledge items were developed by the study team in conjunction with the patient/partner stakeholders. UHS scores were calculated as the sum of the 6 questions (each scored 0 if incorrect and 1 if correct) with a possible range of 0-6.
Covariates
Demographic information, self-reported health, importance of religion, and existence of a power of attorney, living will, advanced directive (eg, Physician Orders for Life-Sustaining Treatment) were obtained via self-report. Participants were asked about their general and social self-efficacy using the validated Self-efficacy Scale16 and their social support using the Lubben Social Network Scale–6.17 Health literacy was assessed using the Rapid Estimate of Adult Literacy in Medicine–Short Form.18 To measure burden of disease, participant comorbidities were measured using a nonvalidated 9-item dichotomous response condition list, which included some items adapted from the Charlson Comorbidity Index and the Elixhauser Comorbidity Index.
Statistical Analysis
Data analysis included all available data in the intention-to-treat dataset. As UHS was collected at multiple time points up to 3 months postintervention, we employed linear- mixed modeling with random participant effect and fixed arm, time, and time-by-arm interaction terms. The time-by-arm interaction allows for comparison of UHS slopes (or trajectories) across arms. Analyses explored multiple potential covariates, including current utilization of services, physical function, comorbidities, social support, health literacy, self-efficacy, and sociodemographics. Those covariates found to have a significant association (P < 0.05) with outcome were considered for inclusion in the overall model selection process. Ultimately, we developed a final parsimonious, adjusted longitudinal model with primary predictors of time, arm, and their interaction, controlling for only significant baseline variables following a manual backward selection method. All analyses were conducted in SAS software (version 9.4, copyright 2012, The SAS Institute Inc., Cary, North Carolina).
RESULTS
Table 3 illustrates linear mixed model results both failing to adjust and adjusting for potentially influential baseline covariates. In both instances, the interaction term (arm-by-time) was highly significant (P < 0.0001) in predicting UHS score, suggesting that, when compared to the AC arm, the intervention arm exhibited a large mean slope in UHS score over time. That is, understanding home services score tended to increase at a faster rate for those in the active arm. Higher levels of income (P = 0.0191), literacy (P = 0.0036), and education (P = 0.0042) were associated with increased UHS scores; however, male sex (P = 0.0023) and history of high blood pressure (P = 0.0409) or kidney disease (P = 0.0278) were negatively associated with UHS scores.
CONCLUSION/DISCUSSION
The results of our study show that among seniors, PYL improved their understanding of home-based services and the services that may be required following a hospitalization. Educating seniors about what to expect regarding the transition home from a hospital before a hospitalization even occurs may enable seniors and their families to plan ahead instead of reacting to a hospitalization. PYL, a national, publicly available tool with links to local resources may potentially help in advancing transitional discharge care to prior to a hospitalization.
To our knowledge, this is one of the first websites and trials devoted to planning for seniors’ health trajectory as they age into their 70s, 80s, 90s, and 100s. Clinicians regularly discuss code status and powers of attorney during their end-of-life discussions with patients. We encourage clinicians to ask patients, “What about the 10 to 20 years before you die? Have you considered what you will do if you get sick or need help at home?” While not replacing a social worker, the ability of PYL to connect seniors to local resources makes it somewhat of a “virtual social worker.” With many physician practices unable to afford social workers, PYL provides a free-of-charge means of connecting seniors to area resources.
The study participants were in general white, educated, and in reasonably good health. This may be a limitation of this study given that it could impact the generalizability of the study results, as we are unable to know for certain if these same results would be observed with participants who have lower educational levels and are in poor health. Power considerations in this study did not account for comparison of outcomes within specific subgroups so we were unable to assess outcomes in groups such as those with limited health literacy, low social support, or low self-efficacy. The trial was also limited by our inability to collect information on whether or not the knowledge gains observed in the study led to any measureable outcomes. Due to the relatively short follow-up time, we were unable to ascertain whether any study participants were hospitalized during the study follow-up period and if so, if exposure to PYL had any impact on patient anxiety, length of hospital stay, and/or caregiver burden. We were also unable to assess patients’ ability to utilize and carry out their posthospitalization discharge plans if they had one in place. Future studies with longer follow-up are needed to determine these important, measurable outcomes.
Potential implications of planning for a senior’s lifespan are expansive. If hospitalized seniors knew their preferred SNF for subacute rehabilitation on the first day of their hospitalization, hospital lengths of stay could potentially be reduced. If families knew which caregiver agencies, Area Agency on Aging, or Village their senior wished to use, obtaining services would perhaps be easier to accomplish.
Acknowledgments
This work was supported through a Patient-Centered Outcomes Research Institute Award (IH-12-11-4259). Dr. Lindquist and Dr. Ciolino had full access to all of the data in the study and take responsibility for the integrity of the data and the accuracy of the data analysis. Research reported in this publication was also supported, in part, by the National Institutes of Health’s National Center for Advancing Translational Sciences, Grant Number UL1TR000150.
Disclaimer
All statements in this manuscript, including its findings and conclusions, are solely those of the authors and do not necessarily represent the views of the Patient-Centered Outcomes Research Institute, its Board of Governors or Methodology Committee, or the National Institutes of Health.
Disclosure: The authors have nothing to report.
1. Campbell SE, Seymour DG, Primrose WR, ACMEPLUS Project. A systematic literature review of factors affecting outcome in older medical patients admitted to hospital. Age Ageing. 2004;33:110-115. PubMed
2. Forster AJ, Clark HD, Menard A, et al. Adverse events among medical patients after discharge from hospital. CMAJ. 2004; 70:345-349. PubMed
3. Kane RL Finding the right level of posthospital care: “We didn’t realize there was any other option for him”. JAMA. 2011;305(3):284-293. PubMed
4. Shepperd S, McClaran J, Phillips CO, et al. Discharge planning from hospital to home. Cochrane Database Syst Rev. 2010;(1):CD000313. PubMed
5. Horwitz LI, Moriarty JP, Chen C, et al. Quality of discharge practices and patient understanding at an academic medical center. JAMA Intern Med. 2013;173:1715-1722. PubMed
6. Creditor MC. Hazards of hospitalization of the elderly. Ann Intern Med. 1993;118(3):219-223. PubMed
7. U.S. Census Bureau, Population Division, Census 2003. https://www.census.gov/programs-surveys/saipe/data/datasets.2003.html. Originally accessed September 1, 2016.
8. Russo, C. A., Elixhauser, A. Hospitalizations in the Elderly Population, 2003. Statistical Brief #6. May 2006. Agency for Healthcare Research and Quality, Rockville, MD. http://www.hcup-us.ahrq.gov/reports/statbriefs/sb6.pdf. Accessed September 1, 2017.
9 U.S. Department of Health and Human Services, and U.S. Department of Labor. The future supply of long-term care workers in relation to the aging baby boom generation: Report to Congress. Washington, DC: Office of the Assistant Secretary for Planning and Evaluation, 2003. http:aspe.hhs.gov/daltcp/reports/ltcwork.htm. Accessed September 1, 2016.
10. The Henry J. Kaiser Foundation. Long-term Care: Medicaid’s role and challenges [Publication #2172]. Washington, DC: 1999.
11. AARP. Beyond 50.2003: A Report to the Nation on Independent Living and Disability, 2003, http://www.aarp.org/research/health/disabilities/aresearch-import-753.html. Accessed September 1, 2016.
12. Lindquist LA, Ramirez-Zohfeld V, Sunkara P, et al. Advanced Life Events (ALEs) that Impede Aging-in-Place among Seniors. Arch Gerontol Geriatrs. 2016;64:90-95. PubMed
13. Doak CC, Doak LG, Root JH. Teaching Patients with Low Literacy Skills. Philadelphia, PA: JB Lippincott Co.; 1996.
14. Callahan CM, Unverzagt FW, Hui SL, Perkins AJ, Hendrie HC. Six-item screener to identify cognitive impairment among potential subjects for clinical research. Med Care. 2002;40:771-781. PubMed
15. Harris PA, Taylor R, Thielke R, Payne J, Gonzalez N, Gonzalez J, Conde JG. Research electronic data capture (REDCap) - A metadata-driven methodology and workflow process for providing translational research informatics support. J Biomed Inform. 2009;42(2):377-381. PubMed
16. Sherer M, Maddux JE, Mercandante B, Prentice-Dunn S, Jacobs B, Rogers RW. The Self Efficacy Scale: Construction and Validation. Psychol Rep. 1982;51(3):663-671.
17. Lubben JE. Assessing social networks among elderly populations. Fam Community Health. 1988;11(3):42-52.
18. Arozullah AM, Yarnold PR, Bennett CL, et al. Development and validation of the Rapid Estimate of Adult Literacy in Medicine. Medical Care. 2007;45(11):1026-1033. PubMed
1. Campbell SE, Seymour DG, Primrose WR, ACMEPLUS Project. A systematic literature review of factors affecting outcome in older medical patients admitted to hospital. Age Ageing. 2004;33:110-115. PubMed
2. Forster AJ, Clark HD, Menard A, et al. Adverse events among medical patients after discharge from hospital. CMAJ. 2004; 70:345-349. PubMed
3. Kane RL Finding the right level of posthospital care: “We didn’t realize there was any other option for him”. JAMA. 2011;305(3):284-293. PubMed
4. Shepperd S, McClaran J, Phillips CO, et al. Discharge planning from hospital to home. Cochrane Database Syst Rev. 2010;(1):CD000313. PubMed
5. Horwitz LI, Moriarty JP, Chen C, et al. Quality of discharge practices and patient understanding at an academic medical center. JAMA Intern Med. 2013;173:1715-1722. PubMed
6. Creditor MC. Hazards of hospitalization of the elderly. Ann Intern Med. 1993;118(3):219-223. PubMed
7. U.S. Census Bureau, Population Division, Census 2003. https://www.census.gov/programs-surveys/saipe/data/datasets.2003.html. Originally accessed September 1, 2016.
8. Russo, C. A., Elixhauser, A. Hospitalizations in the Elderly Population, 2003. Statistical Brief #6. May 2006. Agency for Healthcare Research and Quality, Rockville, MD. http://www.hcup-us.ahrq.gov/reports/statbriefs/sb6.pdf. Accessed September 1, 2017.
9 U.S. Department of Health and Human Services, and U.S. Department of Labor. The future supply of long-term care workers in relation to the aging baby boom generation: Report to Congress. Washington, DC: Office of the Assistant Secretary for Planning and Evaluation, 2003. http:aspe.hhs.gov/daltcp/reports/ltcwork.htm. Accessed September 1, 2016.
10. The Henry J. Kaiser Foundation. Long-term Care: Medicaid’s role and challenges [Publication #2172]. Washington, DC: 1999.
11. AARP. Beyond 50.2003: A Report to the Nation on Independent Living and Disability, 2003, http://www.aarp.org/research/health/disabilities/aresearch-import-753.html. Accessed September 1, 2016.
12. Lindquist LA, Ramirez-Zohfeld V, Sunkara P, et al. Advanced Life Events (ALEs) that Impede Aging-in-Place among Seniors. Arch Gerontol Geriatrs. 2016;64:90-95. PubMed
13. Doak CC, Doak LG, Root JH. Teaching Patients with Low Literacy Skills. Philadelphia, PA: JB Lippincott Co.; 1996.
14. Callahan CM, Unverzagt FW, Hui SL, Perkins AJ, Hendrie HC. Six-item screener to identify cognitive impairment among potential subjects for clinical research. Med Care. 2002;40:771-781. PubMed
15. Harris PA, Taylor R, Thielke R, Payne J, Gonzalez N, Gonzalez J, Conde JG. Research electronic data capture (REDCap) - A metadata-driven methodology and workflow process for providing translational research informatics support. J Biomed Inform. 2009;42(2):377-381. PubMed
16. Sherer M, Maddux JE, Mercandante B, Prentice-Dunn S, Jacobs B, Rogers RW. The Self Efficacy Scale: Construction and Validation. Psychol Rep. 1982;51(3):663-671.
17. Lubben JE. Assessing social networks among elderly populations. Fam Community Health. 1988;11(3):42-52.
18. Arozullah AM, Yarnold PR, Bennett CL, et al. Development and validation of the Rapid Estimate of Adult Literacy in Medicine. Medical Care. 2007;45(11):1026-1033. PubMed
© 2017 Society of Hospital Medicine
The Effect of an Inpatient Smoking Cessation Treatment Program on Hospital Readmissions and Length of Stay
Successful smoking cessation interventions result in substantial gains in health and life expectancy by reducing smoking-related illnesses and preventing premature deaths.1,2 The Department of Health and Human Services recommends clinicians use hospitalization as “an opportunity to promote smoking cessation’’ and ‘‘to prescribe medications to alleviate withdrawal symptoms”3 because individual readiness to quit may be high during hospitalizations. A meta-analysis of 50 studies (21 from the United States) examining the efficacy of hospital-initiated smoking cessation interventions concluded that smoking cessation support programs that began in the hospital and continued for at least 1 month postdischarge significantly increase the likelihood of patients being smoke-free in the long term.4 The most efficacious strategies included counseling and pharmacotherapy rather than counseling alone.3 Most inpatient smoking cessation studies have focused on quit-rates or medical outcomes, while fewer studies have looked at healthcare utilization.
However, previous research has shown that smoking cessation for inpatients has relatively immediate economic and health benefits. Patients who quit smoking during hospitalizations for cardiovascular disease are less likely to be readmitted or to die during follow-up.5,6 Patients with acute myocardial infarction (AMI), unstable angina, heart failure, and chronic obstructive pulmonary disease who received an inpatient smoking cessation intervention had reductions in inpatient readmission rates.7 A 1% reduction in overall smoking rates would lead to an annual reduction of 3,022 hospitalizations for stroke and 1,684 hospitalizations for AMI.8 One comprehensive program, the Ottawa Model for Smoking Cessation (OMSC), found that a hospital-initiated intervention increased long-term cessation rates by 15% in cardiac patients and by 11% in general hospital populations.9,10 The applicability of this result to US healthcare systems is unknown. This paper adds to the existing literature by evaluating the impact of an inpatient smoking cessation program on healthcare utilization among patients hospitalized for any reason, rather than solely focused on those with cardiopulmonary diagnoses.
The current study focuses on an inpatient smoking cessation program at a teaching hospital in the Rocky Mountain region. The hospital implemented a smoking cessation treatment program on July 1, 2013, based on the OMSC. The goal was to identify and support inpatient adult smokers who wanted to make a quit attempt and help them remain smoke-free after discharge. The objective of the current study was to determine the effect of the program on 30-day readmission rates and length of stay (LOS) of the index hospitalization. Although the general cost effectiveness of properly structured smoking cessation programs are well established,11-13 the healthcare utilization effects of inpatient smoking cessation programs are not well understood.
METHODS
Data
The study population consists of patients over age 18 who were admitted to the hospital between July 1, 2012, and July 1, 2014. Baseline smoking status was assessed at hospital admission and recorded in Epic (Epic Systems Corporation, Verona, Wisconsin), the electronic medical records system, as a current smoker (every day and some days), former smoker, never smoker, and never assessed. To check the accuracy of recorded smoking status, a random sample of 819 inpatients was selected and contacted via telephone for verification; 93% of Epic-identified smokers confirmed that they were smokers at hospital admission.14
Intervention
The intervention, which launched July 13, 2014, modified the Epic system to automatically alert providers viewing a tobacco user’s medical record that the patient should receive standardized orders for a bedside consultation with a Tobacco Treatment Specialist (TTS) and a prescription for nicotine replacement therapy (NRT) while in the hospital.15 Previously, referrals for tobacco treatment were done on an ad-hoc basis by the physician, and NRT was not routinely available. This system-level intervention standardized and automated the referral process. For patients with a bedside consultation order, TTS used a patient-centered approach (motivational interviewing) to explore patients’ motivation to quit smoking and offered NRT to improve comfort and safety while in the hospital. Patients who chose to make a quit attempt received a free 2-week supply of NRT at discharge and 6 months of free follow-up counseling by interactive voice response (IVR) telephone technology that included (a) prerecorded advice keyed to individual patient needs, (b) a warm-transfer option to speak with a live TTS (later dropped), and (c) a collection of patient smoking and cessation treatment measures.15
Statistical Analysis
We used an intent-to-treat (ITT) framework for the analysis, which considers everyone eligible for the treatment to be in the treatment group. The approach ignores treatment nonacceptance, nonadherence, protocol deviations, withdrawal from treatment, and cessation outcomes,
Readmission rates and LOS were estimated by using a “difference-in-differences” model, comparing outcomes between smokers before versus after the introduction of the cessation treatment program with nonsmokers before versus after program introduction. The difference-in-differences method looks at the difference pre-and-post in the exposed group (smokers) and unexposed group (nonsmokers). Subtracting the difference between the 2 groups gives an estimate of the policy effect controlling for background trends.19 The smoking cessation treatment effect on readmission is measured by the coefficient on the interaction term between the smoking variable and an indicator that the program is operational. The coefficient is the “difference-in-differences.”
Other control variables include demographic factors (gender, age, race), hospitalization payer (Medicare, Medicaid, commercial), and the service line of the admission. We also included a severity of illness variable from the APR-DRG Grouper (3M, Maplewood, Minnesota)20 and the number of days spent in the intensive care unit. For the readmission model, we included LOS as a control variable, because individuals with longer LOS had a better opportunity to access the intervention.
For readmissions, the model was estimated by using a probit model, predicting the effect of each of the intervention variables and the control variables on the marginal probability of a readmission. Because patients can appear in both the pre- and postyears, clustered standard errors were used, which correct for the lack of independence from multiple observations from the same individual.21 For LOS, a truncated negative binomial model was used. The negative binomial model is a specification for count models with a mass of observations plus a long right tail. The truncation is because zero and negative values for LOS are not possible. The dependent variable represents the number of days the individual was hospitalized. For both models, the reported coefficients represent the marginal effect of the independent variable on the dependent variable. This was calculated using the “margins” command in Stata version 13 (StataCorp LLC, College Station, Texas).
RESULTS
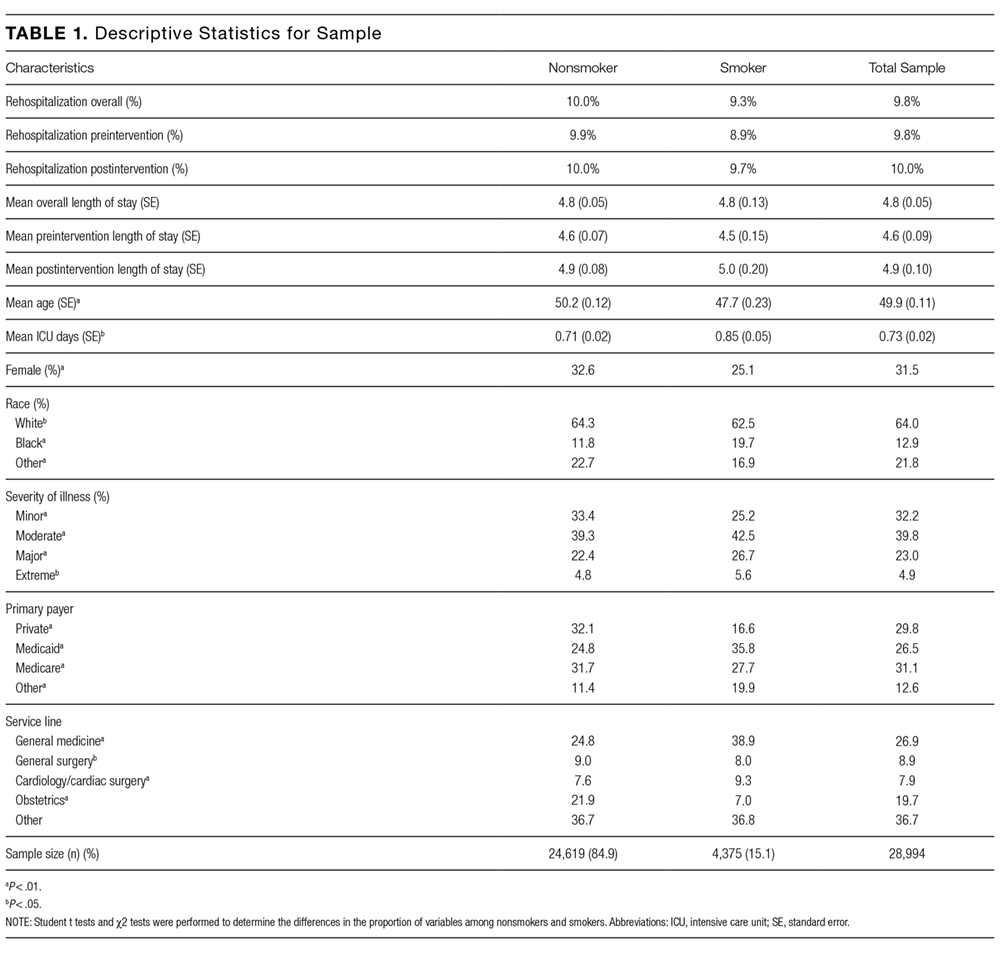
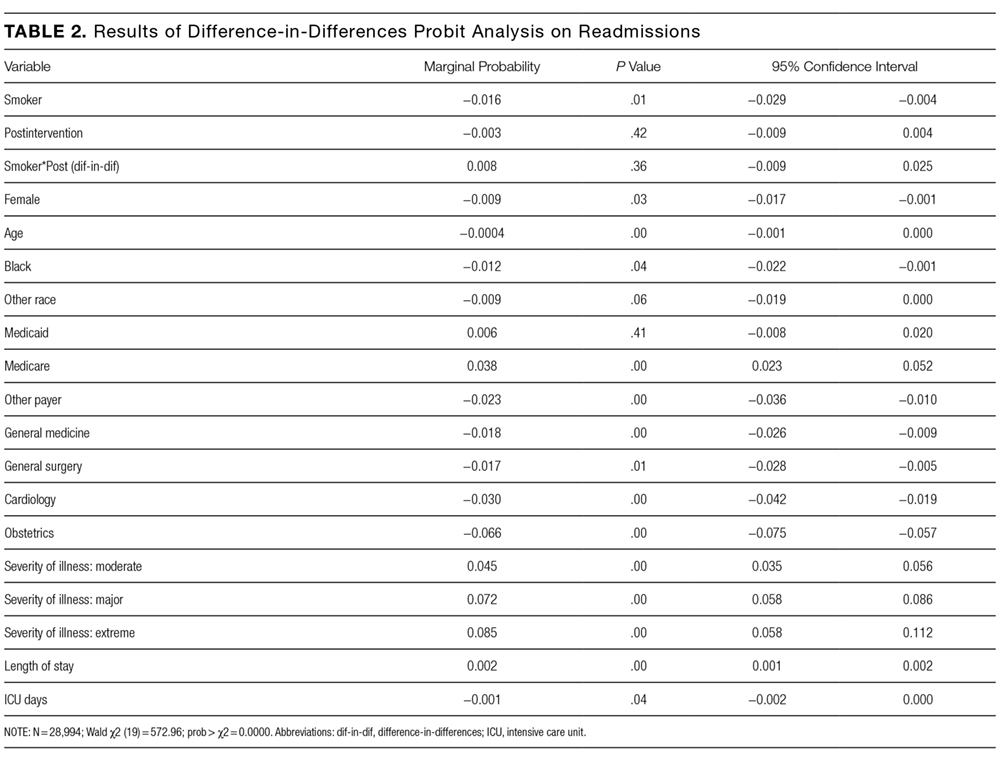
In the probit analysis, the smoking cessation intervention (Smoker*post intervention) showed no significant effect on the probability of readmission (Table 2). The coefficient is positive (β = 0.008) and statistically insignificant (P = 0.36). This indicates that we failed to reject the null hypothesis that there was not a systematic difference in the probability of readmission because of the smoking cessation intervention. Other significant variables generally had the expected relationship with readmission rates. Smokers were 1.6% less likely to be readmitted than nonsmokers (P = 0.01), controlling for other factors.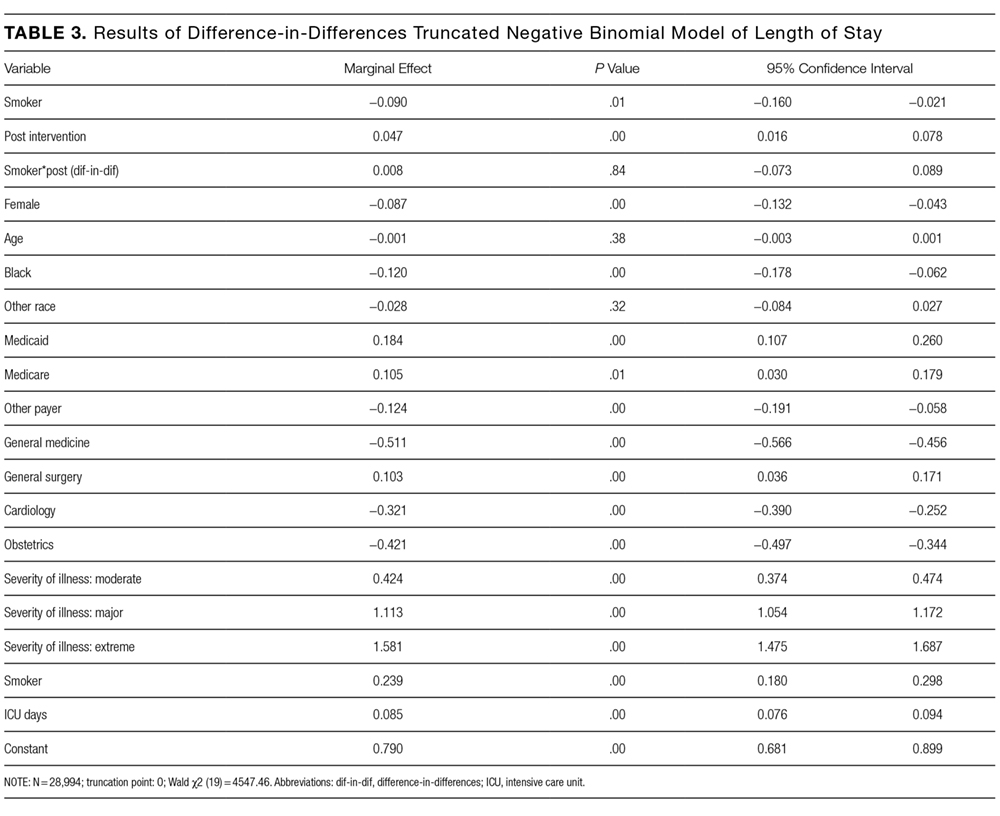
The program effect on smoker LOS was statistically insignificant (β = 0.008; P = 0.36). Smokers overall had a shorter LOS than nonsmokers (β = −0.090; P = 0.01), controlling for other factors. Overall LOS was longer postintervention (β = 0.047; P < 0.01). The control variables generally had the same relationship for the LOS model as for the readmission model.
DISCUSSION
This study investigated the effect of an inpatient smoking cessation program, based on a successful Canadian model, on inpatient readmission rates and LOS. The program showed no effect on 30-day readmission rates or LOS. We see several potential explanations for the absence of a detectable impact.
First, the ITT approach reflected real-world implementation of smoking cessation services. The ITT approach adopts the hospital’s perspective because the hospital will assess overall effectiveness without regard to programmatic limitations. The intervention group for this analysis included individuals who were offered but declined treatment, individuals who accepted treatment but failed to quit smoking, and individuals who both accepted treatment and quit smoking. If the analysis had focused only on the latter group, an effect would have been more likely to be found. Further analysis of the subset of patients who accepted the intervention and quit smoking is warranted. Nevertheless, hospitals cannot expect all inpatient smokers, or even a majority, to embrace an offer of cessation treatment. This also emphasizes the challenges hospitals will face in offering tobacco cessation programs to smokers in a timely way. Reasons for patients not receiving orders varied but included issues with weekend admissions.
Second, the timeframe of the analysis is limited to the inpatient stay (for LOS) and 30 days (for readmission). A longer-term analysis might have found an effect. However, we examined this from the hospital perspective. For the hospital, LOS is a key cost driver; thus, reductions in LOS would create a strong financial incentive for hospitals to implement smoking cessation programs. Similarly, reducing readmissions is now a priority for hospitals because of new Medicare rules that penalize hospitals for readmissions. Thus, the 2 outcomes we examined are outcomes that are financially important to hospitals.
There are several limitations to our analysis. First, the difference-in-differences model assumes that in the absence of treatment, the average change in the dependent variables would have been the same for both the treatment and control groups, also known as the parallel trends assumption. Specification tests showed this assumption was met for the preperiod. Second, our study relies on electronic health record data to identify smokers. However, 93% of individuals who were identified as smokers confirmed their smoking status upon interview. Finally, we looked at all categories of inpatient admissions. Improvement in LOS and short-term readmission rates may be limited to patients admitted for specific conditions, such as cardiovascular and respiratory conditions.
There are a number of plausible reasons for our null finding. First, the “dose” of intervention may have been too weak; that is, the number of smokers who were offered the treatment, accepted the treatment, and adhered to the treatment may have been too low, leading to too few smokers quitting smoking and, thus, no effect of the intervention on our outcomes. This follows directly from the ITT design of the study.23 This suggests that hospitals who wish to adopt smoking cessation programs need to focus on ensuring a timely offering of treatment and encouragement of uptake by smokers.
A second reason for the null finding may have been the short duration for the NRT, which was only offered for 2 weeks. Research suggests that use of NRT for less than 4 weeks is associated with a reduced likelihood of smoking cessation.24 However, a review of the literature concludes that the duration of NRT is less important than the dosage and the combination of NRT with other forms of smoking cessation therapy.25 It is important to note that this study used NRT; other treatments such as Chantix could have different effectiveness.26,27 Further research on different treatment approaches, including longer duration of NRT, would be appropriate.
Disclosure
The authors have no competing interests or conflicts to report. The study was supported by contract number 15FLA68717 from the Colorado Department of Public Health and Environment.
1. Taylor DH Jr, Hasselblad V, Henley SJ, Thun MJ, Sloan FA. Benefits of Smoking Cessation for Longevity. Am J Public Health. 2002;92(6):990-996. PubMed
2. Weitkunat R, Coggins CRE, Sponsiello-Wang Z, Kallischnigg G, Dempsey R. Assessment of Cigarette Smoking in Epidemiologic Studies. Tobacco Research. 2013;25(7).
3. Fiore MC, Jaen CR, Baker TB, et al. Treating Tobacco Use and Dependence: 2008 Update. Rockville (MD): US Department of Health and Human Services. 2008. https://www.ncbi.nlm.nih.gov/books/NBK63952/.
4. Rigotti, NA, Clair, C, Munafo, MR, et al., Interventions for smoking cessation in hospitalised patients. Cochrane Database Syst Rev. 2012(5): CD001837. PubMed
5. Ladapo JA, Jaffer FA, Weinstein MC, Froelicher ES. Projected cost-effectiveness of smoking cessation interventions in patients hospitalized with myocardial infarction. Arch Intern Med. 2011;171:39-45. PubMed
6. Mohiuddin SM, Mooss AN, Hunter CB, Grollmes TL, Cloutier DA, Hilleman DE. Intensive smoking cessation intervention reduces mortality in high-risk smokers with cardiovascular disease. Chest. 2007;131:446-452. PubMed
7. Mullen K, Coyle D, Manuel D, et al. Economic evaluation of a hospital-initiated intervention for smokers with chronic disease, in Ontario, Canada. Tob Control. 2015;24(5):489-496. PubMed
8. Lightwood JM, Glantz SA. Short-term economic and health benefits of smoking cessation: myocardial infarction and stroke. Circulation. 1997;96(4):1089-1096. PubMed
9. Reid RD, Mullen KA, Slovinec D’Angelo ME, et al. Smoking cessation for hospitalized smokers: an evaluation of the “Ottawa Model.” Nicotine Tob Res. 2010;12:11-18. PubMed
10. Reid RD, Pipe AL, Quinlan B. Promoting smoking cessation during hospitalization for coronary artery disease. Can J Cardiol. 2006;22:775-780. PubMed
11. Krumholz H, Cohen B, Tsevat J, Pasternak R, Weinstein M. Cost-effectiveness of a smoking cessation program after myocardial infarction. J Am Coll Cardiol. 1993;22(6):1697-1702. PubMed
12. Curry S, Grothaus L, McAfee T, Pabiniak C. Use and Cost Effectiveness of Smoking-Cessation Services under Four Insurance Plans in a Health Maintenance Organization. N Engl J Med. 1998;339:673-679. PubMed
12. Fiscella K, Franks P. Cost-effectiveness of the transdermal nicotine patch as an adjunct to physicians’ smoking cessation counseling. JAMA. 1996;275:1247-1251. PubMed
13. CEPEG. Independent Evaluation: University of Colorado Hospital’s Smoking Cessation Treatment Program, preliminary report. Aurora: Colorado School of Public Health; 2014.
15. Cooper S, Pray S. Independent Evaluation: Hospital systems change to improve inpatient tobacco dependence treatment final results. Aurora: Colorado School of Public Health; June 2015.
16. Gupta S. Intention-to-treat concept: A review. Perspect Clin Res. 2011;2(3):109-112. DOI:10.4103/2229-3485.83221 PubMed
17. Fisher LD, Dixon DO, Herson J, Frankowski RK, Hearron MS, Peace KE. Intention to treat in clinical trials. In: Peace KE, editor. Statistical Issues in Drug Research and Development. New York: Marcel Dekker; 1990:331-350
18. Newell DJ. Intention-to-treat analysis: implications for quantitative and qualitative research. Int J Epidemiol. 1992;21(5):837-841. PubMed
19. Dimick JB, Ryan AM. Methods for Evaluating Changes in Health Care Policy: The Difference-in-Differences Approach. JAMA. 2014;312(22):2401-2402. DOI:10.1001/jama.2014.16153 PubMed
20. Averill R, Goldfield N, Steinbeck B, et al. Development of the All Patient Refined DRGs (APR-DRGs). Maplewood: 3M Health Information Systems; 1997. Report 8-9. PubMed
21. Cameron A, Miller D. A Practitioner’s Guide to Cluster-Robust Inference. J Hum Resour. 2015;50(2):317-372.
22. Cooper S, Pray S. Independent Evaluation: Hospital systems change to improve inpatient tobacco dependence treatment Final Results. Aurora: Colorado School of Public Health; April 2015.
23. Gupta SK. Intention-to-treat concept: A review. Perspect Clin Res. 2011;2(3):109-112. DOI:10.4103/2229-3485.83221. PubMed
24. Zhang B, Cohen J, Bondy S. Duration of Nicotine Replacement Therapy Use and Smoking Cessation: A Population-Based Longitudinal Study. Am J Epidemiol. 2015;181(7):513-520. PubMed
25. Silagy C, Lancaster T, Stead L, Mant D, Fowler G. Nicotine replacement therapy for smoking cessation. Cochrane Database Syst Rev. 2004;3:CD000146. DOI:10.1002/14651858.CD000146 PubMed
26. C, , . Nicotine receptor partial agonists for smoking cessation. Cochrane Database Syst Rev. 2008;3:CD006103. DOI:10.1002/14651858.CD006103.pub3. PubMed
27. Hurt R, Sachs D, Glover E, et al. A Comparison of Sustained-Release Bupropion and Placebo for Smoking Cessation. N Engl J Med. 1997;337:1195-1202. PubMed
Successful smoking cessation interventions result in substantial gains in health and life expectancy by reducing smoking-related illnesses and preventing premature deaths.1,2 The Department of Health and Human Services recommends clinicians use hospitalization as “an opportunity to promote smoking cessation’’ and ‘‘to prescribe medications to alleviate withdrawal symptoms”3 because individual readiness to quit may be high during hospitalizations. A meta-analysis of 50 studies (21 from the United States) examining the efficacy of hospital-initiated smoking cessation interventions concluded that smoking cessation support programs that began in the hospital and continued for at least 1 month postdischarge significantly increase the likelihood of patients being smoke-free in the long term.4 The most efficacious strategies included counseling and pharmacotherapy rather than counseling alone.3 Most inpatient smoking cessation studies have focused on quit-rates or medical outcomes, while fewer studies have looked at healthcare utilization.
However, previous research has shown that smoking cessation for inpatients has relatively immediate economic and health benefits. Patients who quit smoking during hospitalizations for cardiovascular disease are less likely to be readmitted or to die during follow-up.5,6 Patients with acute myocardial infarction (AMI), unstable angina, heart failure, and chronic obstructive pulmonary disease who received an inpatient smoking cessation intervention had reductions in inpatient readmission rates.7 A 1% reduction in overall smoking rates would lead to an annual reduction of 3,022 hospitalizations for stroke and 1,684 hospitalizations for AMI.8 One comprehensive program, the Ottawa Model for Smoking Cessation (OMSC), found that a hospital-initiated intervention increased long-term cessation rates by 15% in cardiac patients and by 11% in general hospital populations.9,10 The applicability of this result to US healthcare systems is unknown. This paper adds to the existing literature by evaluating the impact of an inpatient smoking cessation program on healthcare utilization among patients hospitalized for any reason, rather than solely focused on those with cardiopulmonary diagnoses.
The current study focuses on an inpatient smoking cessation program at a teaching hospital in the Rocky Mountain region. The hospital implemented a smoking cessation treatment program on July 1, 2013, based on the OMSC. The goal was to identify and support inpatient adult smokers who wanted to make a quit attempt and help them remain smoke-free after discharge. The objective of the current study was to determine the effect of the program on 30-day readmission rates and length of stay (LOS) of the index hospitalization. Although the general cost effectiveness of properly structured smoking cessation programs are well established,11-13 the healthcare utilization effects of inpatient smoking cessation programs are not well understood.
METHODS
Data
The study population consists of patients over age 18 who were admitted to the hospital between July 1, 2012, and July 1, 2014. Baseline smoking status was assessed at hospital admission and recorded in Epic (Epic Systems Corporation, Verona, Wisconsin), the electronic medical records system, as a current smoker (every day and some days), former smoker, never smoker, and never assessed. To check the accuracy of recorded smoking status, a random sample of 819 inpatients was selected and contacted via telephone for verification; 93% of Epic-identified smokers confirmed that they were smokers at hospital admission.14
Intervention
The intervention, which launched July 13, 2014, modified the Epic system to automatically alert providers viewing a tobacco user’s medical record that the patient should receive standardized orders for a bedside consultation with a Tobacco Treatment Specialist (TTS) and a prescription for nicotine replacement therapy (NRT) while in the hospital.15 Previously, referrals for tobacco treatment were done on an ad-hoc basis by the physician, and NRT was not routinely available. This system-level intervention standardized and automated the referral process. For patients with a bedside consultation order, TTS used a patient-centered approach (motivational interviewing) to explore patients’ motivation to quit smoking and offered NRT to improve comfort and safety while in the hospital. Patients who chose to make a quit attempt received a free 2-week supply of NRT at discharge and 6 months of free follow-up counseling by interactive voice response (IVR) telephone technology that included (a) prerecorded advice keyed to individual patient needs, (b) a warm-transfer option to speak with a live TTS (later dropped), and (c) a collection of patient smoking and cessation treatment measures.15
Statistical Analysis
We used an intent-to-treat (ITT) framework for the analysis, which considers everyone eligible for the treatment to be in the treatment group. The approach ignores treatment nonacceptance, nonadherence, protocol deviations, withdrawal from treatment, and cessation outcomes,
Readmission rates and LOS were estimated by using a “difference-in-differences” model, comparing outcomes between smokers before versus after the introduction of the cessation treatment program with nonsmokers before versus after program introduction. The difference-in-differences method looks at the difference pre-and-post in the exposed group (smokers) and unexposed group (nonsmokers). Subtracting the difference between the 2 groups gives an estimate of the policy effect controlling for background trends.19 The smoking cessation treatment effect on readmission is measured by the coefficient on the interaction term between the smoking variable and an indicator that the program is operational. The coefficient is the “difference-in-differences.”
Other control variables include demographic factors (gender, age, race), hospitalization payer (Medicare, Medicaid, commercial), and the service line of the admission. We also included a severity of illness variable from the APR-DRG Grouper (3M, Maplewood, Minnesota)20 and the number of days spent in the intensive care unit. For the readmission model, we included LOS as a control variable, because individuals with longer LOS had a better opportunity to access the intervention.
For readmissions, the model was estimated by using a probit model, predicting the effect of each of the intervention variables and the control variables on the marginal probability of a readmission. Because patients can appear in both the pre- and postyears, clustered standard errors were used, which correct for the lack of independence from multiple observations from the same individual.21 For LOS, a truncated negative binomial model was used. The negative binomial model is a specification for count models with a mass of observations plus a long right tail. The truncation is because zero and negative values for LOS are not possible. The dependent variable represents the number of days the individual was hospitalized. For both models, the reported coefficients represent the marginal effect of the independent variable on the dependent variable. This was calculated using the “margins” command in Stata version 13 (StataCorp LLC, College Station, Texas).
RESULTS
In the probit analysis, the smoking cessation intervention (Smoker*post intervention) showed no significant effect on the probability of readmission (Table 2). The coefficient is positive (β = 0.008) and statistically insignificant (P = 0.36). This indicates that we failed to reject the null hypothesis that there was not a systematic difference in the probability of readmission because of the smoking cessation intervention. Other significant variables generally had the expected relationship with readmission rates. Smokers were 1.6% less likely to be readmitted than nonsmokers (P = 0.01), controlling for other factors.
The program effect on smoker LOS was statistically insignificant (β = 0.008; P = 0.36). Smokers overall had a shorter LOS than nonsmokers (β = −0.090; P = 0.01), controlling for other factors. Overall LOS was longer postintervention (β = 0.047; P < 0.01). The control variables generally had the same relationship for the LOS model as for the readmission model.
DISCUSSION
This study investigated the effect of an inpatient smoking cessation program, based on a successful Canadian model, on inpatient readmission rates and LOS. The program showed no effect on 30-day readmission rates or LOS. We see several potential explanations for the absence of a detectable impact.
First, the ITT approach reflected real-world implementation of smoking cessation services. The ITT approach adopts the hospital’s perspective because the hospital will assess overall effectiveness without regard to programmatic limitations. The intervention group for this analysis included individuals who were offered but declined treatment, individuals who accepted treatment but failed to quit smoking, and individuals who both accepted treatment and quit smoking. If the analysis had focused only on the latter group, an effect would have been more likely to be found. Further analysis of the subset of patients who accepted the intervention and quit smoking is warranted. Nevertheless, hospitals cannot expect all inpatient smokers, or even a majority, to embrace an offer of cessation treatment. This also emphasizes the challenges hospitals will face in offering tobacco cessation programs to smokers in a timely way. Reasons for patients not receiving orders varied but included issues with weekend admissions.
Second, the timeframe of the analysis is limited to the inpatient stay (for LOS) and 30 days (for readmission). A longer-term analysis might have found an effect. However, we examined this from the hospital perspective. For the hospital, LOS is a key cost driver; thus, reductions in LOS would create a strong financial incentive for hospitals to implement smoking cessation programs. Similarly, reducing readmissions is now a priority for hospitals because of new Medicare rules that penalize hospitals for readmissions. Thus, the 2 outcomes we examined are outcomes that are financially important to hospitals.
There are several limitations to our analysis. First, the difference-in-differences model assumes that in the absence of treatment, the average change in the dependent variables would have been the same for both the treatment and control groups, also known as the parallel trends assumption. Specification tests showed this assumption was met for the preperiod. Second, our study relies on electronic health record data to identify smokers. However, 93% of individuals who were identified as smokers confirmed their smoking status upon interview. Finally, we looked at all categories of inpatient admissions. Improvement in LOS and short-term readmission rates may be limited to patients admitted for specific conditions, such as cardiovascular and respiratory conditions.
There are a number of plausible reasons for our null finding. First, the “dose” of intervention may have been too weak; that is, the number of smokers who were offered the treatment, accepted the treatment, and adhered to the treatment may have been too low, leading to too few smokers quitting smoking and, thus, no effect of the intervention on our outcomes. This follows directly from the ITT design of the study.23 This suggests that hospitals who wish to adopt smoking cessation programs need to focus on ensuring a timely offering of treatment and encouragement of uptake by smokers.
A second reason for the null finding may have been the short duration for the NRT, which was only offered for 2 weeks. Research suggests that use of NRT for less than 4 weeks is associated with a reduced likelihood of smoking cessation.24 However, a review of the literature concludes that the duration of NRT is less important than the dosage and the combination of NRT with other forms of smoking cessation therapy.25 It is important to note that this study used NRT; other treatments such as Chantix could have different effectiveness.26,27 Further research on different treatment approaches, including longer duration of NRT, would be appropriate.
Disclosure
The authors have no competing interests or conflicts to report. The study was supported by contract number 15FLA68717 from the Colorado Department of Public Health and Environment.
Successful smoking cessation interventions result in substantial gains in health and life expectancy by reducing smoking-related illnesses and preventing premature deaths.1,2 The Department of Health and Human Services recommends clinicians use hospitalization as “an opportunity to promote smoking cessation’’ and ‘‘to prescribe medications to alleviate withdrawal symptoms”3 because individual readiness to quit may be high during hospitalizations. A meta-analysis of 50 studies (21 from the United States) examining the efficacy of hospital-initiated smoking cessation interventions concluded that smoking cessation support programs that began in the hospital and continued for at least 1 month postdischarge significantly increase the likelihood of patients being smoke-free in the long term.4 The most efficacious strategies included counseling and pharmacotherapy rather than counseling alone.3 Most inpatient smoking cessation studies have focused on quit-rates or medical outcomes, while fewer studies have looked at healthcare utilization.
However, previous research has shown that smoking cessation for inpatients has relatively immediate economic and health benefits. Patients who quit smoking during hospitalizations for cardiovascular disease are less likely to be readmitted or to die during follow-up.5,6 Patients with acute myocardial infarction (AMI), unstable angina, heart failure, and chronic obstructive pulmonary disease who received an inpatient smoking cessation intervention had reductions in inpatient readmission rates.7 A 1% reduction in overall smoking rates would lead to an annual reduction of 3,022 hospitalizations for stroke and 1,684 hospitalizations for AMI.8 One comprehensive program, the Ottawa Model for Smoking Cessation (OMSC), found that a hospital-initiated intervention increased long-term cessation rates by 15% in cardiac patients and by 11% in general hospital populations.9,10 The applicability of this result to US healthcare systems is unknown. This paper adds to the existing literature by evaluating the impact of an inpatient smoking cessation program on healthcare utilization among patients hospitalized for any reason, rather than solely focused on those with cardiopulmonary diagnoses.
The current study focuses on an inpatient smoking cessation program at a teaching hospital in the Rocky Mountain region. The hospital implemented a smoking cessation treatment program on July 1, 2013, based on the OMSC. The goal was to identify and support inpatient adult smokers who wanted to make a quit attempt and help them remain smoke-free after discharge. The objective of the current study was to determine the effect of the program on 30-day readmission rates and length of stay (LOS) of the index hospitalization. Although the general cost effectiveness of properly structured smoking cessation programs are well established,11-13 the healthcare utilization effects of inpatient smoking cessation programs are not well understood.
METHODS
Data
The study population consists of patients over age 18 who were admitted to the hospital between July 1, 2012, and July 1, 2014. Baseline smoking status was assessed at hospital admission and recorded in Epic (Epic Systems Corporation, Verona, Wisconsin), the electronic medical records system, as a current smoker (every day and some days), former smoker, never smoker, and never assessed. To check the accuracy of recorded smoking status, a random sample of 819 inpatients was selected and contacted via telephone for verification; 93% of Epic-identified smokers confirmed that they were smokers at hospital admission.14
Intervention
The intervention, which launched July 13, 2014, modified the Epic system to automatically alert providers viewing a tobacco user’s medical record that the patient should receive standardized orders for a bedside consultation with a Tobacco Treatment Specialist (TTS) and a prescription for nicotine replacement therapy (NRT) while in the hospital.15 Previously, referrals for tobacco treatment were done on an ad-hoc basis by the physician, and NRT was not routinely available. This system-level intervention standardized and automated the referral process. For patients with a bedside consultation order, TTS used a patient-centered approach (motivational interviewing) to explore patients’ motivation to quit smoking and offered NRT to improve comfort and safety while in the hospital. Patients who chose to make a quit attempt received a free 2-week supply of NRT at discharge and 6 months of free follow-up counseling by interactive voice response (IVR) telephone technology that included (a) prerecorded advice keyed to individual patient needs, (b) a warm-transfer option to speak with a live TTS (later dropped), and (c) a collection of patient smoking and cessation treatment measures.15
Statistical Analysis
We used an intent-to-treat (ITT) framework for the analysis, which considers everyone eligible for the treatment to be in the treatment group. The approach ignores treatment nonacceptance, nonadherence, protocol deviations, withdrawal from treatment, and cessation outcomes,
Readmission rates and LOS were estimated by using a “difference-in-differences” model, comparing outcomes between smokers before versus after the introduction of the cessation treatment program with nonsmokers before versus after program introduction. The difference-in-differences method looks at the difference pre-and-post in the exposed group (smokers) and unexposed group (nonsmokers). Subtracting the difference between the 2 groups gives an estimate of the policy effect controlling for background trends.19 The smoking cessation treatment effect on readmission is measured by the coefficient on the interaction term between the smoking variable and an indicator that the program is operational. The coefficient is the “difference-in-differences.”
Other control variables include demographic factors (gender, age, race), hospitalization payer (Medicare, Medicaid, commercial), and the service line of the admission. We also included a severity of illness variable from the APR-DRG Grouper (3M, Maplewood, Minnesota)20 and the number of days spent in the intensive care unit. For the readmission model, we included LOS as a control variable, because individuals with longer LOS had a better opportunity to access the intervention.
For readmissions, the model was estimated by using a probit model, predicting the effect of each of the intervention variables and the control variables on the marginal probability of a readmission. Because patients can appear in both the pre- and postyears, clustered standard errors were used, which correct for the lack of independence from multiple observations from the same individual.21 For LOS, a truncated negative binomial model was used. The negative binomial model is a specification for count models with a mass of observations plus a long right tail. The truncation is because zero and negative values for LOS are not possible. The dependent variable represents the number of days the individual was hospitalized. For both models, the reported coefficients represent the marginal effect of the independent variable on the dependent variable. This was calculated using the “margins” command in Stata version 13 (StataCorp LLC, College Station, Texas).
RESULTS
In the probit analysis, the smoking cessation intervention (Smoker*post intervention) showed no significant effect on the probability of readmission (Table 2). The coefficient is positive (β = 0.008) and statistically insignificant (P = 0.36). This indicates that we failed to reject the null hypothesis that there was not a systematic difference in the probability of readmission because of the smoking cessation intervention. Other significant variables generally had the expected relationship with readmission rates. Smokers were 1.6% less likely to be readmitted than nonsmokers (P = 0.01), controlling for other factors.
The program effect on smoker LOS was statistically insignificant (β = 0.008; P = 0.36). Smokers overall had a shorter LOS than nonsmokers (β = −0.090; P = 0.01), controlling for other factors. Overall LOS was longer postintervention (β = 0.047; P < 0.01). The control variables generally had the same relationship for the LOS model as for the readmission model.
DISCUSSION
This study investigated the effect of an inpatient smoking cessation program, based on a successful Canadian model, on inpatient readmission rates and LOS. The program showed no effect on 30-day readmission rates or LOS. We see several potential explanations for the absence of a detectable impact.
First, the ITT approach reflected real-world implementation of smoking cessation services. The ITT approach adopts the hospital’s perspective because the hospital will assess overall effectiveness without regard to programmatic limitations. The intervention group for this analysis included individuals who were offered but declined treatment, individuals who accepted treatment but failed to quit smoking, and individuals who both accepted treatment and quit smoking. If the analysis had focused only on the latter group, an effect would have been more likely to be found. Further analysis of the subset of patients who accepted the intervention and quit smoking is warranted. Nevertheless, hospitals cannot expect all inpatient smokers, or even a majority, to embrace an offer of cessation treatment. This also emphasizes the challenges hospitals will face in offering tobacco cessation programs to smokers in a timely way. Reasons for patients not receiving orders varied but included issues with weekend admissions.
Second, the timeframe of the analysis is limited to the inpatient stay (for LOS) and 30 days (for readmission). A longer-term analysis might have found an effect. However, we examined this from the hospital perspective. For the hospital, LOS is a key cost driver; thus, reductions in LOS would create a strong financial incentive for hospitals to implement smoking cessation programs. Similarly, reducing readmissions is now a priority for hospitals because of new Medicare rules that penalize hospitals for readmissions. Thus, the 2 outcomes we examined are outcomes that are financially important to hospitals.
There are several limitations to our analysis. First, the difference-in-differences model assumes that in the absence of treatment, the average change in the dependent variables would have been the same for both the treatment and control groups, also known as the parallel trends assumption. Specification tests showed this assumption was met for the preperiod. Second, our study relies on electronic health record data to identify smokers. However, 93% of individuals who were identified as smokers confirmed their smoking status upon interview. Finally, we looked at all categories of inpatient admissions. Improvement in LOS and short-term readmission rates may be limited to patients admitted for specific conditions, such as cardiovascular and respiratory conditions.
There are a number of plausible reasons for our null finding. First, the “dose” of intervention may have been too weak; that is, the number of smokers who were offered the treatment, accepted the treatment, and adhered to the treatment may have been too low, leading to too few smokers quitting smoking and, thus, no effect of the intervention on our outcomes. This follows directly from the ITT design of the study.23 This suggests that hospitals who wish to adopt smoking cessation programs need to focus on ensuring a timely offering of treatment and encouragement of uptake by smokers.
A second reason for the null finding may have been the short duration for the NRT, which was only offered for 2 weeks. Research suggests that use of NRT for less than 4 weeks is associated with a reduced likelihood of smoking cessation.24 However, a review of the literature concludes that the duration of NRT is less important than the dosage and the combination of NRT with other forms of smoking cessation therapy.25 It is important to note that this study used NRT; other treatments such as Chantix could have different effectiveness.26,27 Further research on different treatment approaches, including longer duration of NRT, would be appropriate.
Disclosure
The authors have no competing interests or conflicts to report. The study was supported by contract number 15FLA68717 from the Colorado Department of Public Health and Environment.
1. Taylor DH Jr, Hasselblad V, Henley SJ, Thun MJ, Sloan FA. Benefits of Smoking Cessation for Longevity. Am J Public Health. 2002;92(6):990-996. PubMed
2. Weitkunat R, Coggins CRE, Sponsiello-Wang Z, Kallischnigg G, Dempsey R. Assessment of Cigarette Smoking in Epidemiologic Studies. Tobacco Research. 2013;25(7).
3. Fiore MC, Jaen CR, Baker TB, et al. Treating Tobacco Use and Dependence: 2008 Update. Rockville (MD): US Department of Health and Human Services. 2008. https://www.ncbi.nlm.nih.gov/books/NBK63952/.
4. Rigotti, NA, Clair, C, Munafo, MR, et al., Interventions for smoking cessation in hospitalised patients. Cochrane Database Syst Rev. 2012(5): CD001837. PubMed
5. Ladapo JA, Jaffer FA, Weinstein MC, Froelicher ES. Projected cost-effectiveness of smoking cessation interventions in patients hospitalized with myocardial infarction. Arch Intern Med. 2011;171:39-45. PubMed
6. Mohiuddin SM, Mooss AN, Hunter CB, Grollmes TL, Cloutier DA, Hilleman DE. Intensive smoking cessation intervention reduces mortality in high-risk smokers with cardiovascular disease. Chest. 2007;131:446-452. PubMed
7. Mullen K, Coyle D, Manuel D, et al. Economic evaluation of a hospital-initiated intervention for smokers with chronic disease, in Ontario, Canada. Tob Control. 2015;24(5):489-496. PubMed
8. Lightwood JM, Glantz SA. Short-term economic and health benefits of smoking cessation: myocardial infarction and stroke. Circulation. 1997;96(4):1089-1096. PubMed
9. Reid RD, Mullen KA, Slovinec D’Angelo ME, et al. Smoking cessation for hospitalized smokers: an evaluation of the “Ottawa Model.” Nicotine Tob Res. 2010;12:11-18. PubMed
10. Reid RD, Pipe AL, Quinlan B. Promoting smoking cessation during hospitalization for coronary artery disease. Can J Cardiol. 2006;22:775-780. PubMed
11. Krumholz H, Cohen B, Tsevat J, Pasternak R, Weinstein M. Cost-effectiveness of a smoking cessation program after myocardial infarction. J Am Coll Cardiol. 1993;22(6):1697-1702. PubMed
12. Curry S, Grothaus L, McAfee T, Pabiniak C. Use and Cost Effectiveness of Smoking-Cessation Services under Four Insurance Plans in a Health Maintenance Organization. N Engl J Med. 1998;339:673-679. PubMed
12. Fiscella K, Franks P. Cost-effectiveness of the transdermal nicotine patch as an adjunct to physicians’ smoking cessation counseling. JAMA. 1996;275:1247-1251. PubMed
13. CEPEG. Independent Evaluation: University of Colorado Hospital’s Smoking Cessation Treatment Program, preliminary report. Aurora: Colorado School of Public Health; 2014.
15. Cooper S, Pray S. Independent Evaluation: Hospital systems change to improve inpatient tobacco dependence treatment final results. Aurora: Colorado School of Public Health; June 2015.
16. Gupta S. Intention-to-treat concept: A review. Perspect Clin Res. 2011;2(3):109-112. DOI:10.4103/2229-3485.83221 PubMed
17. Fisher LD, Dixon DO, Herson J, Frankowski RK, Hearron MS, Peace KE. Intention to treat in clinical trials. In: Peace KE, editor. Statistical Issues in Drug Research and Development. New York: Marcel Dekker; 1990:331-350
18. Newell DJ. Intention-to-treat analysis: implications for quantitative and qualitative research. Int J Epidemiol. 1992;21(5):837-841. PubMed
19. Dimick JB, Ryan AM. Methods for Evaluating Changes in Health Care Policy: The Difference-in-Differences Approach. JAMA. 2014;312(22):2401-2402. DOI:10.1001/jama.2014.16153 PubMed
20. Averill R, Goldfield N, Steinbeck B, et al. Development of the All Patient Refined DRGs (APR-DRGs). Maplewood: 3M Health Information Systems; 1997. Report 8-9. PubMed
21. Cameron A, Miller D. A Practitioner’s Guide to Cluster-Robust Inference. J Hum Resour. 2015;50(2):317-372.
22. Cooper S, Pray S. Independent Evaluation: Hospital systems change to improve inpatient tobacco dependence treatment Final Results. Aurora: Colorado School of Public Health; April 2015.
23. Gupta SK. Intention-to-treat concept: A review. Perspect Clin Res. 2011;2(3):109-112. DOI:10.4103/2229-3485.83221. PubMed
24. Zhang B, Cohen J, Bondy S. Duration of Nicotine Replacement Therapy Use and Smoking Cessation: A Population-Based Longitudinal Study. Am J Epidemiol. 2015;181(7):513-520. PubMed
25. Silagy C, Lancaster T, Stead L, Mant D, Fowler G. Nicotine replacement therapy for smoking cessation. Cochrane Database Syst Rev. 2004;3:CD000146. DOI:10.1002/14651858.CD000146 PubMed
26. C, , . Nicotine receptor partial agonists for smoking cessation. Cochrane Database Syst Rev. 2008;3:CD006103. DOI:10.1002/14651858.CD006103.pub3. PubMed
27. Hurt R, Sachs D, Glover E, et al. A Comparison of Sustained-Release Bupropion and Placebo for Smoking Cessation. N Engl J Med. 1997;337:1195-1202. PubMed
1. Taylor DH Jr, Hasselblad V, Henley SJ, Thun MJ, Sloan FA. Benefits of Smoking Cessation for Longevity. Am J Public Health. 2002;92(6):990-996. PubMed
2. Weitkunat R, Coggins CRE, Sponsiello-Wang Z, Kallischnigg G, Dempsey R. Assessment of Cigarette Smoking in Epidemiologic Studies. Tobacco Research. 2013;25(7).
3. Fiore MC, Jaen CR, Baker TB, et al. Treating Tobacco Use and Dependence: 2008 Update. Rockville (MD): US Department of Health and Human Services. 2008. https://www.ncbi.nlm.nih.gov/books/NBK63952/.
4. Rigotti, NA, Clair, C, Munafo, MR, et al., Interventions for smoking cessation in hospitalised patients. Cochrane Database Syst Rev. 2012(5): CD001837. PubMed
5. Ladapo JA, Jaffer FA, Weinstein MC, Froelicher ES. Projected cost-effectiveness of smoking cessation interventions in patients hospitalized with myocardial infarction. Arch Intern Med. 2011;171:39-45. PubMed
6. Mohiuddin SM, Mooss AN, Hunter CB, Grollmes TL, Cloutier DA, Hilleman DE. Intensive smoking cessation intervention reduces mortality in high-risk smokers with cardiovascular disease. Chest. 2007;131:446-452. PubMed
7. Mullen K, Coyle D, Manuel D, et al. Economic evaluation of a hospital-initiated intervention for smokers with chronic disease, in Ontario, Canada. Tob Control. 2015;24(5):489-496. PubMed
8. Lightwood JM, Glantz SA. Short-term economic and health benefits of smoking cessation: myocardial infarction and stroke. Circulation. 1997;96(4):1089-1096. PubMed
9. Reid RD, Mullen KA, Slovinec D’Angelo ME, et al. Smoking cessation for hospitalized smokers: an evaluation of the “Ottawa Model.” Nicotine Tob Res. 2010;12:11-18. PubMed
10. Reid RD, Pipe AL, Quinlan B. Promoting smoking cessation during hospitalization for coronary artery disease. Can J Cardiol. 2006;22:775-780. PubMed
11. Krumholz H, Cohen B, Tsevat J, Pasternak R, Weinstein M. Cost-effectiveness of a smoking cessation program after myocardial infarction. J Am Coll Cardiol. 1993;22(6):1697-1702. PubMed
12. Curry S, Grothaus L, McAfee T, Pabiniak C. Use and Cost Effectiveness of Smoking-Cessation Services under Four Insurance Plans in a Health Maintenance Organization. N Engl J Med. 1998;339:673-679. PubMed
12. Fiscella K, Franks P. Cost-effectiveness of the transdermal nicotine patch as an adjunct to physicians’ smoking cessation counseling. JAMA. 1996;275:1247-1251. PubMed
13. CEPEG. Independent Evaluation: University of Colorado Hospital’s Smoking Cessation Treatment Program, preliminary report. Aurora: Colorado School of Public Health; 2014.
15. Cooper S, Pray S. Independent Evaluation: Hospital systems change to improve inpatient tobacco dependence treatment final results. Aurora: Colorado School of Public Health; June 2015.
16. Gupta S. Intention-to-treat concept: A review. Perspect Clin Res. 2011;2(3):109-112. DOI:10.4103/2229-3485.83221 PubMed
17. Fisher LD, Dixon DO, Herson J, Frankowski RK, Hearron MS, Peace KE. Intention to treat in clinical trials. In: Peace KE, editor. Statistical Issues in Drug Research and Development. New York: Marcel Dekker; 1990:331-350
18. Newell DJ. Intention-to-treat analysis: implications for quantitative and qualitative research. Int J Epidemiol. 1992;21(5):837-841. PubMed
19. Dimick JB, Ryan AM. Methods for Evaluating Changes in Health Care Policy: The Difference-in-Differences Approach. JAMA. 2014;312(22):2401-2402. DOI:10.1001/jama.2014.16153 PubMed
20. Averill R, Goldfield N, Steinbeck B, et al. Development of the All Patient Refined DRGs (APR-DRGs). Maplewood: 3M Health Information Systems; 1997. Report 8-9. PubMed
21. Cameron A, Miller D. A Practitioner’s Guide to Cluster-Robust Inference. J Hum Resour. 2015;50(2):317-372.
22. Cooper S, Pray S. Independent Evaluation: Hospital systems change to improve inpatient tobacco dependence treatment Final Results. Aurora: Colorado School of Public Health; April 2015.
23. Gupta SK. Intention-to-treat concept: A review. Perspect Clin Res. 2011;2(3):109-112. DOI:10.4103/2229-3485.83221. PubMed
24. Zhang B, Cohen J, Bondy S. Duration of Nicotine Replacement Therapy Use and Smoking Cessation: A Population-Based Longitudinal Study. Am J Epidemiol. 2015;181(7):513-520. PubMed
25. Silagy C, Lancaster T, Stead L, Mant D, Fowler G. Nicotine replacement therapy for smoking cessation. Cochrane Database Syst Rev. 2004;3:CD000146. DOI:10.1002/14651858.CD000146 PubMed
26. C, , . Nicotine receptor partial agonists for smoking cessation. Cochrane Database Syst Rev. 2008;3:CD006103. DOI:10.1002/14651858.CD006103.pub3. PubMed
27. Hurt R, Sachs D, Glover E, et al. A Comparison of Sustained-Release Bupropion and Placebo for Smoking Cessation. N Engl J Med. 1997;337:1195-1202. PubMed
© 2017 Society of Hospital Medicine
Treatment Trends and Outcomes in Healthcare-Associated Pneumonia
Bacterial pneumonia remains an important cause of morbidity and mortality in the United States, and is the 8th leading cause of death with 55,227 deaths among adults annually.1 In 2005, the American Thoracic Society (ATS) and the Infectious Diseases Society of America (IDSA) collaborated to update guidelines for hospital-acquired pneumonia (HAP), ventilator-associated pneumonia, and healthcare-associated pneumonia (HCAP).2 This broad document outlines an evidence-based approach to diagnostic testing and antibiotic management based on the epidemiology and risk factors for these conditions. The guideline specifies the following criteria for HCAP: hospitalization in the past 90 days, residence in a skilled nursing facility (SNF), home infusion therapy, hemodialysis, home wound care, family members with multidrug resistant organisms (MDRO), and immunosuppressive diseases or medications, with the presumption that these patients are more likely to be harboring MDRO and should thus be treated empirically with broad-spectrum antibiotic therapy. Prior studies have shown that patients with HCAP have a more severe illness, are more likely to have MDRO, are more likely to be inadequately treated, and are at a higher risk for mortality than patients with community-acquired pneumonia (CAP).3,4
These guidelines are controversial, especially in regard to the recommendations to empirically treat broadly with 2 antibiotics targeting Pseudomonas species, whether patients with HCAP merit broader spectrum coverage than patients with CAP, and whether the criteria for defining HCAP are adequate to predict which patients are harboring MDRO. It has subsequently been proposed that HCAP is more related to CAP than to HAP, and a recent update to the guideline removed recommendations for treatment of HCAP and will be placing HCAP into the guidelines for CAP instead.5 We sought to investigate the degree of uptake of the ATS and IDSA guideline recommendations by physicians over time, and whether this led to a change in outcomes among patients who met the criteria for HCAP.
METHODS
Setting and Patients
We identified patients discharged between July 1, 2007, and November 30, 2011, from 488 US hospitals that participated in the Premier database (Premier Inc., Charlotte, North Carolina), an inpatient database developed for measuring quality and healthcare utilization. The database is frequently used for healthcare research and has been described previously.6 Member hospitals are in all regions of the US and are generally reflective of US hospitals. This database contains multiple data elements, including sociodemographic information, International Classification of Diseases, 9th Revision-Clinical Modification (ICD-9-CM) diagnosis and procedure codes, hospital and physician information, source of admission, and discharge status. It also includes a date-stamped log of all billed items and services, including diagnostic tests, medications, and other treatments. Because the data do not contain identifiable information, the institutional review board at our medical center determined that this study did not constitute human subjects research.
We included all patients aged ≥18 years with a principal diagnosis of pneumonia or with a secondary diagnosis of pneumonia paired with a principal diagnosis of respiratory failure, acute respiratory distress syndrome, respiratory arrest, sepsis, or influenza. Patients were excluded if they were transferred to or from another acute care institution, had a length of stay of 1 day or less, had cystic fibrosis, did not have a chest radiograph, or did not receive antibiotics within 48 hours of admission.
For each patient, we extracted age, gender, principal diagnosis, comorbidities, and the specialty of the attending physician. Comorbidities were identified from ICD-9-CM secondary diagnosis codes and Diagnosis Related Groups by using Healthcare Cost and Utilization Project Comorbidity Software, version 3.1, based on the work of Elixhauser (Agency for Healthcare Research and Quality, Rockville, Maryland).7 In order to ensure that patients had HCAP, we required the presence of ≥1 HCAP criteria, including hospitalization in the past 90 days, hemodialysis, admission from an SNF, or immune suppression (which was derived from either a secondary diagnosis for neutropenia, hematological malignancy, organ transplant, acquired immunodeficiency virus, or receiving immunosuppressant drugs or corticosteroids [equivalent to ≥20 mg/day of prednisone]).
Definitions of Guideline-Concordant and Discordant Antibiotic Therapy
The ATS and IDSA guidelines recommended the following antibiotic combinations for HCAP: an antipseudomonal cephalosporin or carbapenem or a beta-lactam/lactamase inhibitor, plus an antipseudomonal quinolone or aminoglycoside, plus an antibiotic with activity versus methicillin resistant Staphylococcus aureus (MRSA), such as vancomycin or linezolid. Based on these guidelines, we defined the receipt of fully guideline-concordant antibiotics as 2 recommended antibiotics for Pseudomonas species plus 1 for MRSA administered by the second day of admission. Partially guideline-concordant antibiotics were defined as 1 recommended antibiotic for Pseudomonas species plus 1 for MRSA by the second day of hospitalization. Guideline-discordant antibiotics were defined as all other combinations.
Statistical Analysis
Descriptive statistics on patient characteristics are presented as frequency, proportions for categorical factors, and median with interquartile range (IQR) for continuous variables for the full cohort and by treatment group, defined as fully or partially guideline-concordant antibiotic therapy or discordant therapy. Hospital rates of fully guideline-concordant treatment are presented overall and by hospital characteristics. The association of hospital characteristics with rates of fully guideline-concordant therapy were assessed by using 1-way analysis of variance tests.
To assess trends across hospitals for the association between the use of guideline-concordant therapy and mortality, progression to respiratory failure as measured by the late initiation of invasive mechanical ventilation (day 3 or later), and the length of stay among survivors, we divided the 4.5-year study period into 9 intervals of 6 months each; 292 hospitals that submitted data for all 9 time points were examined in this analysis. Based on the distribution of length of stay in the first time period, we created an indicator variable for extended length of stay with length of stay at or above the 75th percentile, defined as extended. For each hospital at each 6-month interval, we then computed risk-standardized guideline-concordant treatment (RS-treatment) rates and risk-standardized in-hospital outcome rates similar to methods used by the Centers for Medicare and Medicaid Services for public reporting.8 For each hospital at each time interval, we estimated a predicted rate of guideline-concordant treatment as the sum of predicted probabilities of guideline-concordant treatment from patient factors and the random intercept for the hospital in which they were admitted. We then calculated the expected rate of guideline-concordant treatment as the sum of expected probabilities of treatment received from patient factors only. RS-treatment was then calculated as the ratio of predicted to expected rates multiplied by the overall unadjusted mean treatment rate from all patients.9 We repeated the same modeling strategy to calculate risk-standardized outcome (RS-outcome) rates for each hospital across all time points. All models were adjusted for patient demographics and comorbidities. Similar models using administrative data have moderate discrimination for mortality.10
We then fit mixed-effects linear models with random hospital intercept and slope across time for the RS-treatment and outcome rates, respectively. From these models, we estimated the mean slope for RS-treatment and for RS-outcome over time. In addition, we estimated a slope or trend over time for each hospital for treatment and for outcome and evaluated the correlation between the treatment and outcome trends.
All analyses were performed using the Statistical Analysis System version 9.4 (SAS Institute Inc., Cary, NC) and STATA release 13 (StataCorp, LLC, College Station, Texas).
RESULTS
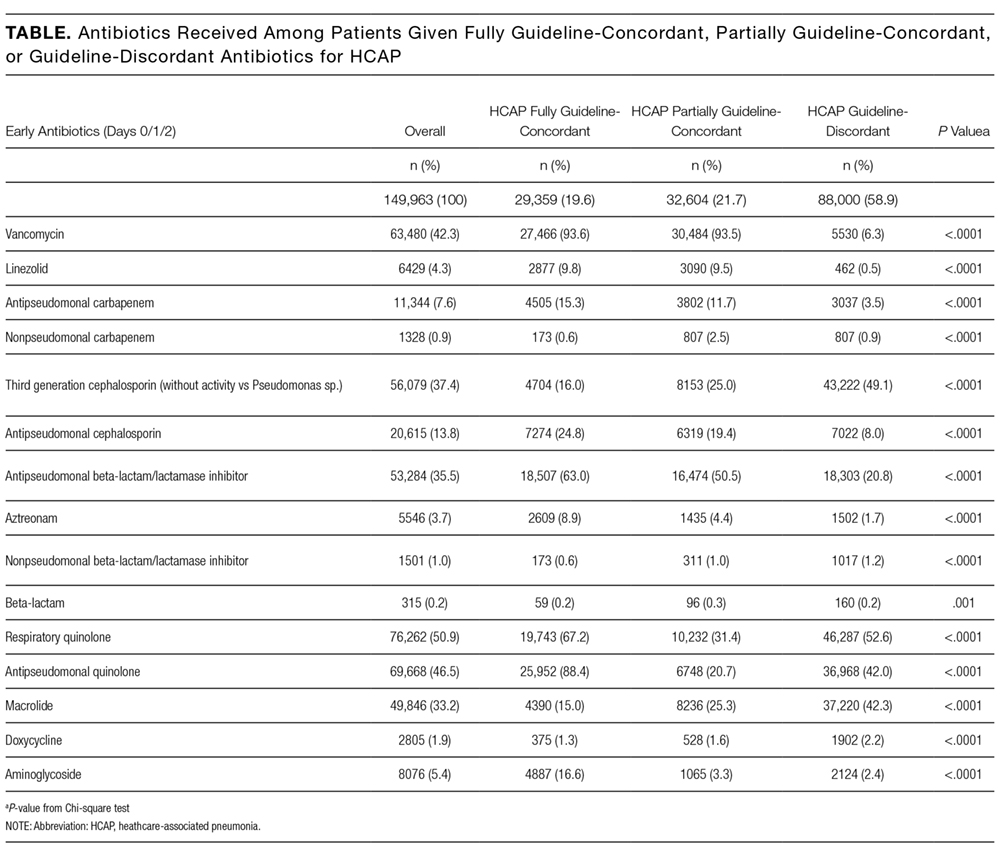

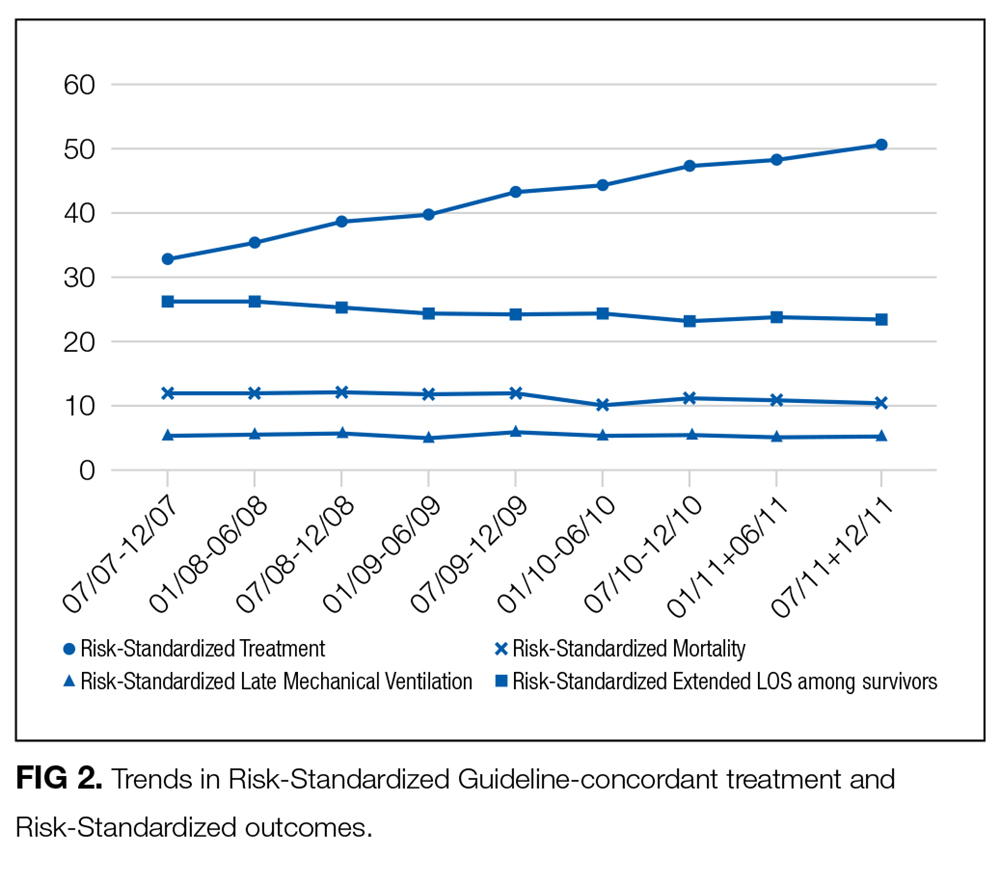
DISCUSSION
In this large, retrospective cohort study, we found that there was a substantial gap between the empiric antibiotics recommended by the ATS and IDSA guidelines and the empiric antibiotics that patients actually received. Over the study period, we saw an increased adherence to guidelines, in spite of growing evidence that HCAP risk factors do not adequately predict which patients are at risk for infection with an MDRO.11 We used this change in antibiotic prescribing behavior over time to determine if there was a clinical impact on patient outcomes and found that at the hospital level, there were no improvements in mortality, excess length of stay, or progression to respiratory failure despite a doubling in guideline-concordant antibiotic use.
At least 2 other large studies have assessed the association between guideline-concordant therapy and outcomes in HCAP.12,13 Both found that guideline-concordant therapy was associated with increased mortality, despite propensity matching. Both were conducted at the individual patient level by using administrative data, and results were likely affected by unmeasured clinical confounders, with sicker patients being more likely to receive guideline-concordant therapy. Our focus on the outcomes at the hospital level avoids this selection bias because the overall severity of illness of patients at any given hospital would not be expected to change over the study period, while physician uptake of antibiotic prescribing guidelines would be expected to increase over time. Determining the correlation between increases in guideline adherence and changes in patient outcome may offer a better assessment of the impact of guideline adherence. In this regard, our results are similar to those achieved by 1 quality improvement collaborative that was aimed at increasing guideline concordant therapy in ICUs. Despite an increase in guideline concordance from 33% to 47% of patients, they found no change in overall mortality.14
There were several limitations to our study. We did not have access to microbiologic data, so we were unable to determine which patients had MDRO infection or determine antibiotic-pathogen matching. However, the treating physicians in our study population presumably did not have access to this data at the time of treatment either because the time period we examined was within the first 48 hours of hospitalization, the interval during which cultures are incubating and the patients are being treated empirically. In addition, there may have been HCAP patients that we failed to identify, such as patients who were admitted in the past 90 days to a hospital that does not submit data to Premier. However, it is unlikely that prescribing for such patients should differ systematically from what we observed. While the database draws from 488 hospitals nationwide, it is possible that practices may be different at facilities that are not contained within the Premier database, such as Veterans Administration Hospitals. Similarly, we did not have readings for chest x-rays; hence, there could be some patients in the dataset who did not have pneumonia. However, we tried to overcome this by including only those patients with a principal diagnosis of pneumonia or sepsis with a secondary pneumonia diagnosis, a chest x-ray, and antibiotics administered within the first 48 hours of admission.
There are likely several reasons why so few HCAP patients in our study received guideline-concordant antibiotics. A lack of knowledge about the ATS and IDSA guidelines may have impacted the physicians in our study population. El-Solh et al.15 surveyed physicians about the ATS-IDSA guidelines 4 years after publication and found that only 45% were familiar with the document. We found that the rate of prescribing at least partially guideline-concordant antibiotics rose steadily over time, supporting the idea that the newness of the guidelines was 1 barrier. Additionally, prior studies have shown that many physicians may not agree with or choose to follow guidelines, with only 20% of physicians indicating that guidelines have a major impact on their clinical decision making,16 and the majority do not choose HCAP guideline-concordant antibiotics when tested.17 Alternatively, clinicians may not follow the guidelines because of a belief that the HCAP criteria do not adequately indicate patients who are at risk for MDRO. Previous studies have demonstrated the relative inability of HCAP risk factors to predict patients who harbor MDRO18 and suggest that better tools such as clinical scoring systems, which include not only the traditional HCAP risk factors but also prior exposure to antibiotics, prior culture data, and a cumulative assessment of both intrinsic and extrinsic factors, could more accurately predict MDRO and lead to a more judicious use of broad-spectrum antimicrobial agents.19-25 Indeed, these collective findings have led the authors of the recently updated guidelines to remove HCAP as a clinical entity from the hospital-acquired or ventilator-associated pneumonia guidelines and place them instead in the upcoming updated guidelines on the management of CAP.5 Of these 3 explanations, the lack of familiarity fits best with our observation that guideline-concordant therapy increased steadily over time with no evidence of reaching a plateau. Ironically, as consensus was building that HCAP is a poor marker for MDROs, routine empiric treatment with vancomycin and piperacillin-tazobactam (“vanco and zosyn”) have become routine in many hospitals. Additional studies are needed to know if this trend has stabilized or reversed.
CONCLUSIONS
In conclusion, clinicians in our large, nationally representative sample treated the majority of HCAP patients as though they had CAP. Although there was an increase in the administration of guideline-concordant therapy over time, this increase was not associated with improved outcomes. This study supports the growing consensus that HCAP criteria do not accurately predict which patients benefit from broad-spectrum antibiotics for pneumonia, and most patients fare well with antibiotics targeting common community-acquired organisms.
Disclosure
This work was supported by grant # R01HS018723 from the Agency for Healthcare Research and Quality. Dr. Lagu is also supported by the National Heart, Lung, and Blood Institute of the National Institutes of Health under award number K01HL114745. Dr. Lindenauer is supported by grant K24HL132008 from the National Heart, Lung, and Blood Institute. The funding agency had no role in the data acquisition, analysis, or manuscript preparation for this study. Drs. Haessler and Rothberg had full access to all the data in the study and take responsibility for the integrity of the data and the accuracy of the data analysis. Drs. Haessler, Lagu, Lindenauer, Skiest, Zilberberg, Higgins, and Rothberg conceived of the study and analyzed and interpreted the data. Dr. Lindenauer acquired the data. Dr. Pekow and Ms. Priya carried out the statistical analyses. Dr. Haessler drafted the manuscript. All authors critically reviewed the manuscript for accuracy and integrity. All authors certify no potential conflicts of interest. Preliminary results from this study were presented in oral and poster format at IDWeek in 2012 and 2013.
1. Kochanek KD, Murphy SL, Xu JQ, Tejada-Vera B. Deaths: Final data for 2014. National vital statistics reports; vol 65 no 4. Hyattsville, MD: National Center for Health Statistics. 2016. PubMed
2. American Thoracic Society, Infectious Diseases Society of America. Guidelines for the Management of Adults with Hospital-acquired, Ventilator-associated, and Healthcare-associated Pneumonia. Am J Respir Crit Care Med. 2005;171(4):388-416. PubMed
3. Zilberberg MD, Shorr A. Healthcare-associated pneumonia: the state of the evidence to date. Curr Opin Pulm Med. 2011;17(3):142-147. PubMed
4. Kollef MK, Shorr A, Tabak YP, Gupta V, Liu LZ, Johannes RS. Epidemiology and Outcomes of Health-care-associated pneumonia. Chest. 2005;128(6):3854-3862. PubMed
5. Kalil AC, Metersky ML, Klompas M, et al. Management of Adults With Hospital-acquired and Ventilator-associated Pneumonia: 2016 Clinical Practice Guidelines by the Infectious Diseases Society of America and the American Thoracic Society. Clin Infect Dis. 2016;63(5):575-582. PubMed
6. Lindenauer PK, Pekow PS, Lahti MC, Lee Y, Benjamin EM, Rothberg MB. Association of corticosteroid dose and route of administration with risk of treatment failure in acute exacerbation of chronic obstructive pulmonary disease. JAMA. 2010;303(23):2359-2367. PubMed
7. Elixhauser A, Steiner C, Harris DR, Coffey RM. Comorbidity measures for use with administrative data. Med Care. 1998;36(1):8-27. PubMed
8. Centers for Medicare & Medicaid Services. Frequently asked questions (FAQs): Implementation and maintenance of CMS mortality measures for AMI & HF. 2007. https://www.cms.gov/Medicare/Quality-Initiatives-Patient-Assessment-Instruments/HospitalQualityInits/downloads/HospitalMortalityAboutAMI_HF.pdf. Accessed November 1, 2016.
9. Normand SL, Shahian DM. Statistical and Clinical Aspects of Hospital Outcomes Profiling. Stat Sci. 2007;22(2):206-226.
10. Rothberg MB, Pekow PS, Priya A, et al. Using highly detailed administrative data to predict pneumonia mortality. PLoS One. 2014;9(1):e87382. PubMed
11. Jones BE, Jones MM, Huttner B, et al. Trends in antibiotic use and nosocomial pathogens in hospitalized veterans with pneumonia at 128 medical centers, 2006-2010. Clin Infect Dis. 2015;61(9):1403-1410. PubMed
12. Attridge RT, Frei CR, Restrepo MI, et al. Guideline-concordant therapy and outcomes in healthcare-associated pneumonia. Eur Respir J. 2011;38(4):878-887. PubMed
13. Rothberg MB, Zilberberg MD, Pekow PS, et al. Association of Guideline-based Antimicrobial Therapy and Outcomes in Healthcare-Associated Pneumonia. J Antimicrob Chemother. 2015;70(5):1573-1579. PubMed
14. Kett DH, Cano E, Quartin AA, et al. Improving Medicine through Pathway Assessment of Critical Therapy of Hospital-Acquired Pneumonia (IMPACT-HAP) Investigators. Implementation of guidelines for management of possible multidrug-resistant pneumonia in intensive care: an observational, multicentre cohort study. Lancet Infect Dis. 2011;11(3):181-189. PubMed
15. El-Solh AA, Alhajhusain A, Saliba RG, Drinka P. Physicians’ Attitudes Toward Guidelines for the Treatment of Hospitalized Nursing-Home -Acquired Pneumonia. J Am Med Dir Assoc. 2011;12(4):270-276. PubMed
16. Tunis S, Hayward R, Wilson M, et al. Internists’ Attitudes about Clinical Practice Guidelines. Ann Intern Med. 1994;120(11):956-963. PubMed
17. Seymann GB, Di Francesco L, Sharpe B, et al. The HCAP Gap: Differences between Self-Reported Practice Patterns and Published Guidelines for Health Care-Associated Pneumonia. Clin Infect Dis. 2009;49(12):1868-1874. PubMed
18. Chalmers JD, Rother C, Salih W, Ewig S. Healthcare associated pneumonia does not accurately identify potentially resistant pathogens: a systematic review and meta-analysis. Clin Infect Dis. 2014;58(3):330-339. PubMed
19. Shorr A, Zilberberg MD, Reichley R, et al. Validation of a Clinical Score for Assessing the Risk of Resistant Pathogens in Patients with Pneumonia Presenting to the Emergency Department. Clin Infect Dis. 2012;54(2):193-198. PubMed
20. Aliberti S, Pasquale MD, Zanaboni AM, et al. Stratifying Risk Factors for Multidrug-Resistant Pathogens in Hospitalized Patients Coming from the Community with Pneumonia. Clin Infect Dis. 2012;54(4):470-478. PubMed
21. Schreiber MP, Chan CM, Shorr AF. Resistant Pathogens in Nonnosocomial Pneumonia and Respiratory Failure: Is it Time to Refine the Definition of Health-care-Associated Pneumonia? Chest. 2010;137(6):1283-1288. PubMed
22. Madaras-Kelly KJ, Remington RE, Fan VS, Sloan KL. Predicting antibiotic resistance to community-acquired pneumonia antibiotics in culture-positive patients with healthcare-associated pneumonia. J Hosp Med. 2012;7(3):195-202. PubMed
23. Shindo Y, Ito R, Kobayashi D, et al. Risk factors for drug-resistant pathogens in community-acquired and healthcare-associated pneumonia. Am J Respir Crit Care Med. 2013;188(8):985-995. PubMed
24. Metersky ML, Frei CR, Mortensen EM. Predictors of Pseudomonas and methicillin-resistant Staphylococcus aureus in hospitalized patients with healthcare-associated pneumonia. Respirology. 2016;21(1):157-163. PubMed
25. Webb BJ, Dascomb K, Stenehjem E, Dean N. Predicting risk of drug-resistant organisms in pneumonia: moving beyond the HCAP model. Respir Med. 2015;109(1):1-10. PubMed
Bacterial pneumonia remains an important cause of morbidity and mortality in the United States, and is the 8th leading cause of death with 55,227 deaths among adults annually.1 In 2005, the American Thoracic Society (ATS) and the Infectious Diseases Society of America (IDSA) collaborated to update guidelines for hospital-acquired pneumonia (HAP), ventilator-associated pneumonia, and healthcare-associated pneumonia (HCAP).2 This broad document outlines an evidence-based approach to diagnostic testing and antibiotic management based on the epidemiology and risk factors for these conditions. The guideline specifies the following criteria for HCAP: hospitalization in the past 90 days, residence in a skilled nursing facility (SNF), home infusion therapy, hemodialysis, home wound care, family members with multidrug resistant organisms (MDRO), and immunosuppressive diseases or medications, with the presumption that these patients are more likely to be harboring MDRO and should thus be treated empirically with broad-spectrum antibiotic therapy. Prior studies have shown that patients with HCAP have a more severe illness, are more likely to have MDRO, are more likely to be inadequately treated, and are at a higher risk for mortality than patients with community-acquired pneumonia (CAP).3,4
These guidelines are controversial, especially in regard to the recommendations to empirically treat broadly with 2 antibiotics targeting Pseudomonas species, whether patients with HCAP merit broader spectrum coverage than patients with CAP, and whether the criteria for defining HCAP are adequate to predict which patients are harboring MDRO. It has subsequently been proposed that HCAP is more related to CAP than to HAP, and a recent update to the guideline removed recommendations for treatment of HCAP and will be placing HCAP into the guidelines for CAP instead.5 We sought to investigate the degree of uptake of the ATS and IDSA guideline recommendations by physicians over time, and whether this led to a change in outcomes among patients who met the criteria for HCAP.
METHODS
Setting and Patients
We identified patients discharged between July 1, 2007, and November 30, 2011, from 488 US hospitals that participated in the Premier database (Premier Inc., Charlotte, North Carolina), an inpatient database developed for measuring quality and healthcare utilization. The database is frequently used for healthcare research and has been described previously.6 Member hospitals are in all regions of the US and are generally reflective of US hospitals. This database contains multiple data elements, including sociodemographic information, International Classification of Diseases, 9th Revision-Clinical Modification (ICD-9-CM) diagnosis and procedure codes, hospital and physician information, source of admission, and discharge status. It also includes a date-stamped log of all billed items and services, including diagnostic tests, medications, and other treatments. Because the data do not contain identifiable information, the institutional review board at our medical center determined that this study did not constitute human subjects research.
We included all patients aged ≥18 years with a principal diagnosis of pneumonia or with a secondary diagnosis of pneumonia paired with a principal diagnosis of respiratory failure, acute respiratory distress syndrome, respiratory arrest, sepsis, or influenza. Patients were excluded if they were transferred to or from another acute care institution, had a length of stay of 1 day or less, had cystic fibrosis, did not have a chest radiograph, or did not receive antibiotics within 48 hours of admission.
For each patient, we extracted age, gender, principal diagnosis, comorbidities, and the specialty of the attending physician. Comorbidities were identified from ICD-9-CM secondary diagnosis codes and Diagnosis Related Groups by using Healthcare Cost and Utilization Project Comorbidity Software, version 3.1, based on the work of Elixhauser (Agency for Healthcare Research and Quality, Rockville, Maryland).7 In order to ensure that patients had HCAP, we required the presence of ≥1 HCAP criteria, including hospitalization in the past 90 days, hemodialysis, admission from an SNF, or immune suppression (which was derived from either a secondary diagnosis for neutropenia, hematological malignancy, organ transplant, acquired immunodeficiency virus, or receiving immunosuppressant drugs or corticosteroids [equivalent to ≥20 mg/day of prednisone]).
Definitions of Guideline-Concordant and Discordant Antibiotic Therapy
The ATS and IDSA guidelines recommended the following antibiotic combinations for HCAP: an antipseudomonal cephalosporin or carbapenem or a beta-lactam/lactamase inhibitor, plus an antipseudomonal quinolone or aminoglycoside, plus an antibiotic with activity versus methicillin resistant Staphylococcus aureus (MRSA), such as vancomycin or linezolid. Based on these guidelines, we defined the receipt of fully guideline-concordant antibiotics as 2 recommended antibiotics for Pseudomonas species plus 1 for MRSA administered by the second day of admission. Partially guideline-concordant antibiotics were defined as 1 recommended antibiotic for Pseudomonas species plus 1 for MRSA by the second day of hospitalization. Guideline-discordant antibiotics were defined as all other combinations.
Statistical Analysis
Descriptive statistics on patient characteristics are presented as frequency, proportions for categorical factors, and median with interquartile range (IQR) for continuous variables for the full cohort and by treatment group, defined as fully or partially guideline-concordant antibiotic therapy or discordant therapy. Hospital rates of fully guideline-concordant treatment are presented overall and by hospital characteristics. The association of hospital characteristics with rates of fully guideline-concordant therapy were assessed by using 1-way analysis of variance tests.
To assess trends across hospitals for the association between the use of guideline-concordant therapy and mortality, progression to respiratory failure as measured by the late initiation of invasive mechanical ventilation (day 3 or later), and the length of stay among survivors, we divided the 4.5-year study period into 9 intervals of 6 months each; 292 hospitals that submitted data for all 9 time points were examined in this analysis. Based on the distribution of length of stay in the first time period, we created an indicator variable for extended length of stay with length of stay at or above the 75th percentile, defined as extended. For each hospital at each 6-month interval, we then computed risk-standardized guideline-concordant treatment (RS-treatment) rates and risk-standardized in-hospital outcome rates similar to methods used by the Centers for Medicare and Medicaid Services for public reporting.8 For each hospital at each time interval, we estimated a predicted rate of guideline-concordant treatment as the sum of predicted probabilities of guideline-concordant treatment from patient factors and the random intercept for the hospital in which they were admitted. We then calculated the expected rate of guideline-concordant treatment as the sum of expected probabilities of treatment received from patient factors only. RS-treatment was then calculated as the ratio of predicted to expected rates multiplied by the overall unadjusted mean treatment rate from all patients.9 We repeated the same modeling strategy to calculate risk-standardized outcome (RS-outcome) rates for each hospital across all time points. All models were adjusted for patient demographics and comorbidities. Similar models using administrative data have moderate discrimination for mortality.10
We then fit mixed-effects linear models with random hospital intercept and slope across time for the RS-treatment and outcome rates, respectively. From these models, we estimated the mean slope for RS-treatment and for RS-outcome over time. In addition, we estimated a slope or trend over time for each hospital for treatment and for outcome and evaluated the correlation between the treatment and outcome trends.
All analyses were performed using the Statistical Analysis System version 9.4 (SAS Institute Inc., Cary, NC) and STATA release 13 (StataCorp, LLC, College Station, Texas).
RESULTS
DISCUSSION
In this large, retrospective cohort study, we found that there was a substantial gap between the empiric antibiotics recommended by the ATS and IDSA guidelines and the empiric antibiotics that patients actually received. Over the study period, we saw an increased adherence to guidelines, in spite of growing evidence that HCAP risk factors do not adequately predict which patients are at risk for infection with an MDRO.11 We used this change in antibiotic prescribing behavior over time to determine if there was a clinical impact on patient outcomes and found that at the hospital level, there were no improvements in mortality, excess length of stay, or progression to respiratory failure despite a doubling in guideline-concordant antibiotic use.
At least 2 other large studies have assessed the association between guideline-concordant therapy and outcomes in HCAP.12,13 Both found that guideline-concordant therapy was associated with increased mortality, despite propensity matching. Both were conducted at the individual patient level by using administrative data, and results were likely affected by unmeasured clinical confounders, with sicker patients being more likely to receive guideline-concordant therapy. Our focus on the outcomes at the hospital level avoids this selection bias because the overall severity of illness of patients at any given hospital would not be expected to change over the study period, while physician uptake of antibiotic prescribing guidelines would be expected to increase over time. Determining the correlation between increases in guideline adherence and changes in patient outcome may offer a better assessment of the impact of guideline adherence. In this regard, our results are similar to those achieved by 1 quality improvement collaborative that was aimed at increasing guideline concordant therapy in ICUs. Despite an increase in guideline concordance from 33% to 47% of patients, they found no change in overall mortality.14
There were several limitations to our study. We did not have access to microbiologic data, so we were unable to determine which patients had MDRO infection or determine antibiotic-pathogen matching. However, the treating physicians in our study population presumably did not have access to this data at the time of treatment either because the time period we examined was within the first 48 hours of hospitalization, the interval during which cultures are incubating and the patients are being treated empirically. In addition, there may have been HCAP patients that we failed to identify, such as patients who were admitted in the past 90 days to a hospital that does not submit data to Premier. However, it is unlikely that prescribing for such patients should differ systematically from what we observed. While the database draws from 488 hospitals nationwide, it is possible that practices may be different at facilities that are not contained within the Premier database, such as Veterans Administration Hospitals. Similarly, we did not have readings for chest x-rays; hence, there could be some patients in the dataset who did not have pneumonia. However, we tried to overcome this by including only those patients with a principal diagnosis of pneumonia or sepsis with a secondary pneumonia diagnosis, a chest x-ray, and antibiotics administered within the first 48 hours of admission.
There are likely several reasons why so few HCAP patients in our study received guideline-concordant antibiotics. A lack of knowledge about the ATS and IDSA guidelines may have impacted the physicians in our study population. El-Solh et al.15 surveyed physicians about the ATS-IDSA guidelines 4 years after publication and found that only 45% were familiar with the document. We found that the rate of prescribing at least partially guideline-concordant antibiotics rose steadily over time, supporting the idea that the newness of the guidelines was 1 barrier. Additionally, prior studies have shown that many physicians may not agree with or choose to follow guidelines, with only 20% of physicians indicating that guidelines have a major impact on their clinical decision making,16 and the majority do not choose HCAP guideline-concordant antibiotics when tested.17 Alternatively, clinicians may not follow the guidelines because of a belief that the HCAP criteria do not adequately indicate patients who are at risk for MDRO. Previous studies have demonstrated the relative inability of HCAP risk factors to predict patients who harbor MDRO18 and suggest that better tools such as clinical scoring systems, which include not only the traditional HCAP risk factors but also prior exposure to antibiotics, prior culture data, and a cumulative assessment of both intrinsic and extrinsic factors, could more accurately predict MDRO and lead to a more judicious use of broad-spectrum antimicrobial agents.19-25 Indeed, these collective findings have led the authors of the recently updated guidelines to remove HCAP as a clinical entity from the hospital-acquired or ventilator-associated pneumonia guidelines and place them instead in the upcoming updated guidelines on the management of CAP.5 Of these 3 explanations, the lack of familiarity fits best with our observation that guideline-concordant therapy increased steadily over time with no evidence of reaching a plateau. Ironically, as consensus was building that HCAP is a poor marker for MDROs, routine empiric treatment with vancomycin and piperacillin-tazobactam (“vanco and zosyn”) have become routine in many hospitals. Additional studies are needed to know if this trend has stabilized or reversed.
CONCLUSIONS
In conclusion, clinicians in our large, nationally representative sample treated the majority of HCAP patients as though they had CAP. Although there was an increase in the administration of guideline-concordant therapy over time, this increase was not associated with improved outcomes. This study supports the growing consensus that HCAP criteria do not accurately predict which patients benefit from broad-spectrum antibiotics for pneumonia, and most patients fare well with antibiotics targeting common community-acquired organisms.
Disclosure
This work was supported by grant # R01HS018723 from the Agency for Healthcare Research and Quality. Dr. Lagu is also supported by the National Heart, Lung, and Blood Institute of the National Institutes of Health under award number K01HL114745. Dr. Lindenauer is supported by grant K24HL132008 from the National Heart, Lung, and Blood Institute. The funding agency had no role in the data acquisition, analysis, or manuscript preparation for this study. Drs. Haessler and Rothberg had full access to all the data in the study and take responsibility for the integrity of the data and the accuracy of the data analysis. Drs. Haessler, Lagu, Lindenauer, Skiest, Zilberberg, Higgins, and Rothberg conceived of the study and analyzed and interpreted the data. Dr. Lindenauer acquired the data. Dr. Pekow and Ms. Priya carried out the statistical analyses. Dr. Haessler drafted the manuscript. All authors critically reviewed the manuscript for accuracy and integrity. All authors certify no potential conflicts of interest. Preliminary results from this study were presented in oral and poster format at IDWeek in 2012 and 2013.
Bacterial pneumonia remains an important cause of morbidity and mortality in the United States, and is the 8th leading cause of death with 55,227 deaths among adults annually.1 In 2005, the American Thoracic Society (ATS) and the Infectious Diseases Society of America (IDSA) collaborated to update guidelines for hospital-acquired pneumonia (HAP), ventilator-associated pneumonia, and healthcare-associated pneumonia (HCAP).2 This broad document outlines an evidence-based approach to diagnostic testing and antibiotic management based on the epidemiology and risk factors for these conditions. The guideline specifies the following criteria for HCAP: hospitalization in the past 90 days, residence in a skilled nursing facility (SNF), home infusion therapy, hemodialysis, home wound care, family members with multidrug resistant organisms (MDRO), and immunosuppressive diseases or medications, with the presumption that these patients are more likely to be harboring MDRO and should thus be treated empirically with broad-spectrum antibiotic therapy. Prior studies have shown that patients with HCAP have a more severe illness, are more likely to have MDRO, are more likely to be inadequately treated, and are at a higher risk for mortality than patients with community-acquired pneumonia (CAP).3,4
These guidelines are controversial, especially in regard to the recommendations to empirically treat broadly with 2 antibiotics targeting Pseudomonas species, whether patients with HCAP merit broader spectrum coverage than patients with CAP, and whether the criteria for defining HCAP are adequate to predict which patients are harboring MDRO. It has subsequently been proposed that HCAP is more related to CAP than to HAP, and a recent update to the guideline removed recommendations for treatment of HCAP and will be placing HCAP into the guidelines for CAP instead.5 We sought to investigate the degree of uptake of the ATS and IDSA guideline recommendations by physicians over time, and whether this led to a change in outcomes among patients who met the criteria for HCAP.
METHODS
Setting and Patients
We identified patients discharged between July 1, 2007, and November 30, 2011, from 488 US hospitals that participated in the Premier database (Premier Inc., Charlotte, North Carolina), an inpatient database developed for measuring quality and healthcare utilization. The database is frequently used for healthcare research and has been described previously.6 Member hospitals are in all regions of the US and are generally reflective of US hospitals. This database contains multiple data elements, including sociodemographic information, International Classification of Diseases, 9th Revision-Clinical Modification (ICD-9-CM) diagnosis and procedure codes, hospital and physician information, source of admission, and discharge status. It also includes a date-stamped log of all billed items and services, including diagnostic tests, medications, and other treatments. Because the data do not contain identifiable information, the institutional review board at our medical center determined that this study did not constitute human subjects research.
We included all patients aged ≥18 years with a principal diagnosis of pneumonia or with a secondary diagnosis of pneumonia paired with a principal diagnosis of respiratory failure, acute respiratory distress syndrome, respiratory arrest, sepsis, or influenza. Patients were excluded if they were transferred to or from another acute care institution, had a length of stay of 1 day or less, had cystic fibrosis, did not have a chest radiograph, or did not receive antibiotics within 48 hours of admission.
For each patient, we extracted age, gender, principal diagnosis, comorbidities, and the specialty of the attending physician. Comorbidities were identified from ICD-9-CM secondary diagnosis codes and Diagnosis Related Groups by using Healthcare Cost and Utilization Project Comorbidity Software, version 3.1, based on the work of Elixhauser (Agency for Healthcare Research and Quality, Rockville, Maryland).7 In order to ensure that patients had HCAP, we required the presence of ≥1 HCAP criteria, including hospitalization in the past 90 days, hemodialysis, admission from an SNF, or immune suppression (which was derived from either a secondary diagnosis for neutropenia, hematological malignancy, organ transplant, acquired immunodeficiency virus, or receiving immunosuppressant drugs or corticosteroids [equivalent to ≥20 mg/day of prednisone]).
Definitions of Guideline-Concordant and Discordant Antibiotic Therapy
The ATS and IDSA guidelines recommended the following antibiotic combinations for HCAP: an antipseudomonal cephalosporin or carbapenem or a beta-lactam/lactamase inhibitor, plus an antipseudomonal quinolone or aminoglycoside, plus an antibiotic with activity versus methicillin resistant Staphylococcus aureus (MRSA), such as vancomycin or linezolid. Based on these guidelines, we defined the receipt of fully guideline-concordant antibiotics as 2 recommended antibiotics for Pseudomonas species plus 1 for MRSA administered by the second day of admission. Partially guideline-concordant antibiotics were defined as 1 recommended antibiotic for Pseudomonas species plus 1 for MRSA by the second day of hospitalization. Guideline-discordant antibiotics were defined as all other combinations.
Statistical Analysis
Descriptive statistics on patient characteristics are presented as frequency, proportions for categorical factors, and median with interquartile range (IQR) for continuous variables for the full cohort and by treatment group, defined as fully or partially guideline-concordant antibiotic therapy or discordant therapy. Hospital rates of fully guideline-concordant treatment are presented overall and by hospital characteristics. The association of hospital characteristics with rates of fully guideline-concordant therapy were assessed by using 1-way analysis of variance tests.
To assess trends across hospitals for the association between the use of guideline-concordant therapy and mortality, progression to respiratory failure as measured by the late initiation of invasive mechanical ventilation (day 3 or later), and the length of stay among survivors, we divided the 4.5-year study period into 9 intervals of 6 months each; 292 hospitals that submitted data for all 9 time points were examined in this analysis. Based on the distribution of length of stay in the first time period, we created an indicator variable for extended length of stay with length of stay at or above the 75th percentile, defined as extended. For each hospital at each 6-month interval, we then computed risk-standardized guideline-concordant treatment (RS-treatment) rates and risk-standardized in-hospital outcome rates similar to methods used by the Centers for Medicare and Medicaid Services for public reporting.8 For each hospital at each time interval, we estimated a predicted rate of guideline-concordant treatment as the sum of predicted probabilities of guideline-concordant treatment from patient factors and the random intercept for the hospital in which they were admitted. We then calculated the expected rate of guideline-concordant treatment as the sum of expected probabilities of treatment received from patient factors only. RS-treatment was then calculated as the ratio of predicted to expected rates multiplied by the overall unadjusted mean treatment rate from all patients.9 We repeated the same modeling strategy to calculate risk-standardized outcome (RS-outcome) rates for each hospital across all time points. All models were adjusted for patient demographics and comorbidities. Similar models using administrative data have moderate discrimination for mortality.10
We then fit mixed-effects linear models with random hospital intercept and slope across time for the RS-treatment and outcome rates, respectively. From these models, we estimated the mean slope for RS-treatment and for RS-outcome over time. In addition, we estimated a slope or trend over time for each hospital for treatment and for outcome and evaluated the correlation between the treatment and outcome trends.
All analyses were performed using the Statistical Analysis System version 9.4 (SAS Institute Inc., Cary, NC) and STATA release 13 (StataCorp, LLC, College Station, Texas).
RESULTS
DISCUSSION
In this large, retrospective cohort study, we found that there was a substantial gap between the empiric antibiotics recommended by the ATS and IDSA guidelines and the empiric antibiotics that patients actually received. Over the study period, we saw an increased adherence to guidelines, in spite of growing evidence that HCAP risk factors do not adequately predict which patients are at risk for infection with an MDRO.11 We used this change in antibiotic prescribing behavior over time to determine if there was a clinical impact on patient outcomes and found that at the hospital level, there were no improvements in mortality, excess length of stay, or progression to respiratory failure despite a doubling in guideline-concordant antibiotic use.
At least 2 other large studies have assessed the association between guideline-concordant therapy and outcomes in HCAP.12,13 Both found that guideline-concordant therapy was associated with increased mortality, despite propensity matching. Both were conducted at the individual patient level by using administrative data, and results were likely affected by unmeasured clinical confounders, with sicker patients being more likely to receive guideline-concordant therapy. Our focus on the outcomes at the hospital level avoids this selection bias because the overall severity of illness of patients at any given hospital would not be expected to change over the study period, while physician uptake of antibiotic prescribing guidelines would be expected to increase over time. Determining the correlation between increases in guideline adherence and changes in patient outcome may offer a better assessment of the impact of guideline adherence. In this regard, our results are similar to those achieved by 1 quality improvement collaborative that was aimed at increasing guideline concordant therapy in ICUs. Despite an increase in guideline concordance from 33% to 47% of patients, they found no change in overall mortality.14
There were several limitations to our study. We did not have access to microbiologic data, so we were unable to determine which patients had MDRO infection or determine antibiotic-pathogen matching. However, the treating physicians in our study population presumably did not have access to this data at the time of treatment either because the time period we examined was within the first 48 hours of hospitalization, the interval during which cultures are incubating and the patients are being treated empirically. In addition, there may have been HCAP patients that we failed to identify, such as patients who were admitted in the past 90 days to a hospital that does not submit data to Premier. However, it is unlikely that prescribing for such patients should differ systematically from what we observed. While the database draws from 488 hospitals nationwide, it is possible that practices may be different at facilities that are not contained within the Premier database, such as Veterans Administration Hospitals. Similarly, we did not have readings for chest x-rays; hence, there could be some patients in the dataset who did not have pneumonia. However, we tried to overcome this by including only those patients with a principal diagnosis of pneumonia or sepsis with a secondary pneumonia diagnosis, a chest x-ray, and antibiotics administered within the first 48 hours of admission.
There are likely several reasons why so few HCAP patients in our study received guideline-concordant antibiotics. A lack of knowledge about the ATS and IDSA guidelines may have impacted the physicians in our study population. El-Solh et al.15 surveyed physicians about the ATS-IDSA guidelines 4 years after publication and found that only 45% were familiar with the document. We found that the rate of prescribing at least partially guideline-concordant antibiotics rose steadily over time, supporting the idea that the newness of the guidelines was 1 barrier. Additionally, prior studies have shown that many physicians may not agree with or choose to follow guidelines, with only 20% of physicians indicating that guidelines have a major impact on their clinical decision making,16 and the majority do not choose HCAP guideline-concordant antibiotics when tested.17 Alternatively, clinicians may not follow the guidelines because of a belief that the HCAP criteria do not adequately indicate patients who are at risk for MDRO. Previous studies have demonstrated the relative inability of HCAP risk factors to predict patients who harbor MDRO18 and suggest that better tools such as clinical scoring systems, which include not only the traditional HCAP risk factors but also prior exposure to antibiotics, prior culture data, and a cumulative assessment of both intrinsic and extrinsic factors, could more accurately predict MDRO and lead to a more judicious use of broad-spectrum antimicrobial agents.19-25 Indeed, these collective findings have led the authors of the recently updated guidelines to remove HCAP as a clinical entity from the hospital-acquired or ventilator-associated pneumonia guidelines and place them instead in the upcoming updated guidelines on the management of CAP.5 Of these 3 explanations, the lack of familiarity fits best with our observation that guideline-concordant therapy increased steadily over time with no evidence of reaching a plateau. Ironically, as consensus was building that HCAP is a poor marker for MDROs, routine empiric treatment with vancomycin and piperacillin-tazobactam (“vanco and zosyn”) have become routine in many hospitals. Additional studies are needed to know if this trend has stabilized or reversed.
CONCLUSIONS
In conclusion, clinicians in our large, nationally representative sample treated the majority of HCAP patients as though they had CAP. Although there was an increase in the administration of guideline-concordant therapy over time, this increase was not associated with improved outcomes. This study supports the growing consensus that HCAP criteria do not accurately predict which patients benefit from broad-spectrum antibiotics for pneumonia, and most patients fare well with antibiotics targeting common community-acquired organisms.
Disclosure
This work was supported by grant # R01HS018723 from the Agency for Healthcare Research and Quality. Dr. Lagu is also supported by the National Heart, Lung, and Blood Institute of the National Institutes of Health under award number K01HL114745. Dr. Lindenauer is supported by grant K24HL132008 from the National Heart, Lung, and Blood Institute. The funding agency had no role in the data acquisition, analysis, or manuscript preparation for this study. Drs. Haessler and Rothberg had full access to all the data in the study and take responsibility for the integrity of the data and the accuracy of the data analysis. Drs. Haessler, Lagu, Lindenauer, Skiest, Zilberberg, Higgins, and Rothberg conceived of the study and analyzed and interpreted the data. Dr. Lindenauer acquired the data. Dr. Pekow and Ms. Priya carried out the statistical analyses. Dr. Haessler drafted the manuscript. All authors critically reviewed the manuscript for accuracy and integrity. All authors certify no potential conflicts of interest. Preliminary results from this study were presented in oral and poster format at IDWeek in 2012 and 2013.
1. Kochanek KD, Murphy SL, Xu JQ, Tejada-Vera B. Deaths: Final data for 2014. National vital statistics reports; vol 65 no 4. Hyattsville, MD: National Center for Health Statistics. 2016. PubMed
2. American Thoracic Society, Infectious Diseases Society of America. Guidelines for the Management of Adults with Hospital-acquired, Ventilator-associated, and Healthcare-associated Pneumonia. Am J Respir Crit Care Med. 2005;171(4):388-416. PubMed
3. Zilberberg MD, Shorr A. Healthcare-associated pneumonia: the state of the evidence to date. Curr Opin Pulm Med. 2011;17(3):142-147. PubMed
4. Kollef MK, Shorr A, Tabak YP, Gupta V, Liu LZ, Johannes RS. Epidemiology and Outcomes of Health-care-associated pneumonia. Chest. 2005;128(6):3854-3862. PubMed
5. Kalil AC, Metersky ML, Klompas M, et al. Management of Adults With Hospital-acquired and Ventilator-associated Pneumonia: 2016 Clinical Practice Guidelines by the Infectious Diseases Society of America and the American Thoracic Society. Clin Infect Dis. 2016;63(5):575-582. PubMed
6. Lindenauer PK, Pekow PS, Lahti MC, Lee Y, Benjamin EM, Rothberg MB. Association of corticosteroid dose and route of administration with risk of treatment failure in acute exacerbation of chronic obstructive pulmonary disease. JAMA. 2010;303(23):2359-2367. PubMed
7. Elixhauser A, Steiner C, Harris DR, Coffey RM. Comorbidity measures for use with administrative data. Med Care. 1998;36(1):8-27. PubMed
8. Centers for Medicare & Medicaid Services. Frequently asked questions (FAQs): Implementation and maintenance of CMS mortality measures for AMI & HF. 2007. https://www.cms.gov/Medicare/Quality-Initiatives-Patient-Assessment-Instruments/HospitalQualityInits/downloads/HospitalMortalityAboutAMI_HF.pdf. Accessed November 1, 2016.
9. Normand SL, Shahian DM. Statistical and Clinical Aspects of Hospital Outcomes Profiling. Stat Sci. 2007;22(2):206-226.
10. Rothberg MB, Pekow PS, Priya A, et al. Using highly detailed administrative data to predict pneumonia mortality. PLoS One. 2014;9(1):e87382. PubMed
11. Jones BE, Jones MM, Huttner B, et al. Trends in antibiotic use and nosocomial pathogens in hospitalized veterans with pneumonia at 128 medical centers, 2006-2010. Clin Infect Dis. 2015;61(9):1403-1410. PubMed
12. Attridge RT, Frei CR, Restrepo MI, et al. Guideline-concordant therapy and outcomes in healthcare-associated pneumonia. Eur Respir J. 2011;38(4):878-887. PubMed
13. Rothberg MB, Zilberberg MD, Pekow PS, et al. Association of Guideline-based Antimicrobial Therapy and Outcomes in Healthcare-Associated Pneumonia. J Antimicrob Chemother. 2015;70(5):1573-1579. PubMed
14. Kett DH, Cano E, Quartin AA, et al. Improving Medicine through Pathway Assessment of Critical Therapy of Hospital-Acquired Pneumonia (IMPACT-HAP) Investigators. Implementation of guidelines for management of possible multidrug-resistant pneumonia in intensive care: an observational, multicentre cohort study. Lancet Infect Dis. 2011;11(3):181-189. PubMed
15. El-Solh AA, Alhajhusain A, Saliba RG, Drinka P. Physicians’ Attitudes Toward Guidelines for the Treatment of Hospitalized Nursing-Home -Acquired Pneumonia. J Am Med Dir Assoc. 2011;12(4):270-276. PubMed
16. Tunis S, Hayward R, Wilson M, et al. Internists’ Attitudes about Clinical Practice Guidelines. Ann Intern Med. 1994;120(11):956-963. PubMed
17. Seymann GB, Di Francesco L, Sharpe B, et al. The HCAP Gap: Differences between Self-Reported Practice Patterns and Published Guidelines for Health Care-Associated Pneumonia. Clin Infect Dis. 2009;49(12):1868-1874. PubMed
18. Chalmers JD, Rother C, Salih W, Ewig S. Healthcare associated pneumonia does not accurately identify potentially resistant pathogens: a systematic review and meta-analysis. Clin Infect Dis. 2014;58(3):330-339. PubMed
19. Shorr A, Zilberberg MD, Reichley R, et al. Validation of a Clinical Score for Assessing the Risk of Resistant Pathogens in Patients with Pneumonia Presenting to the Emergency Department. Clin Infect Dis. 2012;54(2):193-198. PubMed
20. Aliberti S, Pasquale MD, Zanaboni AM, et al. Stratifying Risk Factors for Multidrug-Resistant Pathogens in Hospitalized Patients Coming from the Community with Pneumonia. Clin Infect Dis. 2012;54(4):470-478. PubMed
21. Schreiber MP, Chan CM, Shorr AF. Resistant Pathogens in Nonnosocomial Pneumonia and Respiratory Failure: Is it Time to Refine the Definition of Health-care-Associated Pneumonia? Chest. 2010;137(6):1283-1288. PubMed
22. Madaras-Kelly KJ, Remington RE, Fan VS, Sloan KL. Predicting antibiotic resistance to community-acquired pneumonia antibiotics in culture-positive patients with healthcare-associated pneumonia. J Hosp Med. 2012;7(3):195-202. PubMed
23. Shindo Y, Ito R, Kobayashi D, et al. Risk factors for drug-resistant pathogens in community-acquired and healthcare-associated pneumonia. Am J Respir Crit Care Med. 2013;188(8):985-995. PubMed
24. Metersky ML, Frei CR, Mortensen EM. Predictors of Pseudomonas and methicillin-resistant Staphylococcus aureus in hospitalized patients with healthcare-associated pneumonia. Respirology. 2016;21(1):157-163. PubMed
25. Webb BJ, Dascomb K, Stenehjem E, Dean N. Predicting risk of drug-resistant organisms in pneumonia: moving beyond the HCAP model. Respir Med. 2015;109(1):1-10. PubMed
1. Kochanek KD, Murphy SL, Xu JQ, Tejada-Vera B. Deaths: Final data for 2014. National vital statistics reports; vol 65 no 4. Hyattsville, MD: National Center for Health Statistics. 2016. PubMed
2. American Thoracic Society, Infectious Diseases Society of America. Guidelines for the Management of Adults with Hospital-acquired, Ventilator-associated, and Healthcare-associated Pneumonia. Am J Respir Crit Care Med. 2005;171(4):388-416. PubMed
3. Zilberberg MD, Shorr A. Healthcare-associated pneumonia: the state of the evidence to date. Curr Opin Pulm Med. 2011;17(3):142-147. PubMed
4. Kollef MK, Shorr A, Tabak YP, Gupta V, Liu LZ, Johannes RS. Epidemiology and Outcomes of Health-care-associated pneumonia. Chest. 2005;128(6):3854-3862. PubMed
5. Kalil AC, Metersky ML, Klompas M, et al. Management of Adults With Hospital-acquired and Ventilator-associated Pneumonia: 2016 Clinical Practice Guidelines by the Infectious Diseases Society of America and the American Thoracic Society. Clin Infect Dis. 2016;63(5):575-582. PubMed
6. Lindenauer PK, Pekow PS, Lahti MC, Lee Y, Benjamin EM, Rothberg MB. Association of corticosteroid dose and route of administration with risk of treatment failure in acute exacerbation of chronic obstructive pulmonary disease. JAMA. 2010;303(23):2359-2367. PubMed
7. Elixhauser A, Steiner C, Harris DR, Coffey RM. Comorbidity measures for use with administrative data. Med Care. 1998;36(1):8-27. PubMed
8. Centers for Medicare & Medicaid Services. Frequently asked questions (FAQs): Implementation and maintenance of CMS mortality measures for AMI & HF. 2007. https://www.cms.gov/Medicare/Quality-Initiatives-Patient-Assessment-Instruments/HospitalQualityInits/downloads/HospitalMortalityAboutAMI_HF.pdf. Accessed November 1, 2016.
9. Normand SL, Shahian DM. Statistical and Clinical Aspects of Hospital Outcomes Profiling. Stat Sci. 2007;22(2):206-226.
10. Rothberg MB, Pekow PS, Priya A, et al. Using highly detailed administrative data to predict pneumonia mortality. PLoS One. 2014;9(1):e87382. PubMed
11. Jones BE, Jones MM, Huttner B, et al. Trends in antibiotic use and nosocomial pathogens in hospitalized veterans with pneumonia at 128 medical centers, 2006-2010. Clin Infect Dis. 2015;61(9):1403-1410. PubMed
12. Attridge RT, Frei CR, Restrepo MI, et al. Guideline-concordant therapy and outcomes in healthcare-associated pneumonia. Eur Respir J. 2011;38(4):878-887. PubMed
13. Rothberg MB, Zilberberg MD, Pekow PS, et al. Association of Guideline-based Antimicrobial Therapy and Outcomes in Healthcare-Associated Pneumonia. J Antimicrob Chemother. 2015;70(5):1573-1579. PubMed
14. Kett DH, Cano E, Quartin AA, et al. Improving Medicine through Pathway Assessment of Critical Therapy of Hospital-Acquired Pneumonia (IMPACT-HAP) Investigators. Implementation of guidelines for management of possible multidrug-resistant pneumonia in intensive care: an observational, multicentre cohort study. Lancet Infect Dis. 2011;11(3):181-189. PubMed
15. El-Solh AA, Alhajhusain A, Saliba RG, Drinka P. Physicians’ Attitudes Toward Guidelines for the Treatment of Hospitalized Nursing-Home -Acquired Pneumonia. J Am Med Dir Assoc. 2011;12(4):270-276. PubMed
16. Tunis S, Hayward R, Wilson M, et al. Internists’ Attitudes about Clinical Practice Guidelines. Ann Intern Med. 1994;120(11):956-963. PubMed
17. Seymann GB, Di Francesco L, Sharpe B, et al. The HCAP Gap: Differences between Self-Reported Practice Patterns and Published Guidelines for Health Care-Associated Pneumonia. Clin Infect Dis. 2009;49(12):1868-1874. PubMed
18. Chalmers JD, Rother C, Salih W, Ewig S. Healthcare associated pneumonia does not accurately identify potentially resistant pathogens: a systematic review and meta-analysis. Clin Infect Dis. 2014;58(3):330-339. PubMed
19. Shorr A, Zilberberg MD, Reichley R, et al. Validation of a Clinical Score for Assessing the Risk of Resistant Pathogens in Patients with Pneumonia Presenting to the Emergency Department. Clin Infect Dis. 2012;54(2):193-198. PubMed
20. Aliberti S, Pasquale MD, Zanaboni AM, et al. Stratifying Risk Factors for Multidrug-Resistant Pathogens in Hospitalized Patients Coming from the Community with Pneumonia. Clin Infect Dis. 2012;54(4):470-478. PubMed
21. Schreiber MP, Chan CM, Shorr AF. Resistant Pathogens in Nonnosocomial Pneumonia and Respiratory Failure: Is it Time to Refine the Definition of Health-care-Associated Pneumonia? Chest. 2010;137(6):1283-1288. PubMed
22. Madaras-Kelly KJ, Remington RE, Fan VS, Sloan KL. Predicting antibiotic resistance to community-acquired pneumonia antibiotics in culture-positive patients with healthcare-associated pneumonia. J Hosp Med. 2012;7(3):195-202. PubMed
23. Shindo Y, Ito R, Kobayashi D, et al. Risk factors for drug-resistant pathogens in community-acquired and healthcare-associated pneumonia. Am J Respir Crit Care Med. 2013;188(8):985-995. PubMed
24. Metersky ML, Frei CR, Mortensen EM. Predictors of Pseudomonas and methicillin-resistant Staphylococcus aureus in hospitalized patients with healthcare-associated pneumonia. Respirology. 2016;21(1):157-163. PubMed
25. Webb BJ, Dascomb K, Stenehjem E, Dean N. Predicting risk of drug-resistant organisms in pneumonia: moving beyond the HCAP model. Respir Med. 2015;109(1):1-10. PubMed
© 2017 Society of Hospital Medicine
Visual Tools to Increase Patient Satisfaction: Just Decorative or Actually Effective?
Patient satisfaction and the ability to effectively communicate with hospitalized patients has become a core tenet to providing high-quality healthcare. Over the past few decades, medicine has gradually moved away from many paternalistic practices, and the profession has sought to engage patients as true partners in their own care. It is in this setting that effective communication has risen to be a key factor in the patient and provider relationship. It has also become a closely monitored quality metric tied to financial incentives and penalties. Most importantly, it has been well documented that failures in communication are a frequent cause of adverse events that compromise the ability of healthcare providers to provide safe and effective care.1 It is in this climate that healthcare systems have worked to implement solutions designed to engage patients and their families to improve their healthcare experience. These solutions vary from low to high tech and include patient whiteboards, provider face cards, and web-based patient portals. Despite the numerous innovative solutions being implemented by hospitalists, studies supporting their effectiveness are few. There continues to be limited evidence on the value of these practices and whether they positively impact the desired outcomes of patient satisfaction and engagement.
In this issue of the Journal of Hospital Medicine, Goyal et al.2 performed a systematic review to evaluate whether the use of bedside visual tools for hospitalized medical patients impacts patient satisfaction, patient–provider communication, and provider identification and understanding of roles. The authors were able to identify 16 studies that evaluated the use of these tools, which included provider face cards and whiteboards. The majority of the studies reviewed showed a positive effect on provider identification, understanding providers’ role, and patient satisfaction. The authors found that of the tools evaluated, whiteboards and picture-based techniques were the most effective visually based interventions. However, the authors also highlighted the difficulty in identifying 1 optimal approach to the use of these tools as a result of variations in content, format, and outcome measurement.
Variation in the use of visual tools to improve communication and patient satisfaction limits the ability to identify and evaluate the most effective approaches to their use. Without a streamlined approach, these tools may not produce the desired effect of improving patient and provider communication, which is essential in providing high-quality inpatient care and ensuring patient satisfaction. It has been documented that many patients cannot even identify their providers in the hospital setting, which limits the ability of the patient to be fully engaged in decisions made about their care.3 In addition, substantial portions of hospitalized patients do not understand their plan of care.4 Patients’ understanding of their plan of care is essential for patients to provide informed consent for hospital treatments and better prepare them to assume their own care after discharge, with a full understanding of their diagnosis.5 It has become increasingly clear that healthcare providers must incorporate effective approaches in their daily workflow to address these findings.
Aside from patient satisfaction and engagement, the effect communications failures have on patient safety have been evaluated and recognized. From the National Academy of Medicine’s report emphasizing patient-centered care to the addition of patients’ active engagement in their care as a National Patient Safety Goal by The Joint Commission, the medical field has committed to a continued focus in this area.5,6
The business case can also be made for identifying effective tools that improve patient satisfaction and patient–provider communication. Private and public health insurance providers have incentivized high performance in these areas and have now begun to levy penalties for underperformers. As patients’ level of satisfaction and engagement continue to be assessed via patient surveys, healthcare systems continue to search for effective practices to improve performance in patient-perceived provider communication. Patients’ reporting of their assessment of nurse and physician communication through questions such as “How often did nurses/doctors explain things in a way you could understand?” will continue to be a moving target requiring future studies of effective interventions
Are visual aids the effective tools that hospitals need to improve communication and patient satisfaction, or are they merely decorations? The whiteboard provides an excellent example of the effectiveness that can be seen with the use of these tools. Used to improve patient-provider communication in medicine, the whiteboard has become almost ubiquitous in patient hospital rooms.7 It is now an expected aspect of hospital design and has inspired the development of higher tech solutions, including patient tablets and media walls. It is known to enhance the interaction for both the provider and patient and facilitate the exchange of complicated medical information within an anxiety prone environment in a simple manner by using short phrases or drawings.6 Yet, there is a scarcity of strong evidence to support the most effective approach to the use of whiteboards in improving patient satisfaction and communication. Standardizing how the whiteboard is used during the patient interaction will allow for the effectiveness of this tool to be realized and evaluated and prevent it from becoming another ornamental fixture on our hospital walls.
The systematic review by Goyal et al.2 is a necessary step in the evaluation of common communication tools for their effectiveness and ability to improve patient satisfaction. This exhaustive review of key studies in this area is an excellent addition to the current literature, which has a paucity of extensive evaluations of these approaches. It provides an important signal that visual tools are more than decorative and can be effective when a streamlined approach is utilized. It highlights the importance of identifying effective best practices for the use of these tools that can be studied empirically and subsequently disseminated for widespread use. Continued work is necessary to fill this void and to enable healthcare professionals to provide the highest level of safe, effective, and engaging care that our patients deserve.
Disclosure
The authors have no conflicts of interest.
1. Sutcliffe KM, Lewton E, Rosenthal MM. Communication failures: an insidious contributor to medical mishaps. Acad Med. 2004;79(2):186-194. PubMed
2. Goyal AA, Komalpreet T, Mann J, Townsend W, Flanders SA, Chopra V. Do bedside visual tools improve patient and caregiver satisfaction? A systematic review of the literature. J Hosp Med. 2017. In press. PubMed
3. Makaryus AN, Friedman EA. Does your patient know your name? An approach to enhancing patients’ awareness of their caretaker’s name. J Healthc Qual. 2005;27(4):53-56. PubMed
4. O’Leary KJ, Kulkarni N, Landler MP, et al. Hospitalized patients’ understanding of their plan of care. Mayo Clin Proc.2010;85(1):47-52. PubMed
5. Committee on Quality of Health Care in America. Crossing the Quality Chasm: A New Health System for the 21st Century. [Internet] Washington, DC: National Academy Press; 2001. 8 p. http://www.nationalacademies.org/hmd/~/media/Files/Report%20Files/2001/Crossing-the-Quality-Chasm/Quality%20Chasm%202001%20%20report%20brief.pdf. Accessed on
6. The Joint Commission’s National Patient Safety Goals 2007 for Hospital/Critical Access Hospital. http://www.jointcommission.org/PatientSafety/NationalPatientSafetyGoals/07_hap_cah_npsgs.htm. Accessed on July 2017.
7. Singh S, Fletcher KE, Pandl GJ, et al. It’s the writing on the wall: whiteboards improve inpatient satisfaction with provider communication. Am J Med Qual.2011;26(2):127-131. PubMed
Patient satisfaction and the ability to effectively communicate with hospitalized patients has become a core tenet to providing high-quality healthcare. Over the past few decades, medicine has gradually moved away from many paternalistic practices, and the profession has sought to engage patients as true partners in their own care. It is in this setting that effective communication has risen to be a key factor in the patient and provider relationship. It has also become a closely monitored quality metric tied to financial incentives and penalties. Most importantly, it has been well documented that failures in communication are a frequent cause of adverse events that compromise the ability of healthcare providers to provide safe and effective care.1 It is in this climate that healthcare systems have worked to implement solutions designed to engage patients and their families to improve their healthcare experience. These solutions vary from low to high tech and include patient whiteboards, provider face cards, and web-based patient portals. Despite the numerous innovative solutions being implemented by hospitalists, studies supporting their effectiveness are few. There continues to be limited evidence on the value of these practices and whether they positively impact the desired outcomes of patient satisfaction and engagement.
In this issue of the Journal of Hospital Medicine, Goyal et al.2 performed a systematic review to evaluate whether the use of bedside visual tools for hospitalized medical patients impacts patient satisfaction, patient–provider communication, and provider identification and understanding of roles. The authors were able to identify 16 studies that evaluated the use of these tools, which included provider face cards and whiteboards. The majority of the studies reviewed showed a positive effect on provider identification, understanding providers’ role, and patient satisfaction. The authors found that of the tools evaluated, whiteboards and picture-based techniques were the most effective visually based interventions. However, the authors also highlighted the difficulty in identifying 1 optimal approach to the use of these tools as a result of variations in content, format, and outcome measurement.
Variation in the use of visual tools to improve communication and patient satisfaction limits the ability to identify and evaluate the most effective approaches to their use. Without a streamlined approach, these tools may not produce the desired effect of improving patient and provider communication, which is essential in providing high-quality inpatient care and ensuring patient satisfaction. It has been documented that many patients cannot even identify their providers in the hospital setting, which limits the ability of the patient to be fully engaged in decisions made about their care.3 In addition, substantial portions of hospitalized patients do not understand their plan of care.4 Patients’ understanding of their plan of care is essential for patients to provide informed consent for hospital treatments and better prepare them to assume their own care after discharge, with a full understanding of their diagnosis.5 It has become increasingly clear that healthcare providers must incorporate effective approaches in their daily workflow to address these findings.
Aside from patient satisfaction and engagement, the effect communications failures have on patient safety have been evaluated and recognized. From the National Academy of Medicine’s report emphasizing patient-centered care to the addition of patients’ active engagement in their care as a National Patient Safety Goal by The Joint Commission, the medical field has committed to a continued focus in this area.5,6
The business case can also be made for identifying effective tools that improve patient satisfaction and patient–provider communication. Private and public health insurance providers have incentivized high performance in these areas and have now begun to levy penalties for underperformers. As patients’ level of satisfaction and engagement continue to be assessed via patient surveys, healthcare systems continue to search for effective practices to improve performance in patient-perceived provider communication. Patients’ reporting of their assessment of nurse and physician communication through questions such as “How often did nurses/doctors explain things in a way you could understand?” will continue to be a moving target requiring future studies of effective interventions
Are visual aids the effective tools that hospitals need to improve communication and patient satisfaction, or are they merely decorations? The whiteboard provides an excellent example of the effectiveness that can be seen with the use of these tools. Used to improve patient-provider communication in medicine, the whiteboard has become almost ubiquitous in patient hospital rooms.7 It is now an expected aspect of hospital design and has inspired the development of higher tech solutions, including patient tablets and media walls. It is known to enhance the interaction for both the provider and patient and facilitate the exchange of complicated medical information within an anxiety prone environment in a simple manner by using short phrases or drawings.6 Yet, there is a scarcity of strong evidence to support the most effective approach to the use of whiteboards in improving patient satisfaction and communication. Standardizing how the whiteboard is used during the patient interaction will allow for the effectiveness of this tool to be realized and evaluated and prevent it from becoming another ornamental fixture on our hospital walls.
The systematic review by Goyal et al.2 is a necessary step in the evaluation of common communication tools for their effectiveness and ability to improve patient satisfaction. This exhaustive review of key studies in this area is an excellent addition to the current literature, which has a paucity of extensive evaluations of these approaches. It provides an important signal that visual tools are more than decorative and can be effective when a streamlined approach is utilized. It highlights the importance of identifying effective best practices for the use of these tools that can be studied empirically and subsequently disseminated for widespread use. Continued work is necessary to fill this void and to enable healthcare professionals to provide the highest level of safe, effective, and engaging care that our patients deserve.
Disclosure
The authors have no conflicts of interest.
Patient satisfaction and the ability to effectively communicate with hospitalized patients has become a core tenet to providing high-quality healthcare. Over the past few decades, medicine has gradually moved away from many paternalistic practices, and the profession has sought to engage patients as true partners in their own care. It is in this setting that effective communication has risen to be a key factor in the patient and provider relationship. It has also become a closely monitored quality metric tied to financial incentives and penalties. Most importantly, it has been well documented that failures in communication are a frequent cause of adverse events that compromise the ability of healthcare providers to provide safe and effective care.1 It is in this climate that healthcare systems have worked to implement solutions designed to engage patients and their families to improve their healthcare experience. These solutions vary from low to high tech and include patient whiteboards, provider face cards, and web-based patient portals. Despite the numerous innovative solutions being implemented by hospitalists, studies supporting their effectiveness are few. There continues to be limited evidence on the value of these practices and whether they positively impact the desired outcomes of patient satisfaction and engagement.
In this issue of the Journal of Hospital Medicine, Goyal et al.2 performed a systematic review to evaluate whether the use of bedside visual tools for hospitalized medical patients impacts patient satisfaction, patient–provider communication, and provider identification and understanding of roles. The authors were able to identify 16 studies that evaluated the use of these tools, which included provider face cards and whiteboards. The majority of the studies reviewed showed a positive effect on provider identification, understanding providers’ role, and patient satisfaction. The authors found that of the tools evaluated, whiteboards and picture-based techniques were the most effective visually based interventions. However, the authors also highlighted the difficulty in identifying 1 optimal approach to the use of these tools as a result of variations in content, format, and outcome measurement.
Variation in the use of visual tools to improve communication and patient satisfaction limits the ability to identify and evaluate the most effective approaches to their use. Without a streamlined approach, these tools may not produce the desired effect of improving patient and provider communication, which is essential in providing high-quality inpatient care and ensuring patient satisfaction. It has been documented that many patients cannot even identify their providers in the hospital setting, which limits the ability of the patient to be fully engaged in decisions made about their care.3 In addition, substantial portions of hospitalized patients do not understand their plan of care.4 Patients’ understanding of their plan of care is essential for patients to provide informed consent for hospital treatments and better prepare them to assume their own care after discharge, with a full understanding of their diagnosis.5 It has become increasingly clear that healthcare providers must incorporate effective approaches in their daily workflow to address these findings.
Aside from patient satisfaction and engagement, the effect communications failures have on patient safety have been evaluated and recognized. From the National Academy of Medicine’s report emphasizing patient-centered care to the addition of patients’ active engagement in their care as a National Patient Safety Goal by The Joint Commission, the medical field has committed to a continued focus in this area.5,6
The business case can also be made for identifying effective tools that improve patient satisfaction and patient–provider communication. Private and public health insurance providers have incentivized high performance in these areas and have now begun to levy penalties for underperformers. As patients’ level of satisfaction and engagement continue to be assessed via patient surveys, healthcare systems continue to search for effective practices to improve performance in patient-perceived provider communication. Patients’ reporting of their assessment of nurse and physician communication through questions such as “How often did nurses/doctors explain things in a way you could understand?” will continue to be a moving target requiring future studies of effective interventions
Are visual aids the effective tools that hospitals need to improve communication and patient satisfaction, or are they merely decorations? The whiteboard provides an excellent example of the effectiveness that can be seen with the use of these tools. Used to improve patient-provider communication in medicine, the whiteboard has become almost ubiquitous in patient hospital rooms.7 It is now an expected aspect of hospital design and has inspired the development of higher tech solutions, including patient tablets and media walls. It is known to enhance the interaction for both the provider and patient and facilitate the exchange of complicated medical information within an anxiety prone environment in a simple manner by using short phrases or drawings.6 Yet, there is a scarcity of strong evidence to support the most effective approach to the use of whiteboards in improving patient satisfaction and communication. Standardizing how the whiteboard is used during the patient interaction will allow for the effectiveness of this tool to be realized and evaluated and prevent it from becoming another ornamental fixture on our hospital walls.
The systematic review by Goyal et al.2 is a necessary step in the evaluation of common communication tools for their effectiveness and ability to improve patient satisfaction. This exhaustive review of key studies in this area is an excellent addition to the current literature, which has a paucity of extensive evaluations of these approaches. It provides an important signal that visual tools are more than decorative and can be effective when a streamlined approach is utilized. It highlights the importance of identifying effective best practices for the use of these tools that can be studied empirically and subsequently disseminated for widespread use. Continued work is necessary to fill this void and to enable healthcare professionals to provide the highest level of safe, effective, and engaging care that our patients deserve.
Disclosure
The authors have no conflicts of interest.
1. Sutcliffe KM, Lewton E, Rosenthal MM. Communication failures: an insidious contributor to medical mishaps. Acad Med. 2004;79(2):186-194. PubMed
2. Goyal AA, Komalpreet T, Mann J, Townsend W, Flanders SA, Chopra V. Do bedside visual tools improve patient and caregiver satisfaction? A systematic review of the literature. J Hosp Med. 2017. In press. PubMed
3. Makaryus AN, Friedman EA. Does your patient know your name? An approach to enhancing patients’ awareness of their caretaker’s name. J Healthc Qual. 2005;27(4):53-56. PubMed
4. O’Leary KJ, Kulkarni N, Landler MP, et al. Hospitalized patients’ understanding of their plan of care. Mayo Clin Proc.2010;85(1):47-52. PubMed
5. Committee on Quality of Health Care in America. Crossing the Quality Chasm: A New Health System for the 21st Century. [Internet] Washington, DC: National Academy Press; 2001. 8 p. http://www.nationalacademies.org/hmd/~/media/Files/Report%20Files/2001/Crossing-the-Quality-Chasm/Quality%20Chasm%202001%20%20report%20brief.pdf. Accessed on
6. The Joint Commission’s National Patient Safety Goals 2007 for Hospital/Critical Access Hospital. http://www.jointcommission.org/PatientSafety/NationalPatientSafetyGoals/07_hap_cah_npsgs.htm. Accessed on July 2017.
7. Singh S, Fletcher KE, Pandl GJ, et al. It’s the writing on the wall: whiteboards improve inpatient satisfaction with provider communication. Am J Med Qual.2011;26(2):127-131. PubMed
1. Sutcliffe KM, Lewton E, Rosenthal MM. Communication failures: an insidious contributor to medical mishaps. Acad Med. 2004;79(2):186-194. PubMed
2. Goyal AA, Komalpreet T, Mann J, Townsend W, Flanders SA, Chopra V. Do bedside visual tools improve patient and caregiver satisfaction? A systematic review of the literature. J Hosp Med. 2017. In press. PubMed
3. Makaryus AN, Friedman EA. Does your patient know your name? An approach to enhancing patients’ awareness of their caretaker’s name. J Healthc Qual. 2005;27(4):53-56. PubMed
4. O’Leary KJ, Kulkarni N, Landler MP, et al. Hospitalized patients’ understanding of their plan of care. Mayo Clin Proc.2010;85(1):47-52. PubMed
5. Committee on Quality of Health Care in America. Crossing the Quality Chasm: A New Health System for the 21st Century. [Internet] Washington, DC: National Academy Press; 2001. 8 p. http://www.nationalacademies.org/hmd/~/media/Files/Report%20Files/2001/Crossing-the-Quality-Chasm/Quality%20Chasm%202001%20%20report%20brief.pdf. Accessed on
6. The Joint Commission’s National Patient Safety Goals 2007 for Hospital/Critical Access Hospital. http://www.jointcommission.org/PatientSafety/NationalPatientSafetyGoals/07_hap_cah_npsgs.htm. Accessed on July 2017.
7. Singh S, Fletcher KE, Pandl GJ, et al. It’s the writing on the wall: whiteboards improve inpatient satisfaction with provider communication. Am J Med Qual.2011;26(2):127-131. PubMed
© 2017 Society of Hospital Medicine