User login
Atraumatic splenic rupture as an initial presentation of chronic myelogenous leukemia
Chronic myelogenous leukemia (CML) is a myeloproliferative neoplasm associated with the fusion of the BCR gene located on chromosome 22 and the ABL1 gene on chromosome 9. The fusion results in a reciprocal translocation between chromosomes 9 and 22, leading to the formation of the Philadelphia (Ph) chromosome found in 90%-95% of patients with CML. The incidence of CML is 1.5 per 100,000 people per year, with a male predominance and an average age at diagnosis of 64.1
About 85%-90% of newly diagnosed patients present in the chronic phase and therefore many of them are asymptomatic at the time of diagnosis. If symptoms are present, they often include fatigue, malaise, unintentional weight loss, early satiety, or left upper quadrant pain. Progression of the disease is associated with worsening symptoms such as unexplained fever, significant weight loss, bone or joint pain, bleeding, thrombosis, and infections suggestive of transformation to the accelerated phase or blast crisis. Physical exam findings most commonly include splenomegaly and occasionally mild hepatomegaly.
Atraumatic splenic rupture is a rare complication of this hematologic malignancy, and there are almost no reported cases of CML as the underlying cause.2-4 Here we present the case of a man with sudden-onset generalized abdominal pain and leukocytosis. A computed-tomography scan showed splenic rupture, and the patient was taken for emergency splenectomy. The patient was subsequently positive for t(9,22)(q34;q11.2).
Case presentation and summary
A 59-year-old white man with a history of hypertension and kidney stones presented to a community emergency department with a chief complaint of abdominal pain. About 30 minutes before his arrival, the patient had woken up from sleep with generalized, nonradiating, abdominal pain, which he described as “like my previous kidney stones.” He also reported worsening dyspnea, nausea without vomiting, and lightheadedness without loss of consciousness. The remainder of the review of systems was negative. A physical exam revealed that he was in moderate distress with clear lung fields and had tachycardia without murmur, no CVA tenderness, and a diffusely tender abdomen.
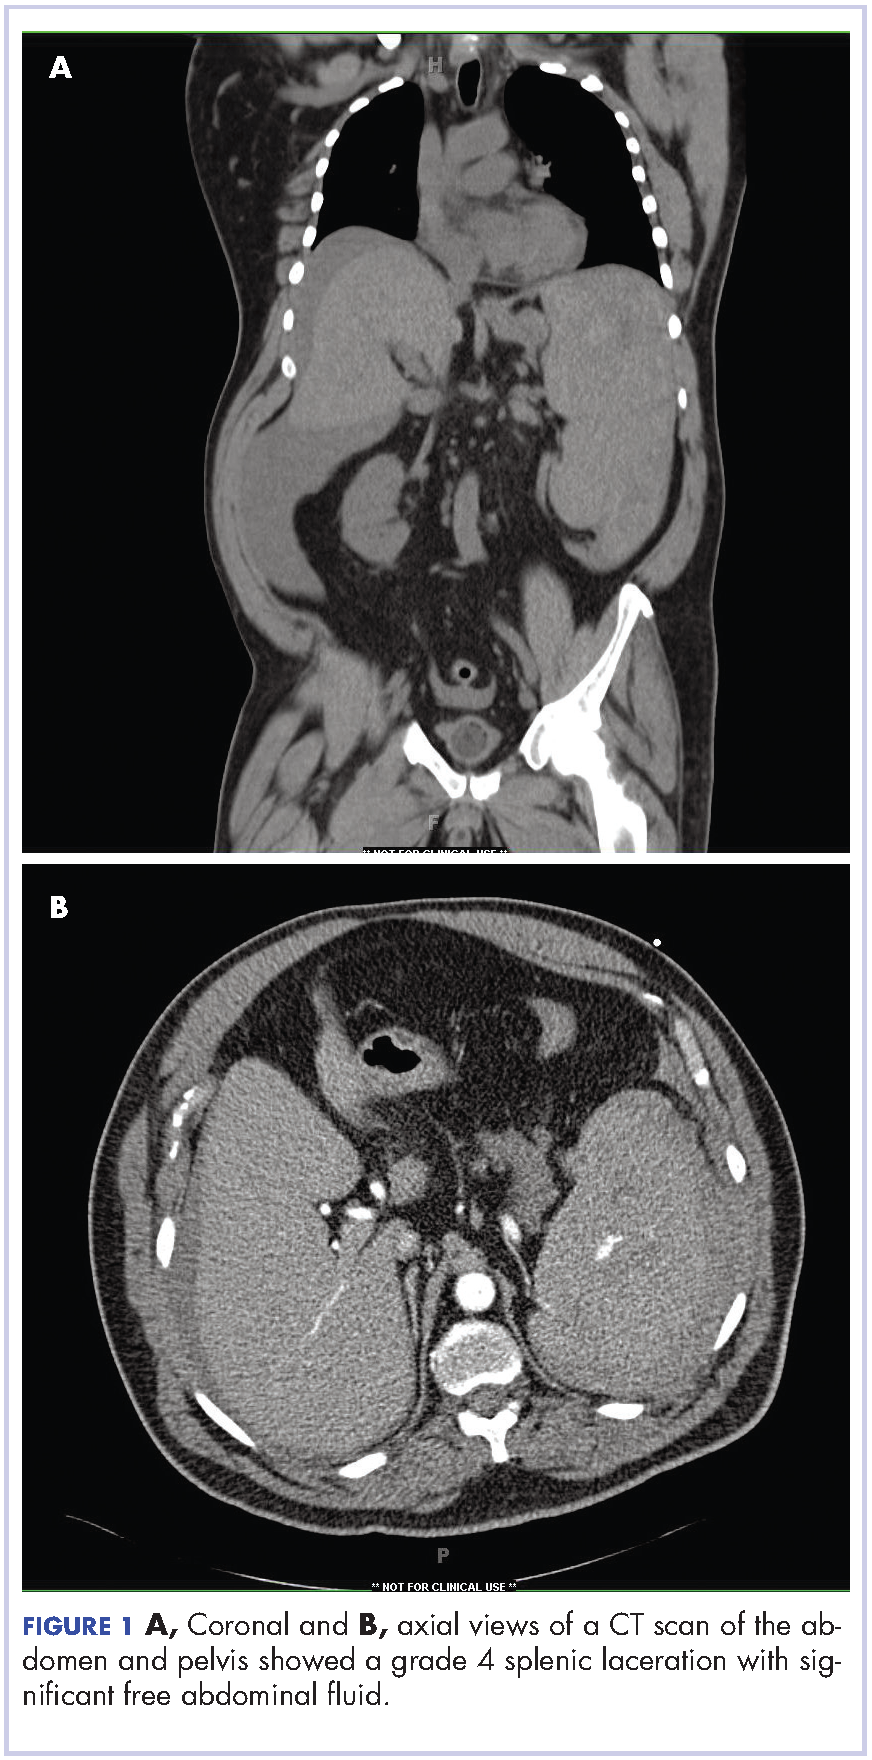
Complete blood count with differential showed leukocytosis (109.1 x 10³/uL), normocytic anemia (8.1 g/dL), thrombocytopenia (100,000 cells/uL), neutrophils (71.06 cells/uL), bands (27.13 cells/uL), and monocytes (11.63 cells/uL). A CT scan of the abdomen and pelvis showed a grade 4 splenic laceration with significant free abdominal fluid (Figure 1).
The patient was taken to the operating room where he underwent a splenectomy which was complicated by partial gastrectomy and partial omentectomy. He remained intubated on mechanical ventilation in the intensive care for 7 days. His progress was complicated by profound hypotension that required significant fluid administration and ultimately multiple pressors for blood pressure support. Hypotensive shock was beginning to improve on day 3 and was completely resolved by day 5. The patient underwent continuous positive airway pressure (CPAP) trials on day 6 and was successfully extubated on day 7.
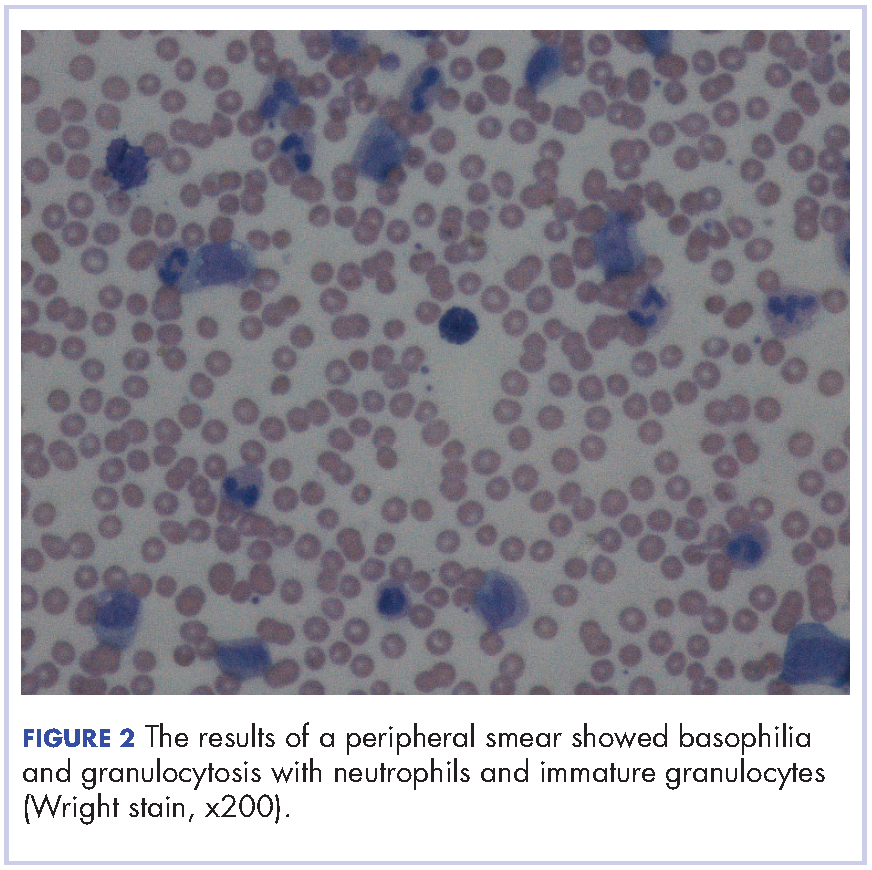
After extubation a more thorough history could be obtained from the patient. He denied any history of weight loss, night sweats, or fatigue. Patient denied any known family history of hematologic malignancies. His peripheral smear showed basophilia and granulocytosis with neutrophils and immature granulocytes (Figure 2). The patient was evaluated by the hematology service and was started on allopurinol and hydroxyurea for presumed hematologic malignancy. He was given the meningococcus and streptococcus pneumoniae vaccine and was discharged home in stable condition on day eleven. Patient was subsequently positive for t(9,22)(q34;q11.2) and was started on imatinib. He has continued to follow in the clinic and is currently in remission.
Discussion
CML has a triphasic clinical course and treatment is based on the specific disease phase. The 3 phases of the disease include the chronic (more indolent) phase, accelerated (more aggressive) phase, and blast crisis. If the disease is left untreated, it will inevitably transition from a chronic to an accelerated phase and finally to blast crisis within a median time of 4 years.
The chronic phase is the most common, representing 85% of diagnoses. Patients can be asymptomatic and many in this phase will be diagnosed by routine lab testing.5 According to the World Health Organization, the accelerated phase is defined as CML patients with one of the following: 10%-19% blasts, basophils ≥20%, platelets <100,000/microL or >1,000,000/microL, unresponsive to therapy, splenomegaly unresponsive to therapy, an increasing white cell count unresponsive to therapy, or cytogenetic evolution.6 Blast crisis is the most aggressive phase and is usually defined by ≥20% blasts, large foci or clusters of blasts on the bone marrow biopsy, or the presence of extramedullary blastic infiltrates.7,8
The diagnosis of CML should be suspected in the presence of distinct lab abnormalities in the peripheral blood. These include elevated white blood cell counts with a median count of 100,000 cells/microL, elevated platelet counts, and a mild normocytic normochromic anemia. Platelet counts of 600,000 or greater have been seen in 15%-30% of patients at the time of diagnosis. The white count differential can show a variety of cells but there will be a notably greater percentage of myelocytes than metamyelocytes. Bone marrow biopsy will reveal increased cellularity, normal to slightly elevated percentage of blasts, and reticulin fibrosis. The diagnosis should be confirmed by the presence of the Philadelphia chromosome either by cytogenetics, fluorescence in situ hybridization, or reverse-transcription polymerase chain reaction (RT-PCR). The Philadelphia chromosome is found in 90%-95% of patients with CML. Most of the remaining patients will have other translocations, but a small minority will have no detectable genetic abnormalities and those patients are known as Ph-negative.9
Treatment options for CML include potential cure with allogeneic hematopoietic stem-cell transplant (HSCT) or disease control using tyrosine kinase inhibitors (TKIs). TKIs are the initial treatment of choice for newly diagnosed patients and are able to produce long-term remission in most patients. The drugs in this category include imatinib, dasatinib, and nilotinib. They work by inhibiting the Bcr-Abl tyrosine kinase, thereby blocking proliferation and inducing apoptosis in Bcr-Abl-positive cells. The majority of patients with chronic-phase CML will have an excellent response to initial treatment with a TKI. It is critical to follow these patients on a regular basis and monitor their disease status. Although the gold standard for assessing cytogenetic response is cytogenetic analysis of a bone marrow biopsy, more sensitive methods such as quantitative PCR using peripheral blood are now available, thereby minimizing the need for bone marrow biopsy. Patients in the accelerated phase are more difficult to manage because they are resistant to most forms of treatment and have short-lived responses to TKI therapy. These patients should strongly be considered for transplantation. Patients in blast crisis have aggressive disease that is more complex and requires more extensive testing. These patients should ideally be treated at tertiary care centers and treatment often involves chemotherapy in addition to TKI therapy usually followed by HSCT.
Atraumatic splenic rupture (ASR) presents similarly to traumatic splenic rupture with typical symptoms being acute onset of upper abdominal, left chest wall, or left shoulder pain (Kehr’s sign) but without a known history of trauma. Quick recognition and surgical intervention represent the best means of definitive care.10 Renzulli and colleagues conducted a literature review for all ASR cases from 1980-2008, examining 632 publications representing 845 cases. They examined the cases using logistic regression analysis to better define the clinicopathology behind ASR. The reported causes of ASR are neoplastic processes (30.3%), infectious (27.3%), inflammatory noninfectious (20.0%), drug- and treatment-related (9.2%), mechanical (6.8%), and normal spleen (6.4%). Treatment included total splenectomy in 84.1% of cases, organ-preserving surgery in 1.2%, and conservative measures in 14.7%. They reported an ASR-related mortality of 12.2%, with being older than 40 and neoplastic disorders associated with increased mortality – although male sex and splenomegaly have also been reported.11-13 Thomas and colleagues have reported on 48 cases of ASR related to hematologic malignancy showing acute myeloid leukemia being the most common cause (21%), followed by acute lymphoblastic leukemia (19%).2
Hematologic malignancies commonly cause splenic engorgement and pain although splenic rupture is an extremely rare event. Recent literature review has shown fewer than a thousand reported cases since 1980.4 There far fewer reported cases of ASR being related to CML, with most being reported as a complication.3,14 Based on our review, we could identify only a handful cases of CML with ASR being the initial symptom. These include a patient with Ph-negative CML and ASR following blast crisis, a patient with Phil-negative BCR-ABL-positive essential thrombocythemia, several cases in which the patient ultimately died, and 1 in which the patient survived into remission.4,14-16 Our case is different because the patient was ultimately positive for t(9,22)(q34;q11.2) and although he experienced multiple complications, he is currently functioning at his baseline and in remission. We hope this case will remind others that CML should be considered in the differential diagnosis of patients ASR.
1. American Cancer Society. Cancer Facts & Figures 2015. Atlanta, Ga: American Cancer Society; 2015.
2. Bauer TW, Haskins GE, Armitage JO. Splenic rupture in patients with hematologic malignancies. Cancer. 1981;48:2729-2733.
3. Giagounidis AA, Burk M, Meckenstock G, Koch AJ, Schneider W. Pathologic rupture of the spleen in hematologic malignancies: two additional cases. Ann Hematol. 1996;73(6):297-302.
4. Goodard SL, Chesney AE, Reis MD, et al. Pathologic splenic rupture: a rare complication of chronic myelomonocytic leukemia. Am J Hematology. 2007;82:405-408.
5. Faderl S, Talpaz M, Estrov Z, et al. The biology of chronic myeloid leukemia. N Engl J Med. 1999;341:164-172.
6. Cortes JE, Talpaz M, O’Brien S, et al. Staging of chronic myeloid leukemia in the imatinib era: an evaluation of the World Health Organization proposal. Cancer. 2006;106:1306-1315.
7. Vardiman JW, Harris NL, Brunning RD. The World Health Organization (WHO) classification of the myeloid neoplasms. Blood. 2002;100:2292-2302.
8. Kantarjian HM, O’Brien S, Cortes J, et al. Results of decitabine (5-aza-2’deoxycytidine) therapy in 130 patients with chronic myelogenous leukemia. Cancer.2003; 98:522-528.
9. Swerdlow SH, Campo E, Harris NL, et al, editors. WHO classification of tumours of haematopoietic and lymphoid tissues. Lyon, France: IARC Press; 2008.
10. Maung A, KaplanL. Management of splenic injury in the adult trauma patient. In: UpToDate, Basow DS (ed), Waltham, MA, 2013.
11. Renzulli P, Hostettler A, Schoepfer AM, Gloor B, Candinas D. Systematic review of atraumatic splenic rupture. Br J Surg. 2009;8(10):1114-1121.
12. Hehlmann R, Heimpel H, Hasford J, et al. Randomized comparison of interferon-alpha with busulfan and hydroxyurea in chronic myelogenous leukemia. The German CML Study Group. Blood. 1994;84:4064-4077.
13. Cortes J, Kantarjian H. How I treat newly diagnosed chronic phase CML. Blood. 2012;120:1390-1397.
14. Nestok BR, Goldstein JD, Lipkovic P. Splenic rupture as a cause of sudden death in undiagnosed chronic myelogenous leukemia. Am J Forensic Med Pathol. 1988;9:241-245.
15. Sachithanandan A, Gleadhil I, Alexander HD, Morris TC. Spontaneous splenic rupture in atypical (Philadelphia chromosome negative) chronic myeloid leukemia following blastic crisis. Ir Med J. 2003;96(6):181-182.
16. Chim CS, Kwong YL, Shek TW, Ma SK, Ooi GC. Splenic rupture as the presenting symptom of blastic crisis in a patient with Philadelphia-negative, BCR-ABL-positive ET. Am J Hematology. 2001;66:70-71.
Chronic myelogenous leukemia (CML) is a myeloproliferative neoplasm associated with the fusion of the BCR gene located on chromosome 22 and the ABL1 gene on chromosome 9. The fusion results in a reciprocal translocation between chromosomes 9 and 22, leading to the formation of the Philadelphia (Ph) chromosome found in 90%-95% of patients with CML. The incidence of CML is 1.5 per 100,000 people per year, with a male predominance and an average age at diagnosis of 64.1
About 85%-90% of newly diagnosed patients present in the chronic phase and therefore many of them are asymptomatic at the time of diagnosis. If symptoms are present, they often include fatigue, malaise, unintentional weight loss, early satiety, or left upper quadrant pain. Progression of the disease is associated with worsening symptoms such as unexplained fever, significant weight loss, bone or joint pain, bleeding, thrombosis, and infections suggestive of transformation to the accelerated phase or blast crisis. Physical exam findings most commonly include splenomegaly and occasionally mild hepatomegaly.
Atraumatic splenic rupture is a rare complication of this hematologic malignancy, and there are almost no reported cases of CML as the underlying cause.2-4 Here we present the case of a man with sudden-onset generalized abdominal pain and leukocytosis. A computed-tomography scan showed splenic rupture, and the patient was taken for emergency splenectomy. The patient was subsequently positive for t(9,22)(q34;q11.2).
Case presentation and summary
A 59-year-old white man with a history of hypertension and kidney stones presented to a community emergency department with a chief complaint of abdominal pain. About 30 minutes before his arrival, the patient had woken up from sleep with generalized, nonradiating, abdominal pain, which he described as “like my previous kidney stones.” He also reported worsening dyspnea, nausea without vomiting, and lightheadedness without loss of consciousness. The remainder of the review of systems was negative. A physical exam revealed that he was in moderate distress with clear lung fields and had tachycardia without murmur, no CVA tenderness, and a diffusely tender abdomen.
Complete blood count with differential showed leukocytosis (109.1 x 10³/uL), normocytic anemia (8.1 g/dL), thrombocytopenia (100,000 cells/uL), neutrophils (71.06 cells/uL), bands (27.13 cells/uL), and monocytes (11.63 cells/uL). A CT scan of the abdomen and pelvis showed a grade 4 splenic laceration with significant free abdominal fluid (Figure 1).
The patient was taken to the operating room where he underwent a splenectomy which was complicated by partial gastrectomy and partial omentectomy. He remained intubated on mechanical ventilation in the intensive care for 7 days. His progress was complicated by profound hypotension that required significant fluid administration and ultimately multiple pressors for blood pressure support. Hypotensive shock was beginning to improve on day 3 and was completely resolved by day 5. The patient underwent continuous positive airway pressure (CPAP) trials on day 6 and was successfully extubated on day 7.
After extubation a more thorough history could be obtained from the patient. He denied any history of weight loss, night sweats, or fatigue. Patient denied any known family history of hematologic malignancies. His peripheral smear showed basophilia and granulocytosis with neutrophils and immature granulocytes (Figure 2). The patient was evaluated by the hematology service and was started on allopurinol and hydroxyurea for presumed hematologic malignancy. He was given the meningococcus and streptococcus pneumoniae vaccine and was discharged home in stable condition on day eleven. Patient was subsequently positive for t(9,22)(q34;q11.2) and was started on imatinib. He has continued to follow in the clinic and is currently in remission.
Discussion
CML has a triphasic clinical course and treatment is based on the specific disease phase. The 3 phases of the disease include the chronic (more indolent) phase, accelerated (more aggressive) phase, and blast crisis. If the disease is left untreated, it will inevitably transition from a chronic to an accelerated phase and finally to blast crisis within a median time of 4 years.
The chronic phase is the most common, representing 85% of diagnoses. Patients can be asymptomatic and many in this phase will be diagnosed by routine lab testing.5 According to the World Health Organization, the accelerated phase is defined as CML patients with one of the following: 10%-19% blasts, basophils ≥20%, platelets <100,000/microL or >1,000,000/microL, unresponsive to therapy, splenomegaly unresponsive to therapy, an increasing white cell count unresponsive to therapy, or cytogenetic evolution.6 Blast crisis is the most aggressive phase and is usually defined by ≥20% blasts, large foci or clusters of blasts on the bone marrow biopsy, or the presence of extramedullary blastic infiltrates.7,8
The diagnosis of CML should be suspected in the presence of distinct lab abnormalities in the peripheral blood. These include elevated white blood cell counts with a median count of 100,000 cells/microL, elevated platelet counts, and a mild normocytic normochromic anemia. Platelet counts of 600,000 or greater have been seen in 15%-30% of patients at the time of diagnosis. The white count differential can show a variety of cells but there will be a notably greater percentage of myelocytes than metamyelocytes. Bone marrow biopsy will reveal increased cellularity, normal to slightly elevated percentage of blasts, and reticulin fibrosis. The diagnosis should be confirmed by the presence of the Philadelphia chromosome either by cytogenetics, fluorescence in situ hybridization, or reverse-transcription polymerase chain reaction (RT-PCR). The Philadelphia chromosome is found in 90%-95% of patients with CML. Most of the remaining patients will have other translocations, but a small minority will have no detectable genetic abnormalities and those patients are known as Ph-negative.9
Treatment options for CML include potential cure with allogeneic hematopoietic stem-cell transplant (HSCT) or disease control using tyrosine kinase inhibitors (TKIs). TKIs are the initial treatment of choice for newly diagnosed patients and are able to produce long-term remission in most patients. The drugs in this category include imatinib, dasatinib, and nilotinib. They work by inhibiting the Bcr-Abl tyrosine kinase, thereby blocking proliferation and inducing apoptosis in Bcr-Abl-positive cells. The majority of patients with chronic-phase CML will have an excellent response to initial treatment with a TKI. It is critical to follow these patients on a regular basis and monitor their disease status. Although the gold standard for assessing cytogenetic response is cytogenetic analysis of a bone marrow biopsy, more sensitive methods such as quantitative PCR using peripheral blood are now available, thereby minimizing the need for bone marrow biopsy. Patients in the accelerated phase are more difficult to manage because they are resistant to most forms of treatment and have short-lived responses to TKI therapy. These patients should strongly be considered for transplantation. Patients in blast crisis have aggressive disease that is more complex and requires more extensive testing. These patients should ideally be treated at tertiary care centers and treatment often involves chemotherapy in addition to TKI therapy usually followed by HSCT.
Atraumatic splenic rupture (ASR) presents similarly to traumatic splenic rupture with typical symptoms being acute onset of upper abdominal, left chest wall, or left shoulder pain (Kehr’s sign) but without a known history of trauma. Quick recognition and surgical intervention represent the best means of definitive care.10 Renzulli and colleagues conducted a literature review for all ASR cases from 1980-2008, examining 632 publications representing 845 cases. They examined the cases using logistic regression analysis to better define the clinicopathology behind ASR. The reported causes of ASR are neoplastic processes (30.3%), infectious (27.3%), inflammatory noninfectious (20.0%), drug- and treatment-related (9.2%), mechanical (6.8%), and normal spleen (6.4%). Treatment included total splenectomy in 84.1% of cases, organ-preserving surgery in 1.2%, and conservative measures in 14.7%. They reported an ASR-related mortality of 12.2%, with being older than 40 and neoplastic disorders associated with increased mortality – although male sex and splenomegaly have also been reported.11-13 Thomas and colleagues have reported on 48 cases of ASR related to hematologic malignancy showing acute myeloid leukemia being the most common cause (21%), followed by acute lymphoblastic leukemia (19%).2
Hematologic malignancies commonly cause splenic engorgement and pain although splenic rupture is an extremely rare event. Recent literature review has shown fewer than a thousand reported cases since 1980.4 There far fewer reported cases of ASR being related to CML, with most being reported as a complication.3,14 Based on our review, we could identify only a handful cases of CML with ASR being the initial symptom. These include a patient with Ph-negative CML and ASR following blast crisis, a patient with Phil-negative BCR-ABL-positive essential thrombocythemia, several cases in which the patient ultimately died, and 1 in which the patient survived into remission.4,14-16 Our case is different because the patient was ultimately positive for t(9,22)(q34;q11.2) and although he experienced multiple complications, he is currently functioning at his baseline and in remission. We hope this case will remind others that CML should be considered in the differential diagnosis of patients ASR.
1. American Cancer Society. Cancer Facts & Figures 2015. Atlanta, Ga: American Cancer Society; 2015.
2. Bauer TW, Haskins GE, Armitage JO. Splenic rupture in patients with hematologic malignancies. Cancer. 1981;48:2729-2733.
3. Giagounidis AA, Burk M, Meckenstock G, Koch AJ, Schneider W. Pathologic rupture of the spleen in hematologic malignancies: two additional cases. Ann Hematol. 1996;73(6):297-302.
4. Goodard SL, Chesney AE, Reis MD, et al. Pathologic splenic rupture: a rare complication of chronic myelomonocytic leukemia. Am J Hematology. 2007;82:405-408.
5. Faderl S, Talpaz M, Estrov Z, et al. The biology of chronic myeloid leukemia. N Engl J Med. 1999;341:164-172.
6. Cortes JE, Talpaz M, O’Brien S, et al. Staging of chronic myeloid leukemia in the imatinib era: an evaluation of the World Health Organization proposal. Cancer. 2006;106:1306-1315.
7. Vardiman JW, Harris NL, Brunning RD. The World Health Organization (WHO) classification of the myeloid neoplasms. Blood. 2002;100:2292-2302.
8. Kantarjian HM, O’Brien S, Cortes J, et al. Results of decitabine (5-aza-2’deoxycytidine) therapy in 130 patients with chronic myelogenous leukemia. Cancer.2003; 98:522-528.
9. Swerdlow SH, Campo E, Harris NL, et al, editors. WHO classification of tumours of haematopoietic and lymphoid tissues. Lyon, France: IARC Press; 2008.
10. Maung A, KaplanL. Management of splenic injury in the adult trauma patient. In: UpToDate, Basow DS (ed), Waltham, MA, 2013.
11. Renzulli P, Hostettler A, Schoepfer AM, Gloor B, Candinas D. Systematic review of atraumatic splenic rupture. Br J Surg. 2009;8(10):1114-1121.
12. Hehlmann R, Heimpel H, Hasford J, et al. Randomized comparison of interferon-alpha with busulfan and hydroxyurea in chronic myelogenous leukemia. The German CML Study Group. Blood. 1994;84:4064-4077.
13. Cortes J, Kantarjian H. How I treat newly diagnosed chronic phase CML. Blood. 2012;120:1390-1397.
14. Nestok BR, Goldstein JD, Lipkovic P. Splenic rupture as a cause of sudden death in undiagnosed chronic myelogenous leukemia. Am J Forensic Med Pathol. 1988;9:241-245.
15. Sachithanandan A, Gleadhil I, Alexander HD, Morris TC. Spontaneous splenic rupture in atypical (Philadelphia chromosome negative) chronic myeloid leukemia following blastic crisis. Ir Med J. 2003;96(6):181-182.
16. Chim CS, Kwong YL, Shek TW, Ma SK, Ooi GC. Splenic rupture as the presenting symptom of blastic crisis in a patient with Philadelphia-negative, BCR-ABL-positive ET. Am J Hematology. 2001;66:70-71.
Open Clinical Trials for Patients With Multiple Sclerosis (FULL)
Providing access to clinical trials for veteran and active-duty military patients can be a challenge, but a significant number of trials are now recruiting patients from those patient populations. More than 51,000 open trials are listed on the ClinicalTrials.gov website. Many explicitly recruit patients from the VA (212 studies), the military (132 studies), and IHS and native health organizations (4 studies). The VA Health Services Research and Development department alone sponsors > 250 research initiatives, and many more are sponsored by Walter Reed National Medical Center and other major defense and VA facilities. The clinical trials listed below are all open as of February 22, 2017, and are focused on the treatment of multiple sclerosis (MS) and other neurologic disorders. For additional information and full inclusion/exclusion criteria, please consult https://clinicaltrials.gov.
Integrating Caregiver Support Into MS Care (MS Caregiver)
With loss of mobility in MS comes an increase in amount and types of caregiver assistance, with a concomitant increase in burden for the caregiver. This feasibility study will test integration of a successful behavioral caregiving intervention into clinical practice to improve functioning of veterans with MS and their caregivers. Caregivers of veterans with MS will receive a behavioral caregiver intervention designed to address caregiver coping and management of patient concerns, with special focus on patient mobility and walking. A pre-post intervention design will compare outcomes for veterans and caregivers.
ID: NCT02835677
Sponsor: Memphis VA Medical Center
Contact: Linda O. Nichols, PhD, [email protected], Jennifer L. Martindale-Adams, [email protected]
Study and Treatment of Visual Dysfunction and Motor Fatigue in Multiple Sclerosis
Primary fatigue represents a major cause of disability in patients with MS, being reported in about 90% of cases. The investigators propose a characteristic eye movement abnormality (internuclear ophthalmoparesis), commonly encountered in MS, as a simple model for primary motor fatigue. The investigators propose a medical treatment to improve ocular performance/fatigue in internuclear ophthalmoparesis, which can reduce visual disability and improve quality of life in veterans with MS.
ID: NCT02391961
Sponsor: VA Office of Research and Development
Location (contact): Louis Stokes VA Medical Center, Cleveland, Ohio (Holly B. Henry)
Dysport Treatment of Urinary Incontinence in Adults Subjects With Neurogenic Detrusor Overactivity Due to Spinal Cord Injury or Multiple Sclerosis
The purpose of this study is to provide confirmatory evidence of the safety and efficacy of 2 Dysport (AbobotulinumtoxinA) doses (600 units [U] and 800 U), compared to placebo in reducing urinary incontinence in adult subjects treated for neurogenic detrusor overactivity due to spinal cord injury or MS.
ID: NCT02660138
Sponsor: Ipsen
Location (contact Ipsen Recruitment Enquiries, clinical.trials@ ipsen.com): VA Long Beach Healthcare System, California, VA Palo Alto Health Care System, California, Raymond G. Murphy VAMC Albuquerque, New Mexico, Louis Stokes Cleveland Veterans Affairs Medical Center, Ohio.
Click here to read the digital edition.
Single-Dose Niacin-Induced Hepatitis
Niacin, also known as vitamin B3, is an important cofactor in many metabolic processes necessary to life. Over the past 15 to 20 years, niacin has been prescribed to patients with hyperlipidemia to increase high-density lipoprotein and lower low-density lipoprotein.1 As a naturally occurring vitamin, niacin is also available over-the-counter (OTC) as a dietary supplement, and is also a common ingredient in energy drinks and multivitamins.2
In addition to treating hyperlipidemia and as a nutritional supplement, some anecdotal reports amongst lay-persons suggests that niacin offers other health benefits, such as promoting weight loss and expediting the elimination of alcohol and illicit drugs from one’s system (eg, marijuana).3,4 The increased use of niacin supplementation in the general population for all of the aforementioned reasons has resulted in an increased incidence of niacin toxicity.
Formulations
Niacin is available in three formulations: extended-release (ER, also referred to as intermediate-release), immediate-release (IR), and sustained-release (SR).
The ER formulations of niacin are typically prescribed to treat hyperlipidemia. Patients are usually started on ER niacin at an initial dose of 250 mg once daily. The dose is gradually increased, as tolerated or necessary, to 2 g per day, taken in three doses. It is not uncommon for patients with hyperlipidemia to take more than 1 g of niacin per day after titration by their primary physicians.
Side Effects
Since niacin increases the release of arachidonic acid from cell membranes that metabolizes into prostaglandins, specifically prostaglandins E2 and D2, many patients taking niacin experience uncomfortable flushing and itching.5 Nonsteroidal anti-inflammatory drugs (NSAIDs) prevent this side effect by inhibiting the metabolism of arachidonic acid into those vasodilatory prostaglandins. The newer ER and SR formulations of niacin, which are approved for OTC use as a dietary supplement, are less likely to cause flushing.5
Extended-release niacin, however, is associated with a higher incidence of hepatotoxicity than the other prescription formulations of niacin.6 Toxicity has been well recognized in patients taking niacin chronically for hyperlipidemia, with reports of such cases dating back to the 1980s.7,8 We report a unique case of niacin toxicity following a single-dose ingestion in a young man.
Case
A 22-year-old man presented to the ED for evaluation of a 2-week history of intermittent periumbilical abdominal pain. This visit represented the patient’s second visit to the ED over the past week for the same complaint.
Upon presentation the patient’s vital signs were: blood pressure (BP), 113/64 mm Hg; heart rate, 82 beats/min; respiratory rate, 16 breaths/min; and temperature 36.6°C. Oxygen saturation was 100% on room air. The patient was otherwise healthy and had no significant recent or remote medical history. He denied taking any medications prior to his initial presentation, and reported only occasional alcohol use.
At the patient’s initial presentation 1 week earlier, he was diagnosed with acute gastroenteritis and treated with famotidine and ondansetron in the ED. The patient appeared well clinically at this visit, and laboratory values were within normal limits, including normal blood glucose and urinalysis.
The patient was discharged home from this first visit with prescriptions of famotidine and ondansetron, and was advised to follow up with his primary care physician in 1 week. Throughout the week after discharge from the ED, the patient experienced worsening abdominal pain, and he developed frequent nonbloody emesis, prompting his second presentation to the ED. At this second visit, the patient stated that he had taken one dose of ondansetron at home, without effect. He also noted subjective fevers, but had no diarrhea or melena.
Vital signs remained within normal limits with BPs ranging from 115 to 130 mm Hg systolic and 50 to 89 mm Hg diastolic. The patient was never tachycardic, tachypneic, febrile, or hypoxic. Physical examination was remarkable for periumbilical tenderness. The patient had no jaundice. A more thorough laboratory evaluation revealed elevated anion gap and blood urea nitrogen/creatinine values, and leukocytosis. The patient’s hepatic enzymes were also elevated, with aspartate aminotransferase (AST) over 2,000 U/L and alanine aminotransferase (ALT) of 1,698 U/L. Lipase, bilirubin, and alkaline phosphatase were all within normal limits. The patient’s prothrombin time (PT) was elevated at 14 seconds, and the international normalized ratio (INR) was elevated at 1.28. Laboratory analysis for acetaminophen and alcohol was negative.
A computed tomography (CT) scan of the abdomen/pelvis with intravenous (IV) contrast was unremarkable, demonstrating a liver devoid of any masses, portal or biliary dilation, or cirrhotic changes.
The patient received IV famotidine and ondansetron, and morphine for pain control, and was admitted to the general medical floor for hepatitis of uncertain etiology. A viral hepatitis panel was negative.
On the recommendation of the toxicology service, the patient was given N-acetylcysteine (NAC), and his hepatic enzymes trended down to an AST of 642 U/L and an ALT of 456 U/L by hospital day 2. (The patient essentially completed a positive dechallenge test).9
A gastroenterology consult was ordered, during which additional history-taking and chart review noted that the patient admitted to taking one or two tablets of OTC niacin as a dietary supplement the day before his initial presentation. Although the patient could not recall the exact dosage, he stated that he had been taking supplemental niacin approximately once a month over the past several years without any issues. Since OTC niacin is most commonly available in 500-mg tablets, this suggested the patient’s recent one-time ingested dose was approximately 500 to 1,000 mg.
Based on the patient’s admission to niacin use, additional studies were ordered, including an abdominal ultrasound and a urine drug screen. Ultrasound findings were unremarkable for portal venous thrombosis. The urine drug screen, however, was positive for marijuana and opiates. While the patient denied any history of opioid use, the positive opiate assay could have been attributed to the morphine given in the ED.
Throughout the patient’s hospital course, he remained normotensive and had no change in mental status. His liver enzymes, PT, and INR continued to normalize, and he was discharged home after 3 days, with instructions to follow up with the gastrointestinal clinic within 11 days. An appointment was made for him, which he did not attend.
Given the patient’s negative autoimmune and viral workup, and rapid resolution of symptoms after discontinuing niacin use, it is believed that he had an acute drug-induced hepatitis due to niacin ingestion. Regarding any coingestants that could have contributed to the hepatitis, the patient denied taking other common coingestants such as alcohol and acetaminophen; this assertion was supported by laboratory results.
Since we were unable to attain a qualitative measurement of the patient’s niacin concentration, our diagnosis was primarily based on the patient’s reported history.10 It is possible the patient had been taking more niacin than that to which he admitted, or that he was taking another hepatotoxic substance not detected on our toxicology workup. As previously noted, there are many medications and/or dietary supplements that could cause or contribute to a synergistic effect of drug-induced hepatitis for which the patient was not tested at his initial presentation. The patient could have co-ingested this large dose of niacin with acetaminophen and/or other supplements, energy drinks, or alcohol. A combination such as this could have contributed to his hepatitis, and the metabolites of these other substances would have been eliminated by the time of his second ED presentation.
Discussion
There are over 900 different drugs, toxins, and supplements known to cause hepatic injury.11,12 Clinical manifestations of toxicity range from asymptomatic incidental elevations in transaminases to fulminant liver failure causing mortality. Ingestion of commonly used medications such as statins (although not in overdose quantities) can cause transient asymptomatic transaminitis.13 These elevations are usually mild—ie, less than twice the upper limit of normal. Patients who experience such elevations can usually continue to take the medications with frequent and vigilant monitoring of hepatic function.
Signs and Symptoms
Acute Liver Injury. Acute liver injury is diagnosed when AST and ALT levels are greater than twice the upper limit of normal. Patients also typically have mild-to-moderate abdominal findings, such as pain, nausea, and vomiting—as was experienced by our patient. Along with niacin, angiotensin-converting enzyme inhibitors, NSAIDs, and antifungal medications are examples of other medications that can cause this degree of drug-induced hepatitis.
Severe Liver Injury. Severe liver injury features elevations in not only AST and ALT, but also alkaline phosphate and bilirubin. Patients with severe hepatic injury appear clinically ill and may exhibit altered mental status and jaundice. This type of subfulminant hepatic failure commonly results from acetaminophen toxicity, anesthetic gases, iron toxicity, phosphorus toxicity, and cocaine toxicity. Examples of drugs that result in massive liver necrosis and fulminant hepatitis are acetaminophen, isoniazid, phenelzine, phenytoin, propylthiouracil, and sertraline. Patients with massive hepatic necrosis and hepatitis may require liver transplantation.
Etiology
Identifying the etiology of liver injury is made largely through the patient’s history because there are simply too many possible hepatotoxic agents to test for them all. Diagnostic suspicion of hepatic toxicity should be increased with signs of more serious disease; however, drug-induced liver injury should be included in the differential diagnosis for all cases of abdominal pain.
With respect to the patient in our case, obtaining a more complete history involving supplement and vitamin use would have allowed us to make the diagnosis in the ED. Unfortunately, these subtle aspects of a patient’s history are often overlooked in the emergent care setting.
Treatment
The treatment of niacin-induced liver injury is similar to the guidelines for treating most other drug-induced pathology.14 Removal of the offending agent and providing supportive care is the primary treatment modality.15 In addition, it is important that the clinician exclude and rule-out other causes of hepatitis such as those of viral, autoimmune, or ischemic etiology.
N-acetylcysteine. A medication classically used in patients with acetaminophen overdose, NAC is a safe and effective treatment for non-acetaminophen-induced liver injury, and was given to treat our patient.16L-carnitine. L-carnitine has been shown to be effective in cases of chronic steatosis from hepatitis C and in valproic acid induced hepatitis.17Since L-carnitine is not included on our hospital’s formulary, it was not a treatment option for our patient.Glucocorticoid Therapy. Although glucocorticoids are occasionally given to patients with systemic symptoms of drug reactions, its effectiveness has not been adequately studied.18
Prognosis
The prognosis of patients with acute drug-induced hepatitis is generally good, and most patients fully recover once the offending agent is removed. Poor prognostic factors include the presence of jaundice, requirement for dialysis, underlying chronic liver conditions, or elevated serum creatinine. While most patients will experience a complete recovery, approximately 5% to 10% will develop chronic hepatitis and/or cirrhosis.
Conclusion
Niacin is now available as prescription and OTC formulations and is a potentially hepatotoxic medication and dietary supplement. Niacin can cause an acute hepatitis, especially when taken in conjunction with other hepatotoxic substances. Drug-induced liver injury from niacin ingestion will improve quickly following removal, and the prognosis in otherwise healthy individuals is good.
Patients, especially young, healthy patients who present with symptoms concerning for hepatitis, should be asked specifically about any nutritional, herbal, or other supplement usage. During the history intake, many patients do not consider vitamins or other nutritional or herbal supplements as “medication” or as being significant, and only report prescription and OTC medications.
1. Berglund L, Brunzell JD, Goldberg AC, et al. Evaluation and treatment of hypertriglyceridemia: an Endocrine Society clinical practice guideline. J Clin Endocrinol Metab. 2012;97(9):2969-2989. doi:10.1210/jc.2011-3213.
2. Vivekanandarajah A, Ni S, Waked A. Acute hepatitis in a woman following excessive ingestion of an energy drink: a case report. J Med Case Rep. 2011;5:227. doi:10.1186/1752-1947-5-227.
3. Niacin. U.S. National Library of Medicine. https://medlineplus.gov/druginfo/meds/a682518.html. Updated July 15, 2017. Accessed February 21, 2018.
4. Addiction Resource. Niacin flush for drug detox. https://addictionresource.com/drug-testing/niacin-drug-test/. Accessed February 20, 2018.
5. Kamanna VS, Ganji SH, Kashyap ML. The mechanism and mitigation of niacin-induced flushing. Int J Clin Pract. 2009;63(9):1369-1377. doi:10.1111/j.1742-1241.2009.02099.x.
6. Etchason JA, Miller TD, Squires RW, et al. Niacin-induced hepatitis: a potential side effect with low-dose time-release niacin. Mayo Clin Proc. 1991;66(1):23-28.
7. Patterson DJ, Dew EW, Gyorkey F, Graham DY. Niacin hepatitis. South Med J. 1983;76(2):239-241.
8. Ferenchick G, Rovner D. Hepatitis and hematemesis complicating nicotinic acid use. Am J Med Sci. 1989;298(3):191-193.
9. Henkin Y, Johnson KC, Segrest JP. Rechallenge with crystalline niacin after drug-induced hepatitis from sustained-release niacin. JAMA. 1990;264(2):241-243.
10. Barritt AS 4th, Lee J, Hayashi PH. Detective work in drug-induced liver injury: sometimes it is all about interviewing the right witness. Clin Gastroenterol Hepatol. 2010;8(7):635-637. doi:10.1016/j.cgh.2010.03.020.
11. Chitturi S, Teoh NC, Farrell GC. Hepatic drug metabolism and liver disease caused by drugs. In: Feldman M, Friedman LS, Brandt LJ, eds. Sleisenger and Fordtran’s Gastrointestinal and Liver Disease. 10th ed. Philadelphia, PA: Elsevier Saunders; 2016:1442-1477.
12. National Institutes of Health. LiverTox: Clinical and Research Information on Drug-Induced Liver Injury. Niacin. https://livertox.nih.gov/Niacin.htm. Updated January 18, 2018. Accessed February 21, 2018.
13. Chalasani N. Statins and hepatotoxicity: focus on patients with fatty liver. Hepatology. 2005;41(4):690-695.
14. Chalasani NP, Hayashi PH, Bonkovsky HL, et al. ACG Clinical Guideline: the diagnosis and management of idiosyncratic drug-induced liver injury. Am J Gastroenterol. 2014;109(7):950-966. doi:10.1038/ajg.2014.131.
15. Larson AM. Hepatotoxicity due to herbal medication and dietary supplements. UpToDate Web site. https://www.uptodate.com/contents/hepatotoxicity-due-to-herbal-medications-and-dietary-supplements?source=search_result&search=niacin%20induced%20hepatitis&selectedTitle=3~150. Updated December 21, 2017. Accessed February 21, 2018.
16. Mumtaz K, Azam Z, Hamid S, et al. Role of N-acetylcysteine in adults with non-acetaminophen-induced acute liver failure in a center without the facility of liver transplantation. Hepatol Int. 2009;3(4):563-570. doi:10.1007/s12072-009-9151-0.
17. Perrott J, Murphy NG, Zed PJ. L-carnitine for acute valproic acid overdose: a systematic review of published cases. Ann Pharmacother. 2010;44(7-8):1287-1293. doi:10.1345/aph.1P135.
18. O’Grady JG, Alexander GJ, Hayllar KM, Williams R. Early indicators of prognosis in fulminant hepatic failure. Gastroenterology. 1989;97(2):439-445.
Niacin, also known as vitamin B3, is an important cofactor in many metabolic processes necessary to life. Over the past 15 to 20 years, niacin has been prescribed to patients with hyperlipidemia to increase high-density lipoprotein and lower low-density lipoprotein.1 As a naturally occurring vitamin, niacin is also available over-the-counter (OTC) as a dietary supplement, and is also a common ingredient in energy drinks and multivitamins.2
In addition to treating hyperlipidemia and as a nutritional supplement, some anecdotal reports amongst lay-persons suggests that niacin offers other health benefits, such as promoting weight loss and expediting the elimination of alcohol and illicit drugs from one’s system (eg, marijuana).3,4 The increased use of niacin supplementation in the general population for all of the aforementioned reasons has resulted in an increased incidence of niacin toxicity.
Formulations
Niacin is available in three formulations: extended-release (ER, also referred to as intermediate-release), immediate-release (IR), and sustained-release (SR).
The ER formulations of niacin are typically prescribed to treat hyperlipidemia. Patients are usually started on ER niacin at an initial dose of 250 mg once daily. The dose is gradually increased, as tolerated or necessary, to 2 g per day, taken in three doses. It is not uncommon for patients with hyperlipidemia to take more than 1 g of niacin per day after titration by their primary physicians.
Side Effects
Since niacin increases the release of arachidonic acid from cell membranes that metabolizes into prostaglandins, specifically prostaglandins E2 and D2, many patients taking niacin experience uncomfortable flushing and itching.5 Nonsteroidal anti-inflammatory drugs (NSAIDs) prevent this side effect by inhibiting the metabolism of arachidonic acid into those vasodilatory prostaglandins. The newer ER and SR formulations of niacin, which are approved for OTC use as a dietary supplement, are less likely to cause flushing.5
Extended-release niacin, however, is associated with a higher incidence of hepatotoxicity than the other prescription formulations of niacin.6 Toxicity has been well recognized in patients taking niacin chronically for hyperlipidemia, with reports of such cases dating back to the 1980s.7,8 We report a unique case of niacin toxicity following a single-dose ingestion in a young man.
Case
A 22-year-old man presented to the ED for evaluation of a 2-week history of intermittent periumbilical abdominal pain. This visit represented the patient’s second visit to the ED over the past week for the same complaint.
Upon presentation the patient’s vital signs were: blood pressure (BP), 113/64 mm Hg; heart rate, 82 beats/min; respiratory rate, 16 breaths/min; and temperature 36.6°C. Oxygen saturation was 100% on room air. The patient was otherwise healthy and had no significant recent or remote medical history. He denied taking any medications prior to his initial presentation, and reported only occasional alcohol use.
At the patient’s initial presentation 1 week earlier, he was diagnosed with acute gastroenteritis and treated with famotidine and ondansetron in the ED. The patient appeared well clinically at this visit, and laboratory values were within normal limits, including normal blood glucose and urinalysis.
The patient was discharged home from this first visit with prescriptions of famotidine and ondansetron, and was advised to follow up with his primary care physician in 1 week. Throughout the week after discharge from the ED, the patient experienced worsening abdominal pain, and he developed frequent nonbloody emesis, prompting his second presentation to the ED. At this second visit, the patient stated that he had taken one dose of ondansetron at home, without effect. He also noted subjective fevers, but had no diarrhea or melena.
Vital signs remained within normal limits with BPs ranging from 115 to 130 mm Hg systolic and 50 to 89 mm Hg diastolic. The patient was never tachycardic, tachypneic, febrile, or hypoxic. Physical examination was remarkable for periumbilical tenderness. The patient had no jaundice. A more thorough laboratory evaluation revealed elevated anion gap and blood urea nitrogen/creatinine values, and leukocytosis. The patient’s hepatic enzymes were also elevated, with aspartate aminotransferase (AST) over 2,000 U/L and alanine aminotransferase (ALT) of 1,698 U/L. Lipase, bilirubin, and alkaline phosphatase were all within normal limits. The patient’s prothrombin time (PT) was elevated at 14 seconds, and the international normalized ratio (INR) was elevated at 1.28. Laboratory analysis for acetaminophen and alcohol was negative.
A computed tomography (CT) scan of the abdomen/pelvis with intravenous (IV) contrast was unremarkable, demonstrating a liver devoid of any masses, portal or biliary dilation, or cirrhotic changes.
The patient received IV famotidine and ondansetron, and morphine for pain control, and was admitted to the general medical floor for hepatitis of uncertain etiology. A viral hepatitis panel was negative.
On the recommendation of the toxicology service, the patient was given N-acetylcysteine (NAC), and his hepatic enzymes trended down to an AST of 642 U/L and an ALT of 456 U/L by hospital day 2. (The patient essentially completed a positive dechallenge test).9
A gastroenterology consult was ordered, during which additional history-taking and chart review noted that the patient admitted to taking one or two tablets of OTC niacin as a dietary supplement the day before his initial presentation. Although the patient could not recall the exact dosage, he stated that he had been taking supplemental niacin approximately once a month over the past several years without any issues. Since OTC niacin is most commonly available in 500-mg tablets, this suggested the patient’s recent one-time ingested dose was approximately 500 to 1,000 mg.
Based on the patient’s admission to niacin use, additional studies were ordered, including an abdominal ultrasound and a urine drug screen. Ultrasound findings were unremarkable for portal venous thrombosis. The urine drug screen, however, was positive for marijuana and opiates. While the patient denied any history of opioid use, the positive opiate assay could have been attributed to the morphine given in the ED.
Throughout the patient’s hospital course, he remained normotensive and had no change in mental status. His liver enzymes, PT, and INR continued to normalize, and he was discharged home after 3 days, with instructions to follow up with the gastrointestinal clinic within 11 days. An appointment was made for him, which he did not attend.
Given the patient’s negative autoimmune and viral workup, and rapid resolution of symptoms after discontinuing niacin use, it is believed that he had an acute drug-induced hepatitis due to niacin ingestion. Regarding any coingestants that could have contributed to the hepatitis, the patient denied taking other common coingestants such as alcohol and acetaminophen; this assertion was supported by laboratory results.
Since we were unable to attain a qualitative measurement of the patient’s niacin concentration, our diagnosis was primarily based on the patient’s reported history.10 It is possible the patient had been taking more niacin than that to which he admitted, or that he was taking another hepatotoxic substance not detected on our toxicology workup. As previously noted, there are many medications and/or dietary supplements that could cause or contribute to a synergistic effect of drug-induced hepatitis for which the patient was not tested at his initial presentation. The patient could have co-ingested this large dose of niacin with acetaminophen and/or other supplements, energy drinks, or alcohol. A combination such as this could have contributed to his hepatitis, and the metabolites of these other substances would have been eliminated by the time of his second ED presentation.
Discussion
There are over 900 different drugs, toxins, and supplements known to cause hepatic injury.11,12 Clinical manifestations of toxicity range from asymptomatic incidental elevations in transaminases to fulminant liver failure causing mortality. Ingestion of commonly used medications such as statins (although not in overdose quantities) can cause transient asymptomatic transaminitis.13 These elevations are usually mild—ie, less than twice the upper limit of normal. Patients who experience such elevations can usually continue to take the medications with frequent and vigilant monitoring of hepatic function.
Signs and Symptoms
Acute Liver Injury. Acute liver injury is diagnosed when AST and ALT levels are greater than twice the upper limit of normal. Patients also typically have mild-to-moderate abdominal findings, such as pain, nausea, and vomiting—as was experienced by our patient. Along with niacin, angiotensin-converting enzyme inhibitors, NSAIDs, and antifungal medications are examples of other medications that can cause this degree of drug-induced hepatitis.
Severe Liver Injury. Severe liver injury features elevations in not only AST and ALT, but also alkaline phosphate and bilirubin. Patients with severe hepatic injury appear clinically ill and may exhibit altered mental status and jaundice. This type of subfulminant hepatic failure commonly results from acetaminophen toxicity, anesthetic gases, iron toxicity, phosphorus toxicity, and cocaine toxicity. Examples of drugs that result in massive liver necrosis and fulminant hepatitis are acetaminophen, isoniazid, phenelzine, phenytoin, propylthiouracil, and sertraline. Patients with massive hepatic necrosis and hepatitis may require liver transplantation.
Etiology
Identifying the etiology of liver injury is made largely through the patient’s history because there are simply too many possible hepatotoxic agents to test for them all. Diagnostic suspicion of hepatic toxicity should be increased with signs of more serious disease; however, drug-induced liver injury should be included in the differential diagnosis for all cases of abdominal pain.
With respect to the patient in our case, obtaining a more complete history involving supplement and vitamin use would have allowed us to make the diagnosis in the ED. Unfortunately, these subtle aspects of a patient’s history are often overlooked in the emergent care setting.
Treatment
The treatment of niacin-induced liver injury is similar to the guidelines for treating most other drug-induced pathology.14 Removal of the offending agent and providing supportive care is the primary treatment modality.15 In addition, it is important that the clinician exclude and rule-out other causes of hepatitis such as those of viral, autoimmune, or ischemic etiology.
N-acetylcysteine. A medication classically used in patients with acetaminophen overdose, NAC is a safe and effective treatment for non-acetaminophen-induced liver injury, and was given to treat our patient.16L-carnitine. L-carnitine has been shown to be effective in cases of chronic steatosis from hepatitis C and in valproic acid induced hepatitis.17Since L-carnitine is not included on our hospital’s formulary, it was not a treatment option for our patient.Glucocorticoid Therapy. Although glucocorticoids are occasionally given to patients with systemic symptoms of drug reactions, its effectiveness has not been adequately studied.18
Prognosis
The prognosis of patients with acute drug-induced hepatitis is generally good, and most patients fully recover once the offending agent is removed. Poor prognostic factors include the presence of jaundice, requirement for dialysis, underlying chronic liver conditions, or elevated serum creatinine. While most patients will experience a complete recovery, approximately 5% to 10% will develop chronic hepatitis and/or cirrhosis.
Conclusion
Niacin is now available as prescription and OTC formulations and is a potentially hepatotoxic medication and dietary supplement. Niacin can cause an acute hepatitis, especially when taken in conjunction with other hepatotoxic substances. Drug-induced liver injury from niacin ingestion will improve quickly following removal, and the prognosis in otherwise healthy individuals is good.
Patients, especially young, healthy patients who present with symptoms concerning for hepatitis, should be asked specifically about any nutritional, herbal, or other supplement usage. During the history intake, many patients do not consider vitamins or other nutritional or herbal supplements as “medication” or as being significant, and only report prescription and OTC medications.
1. Berglund L, Brunzell JD, Goldberg AC, et al. Evaluation and treatment of hypertriglyceridemia: an Endocrine Society clinical practice guideline. J Clin Endocrinol Metab. 2012;97(9):2969-2989. doi:10.1210/jc.2011-3213.
2. Vivekanandarajah A, Ni S, Waked A. Acute hepatitis in a woman following excessive ingestion of an energy drink: a case report. J Med Case Rep. 2011;5:227. doi:10.1186/1752-1947-5-227.
3. Niacin. U.S. National Library of Medicine. https://medlineplus.gov/druginfo/meds/a682518.html. Updated July 15, 2017. Accessed February 21, 2018.
4. Addiction Resource. Niacin flush for drug detox. https://addictionresource.com/drug-testing/niacin-drug-test/. Accessed February 20, 2018.
5. Kamanna VS, Ganji SH, Kashyap ML. The mechanism and mitigation of niacin-induced flushing. Int J Clin Pract. 2009;63(9):1369-1377. doi:10.1111/j.1742-1241.2009.02099.x.
6. Etchason JA, Miller TD, Squires RW, et al. Niacin-induced hepatitis: a potential side effect with low-dose time-release niacin. Mayo Clin Proc. 1991;66(1):23-28.
7. Patterson DJ, Dew EW, Gyorkey F, Graham DY. Niacin hepatitis. South Med J. 1983;76(2):239-241.
8. Ferenchick G, Rovner D. Hepatitis and hematemesis complicating nicotinic acid use. Am J Med Sci. 1989;298(3):191-193.
9. Henkin Y, Johnson KC, Segrest JP. Rechallenge with crystalline niacin after drug-induced hepatitis from sustained-release niacin. JAMA. 1990;264(2):241-243.
10. Barritt AS 4th, Lee J, Hayashi PH. Detective work in drug-induced liver injury: sometimes it is all about interviewing the right witness. Clin Gastroenterol Hepatol. 2010;8(7):635-637. doi:10.1016/j.cgh.2010.03.020.
11. Chitturi S, Teoh NC, Farrell GC. Hepatic drug metabolism and liver disease caused by drugs. In: Feldman M, Friedman LS, Brandt LJ, eds. Sleisenger and Fordtran’s Gastrointestinal and Liver Disease. 10th ed. Philadelphia, PA: Elsevier Saunders; 2016:1442-1477.
12. National Institutes of Health. LiverTox: Clinical and Research Information on Drug-Induced Liver Injury. Niacin. https://livertox.nih.gov/Niacin.htm. Updated January 18, 2018. Accessed February 21, 2018.
13. Chalasani N. Statins and hepatotoxicity: focus on patients with fatty liver. Hepatology. 2005;41(4):690-695.
14. Chalasani NP, Hayashi PH, Bonkovsky HL, et al. ACG Clinical Guideline: the diagnosis and management of idiosyncratic drug-induced liver injury. Am J Gastroenterol. 2014;109(7):950-966. doi:10.1038/ajg.2014.131.
15. Larson AM. Hepatotoxicity due to herbal medication and dietary supplements. UpToDate Web site. https://www.uptodate.com/contents/hepatotoxicity-due-to-herbal-medications-and-dietary-supplements?source=search_result&search=niacin%20induced%20hepatitis&selectedTitle=3~150. Updated December 21, 2017. Accessed February 21, 2018.
16. Mumtaz K, Azam Z, Hamid S, et al. Role of N-acetylcysteine in adults with non-acetaminophen-induced acute liver failure in a center without the facility of liver transplantation. Hepatol Int. 2009;3(4):563-570. doi:10.1007/s12072-009-9151-0.
17. Perrott J, Murphy NG, Zed PJ. L-carnitine for acute valproic acid overdose: a systematic review of published cases. Ann Pharmacother. 2010;44(7-8):1287-1293. doi:10.1345/aph.1P135.
18. O’Grady JG, Alexander GJ, Hayllar KM, Williams R. Early indicators of prognosis in fulminant hepatic failure. Gastroenterology. 1989;97(2):439-445.
Bile spillage during lap cholecystectomy comes with a price
Bile spillage that happens during laparoscopic gallbladder removal is a known problem, but a large study has put some numbers to quantify the risks to patients.
A research team at Massachusetts General Hospital, Boston, conducted a prospective study of 1,001 such operations to look at the impact of bile spillage. They found that wound infection rates in cases involving bile spillage were almost three times higher than were those without spillage and resulting hospital stays were 50% longer, according to an article in the Journal of the American College of Surgeons.
The study involved adults who had laparoscopic and laparoscopic converted to open cholecystectomy at the academic hospital during May 2010-March 2017. The latter category accounted for 95 patients, a 9.5% conversion rate. Overall, bile was spilled in 591 patients (59%), with empyema in 86 (8.6%), hydrops in 62 (6.2%), and clear bile spillage in the remainder. Bile spillage along with gallstone spillage occurred in 202 patients (20.2%), with recovery of all spilled gallstones in 145 (71.8%) of those cases.
Overall, the surgical site infection (SSI) rate was 2.4% (n = 8) in patients with no bile spillage vs. 7.1% (n = 30) for those with bile spillage. Median hospital length of stay was 2 days for the nonspillage patients vs. 3 days for those with spillage. The 30-day readmission rates were 5.9% for the nonspillage group vs. 9.6% for the spillage group.
The bile spillage rate in this study was considerably higher than previous studies had reported, the researchers noted. A retrospective study of 1,127 patients reported a spillage rate of 11.6% (World J Surg. 1999;23:1186-90). “One needs to notice that a retrospective review of medical records almost certainly underappreciates the rate of bile spillage,” the investigators wrote. A Mayo Clinic study reported a bile spillage rate of 29% and an increased risk of intra-abdominal abscesses (J Gastrointest Surg. 1997;1:85-90). The complex and acute nature of the cases at Mass General may explain their higher spillage rates, the researchers suggested.
This study identifies bile spillage, along with conversion to open surgery and patient ASA class 2 or higher as the only independent predictors of SSI. The study also found no link between empyema and hydrops with SSI, although the small number of cases may preclude an representative sample.
Nonetheless, surgeons must face the question of how to decrease SSI in laparoscopic cholecystectomy with bile spillage, study authors wrote. “First, surgeons should acknowledge that gallbladder perforations and bile spillage come at a price,” they said, “and thus should be cautious and try to avoid them.”
When bile is spilled, liberal peritoneal irrigation may be futile; this study showed similar SSI rates after bile spillage, regardless of peritoneal irrigation. “We could consider modifying perioperative antibiotic coverage,” the investigators wrote, but they acknowledged a need for more research to validate its benefit.
The investigators reported having no financial disclosures.
SOURCE: Peponis T et al. J Am Coll Surg. 2018 Mar 1. doi: 10.1016/j.jamcollsurg.2017.11.025.
FROM THE JOURNAL OF THE AMERICAN COLLEGE OF SURGEONS
Key clinical point: Bile spillage during laparoscopic cholecystectomy increases the patient’s risk for surgical site infection.
Major finding: Surgical site infection rates were 7.1% in cases in which bile spillage occurred vs. 2.4% in cases that had no bile spillage.
Data source: Prospective analysis of 1,001 laparoscopic or laparoscopic converted to open operations in adults during May 2010-March 2017.
Disclosures: Dr. Velmahos and coauthors reported having no financial disclosures.
Source: Peponis T et al. J Am Coll Surg. 2018 Mar 1. doi: 10.1016/j.jamcollsurg.2017.11.025.
Migraine and Dysfunction of Discrete Cell Types
Both familial and common migraine may arise from dysfunction of discrete cell types within the neurovascular unit, and localization of the affected cell type(s) in an individual patient may provide insight into to their susceptibility to migraine, according to a recent study. The cell-type specific expression of both familial and common migraine-associated genes was determined bioinformatically using data from 2039 individual human brain cells across 2 published single-cell RNA sequencing datasets. Enrichment of migraine-associated genes was determined for each brain cell type. Researchers found:
- Analysis of single-brain cell RNA sequencing data from 5 major subtypes of cells in the human cortex (neurons, oligodendrocytes, astrocytes, microglia, and endothelial cells) indicates that greater than 40% of known migraine-associated genes are enriched in the expression profiles of a specific brain cell type.
- Further analysis of neuronal migraine-associated genes demonstrated that approximately 70% were significantly enriched in inhibitory neurons and 30% in excitatory neurons.
Localization of migraine susceptibility genes in human brain by single-cell RNA sequencing. [Published online ahead of print March 2, 2018]. Cephalalgia. doi:10.1177/0333102418762476.
sTMS: Well-Tolerated and Effective for Migraine
Single pulse transcranial magnetic stimulation (sTMS) may be an effective, well-tolerated treatment option for migraine prevention, according to a recent study. Researchers conducted the eNeura Spring TMS Post-Market Observational US Study of Migraine (ESPOUSE), a multicenter, prospective, open label, observational study. Of the total subjects (n=263), 229 completed a baseline diary, and 220 were found to be eligible based on the number of headache days. The treatment protocol consisted of preventive (4 pulses twice daily) and acute (3 pulses repeated up to 3 times for each attack) treatment. Researchers found:
- The device was assigned to 217 subjects (Safety Data Set) and 132 were included in the intention to treat Full Analysis Set.
- For the primary endpoint, there was a −2.75 ± 0.40 mean reduction of headache days from baseline compared to the performance goal (-0.63 days).
- There was a reduction of −2.93 (5.24) days of acute medication use, headache impact measured by HIT-6, −3.1 (6.4), and total headache days of any intensity −3.16 days (5.21) compared to the performance goal (−0.63 days).
- The most common adverse events were lightheadedness, tingling, and tinnitus; there were no serious adverse events.
A multicenter, prospective, single arm, open label, observational study of sTMS for migraine prevention (ESPOUSE study). [Published online ahead of print March 4, 2018]. Cephalalgia. doi:10.1177/0333102418762525.
Migraine More Common and Burdensome for Women
Severe headache and migraine remain important public health problems that are more common and burdensome for women, particularly women of childbearing age, and other historically disadvantaged segments of the population, according to a recent study. Researchers searched for the most current publicly available summary statistics from the National Health Interview Survey (NHIS), the National Hospital Ambulatory Medical Care Survey (NHAMCS), and the National Ambulatory Medical Care Survey (NAMCS). They found:
- The prevalence and burden of self-reported migraine and severe headache in the US adult population is high, affecting roughly 1 out of every 6 Americans and 1 in 5 women over a 3-month period (15.3% overall, 9.7% of males, and 20.7% of females).
- The prevalence of migraine or severe headache in 2015 was highest in American Indians or Alaska Natives (18.4%) compared with whites, blacks, or Hispanics, with the lowest prevalence in Asians (11.3%).
- There is a higher burden of migraine in those aged 18-44 (17.9%), people who are unemployed (21.4%), those with family income less than $35,000 per year (19.9%), and the elderly and disabled (16.4%).
The prevalence and impact of migraine and severe headache in the United States: Figures and trends from government health studies. [Published online ahead of print March 12, 2018]. Headache. doi:10.1111/head.13281.
MedPAC to Congress: Eliminate MIPS
The Medicare Payment Advisory Commission has formally recommended to Congress that it repeal the Merit-based Incentive Payment System track of Medicare’s Quality Payment Program.
MedPAC “has concluded that ... the Merit-based Incentive Payment System (MIPS) will not fulfill its goals and therefore should be eliminated,” the commission said in its March 15 report to Congress. MedPAC added that the “basic design of MIPS is fundamentally incompatible with the goals of a beneficiary-focused approach to quality measurement.”
MedPAC adds that, by the Centers for Medicare & Medicaid Services’ own estimates, more than half of clinicians will be exempt from reporting on MIPS, based on the low-volume threshold that exempts providers who bill for $90,000 or less in Medicare claims or see 200 or fewer Medicare patients.
The advisory panel also highlighted other flaws. Those include MIPS’ onerous reporting burden; measures that do not allow for meaningful comparisons among clinicians; differing rules for clinicians depending on location, practice size, and other factors; and payment adjustments that could vary wildly from year to year, creating financial uncertainty for physicians.
The commission, which voted 14-2 in favor of eliminating MIPS, also recommended it be replaced with a “voluntary value program.” But it has offered Congress only a conceptual direction for that replacement program.
“This voluntary value program (VVP) is based on the premise that patient outcomes rely on the combined contributions of clinicians and emphasizes that quality improvement is a collective effort,” according to the report.
The VVP would measure all clinicians based on the same set of measures: clinical quality, patient experience, and value. And it would do so on a population level, rather than the individual patient level.
MedPAC sees the VVP not as an end goal in the transition to paying for value, but rather a stepping stone to get clinicians more comfortable with value-based payments en route to moving into the QPP’s advanced alternative payment model (A-APM) track.
“A VVP’s penalties and rewards might not be significant enough to meaningfully change clinician behavior,” the report stated. “However, the intent is to get clinicians comfortable with being measured in a manner similar to the way they would be in A-APMs. With that experience, clinicians would be poised to form or join robust A-APMs, under which the risk and reward are more meaningful, and the potential for true delivery system reform is within reach.”
There was a near unanimous consensus among MedPAC commissioners that MIPS is flawed, but not all commissioners were ready to give up on it – especially considering how much clinicians have already invested in the program.
MedPAC also heard from the American Medical Association, which voiced opposition to the idea of ending MIPS. In addition, the commission received written feedback from physicians against its proposal.
Other experts support preserving MIPS. Gail R. Wilensky, PhD, economist and senior fellow at Project Hope and a former top health aide to President George H.W. Bush, wrote in the New England Journal of Medicine that MIPS should be fixed rather than scrapped.
CDC: Beware Brazil yellow fever outbreak
The Centers for Disease Control and Prevention recommends that travelers who haven’t been vaccinated against yellow fever should avoid travel to Brazil, according to a media teleconference by CDC officials.
“The most important new recommendation ... is that travelers should not go to these yellow fever hot spots in Brazil, unless they are vaccinated,” stated Martin Cetron, MD, director of the Division of Global Migration and Quarantine at the CDC. “Health officials in Brazil recently confirmed more than 920 cases of yellow fever, including more than 300 deaths, during this outbreak” he added.
Since the beginning of 2018, 10 travel-related cases of yellow fever have been reported among international travelers returning from Brazil. Four of these travelers died. All 10 travelers had not received the yellow fever vaccine. Of these 10 travelers, 8 acquired the disease on Ilha Grande, an island off the coast of Rio De Janeiro that is popular among tourists.
The CDC is urging travelers to get vaccinated because of the potentially fatal effects of yellow fever. Vaccinations are recommended for any eligible person 9 months of age or older traveling to Brazil, specifically Espírito Santo, São Paulo, and Rio de Janeiro states, and certain cities in Bahia state, as well as Ilha Grande in particular.
Individuals heading to Brazil should receive the vaccination at least 10 days before travel. If a traveler is unvaccinated and cannot get the vaccination in the appropriate amount of time, areas where vaccination is recommended should be avoided.
The Food and Drug Administration–approved yellow fever vaccine, YF-VAX, is not currently available because of manufacturing issues. Stamaril, another yellow fever vaccine, is available at a limited number of yellow fever vaccination clinics in the United States.
In light of these supply issues, the CDC has provided resources to locate yellow fever vaccination clinics.
Dr. Cetron reemphasized that unvaccinated individuals planning to vacation in Brazil may want to reconsider their travel plans.
“People who have never been vaccinated against yellow fever should not travel to the areas in Brazil affected by the outbreak. Particularly the hot spot of Ilha Grande.”
Information for clinicians and travelers is available on the travel notice portion of the CDC site. The travel notice for Brazil includes a map of the yellow fever–affected areas in Brazil, as well as other informational resources.
The related CDC Morbidity and Mortality Weekly Report is available online.
Match Day 2018: A slow year for dermatology
according to the National Resident Matching Program (NRMP).
The 2018 Match also set new highs for total positions offered (up 4.4% over last year), total positions filled (up 4.7%), PGY-1 positions (up 4.9%) filled, and total applicants (up 1.7%). “The results of the Match are closely watched because they can be predictors of future physician workforce supply. There also is significant interest in the competitiveness of specialties, as measured by the percentage of positions filled overall and the percentage filled by senior students in U.S. allopathic medical schools,” the NRMP said.