User login
Retinal vessel diameter in children may offer window into future CVD risk
Body mass index, blood pressure, and physical activity all affect retinal vessel diameters, authors of the meta-analysis found.
The findings raise the possibility that, one day, clinicians could help “substantially counteract” the increasing burden of adult cardiovascular disease by diagnosing retinal microvascular impairments early in life, according to investigator Sabrina Köchli, MSc, and her colleagues with the department of sport, exercise, and health at the University of Basel (Switzerland).
“Regular retinal vessel screening may have the potential to be implemented in future medical examination programs to optimize therapy guidance in children and adolescents,” Ms. Köchli and her colleagues wrote in the journal Pediatrics.
The meta-analysis by Ms. Köchli and her coauthors included 11 studies looking at the association between BMI, blood pressure, or physical activity in children.
They found that higher BMI was associated with narrower retinal arteriolar diameters and wider venular diameters in 8 studies including a total of 5,003 participants. The pooled estimate effect size was –0.37 for the association between BMI and retinal arteriolar diameters and 0.35 for the association between BMI and retinal venular diameters, data showed.
Higher blood pressure likewise was associated with narrower retinal arteriolar diameters in 6 studies including 7,687 participants, with a pooled estimate of –0.63 for systolic blood pressure and –0.60 for diastolic blood pressure.
Several studies individually showed that physical activity was associated with retinal vessel diameters. For example, one German study of school children showing that physical inactivity was associated with a lower arteriolar-to-venular diameter. And an Australian study found that more time spent outdoors engaged in physical activity was tied to wider arteriolor diameters and that sedentary behavior was linked to narrower arteriolor diameters. However, because of differences among the studies in how physical activity or inactivity was measured, meta-analysis was not possible, the investigators said.
Retinal vessels, part of the cerebrovascular bed, have been described as a “window to the heart,” Ms. Köchli and her coauthors said in their report. Previous investigations have recently shown that retinal vessel diameters may predict cardiovascular outcomes in adults over the long term.
That suggests retinal vessel diameters are a “reproducible biomarker” that adds value in determining atherosclerotic cardiovascular disease risk, the authors commented.
“However, future researchers will have to ensure that retinal vessel imaging during childhood development has a prognostic value for the adult clinical outcome of pediatric populations,” they added.
No external funding was received for the study. Ms. Köchli and her coauthors had no financial disclosures or potential conflicts of interest to disclose.
SOURCE: Köchli S et al. Pediatrics. 2018;141(6):e20174090
Currently, retinal vessel diameters are not a strong contender for clinical risk prediction, Alan E. Simon, MD, and Matthew W. Gillman, MD, wrote in an editorial commenting on the study by Köchli et al.
However, the concept has “intuitive appeal because the eye provides the opportunity to view systemic arteries and veins directly,” wrote Dr. Simon and Dr. Gillman.
The association between childhood retinal vessel diameters and cardiovascular endpoints in adults has not been evaluated, understandably, because of the very long follow-up that would be required. And even though studies have suggested that there might be some small added benefit for women in adding adult retinal vessel diameters to other cardiovascular risk prediction scores, the same does not appear to be true for men.
Even if childhood retinal vessel diameters had strong predictive value, it’s still not clear whether the retinal vessel evaluation would be useful for pediatricians grouping patients into risk categories for strokes or heart attacks at some point in the future.
Likewise, using retinal vessel diameters as an outcome measure in clinical trials is not justified at present, although that could change in the future.
“As technological advances make this novel assessment more available to clinicians, we hope that such availability is accompanied by additional evidence for or against its usefulness among clinicians and researchers,” the authors said in the editorial.
Body mass index, blood pressure, and physical activity all affect retinal vessel diameters, authors of the meta-analysis found.
The findings raise the possibility that, one day, clinicians could help “substantially counteract” the increasing burden of adult cardiovascular disease by diagnosing retinal microvascular impairments early in life, according to investigator Sabrina Köchli, MSc, and her colleagues with the department of sport, exercise, and health at the University of Basel (Switzerland).
“Regular retinal vessel screening may have the potential to be implemented in future medical examination programs to optimize therapy guidance in children and adolescents,” Ms. Köchli and her colleagues wrote in the journal Pediatrics.
The meta-analysis by Ms. Köchli and her coauthors included 11 studies looking at the association between BMI, blood pressure, or physical activity in children.
They found that higher BMI was associated with narrower retinal arteriolar diameters and wider venular diameters in 8 studies including a total of 5,003 participants. The pooled estimate effect size was –0.37 for the association between BMI and retinal arteriolar diameters and 0.35 for the association between BMI and retinal venular diameters, data showed.
Higher blood pressure likewise was associated with narrower retinal arteriolar diameters in 6 studies including 7,687 participants, with a pooled estimate of –0.63 for systolic blood pressure and –0.60 for diastolic blood pressure.
Several studies individually showed that physical activity was associated with retinal vessel diameters. For example, one German study of school children showing that physical inactivity was associated with a lower arteriolar-to-venular diameter. And an Australian study found that more time spent outdoors engaged in physical activity was tied to wider arteriolor diameters and that sedentary behavior was linked to narrower arteriolor diameters. However, because of differences among the studies in how physical activity or inactivity was measured, meta-analysis was not possible, the investigators said.
Retinal vessels, part of the cerebrovascular bed, have been described as a “window to the heart,” Ms. Köchli and her coauthors said in their report. Previous investigations have recently shown that retinal vessel diameters may predict cardiovascular outcomes in adults over the long term.
That suggests retinal vessel diameters are a “reproducible biomarker” that adds value in determining atherosclerotic cardiovascular disease risk, the authors commented.
“However, future researchers will have to ensure that retinal vessel imaging during childhood development has a prognostic value for the adult clinical outcome of pediatric populations,” they added.
No external funding was received for the study. Ms. Köchli and her coauthors had no financial disclosures or potential conflicts of interest to disclose.
SOURCE: Köchli S et al. Pediatrics. 2018;141(6):e20174090
Key clinical point: In children, retinal vessel diameters may be sensitive biomarkers for cardiovascular risk stratification.
Major finding: BMI was associated with retinal arteriolar and venular diameters; blood pressure also was associated with retinal arteriolar diameters.
Study details: A meta-analysis of 11 studies.
Disclosures: No external funding was received for the study. Authors reported that they had no financial disclosures or potential conflicts of interest.
Source: Köchli S et al. Pediatrics. 2018;141(6):e20174090.
Woman’s Pain is Per-cyst-ent
ANSWER
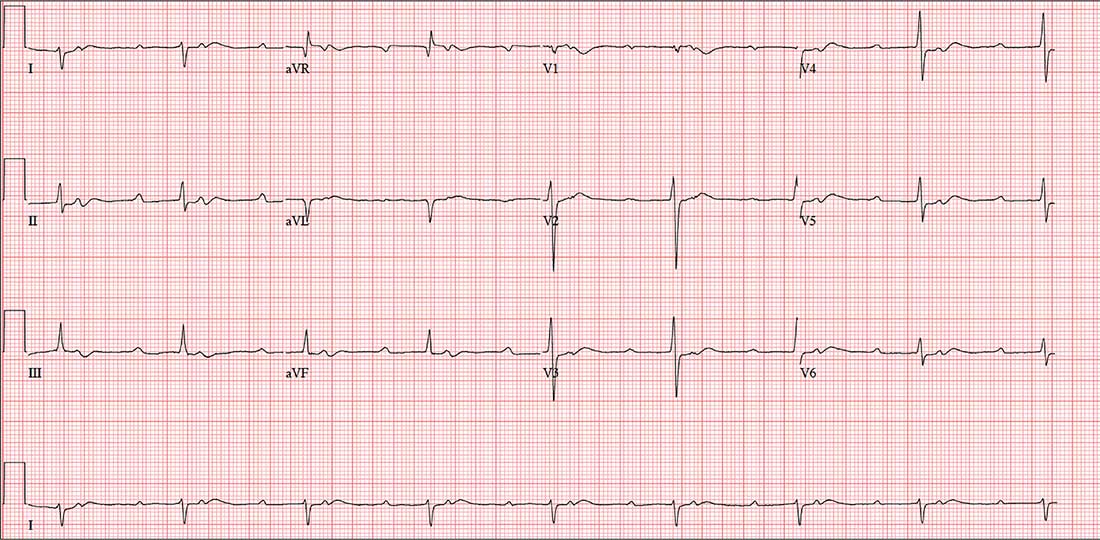
The correct interpretation includes sinus tachycardia with second-degree type 2 (Mobitz II) block, 2:1 AV conduction, and a right-axis deviation.
The P-P interval is 100 beats/min—twice the rate of the QRS complexes. A consistent PR interval > 200 ms supports the diagnosis of first-degree AV block, as the ratio of two P waves for every QRS does for 2:1 AV conduction. Finally, a right-axis deviation is evidenced by an axis > 90°.
These findings are suggestive of AV nodal disease and may explain the patient’s recent increase in fatigue (noted in the review of systems).
ANSWER
The correct interpretation includes sinus tachycardia with second-degree type 2 (Mobitz II) block, 2:1 AV conduction, and a right-axis deviation.
The P-P interval is 100 beats/min—twice the rate of the QRS complexes. A consistent PR interval > 200 ms supports the diagnosis of first-degree AV block, as the ratio of two P waves for every QRS does for 2:1 AV conduction. Finally, a right-axis deviation is evidenced by an axis > 90°.
These findings are suggestive of AV nodal disease and may explain the patient’s recent increase in fatigue (noted in the review of systems).
In the past six to eight months, a 58-year-old woman has experienced abnormal vaginal bleeding and a “heavy” feeling in her lower abdomen. She has also noticed pelvic pain with intercourse. About two months ago, she began having difficulty emptying her bladder. Abdominal CT and MRI revealed a 3-cm cyst of the right ovary. She is scheduled for laparoscopic surgery to remove it and presents for preoperative assessment.
The patient is G3P2A1 and transitioned through menopause at age 53. Medical history is remarkable for gestational diabetes during her second pregnancy; she has had no further symptoms or findings to support the diagnosis since. Both children were delivered by uncomplicated vaginal delivery. During her third pregnancy, she miscarried at 12 weeks.
She has no history of cardiac or pulmonary disease. Surgical history is remarkable for an open reduction internal fixation of a left high ankle fracture at age 18 and for dilation and curettage following her miscarriage.
Social history reveals a 30-year marriage and employment as a tax accountant. The patient drinks one to two glasses of wine nightly and has never smoked. She did try marijuana briefly during college but hasn’t used any illicit substances since.
Family history is positive for coronary artery disease (father) and hypothyroidism (mother). Her children, now adults, are alive and well, with no known medical problems.
Current medications include ibuprofen for abdominal discomfort and diazepam for anxiety; she started the latter after receiving her CT and MRI results. She has no known drug or food allergies.
Review of systems reveals a two-month history of decreased energy and stamina. She denies palpitations or skipped heart beats and shortness of breath or dyspnea on exertion. She does say that she fatigues more easily than she did three months ago. The remainder of the review is uneventful.
Vital signs include a blood pressure of 108/72 mm Hg; pulse, 50 beats/min; respiratory rate, 14 breaths/min-1; temperature, 97.6°F; and O2 saturation, 98% on room air. Her weight is 158 lb and her height, 66 in.
Physical exam reveals an anxious but alert woman in no apparent distress. Corrective lenses are present. There is no evidence of thyromegaly or jugular venous distention. The lungs are clear in all fields. The cardiac exam reveals a regular rate of 50 beats/min with a regular rhythm. There are no murmurs, rubs, or extra heart sounds.
The breasts are well developed and symmetrical, with no discharge. The abdomen is soft and nontender. She states that palpation of the right lower quadrant is uncomfortable but not painful. The ovarian mass is not palpable. Vaginal and rectal exams are deferred.
Her extremities reveal full range of motion with strong peripheral pulses bilaterally. A well-healed surgical scar is present on the lateral aspect of her left lower leg. The neurologic exam is grossly intact, without focal signs.
A preoperative ECG shows a ventricular rate of 50 beats/min; PR interval, 432 ms; QRS duration, 102 ms; QT/QTc interval, 456/415 ms; P axis, 67°; R axis, 131°; and T axis, –29°. What is your interpretation?
FDA approves dabrafenib/trametinib for BRAF-positive anaplastic thyroid cancer
FDA approval was based on results from an open-label clinical trial of patients with various rare, BRAF V600E–positive cancers. In a group of 23 patients, 57% experienced a partial response and 4% experienced a full response. In the response group, nine patients had no significant tumor growth for a period of at least 6 months.
The most common side effects of dabrafenib/trametinib are fever, rash, chills, headache, joint pain, cough, fatigue, nausea, vomiting, diarrhea, myalgia, dry skin, decreased appetite, edema, hemorrhage, high blood pressure, and difficulty breathing. Both drugs can cause damage to developing fetuses, and women should be advised to use proper contraception.
“This approval demonstrates that targeting the same molecular pathway in diverse diseases is an effective way to expedite the development of treatments that may help more patients,” Richard Pazdur, MD, director of the FDA’s Oncology Center of Excellence, said in the press release.
Find the full press release on the FDA website.
Uninsured rate on the rise
The uninsured rate among Americans aged 19-64 years, which was 12.7% in early 2016, has climbed to 15.5%, according to a survey by the Commonwealth Fund.
Medicaid expansion has had a significant effect on that increase. The uninsured rate among working-age adults living in states that did not expand their Medicaid programs has gone from 16.1% in 2016 to 21.9% in 2018, while the rate in states that did expand Medicaid rose from 10.4% to 11.4% over that same time, Commonwealth Fund researchers said in reporting the results of their latest (Feb. 6, 2018, to March 30, 2018) Affordable Care Act Tracking Survey.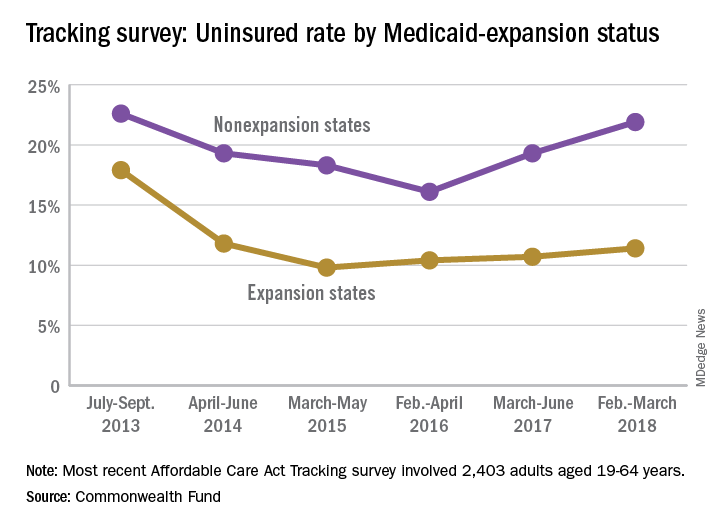
A similar increase/decrease since 2016 was experienced by respondents who identified as Democrats: The rate for the group went from 9.9% in 2016 to 10.4% in 2017 and then dropped to 9.1% in 2018. Those identifying as Republicans started with a lower rate of 7.9% in 2016 but have since seen it rise to 9.9% in 2017 and 13.9% in 2018, results from the survey of 2,403 adults showed.
“In the absence of bipartisan support for federal action [on the ACA], legislative activity has shifted to the states. Eight states have received, or are currently applying for, federal approval to establish reinsurance programs in their states,” the investigators wrote, but “leaving policy innovation to states will ultimately lead to a patchwork quilt of coverage and access to health care across the country, a dynamic that will fuel inequity in overall health, productivity, and well-being.”
How anesthesia in the GI endoscopy suite contributes to endoscopy malpractice
In a study of anesthesia medical malpractice cases involving gastrointestinal endoscopies, endoscopic retrograde cholangiopancreatography (ERCP) was the procedure that most often resulted in payouts to plaintiffs.
Lead author Alexander B. Stone, MD, of Brigham and Women’s Hospital, Boston, and his colleagues examined 58 malpractice cases involving anesthesia providers between January 2007 and December 2016 from the Controlled Risk Insurance Company (CRICO) Comparative Benchmarking System, a database representing about 30% of annual malpractice cases in the United States. Of these cases, 48% were associated with esophagogastroduodenoscopy, 19% involved ERCP, 14% resulted from colonoscopies, 14% stemmed from combined esophagogastroduodenoscopy and colonoscopy, and 5% involved endoscopic ultrasound. Investigators found that 91% of ERCP cases resulted in a payment to plaintiffs, compared with 37.5% of colonoscopy cases, 25% of combined esophagogastroduodenoscopy/colonoscopy cases, 21% of esophagogastroduodenoscopy cases, and 0% of endoscopic ultrasound cases, according to the study published in the April 24 Journal of Clinical Anesthesia.
Of all 58 claims, the mean payment was $99,754. When restricted to only claims that resulted in payment (22 cases), the mean payment rose to $275,510, and the median payment was $7,170. No significant difference existed in the percentage of cases that resulted in payment between high-, middle-, and low-severity cases.
The most common contributing factors to the alleged anesthesiology-related adverse events were lack of technical skill, clinical judgment errors, communication mishaps, and documentation problems. Within the technical skill category, technical problems from a known complication, poor technique, and failure to resuscitate were frequent contributing factors. Within the clinical judgment category, failure to monitor the physiological status of the patient was the most common subcategory noted.
Oversedation was another possible contributing factor in 62.5% of the cases, investigators found. For the purposes of this study, oversedation was defined as unexpected changes in the physiological state of the patient and/or unplanned intubation for a patient undergoing monitored anesthesia care. But the authors concluded that oversedation alone did not lead to liability for anesthesia providers practicing in the endoscopy suite; rather, it was allegations of technical and clinical judgment failures, such as the inability to recognize acute clinical deterioration or manage difficulty, that most often resulted in settlements to plaintiffs. The analysis also suggested that even when adverse events occured in the endoscopy suite, anesthesiologists were less likely to be found liable when highly trained and well-equipped anesthesia providers were readily available.
The authors concluded that it is critical to have a well-prepared anesthesia provider when medically complex patients are undergoing endoscopic procedures.
The authors had no disclosures.
SOURCE: Stone AB et al. J Clin Anesth. 2018 Apr 24;48:15-20.
* This story was updated on June 7, 2018.
FROM THE JOURNAL OF CLINICAL ANESTHESIA
Key clinical point: In a study of anesthesia medical malpractice cases involving gastrointestinal endoscopies, endoscopic retrograde cholangiopancreatography (ERCP) most often resulted in payouts to plaintiffs.
Major finding: Of 58 anesthesia malpractice cases, 11 involved ERCP. Of those, 10 cases (91%) resulted in a payment to plaintiffs.
Study details: A study of 58 malpractice cases involving anesthesia providers from the Controlled Risk Insurance Company (CRICO) Comparative Benchmarking System.
Disclosures: There were no disclosures.
Source: Stone AB et al. J Clin Anesth. 2018 Apr 24;48:15-20.
Novel targeted cancer drugs cause fewer arrhythmias
ORLANDO – Not all oncology drugs are equal when it comes to their risk of treatment-induced cardiac arrhythmias.
Indeed, compared with anthracycline-based regimens, long the workhorse in treating many forms of cancer, the novel targeted agents – tyrosine kinase inhibitors, immune checkpoint inhibitors, and monoclonal antibodies – were 40% less likely to result in a new arrhythmia diagnosis within 6 months of treatment initiation, in a large, single-center retrospective study reported by Andrew Nickel at the annual meeting of the American College of Cardiology.

Overall, 14% of cancer patients developed a first-ever cardiac arrhythmia within the first 6 months after treatment began. In a Cox multivariate analysis, treatment with a targeted cancer agent was independently associated with a 40% lower risk of arrhythmia, compared with anthracycline-containing therapy. Of note, the incidence of new-onset atrial fibrillation was closely similar in the two groups.
Several patient factors emerged as independent predictors of increased risk of cancer treatment–induced arrhythmia in the multivariate analysis: male sex, with a 1.2-fold increased risk; baseline heart failure, with a 2.2-fold risk; and hypertension, which conferred a 1.6-fold increased risk. These are patient groups in which the novel targeted cancer treatments are a particularly attractive option from the standpoint of mitigating arrhythmia risk, provided their use would be appropriate, he observed.
Mr. Nickel reported having no financial conflicts regarding his study, which was conducted free of commercial support.
SOURCE: Nickel A et al. ACC 18. Abstract 900-06.
ORLANDO – Not all oncology drugs are equal when it comes to their risk of treatment-induced cardiac arrhythmias.
Indeed, compared with anthracycline-based regimens, long the workhorse in treating many forms of cancer, the novel targeted agents – tyrosine kinase inhibitors, immune checkpoint inhibitors, and monoclonal antibodies – were 40% less likely to result in a new arrhythmia diagnosis within 6 months of treatment initiation, in a large, single-center retrospective study reported by Andrew Nickel at the annual meeting of the American College of Cardiology.
Overall, 14% of cancer patients developed a first-ever cardiac arrhythmia within the first 6 months after treatment began. In a Cox multivariate analysis, treatment with a targeted cancer agent was independently associated with a 40% lower risk of arrhythmia, compared with anthracycline-containing therapy. Of note, the incidence of new-onset atrial fibrillation was closely similar in the two groups.
Several patient factors emerged as independent predictors of increased risk of cancer treatment–induced arrhythmia in the multivariate analysis: male sex, with a 1.2-fold increased risk; baseline heart failure, with a 2.2-fold risk; and hypertension, which conferred a 1.6-fold increased risk. These are patient groups in which the novel targeted cancer treatments are a particularly attractive option from the standpoint of mitigating arrhythmia risk, provided their use would be appropriate, he observed.
Mr. Nickel reported having no financial conflicts regarding his study, which was conducted free of commercial support.
SOURCE: Nickel A et al. ACC 18. Abstract 900-06.
REPORTING FROM ACC 2018
Key clinical point: The novel targeted cancer therapies cause markedly fewer cardiac arrhythmias.
Major finding: Cancer patients treated with a tyrosine kinase inhibitor, immune checkpoint inhibitor, or another of the novel targeted therapies were 40% less likely than were those on anthracycline-based therapy to develop a treatment-induced cardiac arrhythmia up to 6 months after treatment initiation.
Study details: This was a retrospective single-center study including more than 5,000 cancer patients.
Disclosures: The presenter reported having no financial conflicts regarding his study, which was conducted free of commercial support.
Source: Nickel A et al. ACC 18, Abstract #900-06.
VIDEO: Anemia more than doubles risk of postpartum depression
AUSTIN, TEX. – The risk of depression was more than doubled in women who were anemic during pregnancy, according to a recent retrospective cohort study of nearly 1,000 women. Among patients who had anemia at any point, the relative risk of screening positive for postpartum depression was 2.25 (95% confidence interval, 1.22-4.16).
The video associated with this article is no longer available on this site. Please view all of our videos on the MDedge YouTube channel
“This was an unexpected finding,” said Shannon Sutherland, MD, of the University of Connecticut, Farmington, in an interview after she presented the findings at the annual clinical and scientific meeting of the American College of Obstetricians and Gynecologists.
“Maternal suicide exceeds hemorrhage and hypertensive disease as a cause of U.S. maternal mortality,” wrote Dr. Sutherland and her collaborators in the poster accompanying the presentation. And anemia is common: “Anemia in pregnancy can be as high as 27.4% in low-income minority pregnant women in the third trimester,” they wrote.
“If we can find something like this that affects depression, and screen for it and correct for it, we can make a real big difference in patients’ lives,” said Dr. Sutherland in a video interview. “Screening for anemia ... is such a simple thing for us to do, and I also think it’s very easy for us to correct, and very cheap for us to correct.”
The 922 study participants were at least 16 years old and receiving postpartum care at an outpatient women’s health clinic. Patients who had diseases that disrupted iron metabolism or were tobacco users, and those on antidepressants, anxiolytics, or antipsychotics were excluded from the study. Other exclusion criteria included anemia that required transfusion, and intrauterine fetal demise or neonatal mortality.
To assess depression, Dr. Sutherland and her colleagues administered the Edinburgh Postnatal Depression Scale at routine postpartum visits. Dr. Sutherland and her coinvestigators calculated the numbers of respondents who fell above and below the cutoff for potential depression on the 10-item self-report scale. They then looked at the proportion of women who scored positive for depression among those who were, and those who were not, anemic.
Possible depression was indicated by depression scale scores of 9.2% of participants, while three quarters (75.2%) were anemic either during pregnancy or in the immediate postpartum period. Among anemic patients, 10.8% screened positive for depression, while 4.8% of those without anemia met positive screening criteria for postpartum depression (P = .007).
Dr. Sutherland and her collaborators noted that fewer women in their cohort had postpartum depression than the national average of 19%. They may have missed some patients who would later develop depression since the screening occurred at the first postpartum visit; also, “it is possible that women deeply affected by [postpartum depression] may have been lost to follow-up,” they wrote.
Participants had a mean age of about 26 years, and body mass index was slightly higher for those with anemia than without (mean, 32.2 vs 31.2 kg/m2; P = .025).
Postpartum depression was not associated with marital status, substance use, ethnicity, parity, or the occurrence of postpartum hemorrhage, in the investigators’ analysis.
Dr. Sutherland said that, in their analysis, she and her coinvestigators did not find an association between degree of anemia and the likelihood, or severity, of postpartum depression. However, they did find that anemia of any degree in the immediate peripartum period was most strongly associated with postpartum depression.
Though the exact mechanism of the anemia-depression link isn’t known, the fatigue associated with anemia may help predispose women to postpartum depression, said Dr. Sutherland. Also, she said, “iron can make a difference in synthesizing neurotransmitters” such as serotonin, “so it may follow that you might have some depressive symptoms.”
“The next step after this study, which was a launching point, is to see if we correct the degree of anemia and bring them to normal levels, if that can help decrease the risk of postpartum depression,” said Dr. Sutherland.
Dr. Sutherland and her coinvestigators reported that they had no relevant financial disclosures.
SOURCE: Sutherland S et al. ACOG 2018. Abstract 35C.
REPORTING FROM ACOG 2018

VIDEO: Doula care could avert over 200,000 cesareans annually
AUSTIN, TEX. – Having a trained doula in attendance at labor and delivery for nulliparous women could be a cost-effective strategy to prevent hundreds of thousands of cesarean deliveries yearly, according to a new analysis of the practice.
“We were interested in looking at the cost-effectiveness of having a professional doula at labor and delivery,” said Karen Greiner, a medical student at Oregon Health and Sciences University, Portland. She and her colleagues had their interest sparked after reading a Cochrane review that found reduced rates of cesarean delivery and shortened labor times with continuous support during labor, she said in an interview.
The cost-effectiveness analysis, presented during a poster session of the annual clinical and scientific meeting of the American College of Obstetricians and Gynecologists, used a two-delivery model to track the effect of doula attendance at a nulliparous term labor and delivery. Since most women in the United States have two deliveries, the researchers analyzed what effect having a doula attend the first delivery would have on the subsequent pregnancy as well.
Ms. Greiner and her colleagues used a theoretical cohort of 1.8 million women, about the number of nulliparous women with term deliveries in the United States annually, to see what effect doula care would have on cost and maternal outcomes. “We found that there was a significant reduction in cesarean deliveries – almost 220,000 – when a woman had a professional doula with her during labor and delivery, versus not having that doula support,” Ms. Greiner said in a video interview. “We also found a reduction in maternal deaths ... a reduction in uterine rupture, also in hysterectomies.”
The 51 maternal deaths, 382 uterine ruptures, and 100 subsequent hysterectomies averted by use of doulas would result in an increase of 7,227 quality-adjusted life years, the effectiveness metric chosen for the analysis. However, this benefit would come at an increased cost of $207 million for the theoretical cohort.
“We did find that doulas are expensive, that they do cost money,” acknowledged Ms. Greiner. She and her coauthors allocated $1,000 per doula – the median cost for doula attendance at labor and delivery in Portland, Ore. – in the model used for cost-effectiveness analysis.
“Overall, we found that having a doula during a woman’s labor and delivery is cost-effective up to $1,286 for the cost of the doula” when quality-adjusted life years are taken into account, said Ms. Greiner.
She reported having no relevant financial disclosures.
SOURCE: Greiner K et al. ACOG 2018. Abstract 25C.
REPORTING FROM ACOG 2018

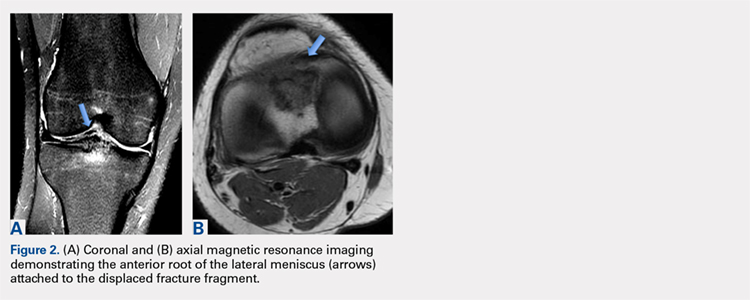
Avulsion of the Anterior Lateral Meniscal Root Secondary to Tibial Eminence Fracture
ABSTRACT
The lateral tibial eminence shares a close relationship with the anterior root of the lateral meniscus. Limited studies have reported traumatic injury to the anterior meniscal roots in the setting of tibial eminence fractures, and reported rates of occurrence of concomitant meniscal and chondral injuries vary widely. The purpose of this article is to describe the case of a 28-year-old woman who had a complete avulsion of the anterolateral meniscal root caused by a tibial eminence fracture with resultant malunion and root displacement. The anterolateral meniscal root was anatomically repaired following arthroscopic resection of the malunited fragment.
The lateral tibial eminence is intimately associated with the root attachment of the anterior horn of the lateral meniscus.1-3 Previous studies have demonstrated both the close proximity of the anterior cruciate ligament (ACL) insertion to the meniscal roots and the potential for disruption in surgical interventions, such as tibial tunnel drilling in ACL reconstruction or placement of intramedullary tibial nails.4-6 The meniscal roots play a crucial role in force distribution, and disruption of these structures has been shown to significantly increase joint contact forces. Despite the deleterious effects of this injury, limited studies have reported on traumatic injury to the meniscal roots in the setting of tibial eminence fractures.
Reported rates of occurrence of concomitant meniscal and chondral injuries occurring with tibial eminence fractures vary widely, ranging from <5% to 40%.7,8 Although fractures to the tibial eminence are more common in children, an association between these injuries and concomitant soft tissue injuries, including meniscal, chondral, and collateral ligament injuries, in the adult population has been reported.7 Monto and Cameron-Donaldson8 used magnetic resonance imaging (MRI) to evaluate tibial eminence fractures in adults and found that 23% of study subjects had associated medial meniscus tears and 18% had lateral meniscus tears. In a similar study, Ishibashi and colleagues9 found that 25% of tibial eminence fractures were associated with lateral meniscus tears and 16% with medial meniscus tears.
These studies demonstrate the potential for meniscus injuries during tibial eminence fractures. However, the authors are unaware of any reports of complete tearing of the anterior horn of the lateral meniscus in association with this injury. This is an important injury to recognize and identify intraoperatively because an injury of this nature could potentially compromise the mechanical loading patterns and health of the articular cartilage of the lateral compartment of the knee. The purpose of this article is to describe a complete avulsion of the anterolateral meniscal root due to a tibial eminence fracture with resultant malunion and displacement of the root in a nonanatomical position. The patient provided written informed consent for print and electronic publication of this case report.
Continue to: A 28-year-old active woman...
CASE
A 28-year-old active woman presented to our clinic 22 months after sustaining a right knee tibial eminence fracture that was initially treated with extension immobilization, which resulted in a fibrous malunion. She subsequently sustained a second injury resulting in displacement of the malunion fracture fragment, and was treated at another institution 10 months prior to presentation at our clinic with arthroscopic reduction and internal fixation with a cannulated screw and washer of the tibial eminence fracture. This was followed by hardware removal 6 months prior to her office visit at our clinic. At presentation, she reported worsening right knee pain, mechanical symptoms, and loss of both flexion and extension compared with her uninjured knee. Conservative management, including activity modification, extensive physical therapy, and anti-inflammatory medication following her most recent procedure, had not resulted in improvement of her symptoms.
Physical examination revealed significantly reduced knee flexion and extension (+15°-120° on the affected side compared with 5° of hyperextension to 130° flexion of the contralateral knee). Ligamentous examination demonstrated no laxity with varus or valgus stress at 0° to 30° of flexion, negative posterior drawer, and a Grade 2 Lachman and positive pivot shift. She also exhibited pain with attempted right knee terminal extension. Radiographs and computed tomography scans were obtained and reviewed. They revealed a malunited tibial eminence fracture (Figures 1A-1D). 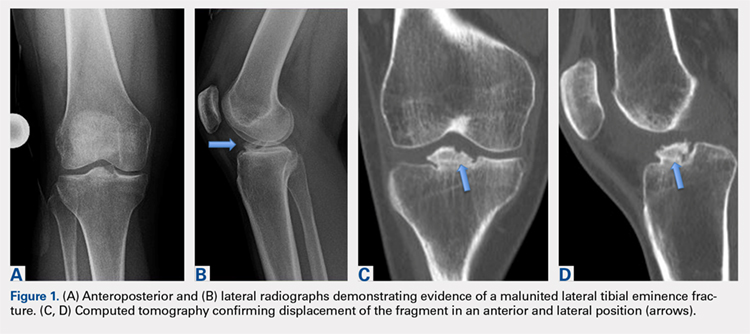
Arthroscopic assessment of the right knee demonstrated the large osseous fragment located in the anterolateral aspect of the joint with the displaced anterior horn of the lateral meniscus attached as well as significant anterior impingement limiting knee extension. Probing of the anterolateral meniscal root in the lateral compartment showed abundant surrounding scar tissue with an abnormal attachment, representing a chronic root avulsion. A mechanical shaver was used to débride the scar tissue and expose the malunited fragment, followed by complete osseous fragment excision with a high-speed burr (Figure 3). 
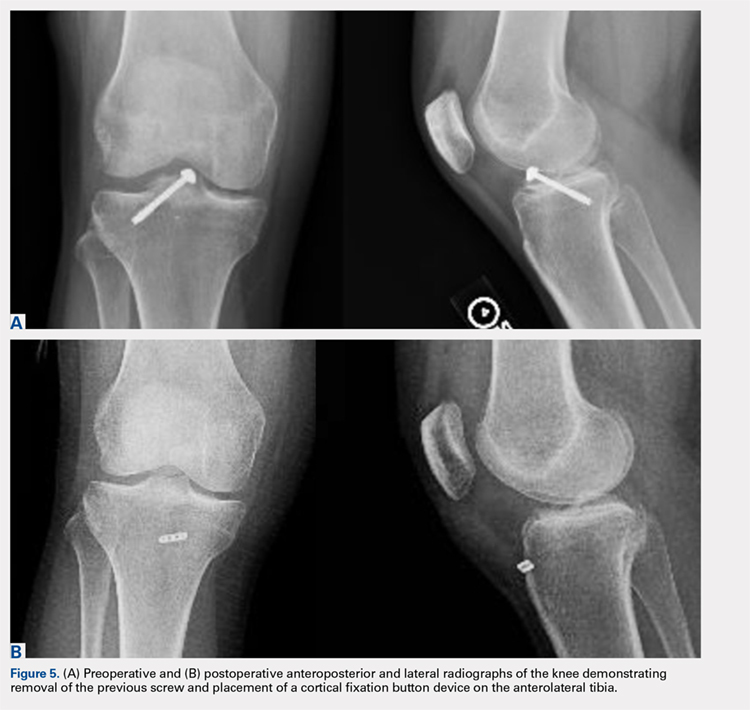
A soft tissue anterolateral meniscal root repair was performed by creating a 2-cm to 3-cm incision on the anterolateral tibia, just distal to the medial aspect of the Gerdy tubercle. To best restore the footprint of the repair and increase the potential for biologic healing, 2 transtibial tunnels were created at the location of the root attachment. An ACL aiming device with a cannulated sleeve was used to drill 2 bony tunnels approximately 5 mm apart, exiting at the anatomic root footprint. The drill pins were removed, leaving the 2 cannulas in place for later suture passage. A suture-passing device was used to pass 2 separate sutures through the detached meniscal root. 
Continue to: Postoperatively, the patient was placed...
Postoperatively, the patient was placed on a non-weight-bearing protocol for her operative lower extremity for 6 weeks. A brace locked in extension was used for the same period of time (being removed only for physical therapy exercises). Enoxaparin was used for the first 2 weeks for deep vein thrombosis prophylaxis, followed by aspirin for an additional 4 weeks. Physical therapy was started on postoperative day 1 to begin working on early passive ROM exercises. Knee flexion was limited to 0° to 90° of flexion for the first 2 weeks and then progressed as tolerated.
DISCUSSION
This article describes a rare case of a patient with lateral meniscal anterior root avulsion in the setting of a tibial eminence fracture with subsequent malunion and root displacement. In a case such as this, delineation of the true extent of the injury is difficult because the anterior meniscal root can be torn, displaced, and nonanatomically scarred to surrounding soft tissues, making MRI interpretation challenging. Clinically, patients can present with a wide range of symptoms, including pain, mechanical symptoms, instability, and loss of knee motion.10
The anterior root of the lateral meniscus has been reported to be attached anterior to the lateral tibial eminence and adjacent to the insertion of the ACL. Fibrous connections extending from the anterior horn of the lateral meniscus attachment to the lateral tibial eminence are constant.11 Furumatsu and colleagues12 demonstrated the existence of dense fibers linking the anterior root of the lateral meniscus with the lateral aspect of the ACL tibial insertion. Acknowledging the close relationship of these structures is key to comprehending the importance of evaluating the anterior horn of the lateral meniscus in cases of tibial eminence fractures at the initial time of injury. Failure to diagnose this pathology can lead to poor clinical outcomes and early degenerative changes of the knee.
Tibial intercondylar eminence avulsion fractures are most likely to occur in children and adolescents, and are equivalent to an ACL tear in adults.13 When tibial eminence fractures occur in an older cohort, they are often combined with lesions of the menisci, capsule, or collateral ligaments.14 The initial injury in our patient demonstrated concomitant anterior root injury that progressed with time to nonanatomical healing of the root, leading to altered biomechanics. Surgical techniques available for meniscal root repair are broadly divided into transosseous suture repairs and suture anchor repairs.10 The transtibial pullout technique using 2 transtibial bone tunnels as described in this report is the senior author’s (RFL) preference because it provides a strong construct with minimal displacement of the repaired meniscus.15-17
This article describes a complete avulsion of the anterolateral meniscal root caused by a tibial eminence fracture with resultant malunion and displacement of the root in a nonanatomic position. Anterior meniscal root tears have been reported to result in altered biomechanics and force transmission across the knee, and therefore, anatomic repair of the anterior root is indicated.
1. James EW, LaPrade CM, Ellman MB, Wijdicks CA, Engebretsen L, LaPrade RF. Radiographic identification of the anterior and posterior root attachments of the medial and lateral menisci. Am J Sports Med. 2014;42(11):2707-2714. doi:10.1177/0363546514545863.
2. LaPrade CM, Foad A, Smith SD, et al. Biomechanical consequences of a nonanatomic posterior medial meniscal root repair. Am J Sports Med. 2015;43(4):912-920. doi:10.1177/0363546514566191.
3. LaPrade CM, James EW, Cram TR, Feagin JA, Engebretsen L, LaPrade RF. Meniscal root tears: a classification system based on tear morphology. Am J Sports Med. 2015;43(2):363-369. doi:10.1177/0363546514559684.
4. Ellman MB, James EW, LaPrade CM, LaPrade RF. Anterior meniscus root avulsion following intramedullary nailing for a tibial shaft fracture. Knee Surg Sports Traumatol Arthrosc. 2015;23(4):1188-1191. doi:10.1007/s00167-014-2941-5.
5. Padalecki JR, Jansson KS, Smith SD, et al. Biomechanical consequences of a complete radial tear adjacent to the medial meniscus posterior root attachment site: in situ pull-out repair restores derangement of joint mechanics. Am J Sports Med. 2014;42(3):699-707. doi:10.1177/0363546513499314.
6. LaPrade CM, Jisa KA, Cram TR, LaPrade RF. Posterior lateral meniscal root tear due to a malpositioned double-bundle anterior cruciate ligament reconstruction tibial tunnel. Knee Surg Sports Traumatol Arthrosc. 2015;23(12):3670-3673. doi:10.1007/s00167-014-3273-1.
7. Mitchell JJ, Sjostrom R, Mansour AA, et al. Incidence of meniscal injury and chondral pathology in anterior tibial spine fractures of children. J Pediatr Orthop. 2015;35(2):130-135. doi:10.1097/BPO.0000000000000249.
8. Monto RR, Cameron-Donaldson ML. Magnetic resonance imaging in the evaluation of tibial eminence fractures in adults. J Knee Surg. 2006;19(3):187-190.
9. Ishibashi Y, Tsuda E, Sasaki T, Toh S. Magnetic resonance imaging AIDS in detecting concomitant injuries in patients with tibial spine fractures. Clin Orthop Relat Res. 2005;(434):207-212.
10. Bhatia S, LaPrade CM, Ellman MB, LaPrade RF. Meniscal root tears significance, diagnosis, and treatment. Am J Sports Med. 2014;42(12):3016-3030. doi:10.1177/0363546514524162.
11. Ziegler CG, Pietrini SD, Westerhaus BD, et al. Arthroscopically pertinent landmarks for tunnel positioning in single-bundle and double-bundle anterior cruciate ligament reconstructions. Am J Sports Med. 2011;39(4):743-752. doi:10.1177/0363546510387511.
12. Furumatsu T, Kodama Y, Maehara A, et al. The anterior cruciate ligament-lateral meniscus complex: a histological study. Connect Tissue Res. 2016;57(2):91-98. doi:10.3109/03008207.2015.1081899.
13. Lubowitz JH, Grauer JD. Arthroscopic treatment of anterior cruciate ligament avulsion. Clin Orthop Rel Res. 1993;(294):242-246.
14. Falstie-Jensen S, Sondergard Petersen PE. Incarceration of the meniscus in fractures of the intercondylar eminence of the tibia in children. Injury. 1984;15(4):236-238.
15. LaPrade CM, LaPrade MD, Turnbull TL, Wijdicks CA, LaPrade RF. Biomechanical evaluation of the transtibial pull-out technique for posterior medial meniscal root repairs using 1 and 2 transtibial bone tunnels. Am J Sports Med. 2015;43(4):899-904. doi:10.1177/0363546514563278.
16. Menge TJ, Chahla J, Dean CS, Mitchell JJ, Moatshe G, LaPrade RF. Anterior meniscal root repair using a transtibial double-tunnel pullout technique. Arthrosc Tech. 2016;5(3):e679-e684. doi:10.1016/j.eats.2016.02.026.
17. Menge TJ, Dean CS, Chahla J, Mitchell JJ, LaPrade RF. Anterior horn meniscal repair using an outside-in suture technique. Arthrosc Tech. 2016;5(5):e1111-e1116. doi:10.1016/j.eats.2016.06.005.
ABSTRACT
The lateral tibial eminence shares a close relationship with the anterior root of the lateral meniscus. Limited studies have reported traumatic injury to the anterior meniscal roots in the setting of tibial eminence fractures, and reported rates of occurrence of concomitant meniscal and chondral injuries vary widely. The purpose of this article is to describe the case of a 28-year-old woman who had a complete avulsion of the anterolateral meniscal root caused by a tibial eminence fracture with resultant malunion and root displacement. The anterolateral meniscal root was anatomically repaired following arthroscopic resection of the malunited fragment.
The lateral tibial eminence is intimately associated with the root attachment of the anterior horn of the lateral meniscus.1-3 Previous studies have demonstrated both the close proximity of the anterior cruciate ligament (ACL) insertion to the meniscal roots and the potential for disruption in surgical interventions, such as tibial tunnel drilling in ACL reconstruction or placement of intramedullary tibial nails.4-6 The meniscal roots play a crucial role in force distribution, and disruption of these structures has been shown to significantly increase joint contact forces. Despite the deleterious effects of this injury, limited studies have reported on traumatic injury to the meniscal roots in the setting of tibial eminence fractures.
Reported rates of occurrence of concomitant meniscal and chondral injuries occurring with tibial eminence fractures vary widely, ranging from <5% to 40%.7,8 Although fractures to the tibial eminence are more common in children, an association between these injuries and concomitant soft tissue injuries, including meniscal, chondral, and collateral ligament injuries, in the adult population has been reported.7 Monto and Cameron-Donaldson8 used magnetic resonance imaging (MRI) to evaluate tibial eminence fractures in adults and found that 23% of study subjects had associated medial meniscus tears and 18% had lateral meniscus tears. In a similar study, Ishibashi and colleagues9 found that 25% of tibial eminence fractures were associated with lateral meniscus tears and 16% with medial meniscus tears.
These studies demonstrate the potential for meniscus injuries during tibial eminence fractures. However, the authors are unaware of any reports of complete tearing of the anterior horn of the lateral meniscus in association with this injury. This is an important injury to recognize and identify intraoperatively because an injury of this nature could potentially compromise the mechanical loading patterns and health of the articular cartilage of the lateral compartment of the knee. The purpose of this article is to describe a complete avulsion of the anterolateral meniscal root due to a tibial eminence fracture with resultant malunion and displacement of the root in a nonanatomical position. The patient provided written informed consent for print and electronic publication of this case report.
Continue to: A 28-year-old active woman...
CASE
A 28-year-old active woman presented to our clinic 22 months after sustaining a right knee tibial eminence fracture that was initially treated with extension immobilization, which resulted in a fibrous malunion. She subsequently sustained a second injury resulting in displacement of the malunion fracture fragment, and was treated at another institution 10 months prior to presentation at our clinic with arthroscopic reduction and internal fixation with a cannulated screw and washer of the tibial eminence fracture. This was followed by hardware removal 6 months prior to her office visit at our clinic. At presentation, she reported worsening right knee pain, mechanical symptoms, and loss of both flexion and extension compared with her uninjured knee. Conservative management, including activity modification, extensive physical therapy, and anti-inflammatory medication following her most recent procedure, had not resulted in improvement of her symptoms.
Physical examination revealed significantly reduced knee flexion and extension (+15°-120° on the affected side compared with 5° of hyperextension to 130° flexion of the contralateral knee). Ligamentous examination demonstrated no laxity with varus or valgus stress at 0° to 30° of flexion, negative posterior drawer, and a Grade 2 Lachman and positive pivot shift. She also exhibited pain with attempted right knee terminal extension. Radiographs and computed tomography scans were obtained and reviewed. They revealed a malunited tibial eminence fracture (Figures 1A-1D).
Arthroscopic assessment of the right knee demonstrated the large osseous fragment located in the anterolateral aspect of the joint with the displaced anterior horn of the lateral meniscus attached as well as significant anterior impingement limiting knee extension. Probing of the anterolateral meniscal root in the lateral compartment showed abundant surrounding scar tissue with an abnormal attachment, representing a chronic root avulsion. A mechanical shaver was used to débride the scar tissue and expose the malunited fragment, followed by complete osseous fragment excision with a high-speed burr (Figure 3).
A soft tissue anterolateral meniscal root repair was performed by creating a 2-cm to 3-cm incision on the anterolateral tibia, just distal to the medial aspect of the Gerdy tubercle. To best restore the footprint of the repair and increase the potential for biologic healing, 2 transtibial tunnels were created at the location of the root attachment. An ACL aiming device with a cannulated sleeve was used to drill 2 bony tunnels approximately 5 mm apart, exiting at the anatomic root footprint. The drill pins were removed, leaving the 2 cannulas in place for later suture passage. A suture-passing device was used to pass 2 separate sutures through the detached meniscal root.
Continue to: Postoperatively, the patient was placed...
Postoperatively, the patient was placed on a non-weight-bearing protocol for her operative lower extremity for 6 weeks. A brace locked in extension was used for the same period of time (being removed only for physical therapy exercises). Enoxaparin was used for the first 2 weeks for deep vein thrombosis prophylaxis, followed by aspirin for an additional 4 weeks. Physical therapy was started on postoperative day 1 to begin working on early passive ROM exercises. Knee flexion was limited to 0° to 90° of flexion for the first 2 weeks and then progressed as tolerated.
DISCUSSION
This article describes a rare case of a patient with lateral meniscal anterior root avulsion in the setting of a tibial eminence fracture with subsequent malunion and root displacement. In a case such as this, delineation of the true extent of the injury is difficult because the anterior meniscal root can be torn, displaced, and nonanatomically scarred to surrounding soft tissues, making MRI interpretation challenging. Clinically, patients can present with a wide range of symptoms, including pain, mechanical symptoms, instability, and loss of knee motion.10
The anterior root of the lateral meniscus has been reported to be attached anterior to the lateral tibial eminence and adjacent to the insertion of the ACL. Fibrous connections extending from the anterior horn of the lateral meniscus attachment to the lateral tibial eminence are constant.11 Furumatsu and colleagues12 demonstrated the existence of dense fibers linking the anterior root of the lateral meniscus with the lateral aspect of the ACL tibial insertion. Acknowledging the close relationship of these structures is key to comprehending the importance of evaluating the anterior horn of the lateral meniscus in cases of tibial eminence fractures at the initial time of injury. Failure to diagnose this pathology can lead to poor clinical outcomes and early degenerative changes of the knee.
Tibial intercondylar eminence avulsion fractures are most likely to occur in children and adolescents, and are equivalent to an ACL tear in adults.13 When tibial eminence fractures occur in an older cohort, they are often combined with lesions of the menisci, capsule, or collateral ligaments.14 The initial injury in our patient demonstrated concomitant anterior root injury that progressed with time to nonanatomical healing of the root, leading to altered biomechanics. Surgical techniques available for meniscal root repair are broadly divided into transosseous suture repairs and suture anchor repairs.10 The transtibial pullout technique using 2 transtibial bone tunnels as described in this report is the senior author’s (RFL) preference because it provides a strong construct with minimal displacement of the repaired meniscus.15-17
This article describes a complete avulsion of the anterolateral meniscal root caused by a tibial eminence fracture with resultant malunion and displacement of the root in a nonanatomic position. Anterior meniscal root tears have been reported to result in altered biomechanics and force transmission across the knee, and therefore, anatomic repair of the anterior root is indicated.
1. James EW, LaPrade CM, Ellman MB, Wijdicks CA, Engebretsen L, LaPrade RF. Radiographic identification of the anterior and posterior root attachments of the medial and lateral menisci. Am J Sports Med. 2014;42(11):2707-2714. doi:10.1177/0363546514545863.
2. LaPrade CM, Foad A, Smith SD, et al. Biomechanical consequences of a nonanatomic posterior medial meniscal root repair. Am J Sports Med. 2015;43(4):912-920. doi:10.1177/0363546514566191.
3. LaPrade CM, James EW, Cram TR, Feagin JA, Engebretsen L, LaPrade RF. Meniscal root tears: a classification system based on tear morphology. Am J Sports Med. 2015;43(2):363-369. doi:10.1177/0363546514559684.
4. Ellman MB, James EW, LaPrade CM, LaPrade RF. Anterior meniscus root avulsion following intramedullary nailing for a tibial shaft fracture. Knee Surg Sports Traumatol Arthrosc. 2015;23(4):1188-1191. doi:10.1007/s00167-014-2941-5.
5. Padalecki JR, Jansson KS, Smith SD, et al. Biomechanical consequences of a complete radial tear adjacent to the medial meniscus posterior root attachment site: in situ pull-out repair restores derangement of joint mechanics. Am J Sports Med. 2014;42(3):699-707. doi:10.1177/0363546513499314.
6. LaPrade CM, Jisa KA, Cram TR, LaPrade RF. Posterior lateral meniscal root tear due to a malpositioned double-bundle anterior cruciate ligament reconstruction tibial tunnel. Knee Surg Sports Traumatol Arthrosc. 2015;23(12):3670-3673. doi:10.1007/s00167-014-3273-1.
7. Mitchell JJ, Sjostrom R, Mansour AA, et al. Incidence of meniscal injury and chondral pathology in anterior tibial spine fractures of children. J Pediatr Orthop. 2015;35(2):130-135. doi:10.1097/BPO.0000000000000249.
8. Monto RR, Cameron-Donaldson ML. Magnetic resonance imaging in the evaluation of tibial eminence fractures in adults. J Knee Surg. 2006;19(3):187-190.
9. Ishibashi Y, Tsuda E, Sasaki T, Toh S. Magnetic resonance imaging AIDS in detecting concomitant injuries in patients with tibial spine fractures. Clin Orthop Relat Res. 2005;(434):207-212.
10. Bhatia S, LaPrade CM, Ellman MB, LaPrade RF. Meniscal root tears significance, diagnosis, and treatment. Am J Sports Med. 2014;42(12):3016-3030. doi:10.1177/0363546514524162.
11. Ziegler CG, Pietrini SD, Westerhaus BD, et al. Arthroscopically pertinent landmarks for tunnel positioning in single-bundle and double-bundle anterior cruciate ligament reconstructions. Am J Sports Med. 2011;39(4):743-752. doi:10.1177/0363546510387511.
12. Furumatsu T, Kodama Y, Maehara A, et al. The anterior cruciate ligament-lateral meniscus complex: a histological study. Connect Tissue Res. 2016;57(2):91-98. doi:10.3109/03008207.2015.1081899.
13. Lubowitz JH, Grauer JD. Arthroscopic treatment of anterior cruciate ligament avulsion. Clin Orthop Rel Res. 1993;(294):242-246.
14. Falstie-Jensen S, Sondergard Petersen PE. Incarceration of the meniscus in fractures of the intercondylar eminence of the tibia in children. Injury. 1984;15(4):236-238.
15. LaPrade CM, LaPrade MD, Turnbull TL, Wijdicks CA, LaPrade RF. Biomechanical evaluation of the transtibial pull-out technique for posterior medial meniscal root repairs using 1 and 2 transtibial bone tunnels. Am J Sports Med. 2015;43(4):899-904. doi:10.1177/0363546514563278.
16. Menge TJ, Chahla J, Dean CS, Mitchell JJ, Moatshe G, LaPrade RF. Anterior meniscal root repair using a transtibial double-tunnel pullout technique. Arthrosc Tech. 2016;5(3):e679-e684. doi:10.1016/j.eats.2016.02.026.
17. Menge TJ, Dean CS, Chahla J, Mitchell JJ, LaPrade RF. Anterior horn meniscal repair using an outside-in suture technique. Arthrosc Tech. 2016;5(5):e1111-e1116. doi:10.1016/j.eats.2016.06.005.
TAKE-HOME POINTS
- Root tears of all meniscal attachments have been described. A comprehensive anatomic understanding of the meniscal roots is of utmost importance to suspect root lesions.
- A detailed physical examination along with imaging methods should be performed to make the correct diagnosis. In cases of evident injuries, such as a tibial spine fracture, additional soft tissue pathology should also be assessed.
- It is important to restore all torn root attachments to restore joint loading and contact areas. An anatomical root repair is needed to yield optimal results.
- Progressive rehabilitation with early ROM starting on postoperative day 1 can help avoid loss of knee motion and arthrofibrosis.
Unusual skin reactions to aluminum patch test seen in some children
Instead of the usual eczematous reaction confined to the test area, they exhibited erythema and papules distant from the test area.
In one girl, the reaction consisted of erythematous itchy papules across much of her back on day 2, and by day 4, there were even papules on her chest. In the other girl, erythema, infiltration, and occasional papules covered the whole patch area, and erythematous papules also were seen at some distance from the test area, Nadia Raison-Peyron, MD, of Saint-Eloi Hospital, Montpellier, France, and her colleagues, reported in Pediatric Dermatology.
Biopsies were not performed because of the girls’ young age.
SOURCE: Raison-Peyron N et al. Pediatr Dermatol. 2018. doi: 10.1111/pde.13481.
FROM PEDIATRIC DERMATOLOGY