User login
SLE flares linked to air temperature, pollution
AMSTERDAM – Both air temperature and air pollution levels affected the likelihood of experiencing a flare in systemic lupus erythematosus (SLE) organ-specific disease activity in a study presented at the European Congress of Rheumatology.
For every 1° F increase in temperature, there was an increase in the odds of experiencing a skin flare (odds ratio, 1.0075), joint flare (OR, 1.0110), or neurologic flare (OR, 1.0096), reported George Stojan, MD, and associates during one of the poster sessions. Conversely, renal flares were less likely to occur with rising temperature (OR, 0.9960). The latter is something previously reported, Dr. Stojan said in an interview, “as we found most renal flares occur in the winter, not in the summer months.”

Furthermore, for every 1 mcg per cubic meter increase in fine particulate matter pollution (PM2.5), there were increases in serositis (OR, 1.0240) and hematologic flares (OR, 1.011).
There were two reasons for looking at the role of these environmental factors in relation to SLE flares, said Dr. Stojan, an assistant professor of medicine at Johns Hopkins University, Baltimore. “The first was a clinical observation – I was getting clusters of patients with certain disease manifestations, for example with serositis or joint flares, and there wasn’t a random distribution.”
The second was a patient observation, added Dr. Stojan, who is also codirector of the Johns Hopkins Lupus Center. Every year, patients treated at the Center have the opportunity to meet each other and hear about the research being done by the team, and it was at this meeting that patients said they felt they were experiencing similar disease flares.
To look at the underlying role of environmental exposures in the development of SLE and possible associations with disease activity, Dr. Stojan and associates used a method known as cluster detection, which is commonly used in public health studies.
The investigators used a 350-km radial zone around the Johns Hopkins Lupus Center for the analysis as this was an area where a uniform number of patients treated by the center were living. They obtained data on 1,261 patients in the Hopkins Lupus Cohort, spanning a 10-year period from 1999 to 2009, and used SaTScan software to identify clusters of disease activity occurring during 3 separate monthly time intervals in different counties. The researchers then linked these clusters to average temperature and PM2.5 data obtained from the Environmental Protection Agency for the 10 days prior to patients’ visits.
“The SaTScan system predicts how many flares per organ system you would expect in a county based on the number of patients and based on the total flares we have in our cohort,” Dr. Stojan explained. Previously, the system helped to identify areas that had a higher flare incidence for each organ system that lasted for about 2-3 years, did not overlap, and could not be explained. So, the next step was to look for potential environmental triggers.
“Basically, the SaTScan adjusts the data that’s inputted for temperature and small particulate pollution. If the cluster moves in space and time then these did affect it,” Dr. Stojan said. “It seems that these do affect certain types of organ flares,” even after adjustment for other variables such as patients’ age, gender, income, ethnicity, and living situation (rural or urban).
Flares in skin symptoms during the summer have been identified before, he acknowledged, but the link to joint flares or neurologic flares have not. The latter includes things like seizures, neuropathy, or abnormal brain imaging rather than mood changes or mild cognitive dysfunction.
These data could have an impact on how clinical trials are designed, Dr. Stojan added, suggesting that factoring in where patients live and how close they are to areas of pollution could ensure a uniform population of patients is studied.
From a more practical perspective, these data might help to develop predictive models to help understand when patients are likely to experience a flare and if any action can be taken to ameliorate the effects of exposure.
The next step is a collaboration with patients to develop software or a mobile application where patients could input information about any disease flares. This would enable a finer view of what could be happening, Dr. Stojan said, as while daily readings are available for the environmental factors studied, disease activity data is only available during 3 separate monthly intervals. It would also allow other environmental factors to be considered.
“I think this is an important step in figuring out environmental factors and their influence on lupus,” he said. “There has been an extensive amount of research into viral causes and potential infectious triggers, but spatial-temporal analysis of environmental variables have never been done before in lupus.”
The study received no commercial funding, and Dr. Stojan reported having no disclosures.
SOURCE: Stojan G et al. Ann Rheum Dis. 2018;77(Suppl 2):1191. Abstract SAT0685.
AMSTERDAM – Both air temperature and air pollution levels affected the likelihood of experiencing a flare in systemic lupus erythematosus (SLE) organ-specific disease activity in a study presented at the European Congress of Rheumatology.
For every 1° F increase in temperature, there was an increase in the odds of experiencing a skin flare (odds ratio, 1.0075), joint flare (OR, 1.0110), or neurologic flare (OR, 1.0096), reported George Stojan, MD, and associates during one of the poster sessions. Conversely, renal flares were less likely to occur with rising temperature (OR, 0.9960). The latter is something previously reported, Dr. Stojan said in an interview, “as we found most renal flares occur in the winter, not in the summer months.”
Furthermore, for every 1 mcg per cubic meter increase in fine particulate matter pollution (PM2.5), there were increases in serositis (OR, 1.0240) and hematologic flares (OR, 1.011).
There were two reasons for looking at the role of these environmental factors in relation to SLE flares, said Dr. Stojan, an assistant professor of medicine at Johns Hopkins University, Baltimore. “The first was a clinical observation – I was getting clusters of patients with certain disease manifestations, for example with serositis or joint flares, and there wasn’t a random distribution.”
The second was a patient observation, added Dr. Stojan, who is also codirector of the Johns Hopkins Lupus Center. Every year, patients treated at the Center have the opportunity to meet each other and hear about the research being done by the team, and it was at this meeting that patients said they felt they were experiencing similar disease flares.
To look at the underlying role of environmental exposures in the development of SLE and possible associations with disease activity, Dr. Stojan and associates used a method known as cluster detection, which is commonly used in public health studies.
The investigators used a 350-km radial zone around the Johns Hopkins Lupus Center for the analysis as this was an area where a uniform number of patients treated by the center were living. They obtained data on 1,261 patients in the Hopkins Lupus Cohort, spanning a 10-year period from 1999 to 2009, and used SaTScan software to identify clusters of disease activity occurring during 3 separate monthly time intervals in different counties. The researchers then linked these clusters to average temperature and PM2.5 data obtained from the Environmental Protection Agency for the 10 days prior to patients’ visits.
“The SaTScan system predicts how many flares per organ system you would expect in a county based on the number of patients and based on the total flares we have in our cohort,” Dr. Stojan explained. Previously, the system helped to identify areas that had a higher flare incidence for each organ system that lasted for about 2-3 years, did not overlap, and could not be explained. So, the next step was to look for potential environmental triggers.
“Basically, the SaTScan adjusts the data that’s inputted for temperature and small particulate pollution. If the cluster moves in space and time then these did affect it,” Dr. Stojan said. “It seems that these do affect certain types of organ flares,” even after adjustment for other variables such as patients’ age, gender, income, ethnicity, and living situation (rural or urban).
Flares in skin symptoms during the summer have been identified before, he acknowledged, but the link to joint flares or neurologic flares have not. The latter includes things like seizures, neuropathy, or abnormal brain imaging rather than mood changes or mild cognitive dysfunction.
These data could have an impact on how clinical trials are designed, Dr. Stojan added, suggesting that factoring in where patients live and how close they are to areas of pollution could ensure a uniform population of patients is studied.
From a more practical perspective, these data might help to develop predictive models to help understand when patients are likely to experience a flare and if any action can be taken to ameliorate the effects of exposure.
The next step is a collaboration with patients to develop software or a mobile application where patients could input information about any disease flares. This would enable a finer view of what could be happening, Dr. Stojan said, as while daily readings are available for the environmental factors studied, disease activity data is only available during 3 separate monthly intervals. It would also allow other environmental factors to be considered.
“I think this is an important step in figuring out environmental factors and their influence on lupus,” he said. “There has been an extensive amount of research into viral causes and potential infectious triggers, but spatial-temporal analysis of environmental variables have never been done before in lupus.”
The study received no commercial funding, and Dr. Stojan reported having no disclosures.
SOURCE: Stojan G et al. Ann Rheum Dis. 2018;77(Suppl 2):1191. Abstract SAT0685.
REPORTING FROM THE EULAR 2018 CONGRESS
Key clinical point:
Major finding: For every 1° F increase in temperature, the risk for skin, joint, or neurologic flares increased.
Study details: A spatial-time cluster analysis of 1,261 patients in the Hopkins Lupus Cohort linking disease activity to temperature changes and fine particulate matter pollution.
Disclosures: The study received no commercial funding, and Dr. Stojan reported having no disclosures.
Source: Stojan G et al. Ann Rheum Dis. 2018;77(Suppl 2):1191. Abstract SAT0685.
Negotiating physician employment agreements
You have finally completed your residency or fellowship, and now you have a job offer. With some trepidation, you decide to read the employment agreement that has been emailed to you. You quickly realize that you do not understand much of it. All those legal terms! You lament the fact that medical school never taught you about the business of medicine. What are you going to do? The choices are actually quite simple: You can take the time to educate yourself or you can hire an expert. This article will review some of the basic principles of negotiating as well as some of the critical issues found in physician employment agreements today.
Whether you represent yourself or hire someone to do it for you, it is important to understand some of the basic principles of negotiating. These principles generally are applicable whether you are buying a house or negotiating your employment agreement.
Negotiations

The most important principle is preparation. For example, many physicians negotiate their salaries during the interview process. Consequently, it is imperative that, before you negotiate your compensation, you know the range of salaries in your area for your specialty. It is also important to know whether salaries are usually guaranteed in your market, or whether production-based salaries (which are based on the amount of your billings) are the norm. Never go into an interview unprepared!
Always try to gain leverage in your negotiations. The easiest way to accomplish this is by having multiple offers, and subtly letting your suitors know this. Allow adequate time to negotiate; the more time you have, the easier it is to negotiate. Establish your objectives and try to anticipate the objectives of the other party. Determine your best-case and worse-case scenarios, as well as the most likely outcome. Do not negotiate against yourself and try to get something every time you give something. Define the nonnegotiable issues, and do not waste time on them. Keep cool and be flexible.
The first question you must answer when you receive an employment agreement is who is going to negotiate it. Many new physicians hire attorneys to help them with their employment agreements and employers expect as much. It is best to engage an attorney before you begin your job search so you can get a better understanding of how the attorney can help you. Most attorneys do not charge a prospective client for such information. However, many physicians wait until they actually receive an offer before contacting an attorney. It is not uncommon for physicians to negotiate their salaries during job interviews even if they eventually hire an attorney to help them. This is usually attributable to a lack of negotiating experience and an eagerness to determine whether a job offer is viable. Keep in mind that an attorney often can negotiate a better starting salary than you, so try to resist the temptation to negotiate your salary during the interview process.
Compensation
With compensation in mind, what are some of the important issues? Today, many physician employers are converting to production-based compensation models. Consequently, it is important for new physicians to obtain guaranteed base salaries during their first few years of employment while they are building their practices.
On occasion, new physicians initially are offered production-based compensation models, which also allocate a share of practice overhead expenses to them. This is a very dangerous compensation model for a new physician. Under such a model, it is possible that a new physician could have a negative balance in his/her cost center at the end of the year, and actually owe his/her employer money.
Some physicians may be offered income guarantees by hospitals. There are several different types of income guarantees but they are frequently categorized together even though they differ significantly. The most common income guarantees offered to physicians are physician recruitment agreements (PRAs). Under a PRA, a hospital usually guarantees that a physician who relocates to the service area of the hospital collects a minimum amount of monthly revenue for 1-2 years, which is known as the guarantee period. The hospital also guarantees to pay certain monthly expenses of the physician during the guarantee period. This arrangement is actually structured as a loan by the hospital to the physician, and requires the physician to execute a promissory note with the hospital for the amounts advanced to the physician by the hospital. The promissory note is forgiven if the physician continues to practice in the service area for 2-3 years after the guarantee period. This type of guarantee provides an excellent opportunity for a new physician to establish a solo practice. A variation of this model involves a third party such as a medical group. Under this model, the hospital continues to guarantee the revenue of the new physician and pays the medical group the expenses it incurs as a result of hiring the new physician. These expenses are known as incremental practice expenses. The medical group also becomes a signatory to the promissory note. Other health care entities also have begun to offer PRAs to physicians. For example, an independent practice association in California recently entered into a PRA with a gastroenterologist.
Keep in mind that the promissory note executed by the physician may affect the credit of the physician, especially if he/she wants to obtain financing for a home purchase. Also, a hospital may seek security for the performance of the promissory note by collateralizing the personal assets of the physician instead of just his/her practice assets; this should be avoided.
The other type of income guarantee is provided to hospital-based physicians such as pathologists, radiologists, anesthesiologists, etc. Under this type of guarantee, a hospital ensures that the physicians receive a minimum threshold of collections. This type of guarantee may be necessary to attract hospital-based physicians to a hospital which has a low-income and/or Medicaid population. This is not a typical scenario for a gastroenterologist.
Some practices create incentives for physicians by offering a variety of bonuses. Most often these bonuses are production based but sometimes they are based on such quality issues as patient satisfaction. The most common types of production bonuses are based on attaining a level of collections above a dollar threshold or exceeding a minimum level of relative value units (RVUs).
To summarize, new physicians should always try to get at least a 2-year income guarantee. They should never allow an employer to allocate overhead to them during the first 2 years of employment. In addition, they should always try to negotiate realistic production-based bonuses.
Benefits
Fringe benefits are an integral part of a compensation package for a new physician. Most physician employers offer a generous package of health insurance, retirement, reimbursable expenses, and paid time off. These benefits should be clearly delineated in the employment agreement or employee handbook. A very common question about health benefits is when they become effective (the first day of employment, 30 days after employment, the first of the month after employment, etc.). This is significant because Consolidated Omnibus Budget Reconciliation Act (COBRA) is quite expensive. Another issue is whether health insurance also will cover the physician’s spouse and dependents. Most physician employers cover only the physician, not his/her spouse and dependents. If a new physician has a spouse who already provides family health benefits, it may behoove the physician to negotiate an allowance in lieu of health benefits.
Paid time off of 10-20 days are commonly given by physician employers to new physicians. Some employers also provide 5 or more additional days of paid time off for Continuing Medical Education (CME). Of course, once a physician goes onto production-based compensation, paid time off usually is not provided.
It is very important that a physician employer offer a retirement plan. Oftentimes, there is a matching contribution by the employer. However, it is not uncommon for there to be a year waiting period for eligibility in the retirement plan. Retirement plans vary significantly so it is advisable for a new physician to meet with the employer’s human resources department to get the details of the plan offered; the physician may want to confer with a financial advisor after obtaining this information.
Most physician employers reimburse licensing and DEA fees, medical staff dues, and board certification expenses. There is often a CME allowance as well. In competitive markets, some physician employers also offer innovative benefits such as student loan repayment programs, fellowship and residency stipends, and forgivable loans for housing. Sometimes these benefits are not included in the employment agreement; you may have to ask for them.
Indemnification/noncompetition
In addition to compensation and benefits, there are several other issues which are commonly found in employment agreements. Perhaps the most controversial is the issue of indemnification. The legal concept of indemnity allows a physician employer to recover damages and defense costs from a physician employee in certain circumstances. For example, if a physician employer has a $1,000,000/$3,000,000 malpractice policy covering itself and each of its physician employees, and if a physician commits malpractice and the award is $2,000,000, the employer may seek to recover the $1,000,000 deficit from the physician. In California, for example, the physician employer would be prohibited from seeking the deficit from the physician employee, but in most states, it is permitted. Because insurance policies usually do not cover physicians for damages, expenses, costs, etc as a result of an indemnification action, there is no practical way for a physician to protect himself/herself from the consequences. It is very important that physicians not sign any type of agreement with an indemnification clause in it without consulting an attorney first.
Another controversial issue is noncompete restrictions. In many states, a physician employer can restrict a physician employee from competing with it after an employment agreement is terminated. The noncompete prohibitions usually last for 1-2 years and extend over a geographic area, which often causes a terminated physician to relocate. Importantly, noncompete clauses are generally enforceable in most states.
Tail coverage
Malpractice tail coverage often can be an issue as well. For many years, physician employers routinely paid the cost of tail coverage for a physician employee after termination of employment. Tail coverage is necessary because most malpractice policies are claims-made insurance instead of occurrence insurance. This means that the insurance is applicable when a claim is filed versus when a malpractice act or omission occurred. Because of the significant cost of tail coverage, many physician employers attempt to transfer this financial responsibility to physician employees. Depending on a physician’s specialty, tail coverage can be quite costly. Consequently, it behooves physicians to carefully negotiate this issue. If a physician employer is unwilling to provide tail coverage, a compromise may be proposed whereby the physician employee is responsible only for the cost of tail coverage if he/she terminates the employment agreement without cause or if the physician employer terminates the employment agreement for cause. Conversely, the physician employer would be responsible for the cost if the physician employer terminates the employment agreement without cause or the physician employee terminates the employment agreement for cause.
Equity accrual
Finally, new physicians always should ask whether there is an opportunity to obtain equity in the organizations that hire them. Many for-profit physician employers provide such an opportunity to new physicians after 2-3 years. However, timing is just one factor. Importantly, the cost of the buy-in is critical especially to new physicians with student loans. Recognizing this problem, the trend today is for physician employers to have nominal buy-ins. Notwithstanding this trend, some physician employers also own ambulatory surgery centers and the buy-ins for these entities must be at fair market value and cannot be financed by the center or its owners under the law. Consequently, the buy-in for ambulatory surgery centers is usually substantial and requires a physician to obtain outside financing.
In conclusion, when evaluating the viability of a physician employment opportunity, salary should be only one factor considered. Fringe benefits, the opportunity for equity, and the fairness of the employment agreement also should be weighed heavily by a physician. It is important for a physician to be comfortable with his/her peers and work environment. Selecting the right job opportunity can be challenging. However, the process will be much easier if you remember the basic principles of negotiating.
You have finally completed your residency or fellowship, and now you have a job offer. With some trepidation, you decide to read the employment agreement that has been emailed to you. You quickly realize that you do not understand much of it. All those legal terms! You lament the fact that medical school never taught you about the business of medicine. What are you going to do? The choices are actually quite simple: You can take the time to educate yourself or you can hire an expert. This article will review some of the basic principles of negotiating as well as some of the critical issues found in physician employment agreements today.
Whether you represent yourself or hire someone to do it for you, it is important to understand some of the basic principles of negotiating. These principles generally are applicable whether you are buying a house or negotiating your employment agreement.
Negotiations
The most important principle is preparation. For example, many physicians negotiate their salaries during the interview process. Consequently, it is imperative that, before you negotiate your compensation, you know the range of salaries in your area for your specialty. It is also important to know whether salaries are usually guaranteed in your market, or whether production-based salaries (which are based on the amount of your billings) are the norm. Never go into an interview unprepared!
Always try to gain leverage in your negotiations. The easiest way to accomplish this is by having multiple offers, and subtly letting your suitors know this. Allow adequate time to negotiate; the more time you have, the easier it is to negotiate. Establish your objectives and try to anticipate the objectives of the other party. Determine your best-case and worse-case scenarios, as well as the most likely outcome. Do not negotiate against yourself and try to get something every time you give something. Define the nonnegotiable issues, and do not waste time on them. Keep cool and be flexible.
The first question you must answer when you receive an employment agreement is who is going to negotiate it. Many new physicians hire attorneys to help them with their employment agreements and employers expect as much. It is best to engage an attorney before you begin your job search so you can get a better understanding of how the attorney can help you. Most attorneys do not charge a prospective client for such information. However, many physicians wait until they actually receive an offer before contacting an attorney. It is not uncommon for physicians to negotiate their salaries during job interviews even if they eventually hire an attorney to help them. This is usually attributable to a lack of negotiating experience and an eagerness to determine whether a job offer is viable. Keep in mind that an attorney often can negotiate a better starting salary than you, so try to resist the temptation to negotiate your salary during the interview process.
Compensation
With compensation in mind, what are some of the important issues? Today, many physician employers are converting to production-based compensation models. Consequently, it is important for new physicians to obtain guaranteed base salaries during their first few years of employment while they are building their practices.
On occasion, new physicians initially are offered production-based compensation models, which also allocate a share of practice overhead expenses to them. This is a very dangerous compensation model for a new physician. Under such a model, it is possible that a new physician could have a negative balance in his/her cost center at the end of the year, and actually owe his/her employer money.
Some physicians may be offered income guarantees by hospitals. There are several different types of income guarantees but they are frequently categorized together even though they differ significantly. The most common income guarantees offered to physicians are physician recruitment agreements (PRAs). Under a PRA, a hospital usually guarantees that a physician who relocates to the service area of the hospital collects a minimum amount of monthly revenue for 1-2 years, which is known as the guarantee period. The hospital also guarantees to pay certain monthly expenses of the physician during the guarantee period. This arrangement is actually structured as a loan by the hospital to the physician, and requires the physician to execute a promissory note with the hospital for the amounts advanced to the physician by the hospital. The promissory note is forgiven if the physician continues to practice in the service area for 2-3 years after the guarantee period. This type of guarantee provides an excellent opportunity for a new physician to establish a solo practice. A variation of this model involves a third party such as a medical group. Under this model, the hospital continues to guarantee the revenue of the new physician and pays the medical group the expenses it incurs as a result of hiring the new physician. These expenses are known as incremental practice expenses. The medical group also becomes a signatory to the promissory note. Other health care entities also have begun to offer PRAs to physicians. For example, an independent practice association in California recently entered into a PRA with a gastroenterologist.
Keep in mind that the promissory note executed by the physician may affect the credit of the physician, especially if he/she wants to obtain financing for a home purchase. Also, a hospital may seek security for the performance of the promissory note by collateralizing the personal assets of the physician instead of just his/her practice assets; this should be avoided.
The other type of income guarantee is provided to hospital-based physicians such as pathologists, radiologists, anesthesiologists, etc. Under this type of guarantee, a hospital ensures that the physicians receive a minimum threshold of collections. This type of guarantee may be necessary to attract hospital-based physicians to a hospital which has a low-income and/or Medicaid population. This is not a typical scenario for a gastroenterologist.
Some practices create incentives for physicians by offering a variety of bonuses. Most often these bonuses are production based but sometimes they are based on such quality issues as patient satisfaction. The most common types of production bonuses are based on attaining a level of collections above a dollar threshold or exceeding a minimum level of relative value units (RVUs).
To summarize, new physicians should always try to get at least a 2-year income guarantee. They should never allow an employer to allocate overhead to them during the first 2 years of employment. In addition, they should always try to negotiate realistic production-based bonuses.
Benefits
Fringe benefits are an integral part of a compensation package for a new physician. Most physician employers offer a generous package of health insurance, retirement, reimbursable expenses, and paid time off. These benefits should be clearly delineated in the employment agreement or employee handbook. A very common question about health benefits is when they become effective (the first day of employment, 30 days after employment, the first of the month after employment, etc.). This is significant because Consolidated Omnibus Budget Reconciliation Act (COBRA) is quite expensive. Another issue is whether health insurance also will cover the physician’s spouse and dependents. Most physician employers cover only the physician, not his/her spouse and dependents. If a new physician has a spouse who already provides family health benefits, it may behoove the physician to negotiate an allowance in lieu of health benefits.
Paid time off of 10-20 days are commonly given by physician employers to new physicians. Some employers also provide 5 or more additional days of paid time off for Continuing Medical Education (CME). Of course, once a physician goes onto production-based compensation, paid time off usually is not provided.
It is very important that a physician employer offer a retirement plan. Oftentimes, there is a matching contribution by the employer. However, it is not uncommon for there to be a year waiting period for eligibility in the retirement plan. Retirement plans vary significantly so it is advisable for a new physician to meet with the employer’s human resources department to get the details of the plan offered; the physician may want to confer with a financial advisor after obtaining this information.
Most physician employers reimburse licensing and DEA fees, medical staff dues, and board certification expenses. There is often a CME allowance as well. In competitive markets, some physician employers also offer innovative benefits such as student loan repayment programs, fellowship and residency stipends, and forgivable loans for housing. Sometimes these benefits are not included in the employment agreement; you may have to ask for them.
Indemnification/noncompetition
In addition to compensation and benefits, there are several other issues which are commonly found in employment agreements. Perhaps the most controversial is the issue of indemnification. The legal concept of indemnity allows a physician employer to recover damages and defense costs from a physician employee in certain circumstances. For example, if a physician employer has a $1,000,000/$3,000,000 malpractice policy covering itself and each of its physician employees, and if a physician commits malpractice and the award is $2,000,000, the employer may seek to recover the $1,000,000 deficit from the physician. In California, for example, the physician employer would be prohibited from seeking the deficit from the physician employee, but in most states, it is permitted. Because insurance policies usually do not cover physicians for damages, expenses, costs, etc as a result of an indemnification action, there is no practical way for a physician to protect himself/herself from the consequences. It is very important that physicians not sign any type of agreement with an indemnification clause in it without consulting an attorney first.
Another controversial issue is noncompete restrictions. In many states, a physician employer can restrict a physician employee from competing with it after an employment agreement is terminated. The noncompete prohibitions usually last for 1-2 years and extend over a geographic area, which often causes a terminated physician to relocate. Importantly, noncompete clauses are generally enforceable in most states.
Tail coverage
Malpractice tail coverage often can be an issue as well. For many years, physician employers routinely paid the cost of tail coverage for a physician employee after termination of employment. Tail coverage is necessary because most malpractice policies are claims-made insurance instead of occurrence insurance. This means that the insurance is applicable when a claim is filed versus when a malpractice act or omission occurred. Because of the significant cost of tail coverage, many physician employers attempt to transfer this financial responsibility to physician employees. Depending on a physician’s specialty, tail coverage can be quite costly. Consequently, it behooves physicians to carefully negotiate this issue. If a physician employer is unwilling to provide tail coverage, a compromise may be proposed whereby the physician employee is responsible only for the cost of tail coverage if he/she terminates the employment agreement without cause or if the physician employer terminates the employment agreement for cause. Conversely, the physician employer would be responsible for the cost if the physician employer terminates the employment agreement without cause or the physician employee terminates the employment agreement for cause.
Equity accrual
Finally, new physicians always should ask whether there is an opportunity to obtain equity in the organizations that hire them. Many for-profit physician employers provide such an opportunity to new physicians after 2-3 years. However, timing is just one factor. Importantly, the cost of the buy-in is critical especially to new physicians with student loans. Recognizing this problem, the trend today is for physician employers to have nominal buy-ins. Notwithstanding this trend, some physician employers also own ambulatory surgery centers and the buy-ins for these entities must be at fair market value and cannot be financed by the center or its owners under the law. Consequently, the buy-in for ambulatory surgery centers is usually substantial and requires a physician to obtain outside financing.
In conclusion, when evaluating the viability of a physician employment opportunity, salary should be only one factor considered. Fringe benefits, the opportunity for equity, and the fairness of the employment agreement also should be weighed heavily by a physician. It is important for a physician to be comfortable with his/her peers and work environment. Selecting the right job opportunity can be challenging. However, the process will be much easier if you remember the basic principles of negotiating.
Fluoroquinolones can cause fatal hypoglycemia, FDA warns
Fluoroquinolones have caused at least 67 cases of life-threatening hypoglycemic coma, including 13 deaths and 9 permanent and disabling injuries, according to an internal safety review by the Food and Drug Administration. Most cases (44) were associated with levofloxacin.

The review also found new neuropsychiatric side effects associated with fluoroquinolones, including disturbances in attention, memory impairment, and delirium.
Considering these findings, the agency will strengthen warning labels on all fluoroquinolones, which already warn that the antibiotics may cause hypoglycemia and mental health issues, especially in older people, the FDA said in a press statement.
“Health care professionals should be aware of the potential risk of hypoglycemia, sometimes resulting in coma, occurring more frequently in the elderly and those with diabetes taking an oral hypoglycemic medicine or insulin,” the statement said. “Alert patients of the symptoms of hypoglycemia and carefully monitor blood glucose levels in these patients and discuss with them how to treat themselves if they have symptoms of hypoglycemia. Inform patients about the risk of psychiatric adverse reactions that can occur after just one dose. Stop fluoroquinolone treatment immediately if a patient reports any central nervous system side effects, including psychiatric adverse reactions, or blood glucose disturbances and switch to a non–fluoroquinolone antibiotic if possible. Stop fluoroquinolone treatment immediately if a patient reports serious side effects involving the tendons, muscles, joints, or nerves, and switch to a non–fluoroquinolone antibiotic to complete the patient’s treatment course.”
The statement also warned not to prescribe fluoroquinolones to patients who have other treatment options for acute bacterial sinusitis, acute bacterial exacerbation of chronic bronchitis, and uncomplicated urinary tract infections because the risks outweigh the benefits in these patients.
The FDA conducted the postmarketing review on all five of the fluoroquinolones (ciprofloxacin, gemifloxacin, levofloxacin, moxifloxacin, and ofloxacin). The newest fluoroquinolone, delafloxacin, approved a year ago, was not included in the class review. However, the agency expects that similar adverse events will be associated with delafloxacin and labeling on that drug will include the new warnings.
The agency reviewed cases in the FDA Adverse Event Reporting System, and in published medical literature, during 1987-2017. Most of the incidents (56) were in the system; 11 additional cases were published. Levofloxacin caused most of the incidents (44), followed by ciprofloxacin (12), moxifloxacin (9), and ofloxacin (2). Four of the fluoroquinolones have a labeled drug interaction with sulfonylurea agents, which can cause hypoglycemia.
Some of those who died were getting the antibiotics for complicated infections, including urinary tract and upper respiratory tract infections, and postoperative antibiotic prophylaxis. Others had renal insufficiency – a risk factor for hypoglycemia.
Of the 54 patients who survived, 9 never fully recovered and had permanent disabilities. Four patients remained in a coma for at least 1 month, despite blood sugar normalization. Five experienced some type of neurologic injury.
The new label changes will also fortify the existing warning about mental health side effects, after the review found new reactions that are not listed in the current warning, including the new reports of disturbance in attention, memory impairment, and delirium.
The FDA statement did not include the number of cases found or the associated drugs. Again, the safety review was based on reports in the FAERS database and published medical literature.
“We found that psychiatric adverse reactions were not consistent in the drug labels. The labels of fluoroquinolones currently include many psychiatric adverse reactions in the Warnings and Precautions section, for example, hallucination, psychoses, confusion, depression, anxiety, and paranoia. In an effort to harmonize the psychiatric adverse reactions described in the drug labels across the class of fluoroquinolones, we are requiring that all fluoroquinolones include six psychiatric adverse reactions (disturbance in attention, memory impairment, delirium, nervousness, agitation, and disorientation) in the Central Nervous System Effects of the Warnings and Precautions section of the labels. Disturbance in attention, memory impairment, and delirium are new adverse reactions to be added to the labels of the entire class of fluoroquinolones. Nervousness, agitation, and disorientation had been previously listed in the fluoroquinolone drug labels and will now be added to the Warnings and Precautions section of each drug label to harmonize labels across the fluoroquinolone drug class. The new label changes will make the psychiatric adverse reactions more prominent and more consistent.”
The FDA has previously warned about other adverse events associated with fluoroquinolones in May 2016, restricting use for certain uncomplicated infections; July 2016, for disabling side effects; August 2013, for peripheral neuropathy, and July 2008, for tendinitis and tendon rupture.
Fluoroquinolones have caused at least 67 cases of life-threatening hypoglycemic coma, including 13 deaths and 9 permanent and disabling injuries, according to an internal safety review by the Food and Drug Administration. Most cases (44) were associated with levofloxacin.
The review also found new neuropsychiatric side effects associated with fluoroquinolones, including disturbances in attention, memory impairment, and delirium.
Considering these findings, the agency will strengthen warning labels on all fluoroquinolones, which already warn that the antibiotics may cause hypoglycemia and mental health issues, especially in older people, the FDA said in a press statement.
“Health care professionals should be aware of the potential risk of hypoglycemia, sometimes resulting in coma, occurring more frequently in the elderly and those with diabetes taking an oral hypoglycemic medicine or insulin,” the statement said. “Alert patients of the symptoms of hypoglycemia and carefully monitor blood glucose levels in these patients and discuss with them how to treat themselves if they have symptoms of hypoglycemia. Inform patients about the risk of psychiatric adverse reactions that can occur after just one dose. Stop fluoroquinolone treatment immediately if a patient reports any central nervous system side effects, including psychiatric adverse reactions, or blood glucose disturbances and switch to a non–fluoroquinolone antibiotic if possible. Stop fluoroquinolone treatment immediately if a patient reports serious side effects involving the tendons, muscles, joints, or nerves, and switch to a non–fluoroquinolone antibiotic to complete the patient’s treatment course.”
The statement also warned not to prescribe fluoroquinolones to patients who have other treatment options for acute bacterial sinusitis, acute bacterial exacerbation of chronic bronchitis, and uncomplicated urinary tract infections because the risks outweigh the benefits in these patients.
The FDA conducted the postmarketing review on all five of the fluoroquinolones (ciprofloxacin, gemifloxacin, levofloxacin, moxifloxacin, and ofloxacin). The newest fluoroquinolone, delafloxacin, approved a year ago, was not included in the class review. However, the agency expects that similar adverse events will be associated with delafloxacin and labeling on that drug will include the new warnings.
The agency reviewed cases in the FDA Adverse Event Reporting System, and in published medical literature, during 1987-2017. Most of the incidents (56) were in the system; 11 additional cases were published. Levofloxacin caused most of the incidents (44), followed by ciprofloxacin (12), moxifloxacin (9), and ofloxacin (2). Four of the fluoroquinolones have a labeled drug interaction with sulfonylurea agents, which can cause hypoglycemia.
Some of those who died were getting the antibiotics for complicated infections, including urinary tract and upper respiratory tract infections, and postoperative antibiotic prophylaxis. Others had renal insufficiency – a risk factor for hypoglycemia.
Of the 54 patients who survived, 9 never fully recovered and had permanent disabilities. Four patients remained in a coma for at least 1 month, despite blood sugar normalization. Five experienced some type of neurologic injury.
The new label changes will also fortify the existing warning about mental health side effects, after the review found new reactions that are not listed in the current warning, including the new reports of disturbance in attention, memory impairment, and delirium.
The FDA statement did not include the number of cases found or the associated drugs. Again, the safety review was based on reports in the FAERS database and published medical literature.
“We found that psychiatric adverse reactions were not consistent in the drug labels. The labels of fluoroquinolones currently include many psychiatric adverse reactions in the Warnings and Precautions section, for example, hallucination, psychoses, confusion, depression, anxiety, and paranoia. In an effort to harmonize the psychiatric adverse reactions described in the drug labels across the class of fluoroquinolones, we are requiring that all fluoroquinolones include six psychiatric adverse reactions (disturbance in attention, memory impairment, delirium, nervousness, agitation, and disorientation) in the Central Nervous System Effects of the Warnings and Precautions section of the labels. Disturbance in attention, memory impairment, and delirium are new adverse reactions to be added to the labels of the entire class of fluoroquinolones. Nervousness, agitation, and disorientation had been previously listed in the fluoroquinolone drug labels and will now be added to the Warnings and Precautions section of each drug label to harmonize labels across the fluoroquinolone drug class. The new label changes will make the psychiatric adverse reactions more prominent and more consistent.”
The FDA has previously warned about other adverse events associated with fluoroquinolones in May 2016, restricting use for certain uncomplicated infections; July 2016, for disabling side effects; August 2013, for peripheral neuropathy, and July 2008, for tendinitis and tendon rupture.
Status Epilepticus in the Emergency Department, Part 2: Treatment
In part 1 of this 2-part review, the authors detailed proper diagnosis of seizures in the ED setting. In this concluding article, they focus on appropriate management and treatment options for patients with seizure.
Status epilepticus is defined as continuous seizure activity for greater than 5 minutes, or repeated episodes of seizures without resolution of the postictal period. When the clinician arrives at the patient’s bedside or the emergency medical technician arrives at the scene in the prehospital setting, the patient may be minutes into seizure activity. If the seizure does not immediately resolve, the provider should treat as if status is imminent, if not ongoing. Regardless of setting, if the patient is discovered to be seizing, treatment should be initiated.
It is important to distinguish between provoked and unprovoked seizures, since successful management may require treating an underlying etiology. Although there are as many types of status epilepticus as there are types of seizures, the focus of this review is on generalized convulsive status epilepticus (GCSE).
As a GCSE continues, the overt seizure activity may become subtle—essentially a transformation of generalized status to a state with minimal or no motor movements. Whether or not there is an absence of, or minimal, movement, GCSE still represents a medical emergency, since the excessive neuronal activity causes neuronal injury. An electroencephalogram (EEG) may be required to detect transformed GCSE, which should be suspected if the patient does not exhibit improved mental status within 20 to 30 minutes of convulsive seizure cessation, or if neuromuscular paralysis for intubation has occurred.
Initial Management
Initial management of seizure patients is consistent with the care of any critical patient in the ED. Assessment of the airway and airway management with endotracheal intubation may be necessary for patients who are apneic or at risk for aspiration, or in whom more conservative management is inadequate.
While placing a patient in the left lateral decubitus position may mitigate aspiration risk, since vomiting is common in a postictal state, moving a convulsing patient may be challenging.1 Patients should be placed on cardiac monitoring with pulse oximetry if feasible. Intravenous (IV) access should be established if possible, though intramuscular (IM) or other alternative routes for benzodiazepines may be used if obtaining IV access will result in a delay in treatment.2
Oxygen should be administered via nonrebreather or bag-valve-mask to patients with apnea to prevent both systemic and cerebral hypoxia.3Since cardiac dysrhythmias with cerebral hypoxia may cause seizure-like activity, it is imperative to check the patient’s pulses, blood pressure, and to maintain cardiac monitoring during convulsive episodes.4 The patient’s glucose levels should be checked upon arrival to determine if the seizure is due to metabolic disturbance, which is an easily reversible cause of seizure. If glucose point-of-care testing is not available, it is reasonable to treat empirically for hypoglycemia.
Emergent Initial Therapy: First-Line Agents
Benzodiazepines
Benzodiazepines are the mainstay of emergent treatment for status epilepticus. The choice of benzodiazepine may be dependent on the clinical setting and availability of IV access or other resources. In the United States, diazepam, lorazepam, and midazolam are the common formulations used for abortive emergent initial therapy.
Diazepam. One of the advantages of diazepam is that it is has the advantage of being water soluble at room temperature, which allows rectal rescue kits for home treatment. Although diazepam is efficacious for status epilepticus, variable pharmacokinetics leading to repeat dosing and further sedation make other benzodiazepines safer.
Lorazepam. Generally accepted as the preferred IV formulation for seizure, lorazepam requires refrigeration and has a short shelf life, making its use challenging in the prehospital setting. When administered via the IV route, lorazepam works as rapidly as diazepam in treating seizures but with a longer duration of effectiveness, resulting in a decreased need to re-dose or administer an alternative antiepileptic drug (AED).5
Midazolam. Newer studies suggest that buccal, intranasal, and IM midazolam may be superior to buccal, intranasal, and IM diazepam in treating GCSE.6 The Rapid Anticonvulsant Medication Prior to Arrival Trial demonstrated IM midazolam to be at least as efficacious as IV lorazepam in the prehospital setting for treating GCSE.2
Efficacy, Route, and Dosing
A meta-analysis of all three benzodiazepines in pediatric patients with seizure showed midazolam to have the highest probability of aborting seizure activity, while lorazepam had the least likelihood of causing respiratory depression.7The authors concluded that IV lorazepam and non-IV midazolam were superior to IV and non-IV diazepam in the treatment of pediatric seizures.7
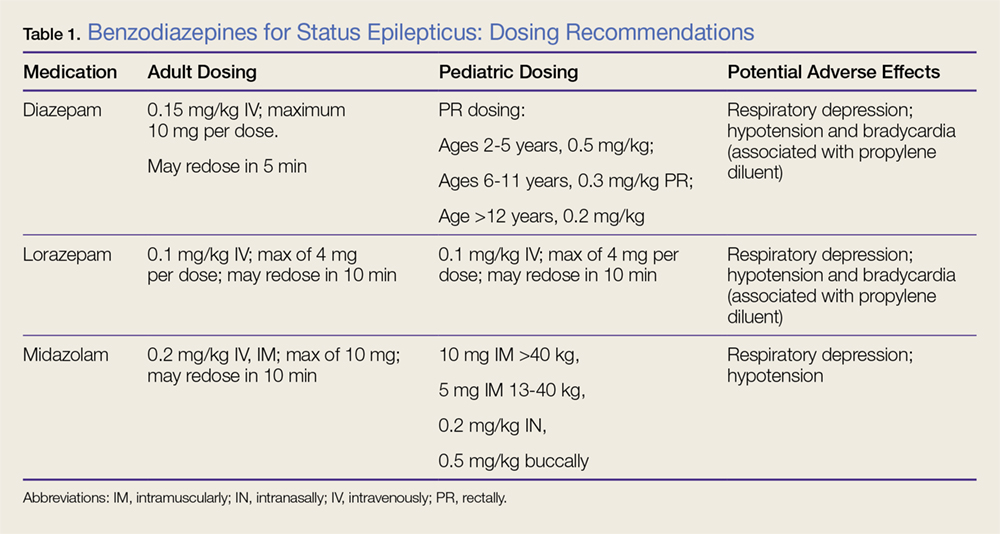
A recent retrospective study that analyzed benzodiazepine use in the emergency setting noted underdosing of benzodiazepines in the ED for nonprotocol-driven treatment of status epilepticus, resulting in the increased potential for adverse outcomes and intubations.8 Table 1 provides benzodiazepine dosing recommendations by route for adult and pediatric patients, along with potential adverse effects.
Adverse Effects
As noted previously, benzodiazepines can cause respiratory depression. Anecdotally, respiratory depression is often related to the rate at which the benzodiazepine is administered. For example, most treatment recommendations advise giving IV lorazepam over a 2-minute time period—not as an IV push.7
With respect to other adverse effects, it is important to note that IV formulations of diazepam and lorazepam contain propylene glycol as a diluent, which may lead to hypotension and bradycardia, especially when large volumes are infused over short periods of time.9
Second-Line Agents
While emergent initial therapy with benzodiazepines is well established, the preferred second-line agent, or urgent control therapy, continues to be a subject of controversy due to a lack of conclusive evidence for a superior agent.10 The Established Status Epilepticus Treatment Trial (ESETT) is currently conducting a head-to-head study to determine if any of the commonly used second-line agents (ie, fosphenytoin, levetiracetam, valproic acid) will prove to be more efficacious.11 Recently, the adult arm of the ESETT trial was halted due to futility.
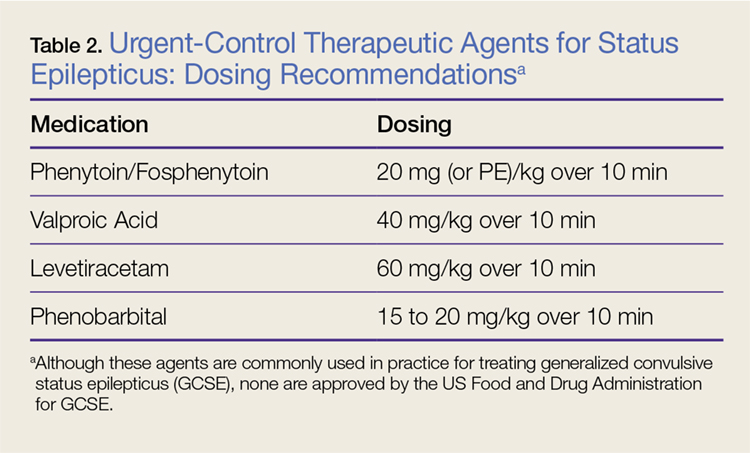
All patients without an identifiable secondary cause of GCSE (eg, hypoglycemia, hyponatremia, hypocalcemia) should be started on a second-line agent. Treatment with a second-line agent provides two benefits: First, patients who experience resolution of seizure activity may rapidly attain therapeutic levels of AEDs, which may be sustained through maintenance therapy; and second, the second-line treatment may abort refractory cases of status.12 Table 2 provides dosing recommendations for second-line agents.
Phenytoin and Fosphenytoin
Phenytoin and the newer prodrug fosphenytoin are a mainstay urgent-control therapy for emergency physicians (EPs) and neurologists alike. In one of the few head-to-head studies of AEDs,13 phenytoin did not perform as well as the other study agents (diazepam, lorazepam, and phenobarbital); however, generalizability from this study is limited. Fosphenytoin continues to be an efficacious choice for second-line treatment of AED.
Fosphenytoin, a water-soluble prodrug of phenytoin, is given preferentially over IV phenytoin due to its decreased risk of cardiovascular (CV) side effects and more rapid administration.14 Moreover, fosphenytoin is compatible with most IV fluids (eg, dextrose, lactated Ringer’s solution, normal saline [NS]), whereas phenytoin is only compatible with NS. For convenience, fosphenytoin is dosed in phenytoin equivalents (PE/kg)—eg, administration of 20 PE/kg over 10 minutes is a potential loading dose for fosphenytoin.
Valproic Acid
Valproic acid has become a favored second-line agent for many providers due to its relatively safe profile and rapid infusion time. Most studies have shown IV valproic acid is at least as effective as phenytoin, but data continue to be somewhat weak and most of the studies are uncontrolled.15
Hepatotoxicity is generally only associated with long-term use of valproic acid, but it remains reasonable to abstain from using this agent in patients with preexisting hepatic disease. Valproic acid toxicity can lead to somnolence, ataxia, seizures, and coma with marked hyperammonemia.16
Levetiracetam
Intravenous levetiracetam is becoming a more commonly used drug both for emergent initial treatment of seizure and as a maintenance therapy. While data on levetiracetam are limited, a few studies tout the efficacy and safety of IV loading to abort GCSE.
In observational studies, levetiracetam appears to have similar efficacy to other AEDs and may be more beneficial in early therapy.17 An ongoing current study, The Emergency Treatment With Levetiracetam or Phenytoin in Status Epilepticus trial, is examining a prospective cohort of pediatric patients comparing levetiracetam against phenytoin.18
Levetiracetam is generally considered safe. The most commonly reported side effects are dizziness, somnolence, nausea, and brief transaminitis.19 Levetiracetam has also been associated with neuropsychiatric exacerbations.20
Phenobarbital
Intravenous phenobarbital has been used as an urgent-control therapy for seizure with good efficacy, even in recent years.21 Despite this, phenobarbital may cause profound CV depression necessitating the use of vasopressors.22 Large-dose phenobarbital can be used to induce coma in patients, although this should not be attempted without the guidance of a neurologist. While phenobarbital can be used safely in certain circumstances, its use has fallen out of favor in the ED due to the availability of safer alternative options.
Refractory Status Epilepticus
If after receiving two AEDs, a patient continues to demonstrate seizure activity on physical examination or EEG, she or he is considered to have refractory status epilepticus, which is a medical emergency. Patients in refractory status epilepticus will likely require a continuous infusion of an AED as well as definitive airway management as a result of either seizure or continuous treatment. In rare cases, some patients will continue to seize despite continuous treatment. Such patients are considered to have super refractory status epilepticus, which is defined as continuing seizure activity despite treatment with general anesthetics for more than 24 hours. This condition is beyond the scope of traditional EP practice, who in this scenario would consult emergently with neurology or critical care services.
Propofol
Propofol, a sedative-hypnotic agent that activates both γ-aminobutyric acid and N-methyl-D-aspartate receptors, is commonly given to patients with refractory status epilepticus. While head-to-head reviews have not shown propofol to be superior to phenobarbital or midazolam in treating refractory seizure, it is a drug that is familiar to most EPs.23 Midazolam or propofol are typically given to patients in the ED who require intubation with sedation.
With respect to side effects, propofol can cause dose-limiting hypotension. In addition, propofol infusion syndrome leading to lactic acidosis and cardiac dysfunction in patients receiving long-term propofol infusion.24 One possible infusion dose is 0.5-1 mg/kg loading dose with a continuous infusion of 2 mg/kg/h IV.
High-Dose Midazolam
High-dose midazolam may be given as an alternative to propofol as some studies have shown its efficacy in treating refractory status epilepticus.25 Continuous low-dose infusions of midazolam (0.2 mg/kg/h) have been given to patients in the neurological intensive care unit (ICU); however, there are some data to support treating with a higher dose (≥0.4 mg/kg/h).25 In one single-center retrospective trial, post discharge all-cause mortality was lower in the cohort group that received the higher dose infusion (40% vs 62%).25 Although higher rates of hypotension were noted in the high-dose group, it did not appear to affect mortality.
Ketamine
Ketamine has become a valued anesthetic in emergency medicine, and EPs have become comfortable with its dosing and safety profile. While animal studies on ketamine are promising to treat status epilepticus, human data are limited and often extrapolated from retrospective ICU data. Many patients are placed on a ketamine infusion multiple days into status epilepticus, and for this reason, ketamine is not recommended as a second-line abortive drug in the ED.26
Alternative Treatments and Super Refractory GCSE
In cases of patients with seizure activity ongoing beyond conventional therapy, other methods have been attempted to cease seizure activity and achieve burst suppression on EEG. None of these treatments is in the purview of the EP and should only be undertaken by a neurologist.
Two pharmacologic agents that have some limited efficacy include lacosamide and topiramate. Isoflurane is the most commonly used inhaled anesthetic.27 Thiopental and pentobarbital are barbiturate anesthetics which are used in super refractory GCSE. Barbiturates have a desirable theoretical neuroprotective effect, but are limited by their CV depression at high doses.28 Vagus nerve stimulation, induced hypothermia, transcranial magnetic stimulation, and neurosurgical intervention have all been attempted with varying degrees of success in select patients.29
Eclampsia and Seizures During Pregnancy
Treating a pregnant patient with status epilepticus presents a unique challenge in the ED. The EP must weigh the importance of aborting seizure activity with the possibility of teratogenic effects. All AEDs must be used carefully, but valproic acid and phenytoin are potent teratogens and should be avoided in this patient population. Most evidence points to safety with exposure to benzodiazepines during pregnancy.30 Eclampsia must be considered in patients who may be pregnant or recently pregnant; magnesium should be used with or without the use of benzodiazepines in these patients.
Summary
The diagnosis and treatment of status epilepticus in the ED can be challenging. While there is a multitude of first-, second-, and third-line agents available to treat this condition, choosing the correct therapy for a patient can be daunting, and evidence of which treatment is superior can be lacking. However, the judicious use of benzodiazepines continues to be the primary treatment option. If status epilepticus persists, alternative agents and airway management may be necessary. The goal of treatment is to abort seizure-like activity observed on physician examination or EEG. It is important to remember that symptoms of status epilepticus can be subtle (eg, mild twitching, eye deviation), particularly when airway management is required since neuromuscular blockade can mask overt symptoms. Consultation with neurology and critical care colleagues should be initiated early; when such consultation is not available, the EP should consider patient transfer to an appropriate facility.
1. DeToledo JC, Lowe MR. Seizures, lateral decubitus, aspiration, and shoulder dislocation: time to change the guidelines? Neurology. 2001;56(3):290-291. doi:10.1212/wnl.56.3.290.
2. Silbergleit R, Lowenstein D, Durkalski V, et al; Neurological Emergency Treatment Trials (NETT) Investigators. RAMPART (Rapid Anticonvulsant Medication Prior to Arrival Trial): a double-blind randomized clinical trial of the efficacy of intramuscular midazolam versus intravenous lorazepam in the prehospital treatment of status epilepticus by paramedics. Epilepsia. 2011;52(Suppl 8):45-47. doi:10.1111/j.1528-1167.2011.03235.x.
3. Kreisman NR. Cerebral hypoxia during repetitive seizures. In: Somjen G, ed. Advances in Behavioral Biology: Mechanisms of Cerebral Hypoxia and Stroke. Vol 35. Boston, MA: Springer; 1988:139-149.
4. Van der Lende M, Surges R, Sander JW, Thijs RD. Cardiac arrhythmias during or after epileptic seizures. J Neurol Neurosurg Psychiatry. 2016;87(1):69-74. doi:10.1136/jnnp-2015-310559.
5. Appletan R, Sweeney A, Choonara I, Robson J, Molyneux E. Lorazepam versus diazepam in the acute treatment of epileptic seizures and status epilepticus. Dev Med Child Neurol. 1995;37(8):682-688. doi:10.1111/j.1469-8749.1995.tb15014.x.
6. McMullan J, Sasson C, Pancioli A, Silbergleit R. Midazolam versus diazepam for the treatment of status epilepticus in children and young adults: a meta-analysis. Acad Emerg Med. 2010;17(6):575-582. doi:10.1111/j.1553-2712.2010.00751.x.
7. Zhao ZY, Wang HY, Wen B, Yang ZB, Feng K, Fan JC. A comparison of midazolam, lorazepam, and diazepam for the treatment of status epilepticus in children: a network meta-analysis. J Child Neurol. 2016;31(9):1093-1107. doi:10.1177/0883073816638757.
8. Braun J, Gau E, Revelle S, Byrne L, Kumar A. Impact of non-guideline-based treatment of status epilepticus. J Neurol Sci. 2017;382:126-130. doi:10.1016/j.jns.2017.09.031.
9. Pillai U, Hothi JC, Bhat ZY. Severe propylene glycol toxicity secondary to use of anti-epileptics. Am J Ther. 2014;21(4):e106-e109. doi:10.1097/MJT.0b013e31824c407d.
10. Berkowitz R, Koyfman A. What is the best first-line agent for benzodiazepine-resistant convulsive status epilepticus? Ann Emerg Med. 2014;64(6):656-657. doi:10.1016/j.annemergmed.2014.04.017.
11. Established Status Epilepticus Treatment Trial. U.S. National Library of Medicine. ClinicalTrials.gov Web site. https://clinicaltrials.gov/ct2/show/NCT01960075. Accessed June 7, 2018.
12. O’Phelan KH, Miller CM. Emergency neurological life support: third edition, updates in the approach to early management of a neurological emergency. Neurocrit Care. 2017;27(Suppl 1):1-3. doi:10.1007/s12028-017-0448-x.
13. Treiman DM, Meyers PD, Walton NY, et al. A comparison of four treatments for generalized convulsive status epilepticus. Veterans Affairs Status Epilepticus Cooperative Study Group. N Engl J Med. 1998;339(12):792-798. doi:10.1056/NEJM199809173391202.
14. Thomson A. Fosphenytoin for the treatment of status epilepticus: an evidence-based assessment of its clinical and economic outcomes. Core Evid. 2005;1(1):65-75. doi:10.2147/ce.s6408.
15. Kanner AM. Intravenous valproate for status epilepticus...an effective, yet still merely empirical alternative! 2008;8(3):66-67. doi:10.1111/j.1535-7511.2008.00240.x.
16. Mishra D, Jain R, Juneja M, Chakrabarty B. Valproate associated hyperammonemic encephalopathy. J Pediatr Neurol. 2015;9(1):93-95. doi:10.3233/jpn-2010-0437.
17. Aiguabella M, Falip M, Villanueva V, et al. Efficacy of intravenous levetiracetam as an add-on treatment in status epilepticus: a multicentric observational study. Seizure. 2011;20(1):60-64. doi:10.1016/j.seizure.2010.10.009.
18. Lyttle MD, Gamble C, Messahel S, et al; supported by Paediatric Emergency Research in the United Kingdom & Ireland (PERUKI). Emergency treatment with levetiracetam or phenytoin in status epilepticus in children—the EcLiPSE study: study protocol for a randomised controlled trial. Trials. 2017;18(1):283. doi:10.1186/s13063-017-2010-8.
19. Uges JW, van Huizen MD, Engelsman J, et al. Safety and pharmacokinetics of intravenous levetiracetam infusion as add-on in status epilepticus. Epilepsia. 2009;50(3):415-421. doi:10.1111/j.1528-1167.2008.01889.x.
20. Afazal U, Oostema JA, Smith B. Emergency department initiation of levetiracetam for seizure: a cohort study examining psychiatric risk assessment and counseling. Ann Emerg Med. 2013;62(4):S131. doi:10.1016/j.annemergmed.2013.07.194.
21. Muramoto E, Mizobuchi M, Sumi Y, et al. Efficacy of intravenous phenobarbital treatment for status epilepticus. Brain Nerve. 2013;65(8):983-987.
22. Wijdicks EFM. Status epilepticus. In: The Practice of Emergency and Critical Care Neurology. New York, NY: Oxford University Press; 2010:558-559.
23. Claassen J, Hirsch LJ, Emerson RG, Mayer SA. Treatment of refractory status epilepticus with pentobarbital, propofol, or midazolam: a systematic review. Epilepsia. 2002;43(2):146-153. doi:10.1046/j.1528-1157.2002.28501.x.
24. Choi YJ, Kim MC, Lim YJ, Yoon SZ, Yoon SM, Yoon HR. Propofol infusion associated metabolic acidosis in patients undergoing neurosurgical anesthesia: a retrospective study. J Korean Neurosurg Soc. 2014;56(2):135-140. doi:10.3340/jkns.2014.56.2.135.
25. Fernandez A, Lantigua H, Lesch C, et al. High-dose midazolam infusion for refractory status epilepticus. Neurology. 2013;82(4): 359-365. doi:10.1212/wnl.0000000000000054.
26. Dorandeu F. Ketamine for the treatment of (super) refractory status epilepticus? Not quite yet. Expert Rev Neurother. 2017;17(5):419-421. doi:10.1080/14737175.2017.1288099.
27. Zeiler FA, Zeiler KJ, Teitelbaum J, Gillman LM, West M. Modern inhalational anesthetics for refractory status epilepticus. Can J Neurol Sci. 2015;42(2):106-115. doi:10.1017/cjn.2014.121.
28. Shorvon S, Ferlisi M. The treatment of super-refractory status epilepticus: a critical review of available therapies and a clinical treatment protocol. Brain. 2011;134(10):2802-2818. doi:10.1093/brain/awr215.
29. Winkler PA. Surgical treatment of status epilepticus: a palliative approach. Epilepsia. 2013;54(Suppl 6):68-71. doi:10.1111/epi.12282.
30. Eros E, Czeizel AE, Rockenbauer M, Sorensen HT, Olsen J. A population-based case-control teratologic study of nitrazepam, medazepam, tofisopam, alprazolum and clonazepam treatment during pregnancy. Eur J Obstet Gynecol Reprod Biol. 2002;101(2):147-154. doi:10.1016/s0301-2115(01)00545-0.
In part 1 of this 2-part review, the authors detailed proper diagnosis of seizures in the ED setting. In this concluding article, they focus on appropriate management and treatment options for patients with seizure.
In part 1 of this 2-part review, the authors detailed proper diagnosis of seizures in the ED setting. In this concluding article, they focus on appropriate management and treatment options for patients with seizure.
Status epilepticus is defined as continuous seizure activity for greater than 5 minutes, or repeated episodes of seizures without resolution of the postictal period. When the clinician arrives at the patient’s bedside or the emergency medical technician arrives at the scene in the prehospital setting, the patient may be minutes into seizure activity. If the seizure does not immediately resolve, the provider should treat as if status is imminent, if not ongoing. Regardless of setting, if the patient is discovered to be seizing, treatment should be initiated.
It is important to distinguish between provoked and unprovoked seizures, since successful management may require treating an underlying etiology. Although there are as many types of status epilepticus as there are types of seizures, the focus of this review is on generalized convulsive status epilepticus (GCSE).
As a GCSE continues, the overt seizure activity may become subtle—essentially a transformation of generalized status to a state with minimal or no motor movements. Whether or not there is an absence of, or minimal, movement, GCSE still represents a medical emergency, since the excessive neuronal activity causes neuronal injury. An electroencephalogram (EEG) may be required to detect transformed GCSE, which should be suspected if the patient does not exhibit improved mental status within 20 to 30 minutes of convulsive seizure cessation, or if neuromuscular paralysis for intubation has occurred.
Initial Management
Initial management of seizure patients is consistent with the care of any critical patient in the ED. Assessment of the airway and airway management with endotracheal intubation may be necessary for patients who are apneic or at risk for aspiration, or in whom more conservative management is inadequate.
While placing a patient in the left lateral decubitus position may mitigate aspiration risk, since vomiting is common in a postictal state, moving a convulsing patient may be challenging.1 Patients should be placed on cardiac monitoring with pulse oximetry if feasible. Intravenous (IV) access should be established if possible, though intramuscular (IM) or other alternative routes for benzodiazepines may be used if obtaining IV access will result in a delay in treatment.2
Oxygen should be administered via nonrebreather or bag-valve-mask to patients with apnea to prevent both systemic and cerebral hypoxia.3Since cardiac dysrhythmias with cerebral hypoxia may cause seizure-like activity, it is imperative to check the patient’s pulses, blood pressure, and to maintain cardiac monitoring during convulsive episodes.4 The patient’s glucose levels should be checked upon arrival to determine if the seizure is due to metabolic disturbance, which is an easily reversible cause of seizure. If glucose point-of-care testing is not available, it is reasonable to treat empirically for hypoglycemia.
Emergent Initial Therapy: First-Line Agents
Benzodiazepines
Benzodiazepines are the mainstay of emergent treatment for status epilepticus. The choice of benzodiazepine may be dependent on the clinical setting and availability of IV access or other resources. In the United States, diazepam, lorazepam, and midazolam are the common formulations used for abortive emergent initial therapy.
Diazepam. One of the advantages of diazepam is that it is has the advantage of being water soluble at room temperature, which allows rectal rescue kits for home treatment. Although diazepam is efficacious for status epilepticus, variable pharmacokinetics leading to repeat dosing and further sedation make other benzodiazepines safer.
Lorazepam. Generally accepted as the preferred IV formulation for seizure, lorazepam requires refrigeration and has a short shelf life, making its use challenging in the prehospital setting. When administered via the IV route, lorazepam works as rapidly as diazepam in treating seizures but with a longer duration of effectiveness, resulting in a decreased need to re-dose or administer an alternative antiepileptic drug (AED).5
Midazolam. Newer studies suggest that buccal, intranasal, and IM midazolam may be superior to buccal, intranasal, and IM diazepam in treating GCSE.6 The Rapid Anticonvulsant Medication Prior to Arrival Trial demonstrated IM midazolam to be at least as efficacious as IV lorazepam in the prehospital setting for treating GCSE.2
Efficacy, Route, and Dosing
A meta-analysis of all three benzodiazepines in pediatric patients with seizure showed midazolam to have the highest probability of aborting seizure activity, while lorazepam had the least likelihood of causing respiratory depression.7The authors concluded that IV lorazepam and non-IV midazolam were superior to IV and non-IV diazepam in the treatment of pediatric seizures.7
A recent retrospective study that analyzed benzodiazepine use in the emergency setting noted underdosing of benzodiazepines in the ED for nonprotocol-driven treatment of status epilepticus, resulting in the increased potential for adverse outcomes and intubations.8 Table 1 provides benzodiazepine dosing recommendations by route for adult and pediatric patients, along with potential adverse effects.
Adverse Effects
As noted previously, benzodiazepines can cause respiratory depression. Anecdotally, respiratory depression is often related to the rate at which the benzodiazepine is administered. For example, most treatment recommendations advise giving IV lorazepam over a 2-minute time period—not as an IV push.7
With respect to other adverse effects, it is important to note that IV formulations of diazepam and lorazepam contain propylene glycol as a diluent, which may lead to hypotension and bradycardia, especially when large volumes are infused over short periods of time.9
Second-Line Agents
While emergent initial therapy with benzodiazepines is well established, the preferred second-line agent, or urgent control therapy, continues to be a subject of controversy due to a lack of conclusive evidence for a superior agent.10 The Established Status Epilepticus Treatment Trial (ESETT) is currently conducting a head-to-head study to determine if any of the commonly used second-line agents (ie, fosphenytoin, levetiracetam, valproic acid) will prove to be more efficacious.11 Recently, the adult arm of the ESETT trial was halted due to futility.
All patients without an identifiable secondary cause of GCSE (eg, hypoglycemia, hyponatremia, hypocalcemia) should be started on a second-line agent. Treatment with a second-line agent provides two benefits: First, patients who experience resolution of seizure activity may rapidly attain therapeutic levels of AEDs, which may be sustained through maintenance therapy; and second, the second-line treatment may abort refractory cases of status.12 Table 2 provides dosing recommendations for second-line agents.
Phenytoin and Fosphenytoin
Phenytoin and the newer prodrug fosphenytoin are a mainstay urgent-control therapy for emergency physicians (EPs) and neurologists alike. In one of the few head-to-head studies of AEDs,13 phenytoin did not perform as well as the other study agents (diazepam, lorazepam, and phenobarbital); however, generalizability from this study is limited. Fosphenytoin continues to be an efficacious choice for second-line treatment of AED.
Fosphenytoin, a water-soluble prodrug of phenytoin, is given preferentially over IV phenytoin due to its decreased risk of cardiovascular (CV) side effects and more rapid administration.14 Moreover, fosphenytoin is compatible with most IV fluids (eg, dextrose, lactated Ringer’s solution, normal saline [NS]), whereas phenytoin is only compatible with NS. For convenience, fosphenytoin is dosed in phenytoin equivalents (PE/kg)—eg, administration of 20 PE/kg over 10 minutes is a potential loading dose for fosphenytoin.
Valproic Acid
Valproic acid has become a favored second-line agent for many providers due to its relatively safe profile and rapid infusion time. Most studies have shown IV valproic acid is at least as effective as phenytoin, but data continue to be somewhat weak and most of the studies are uncontrolled.15
Hepatotoxicity is generally only associated with long-term use of valproic acid, but it remains reasonable to abstain from using this agent in patients with preexisting hepatic disease. Valproic acid toxicity can lead to somnolence, ataxia, seizures, and coma with marked hyperammonemia.16
Levetiracetam
Intravenous levetiracetam is becoming a more commonly used drug both for emergent initial treatment of seizure and as a maintenance therapy. While data on levetiracetam are limited, a few studies tout the efficacy and safety of IV loading to abort GCSE.
In observational studies, levetiracetam appears to have similar efficacy to other AEDs and may be more beneficial in early therapy.17 An ongoing current study, The Emergency Treatment With Levetiracetam or Phenytoin in Status Epilepticus trial, is examining a prospective cohort of pediatric patients comparing levetiracetam against phenytoin.18
Levetiracetam is generally considered safe. The most commonly reported side effects are dizziness, somnolence, nausea, and brief transaminitis.19 Levetiracetam has also been associated with neuropsychiatric exacerbations.20
Phenobarbital
Intravenous phenobarbital has been used as an urgent-control therapy for seizure with good efficacy, even in recent years.21 Despite this, phenobarbital may cause profound CV depression necessitating the use of vasopressors.22 Large-dose phenobarbital can be used to induce coma in patients, although this should not be attempted without the guidance of a neurologist. While phenobarbital can be used safely in certain circumstances, its use has fallen out of favor in the ED due to the availability of safer alternative options.
Refractory Status Epilepticus
If after receiving two AEDs, a patient continues to demonstrate seizure activity on physical examination or EEG, she or he is considered to have refractory status epilepticus, which is a medical emergency. Patients in refractory status epilepticus will likely require a continuous infusion of an AED as well as definitive airway management as a result of either seizure or continuous treatment. In rare cases, some patients will continue to seize despite continuous treatment. Such patients are considered to have super refractory status epilepticus, which is defined as continuing seizure activity despite treatment with general anesthetics for more than 24 hours. This condition is beyond the scope of traditional EP practice, who in this scenario would consult emergently with neurology or critical care services.
Propofol
Propofol, a sedative-hypnotic agent that activates both γ-aminobutyric acid and N-methyl-D-aspartate receptors, is commonly given to patients with refractory status epilepticus. While head-to-head reviews have not shown propofol to be superior to phenobarbital or midazolam in treating refractory seizure, it is a drug that is familiar to most EPs.23 Midazolam or propofol are typically given to patients in the ED who require intubation with sedation.
With respect to side effects, propofol can cause dose-limiting hypotension. In addition, propofol infusion syndrome leading to lactic acidosis and cardiac dysfunction in patients receiving long-term propofol infusion.24 One possible infusion dose is 0.5-1 mg/kg loading dose with a continuous infusion of 2 mg/kg/h IV.
High-Dose Midazolam
High-dose midazolam may be given as an alternative to propofol as some studies have shown its efficacy in treating refractory status epilepticus.25 Continuous low-dose infusions of midazolam (0.2 mg/kg/h) have been given to patients in the neurological intensive care unit (ICU); however, there are some data to support treating with a higher dose (≥0.4 mg/kg/h).25 In one single-center retrospective trial, post discharge all-cause mortality was lower in the cohort group that received the higher dose infusion (40% vs 62%).25 Although higher rates of hypotension were noted in the high-dose group, it did not appear to affect mortality.
Ketamine
Ketamine has become a valued anesthetic in emergency medicine, and EPs have become comfortable with its dosing and safety profile. While animal studies on ketamine are promising to treat status epilepticus, human data are limited and often extrapolated from retrospective ICU data. Many patients are placed on a ketamine infusion multiple days into status epilepticus, and for this reason, ketamine is not recommended as a second-line abortive drug in the ED.26
Alternative Treatments and Super Refractory GCSE
In cases of patients with seizure activity ongoing beyond conventional therapy, other methods have been attempted to cease seizure activity and achieve burst suppression on EEG. None of these treatments is in the purview of the EP and should only be undertaken by a neurologist.
Two pharmacologic agents that have some limited efficacy include lacosamide and topiramate. Isoflurane is the most commonly used inhaled anesthetic.27 Thiopental and pentobarbital are barbiturate anesthetics which are used in super refractory GCSE. Barbiturates have a desirable theoretical neuroprotective effect, but are limited by their CV depression at high doses.28 Vagus nerve stimulation, induced hypothermia, transcranial magnetic stimulation, and neurosurgical intervention have all been attempted with varying degrees of success in select patients.29
Eclampsia and Seizures During Pregnancy
Treating a pregnant patient with status epilepticus presents a unique challenge in the ED. The EP must weigh the importance of aborting seizure activity with the possibility of teratogenic effects. All AEDs must be used carefully, but valproic acid and phenytoin are potent teratogens and should be avoided in this patient population. Most evidence points to safety with exposure to benzodiazepines during pregnancy.30 Eclampsia must be considered in patients who may be pregnant or recently pregnant; magnesium should be used with or without the use of benzodiazepines in these patients.
Summary
The diagnosis and treatment of status epilepticus in the ED can be challenging. While there is a multitude of first-, second-, and third-line agents available to treat this condition, choosing the correct therapy for a patient can be daunting, and evidence of which treatment is superior can be lacking. However, the judicious use of benzodiazepines continues to be the primary treatment option. If status epilepticus persists, alternative agents and airway management may be necessary. The goal of treatment is to abort seizure-like activity observed on physician examination or EEG. It is important to remember that symptoms of status epilepticus can be subtle (eg, mild twitching, eye deviation), particularly when airway management is required since neuromuscular blockade can mask overt symptoms. Consultation with neurology and critical care colleagues should be initiated early; when such consultation is not available, the EP should consider patient transfer to an appropriate facility.
1. DeToledo JC, Lowe MR. Seizures, lateral decubitus, aspiration, and shoulder dislocation: time to change the guidelines? Neurology. 2001;56(3):290-291. doi:10.1212/wnl.56.3.290.
2. Silbergleit R, Lowenstein D, Durkalski V, et al; Neurological Emergency Treatment Trials (NETT) Investigators. RAMPART (Rapid Anticonvulsant Medication Prior to Arrival Trial): a double-blind randomized clinical trial of the efficacy of intramuscular midazolam versus intravenous lorazepam in the prehospital treatment of status epilepticus by paramedics. Epilepsia. 2011;52(Suppl 8):45-47. doi:10.1111/j.1528-1167.2011.03235.x.
3. Kreisman NR. Cerebral hypoxia during repetitive seizures. In: Somjen G, ed. Advances in Behavioral Biology: Mechanisms of Cerebral Hypoxia and Stroke. Vol 35. Boston, MA: Springer; 1988:139-149.
4. Van der Lende M, Surges R, Sander JW, Thijs RD. Cardiac arrhythmias during or after epileptic seizures. J Neurol Neurosurg Psychiatry. 2016;87(1):69-74. doi:10.1136/jnnp-2015-310559.
5. Appletan R, Sweeney A, Choonara I, Robson J, Molyneux E. Lorazepam versus diazepam in the acute treatment of epileptic seizures and status epilepticus. Dev Med Child Neurol. 1995;37(8):682-688. doi:10.1111/j.1469-8749.1995.tb15014.x.
6. McMullan J, Sasson C, Pancioli A, Silbergleit R. Midazolam versus diazepam for the treatment of status epilepticus in children and young adults: a meta-analysis. Acad Emerg Med. 2010;17(6):575-582. doi:10.1111/j.1553-2712.2010.00751.x.
7. Zhao ZY, Wang HY, Wen B, Yang ZB, Feng K, Fan JC. A comparison of midazolam, lorazepam, and diazepam for the treatment of status epilepticus in children: a network meta-analysis. J Child Neurol. 2016;31(9):1093-1107. doi:10.1177/0883073816638757.
8. Braun J, Gau E, Revelle S, Byrne L, Kumar A. Impact of non-guideline-based treatment of status epilepticus. J Neurol Sci. 2017;382:126-130. doi:10.1016/j.jns.2017.09.031.
9. Pillai U, Hothi JC, Bhat ZY. Severe propylene glycol toxicity secondary to use of anti-epileptics. Am J Ther. 2014;21(4):e106-e109. doi:10.1097/MJT.0b013e31824c407d.
10. Berkowitz R, Koyfman A. What is the best first-line agent for benzodiazepine-resistant convulsive status epilepticus? Ann Emerg Med. 2014;64(6):656-657. doi:10.1016/j.annemergmed.2014.04.017.
11. Established Status Epilepticus Treatment Trial. U.S. National Library of Medicine. ClinicalTrials.gov Web site. https://clinicaltrials.gov/ct2/show/NCT01960075. Accessed June 7, 2018.
12. O’Phelan KH, Miller CM. Emergency neurological life support: third edition, updates in the approach to early management of a neurological emergency. Neurocrit Care. 2017;27(Suppl 1):1-3. doi:10.1007/s12028-017-0448-x.
13. Treiman DM, Meyers PD, Walton NY, et al. A comparison of four treatments for generalized convulsive status epilepticus. Veterans Affairs Status Epilepticus Cooperative Study Group. N Engl J Med. 1998;339(12):792-798. doi:10.1056/NEJM199809173391202.
14. Thomson A. Fosphenytoin for the treatment of status epilepticus: an evidence-based assessment of its clinical and economic outcomes. Core Evid. 2005;1(1):65-75. doi:10.2147/ce.s6408.
15. Kanner AM. Intravenous valproate for status epilepticus...an effective, yet still merely empirical alternative! 2008;8(3):66-67. doi:10.1111/j.1535-7511.2008.00240.x.
16. Mishra D, Jain R, Juneja M, Chakrabarty B. Valproate associated hyperammonemic encephalopathy. J Pediatr Neurol. 2015;9(1):93-95. doi:10.3233/jpn-2010-0437.
17. Aiguabella M, Falip M, Villanueva V, et al. Efficacy of intravenous levetiracetam as an add-on treatment in status epilepticus: a multicentric observational study. Seizure. 2011;20(1):60-64. doi:10.1016/j.seizure.2010.10.009.
18. Lyttle MD, Gamble C, Messahel S, et al; supported by Paediatric Emergency Research in the United Kingdom & Ireland (PERUKI). Emergency treatment with levetiracetam or phenytoin in status epilepticus in children—the EcLiPSE study: study protocol for a randomised controlled trial. Trials. 2017;18(1):283. doi:10.1186/s13063-017-2010-8.
19. Uges JW, van Huizen MD, Engelsman J, et al. Safety and pharmacokinetics of intravenous levetiracetam infusion as add-on in status epilepticus. Epilepsia. 2009;50(3):415-421. doi:10.1111/j.1528-1167.2008.01889.x.
20. Afazal U, Oostema JA, Smith B. Emergency department initiation of levetiracetam for seizure: a cohort study examining psychiatric risk assessment and counseling. Ann Emerg Med. 2013;62(4):S131. doi:10.1016/j.annemergmed.2013.07.194.
21. Muramoto E, Mizobuchi M, Sumi Y, et al. Efficacy of intravenous phenobarbital treatment for status epilepticus. Brain Nerve. 2013;65(8):983-987.
22. Wijdicks EFM. Status epilepticus. In: The Practice of Emergency and Critical Care Neurology. New York, NY: Oxford University Press; 2010:558-559.
23. Claassen J, Hirsch LJ, Emerson RG, Mayer SA. Treatment of refractory status epilepticus with pentobarbital, propofol, or midazolam: a systematic review. Epilepsia. 2002;43(2):146-153. doi:10.1046/j.1528-1157.2002.28501.x.
24. Choi YJ, Kim MC, Lim YJ, Yoon SZ, Yoon SM, Yoon HR. Propofol infusion associated metabolic acidosis in patients undergoing neurosurgical anesthesia: a retrospective study. J Korean Neurosurg Soc. 2014;56(2):135-140. doi:10.3340/jkns.2014.56.2.135.
25. Fernandez A, Lantigua H, Lesch C, et al. High-dose midazolam infusion for refractory status epilepticus. Neurology. 2013;82(4): 359-365. doi:10.1212/wnl.0000000000000054.
26. Dorandeu F. Ketamine for the treatment of (super) refractory status epilepticus? Not quite yet. Expert Rev Neurother. 2017;17(5):419-421. doi:10.1080/14737175.2017.1288099.
27. Zeiler FA, Zeiler KJ, Teitelbaum J, Gillman LM, West M. Modern inhalational anesthetics for refractory status epilepticus. Can J Neurol Sci. 2015;42(2):106-115. doi:10.1017/cjn.2014.121.
28. Shorvon S, Ferlisi M. The treatment of super-refractory status epilepticus: a critical review of available therapies and a clinical treatment protocol. Brain. 2011;134(10):2802-2818. doi:10.1093/brain/awr215.
29. Winkler PA. Surgical treatment of status epilepticus: a palliative approach. Epilepsia. 2013;54(Suppl 6):68-71. doi:10.1111/epi.12282.
30. Eros E, Czeizel AE, Rockenbauer M, Sorensen HT, Olsen J. A population-based case-control teratologic study of nitrazepam, medazepam, tofisopam, alprazolum and clonazepam treatment during pregnancy. Eur J Obstet Gynecol Reprod Biol. 2002;101(2):147-154. doi:10.1016/s0301-2115(01)00545-0.
FDA Efforts to Advance Development of Gene Therapies
FDA Commissioner Scott Gottlieb, MD, releases a statement on the agency’s efforts to advance development of gene therapies.
Once just a theory, gene therapies are now a therapeutic reality for some patients. These platforms may have the potential to treat and cure some of our most intractable and vexing diseases. The policy framework we construct for how these products should be developed, reviewed by regulators, and reimbursed, will help set the stage for the continued advancement of this new market. Last year, we announced our comprehensive policy framework for regenerative medicine, including a draft guidance that describes the expedited programs, such as the breakthrough therapy designation, and the regenerative medicine advanced therapy (RMAT) designation, that may be available to sponsors of these therapies. Today, we’re unveiling a complementary framework for the development, review and approval of gene therapies.

In the past 12 months, we’ve seen three separate gene therapy products approved by the FDA. This reflects the rapid advancements in this field. An inflection point was reached with the development of vectors that could reliably deliver gene cassettes in vivo, into cells and human tissue. In the future, we expect this field to continue to expand, with the potential approval of new treatments for many debilitating diseases. These therapies hold great promise. Our new steps are aimed at fostering developments in this innovative field.
Gene therapies are being studied in many areas, including genetic disorders, autoimmune diseases, heart disease, cancer and HIV/AIDS. We look forward to working with the academic and research communities to make safe and effective products a reality for more patients. But we know that we still have much to learn about how these products work, how to administer them safely, and whether they will continue to work properly in the body without causing adverse side effects over long periods of time. In contrast to traditional drug review, some of the more challenging questions when it comes to gene therapy relate to product manufacturing and quality, or questions about the durability of response, which often can’t be fully answered in any reasonably sized pre-market trial. For some of these products, we may need to accept some level of uncertainty around these questions at the time of approval. For example, in some cases the long-term durability of the effect won’t be fully understood at the time of approval. Effective tools for reliable post-market follow up, such as required post-market clinical trials, are going to be one key to advancing this field and helping to ensure that our approach fosters safe and innovative treatments.
Even when there may be uncertainty about some questions, we need to make certain we assure patient safety and adequately characterize the potential risks and demonstrated benefits of these products. In part because of the added questions that often surround a new technology like gene therapy, these products are initially being aimed at devastating diseases, many of which lack available therapies, including some diseases that are fatal. In such cases of devastating diseases without available therapies, we’ve traditionally been willing to accept more uncertainty to facilitate timely access to promising therapies. In such cases, drug sponsors are generally required to conduct post-marketing clinical trials, known as phase 4 confirmatory trials, to confirm clinical benefit of the drug. This is the direction Congress gave the FDA by creating vehicles like the accelerated approval pathway.
When it comes to novel technologies like gene therapy, the FDA is steadfastly committed to a regulatory path that maintains the agency’s gold standard for assuring safety and efficacy. As we develop this evidence-based framework, we’re going to have to modernize how we approach certain aspects of these products in order to make sure our approach is tailored to the unique challenges created by these new platforms.
Today, we’re taking a step toward shaping this modern structure for the regulation of gene therapy. The agency is issuing a suite of six scientific guidance documents intended to serve as the building blocks of a modern, comprehensive framework for how we’ll help advance the field of gene therapy while making sure new products meet the FDA’s gold standard for safety and effectiveness.
These policies are part of our efforts to communicate the steps we’re taking to provide clear recommendations to sponsors and researchers, so that we can better support innovation. The documents are being issued in draft form so that we can solicit public input on these new policies. As with all draft guidances, all of the comments we receive will be carefully considered prior to finalizing these documents. We’re committed to working with stakeholders to bring novel treatments to the market while ensuring the safety of patients.
Disease-Specific Gene Therapy Guidances
The FDA has issuing three new draft guidance documents on the development of gene therapy products for specific disease categories. These are the first three disease-specific guidances that the agency is issuing for gene therapy products. Our new commitment to develop disease-specific guidance documents reflects the increasing activity in this field, and its growing importance to advancing public health.
Human Gene Therapy for Hemophilia: Gene therapy products for hemophilia are now being developed as single-dose treatments that may enable long-term production of the missing or abnormal coagulation factor in patients. This may reduce or eliminate the need for coagulation factor replacement. To define the proper development pathway for such products, we’re issuing a new draft guidance on gene therapy products that are targeted to the treatment of hemophilia. Once finalized, this new guidance will provide recommendations on the FDA’s current thinking on clinical trial design and preclinical considerations to support the development of these gene therapy products. Among other elements, the draft guidance provides recommendations regarding surrogate endpoints that could be used by sponsors pursuing accelerated approval of gene therapy products that are intended for treatment of hemophilia.
Human Gene Therapy for Retinal Disorders: Another area of fast-paced activity is gene therapy products targeted to the treatment of retinal disorders. The Human Gene Therapy for Retinal Disorders guidance, once finalized, will assist those developing gene therapy products for a wide variety of retinal disorders affecting both adult and pediatric patients. Gene therapy products currently undergoing clinical trials in the United States for retinal disorders are commonly delivered by intravitreal injections (into the fluid portion of the eye), or by subretinal injections (beneath the retina). In some cases, the gene therapy products are encapsulated in a device to be implanted within the eye. This new guidance document will focus on issues that are specific to gene therapies for retinal disorders. The document provides recommendations related to product development, preclinical testing, and clinical trial design for such products.
Human Gene Therapy for Rare Diseases: Rare diseases are those that affect fewer than 200,000 people in the United States. The National Institutes of Health reports that nearly 7,000 rare diseases affect more than 25 million Americans. About 80 percent of rare diseases are caused by a single-gene defect, and about half of all rare diseases affect children. Since most rare diseases have no approved therapies, there is a significant unmet need. The Human Gene Therapy for Rare Diseases guidance, once finalized, will provide recommendations on preclinical, manufacturing and clinical trial design for all phases of the clinical development program for these types of gene therapies. The information is intended to assist sponsors in the design of clinical development programs, where there may be limited study population size, potential feasibility and safety issues, as well as issues relating to the interpretation of effectiveness.
Guidances on Manufacturing Gene Therapies
The FDA is also providing new and comprehensive updates to three existing guidances that address manufacturing issues related to gene therapy. These updates reflect input from many stakeholders. We encourage additional feedback on these documents during the comment period.
The first draft guidance, Chemistry, Manufacturing, and Control (CMC) Information for Human Gene Therapy Investigational New Drug Applications (INDs), provides sponsors with recommendations on how to provide sufficient CMC information to assure safety, identity, quality, purity and strength/potency of investigational gene therapy products. The guidance applies to human gene therapies and to combination products that contain a human gene therapy in combination with a drug or device. In addition, this guidance is organized to follow the structure of the FDA guidance on the Common Technical Document.
The second draft guidance, Testing of Retroviral Vector-Based Gene Therapy Products for Replication Competent Retrovirus (RCR) during Product Manufacture and Patient Follow-up, provides additional recommendations regarding the proper testing for RCR during the manufacture of retroviral vector-based gene therapy products, as well as during the follow-up monitoring of patients who’ve received retroviral vector-based gene therapy products. Specifically, the draft guidance recommends the identification and amount of material to be tested. The guidance also provides advice on general testing methods.
The third draft guidance, Long Term Follow-Up After Administration of Human Gene Therapy Products, provides recommendations regarding the design of long-term follow-up (LTFU) observational studies for the collection of data on delayed adverse events following administration of a gene therapy product. Because of some of the additional uncertainty intrinsic to a novel platform like gene therapy -- including questions related to the durability of the treatment effects as well as the theoretical potential for off-target effects if the genes do not insert correctly -- there’s an increased need for robust long-term follow-up of patients in the post-market period. This guidance describes product characteristics, patient-related factors, and the preclinical and clinical data that should be considered when assessing the need for LTFU observations and describes the features related to effective post-market follow up.
Once finalized, these draft guidances will replace previous guidances issued by the FDA in April 2008 (CMC) and November 2006 (RCR and LTFU).
The field of gene therapy has progressed rapidly since these guidances were first issued. Therefore, the FDA is updating these guidances to provide sponsors with the agency’s most up-to-date thinking.
Our goal is to help promote safe and effective product development in this field. We’ll continue to work with the product sponsors to help make the development and approval of these innovative gene therapies more efficient, while putting in place the regulatory controls needed to ensure that the resulting therapies are both safe and effective. We’ll also make full use of our expedited programs such as breakthrough therapy designation and regenerative medicine advanced therapy designation whenever possible.
Gene therapy represents one of the most promising opportunities for developing highly effective and even curative treatments for many vexing disorders. Some of these products are almost certainly going to change the contours of medical practice, and the destiny of patients with some debilitating diseases.
The FDA’s goal is to help these innovations advance in a framework that assures the safety and effectiveness of these resulting treatments, and continues to build peoples’ confidence in this novel area of medicine.
–Scott Gottlieb, MD
FDA Commissioner Scott Gottlieb, MD, releases a statement on the agency’s efforts to advance development of gene therapies.
FDA Commissioner Scott Gottlieb, MD, releases a statement on the agency’s efforts to advance development of gene therapies.
Once just a theory, gene therapies are now a therapeutic reality for some patients. These platforms may have the potential to treat and cure some of our most intractable and vexing diseases. The policy framework we construct for how these products should be developed, reviewed by regulators, and reimbursed, will help set the stage for the continued advancement of this new market. Last year, we announced our comprehensive policy framework for regenerative medicine, including a draft guidance that describes the expedited programs, such as the breakthrough therapy designation, and the regenerative medicine advanced therapy (RMAT) designation, that may be available to sponsors of these therapies. Today, we’re unveiling a complementary framework for the development, review and approval of gene therapies.
In the past 12 months, we’ve seen three separate gene therapy products approved by the FDA. This reflects the rapid advancements in this field. An inflection point was reached with the development of vectors that could reliably deliver gene cassettes in vivo, into cells and human tissue. In the future, we expect this field to continue to expand, with the potential approval of new treatments for many debilitating diseases. These therapies hold great promise. Our new steps are aimed at fostering developments in this innovative field.
Gene therapies are being studied in many areas, including genetic disorders, autoimmune diseases, heart disease, cancer and HIV/AIDS. We look forward to working with the academic and research communities to make safe and effective products a reality for more patients. But we know that we still have much to learn about how these products work, how to administer them safely, and whether they will continue to work properly in the body without causing adverse side effects over long periods of time. In contrast to traditional drug review, some of the more challenging questions when it comes to gene therapy relate to product manufacturing and quality, or questions about the durability of response, which often can’t be fully answered in any reasonably sized pre-market trial. For some of these products, we may need to accept some level of uncertainty around these questions at the time of approval. For example, in some cases the long-term durability of the effect won’t be fully understood at the time of approval. Effective tools for reliable post-market follow up, such as required post-market clinical trials, are going to be one key to advancing this field and helping to ensure that our approach fosters safe and innovative treatments.
Even when there may be uncertainty about some questions, we need to make certain we assure patient safety and adequately characterize the potential risks and demonstrated benefits of these products. In part because of the added questions that often surround a new technology like gene therapy, these products are initially being aimed at devastating diseases, many of which lack available therapies, including some diseases that are fatal. In such cases of devastating diseases without available therapies, we’ve traditionally been willing to accept more uncertainty to facilitate timely access to promising therapies. In such cases, drug sponsors are generally required to conduct post-marketing clinical trials, known as phase 4 confirmatory trials, to confirm clinical benefit of the drug. This is the direction Congress gave the FDA by creating vehicles like the accelerated approval pathway.
When it comes to novel technologies like gene therapy, the FDA is steadfastly committed to a regulatory path that maintains the agency’s gold standard for assuring safety and efficacy. As we develop this evidence-based framework, we’re going to have to modernize how we approach certain aspects of these products in order to make sure our approach is tailored to the unique challenges created by these new platforms.
Today, we’re taking a step toward shaping this modern structure for the regulation of gene therapy. The agency is issuing a suite of six scientific guidance documents intended to serve as the building blocks of a modern, comprehensive framework for how we’ll help advance the field of gene therapy while making sure new products meet the FDA’s gold standard for safety and effectiveness.
These policies are part of our efforts to communicate the steps we’re taking to provide clear recommendations to sponsors and researchers, so that we can better support innovation. The documents are being issued in draft form so that we can solicit public input on these new policies. As with all draft guidances, all of the comments we receive will be carefully considered prior to finalizing these documents. We’re committed to working with stakeholders to bring novel treatments to the market while ensuring the safety of patients.
Disease-Specific Gene Therapy Guidances
The FDA has issuing three new draft guidance documents on the development of gene therapy products for specific disease categories. These are the first three disease-specific guidances that the agency is issuing for gene therapy products. Our new commitment to develop disease-specific guidance documents reflects the increasing activity in this field, and its growing importance to advancing public health.
Human Gene Therapy for Hemophilia: Gene therapy products for hemophilia are now being developed as single-dose treatments that may enable long-term production of the missing or abnormal coagulation factor in patients. This may reduce or eliminate the need for coagulation factor replacement. To define the proper development pathway for such products, we’re issuing a new draft guidance on gene therapy products that are targeted to the treatment of hemophilia. Once finalized, this new guidance will provide recommendations on the FDA’s current thinking on clinical trial design and preclinical considerations to support the development of these gene therapy products. Among other elements, the draft guidance provides recommendations regarding surrogate endpoints that could be used by sponsors pursuing accelerated approval of gene therapy products that are intended for treatment of hemophilia.
Human Gene Therapy for Retinal Disorders: Another area of fast-paced activity is gene therapy products targeted to the treatment of retinal disorders. The Human Gene Therapy for Retinal Disorders guidance, once finalized, will assist those developing gene therapy products for a wide variety of retinal disorders affecting both adult and pediatric patients. Gene therapy products currently undergoing clinical trials in the United States for retinal disorders are commonly delivered by intravitreal injections (into the fluid portion of the eye), or by subretinal injections (beneath the retina). In some cases, the gene therapy products are encapsulated in a device to be implanted within the eye. This new guidance document will focus on issues that are specific to gene therapies for retinal disorders. The document provides recommendations related to product development, preclinical testing, and clinical trial design for such products.
Human Gene Therapy for Rare Diseases: Rare diseases are those that affect fewer than 200,000 people in the United States. The National Institutes of Health reports that nearly 7,000 rare diseases affect more than 25 million Americans. About 80 percent of rare diseases are caused by a single-gene defect, and about half of all rare diseases affect children. Since most rare diseases have no approved therapies, there is a significant unmet need. The Human Gene Therapy for Rare Diseases guidance, once finalized, will provide recommendations on preclinical, manufacturing and clinical trial design for all phases of the clinical development program for these types of gene therapies. The information is intended to assist sponsors in the design of clinical development programs, where there may be limited study population size, potential feasibility and safety issues, as well as issues relating to the interpretation of effectiveness.
Guidances on Manufacturing Gene Therapies
The FDA is also providing new and comprehensive updates to three existing guidances that address manufacturing issues related to gene therapy. These updates reflect input from many stakeholders. We encourage additional feedback on these documents during the comment period.
The first draft guidance, Chemistry, Manufacturing, and Control (CMC) Information for Human Gene Therapy Investigational New Drug Applications (INDs), provides sponsors with recommendations on how to provide sufficient CMC information to assure safety, identity, quality, purity and strength/potency of investigational gene therapy products. The guidance applies to human gene therapies and to combination products that contain a human gene therapy in combination with a drug or device. In addition, this guidance is organized to follow the structure of the FDA guidance on the Common Technical Document.
The second draft guidance, Testing of Retroviral Vector-Based Gene Therapy Products for Replication Competent Retrovirus (RCR) during Product Manufacture and Patient Follow-up, provides additional recommendations regarding the proper testing for RCR during the manufacture of retroviral vector-based gene therapy products, as well as during the follow-up monitoring of patients who’ve received retroviral vector-based gene therapy products. Specifically, the draft guidance recommends the identification and amount of material to be tested. The guidance also provides advice on general testing methods.
The third draft guidance, Long Term Follow-Up After Administration of Human Gene Therapy Products, provides recommendations regarding the design of long-term follow-up (LTFU) observational studies for the collection of data on delayed adverse events following administration of a gene therapy product. Because of some of the additional uncertainty intrinsic to a novel platform like gene therapy -- including questions related to the durability of the treatment effects as well as the theoretical potential for off-target effects if the genes do not insert correctly -- there’s an increased need for robust long-term follow-up of patients in the post-market period. This guidance describes product characteristics, patient-related factors, and the preclinical and clinical data that should be considered when assessing the need for LTFU observations and describes the features related to effective post-market follow up.
Once finalized, these draft guidances will replace previous guidances issued by the FDA in April 2008 (CMC) and November 2006 (RCR and LTFU).
The field of gene therapy has progressed rapidly since these guidances were first issued. Therefore, the FDA is updating these guidances to provide sponsors with the agency’s most up-to-date thinking.
Our goal is to help promote safe and effective product development in this field. We’ll continue to work with the product sponsors to help make the development and approval of these innovative gene therapies more efficient, while putting in place the regulatory controls needed to ensure that the resulting therapies are both safe and effective. We’ll also make full use of our expedited programs such as breakthrough therapy designation and regenerative medicine advanced therapy designation whenever possible.
Gene therapy represents one of the most promising opportunities for developing highly effective and even curative treatments for many vexing disorders. Some of these products are almost certainly going to change the contours of medical practice, and the destiny of patients with some debilitating diseases.
The FDA’s goal is to help these innovations advance in a framework that assures the safety and effectiveness of these resulting treatments, and continues to build peoples’ confidence in this novel area of medicine.
–Scott Gottlieb, MD
Antibodies to HCV core protein can be expressed in E. coli and silkworms
Intrabody 2H9-L, which can function as a hepatitis C virus (HCV) inhibitor in human hepatic cells, was expressed at high levels in Escherichia coli and silkworm pupae and was successfully purified in soluble form, according to a report published in Protein Expression and Purification by Tatsuya Kato, an assistant professor at Shizuoka (Japan) University, and his colleagues.

In their study, 171 mcg of purified intrabody was obtainable from 100 mL of E. coli culture, and 132 mcg could be obtained from 10 silkworm pupae.
The intrabodies were capable of binding to all HCV core protein variants tested. These purified intrabodies can be used in biochemical analyses and provide a potential pathway to developing a new type of therapy, according to the researchers.
“The structural basis of HCV core–intrabody interfaces would allow a novel strategy to design and generate chemical drugs with antiviral activities,” they stated. In addition, “to analyze the HCV core protein in detail, this intrabody can be used to keep the HCV core protein soluble, even when its concentration is high.”
No funding source or disclosures were reported in the paper.
SOURCE: Kato T et al. Protein Expression and Purification. 2018 October;150:61-6.
Intrabody 2H9-L, which can function as a hepatitis C virus (HCV) inhibitor in human hepatic cells, was expressed at high levels in Escherichia coli and silkworm pupae and was successfully purified in soluble form, according to a report published in Protein Expression and Purification by Tatsuya Kato, an assistant professor at Shizuoka (Japan) University, and his colleagues.
In their study, 171 mcg of purified intrabody was obtainable from 100 mL of E. coli culture, and 132 mcg could be obtained from 10 silkworm pupae.
The intrabodies were capable of binding to all HCV core protein variants tested. These purified intrabodies can be used in biochemical analyses and provide a potential pathway to developing a new type of therapy, according to the researchers.
“The structural basis of HCV core–intrabody interfaces would allow a novel strategy to design and generate chemical drugs with antiviral activities,” they stated. In addition, “to analyze the HCV core protein in detail, this intrabody can be used to keep the HCV core protein soluble, even when its concentration is high.”
No funding source or disclosures were reported in the paper.
SOURCE: Kato T et al. Protein Expression and Purification. 2018 October;150:61-6.
FROM PROTEIN EXPRESSION AND PURIFICATION

Antegrade Femoral Nail Distal Interlocking Screw Causing Rupture of the Medial Patellofemoral Ligament and Patellar Instability
ABSTRACT
Antegrade reamed intramedullary nailing has the advantages of high fracture union and early weight-bearing, making it the gold standard for fixation of diaphyseal femur fractures. However, knowledge of distal femoral anatomy may mitigate the risk of secondary complications.
We present a previously unrecognized complication of antegrade femoral nailing in which a 23-year-old man sustained iatrogenic rupture of the medial patellofemoral ligament (MPFL) caused by the distal interlocking screw of the femoral nail. The patient had a history of antegrade intramedullary nailing that was revised for rotational malalignment, after which he began experiencing recurrent episodes of atraumatic bloody joint effusion and swelling of the right knee with associated patellar instability. Plain radiographs and magnetic resonance imaging revealed a large effusion with a prominent intra-articular distal interlocking screw disrupting the MPFL. The patient underwent a right knee arthroscopic-assisted MPFL reconstruction and removal of the distal interlocking screw. Following surgery, the patient experienced resolution of his effusions, no recurrent patellar instability, and was able to return to his activities.
This case demonstrates that iatrogenic MPFL injury is a potential complication of antegrade femoral nailing and a previously unrecognized cause of patellar instability. Surgeons should be aware of this potential complication and strive to avoid the MPFL origin when placing their distal interlocking screw.
Continue to: Reamed intramedullary nails...
Reamed intramedullary nails are the gold standard for fixation of femoral diaphyseal fractures.1 Antegrade or retrograde nails are effective options, with the choice of technique based on factors including surgeon preference, patient factors, and concomitant injuries.2 Interlocking screws are generally placed to allow control of both rotation and length.1 Advantages of intramedullary treatment of femoral diaphyseal fractures compared with plate fixation include low rates of infection, lower nonunion rate, and faster patient mobilization and weight-bearing.3
Complications of antegrade intramedullary fixation of femoral shaft fractures include infection, nonunion, malunion, anterior cortical perforation, heterotopic ossification, abductor weakness, and soft tissue irritation from interlocking screws.2-4 Femoral intramedullary nails are not routinely removed because the hardware is rarely symptomatic and removing the nail involves additional surgical morbidity with the potential for complications.5 Interlocking screws are removed in select cases due to soft tissue irritation, generally after fracture union. Although hardware removal may help in select cases, removal of intramedullary nails is associated with low rates of symptom resolution.6-8
We present a case of iatrogenic medial patellofemoral ligament (MPFL) disruption by the distal interlocking screw leading to patellar instability, a previously unrecognized complication of antegrade femoral nailing for femoral diaphyseal fractures. The patient provided written informed consent for print and electronic publication of this case report.
CASE REPORT
We present a case of a 23-year-old man whose status was 2 years post antegrade reamed femoral intramedullary nailing at an outside institution for a right diaphyseal femur fracture. This issue was revised for external rotational malalignment, and he presented with right anterior knee pain, recurrent patellar subluxation, and recurrent effusions. The extent of external rotational malalignment and subsequent rotational correction were not evident from the available outside institution records. These symptoms began after his femoral nail revision for malalignment, and he had no subsequent trauma. The femoral fracture healed uneventfully. The patient denied any history of knee pain, swelling, or patellar instability before his femoral nail revision for malalignment. These episodes of effusion, instability, and pain occurred several times per year, generally with activities of daily living (ADL). On one occasion, he presented to a local emergency room where knee aspiration revealed no evidence of crystals or infection. The patient was referred to the senior author (Dr. Nho) for consultation.
Physical examination revealed right knee full extension with flexion to 80°. A moderate right knee effusion was present. The patient was tender over the medial femoral epicondyle and the superomedial aspect of the patella without joint line tenderness. Lateral patellar instability was present with 2 quadrants of translation (compared with 1 on the contralateral side) and patellar apprehension. The patient’s knee was ligamentously stable, and meniscal signs were absent. His lower extremity rotational profile was symmetric to the contralateral uninjured side.
Right femur and knee X-rays showed an antegrade intramedullary nail with a well-healed diaphyseal fracture and a single distal interlocking screw oriented from posterolateral to anteromedial (Figures 1A-1G). The screw tip was prominent on sunrise X-ray view anterior to the medial femoral epicondyle (Figure 1C). Magnetic resonance imaging demonstrated a large effusion and lateral patellar subluxation with a prominent intra-articular distal interlocking screw disrupting the MPFL near the femoral attachment (Figure 2). Patellar height, trochlear morphology, and tibial tubercle-trochlear groove distance were assessed and found to be normal.
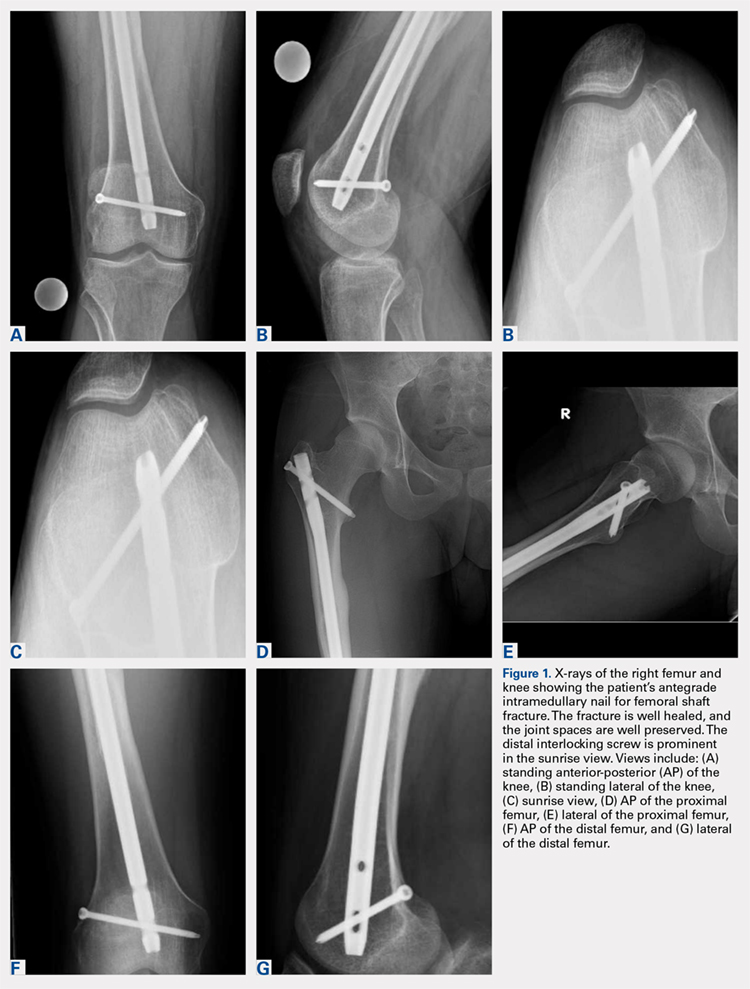

Continue to: The patient elected...
The patient elected to have a right knee arthroscopic-assisted MPFL reconstruction and removal of the distal interlocking screw. Diagnostic arthroscopy revealed the distal interlocking screw to be intra-articular medially, prominent by 3 mm causing attritional disruption of the mid-substance MPFL (Figure 3A). The patella was noted to be subluxated and tracking laterally (Figure 3B). Both the anterior cruciate ligament and posterior cruciate ligament were intact, and menisci and articular cartilage were normal. The distal interlocking screw was removed under fluoroscopic guidance through a small lateral incision (Figure 3C).
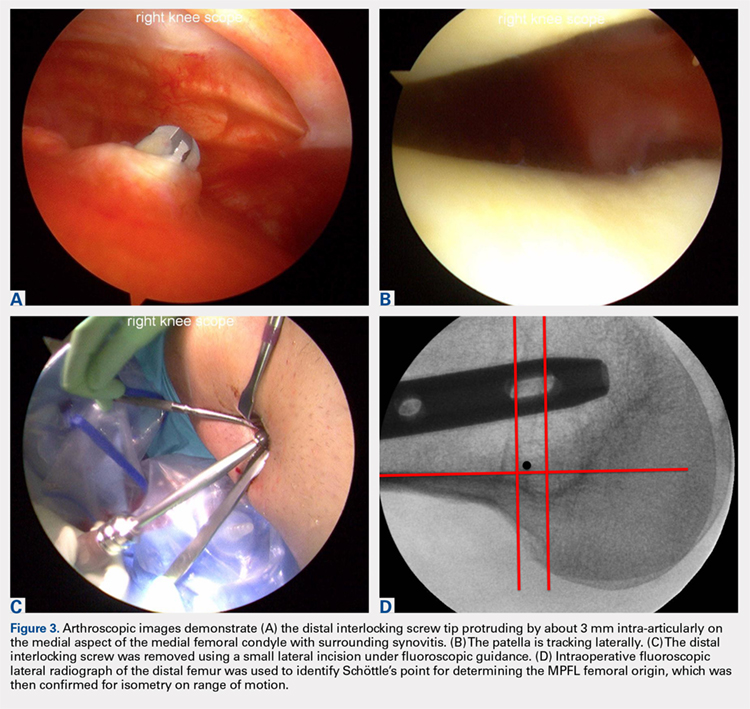
Due to the nature of the longstanding attritional disruption of the MPFL in this case with associated patellar instability over a 2-year period, the decision was made to proceed with formal MPFL reconstruction as opposed to repair. A 2-cm incision was made at the medial aspect of the patella. The proximal half of the patella was decorticated. Guide pins were placed within the proximal half of the patella, ensuring at least a 1-cm bone bridge between them, and two 4.75-mm SwiveLock suture anchors (Arthrex) were inserted. A semitendinosus graft was used for MPFL reconstruction with the 2 ends of the graft secured to 2 suture anchors with a whipstitch. Lateral fluoroscopy was used to identify Schöttle’s point, denoting the femoral origin of the MPFL9 (Figure 3D). A 2-cm incision was made at this location. A guide pin was then placed at Schöttle’s point under fluoroscopic guidance, aimed proximally, and the knee was brought through a range of motion (ROM), to verify graft isometry. Once verified, the guide pin was over-reamed to 8 mm. The layer between the retinaculum and the capsule was carefully dissected, and the graft was passed extra-articularly in the plane between the retinaculum and the capsule, out through the medial incision, and docked into the bone tunnel. An 8-mm BioComposite interference screw (Arthrex) was then placed with the knee flexed to 30°. The knee was then passed through a ROM and an arthroscopic evaluation confirmed that the patella was no longer subluxated laterally. There was normal tracking of the patellofemoral joint on arthroscopic evaluation.
Postoperatively, the patient was maintained in a hinged knee brace for 6 weeks. He was weight-bearing as tolerated when locked in full extension beginning immediately postoperatively, and allowed to unlock the brace to start non-weight-bearing active flexion and extension with therapy on postoperative day 1. Radiographs confirmed removal of the distal interlocking screw (Figures 4A, 4B). Following surgery, the patient experienced resolution of his effusions, no recurrent patellar instability at 1-year postoperative, and was able to return to his ADL and recreational sporting activities (Knee Injury and Osteoarthritis Outcome Score [KOOS] ADL, 100; KOOS sporting and recreational activities, 95; quality of life, 100; Marx Activity Rating Scale, 12).
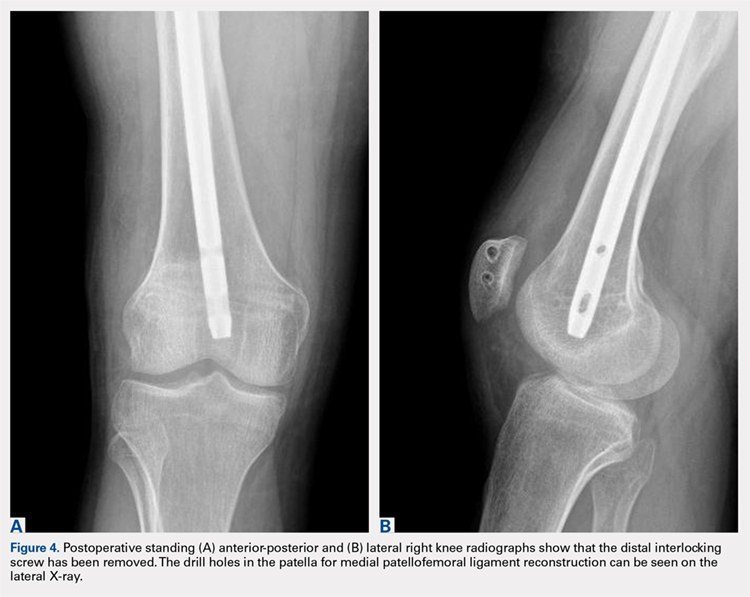
DISCUSSION
The MPFL connects the superomedial edge of the patella to the medial femur and is injured in nearly 100% of patellar dislocations.6 The femoral origin lies between the adductor tubercle and the medial epicondyle.7 The MPFL prevents lateral subluxation of the patella and acts as the major restraint during the first 20° of knee flexion. Although radiographic parameters for identifying the MPFL femoral origin have been defined by both Schöttle and colleagues9 and Stephen and colleagues10, it is important to check the isometry intraoperatively through a ROM when performing MPFL reconstruction. In this case, the patient’s history and physical examination showed patellar instability, which was determined to be iatrogenically related to the distal interlocking screw rupture of the MPFL. Following screw removal and MPFL reconstruction, the patient had no further symptoms of pain, effusion, or patellar instability and returned to his normal activities.
Femoral malrotation following intramedullary nailing of femoral shaft fractures is a common complication,4 with a 22% incidence of malrotation of at least 15° in 1 series from an academic trauma center.11 There are mixed data as to whether malrotation is more common in complex fracture patterns, in cases performed during night hours, and in cases performed by non-trauma fellowship-trained surgeons.11-13 The natural history of malrotation is not well elucidated, but there is some suggestion that it alters load bearing in the distal joints of the involved leg including the patellofemoral joint. Patients also may not tolerate malrotation due to the abnormal foot progression angle, particularly with malrotation >15°.4 In this case, the patient’s initial femoral nail was placed in an externally rotated position, requiring revision. The result of this was an unusual trajectory of the distal interlocking screw from posterolateral to anteromedial. Combined with the prominent screw tip, the trajectory of this distal interlocking screw likely contributed to the injury to the MPFL observed in this case. This trajectory would also pose potential risk to the common peroneal nerve, which is usually situated posterior to the insertion point for distal femoral interlocking screws. The prominent distal interlock screw is a well-recognized problem with femoral intramedullary nails. This issue results from the tapering of the width of the distal femur from being larger posteriorly to being smaller anteriorly. To avoid placement of a prominent distal interlocking screw, surgeons often will obtain an intraoperative anterior-posterior radiograph with the lower extremity in 30° of internal rotation to account for the angle of the medial aspect of the distal femur.
This practice represents, to our knowledge, a previously unreported cause of patellar instability as well as an unreported complication of antegrade femoral intramedullary nailing. Surgeons treating these conditions should consider this potential complication and pursue advanced imaging if patients present with these complaints after femoral intramedullary nail placement. Knowledge of both MPFL origin and insertional anatomy and avoidance of prominent distal interlocking screws in the region of the MPFL, if possible, would likely prevent this complication.
Limitations of this study include the case report design, which makes it impossible to comment on the incidence of this complication or to make comparisons regarding treatment options. There is, of course, the possibility that the patient had a concurrent MPFL injury from the injury in which he sustained the femur fracture. Nevertheless, the clinical history, examination, imaging, and arthroscopic findings all strongly suggest that the prominent distal interlocking screw was the cause of his MPFL injury and patellar instability. Finally, the point widely defined by Schöttle and colleagues12 was used for MPFL reconstruction in this case based on an intraoperative true lateral radiograph of the distal femur. It should be noted that recent literature has debated the accuracy of this method for determining the femoral origin, the anatomy of the MPFL in relation to the quadriceps, and type of fixation for MPFL reconstruction with some advocating soft tissue only fixation.14-17 For purposes of this case report, we focused on a different cause of MPFL disruption in this patient and our technique for MPFL reconstruction.
CONCLUSION
This case demonstrates that iatrogenic MPFL injury is a potential complication of antegrade femoral nailing and a previously unrecognized cause of patellar instability. Surgeons should be aware of this potential complication and strive to avoid the MPFL origin when placing their distal interlocking screw.
This paper will be judged for the Resident Writer’s Award.
- Brumback RJ, Virkus WW. Intramedullary nailing of the femur: reamed versus nonreamed. J Am Acad Orthop Surg. 2000;8(2):83-90.
- Ricci WM, Bellabarba C, Evanoff B, Herscovici D, DiPasquale T, Sanders R. Retrograde versus antegrade nailing of femoral shaft fractures. J Orthop Trauma 2001;15(3):161-169.
- Ricci WM, Gallagher B, Haidukewych GJ. Intramedullary nailing of femoral shaft fractures: current concepts. J Am Acad Orthop Surg. 2009;17(5):296-305.
- Lindsey JD, Krieg JC. Femoral malrotation following intramedullary nail fixation. J Am Acad Orthop Surg. 2011;19(1):17-26.
- Busam ML, Esther RJ, Obremskey WT. Hardware removal: indications and expectations. J Am Acad Orthop Surg. 2006;14(2):113-120.
- Morshed S, Humphrey M, Corrales LA, Millett M, Hoffinger SA. Retention of flexible intramedullary nails following treatment of pediatric femur fractures. Arch Orthop Trauma Surg. 2007;127(7):509-514.
- Boerger TO, Patel G, Murphy JP. Is routine removal of intramedullary nails justified. Injury. 1999;30(2):79-81.
- Kellan J. Fracture healing: Does hardware removal enhance patient outcomes. Chin J Orthop Trauma (Chin). 2010;12:374-378.
- Schöttle PB, Schmeling A, Rosenstiel N, Weiler A. Radiographic landmarks for femoral tunnel placement in medial patellofemoral ligament reconstruction. Am J Sports Med. 2007;35(5):801-804. doi:10.1177/0363546506296415.
- Stephen JM, Lumpaopong P, Deehan DJ, Kader D, Amis AA. The medial patellofemoral ligament: location of femoral attachment and length change patterns resulting from anatomic and nonanatomic attachments. Am J Sports Med. 2012;40(8):1871-1879. doi:10.1177/0363546512449998.
- Hüfner T, Citak M, Suero EM, et al. Femoral malrotation after unreamed intramedullary nailing: an evaluation of influencing operative factors. J Orthop Trauma. 2011;25(4):224-227. doi:10.1097/BOT.0b013e3181e47e3b.
- Ayalon OB, Patel NM, Yoon RS, Donegan DJ, Koerner JD, Liporace FA. Comparing femoral version after intramedullary nailing performed by trauma-trained and non-trauma trained surgeons: is there a difference? Injury. 2014;45(7):1091-1094. doi:10.1016/j.injury.2014.01.024.
- Patel NM, Yoon RS, Cantlon MB, Koerner JD, Donegan DJ, Liporace FA. Intramedullary nailing of diaphyseal femur fractures secondary to gunshot wounds: predictors of postoperative malrotation. J Orthop Trauma. 2014;28(12):711-714. doi:10.1097/BOT.0000000000000124.
- Ziegler CG, Fulkerson JP, Edgar C. Radiographic reference points are inaccurate with and without a true lateral radiograph: the importance of anatomy in medial patellofemoral ligament reconstruction. Am J Sports Med. 2016;44(1):133-142.
- Fulkerson JP, Edgar C. Medial quadriceps tendon-femoral ligament: surgical anatomy and reconstruction technique to prevent patella instability. Arthrosc Tech. 2013;2(2):e125-e128. doi:10.1016/j.eats.2013.01.002.
- Tanaka MJ, Voss A, Fulkerson JP. The anatomic midpoint of the attachment of the medial patellofemoral complex. J Bone Joint Surg Am. 2016;98(14):1199-1205. doi:10.2106/JBJS.15.01182.
- Mochizuki T, Nimura A, Tateishi T, Yamaguchi K, Muneta T, Akita K. Anatomic study of the attachment of the medial patellofemoral ligament and its characteristic relationships to the vastus intermedius. Knee Surg Sports Traumatol Arthrosc. 2013;21(2):305-310. doi:10.1007/s00167-012-1993-7.
ABSTRACT
Antegrade reamed intramedullary nailing has the advantages of high fracture union and early weight-bearing, making it the gold standard for fixation of diaphyseal femur fractures. However, knowledge of distal femoral anatomy may mitigate the risk of secondary complications.
We present a previously unrecognized complication of antegrade femoral nailing in which a 23-year-old man sustained iatrogenic rupture of the medial patellofemoral ligament (MPFL) caused by the distal interlocking screw of the femoral nail. The patient had a history of antegrade intramedullary nailing that was revised for rotational malalignment, after which he began experiencing recurrent episodes of atraumatic bloody joint effusion and swelling of the right knee with associated patellar instability. Plain radiographs and magnetic resonance imaging revealed a large effusion with a prominent intra-articular distal interlocking screw disrupting the MPFL. The patient underwent a right knee arthroscopic-assisted MPFL reconstruction and removal of the distal interlocking screw. Following surgery, the patient experienced resolution of his effusions, no recurrent patellar instability, and was able to return to his activities.
This case demonstrates that iatrogenic MPFL injury is a potential complication of antegrade femoral nailing and a previously unrecognized cause of patellar instability. Surgeons should be aware of this potential complication and strive to avoid the MPFL origin when placing their distal interlocking screw.
Continue to: Reamed intramedullary nails...
Reamed intramedullary nails are the gold standard for fixation of femoral diaphyseal fractures.1 Antegrade or retrograde nails are effective options, with the choice of technique based on factors including surgeon preference, patient factors, and concomitant injuries.2 Interlocking screws are generally placed to allow control of both rotation and length.1 Advantages of intramedullary treatment of femoral diaphyseal fractures compared with plate fixation include low rates of infection, lower nonunion rate, and faster patient mobilization and weight-bearing.3
Complications of antegrade intramedullary fixation of femoral shaft fractures include infection, nonunion, malunion, anterior cortical perforation, heterotopic ossification, abductor weakness, and soft tissue irritation from interlocking screws.2-4 Femoral intramedullary nails are not routinely removed because the hardware is rarely symptomatic and removing the nail involves additional surgical morbidity with the potential for complications.5 Interlocking screws are removed in select cases due to soft tissue irritation, generally after fracture union. Although hardware removal may help in select cases, removal of intramedullary nails is associated with low rates of symptom resolution.6-8
We present a case of iatrogenic medial patellofemoral ligament (MPFL) disruption by the distal interlocking screw leading to patellar instability, a previously unrecognized complication of antegrade femoral nailing for femoral diaphyseal fractures. The patient provided written informed consent for print and electronic publication of this case report.
CASE REPORT
We present a case of a 23-year-old man whose status was 2 years post antegrade reamed femoral intramedullary nailing at an outside institution for a right diaphyseal femur fracture. This issue was revised for external rotational malalignment, and he presented with right anterior knee pain, recurrent patellar subluxation, and recurrent effusions. The extent of external rotational malalignment and subsequent rotational correction were not evident from the available outside institution records. These symptoms began after his femoral nail revision for malalignment, and he had no subsequent trauma. The femoral fracture healed uneventfully. The patient denied any history of knee pain, swelling, or patellar instability before his femoral nail revision for malalignment. These episodes of effusion, instability, and pain occurred several times per year, generally with activities of daily living (ADL). On one occasion, he presented to a local emergency room where knee aspiration revealed no evidence of crystals or infection. The patient was referred to the senior author (Dr. Nho) for consultation.
Physical examination revealed right knee full extension with flexion to 80°. A moderate right knee effusion was present. The patient was tender over the medial femoral epicondyle and the superomedial aspect of the patella without joint line tenderness. Lateral patellar instability was present with 2 quadrants of translation (compared with 1 on the contralateral side) and patellar apprehension. The patient’s knee was ligamentously stable, and meniscal signs were absent. His lower extremity rotational profile was symmetric to the contralateral uninjured side.
Right femur and knee X-rays showed an antegrade intramedullary nail with a well-healed diaphyseal fracture and a single distal interlocking screw oriented from posterolateral to anteromedial (Figures 1A-1G). The screw tip was prominent on sunrise X-ray view anterior to the medial femoral epicondyle (Figure 1C). Magnetic resonance imaging demonstrated a large effusion and lateral patellar subluxation with a prominent intra-articular distal interlocking screw disrupting the MPFL near the femoral attachment (Figure 2). Patellar height, trochlear morphology, and tibial tubercle-trochlear groove distance were assessed and found to be normal.
Continue to: The patient elected...
The patient elected to have a right knee arthroscopic-assisted MPFL reconstruction and removal of the distal interlocking screw. Diagnostic arthroscopy revealed the distal interlocking screw to be intra-articular medially, prominent by 3 mm causing attritional disruption of the mid-substance MPFL (Figure 3A). The patella was noted to be subluxated and tracking laterally (Figure 3B). Both the anterior cruciate ligament and posterior cruciate ligament were intact, and menisci and articular cartilage were normal. The distal interlocking screw was removed under fluoroscopic guidance through a small lateral incision (Figure 3C).
Due to the nature of the longstanding attritional disruption of the MPFL in this case with associated patellar instability over a 2-year period, the decision was made to proceed with formal MPFL reconstruction as opposed to repair. A 2-cm incision was made at the medial aspect of the patella. The proximal half of the patella was decorticated. Guide pins were placed within the proximal half of the patella, ensuring at least a 1-cm bone bridge between them, and two 4.75-mm SwiveLock suture anchors (Arthrex) were inserted. A semitendinosus graft was used for MPFL reconstruction with the 2 ends of the graft secured to 2 suture anchors with a whipstitch. Lateral fluoroscopy was used to identify Schöttle’s point, denoting the femoral origin of the MPFL9 (Figure 3D). A 2-cm incision was made at this location. A guide pin was then placed at Schöttle’s point under fluoroscopic guidance, aimed proximally, and the knee was brought through a range of motion (ROM), to verify graft isometry. Once verified, the guide pin was over-reamed to 8 mm. The layer between the retinaculum and the capsule was carefully dissected, and the graft was passed extra-articularly in the plane between the retinaculum and the capsule, out through the medial incision, and docked into the bone tunnel. An 8-mm BioComposite interference screw (Arthrex) was then placed with the knee flexed to 30°. The knee was then passed through a ROM and an arthroscopic evaluation confirmed that the patella was no longer subluxated laterally. There was normal tracking of the patellofemoral joint on arthroscopic evaluation.
Postoperatively, the patient was maintained in a hinged knee brace for 6 weeks. He was weight-bearing as tolerated when locked in full extension beginning immediately postoperatively, and allowed to unlock the brace to start non-weight-bearing active flexion and extension with therapy on postoperative day 1. Radiographs confirmed removal of the distal interlocking screw (Figures 4A, 4B). Following surgery, the patient experienced resolution of his effusions, no recurrent patellar instability at 1-year postoperative, and was able to return to his ADL and recreational sporting activities (Knee Injury and Osteoarthritis Outcome Score [KOOS] ADL, 100; KOOS sporting and recreational activities, 95; quality of life, 100; Marx Activity Rating Scale, 12).
DISCUSSION
The MPFL connects the superomedial edge of the patella to the medial femur and is injured in nearly 100% of patellar dislocations.6 The femoral origin lies between the adductor tubercle and the medial epicondyle.7 The MPFL prevents lateral subluxation of the patella and acts as the major restraint during the first 20° of knee flexion. Although radiographic parameters for identifying the MPFL femoral origin have been defined by both Schöttle and colleagues9 and Stephen and colleagues10, it is important to check the isometry intraoperatively through a ROM when performing MPFL reconstruction. In this case, the patient’s history and physical examination showed patellar instability, which was determined to be iatrogenically related to the distal interlocking screw rupture of the MPFL. Following screw removal and MPFL reconstruction, the patient had no further symptoms of pain, effusion, or patellar instability and returned to his normal activities.
Femoral malrotation following intramedullary nailing of femoral shaft fractures is a common complication,4 with a 22% incidence of malrotation of at least 15° in 1 series from an academic trauma center.11 There are mixed data as to whether malrotation is more common in complex fracture patterns, in cases performed during night hours, and in cases performed by non-trauma fellowship-trained surgeons.11-13 The natural history of malrotation is not well elucidated, but there is some suggestion that it alters load bearing in the distal joints of the involved leg including the patellofemoral joint. Patients also may not tolerate malrotation due to the abnormal foot progression angle, particularly with malrotation >15°.4 In this case, the patient’s initial femoral nail was placed in an externally rotated position, requiring revision. The result of this was an unusual trajectory of the distal interlocking screw from posterolateral to anteromedial. Combined with the prominent screw tip, the trajectory of this distal interlocking screw likely contributed to the injury to the MPFL observed in this case. This trajectory would also pose potential risk to the common peroneal nerve, which is usually situated posterior to the insertion point for distal femoral interlocking screws. The prominent distal interlock screw is a well-recognized problem with femoral intramedullary nails. This issue results from the tapering of the width of the distal femur from being larger posteriorly to being smaller anteriorly. To avoid placement of a prominent distal interlocking screw, surgeons often will obtain an intraoperative anterior-posterior radiograph with the lower extremity in 30° of internal rotation to account for the angle of the medial aspect of the distal femur.
This practice represents, to our knowledge, a previously unreported cause of patellar instability as well as an unreported complication of antegrade femoral intramedullary nailing. Surgeons treating these conditions should consider this potential complication and pursue advanced imaging if patients present with these complaints after femoral intramedullary nail placement. Knowledge of both MPFL origin and insertional anatomy and avoidance of prominent distal interlocking screws in the region of the MPFL, if possible, would likely prevent this complication.
Limitations of this study include the case report design, which makes it impossible to comment on the incidence of this complication or to make comparisons regarding treatment options. There is, of course, the possibility that the patient had a concurrent MPFL injury from the injury in which he sustained the femur fracture. Nevertheless, the clinical history, examination, imaging, and arthroscopic findings all strongly suggest that the prominent distal interlocking screw was the cause of his MPFL injury and patellar instability. Finally, the point widely defined by Schöttle and colleagues12 was used for MPFL reconstruction in this case based on an intraoperative true lateral radiograph of the distal femur. It should be noted that recent literature has debated the accuracy of this method for determining the femoral origin, the anatomy of the MPFL in relation to the quadriceps, and type of fixation for MPFL reconstruction with some advocating soft tissue only fixation.14-17 For purposes of this case report, we focused on a different cause of MPFL disruption in this patient and our technique for MPFL reconstruction.
CONCLUSION
This case demonstrates that iatrogenic MPFL injury is a potential complication of antegrade femoral nailing and a previously unrecognized cause of patellar instability. Surgeons should be aware of this potential complication and strive to avoid the MPFL origin when placing their distal interlocking screw.
This paper will be judged for the Resident Writer’s Award.
- Brumback RJ, Virkus WW. Intramedullary nailing of the femur: reamed versus nonreamed. J Am Acad Orthop Surg. 2000;8(2):83-90.
- Ricci WM, Bellabarba C, Evanoff B, Herscovici D, DiPasquale T, Sanders R. Retrograde versus antegrade nailing of femoral shaft fractures. J Orthop Trauma 2001;15(3):161-169.
- Ricci WM, Gallagher B, Haidukewych GJ. Intramedullary nailing of femoral shaft fractures: current concepts. J Am Acad Orthop Surg. 2009;17(5):296-305.
- Lindsey JD, Krieg JC. Femoral malrotation following intramedullary nail fixation. J Am Acad Orthop Surg. 2011;19(1):17-26.
- Busam ML, Esther RJ, Obremskey WT. Hardware removal: indications and expectations. J Am Acad Orthop Surg. 2006;14(2):113-120.
- Morshed S, Humphrey M, Corrales LA, Millett M, Hoffinger SA. Retention of flexible intramedullary nails following treatment of pediatric femur fractures. Arch Orthop Trauma Surg. 2007;127(7):509-514.
- Boerger TO, Patel G, Murphy JP. Is routine removal of intramedullary nails justified. Injury. 1999;30(2):79-81.
- Kellan J. Fracture healing: Does hardware removal enhance patient outcomes. Chin J Orthop Trauma (Chin). 2010;12:374-378.
- Schöttle PB, Schmeling A, Rosenstiel N, Weiler A. Radiographic landmarks for femoral tunnel placement in medial patellofemoral ligament reconstruction. Am J Sports Med. 2007;35(5):801-804. doi:10.1177/0363546506296415.
- Stephen JM, Lumpaopong P, Deehan DJ, Kader D, Amis AA. The medial patellofemoral ligament: location of femoral attachment and length change patterns resulting from anatomic and nonanatomic attachments. Am J Sports Med. 2012;40(8):1871-1879. doi:10.1177/0363546512449998.
- Hüfner T, Citak M, Suero EM, et al. Femoral malrotation after unreamed intramedullary nailing: an evaluation of influencing operative factors. J Orthop Trauma. 2011;25(4):224-227. doi:10.1097/BOT.0b013e3181e47e3b.
- Ayalon OB, Patel NM, Yoon RS, Donegan DJ, Koerner JD, Liporace FA. Comparing femoral version after intramedullary nailing performed by trauma-trained and non-trauma trained surgeons: is there a difference? Injury. 2014;45(7):1091-1094. doi:10.1016/j.injury.2014.01.024.
- Patel NM, Yoon RS, Cantlon MB, Koerner JD, Donegan DJ, Liporace FA. Intramedullary nailing of diaphyseal femur fractures secondary to gunshot wounds: predictors of postoperative malrotation. J Orthop Trauma. 2014;28(12):711-714. doi:10.1097/BOT.0000000000000124.
- Ziegler CG, Fulkerson JP, Edgar C. Radiographic reference points are inaccurate with and without a true lateral radiograph: the importance of anatomy in medial patellofemoral ligament reconstruction. Am J Sports Med. 2016;44(1):133-142.
- Fulkerson JP, Edgar C. Medial quadriceps tendon-femoral ligament: surgical anatomy and reconstruction technique to prevent patella instability. Arthrosc Tech. 2013;2(2):e125-e128. doi:10.1016/j.eats.2013.01.002.
- Tanaka MJ, Voss A, Fulkerson JP. The anatomic midpoint of the attachment of the medial patellofemoral complex. J Bone Joint Surg Am. 2016;98(14):1199-1205. doi:10.2106/JBJS.15.01182.
- Mochizuki T, Nimura A, Tateishi T, Yamaguchi K, Muneta T, Akita K. Anatomic study of the attachment of the medial patellofemoral ligament and its characteristic relationships to the vastus intermedius. Knee Surg Sports Traumatol Arthrosc. 2013;21(2):305-310. doi:10.1007/s00167-012-1993-7.
TAKE-HOME POINTS
- Anterograde intramedullary nailing is the gold standard for fixation of diaphyseal femur fractures.
- Damage to the MPFL can be caused by the distal interlocking screw of an anterograde intramedullary nail.
- The trajectory of the distal interlocking screw from posterolateral to anteromedial, and a prominent screw tip, likely contributed to the injury to the MPFL observed in this case.
- Surgeons treating these conditions should pursue advanced imaging if patients present with effusion and patellar instability after femoral intramedullary nail placement.
- Distal interlocking screw removal and arthroscopic MPFL reconstruction can result in successful return of function and normal activities.
Facial and Orbital Asymmetry in Oculofacial Surgery Patients
Facial symmetry plays a role in attractiveness, but a small degree of asymmetry is normal and more common than symmetry. Mild asymmetry has been noted in the general population, even in the absence of pathology such as trauma or craniosynostosis.1,2 Asymmetry may be static or dynamic and is thought to arise from a multitude of developmental factors, including skeletal, neurologic, and soft tissue changes, as well as photoaging.3-5 Cosmetic and reconstructive surgical procedures strive to achieve facial symmetry. Patients often are unaware of their preexisting facial asymmetry.6 Anecdotally, we have found patients tend to be more cognizant of preexisting facial asymmetry following a notable change in facial appearance (eg, surgery). In counseling patients who are considering reconstructive or cosmetic surgery, it is beneficial to identify any preexisting facial asymmetries and discuss if they are within normal limits. The current literature, however, lacks thresholds for what is considered normal in many cases. In this study, we reviewed 100 faces without unilateral or orbital pathology or diplopia to describe the occurrence of facial asymmetries, including larger hemiface and hemiface with greater excursion of motion upon smiling (interpreted to signify stronger seventh cranial nerve), hemiface with more rhytides at rest, higher globe, higher earlobe, and higher lip.
Methods
One hundred oculofacial surgery patients without unilateral or orbital pathology or diplopia were included in this retrospective evaluation of static and dynamic facial asymmetry via facial photography (100 participants). Three graders were provided standard frontal and frontal smiling photographs with overlying facial grids to aid in assessing larger hemiface and hemiface with stronger seventh cranial nerve, which was judged in smiling photographs by assessing the excursion and the vector of motion; more rhytides at rest; higher globe; higher earlobe; and higher lip. Difference in globe height was measured relative to interpupillary distance (IPD) and recorded as the ratio of difference in globe height to IPD. The data were analyzed to see if there were any correlations among the 6 variables. This study was approved by the Duke University Health System (Durham, North Carolina) institutional review board.
Results
One hundred photographs were analyzed including 82 women aged 42 to 85 years and 18 men aged 22 to 88 years (overall average age, 61.64 years). The average difference in globe height was 1.2% of IPD; the maximum was 4.4% of IPD. The difference in globe height was verified by 3 graders via 2 different methods. Fifty-four patients were found to have a larger right hemiface, 36 had a larger left hemiface, and 10 had symmetrically sized hemifaces. Nearly half of patients were judged to have greater seventh cranial nerve action on the left (n=47), approximately one-quarter had greater action on the right (n=28), and another quarter were judged to have equal action (n=25). Most patients had static facial asymmetry; 72 had rhytides more pronounced on one hemiface compared to the other, 79 with a difference in globe height, and 68 with a difference in lip height. In approximately 40% of photographs, the graders were unable to judge earlobe height difference; therefore, this data was not analyzed. There was no correlation among the 6 variables.
Discussion
Facial asymmetry has long been a topic of interest in the plastic and reconstructive surgery fields. Ercan et al7 used statistical shape analysis to study facial asymmetry in young healthy subjects and found the left hemiface to be larger than the right hemiface in both sexes. Smith4 evaluated facial asymmetry in healthy college students and found the left hemiface to be larger in males and the right hemiface to be larger in females. Our group was predominantly female, but we found the right hemiface to be larger in both females and males, similar to the findings of Lepich et al.8
We also found that most patients had static and dynamic facial asymmetry despite no known unilateral pathology. The present literature lacks normative values to help determine what degree of asymmetry should be considered pathologic. Vertical orbital dystopia is defined as an inequality in the horizontal levels of the whole orbits.9 It has been hypothesized that most vertical dystopia is caused by congenital malformations, but no threshold has been set for the difference in height that qualifies as dystopia.10 Regarding the difference we found in globe height relative to IPD, if one takes the mean IPD of 63.36 mm (based on a study of 3976 American adults aged 17–51 years)11 and makes the assumption that our patients have this IPD, then one can extrapolate that on average there was a difference of 0.76 mm between the 2 globe heights. Likewise, nearly all patients (n=96) had less than a 2-mm difference (21 had symmetric globe heights, 46 had a difference in globe height of <1 mm, and 29 had a difference of >1 mm and <2 mm). Four patients had a difference greater than 2 mm, with the largest difference being 2.75 mm. A limitation of this retrospective study is the need to extrapolate these distances, as our patients were not photographed with rulers.
Hafezi et al12 looked at the facial asymmetry in patients without history of trauma or nasal fracture who were seeking rhinoplasty. They noted vertical orbital dystopia in this patient population, but the degree of dystopia was not quantified.12 We believe our data highlight the importance of counseling patients about preexisting facial asymmetry with normative values in mind. Patients may be dissatisfied by new or preexisting asymmetry following surgery, even if such asymmetries are less objectively apparent than in the patient’s preoperative appearance. Even when patients are already acutely aware of their facial asymmetries, they should learn that facial asymmetries, to varying degrees, are natural and not necessarily unattractive. In fact, a 2006
- Wang TT, Wessels L, Hussain G, et al. Discriminative thresholds in facial asymmetry: a review of the literature. Aesthet Surg J. 2017;37:375-385.
- Zaidel DW, Cohen JA. The face, beauty, and symmetry: perceiving asymmetry in beautiful faces. Int J Neurosci. 2005;115:1165-1173.
- Rossi M, Ribeiro E, Smith R. Craniofacial asymmetry in development: an anatomical study. Angle Orthod. 2003;73:381-385.
- Smith WM. Hemispheric and facial asymmetry: gender differences. Laterality. 2000;5:251-258.
- Gordon JR, Brieva JC. Images in clinical medicine. unilateral dermatoheliosis. N Engl J Med. 2012;366:e25.
- Macdonald KI, Mendez AI, Hart RD, et al. Eyelid and brow asymmetry in patients evaluated for upper lid blepharoplasty. J Otolaryngol Head Neck Surg. 2014;43:36.
- Ercan I, Ozdemir ST, Etoz A, et al. Facial asymmetry in young healthy subjects evaluated by statistical shape analysis. J Anat. 2008;213:663-669.
- Lepich T, Dabek J, Witkowska M, et al. Female and male orbit asymmetry: digital analysis. Adv Clin Exp Med. 2017;26:69-76.
- Tan ST, Ashworth G, Czypionka S, et al. Vertical orbital dystopia. Plast Reconstr Surg. 1996;97:1349-1361.
- De Ponte FS, Fadda T, Rinna C, et al. Early and late surgical treatment of orbital dystopia in craniofacial malformation. J Craniofac Surg. 1997;8:17-22.
- Dodgson NA. Variation and extrema of human interpupillary distance. Proc Int Soc Opt Eng. 2004;5291:36-46.
- Hafezi F, Naghibzadeh B, Nouhi A, et al. Asymmetric facial growth and deviated nose: a new concept. Ann Plast Surg. 2010;64:47-51.
- Ing E, Safarpour A, Ing T, et al. Ocular adnexal asymmetry in models: a magazine photograph analysis. Can J Ophthalmol. 2006;41:175-182.
Facial symmetry plays a role in attractiveness, but a small degree of asymmetry is normal and more common than symmetry. Mild asymmetry has been noted in the general population, even in the absence of pathology such as trauma or craniosynostosis.1,2 Asymmetry may be static or dynamic and is thought to arise from a multitude of developmental factors, including skeletal, neurologic, and soft tissue changes, as well as photoaging.3-5 Cosmetic and reconstructive surgical procedures strive to achieve facial symmetry. Patients often are unaware of their preexisting facial asymmetry.6 Anecdotally, we have found patients tend to be more cognizant of preexisting facial asymmetry following a notable change in facial appearance (eg, surgery). In counseling patients who are considering reconstructive or cosmetic surgery, it is beneficial to identify any preexisting facial asymmetries and discuss if they are within normal limits. The current literature, however, lacks thresholds for what is considered normal in many cases. In this study, we reviewed 100 faces without unilateral or orbital pathology or diplopia to describe the occurrence of facial asymmetries, including larger hemiface and hemiface with greater excursion of motion upon smiling (interpreted to signify stronger seventh cranial nerve), hemiface with more rhytides at rest, higher globe, higher earlobe, and higher lip.
Methods
One hundred oculofacial surgery patients without unilateral or orbital pathology or diplopia were included in this retrospective evaluation of static and dynamic facial asymmetry via facial photography (100 participants). Three graders were provided standard frontal and frontal smiling photographs with overlying facial grids to aid in assessing larger hemiface and hemiface with stronger seventh cranial nerve, which was judged in smiling photographs by assessing the excursion and the vector of motion; more rhytides at rest; higher globe; higher earlobe; and higher lip. Difference in globe height was measured relative to interpupillary distance (IPD) and recorded as the ratio of difference in globe height to IPD. The data were analyzed to see if there were any correlations among the 6 variables. This study was approved by the Duke University Health System (Durham, North Carolina) institutional review board.
Results
One hundred photographs were analyzed including 82 women aged 42 to 85 years and 18 men aged 22 to 88 years (overall average age, 61.64 years). The average difference in globe height was 1.2% of IPD; the maximum was 4.4% of IPD. The difference in globe height was verified by 3 graders via 2 different methods. Fifty-four patients were found to have a larger right hemiface, 36 had a larger left hemiface, and 10 had symmetrically sized hemifaces. Nearly half of patients were judged to have greater seventh cranial nerve action on the left (n=47), approximately one-quarter had greater action on the right (n=28), and another quarter were judged to have equal action (n=25). Most patients had static facial asymmetry; 72 had rhytides more pronounced on one hemiface compared to the other, 79 with a difference in globe height, and 68 with a difference in lip height. In approximately 40% of photographs, the graders were unable to judge earlobe height difference; therefore, this data was not analyzed. There was no correlation among the 6 variables.
Discussion
Facial asymmetry has long been a topic of interest in the plastic and reconstructive surgery fields. Ercan et al7 used statistical shape analysis to study facial asymmetry in young healthy subjects and found the left hemiface to be larger than the right hemiface in both sexes. Smith4 evaluated facial asymmetry in healthy college students and found the left hemiface to be larger in males and the right hemiface to be larger in females. Our group was predominantly female, but we found the right hemiface to be larger in both females and males, similar to the findings of Lepich et al.8
We also found that most patients had static and dynamic facial asymmetry despite no known unilateral pathology. The present literature lacks normative values to help determine what degree of asymmetry should be considered pathologic. Vertical orbital dystopia is defined as an inequality in the horizontal levels of the whole orbits.9 It has been hypothesized that most vertical dystopia is caused by congenital malformations, but no threshold has been set for the difference in height that qualifies as dystopia.10 Regarding the difference we found in globe height relative to IPD, if one takes the mean IPD of 63.36 mm (based on a study of 3976 American adults aged 17–51 years)11 and makes the assumption that our patients have this IPD, then one can extrapolate that on average there was a difference of 0.76 mm between the 2 globe heights. Likewise, nearly all patients (n=96) had less than a 2-mm difference (21 had symmetric globe heights, 46 had a difference in globe height of <1 mm, and 29 had a difference of >1 mm and <2 mm). Four patients had a difference greater than 2 mm, with the largest difference being 2.75 mm. A limitation of this retrospective study is the need to extrapolate these distances, as our patients were not photographed with rulers.
Hafezi et al12 looked at the facial asymmetry in patients without history of trauma or nasal fracture who were seeking rhinoplasty. They noted vertical orbital dystopia in this patient population, but the degree of dystopia was not quantified.12 We believe our data highlight the importance of counseling patients about preexisting facial asymmetry with normative values in mind. Patients may be dissatisfied by new or preexisting asymmetry following surgery, even if such asymmetries are less objectively apparent than in the patient’s preoperative appearance. Even when patients are already acutely aware of their facial asymmetries, they should learn that facial asymmetries, to varying degrees, are natural and not necessarily unattractive. In fact, a 2006
- Wang TT, Wessels L, Hussain G, et al. Discriminative thresholds in facial asymmetry: a review of the literature. Aesthet Surg J. 2017;37:375-385.
- Zaidel DW, Cohen JA. The face, beauty, and symmetry: perceiving asymmetry in beautiful faces. Int J Neurosci. 2005;115:1165-1173.
- Rossi M, Ribeiro E, Smith R. Craniofacial asymmetry in development: an anatomical study. Angle Orthod. 2003;73:381-385.
- Smith WM. Hemispheric and facial asymmetry: gender differences. Laterality. 2000;5:251-258.
- Gordon JR, Brieva JC. Images in clinical medicine. unilateral dermatoheliosis. N Engl J Med. 2012;366:e25.
- Macdonald KI, Mendez AI, Hart RD, et al. Eyelid and brow asymmetry in patients evaluated for upper lid blepharoplasty. J Otolaryngol Head Neck Surg. 2014;43:36.
- Ercan I, Ozdemir ST, Etoz A, et al. Facial asymmetry in young healthy subjects evaluated by statistical shape analysis. J Anat. 2008;213:663-669.
- Lepich T, Dabek J, Witkowska M, et al. Female and male orbit asymmetry: digital analysis. Adv Clin Exp Med. 2017;26:69-76.
- Tan ST, Ashworth G, Czypionka S, et al. Vertical orbital dystopia. Plast Reconstr Surg. 1996;97:1349-1361.
- De Ponte FS, Fadda T, Rinna C, et al. Early and late surgical treatment of orbital dystopia in craniofacial malformation. J Craniofac Surg. 1997;8:17-22.
- Dodgson NA. Variation and extrema of human interpupillary distance. Proc Int Soc Opt Eng. 2004;5291:36-46.
- Hafezi F, Naghibzadeh B, Nouhi A, et al. Asymmetric facial growth and deviated nose: a new concept. Ann Plast Surg. 2010;64:47-51.
- Ing E, Safarpour A, Ing T, et al. Ocular adnexal asymmetry in models: a magazine photograph analysis. Can J Ophthalmol. 2006;41:175-182.
Resident Pearl
- A small degree of asymmetry is normal and more common than perfect symmetry.

RISE: Insulin glargine, metformin offer no beta cell function benefit in youth
ORLANDO – in the pediatric medication portion of the Restoring Insulin Secretion (RISE) study.
The treatments, including either metformin for 12 months in 47 participants or insulin glargine for 3 months followed by metformin for 9 months in 44 participants, were not associated with improvement in beta cell function at 12 months, compared with baseline, according to reports from members of the RISE Consortium at the annual scientific sessions of the American Diabetes Association.
The video associated with this article is no longer available on this site. Please view all of our videos on the MDedge YouTube channel
Furthermore, measures of beta cell function worsened in both groups at 15-month follow-up, and the same was true for participants with impaired glucose tolerance only; the outcomes in that subset of patients were similar to the entire group, including patients with early T2DM.
“Beta cell failure progressed despite that intervention, and though both [metformin and insulin glargine] were effective for lowering glucose – and metformin for lowering weight ... it had nothing to do with the natural history of the disease, and that’s really quite disappointing,” John B. Buse, MD, said in a video interview.
But that’s not to say the findings weren’t of value.
“The exciting bit was our greater understanding of what’s different about diabetes in youth, and basically [the findings] showed that, both in the setting of impaired glucose tolerance and early diabetes, youth have more insulin resistance than adults, they have relatively more well-preserved beta cell function – they’re secreting more insulin at both impaired glucose tolerance and diabetes, and they have lesser hepatic insulin clearance,” said Dr. Buse, professor, chief of the division of endocrinology, and director of the Diabetes Center at the University of North Carolina, Chapel Hill.
Dr. Buse provided invited commentary on the findings at the ADA scientific sessions and elaborated on those comments in this interview, noting that, in addition to identifying important differences between children and adults with impaired glucose tolerance and diabetes, the RISE study demonstrated that the numerous challenges associated with conducting a major study involving children with impaired glucose tolerance or T2DM can be overcome.
“It’s a really heartwarming story,” he said of the efforts and successes of the RISE investigators in completing the pediatric medication portion of the study. “It at least gives us hope that, even if we haven’t found a cure for type 2 diabetes in children, we at least know we can do the studies.”
Dr. Buse also provided his take on what the future holds for both parts of the RISE study (findings from the adult medication and adult surgery portions are expected to be reported within the next year) and for other studies in children and youth with diabetes; he noted that the current findings and successes in enrolling and completing the pediatric portion of the study highlight multiple opportunities for future research.
Dr. Buse reported financial relationships with Adocia, AstraZeneca, Dexcom, Elcelyx, Eli Lilly, Fractyl Laboratories, Intarcia Therapeutics, Lexicon Pharmaceuticals, Metavention, NovaTarg Therapeutics, Novo Nordisk, Sanofi, VTV Therapeutics, Boehringer Ingelheim, Johnson & Johnson Services, Theracos, Shenzhen Hightide Biopharmaceutical, National Heart Lung and Blood Institute, National Center for Advancing Translational Sciences, National Institute of Diabetes and Digestive and Kidney Diseases, American Diabetes Association, Patient-Centered Outcomes Research Institute, and the National Institute of Environmental Health Sciences.
EXPERT ANALYSIS AT ADA 2018

Treatment of Grade III Acromioclavicular Separations in Professional Baseball Pitchers: A Survey of Major League Baseball Team Physicians
ABSTRACT
Despite advancements in surgical technique and understanding of throwing mechanics, controversy persists regarding the treatment of grade III acromioclavicular (AC) joint separations, particularly in throwing athletes. Twenty-eight major league baseball (MLB) orthopedic team physicians were surveyed to determine their definitive management of a grade III AC separation in the dominant arm of a professional baseball pitcher and their experience treating AC joint separations in starting pitchers and position players. Return-to-play outcomes were also evaluated. Twenty (71.4%) team physicians recommended nonoperative intervention compared to 8 (28.6%) who would have operated acutely. Eighteen (64.3%) team physicians had treated at least 1 professional pitcher with a grade III AC separation; 51 (77.3%) pitchers had been treated nonoperatively compared to 15 (22.7%) operatively. No difference was observed in the proportion of pitchers who returned to the same level of play (P = .54), had full, unrestricted range of motion (P = .23), or had full pain relief (P = .19) between the operatively and nonoperatively treated MLB pitchers. The majority (53.6%) of physicians would not include an injection if the injury was treated nonoperatively. Open coracoclavicular reconstruction (65.2%) was preferred for operative cases; 66.7% of surgeons would also include distal clavicle excision as an adjunct procedure. About 90% of physicians would return pitchers to throwing >12 weeks after surgery compared to after 4 to 6 weeks in nonoperatively treated cases. In conclusion, MLB team physicians preferred nonoperative management for an acute grade III AC joint separation in professional pitchers. If operative intervention is required, ligament reconstruction with adjunct distal clavicle excision were the most commonly performed procedures.
Continue to: Despite advancements in surgucal technique...
Despite advancements in surgical technique and improved understanding of the physiology of throwing mechanics, controversy persists regarding the preferred treatment for grade III acromioclavicular (AC) joint separations.1-6 Nonsurgical management has demonstrated return to prior function with fewer complications.7 However, there is a growing body of evidence demonstrating that surgical intervention is associated with more favorable outcomes8 and should be considered in patients who place high functional demands on their shoulders.9
The reported results on professional athletes in the literature remain ambivalent. Multiple small case reports/series have reported successful nonoperative treatment of elite athletes.10-12 Not surprisingly, McFarland and colleagues13 reported in 1997 that 69% of major league baseball (MLB) team physicians preferred nonoperative treatment for a theoretical starting pitcher sustaining a grade III AC separation 1 week prior to the start of the season. In contrast, reports of an inability to throw at a pre-injury level are equally commonplace.14,15 Nevertheless, all of these studies were limited to small cohorts, as the incidence of grade III AC separations in elite throwing athletes is relatively uncommon.13,16
In this study, we re-evaluated the study performed by McFarland and colleagues13 in 1997 by surveying all active MLB team orthopedic surgeons. We asked them how they would treat a grade III AC separation in a starting professional baseball pitcher. The physicians were also asked about their personal experience evaluating outcomes in these elite athletes. Given our improved understanding of the anatomy, pathophysiology, and surgical techniques for treating grade III AC separations, we hypothesize that more MLB team physicians would favor operative intervention treatment in professional baseball pitchers, as their vocation places higher demands on their shoulders.
MATERIALS AND METHODS
A questionnaire (Appendix A) was distributed to the team physicians of all 30 MLB teams. In addition to surgeon demographics, including age, years in practice, and years of taking care of an MLB team, the initial section of the questionnaire asked orthopedic surgeons how they would treat a theoretical starting pitcher who sustained a grade III AC joint separation of the dominant throwing arm 1 week prior to the start of the season. Physicians who preferred nonoperative treatment were asked whether they would use an injection (and what type), as well as when they would allow the pitcher to start a progressive interval throwing program. Physicians who preferred operative treatment were asked to rank their indications for operating, what procedure they would use (eg, open vs arthroscopic or coracoclavicular ligament repair vs reconstruction), and whether the surgical intervention would include distal clavicle excision. Both groups of physicians were also asked if their preferred treatment would change if the injury were to occur at the end of the season.
The second portion of the questionnaire asked surgeons about their experience treating AC joint separations in both starting pitchers and position players, as well as to describe the long-term outcomes of their preferred treatment, including time to return to full clearance for pitching, whether their patients returned to their prior level of play, and whether these patients had full pain relief. Finally, physicians were asked if any of the nonoperatively treated players ultimately crossed over and required operative intervention.
Continue to: Statistics...
STATISTICS
Descriptive statistics were used for continuous variables, and frequencies were used for categorical variables. Linear regression was performed to determine the correlation between the physician’s training or experience in treating AC joint separations and their recommended treatment. Fischer’s exact test/chi-square analysis was used to compare categorical variables. All tests were conducted using 2-sided hypothesis testing with statistical significance set at P < .05. All statistical analyses were conducted with SPSS 21.0 software (IBM Corporation).
RESULTS
A total of 28 MLB team physicians completed the questionnaires from 18 of the 30 MLB teams. The average age of the responders was 50.5 years (range, 34-60 years), with an average of 18.2 years in practice (range, 2-30 years) and 10.8 years (range, 1-24 years) taking care of their current professional baseball team. About 82% of the team physicians completed a sports medicine fellowship. On average, physicians saw 16.6 (range, 5-50) grade III or higher AC joint separations per year, and operated on 4.6 (range, 0-10) per year.
Nonoperative treatment was the preferred treatment for a grade III AC joint separation in a starting professional baseball pitcher for the majority of team physicians (20/28). No correlation was observed between the physician’s age (P = .881), years in practice (P = .915), years taking care of their professional team (P = .989), percentage of practice focused on shoulders (P = .986), number of AC joint injuries seen (P = .325), or number of surgeries performed per year (P = .807) with the team physician’s preferred treatment. Compared to the proportion reported originally by McFarland and colleagues13 in 1997 (69%), there was no difference in the proportion of team physicians that recommended nonoperative treatment (P = 1).
If treating this injury nonoperatively, 46.4% of physicians would also use an injection, with orthobiologics (eg, platelet-rich plasma) as the most popular choice (Table 1). No consensus was provided on the timeframe to return pitchers back to a progressive interval throwing program; however, 46.67% of physicians would return pitchers 4 to 6 weeks after a nonoperatively treated injury, while 35.7% would return pitchers 7 to 12 weeks after the initial injury.
Table 1. Treatment Preferences of Grade III AC Separation by MLB Team Physicians
Nonoperativea | |
Yes injection | 13 (46.4%) |
Cortisone | 3 (23.1%) |
Orthobiologic | 10 (76.9%) |
Local anesthetic (eg, lidocaine) | 1 (7.7%) |
Intramuscular toradol | 3 (23.1%) |
No injection | 15 (53.6%) |
Operativea | |
Open coracoclavicular ligament repair | 3 (13.0%) |
Open coracoclavicular ligament reconstruction | 15 (65.2%) |
Arthroscopic reconstruction with graft | 6 (26.1%) |
Arthroscopic repair with implant (ie, tight-rope) | 2 (8.7%) |
Distal clavicle excisionb | 16 (66.7%) |
Would not intervene operatively | 5 (17.9%) |
|
|
aRespondents were allowed to choose more than 1 treatment in each category. bChosen as an adjunct treatment.
Abbreviations: AC, acromioclavicular; MLB, major league baseball.
Most physicians (64.3%) cited functional limitations as the most important reason for indicating operative treatment, followed by pain (21.4%), and a deformity (14.3%). About 65% preferred open coracoclavicular ligament reconstruction. No physician recommended the Weaver-Dunn procedure or use of hardware (eg, hook plate). Of those who preferred an operative intervention, 66.7% would also include a distal clavicle excision, which is significantly higher than the proportion reported by McFarland and colleagues13 (23%, P = .0170). About 90% of physicians would return pitchers to play >12 weeks after operative treatment.
Continue to: If the injury occurred at the end ...
If the injury occurred at the end of the season, 7 of the 20 orthopedists (35%) who recommended nonoperative treatment said they would change to an operative intervention. Eighteen of 28 responders would have the same algorithm for MLB position players. Team physicians were less likely to recommend operative intervention in position players due to less demand on the arm and increased ability to accommodate the injury by altering their throwing mechanics.
Eighteen (64%) of the team physicians had treated at least 1 professional pitcher with a grade III AC separation in his dominant arm, and 11 (39.3%) had treated >1. Collectively, team physicians had treated 15 professional pitchers operatively, and 51 nonoperatively; only 3 patients converted to operative intervention after a failed nonoperative treatment.
Of the pitchers treated operatively, 93.3% (14) of pitchers returned to their prior level of pitching. The 1 patient who failed to return to the same level of pitching retired instead of returning to play. About 80% (12) of the pitchers had full pain relief, and 93.3% (14) had full range of motion (ROM). The pitcher who failed to regain full ROM also had a concomitant rotator cuff repair. The only complication reported from an operative intervention was a pitcher who sustained a coracoid fracture 10 months postoperatively while throwing 100 mph. Of the pitchers treated nonoperatively, 96% returned to their prior level of pitching, 92.2% (47) had full complete pain relief when throwing, and 100% had full ROM. No differences were observed between the proportion of pitchers who returned to their prior level of pitching, regained full ROM, or had full pain relief in the operative and nonoperative groups (Table 2).
Table 2. Outcomes of Treatment of Grade III AC Separation in 58 Professional Baseball Players
| Operative | Nonoperative | P-value |
Return to same level of play | 14/15 (93.3%) | 49/51 (96%) | 0.54 |
Full pain relief | 12/15 (80%) | 47/51 (92.2%) | 0.19 |
Full ROM | 14/15 (93.3%) | 51/51 (100%) | 0.23 |
Abbreviations: AC, acromioclavicular; ROM, range of motion.
DISCUSSION
Controversy persists regarding the optimal management of acute grade III AC separations, with the current available evidence potentially suggesting better cosmetic and radiological results but no definite differences in clinical results.1-6,17,18 In the absence of formal clinical practice guidelines, surgeons rely on their own experience or defer to the anecdotal experience of experts in the field. Our initial hypothesis was false in this survey of MLB team physicians taking care of overhead throwing athletes at the highest level. Our results demonstrate that despite improved techniques and an increased understanding of the pathophysiology of AC joint separations, conservative management is still the preferred treatment for acute grade III AC joint separations in professional baseball pitchers. The proportion of team physicians recommending nonoperative treatment in our series was essentially equivalent to the results reported by McFarland and colleagues13 in 1997, suggesting that the pendulum continues to favor conservative management initially. This status quo likely reflects both the dearth of literature suggesting a substantial benefit of acute operative repair, as well as the ability to accommodate with conservative measures after most grade III AC injuries, even at the highest level of athletic competition.
These results are also consistent with trends from the last few decades. In the 1970s, the overwhelming preference for treating an acute complete AC joint separation was surgical repair, with Powers and Bach10 reporting in a 1974 survey of 163 chairmen of orthopedic programs around the country that 91.5% advocated surgical treatment. However, surgical preference had reversed by the 1990s. Of the 187 chairmen and 59 team physicians surveyed by Cox19 in 1992, 72% and 86% respectively preferred nonoperative treatment in a theoretical 21-year-old athlete with a grade III AC separation. Nissen and Chatterjee20 reported in 2007 on a survey of all American Orthopaedic Society for Sports Medicine surgeons (N = 577) and Accreditation Council for Graduate Medical Education orthopedic program residency directors (N = 87) that >80% of responders preferred conservative measures for this acute injury. The reversal of trends has also been corroborated by recent multicenter trials demonstrating no difference in clinical outcomes between operative and nonoperative treatment of high grade AC joint dislocations, albeit these patients were not all high level overhead throwing athletes.17,18
Continue to: The trends in surgical interventions are notable...
The trends in surgical interventions are notable within the smaller subset of patients who are indicated for operative repair. Use of hardware and primary ligament repair, while popular in the surveys conducted in the 1970s10 and 1990s13 and even present in Nissen and Chatterjee’s20 2007 survey, were noticeably absent from our survey results, with the majority of respondents preferring open coracoclavicular ligament reconstruction. The role of distal clavicle excision has also expanded, from 23% of team physicians recommending it in 199713 to 57% to 59% in Nissen and Chatterjee’s20 2007 survey, to 66.7% in our series. This trend is not surprising as several recent cadaveric biomechanical studies have demonstrated that not only do peak graft forces not increase significantly,21 the anterior-posterior and superior-inferior motion at the AC joint following ligament reconstruction is maintained despite resection of the lateral clavicle.22 Additionally, primary distal clavicle excision may prevent the development of post-traumatic arthritis at the AC joint and osteolysis of the distal clavicle as a possible pain generator in the future.23 However, some respondents cautioned against performing a concomitant distal clavicle excision, as some biomechanical data demonstrate that resecting the distal clavicle may lead to increased horizontal translation at the AC joint despite intact superior and posterior AC capsules.24 Professional baseball pitchers may also be more lax and thus prone to more instability. Primary repair or reconstruction may not always lead to complete pre-injury stability in these individuals. This subtle unrecognized instability is hard to diagnosis and may be a persistent source of pain; thus, adding a distal clavicle excision may actually exacerbate the instability.
The nuanced indications for operative intervention, such as the presence of associated lesions were not captured by our survey.25 While most team physicians cited functional limitations as their most common reason for offering surgery, several MLB orthopedic surgeons also commented on evaluating the stability of the AC joint after a grade III injury, akin to the consensus statement from the International Society of Arthroscopy, Knee Surgery and Orthopaedic Sports Medicine (ISAKOS) Upper Extremity Committee26 in 2014 that diversified the Rockwood Grade III AC joint separation into its IIIA and IIIB classifications. The ISAKOS recommendations include initial conservative management and a second evaluation (both clinical and radiographic) for grade III lesions 3 to 6 weeks after the injury. However, as professional baseball is an incredibly profitable sport with an annual revenue approaching $9.5 billion27 and pitching salaries up to $32.5 million in 2015, serious financial considerations must be given to players who wish to avoid undergoing delayed surgery.
This study has shortcomings typical of expert opinion papers. The retrospective nature of this study places the data at risk of recall bias. Objective data (eg, terminal ROM, pain relief, and return to play) were obtained from a retrospective chart review; however, no standard documentation or collection method was used given the number of surgeons involved and, thus, conclusions based on treatment outcomes are imperfect. Another major weakness of this survey is the relatively small number of patients and respondents. An a priori power analysis was not available, as this was a retrospective review. A comparative trial will be necessary to definitively support one treatment over another. Assuming a 95% return to play in the nonoperatively treated group, approximately 300 patients would be needed in a prospective 2-armed study with 80% power to detect a 10% reduction in the incidence of return to play using an alpha level of 0.05 and assuming no loss to follow-up. This sample size would be difficult to achieve in this patient population.
However, compared to past series,13 the number of professional baseball players treated by the collective experience of these MLB team physicians is the largest reported to date. As suggested above, the rarity of this condition in elite athletes precludes the ability to have matched controls to definitively determine the optimal treatment, which may explain the lack of difference in the return to play, ROM, and pain relief outcomes. Instead, we can only extrapolate based on the collective anecdotal experience of the MLB team physicians.
CONCLUSION
Despite advances in surgical technique and understanding of throwing mechanics, the majority of MLB team physicians preferred nonoperative management for an acute grade III AC joint separation in a professional baseball pitcher. Open coracoclavicular ligament reconstruction was preferred for those who preferred operative intervention. An increasing number of orthopedic surgeons now consider a distal clavicle excision as an adjunct procedure.
This paper will be judged for the Resident Writer’s Award.
- Spencer EE Jr. Treatment of grade III acromioclavicular joint injuries: a systematic review. Clin Orthop Relat Res. 2007;455:38-44. doi:10.1097/BLO.0b013e318030df83.
- Ceccarelli E, Bondì R, Alviti F, Garofalo R, Miulli F, Padua R. Treatment of acute grade III acromioclavicular dislocation: A lack of evidence. J Orthop Traumatol. 2008;9(2):105-108. doi:10.1007/s10195-008-0013-7.
- Smith TO, Chester R, Pearse EO, Hing CB. Operative versus non-operative management following rockwood grade III acromioclavicular separation: a meta-analysis of the current evidence base. J Orthop Traumatol. 2011;12(1):19-27. doi:10.1007/s10195-011-0127-1.
- Beitzel K, Cote MP, Apostolakos J, et al. Current concepts in the treatment of acromioclavicular joint dislocations. Arthroscopy. 2013;29(2):387-397. doi:10.1016/j.arthro.2012.11.023.
- Korsten K, Gunning AC, Leenen LP. Operative or conservative treatment in patients with rockwood type III acromioclavicular dislocation: a systematic review and update of current literature. Int Orthop. 2014;38(4):831-838. doi:10.1007/s00264-013-2143-7.
- Modi CS, Beazley J, Zywiel MG, Lawrence TM, Veillette CJ. Controversies relating to the management of acromioclavicular joint dislocations. Bone Joint J. 2013;95-B(12):1595-1602. doi:10.1302/0301-620X.95B12.31802.
- Reid D, Polson K, Johnson L. Acromioclavicular joint separations grades I-III: a review of the literature and development of best practice guidelines. Sports Med. 2012;42(8):681-696. doi:10.2165/11633460-000000000-00000.
- Farber AJ, Cascio BM, Wilckens JH. Type III acromioclavicular separation: rationale for anatomical reconstruction. Am J Orthop. 2008;37(7):349-355.
- Li X, Ma R, Bedi A, Dines DM, Altchek DW, Dines JS. Management of acromioclavicular joint injuries. J Bone Joint Surg Am. 2014;96(1):73-84. doi:10.2106/JBJS.L.00734.
- Powers JA, Bach PJ. Acromioclavicular separations. Closed or open treatment? Clin Orthop Relat Res. 1974;104(104):213-223. doi:10.1097/00003086-197410000-00024.
- Glick JM, Milburn LJ, Haggerty JF, Nishimoto D. Dislocated acromioclavicular joint: follow-up study of 35 unreduced acromioclavicular dislocations. Am J Sports Med. 1977;5(6):264-270. doi:10.1177/036354657700500614.
- Watson ST, Wyland DJ. Return to play after nonoperative management for a severe type III acromioclavicular separation in the throwing shoulder of a collegiate pitcher. Phys Sportsmed. 2015;43(1):99-103. doi:10.1080/00913847.2015.1001937.
- McFarland EG, Blivin SJ, Doehring CB, Curl LA, Silberstein C. Treatment of grade III acromioclavicular separations in professional throwing athletes: results of a survey. Am J Orthop. 1997;26(11):771-774.
- Wojtys EM, Nelson G. Conservative treatment of grade III acromioclavicular dislocations. Clin Orthop Relat Res. 1991;268(268):112-119.
- Galpin RD, Hawkins RJ, Grainger RW. A comparative analysis of operative versus nonoperative treatment of grade III acromioclavicular separations. Clin Orthop Relat Res. 1985;193(193):150-155. doi:10.1097/00003086-198503000-00020.
- Pallis M, Cameron KL, Svoboda SJ, Owens BD. Epidemiology of acromioclavicular joint injury in young athletes. Am J Sports Med. 2012;40(9):2072-2077. doi:10.1177/0363546512450162.
- Canadian Orthopaedic Trauma Society. Multicenter randomized clinical trial of nonoperative versus operative treatment of acute acromio-clavicular joint dislocation. J Orthop Trauma. 2015;29(11):479-487. doi:10.1097/BOT.0000000000000437.
- Joukainen A, Kröger H, Niemitukia L, Mäkelä EA, Väätäinen U. Results of operative and nonoperative treatment of rockwood types III and V acromioclavicular joint dislocation: a prospective, randomized trial with an 18- to 20-year follow-up. Orthop J Sports Med. 2014;2(12):2325967114560130. doi:10.1177/2325967114560130.
- Cox JS. Current method of treatment of acromioclavicular joint dislocations. Orthopedics. 1992;15(9):1041-1044.
- Nissen CW, Chatterjee A. Type III acromioclavicular separation: results of a recent survey on its management. Am J Orthop. 2007;36(2):89-93.
- Kowalsky MS, Kremenic IJ, Orishimo KF, McHugh MP, Nicholas SJ, Lee SJ. The effect of distal clavicle excision on in situ graft forces in coracoclavicular ligament reconstruction. Am J Sports Med. 2010;38(11):2313-2319. doi:10.1177/0363546510374447.
- Beaver AB, Parks BG, Hinton RY. Biomechanical analysis of distal clavicle excision with acromioclavicular joint reconstruction. Am J Sports Med. 2013;41(7):1684-1688. doi:10.1177/0363546513488750.
- Mumford EB. Acromioclavicular dislocation. J Bone Joint Surg Am. 1941;23:799-802.
- Beitzel K, Sablan N, Chowaniec DM, et al. Sequential resection of the distal clavicle and its effects on horizontal acromioclavicular joint translation. Am J Sports Med. 2012;40(3):681-685. doi:10.1177/0363546511428880.
- Arrigoni P, Brady PC, Zottarelli L, et al. Associated lesions requiring additional surgical treatment in grade 3 acromioclavicular joint dislocations. Arthroscopy. 2014;30(1):6-10. doi:10.1016/j.arthro.2013.10.006.
- Beitzel K, Mazzocca AD, Bak K, et al. ISAKOS upper extremity committee consensus statement on the need for diversification of the rockwood classification for acromioclavicular joint injuries. Arthroscopy. 2014;30(2):271-278. doi:10.1016/j.arthro.2013.11.005.
- Brown M. MLB sees record revenues for 2015, up $500 million and approaching $9.5 billion. Forbes Web site. http://www.forbes.com/sites/maurybrown/2015/12/04/mlb-sees-record-revenu.... Published December 4, 2015. Accessed February 4, 2016.
ABSTRACT
Despite advancements in surgical technique and understanding of throwing mechanics, controversy persists regarding the treatment of grade III acromioclavicular (AC) joint separations, particularly in throwing athletes. Twenty-eight major league baseball (MLB) orthopedic team physicians were surveyed to determine their definitive management of a grade III AC separation in the dominant arm of a professional baseball pitcher and their experience treating AC joint separations in starting pitchers and position players. Return-to-play outcomes were also evaluated. Twenty (71.4%) team physicians recommended nonoperative intervention compared to 8 (28.6%) who would have operated acutely. Eighteen (64.3%) team physicians had treated at least 1 professional pitcher with a grade III AC separation; 51 (77.3%) pitchers had been treated nonoperatively compared to 15 (22.7%) operatively. No difference was observed in the proportion of pitchers who returned to the same level of play (P = .54), had full, unrestricted range of motion (P = .23), or had full pain relief (P = .19) between the operatively and nonoperatively treated MLB pitchers. The majority (53.6%) of physicians would not include an injection if the injury was treated nonoperatively. Open coracoclavicular reconstruction (65.2%) was preferred for operative cases; 66.7% of surgeons would also include distal clavicle excision as an adjunct procedure. About 90% of physicians would return pitchers to throwing >12 weeks after surgery compared to after 4 to 6 weeks in nonoperatively treated cases. In conclusion, MLB team physicians preferred nonoperative management for an acute grade III AC joint separation in professional pitchers. If operative intervention is required, ligament reconstruction with adjunct distal clavicle excision were the most commonly performed procedures.
Continue to: Despite advancements in surgucal technique...
Despite advancements in surgical technique and improved understanding of the physiology of throwing mechanics, controversy persists regarding the preferred treatment for grade III acromioclavicular (AC) joint separations.1-6 Nonsurgical management has demonstrated return to prior function with fewer complications.7 However, there is a growing body of evidence demonstrating that surgical intervention is associated with more favorable outcomes8 and should be considered in patients who place high functional demands on their shoulders.9
The reported results on professional athletes in the literature remain ambivalent. Multiple small case reports/series have reported successful nonoperative treatment of elite athletes.10-12 Not surprisingly, McFarland and colleagues13 reported in 1997 that 69% of major league baseball (MLB) team physicians preferred nonoperative treatment for a theoretical starting pitcher sustaining a grade III AC separation 1 week prior to the start of the season. In contrast, reports of an inability to throw at a pre-injury level are equally commonplace.14,15 Nevertheless, all of these studies were limited to small cohorts, as the incidence of grade III AC separations in elite throwing athletes is relatively uncommon.13,16
In this study, we re-evaluated the study performed by McFarland and colleagues13 in 1997 by surveying all active MLB team orthopedic surgeons. We asked them how they would treat a grade III AC separation in a starting professional baseball pitcher. The physicians were also asked about their personal experience evaluating outcomes in these elite athletes. Given our improved understanding of the anatomy, pathophysiology, and surgical techniques for treating grade III AC separations, we hypothesize that more MLB team physicians would favor operative intervention treatment in professional baseball pitchers, as their vocation places higher demands on their shoulders.
MATERIALS AND METHODS
A questionnaire (Appendix A) was distributed to the team physicians of all 30 MLB teams. In addition to surgeon demographics, including age, years in practice, and years of taking care of an MLB team, the initial section of the questionnaire asked orthopedic surgeons how they would treat a theoretical starting pitcher who sustained a grade III AC joint separation of the dominant throwing arm 1 week prior to the start of the season. Physicians who preferred nonoperative treatment were asked whether they would use an injection (and what type), as well as when they would allow the pitcher to start a progressive interval throwing program. Physicians who preferred operative treatment were asked to rank their indications for operating, what procedure they would use (eg, open vs arthroscopic or coracoclavicular ligament repair vs reconstruction), and whether the surgical intervention would include distal clavicle excision. Both groups of physicians were also asked if their preferred treatment would change if the injury were to occur at the end of the season.
The second portion of the questionnaire asked surgeons about their experience treating AC joint separations in both starting pitchers and position players, as well as to describe the long-term outcomes of their preferred treatment, including time to return to full clearance for pitching, whether their patients returned to their prior level of play, and whether these patients had full pain relief. Finally, physicians were asked if any of the nonoperatively treated players ultimately crossed over and required operative intervention.
Continue to: Statistics...
STATISTICS
Descriptive statistics were used for continuous variables, and frequencies were used for categorical variables. Linear regression was performed to determine the correlation between the physician’s training or experience in treating AC joint separations and their recommended treatment. Fischer’s exact test/chi-square analysis was used to compare categorical variables. All tests were conducted using 2-sided hypothesis testing with statistical significance set at P < .05. All statistical analyses were conducted with SPSS 21.0 software (IBM Corporation).
RESULTS
A total of 28 MLB team physicians completed the questionnaires from 18 of the 30 MLB teams. The average age of the responders was 50.5 years (range, 34-60 years), with an average of 18.2 years in practice (range, 2-30 years) and 10.8 years (range, 1-24 years) taking care of their current professional baseball team. About 82% of the team physicians completed a sports medicine fellowship. On average, physicians saw 16.6 (range, 5-50) grade III or higher AC joint separations per year, and operated on 4.6 (range, 0-10) per year.
Nonoperative treatment was the preferred treatment for a grade III AC joint separation in a starting professional baseball pitcher for the majority of team physicians (20/28). No correlation was observed between the physician’s age (P = .881), years in practice (P = .915), years taking care of their professional team (P = .989), percentage of practice focused on shoulders (P = .986), number of AC joint injuries seen (P = .325), or number of surgeries performed per year (P = .807) with the team physician’s preferred treatment. Compared to the proportion reported originally by McFarland and colleagues13 in 1997 (69%), there was no difference in the proportion of team physicians that recommended nonoperative treatment (P = 1).
If treating this injury nonoperatively, 46.4% of physicians would also use an injection, with orthobiologics (eg, platelet-rich plasma) as the most popular choice (Table 1). No consensus was provided on the timeframe to return pitchers back to a progressive interval throwing program; however, 46.67% of physicians would return pitchers 4 to 6 weeks after a nonoperatively treated injury, while 35.7% would return pitchers 7 to 12 weeks after the initial injury.
Table 1. Treatment Preferences of Grade III AC Separation by MLB Team Physicians
Nonoperativea | |
Yes injection | 13 (46.4%) |
Cortisone | 3 (23.1%) |
Orthobiologic | 10 (76.9%) |
Local anesthetic (eg, lidocaine) | 1 (7.7%) |
Intramuscular toradol | 3 (23.1%) |
No injection | 15 (53.6%) |
Operativea | |
Open coracoclavicular ligament repair | 3 (13.0%) |
Open coracoclavicular ligament reconstruction | 15 (65.2%) |
Arthroscopic reconstruction with graft | 6 (26.1%) |
Arthroscopic repair with implant (ie, tight-rope) | 2 (8.7%) |
Distal clavicle excisionb | 16 (66.7%) |
Would not intervene operatively | 5 (17.9%) |
|
|
aRespondents were allowed to choose more than 1 treatment in each category. bChosen as an adjunct treatment.
Abbreviations: AC, acromioclavicular; MLB, major league baseball.
Most physicians (64.3%) cited functional limitations as the most important reason for indicating operative treatment, followed by pain (21.4%), and a deformity (14.3%). About 65% preferred open coracoclavicular ligament reconstruction. No physician recommended the Weaver-Dunn procedure or use of hardware (eg, hook plate). Of those who preferred an operative intervention, 66.7% would also include a distal clavicle excision, which is significantly higher than the proportion reported by McFarland and colleagues13 (23%, P = .0170). About 90% of physicians would return pitchers to play >12 weeks after operative treatment.
Continue to: If the injury occurred at the end ...
If the injury occurred at the end of the season, 7 of the 20 orthopedists (35%) who recommended nonoperative treatment said they would change to an operative intervention. Eighteen of 28 responders would have the same algorithm for MLB position players. Team physicians were less likely to recommend operative intervention in position players due to less demand on the arm and increased ability to accommodate the injury by altering their throwing mechanics.
Eighteen (64%) of the team physicians had treated at least 1 professional pitcher with a grade III AC separation in his dominant arm, and 11 (39.3%) had treated >1. Collectively, team physicians had treated 15 professional pitchers operatively, and 51 nonoperatively; only 3 patients converted to operative intervention after a failed nonoperative treatment.
Of the pitchers treated operatively, 93.3% (14) of pitchers returned to their prior level of pitching. The 1 patient who failed to return to the same level of pitching retired instead of returning to play. About 80% (12) of the pitchers had full pain relief, and 93.3% (14) had full range of motion (ROM). The pitcher who failed to regain full ROM also had a concomitant rotator cuff repair. The only complication reported from an operative intervention was a pitcher who sustained a coracoid fracture 10 months postoperatively while throwing 100 mph. Of the pitchers treated nonoperatively, 96% returned to their prior level of pitching, 92.2% (47) had full complete pain relief when throwing, and 100% had full ROM. No differences were observed between the proportion of pitchers who returned to their prior level of pitching, regained full ROM, or had full pain relief in the operative and nonoperative groups (Table 2).
Table 2. Outcomes of Treatment of Grade III AC Separation in 58 Professional Baseball Players
| Operative | Nonoperative | P-value |
Return to same level of play | 14/15 (93.3%) | 49/51 (96%) | 0.54 |
Full pain relief | 12/15 (80%) | 47/51 (92.2%) | 0.19 |
Full ROM | 14/15 (93.3%) | 51/51 (100%) | 0.23 |
Abbreviations: AC, acromioclavicular; ROM, range of motion.
DISCUSSION
Controversy persists regarding the optimal management of acute grade III AC separations, with the current available evidence potentially suggesting better cosmetic and radiological results but no definite differences in clinical results.1-6,17,18 In the absence of formal clinical practice guidelines, surgeons rely on their own experience or defer to the anecdotal experience of experts in the field. Our initial hypothesis was false in this survey of MLB team physicians taking care of overhead throwing athletes at the highest level. Our results demonstrate that despite improved techniques and an increased understanding of the pathophysiology of AC joint separations, conservative management is still the preferred treatment for acute grade III AC joint separations in professional baseball pitchers. The proportion of team physicians recommending nonoperative treatment in our series was essentially equivalent to the results reported by McFarland and colleagues13 in 1997, suggesting that the pendulum continues to favor conservative management initially. This status quo likely reflects both the dearth of literature suggesting a substantial benefit of acute operative repair, as well as the ability to accommodate with conservative measures after most grade III AC injuries, even at the highest level of athletic competition.
These results are also consistent with trends from the last few decades. In the 1970s, the overwhelming preference for treating an acute complete AC joint separation was surgical repair, with Powers and Bach10 reporting in a 1974 survey of 163 chairmen of orthopedic programs around the country that 91.5% advocated surgical treatment. However, surgical preference had reversed by the 1990s. Of the 187 chairmen and 59 team physicians surveyed by Cox19 in 1992, 72% and 86% respectively preferred nonoperative treatment in a theoretical 21-year-old athlete with a grade III AC separation. Nissen and Chatterjee20 reported in 2007 on a survey of all American Orthopaedic Society for Sports Medicine surgeons (N = 577) and Accreditation Council for Graduate Medical Education orthopedic program residency directors (N = 87) that >80% of responders preferred conservative measures for this acute injury. The reversal of trends has also been corroborated by recent multicenter trials demonstrating no difference in clinical outcomes between operative and nonoperative treatment of high grade AC joint dislocations, albeit these patients were not all high level overhead throwing athletes.17,18
Continue to: The trends in surgical interventions are notable...
The trends in surgical interventions are notable within the smaller subset of patients who are indicated for operative repair. Use of hardware and primary ligament repair, while popular in the surveys conducted in the 1970s10 and 1990s13 and even present in Nissen and Chatterjee’s20 2007 survey, were noticeably absent from our survey results, with the majority of respondents preferring open coracoclavicular ligament reconstruction. The role of distal clavicle excision has also expanded, from 23% of team physicians recommending it in 199713 to 57% to 59% in Nissen and Chatterjee’s20 2007 survey, to 66.7% in our series. This trend is not surprising as several recent cadaveric biomechanical studies have demonstrated that not only do peak graft forces not increase significantly,21 the anterior-posterior and superior-inferior motion at the AC joint following ligament reconstruction is maintained despite resection of the lateral clavicle.22 Additionally, primary distal clavicle excision may prevent the development of post-traumatic arthritis at the AC joint and osteolysis of the distal clavicle as a possible pain generator in the future.23 However, some respondents cautioned against performing a concomitant distal clavicle excision, as some biomechanical data demonstrate that resecting the distal clavicle may lead to increased horizontal translation at the AC joint despite intact superior and posterior AC capsules.24 Professional baseball pitchers may also be more lax and thus prone to more instability. Primary repair or reconstruction may not always lead to complete pre-injury stability in these individuals. This subtle unrecognized instability is hard to diagnosis and may be a persistent source of pain; thus, adding a distal clavicle excision may actually exacerbate the instability.
The nuanced indications for operative intervention, such as the presence of associated lesions were not captured by our survey.25 While most team physicians cited functional limitations as their most common reason for offering surgery, several MLB orthopedic surgeons also commented on evaluating the stability of the AC joint after a grade III injury, akin to the consensus statement from the International Society of Arthroscopy, Knee Surgery and Orthopaedic Sports Medicine (ISAKOS) Upper Extremity Committee26 in 2014 that diversified the Rockwood Grade III AC joint separation into its IIIA and IIIB classifications. The ISAKOS recommendations include initial conservative management and a second evaluation (both clinical and radiographic) for grade III lesions 3 to 6 weeks after the injury. However, as professional baseball is an incredibly profitable sport with an annual revenue approaching $9.5 billion27 and pitching salaries up to $32.5 million in 2015, serious financial considerations must be given to players who wish to avoid undergoing delayed surgery.
This study has shortcomings typical of expert opinion papers. The retrospective nature of this study places the data at risk of recall bias. Objective data (eg, terminal ROM, pain relief, and return to play) were obtained from a retrospective chart review; however, no standard documentation or collection method was used given the number of surgeons involved and, thus, conclusions based on treatment outcomes are imperfect. Another major weakness of this survey is the relatively small number of patients and respondents. An a priori power analysis was not available, as this was a retrospective review. A comparative trial will be necessary to definitively support one treatment over another. Assuming a 95% return to play in the nonoperatively treated group, approximately 300 patients would be needed in a prospective 2-armed study with 80% power to detect a 10% reduction in the incidence of return to play using an alpha level of 0.05 and assuming no loss to follow-up. This sample size would be difficult to achieve in this patient population.
However, compared to past series,13 the number of professional baseball players treated by the collective experience of these MLB team physicians is the largest reported to date. As suggested above, the rarity of this condition in elite athletes precludes the ability to have matched controls to definitively determine the optimal treatment, which may explain the lack of difference in the return to play, ROM, and pain relief outcomes. Instead, we can only extrapolate based on the collective anecdotal experience of the MLB team physicians.
CONCLUSION
Despite advances in surgical technique and understanding of throwing mechanics, the majority of MLB team physicians preferred nonoperative management for an acute grade III AC joint separation in a professional baseball pitcher. Open coracoclavicular ligament reconstruction was preferred for those who preferred operative intervention. An increasing number of orthopedic surgeons now consider a distal clavicle excision as an adjunct procedure.
This paper will be judged for the Resident Writer’s Award.
- Spencer EE Jr. Treatment of grade III acromioclavicular joint injuries: a systematic review. Clin Orthop Relat Res. 2007;455:38-44. doi:10.1097/BLO.0b013e318030df83.
- Ceccarelli E, Bondì R, Alviti F, Garofalo R, Miulli F, Padua R. Treatment of acute grade III acromioclavicular dislocation: A lack of evidence. J Orthop Traumatol. 2008;9(2):105-108. doi:10.1007/s10195-008-0013-7.
- Smith TO, Chester R, Pearse EO, Hing CB. Operative versus non-operative management following rockwood grade III acromioclavicular separation: a meta-analysis of the current evidence base. J Orthop Traumatol. 2011;12(1):19-27. doi:10.1007/s10195-011-0127-1.
- Beitzel K, Cote MP, Apostolakos J, et al. Current concepts in the treatment of acromioclavicular joint dislocations. Arthroscopy. 2013;29(2):387-397. doi:10.1016/j.arthro.2012.11.023.
- Korsten K, Gunning AC, Leenen LP. Operative or conservative treatment in patients with rockwood type III acromioclavicular dislocation: a systematic review and update of current literature. Int Orthop. 2014;38(4):831-838. doi:10.1007/s00264-013-2143-7.
- Modi CS, Beazley J, Zywiel MG, Lawrence TM, Veillette CJ. Controversies relating to the management of acromioclavicular joint dislocations. Bone Joint J. 2013;95-B(12):1595-1602. doi:10.1302/0301-620X.95B12.31802.
- Reid D, Polson K, Johnson L. Acromioclavicular joint separations grades I-III: a review of the literature and development of best practice guidelines. Sports Med. 2012;42(8):681-696. doi:10.2165/11633460-000000000-00000.
- Farber AJ, Cascio BM, Wilckens JH. Type III acromioclavicular separation: rationale for anatomical reconstruction. Am J Orthop. 2008;37(7):349-355.
- Li X, Ma R, Bedi A, Dines DM, Altchek DW, Dines JS. Management of acromioclavicular joint injuries. J Bone Joint Surg Am. 2014;96(1):73-84. doi:10.2106/JBJS.L.00734.
- Powers JA, Bach PJ. Acromioclavicular separations. Closed or open treatment? Clin Orthop Relat Res. 1974;104(104):213-223. doi:10.1097/00003086-197410000-00024.
- Glick JM, Milburn LJ, Haggerty JF, Nishimoto D. Dislocated acromioclavicular joint: follow-up study of 35 unreduced acromioclavicular dislocations. Am J Sports Med. 1977;5(6):264-270. doi:10.1177/036354657700500614.
- Watson ST, Wyland DJ. Return to play after nonoperative management for a severe type III acromioclavicular separation in the throwing shoulder of a collegiate pitcher. Phys Sportsmed. 2015;43(1):99-103. doi:10.1080/00913847.2015.1001937.
- McFarland EG, Blivin SJ, Doehring CB, Curl LA, Silberstein C. Treatment of grade III acromioclavicular separations in professional throwing athletes: results of a survey. Am J Orthop. 1997;26(11):771-774.
- Wojtys EM, Nelson G. Conservative treatment of grade III acromioclavicular dislocations. Clin Orthop Relat Res. 1991;268(268):112-119.
- Galpin RD, Hawkins RJ, Grainger RW. A comparative analysis of operative versus nonoperative treatment of grade III acromioclavicular separations. Clin Orthop Relat Res. 1985;193(193):150-155. doi:10.1097/00003086-198503000-00020.
- Pallis M, Cameron KL, Svoboda SJ, Owens BD. Epidemiology of acromioclavicular joint injury in young athletes. Am J Sports Med. 2012;40(9):2072-2077. doi:10.1177/0363546512450162.
- Canadian Orthopaedic Trauma Society. Multicenter randomized clinical trial of nonoperative versus operative treatment of acute acromio-clavicular joint dislocation. J Orthop Trauma. 2015;29(11):479-487. doi:10.1097/BOT.0000000000000437.
- Joukainen A, Kröger H, Niemitukia L, Mäkelä EA, Väätäinen U. Results of operative and nonoperative treatment of rockwood types III and V acromioclavicular joint dislocation: a prospective, randomized trial with an 18- to 20-year follow-up. Orthop J Sports Med. 2014;2(12):2325967114560130. doi:10.1177/2325967114560130.
- Cox JS. Current method of treatment of acromioclavicular joint dislocations. Orthopedics. 1992;15(9):1041-1044.
- Nissen CW, Chatterjee A. Type III acromioclavicular separation: results of a recent survey on its management. Am J Orthop. 2007;36(2):89-93.
- Kowalsky MS, Kremenic IJ, Orishimo KF, McHugh MP, Nicholas SJ, Lee SJ. The effect of distal clavicle excision on in situ graft forces in coracoclavicular ligament reconstruction. Am J Sports Med. 2010;38(11):2313-2319. doi:10.1177/0363546510374447.
- Beaver AB, Parks BG, Hinton RY. Biomechanical analysis of distal clavicle excision with acromioclavicular joint reconstruction. Am J Sports Med. 2013;41(7):1684-1688. doi:10.1177/0363546513488750.
- Mumford EB. Acromioclavicular dislocation. J Bone Joint Surg Am. 1941;23:799-802.
- Beitzel K, Sablan N, Chowaniec DM, et al. Sequential resection of the distal clavicle and its effects on horizontal acromioclavicular joint translation. Am J Sports Med. 2012;40(3):681-685. doi:10.1177/0363546511428880.
- Arrigoni P, Brady PC, Zottarelli L, et al. Associated lesions requiring additional surgical treatment in grade 3 acromioclavicular joint dislocations. Arthroscopy. 2014;30(1):6-10. doi:10.1016/j.arthro.2013.10.006.
- Beitzel K, Mazzocca AD, Bak K, et al. ISAKOS upper extremity committee consensus statement on the need for diversification of the rockwood classification for acromioclavicular joint injuries. Arthroscopy. 2014;30(2):271-278. doi:10.1016/j.arthro.2013.11.005.
- Brown M. MLB sees record revenues for 2015, up $500 million and approaching $9.5 billion. Forbes Web site. http://www.forbes.com/sites/maurybrown/2015/12/04/mlb-sees-record-revenu.... Published December 4, 2015. Accessed February 4, 2016.
TAKE-HOME POINTS
- There was no difference in return to previous level of play between professional pitchers treated nonoperatively and operatively for grade III AC separation.
- MLB team physicians prefer nonoperative management for acute grade III AC joint separation in professional pitchers.
- The majority of MLB physicians do not use injections for nonoperative treatment of grade III AC separations; however, use of orthobiologics (eg, PRP) is becoming more commonplace.
- Persistent functional limitations and pain are the most common surgical indications for treatment of grade III AC separation in high level throwing athletes.
- If operative intervention is indicated for grade III AC separation, open coracoclavicular reconstruction and adjunct distal clavicle excision are preferred by most MLB team physicians.