User login
FDA Grants Fund Rare Disease Research
Twelve FDA grants fund new clinical trials to advance the development of medical products for the treatment of rare diseases.
On September 24, 2018, the FDA announced that it awarded 12 new clinical trial research grants totaling more than $18 million over the next four years to enhance the development of medical products for patients with rare diseases. These new grants were awarded to principal investigators from academia and industry across the country.
“Developing a treatment for a rare disease can be especially challenging. Given the often small number of patients affected by certain very rare diseases, there can be limited markets for new treatments, and as a result fewer resources devoted to researching these opportunities,” said FDA Commissioner Scott Gottlieb, MD. “The FDA is committed to doing its part to facilitate continued progress toward more treatments, and even potential cures, for patients with rare diseases. New scientific advances offer more opportunities to develop these potential cures. With efficient regulation, proper incentives for product development, and the continued support of patients, providers, and researchers, we have more opportunities to pursue these advances than ever before. For 35 years, the FDA has provided much-needed financial support for clinical trials of potentially life-changing treatments for patients with rare diseases. This funding helps support early-stage development activities targeting rare diseases that do not have effective treatments. By providing seed capital, these FDA-administered grants enable researchers to prove out important concepts. The FDA grants also provide some important recognition to promising development programs that ultimately can help researchers attract additional funding.”

The FDA awarded the grants through the Orphan Products Clinical Trials Grants Program. This program is funded by Congressional appropriations and encourages clinical development of drugs, biologics, medical devices, or medical foods for use in rare diseases. The grants are intended for clinical studies evaluating the safety and effectiveness of products that could either result in, or substantially contribute to, the FDA approval of products targeted to the treatment of rare diseases. Grant applications were reviewed and evaluated for scientific and technical merit by more than 100 rare disease experts, which included representatives from academia, the NIH, and the FDA.
The grant recipients, principal investigators, and approximate funding amounts, listed alphabetically, are:
Alkeus Pharmaceuticals, Inc (Cambridge, Massachusetts), Leonide Saad, phase 2 study of ALK-001 for the treatment of Stargardt disease—$1.75 million over four years
Arizona State University–Tempe Campus (Tempe, Arizona), Keith Lindor, phase 2 study of oral vancomycin for the treatment of primary sclerosing cholangitis—$2 million over four years
Cedars-Sinai Medical Center (Los Angeles), Shlomo Melmed, phase 2 study of seliciclib for the treatment of Cushing disease—$2 million over four years
Columbia University (New York), Yvonne Saenger, phase 1 study of talimogene laherparepvec for the treatment for advanced pancreatic cancer—$750,000 over three years
Emory University (Atlanta), Eric Sorscher, phase 1/ 2 study of Ad/PNP fludarabine for the treatment of head and neck squamous cell carcinoma—$1.5 million over three years
Fibrocell Technologies, Inc (Exton, Pennsylvania), John Maslowski, phase 1/2 study of gene-modified ex-vivo autologous fibroblasts for the treatment of dystrophic epidermolysis bullosa—$1.5 million over four years
Johns Hopkins University (Baltimore), Amy Dezern, phase 1/2 study of CD8-reduced T cells for the treatment of myelodysplastic syndrome or acute myeloid leukemia—$750,000 over three years
Oncolmmune, Inc (Rockville, Maryland) Yang Liu, phase 2b study of CD24Fc for the prevention of graft versus host disease—$2 million over four years
Patagonia Pharmaceuticals, LLC (Woodcliff Lake, New Jersey), Zachary Rome, phase 2 study of PAT-001 (isotretinoin) for the treatment of congenital ichthyosis—$1.5 million over three years
The General Hospital Corporation (Boston), Stephanie Seminara, phase 2 study of kisspeptin for the treatment of dopamine agonist intolerant hyperprolactinemia—$1.4 million over four years
University of Minnesota (Minneapolis), Kyriakie Sarafoglou, phase 2a study of subcutaneous hydrocortisone infusion pump for the treatment of congenital adrenal hyperplasia—$1.4 million over three years
University of North Carolina at Chapel Hill (Chapel Hill, North Carolina), Matthew Laughon, phase 2 study of sildenafil for the prevention of bronchopulmonary dysplasia—$2 million over four years.
“Since its creation in 1983, the Orphan Products Grants Program has provided more than $400 million to fund more than 600 new clinical studies,” said Debra Lewis, OD, Acting Director of the FDA’s Office of Orphan Products Development. “We are encouraged to see so much interest in our grants program and are pleased to support research for a variety of rare diseases that have little, or no, treatment options for patients.”
One-third of the new awards aim to accelerate cancer research by enrolling patients with rare forms of cancer, including advanced pancreatic cancer, head and neck squamous cell carcinoma, myelodysplastic syndrome, and acute myeloid leukemia. Another 25% of the new awards fund studies evaluating drug products for rare endocrine disorders, including Cushing disease, dopamine agonist intolerant hyperprolactinemia, and congenital adrenal hyperplasia. Another study addresses an unmet need in primary sclerosing cholangitis, a rare, chronic, and potentially serious bile duct disease.
About 42% of the grants fund studies that enroll children and adolescents, targeting a variety of rare diseases in children such as Stargardt disease, a juvenile genetic eye disorder that causes progressive vision loss; dystrophic epidermolysis bullosa, a genetic condition that causes the skin to be fragile resulting in painful blisters; and bronchopulmonary dysplasia, a serious lung condition that affects infants.
To date, the program’s grants have supported research that led to the marketing approval of more than 60 orphan products. Among the recent product approvals which were supported by studies funded by this grants program are a marketing approval for a much-needed treatment of human immunodeficiency virus type 1 (HIV-1) infection in adults with multidrug resistant HIV-1 infection and another approval to reduce the acute complications of sickle cell disease in adult and pediatric patients.
The FDA is also currently supporting six natural history studies for rare diseases to further advance the mission of bringing new therapies to market.
Twelve FDA grants fund new clinical trials to advance the development of medical products for the treatment of rare diseases.
Twelve FDA grants fund new clinical trials to advance the development of medical products for the treatment of rare diseases.
On September 24, 2018, the FDA announced that it awarded 12 new clinical trial research grants totaling more than $18 million over the next four years to enhance the development of medical products for patients with rare diseases. These new grants were awarded to principal investigators from academia and industry across the country.
“Developing a treatment for a rare disease can be especially challenging. Given the often small number of patients affected by certain very rare diseases, there can be limited markets for new treatments, and as a result fewer resources devoted to researching these opportunities,” said FDA Commissioner Scott Gottlieb, MD. “The FDA is committed to doing its part to facilitate continued progress toward more treatments, and even potential cures, for patients with rare diseases. New scientific advances offer more opportunities to develop these potential cures. With efficient regulation, proper incentives for product development, and the continued support of patients, providers, and researchers, we have more opportunities to pursue these advances than ever before. For 35 years, the FDA has provided much-needed financial support for clinical trials of potentially life-changing treatments for patients with rare diseases. This funding helps support early-stage development activities targeting rare diseases that do not have effective treatments. By providing seed capital, these FDA-administered grants enable researchers to prove out important concepts. The FDA grants also provide some important recognition to promising development programs that ultimately can help researchers attract additional funding.”
The FDA awarded the grants through the Orphan Products Clinical Trials Grants Program. This program is funded by Congressional appropriations and encourages clinical development of drugs, biologics, medical devices, or medical foods for use in rare diseases. The grants are intended for clinical studies evaluating the safety and effectiveness of products that could either result in, or substantially contribute to, the FDA approval of products targeted to the treatment of rare diseases. Grant applications were reviewed and evaluated for scientific and technical merit by more than 100 rare disease experts, which included representatives from academia, the NIH, and the FDA.
The grant recipients, principal investigators, and approximate funding amounts, listed alphabetically, are:
Alkeus Pharmaceuticals, Inc (Cambridge, Massachusetts), Leonide Saad, phase 2 study of ALK-001 for the treatment of Stargardt disease—$1.75 million over four years
Arizona State University–Tempe Campus (Tempe, Arizona), Keith Lindor, phase 2 study of oral vancomycin for the treatment of primary sclerosing cholangitis—$2 million over four years
Cedars-Sinai Medical Center (Los Angeles), Shlomo Melmed, phase 2 study of seliciclib for the treatment of Cushing disease—$2 million over four years
Columbia University (New York), Yvonne Saenger, phase 1 study of talimogene laherparepvec for the treatment for advanced pancreatic cancer—$750,000 over three years
Emory University (Atlanta), Eric Sorscher, phase 1/ 2 study of Ad/PNP fludarabine for the treatment of head and neck squamous cell carcinoma—$1.5 million over three years
Fibrocell Technologies, Inc (Exton, Pennsylvania), John Maslowski, phase 1/2 study of gene-modified ex-vivo autologous fibroblasts for the treatment of dystrophic epidermolysis bullosa—$1.5 million over four years
Johns Hopkins University (Baltimore), Amy Dezern, phase 1/2 study of CD8-reduced T cells for the treatment of myelodysplastic syndrome or acute myeloid leukemia—$750,000 over three years
Oncolmmune, Inc (Rockville, Maryland) Yang Liu, phase 2b study of CD24Fc for the prevention of graft versus host disease—$2 million over four years
Patagonia Pharmaceuticals, LLC (Woodcliff Lake, New Jersey), Zachary Rome, phase 2 study of PAT-001 (isotretinoin) for the treatment of congenital ichthyosis—$1.5 million over three years
The General Hospital Corporation (Boston), Stephanie Seminara, phase 2 study of kisspeptin for the treatment of dopamine agonist intolerant hyperprolactinemia—$1.4 million over four years
University of Minnesota (Minneapolis), Kyriakie Sarafoglou, phase 2a study of subcutaneous hydrocortisone infusion pump for the treatment of congenital adrenal hyperplasia—$1.4 million over three years
University of North Carolina at Chapel Hill (Chapel Hill, North Carolina), Matthew Laughon, phase 2 study of sildenafil for the prevention of bronchopulmonary dysplasia—$2 million over four years.
“Since its creation in 1983, the Orphan Products Grants Program has provided more than $400 million to fund more than 600 new clinical studies,” said Debra Lewis, OD, Acting Director of the FDA’s Office of Orphan Products Development. “We are encouraged to see so much interest in our grants program and are pleased to support research for a variety of rare diseases that have little, or no, treatment options for patients.”
One-third of the new awards aim to accelerate cancer research by enrolling patients with rare forms of cancer, including advanced pancreatic cancer, head and neck squamous cell carcinoma, myelodysplastic syndrome, and acute myeloid leukemia. Another 25% of the new awards fund studies evaluating drug products for rare endocrine disorders, including Cushing disease, dopamine agonist intolerant hyperprolactinemia, and congenital adrenal hyperplasia. Another study addresses an unmet need in primary sclerosing cholangitis, a rare, chronic, and potentially serious bile duct disease.
About 42% of the grants fund studies that enroll children and adolescents, targeting a variety of rare diseases in children such as Stargardt disease, a juvenile genetic eye disorder that causes progressive vision loss; dystrophic epidermolysis bullosa, a genetic condition that causes the skin to be fragile resulting in painful blisters; and bronchopulmonary dysplasia, a serious lung condition that affects infants.
To date, the program’s grants have supported research that led to the marketing approval of more than 60 orphan products. Among the recent product approvals which were supported by studies funded by this grants program are a marketing approval for a much-needed treatment of human immunodeficiency virus type 1 (HIV-1) infection in adults with multidrug resistant HIV-1 infection and another approval to reduce the acute complications of sickle cell disease in adult and pediatric patients.
The FDA is also currently supporting six natural history studies for rare diseases to further advance the mission of bringing new therapies to market.
Re-excision unnecessary in moderately dysplastic nevi with positive margins
ORLANDO – Re-excisions are not needed when clinically excised moderately dysplastic nevi have positive histologic margins, based on results of a retrospective study of 438 patients who were treated at nine academic medical centers in the United States.

Not a single patient in the study developed melanoma at the excision site after an average follow-up of 6.9 years, and at least 3 years in all cases, said Elizabeth G. Berry, MD, of Emory University, Atlanta, and Atlanta Veterans Administration Medical Center, one of the study investigators.
The finding “really has the potential to change how we manage these lesions. You don’t need to cut [these patients] again. You can watch them. Close observation with routine skin surveillance is reasonable,” Dr. Berry said at the International Investigative Dermatology meeting.
Routine skin exams are essential for patients with a history of dysplastic nevi as these patients are at risk for developing melanoma. Indeed, in this study, 100 patients (22.8%) subsequently developed melanomas at a site other than the location of their biopsy.
The study included 438 patients who had 467 biopsies that indicated incomplete excision of a moderately dysplastic nevus from 1990 to 2014. Patients were at least 18 years old and were an average of 47 years old. About half had a history of dysplastic nevi, and a third had a history of melanoma.
All of their biopsies for moderately dysplastic nevi had positive margins, but patients had no clinically apparent residual pigment at their excision sites. Lesions were equally as likely to be removed by shave and punch biopsies, and the majority of the nevi were located on the trunk. Complete excision was the intent in all cases.
To control for interobserver variability, the centers submitted a total of 40 slides for central dermatopathology review, which found agreement in 35 cases (87.8%). Two of the remaining five cases were downgraded to mild dysplasia, two were upgraded to severe, and one patient was upgraded to melanoma in situ, but hasn’t had a recurrence after 5 years of follow-up.
Controlling for age, sex, and family history, a patient history of dysplastic nevus prior to the biopsy doubled the risk of a subsequent melanoma (P = .017), and a history of melanoma increased it almost eightfold (P less than .001).
Knowing these risk factors, patients with a history of dysplastic nevi “need to have more frequent total body skin exams. What that frequency is, we don’t know,” Dr. Berry said.
The investigators reported they had no relevant disclosures.
SOURCE: Kim CC et al. IID 2018, Abstract 571.
ORLANDO – Re-excisions are not needed when clinically excised moderately dysplastic nevi have positive histologic margins, based on results of a retrospective study of 438 patients who were treated at nine academic medical centers in the United States.
Not a single patient in the study developed melanoma at the excision site after an average follow-up of 6.9 years, and at least 3 years in all cases, said Elizabeth G. Berry, MD, of Emory University, Atlanta, and Atlanta Veterans Administration Medical Center, one of the study investigators.
The finding “really has the potential to change how we manage these lesions. You don’t need to cut [these patients] again. You can watch them. Close observation with routine skin surveillance is reasonable,” Dr. Berry said at the International Investigative Dermatology meeting.
Routine skin exams are essential for patients with a history of dysplastic nevi as these patients are at risk for developing melanoma. Indeed, in this study, 100 patients (22.8%) subsequently developed melanomas at a site other than the location of their biopsy.
The study included 438 patients who had 467 biopsies that indicated incomplete excision of a moderately dysplastic nevus from 1990 to 2014. Patients were at least 18 years old and were an average of 47 years old. About half had a history of dysplastic nevi, and a third had a history of melanoma.
All of their biopsies for moderately dysplastic nevi had positive margins, but patients had no clinically apparent residual pigment at their excision sites. Lesions were equally as likely to be removed by shave and punch biopsies, and the majority of the nevi were located on the trunk. Complete excision was the intent in all cases.
To control for interobserver variability, the centers submitted a total of 40 slides for central dermatopathology review, which found agreement in 35 cases (87.8%). Two of the remaining five cases were downgraded to mild dysplasia, two were upgraded to severe, and one patient was upgraded to melanoma in situ, but hasn’t had a recurrence after 5 years of follow-up.
Controlling for age, sex, and family history, a patient history of dysplastic nevus prior to the biopsy doubled the risk of a subsequent melanoma (P = .017), and a history of melanoma increased it almost eightfold (P less than .001).
Knowing these risk factors, patients with a history of dysplastic nevi “need to have more frequent total body skin exams. What that frequency is, we don’t know,” Dr. Berry said.
The investigators reported they had no relevant disclosures.
SOURCE: Kim CC et al. IID 2018, Abstract 571.
REPORTING FROM IID 2018
Is Napping Associated With Risk of Parkinson’s Disease?
Older men who nap for over an hour per day, as measured by actigraphy, may be more likely to develop Parkinson’s disease.
BALTIMORE—Older men who nap for more than an hour per day are more likely to develop Parkinson’s disease over 11 years of follow-up, compared with those who nap for less than an hour per day and do not have excessive daytime sleepiness, according to a study described at the 32nd Annual Meeting of the Associated Professional Sleep Societies.

Self-reported daytime sleepiness alone was not associated with increased risk, said Yue Leng, PhD, a postdoctoral researcher at the University of California, San Francisco.
The findings suggest that objective measures of napping might be valuable preclinical markers of Parkinson’s disease.
The mechanism underlying the association is unclear. It is possible that the ongoing degeneration in brain regions involved in the 24-hour sleep–wake cycle leads to increased napping in people who later develop Parkinson’s disease, she said.
“Excessive daytime sleepiness and daytime napping are common in older adults, especially those with Parkinson’s disease,” Dr. Leng said. Whether excessive daytime sleepiness or napping precedes the development of Parkinson’s disease and may be risk factors is not well understood, however. “There is a lack of objectively measured naps and also a lack of longitudinal studies. In fact, we are unaware of any longitudinal studies that have used objectively measured napping in relation to Parkinson’s disease risk.”
To examine the longitudinal association between objectively measured napping duration and risk of Parkinson’s disease, Dr. Leng and colleagues analyzed data from the Osteoporotic Fractures in Men Study (MrOS), a large, longitudinal, multicenter study of community-dwelling older men. They excluded men with Parkinson’s disease at baseline. The analysis included data from more than 2,900 men who had napping and sleep measures at baseline between 2003 and 2005 and were followed up for development of Parkinson’s disease over 11 years.
The investigators used actigraphy to measure napping. Participants wore a sleep watch on the dominant wrist for at least five consecutive 24-hour periods. The researchers defined napping as having at least five consecutive minutes of inactivity outside of the main sleep period. They defined excessive daytime sleepiness as a score greater than 10 on the Epworth Sleepiness Scale.
The researchers identified Parkinson’s disease using physician diagnosis or Parkinson’s disease medication use. Their analysis adjusted for age, BMI, smoking, physical activity, depression, comorbidities, global cognition scores, medication use, and nighttime sleep variables (ie, efficiency, duration, and apnea–hypopnea index).
“The highest risk was in those who reported daytime sleepiness and had objective napping for at least an hour per day,” Dr. Leng said. These participants had more than twice the risk of developing Parkinson’s disease, compared with a reference group that did not have daytime sleepiness and napped for less than one hour per day (odds ratio, 2.52).
Participants who napped for at least an hour per day but did not report excessive daytime sleepiness also had increased risk (odds ratio, 1.96).
The results indicate that objectively measured napping, rather than self-reported excessive daytime sleepiness, is important for Parkinson’s disease risk, Dr. Leng said.
Sensitivity analyses that excluded patients who developed Parkinson’s disease within two years after baseline and only included physician-confirmed cases of Parkinson’s disease had similar results.
Actigraphy is limited in its ability to differentiate between napping and inactivity, Dr. Leng noted. In addition, the results cannot be generalized to women and younger populations, she said.
—Jake Remaly
Suggested Reading
Leng Y, Goldman SM, Cawthon PM, et al. Excessive daytime sleepiness, objective napping and 11-year risk of Parkinson’s disease in older men. Int J Epidemiol. 2018 Jun 4 [Epub ahead of print].
Older men who nap for over an hour per day, as measured by actigraphy, may be more likely to develop Parkinson’s disease.
Older men who nap for over an hour per day, as measured by actigraphy, may be more likely to develop Parkinson’s disease.
BALTIMORE—Older men who nap for more than an hour per day are more likely to develop Parkinson’s disease over 11 years of follow-up, compared with those who nap for less than an hour per day and do not have excessive daytime sleepiness, according to a study described at the 32nd Annual Meeting of the Associated Professional Sleep Societies.
Self-reported daytime sleepiness alone was not associated with increased risk, said Yue Leng, PhD, a postdoctoral researcher at the University of California, San Francisco.
The findings suggest that objective measures of napping might be valuable preclinical markers of Parkinson’s disease.
The mechanism underlying the association is unclear. It is possible that the ongoing degeneration in brain regions involved in the 24-hour sleep–wake cycle leads to increased napping in people who later develop Parkinson’s disease, she said.
“Excessive daytime sleepiness and daytime napping are common in older adults, especially those with Parkinson’s disease,” Dr. Leng said. Whether excessive daytime sleepiness or napping precedes the development of Parkinson’s disease and may be risk factors is not well understood, however. “There is a lack of objectively measured naps and also a lack of longitudinal studies. In fact, we are unaware of any longitudinal studies that have used objectively measured napping in relation to Parkinson’s disease risk.”
To examine the longitudinal association between objectively measured napping duration and risk of Parkinson’s disease, Dr. Leng and colleagues analyzed data from the Osteoporotic Fractures in Men Study (MrOS), a large, longitudinal, multicenter study of community-dwelling older men. They excluded men with Parkinson’s disease at baseline. The analysis included data from more than 2,900 men who had napping and sleep measures at baseline between 2003 and 2005 and were followed up for development of Parkinson’s disease over 11 years.
The investigators used actigraphy to measure napping. Participants wore a sleep watch on the dominant wrist for at least five consecutive 24-hour periods. The researchers defined napping as having at least five consecutive minutes of inactivity outside of the main sleep period. They defined excessive daytime sleepiness as a score greater than 10 on the Epworth Sleepiness Scale.
The researchers identified Parkinson’s disease using physician diagnosis or Parkinson’s disease medication use. Their analysis adjusted for age, BMI, smoking, physical activity, depression, comorbidities, global cognition scores, medication use, and nighttime sleep variables (ie, efficiency, duration, and apnea–hypopnea index).
“The highest risk was in those who reported daytime sleepiness and had objective napping for at least an hour per day,” Dr. Leng said. These participants had more than twice the risk of developing Parkinson’s disease, compared with a reference group that did not have daytime sleepiness and napped for less than one hour per day (odds ratio, 2.52).
Participants who napped for at least an hour per day but did not report excessive daytime sleepiness also had increased risk (odds ratio, 1.96).
The results indicate that objectively measured napping, rather than self-reported excessive daytime sleepiness, is important for Parkinson’s disease risk, Dr. Leng said.
Sensitivity analyses that excluded patients who developed Parkinson’s disease within two years after baseline and only included physician-confirmed cases of Parkinson’s disease had similar results.
Actigraphy is limited in its ability to differentiate between napping and inactivity, Dr. Leng noted. In addition, the results cannot be generalized to women and younger populations, she said.
—Jake Remaly
Suggested Reading
Leng Y, Goldman SM, Cawthon PM, et al. Excessive daytime sleepiness, objective napping and 11-year risk of Parkinson’s disease in older men. Int J Epidemiol. 2018 Jun 4 [Epub ahead of print].
REM Sleep Behavior Disorder Predicts Rapid Motor and Cognitive Decline in Parkinson’s Disease
The disorder may have prognostic value only among patients with certain CSF results.
Among people with Parkinson’s disease, REM sleep behavior disorder (RBD) is associated with more rapid motor progression in patients with high levels of synuclein and dopaminergic pathology, according to research published online ahead of print August 8 in Neurology. RBD also indicates an increased risk of cognitive decline in patients with high degrees of synuclein and amyloid pathology.
“Our study is the first to link the predictive value of RBD symptoms to the presence of amyloid and synuclein pathology,” said Marios Politis, MD, PhD, Lily Safra Professor of Neurology and Neuroimaging, Consultant Neurologist, and the Director of the Neurodegeneration Imaging Group at King’s College London, and colleagues. “Measuring dopaminergic dysfunction and amyloid and synuclein burden in the screening of patients with RBD at an early stage of Parkinson’s disease, possibly even at the premotor phase of disease, could potentially identify the ones more likely to progress and develop dementia.”

The prevalence of RBD in patients with Parkinson’s disease ranges between 35% and 60%. Longitudinal data indicate that RBD is associated with faster development of cognitive decline and a greater risk of mild cognitive impairment and dementia in patients with Parkinson’s disease. Dr. Politis and colleagues examined the risk of motor progression and cognitive decline in patients with Parkinson’s disease and RBD who are untreated and at an early stage after disease onset.
The investigators selected 421 untreated patients with Parkinson’s disease and 196 healthy controls from the Parkinson’s Progression Markers Initiative database for their analysis. Eligible participants presented for screening at less than two years after diagnosis. Patients underwent a [123I]FP-CIT SPECT scan, CSF assessment, 3-T MRI, and thorough clinical assessments.
Among participants with Parkinson’s disease, average age was about 61 at baseline. Approximately 66% of these participants were male, and their mean disease duration was about 6.6 years. Patients with RBD had poorer olfaction, a higher burden of nonmotor symptoms, and worse scores on neuropsychologic tests. Furthermore, patients with RBD had lower CSF amyloid β42 levels and higher ratios of total tau to amyloid β42, compared with patients without RBD.
During 60 months of follow-up, RBD was associated with faster motor progression (hazard ratio [HR], 1.368) and cognitive decline (HR, 1.794). RBD predicted motor progression only in patients with Parkinson’s disease who had low α-synuclein levels and low [123I]FP-CIT uptake in the striatum (HR, 2.091). RBD predicted cognitive decline only in patients with Parkinson’s disease who had low amyloid β42 and low α-synuclein levels (HR, 2.810). RBD was not associated with cognitive decline or pathologic changes among healthy controls.
Parkinson’s disease with RBD “was previously suggested as a specific Parkinson’s disease phenotype associated with faster motor progression and characterized by reduced tremor, high frequency of falls, and a lower amplitude of response to medication dose,” said Dr. Politis and coauthors. “Our findings extend these observations and indicate that the Parkinson’s disease-RBD phenotype may vary in terms of progression of motor or cognitive symptoms, depending on underlying α-synuclein, amyloid β, and dopaminergic pathology."
—Erik Greb
Suggested Reading
Pagano G, De Micco R, Yousaf T, et al. REM behavior disorder predicts motor progression and cognitive decline in Parkinson disease. Neurology. 2018 Aug 8 [Epub ahead of print].
The disorder may have prognostic value only among patients with certain CSF results.
The disorder may have prognostic value only among patients with certain CSF results.
Among people with Parkinson’s disease, REM sleep behavior disorder (RBD) is associated with more rapid motor progression in patients with high levels of synuclein and dopaminergic pathology, according to research published online ahead of print August 8 in Neurology. RBD also indicates an increased risk of cognitive decline in patients with high degrees of synuclein and amyloid pathology.
“Our study is the first to link the predictive value of RBD symptoms to the presence of amyloid and synuclein pathology,” said Marios Politis, MD, PhD, Lily Safra Professor of Neurology and Neuroimaging, Consultant Neurologist, and the Director of the Neurodegeneration Imaging Group at King’s College London, and colleagues. “Measuring dopaminergic dysfunction and amyloid and synuclein burden in the screening of patients with RBD at an early stage of Parkinson’s disease, possibly even at the premotor phase of disease, could potentially identify the ones more likely to progress and develop dementia.”
The prevalence of RBD in patients with Parkinson’s disease ranges between 35% and 60%. Longitudinal data indicate that RBD is associated with faster development of cognitive decline and a greater risk of mild cognitive impairment and dementia in patients with Parkinson’s disease. Dr. Politis and colleagues examined the risk of motor progression and cognitive decline in patients with Parkinson’s disease and RBD who are untreated and at an early stage after disease onset.
The investigators selected 421 untreated patients with Parkinson’s disease and 196 healthy controls from the Parkinson’s Progression Markers Initiative database for their analysis. Eligible participants presented for screening at less than two years after diagnosis. Patients underwent a [123I]FP-CIT SPECT scan, CSF assessment, 3-T MRI, and thorough clinical assessments.
Among participants with Parkinson’s disease, average age was about 61 at baseline. Approximately 66% of these participants were male, and their mean disease duration was about 6.6 years. Patients with RBD had poorer olfaction, a higher burden of nonmotor symptoms, and worse scores on neuropsychologic tests. Furthermore, patients with RBD had lower CSF amyloid β42 levels and higher ratios of total tau to amyloid β42, compared with patients without RBD.
During 60 months of follow-up, RBD was associated with faster motor progression (hazard ratio [HR], 1.368) and cognitive decline (HR, 1.794). RBD predicted motor progression only in patients with Parkinson’s disease who had low α-synuclein levels and low [123I]FP-CIT uptake in the striatum (HR, 2.091). RBD predicted cognitive decline only in patients with Parkinson’s disease who had low amyloid β42 and low α-synuclein levels (HR, 2.810). RBD was not associated with cognitive decline or pathologic changes among healthy controls.
Parkinson’s disease with RBD “was previously suggested as a specific Parkinson’s disease phenotype associated with faster motor progression and characterized by reduced tremor, high frequency of falls, and a lower amplitude of response to medication dose,” said Dr. Politis and coauthors. “Our findings extend these observations and indicate that the Parkinson’s disease-RBD phenotype may vary in terms of progression of motor or cognitive symptoms, depending on underlying α-synuclein, amyloid β, and dopaminergic pathology."
—Erik Greb
Suggested Reading
Pagano G, De Micco R, Yousaf T, et al. REM behavior disorder predicts motor progression and cognitive decline in Parkinson disease. Neurology. 2018 Aug 8 [Epub ahead of print].
Multiday Seizure Cycles May Be Common
Tracking seizure cycles could facilitate personalized medicine and improve seizure reduction.
Multiday epileptic seizure cycles may occur in many individuals with epilepsy, according to a retrospective cohort study published online ahead of print September 12 in Lancet Neurology.
About 80% of patients in the study showed circadian modulation of their seizure rates, and more than 20% had strong circaseptan (ie, seven-day) rhythms, said Mark J. Cook, MD, a neurologist at St. Vincent’s Hospital in Melbourne, and colleagues.

The high prevalence of multiday seizure cycles could present an opportunity to improve treatment through the development of patient-specific chronotherapy (ie, the administration of medication when seizures are most likely). “Even without fully understanding the mechanisms of seizure cycles, temporal patterns can be incorporated into patient management plans,” said Dr. Cook.
The investigators based their study on two seizure datasets. One was a US cohort of 1,118 patients who reported at least 100 seizures through the SeizureTracker website or mobile app. The other was an Australian cohort of 12 patients with focal epilepsy who had at least 30 seizures recorded by an implanted electrocorticography device during follow-up that ranged between six months and three years.
In the US cohort, 86% of participants had at least one significant cycle in their seizure times, and 64% had more than one cycle. Most of the cycles (80%) were circadian, while 21% of people had significant circaseptan cycles in one analysis using the Hodges-Ajne test, a statistical method used to test for circular uniformity. “Many patients also showed some evidence of cycles lasting up to a month,” said the authors.
A confirmatory analysis using Monte Carlo simulation found that 7% of people, or 77 individuals, had significant circaseptan cycles. “The probability that 77 patients would randomly share a specific cycle is infinitesimal,” said the authors.
In the Australian study, 11 of 12 patients had strong rhythms at 24 hours, one had a significant cycle of exactly one week, and two others had cycles of approximately one week.
“Some people had stronger rhythms at time scales longer than 24 hours, which suggests that circadian regulation was not necessarily the strongest modulating factor of epileptic activity,” said the investigators. The cause of longer seizure cycles remains unclear, though peak seizure times might be linked to varying stress levels, seasonal changes in sleep quality, or biologic cycles such as menstruation.
—Andrew D. Bowser
Suggested Reading
Karoly PJ, Goldenholz DM, Freestone DR, et al. Circadian and circaseptan rhythms in human epilepsy: a retrospective cohort study. Lancet Neurol. 2018 Sep 12 [Epub ahead of print].
Tracking seizure cycles could facilitate personalized medicine and improve seizure reduction.
Tracking seizure cycles could facilitate personalized medicine and improve seizure reduction.
Multiday epileptic seizure cycles may occur in many individuals with epilepsy, according to a retrospective cohort study published online ahead of print September 12 in Lancet Neurology.
About 80% of patients in the study showed circadian modulation of their seizure rates, and more than 20% had strong circaseptan (ie, seven-day) rhythms, said Mark J. Cook, MD, a neurologist at St. Vincent’s Hospital in Melbourne, and colleagues.
The high prevalence of multiday seizure cycles could present an opportunity to improve treatment through the development of patient-specific chronotherapy (ie, the administration of medication when seizures are most likely). “Even without fully understanding the mechanisms of seizure cycles, temporal patterns can be incorporated into patient management plans,” said Dr. Cook.
The investigators based their study on two seizure datasets. One was a US cohort of 1,118 patients who reported at least 100 seizures through the SeizureTracker website or mobile app. The other was an Australian cohort of 12 patients with focal epilepsy who had at least 30 seizures recorded by an implanted electrocorticography device during follow-up that ranged between six months and three years.
In the US cohort, 86% of participants had at least one significant cycle in their seizure times, and 64% had more than one cycle. Most of the cycles (80%) were circadian, while 21% of people had significant circaseptan cycles in one analysis using the Hodges-Ajne test, a statistical method used to test for circular uniformity. “Many patients also showed some evidence of cycles lasting up to a month,” said the authors.
A confirmatory analysis using Monte Carlo simulation found that 7% of people, or 77 individuals, had significant circaseptan cycles. “The probability that 77 patients would randomly share a specific cycle is infinitesimal,” said the authors.
In the Australian study, 11 of 12 patients had strong rhythms at 24 hours, one had a significant cycle of exactly one week, and two others had cycles of approximately one week.
“Some people had stronger rhythms at time scales longer than 24 hours, which suggests that circadian regulation was not necessarily the strongest modulating factor of epileptic activity,” said the investigators. The cause of longer seizure cycles remains unclear, though peak seizure times might be linked to varying stress levels, seasonal changes in sleep quality, or biologic cycles such as menstruation.
—Andrew D. Bowser
Suggested Reading
Karoly PJ, Goldenholz DM, Freestone DR, et al. Circadian and circaseptan rhythms in human epilepsy: a retrospective cohort study. Lancet Neurol. 2018 Sep 12 [Epub ahead of print].
Stroke Increases the Risk of All-Cause Dementia
Protecting the blood supply to the brain could reduce the risk of incident dementia.
Stroke is a strong independent risk factor for all-cause dementia, according to research published online ahead of print August 25 in Alzheimer’s & Dementia. Clinicians should incorporate stroke-prevention strategies into their health interventions to reduce patients’ risk of dementia, said the authors.
“Around a third of dementia cases are thought to be potentially preventable, though this estimate does not take into account the risk associated with stroke,” said David Llewellyn, PhD, Senior Research Fellow at University of Exeter Medical School in the United Kingdom. “Our findings indicate that this figure could be even higher and reinforce the importance of protecting the blood supply to the brain when attempting to reduce the global burden of dementia.”

Meta-Analysis of Previous Research
Stroke is a recognized risk factor for all-cause dementia, but no researchers had previously performed a meta-analysis to quantify the risk. Dr. Llewellyn and colleagues searched Medline, PsycINFO, and Embase databases for prospective studies that investigated the association between prevalent or incident stroke and incident all-cause dementia. They excluded studies that lacked a comparison group or that had a comparison group other than a stroke-free group. The investigators pooled adjusted estimates across studies using random effects meta-analysis and evaluated potential effect modifiers with meta-regression.
Dr. Llewellyn and colleagues identified 11,129 articles, 26 of which were eligible for analysis. They also included 16 studies from a previous systematic review and four studies identified through backward and forward citation searches. In all, 36 studies examined prevalent stroke (1.9 million participants), and 12 studies examined incident stroke (1.3 million participants). The studies were conducted in America, Europe, Asia, and Australia and included more than three million participants. Follow-up periods ranged from nine months to 25 years.
Stroke Affected Dementia Risk
When the researchers pooled results from 22 cohorts of participants who were cognitively normal at baseline, they found that those with prevalent stroke had a higher adjusted risk of incident dementia, compared with those without stroke (hazard ratio [HR], 1.69). Sensitivity analyses did not change the results significantly. Prevalent stroke was associated with a higher risk of incident dementia among men than among women. Sex explained 50.2% of heterogeneity between studies for prevalent stroke.
After combining the adjusted results from eight studies, Dr. Llewellyn and colleagues found that incident stroke more than doubled the risk of incident all-cause dementia, compared with no incident stroke (risk ratio [RR], 2.18). For a sensitivity analysis, the investigators excluded three studies that combined stroke with transient ischemic attack; this adjustment strengthened the association.
The study’s strengths include the investigators’ search of several major databases and their contacts with authors who provided relevant data. The analysis reflects the limitations of the original studies, however. These limitations include selective samples and differences in stroke assessment and dementia diagnosis criteria. In addition, dementia may develop years before it is diagnosed. “More detailed reporting of the interval between stroke occurrence and dementia diagnosis in future studies will help to better characterize the role of time since stroke in the risk of dementia,” said Dr. Llewellyn.
—Erik Greb
Kuz´ma E, Lourida I, Moore SF, et al. Stroke and dementia risk: a systematic review and meta-analysis. Alzheimers Dement. 2018 Aug 25 [Epub ahead of print].
Protecting the blood supply to the brain could reduce the risk of incident dementia.
Protecting the blood supply to the brain could reduce the risk of incident dementia.
Stroke is a strong independent risk factor for all-cause dementia, according to research published online ahead of print August 25 in Alzheimer’s & Dementia. Clinicians should incorporate stroke-prevention strategies into their health interventions to reduce patients’ risk of dementia, said the authors.
“Around a third of dementia cases are thought to be potentially preventable, though this estimate does not take into account the risk associated with stroke,” said David Llewellyn, PhD, Senior Research Fellow at University of Exeter Medical School in the United Kingdom. “Our findings indicate that this figure could be even higher and reinforce the importance of protecting the blood supply to the brain when attempting to reduce the global burden of dementia.”
Meta-Analysis of Previous Research
Stroke is a recognized risk factor for all-cause dementia, but no researchers had previously performed a meta-analysis to quantify the risk. Dr. Llewellyn and colleagues searched Medline, PsycINFO, and Embase databases for prospective studies that investigated the association between prevalent or incident stroke and incident all-cause dementia. They excluded studies that lacked a comparison group or that had a comparison group other than a stroke-free group. The investigators pooled adjusted estimates across studies using random effects meta-analysis and evaluated potential effect modifiers with meta-regression.
Dr. Llewellyn and colleagues identified 11,129 articles, 26 of which were eligible for analysis. They also included 16 studies from a previous systematic review and four studies identified through backward and forward citation searches. In all, 36 studies examined prevalent stroke (1.9 million participants), and 12 studies examined incident stroke (1.3 million participants). The studies were conducted in America, Europe, Asia, and Australia and included more than three million participants. Follow-up periods ranged from nine months to 25 years.
Stroke Affected Dementia Risk
When the researchers pooled results from 22 cohorts of participants who were cognitively normal at baseline, they found that those with prevalent stroke had a higher adjusted risk of incident dementia, compared with those without stroke (hazard ratio [HR], 1.69). Sensitivity analyses did not change the results significantly. Prevalent stroke was associated with a higher risk of incident dementia among men than among women. Sex explained 50.2% of heterogeneity between studies for prevalent stroke.
After combining the adjusted results from eight studies, Dr. Llewellyn and colleagues found that incident stroke more than doubled the risk of incident all-cause dementia, compared with no incident stroke (risk ratio [RR], 2.18). For a sensitivity analysis, the investigators excluded three studies that combined stroke with transient ischemic attack; this adjustment strengthened the association.
The study’s strengths include the investigators’ search of several major databases and their contacts with authors who provided relevant data. The analysis reflects the limitations of the original studies, however. These limitations include selective samples and differences in stroke assessment and dementia diagnosis criteria. In addition, dementia may develop years before it is diagnosed. “More detailed reporting of the interval between stroke occurrence and dementia diagnosis in future studies will help to better characterize the role of time since stroke in the risk of dementia,” said Dr. Llewellyn.
—Erik Greb
Kuz´ma E, Lourida I, Moore SF, et al. Stroke and dementia risk: a systematic review and meta-analysis. Alzheimers Dement. 2018 Aug 25 [Epub ahead of print].
Adult-Onset Still Disease: Persistent Pruritic Papular Rash With Unique Histopathologic Findings
Adult-onset Still disease (AOSD) is a systemic inflammatory condition that clinically manifests as spiking fevers, arthralgia, evanescent skin rash, and lymphadenopathy. 1 The most commonly used criteria for diagnosing AOSD are the Yamaguchi criteria. 2 The major criteria include high fever for more than 1 week, arthralgia for more than 2 weeks, leukocytosis, and an evanescent skin rash. The minor criteria consist of sore throat, lymphadenopathy and/or splenomegaly, liver dysfunction, and negative rheumatoid factor and antinuclear antibodies. Classically, the skin rash is described as an evanescent, salmon-colored erythema involving the extremities. Nevertheless, unusual cutaneous eruptions have been reported in AOSD, including persistent pruritic papules and plaques. 3 Importantly, this atypical rash demonstrates specific histologic findings that are not found on routine histopathology of a typical evanescent rash. We describe 2 patients with this atypical cutaneous eruption along with the unique histopathologic findings of AOSD.
Case Reports
Patient 1
A 23-year-old Chinese woman presented with periodic fevers, persistent rash, and joint pain of 2 years’ duration. Her medical history included splenectomy for hepatosplenomegaly as well as evaluation by hematology for lymphadenopathy; a cervical lymph node biopsy showed lymphoid and follicular hyperplasia.
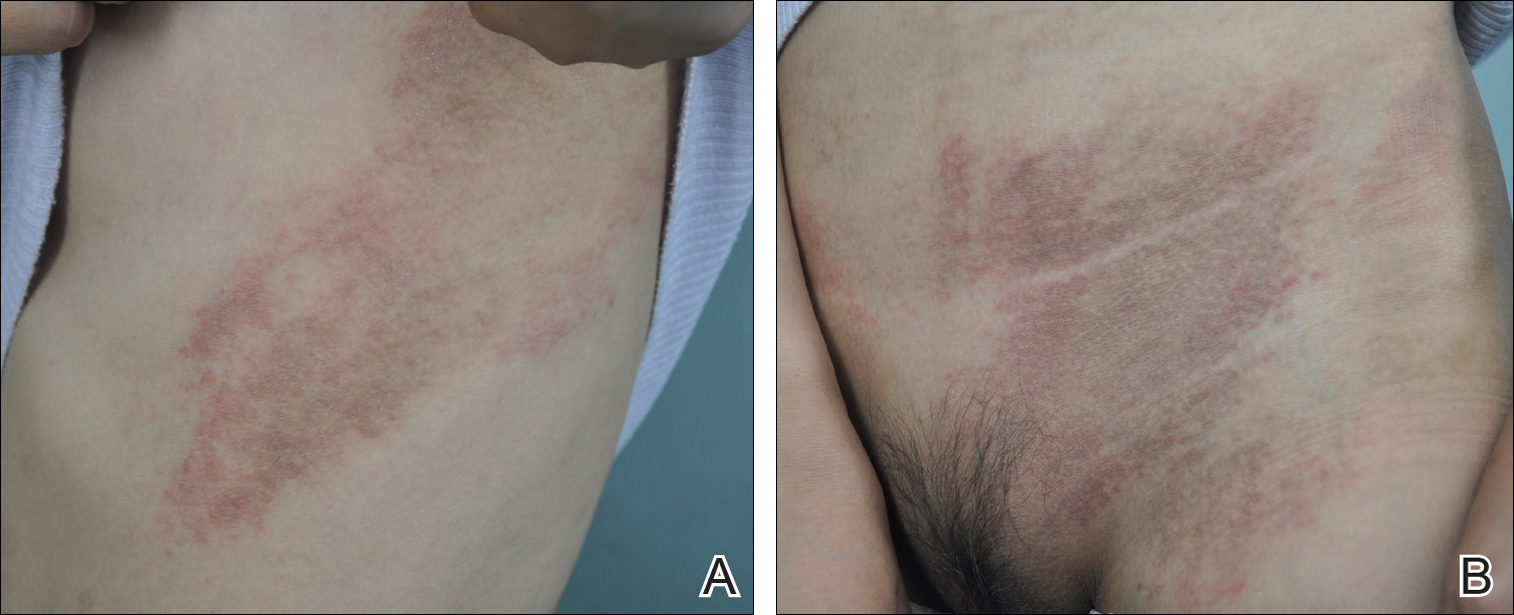
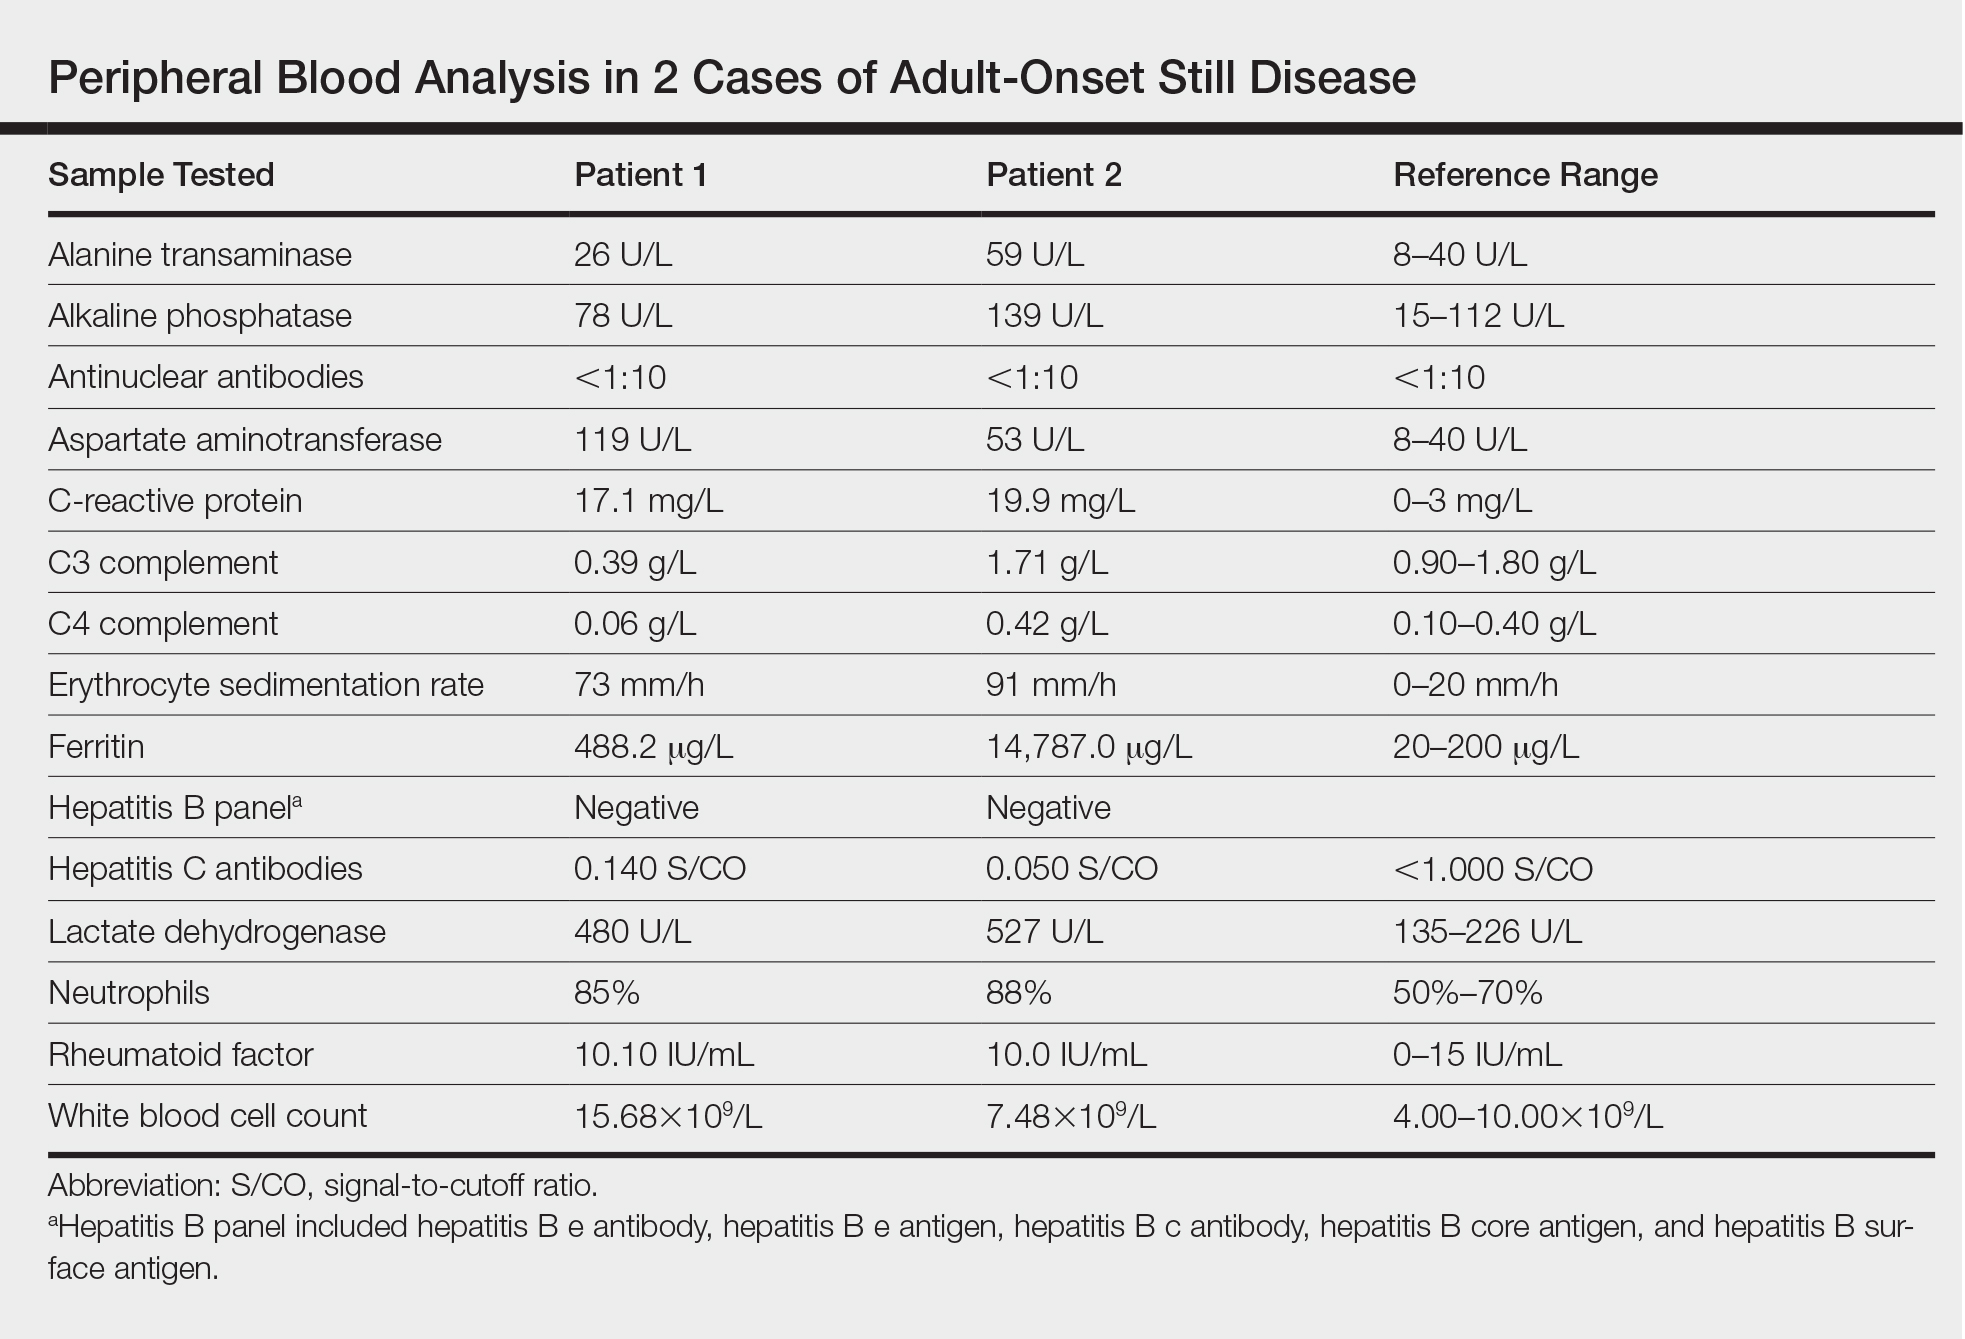
Twenty days later, the patient was referred to the dermatology department for evaluation of the persistent rash. The patient described a history of flushing of the face, severe joint pain in both arms and legs, aching muscles, and persistent sore throat. The patient did not report any history of drug ingestion. Physical examination revealed a fever (temperature, 39.2°C); swollen nontender lymph nodes in the neck, axillae, and groin; and salmon-colored and hyperpigmented patches and thin plaques over the neck, chest, abdomen, and arms (Figure 1). A splenectomy scar also was noted. Peripheral blood was collected for laboratory analyses, which revealed transaminitis and moderate hyperferritinemia (Table). An autoimmune panel was negative for rheumatoid factor, antinuclear antibodies, and antineutrophil cytoplasmic antibodies. The patient was admitted to the hospital, and a skin biopsy was performed. Histology showed superficial dyskeratotic keratinocytes and sparse perivascular infiltration of neutrophils in the upper dermis (Figure 2).
The patient was diagnosed with AOSD based on fulfillment of the Yamaguchi criteria.2 She was treated with methylprednisolone 60 mg daily and was discharged 14 days later. At 16-month follow-up, the patient demonstrated complete resolution of symptoms with a maintenance dose of prednisolone (7.5 mg daily).
Patient 2
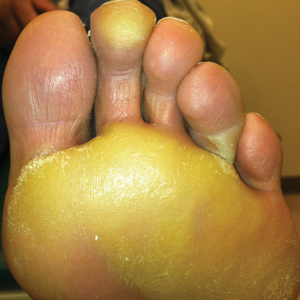
A 23-year-old black woman presented to the emergency department 3 months postpartum with recurrent high fevers, worsening joint pain, and persistent itchy rash of 2 months’ duration. The patient had no history of travel, autoimmune disease, or sick contacts. She occasionally took aspirin for joint pain. Physical examination revealed a fever (temperature, 39.1°C) along with hyperpigmented patches and thin scaly hyperpigmented papules coalescing into a poorly demarcated V-shaped plaque on the upper back and posterior neck, extending to the chest in a shawl-like distribution (Figure 3). Submental lymphadenopathy was present. The spleen was not palpable.
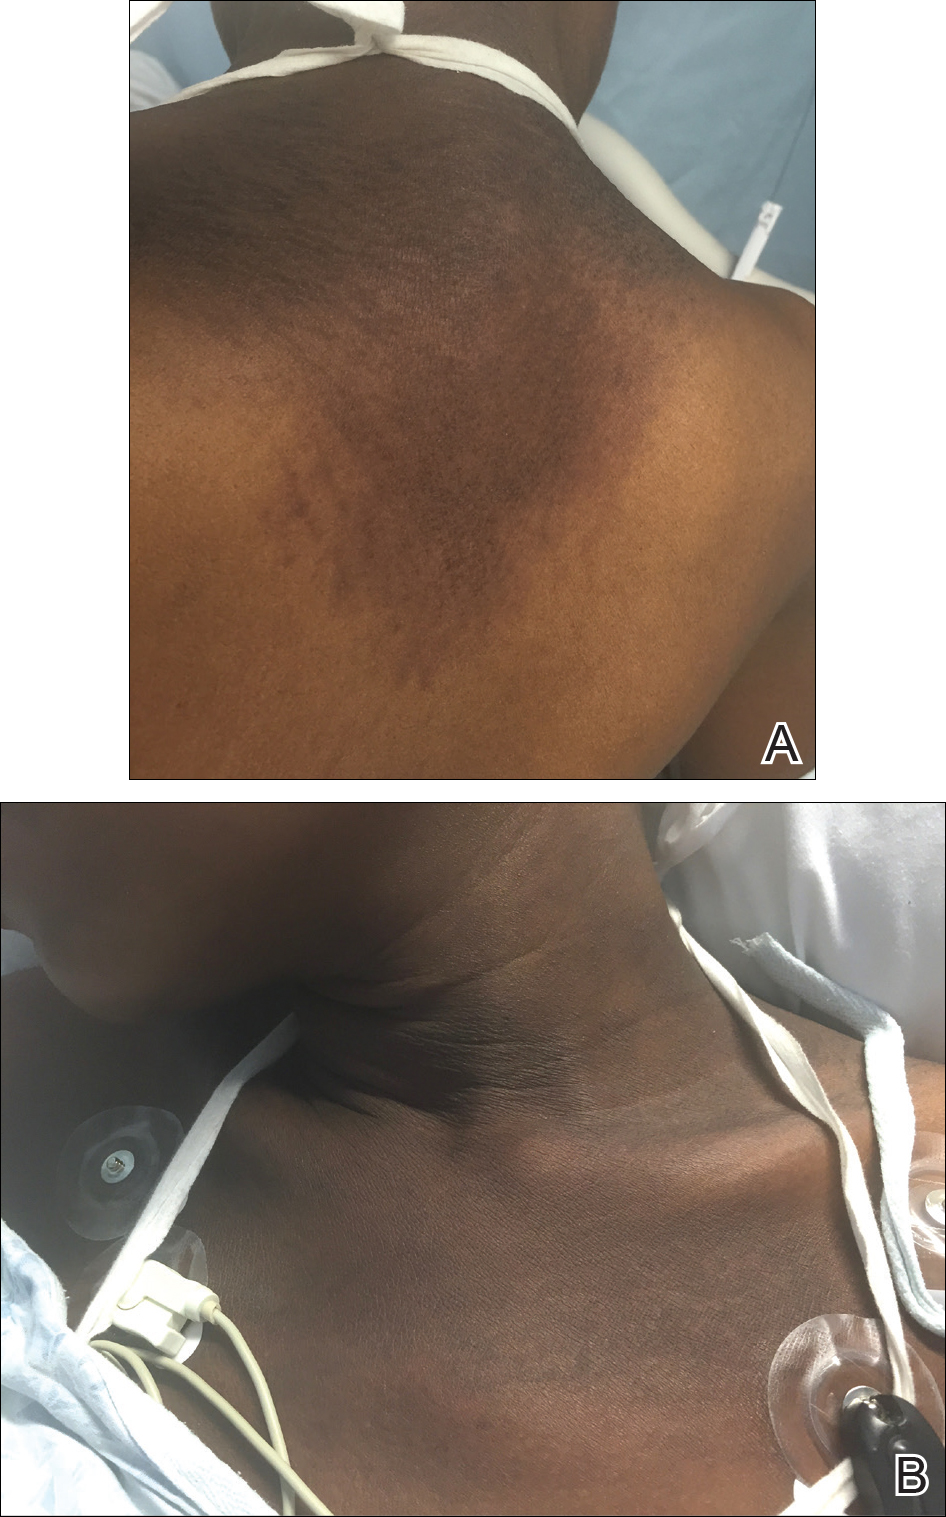
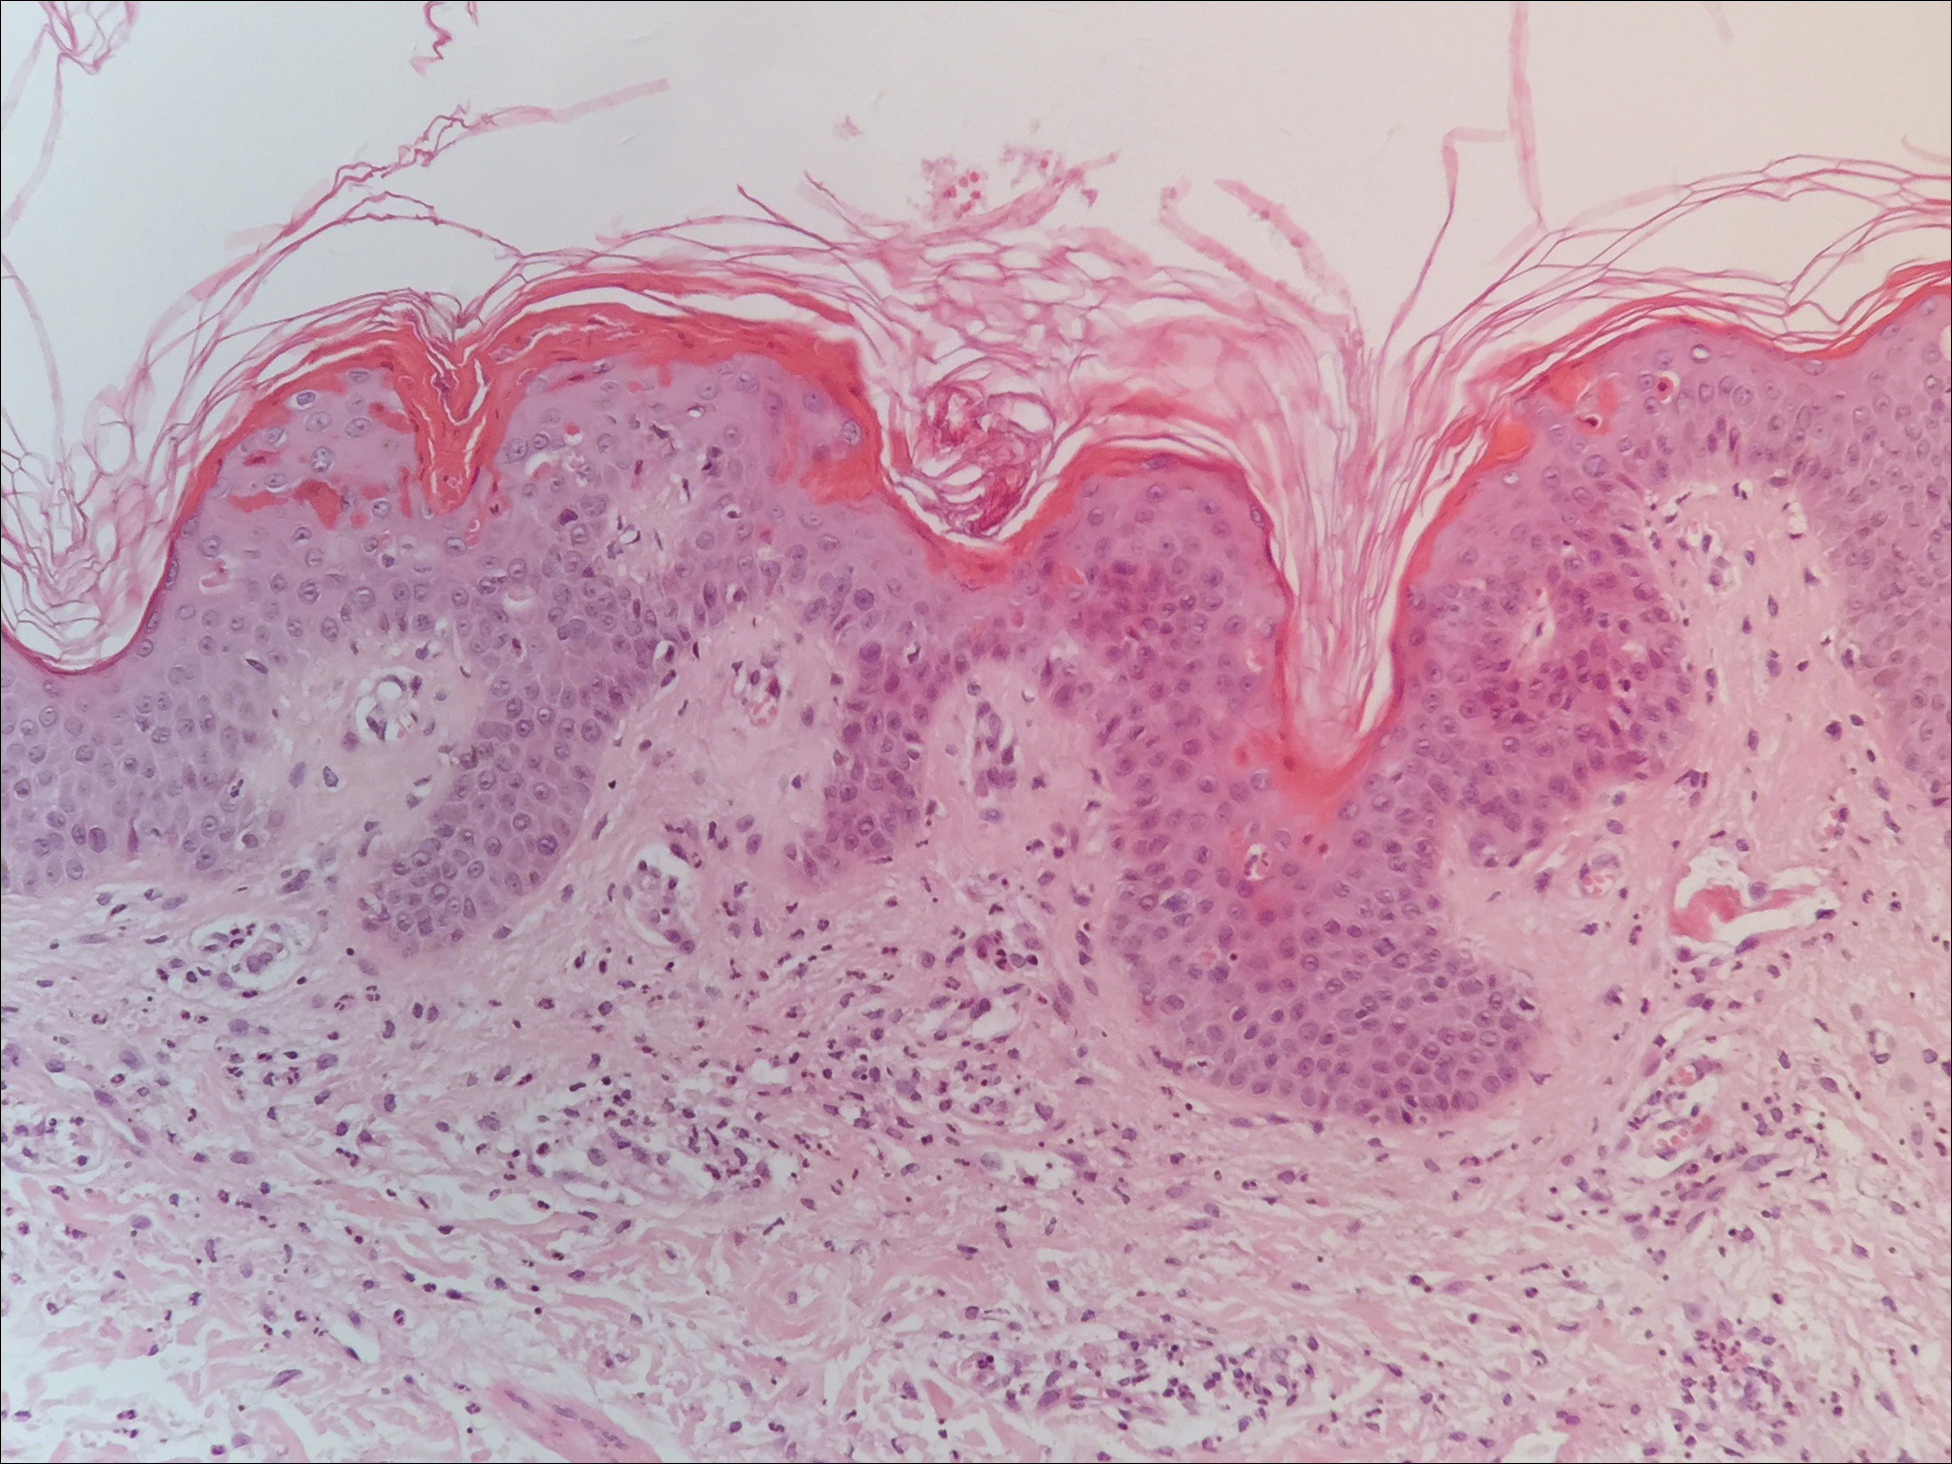
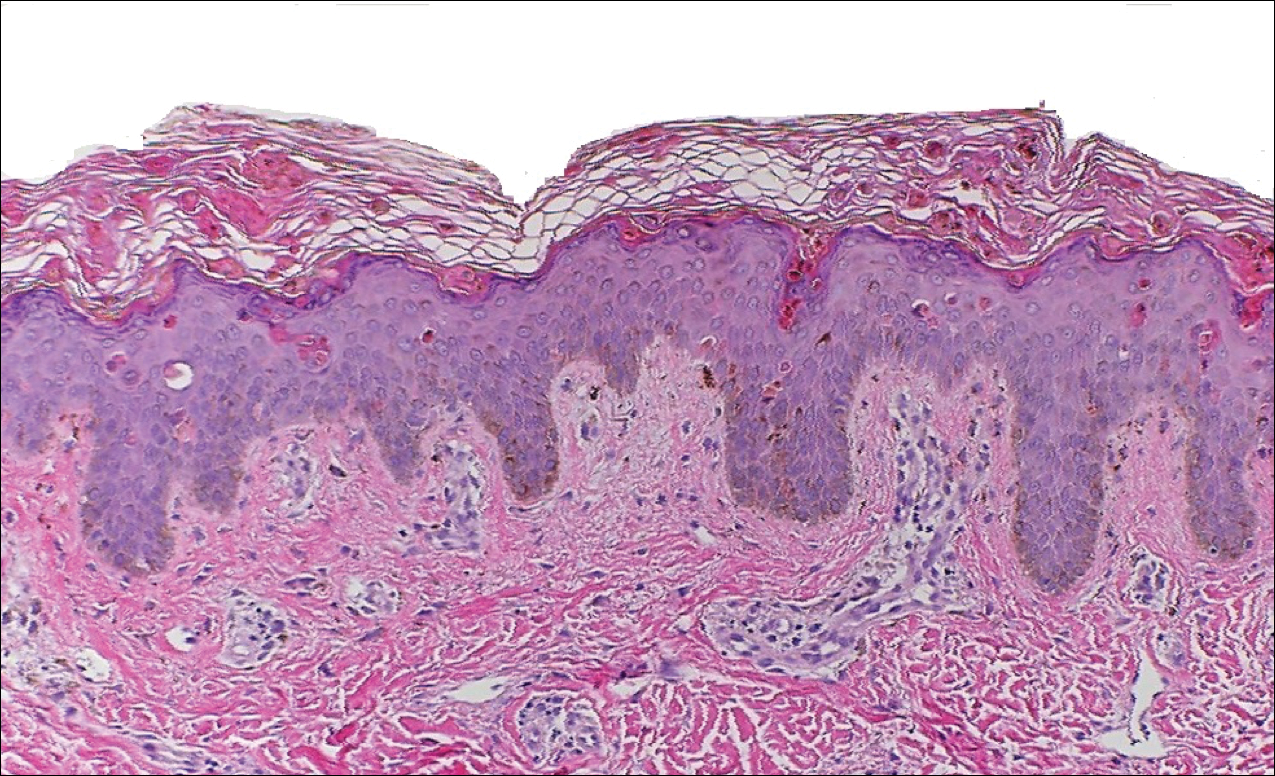
Peripheral blood was collected for laboratory analysis and demonstrated transaminitis and a markedly high ferritin level (Table). An autoimmune panel was negative for rheumatoid factor, antinuclear antibodies, and antineutrophil cytoplasmic antibodies. Skin biopsy was performed and demonstrated many necrotic keratinocytes, singly and in aggregates, distributed from the spinous layer to the stratum corneum. A neutrophilic infiltrate was present in the papillary dermis (Figure 4).
The patient met the Yamaguchi criteria and was subsequently diagnosed with AOSD. She was treated with intravenous methylprednisolone 20 mg every 8 hours and was discharged 1 week later on oral prednisone 60 mg daily to be tapered over a period of months. At 2-week follow-up, the patient continued to experience rash and joint pain; oral methotrexate 10 mg weekly was added to her regimen, as well as vitamin D, calcium, and folic acid supplementation. At the next 2-week follow-up the patient noted improvement in the rash as well as the joint pain, but both still persisted. Prednisone was decreased to 50 mg daily and methotrexate was increased to 15 mg weekly. The patient continued to show improvement over the subsequent 3 months, during which prednisone was tapered to 10 mg daily and methotrexate was increased to 20 mg weekly. The patient showed resolution of symptoms at 3-month follow-up on this regimen, with plans to continue the prednisone taper and maintain methotrexate dosing.
Comment
Adult-onset Still disease is a systemic inflammatory condition that clinically manifests as spiking fevers, arthralgia, salmon-pink evanescent erythema, and lymphadenopathy.2 The condition also can cause liver dysfunction, splenomegaly, pericarditis, pleuritis, renal dysfunction, and a reactive hemophagocytic syndrome.1 Furthermore, one review of the literature described an association with delayed-onset malignancy.4 Early diagnosis is important yet challenging, as AOSD is a diagnosis of exclusion. The Yamaguchi criteria are the most widely used method of diagnosis and demonstrate more than 90% sensitivity.In addition to the Yamaguchi criteria, marked hyperferritinemia is characteristic of AOSD and can act as an indicator of disease activity.5 Interestingly, both of our patients had elevated ferritin levels, with patient 2 showing marked elevation (Table). In both patients, all major criteria were fulfilled, except the typical skin rash.
The skin rash in AOSD, classically consisting of an evanescent, salmon-pink erythema predominantly involving the extremities, has been observed in up to 87% of AOSD patients.5 The histology of the typical evanescent rash is nonspecific, characterized by a relatively sparse, perivascular, mixed inflammatory infiltrate. Notably, other skin manifestations may be found in patients with AOSD.1,2,5-16 Persistent pruritic papules and plaques are the most commonly reported nonclassical rash, presenting as erythematous, slightly scaly papules and plaques with a linear configuration typically on the trunk.2 Both of our patients presented with this atypical eruption. Importantly, the histopathology of this unique rash displays distinctive features, which can aid in early diagnosis. Findings include dyskeratotic keratinocytes in the cornified layers as well as in the epidermis, and a sparse neutrophilic and/or lymphocytic infiltrate in the papillary dermis without vasculitis. These findings were evident in both histopathologic studies of our patients (Figures 2 and 4). Although not present in our patients, dermal mucin deposition has been demonstrated in some reports.1,13,15
A 2015 review of the literature yielded 30 cases of AOSD with pruritic persistent papules and plaques.4 The study confirmed a linear, erythematous or brown rash on the back and neck in the majority of cases. Histologic findings were congruent with those reported in our 2 cases: necrotic keratinocytes in the upper epidermis with a neutrophilic infiltrate in the upper dermis without vasculitis. Most patients showed rapid resolution of the rash and symptoms with the use of prednisone, prednisolone, or intravenous pulsed methylprednisolone. Interestingly, a range of presentations were noted, including prurigo pigmentosalike urticarial papules; lichenoid papules; and dermatographismlike, dermatomyositislike, and lichen amyloidosis–like rashes.4 In our report, patient 2 presented with a rash in a dermat-omyositislike shawl distribution. It has been suggested that patients with dermatomyositislike rashes require more potent immunotherapy as compared to patients with other rash morphologies.4 The need for methotrexate in addition to a prednisone taper in the clinical course of patient 2 lends further support to this observation.
Conclusion
A clinically and pathologically distinct form of cutaneous disease—AOSD with persistent pruritic papules and plaques—was observed in our 2 patients. These histopathologic findings facilitated timely diagnosis in both patients. A range of clinical morphologies may exist in AOSD, an awareness of which is paramount. Adult-onset Still disease should be included in the differential diagnosis of a dermatomyositislike presentation in a shawl distribution. Prompt diagnosis is essential to ensure adequate therapy.
- Yamamoto T. Cutaneous manifestations associated with adult-onset Still’s disease: important diagnostic values. Rheumatol Int. 2012;32:2233-2237.
- Yamaguchi M, Ohta A, Tsunematsu T, et al. Preliminary criteria for classification of adult Still’s disease. J Rheumatol. 1992;19:424-431.
- Lee JY, Yang CC, Hsu MM. Histopathology of persistent papules and plaques in adult-onset Still’s disease. J Am Acad Dermatol. 2005;52:1003-1008.
- Sun NZ, Brezinski EA, Berliner J, et al. Updates in adult-onset Still disease: atypical cutaneous manifestations and associates with delayed malignancy [published online June 6, 2015]. J Am Acad Dermatol. 2015;73:294-303.
- Schwarz-Eywill M, Heilig B, Bauer H, et al. Evaluation of serum ferritin as a marker for adult Still’s disease activity. Ann Rheum Dis. 1992;51:683-685.
- Ohta A, Yamaguchi M, Tsunematsu T, et al. Adult Still’s disease: a multicenter survey of Japanese patients. J Rheumatol. 1990;17:1058-1063.
- Kaur S, Bambery P, Dhar S. Persistent dermal plaque lesions in adult onset Still’s disease. Dermatology. 1994;188:241-242.
- Lübbe J, Hofer M, Chavaz P, et al. Adult onset Still’s disease with persistent plaques. Br J Dermatol. 1999;141:710-713.
- Suzuki K, Kimura Y, Aoki M, et al. Persistent plaques and linear pigmentation in adult-onset Still’s disease. Dermatology. 2001;202:333-335.
- Fujii K, Konishi K, Kanno Y, et al. Persistent generalized erythema in adult-onset Still’s disease. Int J Dermatol. 2003;42:824-825.
- Thien Huong NT, Pitche P, Minh Hoa T, et al. Persistent pigmented plaques in adult-onset Still’s disease. Ann Dermatol Venereol. 2005;132:693-696.
- Lee JY, Yang CC, Hsu MM. Histopathology of persistent papules and plaques in adult-onset Still’s disease. J Am Acad Dermatol. 2005;52:1003-1008.
- Wolgamot G, Yoo J, Hurst S, et al. Unique histopathologic findings in a patient with adult-onset Still’s disease. Am J Dermatopathol. 2007;49:194-196.
- Fortna RR, Gudjonsson JE, Seidel G, et al. Persistent pruritic papules and plaques: a characteristic histopathologic presentation seen in a subset of patients with adult-onset and juvenile Still’s disease. J Cutan Pathol. 2010;37:932-937.
- Yang CC, Lee JY, Liu MF, et al. Adult-onset Still’s disease with persistent skin eruption and fatal respiratory failure in a Taiwanese woman. Eur J Dermatol. 2006;16:593-594.
- Azeck AG, Littlewood SM. Adult-onset Still’s disease with atypical cutaneous features. J Eur Acad Dermatol Venereol. 2005;19:360-363.
Adult-onset Still disease (AOSD) is a systemic inflammatory condition that clinically manifests as spiking fevers, arthralgia, evanescent skin rash, and lymphadenopathy. 1 The most commonly used criteria for diagnosing AOSD are the Yamaguchi criteria. 2 The major criteria include high fever for more than 1 week, arthralgia for more than 2 weeks, leukocytosis, and an evanescent skin rash. The minor criteria consist of sore throat, lymphadenopathy and/or splenomegaly, liver dysfunction, and negative rheumatoid factor and antinuclear antibodies. Classically, the skin rash is described as an evanescent, salmon-colored erythema involving the extremities. Nevertheless, unusual cutaneous eruptions have been reported in AOSD, including persistent pruritic papules and plaques. 3 Importantly, this atypical rash demonstrates specific histologic findings that are not found on routine histopathology of a typical evanescent rash. We describe 2 patients with this atypical cutaneous eruption along with the unique histopathologic findings of AOSD.
Case Reports
Patient 1
A 23-year-old Chinese woman presented with periodic fevers, persistent rash, and joint pain of 2 years’ duration. Her medical history included splenectomy for hepatosplenomegaly as well as evaluation by hematology for lymphadenopathy; a cervical lymph node biopsy showed lymphoid and follicular hyperplasia.
Twenty days later, the patient was referred to the dermatology department for evaluation of the persistent rash. The patient described a history of flushing of the face, severe joint pain in both arms and legs, aching muscles, and persistent sore throat. The patient did not report any history of drug ingestion. Physical examination revealed a fever (temperature, 39.2°C); swollen nontender lymph nodes in the neck, axillae, and groin; and salmon-colored and hyperpigmented patches and thin plaques over the neck, chest, abdomen, and arms (Figure 1). A splenectomy scar also was noted. Peripheral blood was collected for laboratory analyses, which revealed transaminitis and moderate hyperferritinemia (Table). An autoimmune panel was negative for rheumatoid factor, antinuclear antibodies, and antineutrophil cytoplasmic antibodies. The patient was admitted to the hospital, and a skin biopsy was performed. Histology showed superficial dyskeratotic keratinocytes and sparse perivascular infiltration of neutrophils in the upper dermis (Figure 2).
The patient was diagnosed with AOSD based on fulfillment of the Yamaguchi criteria.2 She was treated with methylprednisolone 60 mg daily and was discharged 14 days later. At 16-month follow-up, the patient demonstrated complete resolution of symptoms with a maintenance dose of prednisolone (7.5 mg daily).
Patient 2
A 23-year-old black woman presented to the emergency department 3 months postpartum with recurrent high fevers, worsening joint pain, and persistent itchy rash of 2 months’ duration. The patient had no history of travel, autoimmune disease, or sick contacts. She occasionally took aspirin for joint pain. Physical examination revealed a fever (temperature, 39.1°C) along with hyperpigmented patches and thin scaly hyperpigmented papules coalescing into a poorly demarcated V-shaped plaque on the upper back and posterior neck, extending to the chest in a shawl-like distribution (Figure 3). Submental lymphadenopathy was present. The spleen was not palpable.
Peripheral blood was collected for laboratory analysis and demonstrated transaminitis and a markedly high ferritin level (Table). An autoimmune panel was negative for rheumatoid factor, antinuclear antibodies, and antineutrophil cytoplasmic antibodies. Skin biopsy was performed and demonstrated many necrotic keratinocytes, singly and in aggregates, distributed from the spinous layer to the stratum corneum. A neutrophilic infiltrate was present in the papillary dermis (Figure 4).
The patient met the Yamaguchi criteria and was subsequently diagnosed with AOSD. She was treated with intravenous methylprednisolone 20 mg every 8 hours and was discharged 1 week later on oral prednisone 60 mg daily to be tapered over a period of months. At 2-week follow-up, the patient continued to experience rash and joint pain; oral methotrexate 10 mg weekly was added to her regimen, as well as vitamin D, calcium, and folic acid supplementation. At the next 2-week follow-up the patient noted improvement in the rash as well as the joint pain, but both still persisted. Prednisone was decreased to 50 mg daily and methotrexate was increased to 15 mg weekly. The patient continued to show improvement over the subsequent 3 months, during which prednisone was tapered to 10 mg daily and methotrexate was increased to 20 mg weekly. The patient showed resolution of symptoms at 3-month follow-up on this regimen, with plans to continue the prednisone taper and maintain methotrexate dosing.
Comment
Adult-onset Still disease is a systemic inflammatory condition that clinically manifests as spiking fevers, arthralgia, salmon-pink evanescent erythema, and lymphadenopathy.2 The condition also can cause liver dysfunction, splenomegaly, pericarditis, pleuritis, renal dysfunction, and a reactive hemophagocytic syndrome.1 Furthermore, one review of the literature described an association with delayed-onset malignancy.4 Early diagnosis is important yet challenging, as AOSD is a diagnosis of exclusion. The Yamaguchi criteria are the most widely used method of diagnosis and demonstrate more than 90% sensitivity.In addition to the Yamaguchi criteria, marked hyperferritinemia is characteristic of AOSD and can act as an indicator of disease activity.5 Interestingly, both of our patients had elevated ferritin levels, with patient 2 showing marked elevation (Table). In both patients, all major criteria were fulfilled, except the typical skin rash.
The skin rash in AOSD, classically consisting of an evanescent, salmon-pink erythema predominantly involving the extremities, has been observed in up to 87% of AOSD patients.5 The histology of the typical evanescent rash is nonspecific, characterized by a relatively sparse, perivascular, mixed inflammatory infiltrate. Notably, other skin manifestations may be found in patients with AOSD.1,2,5-16 Persistent pruritic papules and plaques are the most commonly reported nonclassical rash, presenting as erythematous, slightly scaly papules and plaques with a linear configuration typically on the trunk.2 Both of our patients presented with this atypical eruption. Importantly, the histopathology of this unique rash displays distinctive features, which can aid in early diagnosis. Findings include dyskeratotic keratinocytes in the cornified layers as well as in the epidermis, and a sparse neutrophilic and/or lymphocytic infiltrate in the papillary dermis without vasculitis. These findings were evident in both histopathologic studies of our patients (Figures 2 and 4). Although not present in our patients, dermal mucin deposition has been demonstrated in some reports.1,13,15
A 2015 review of the literature yielded 30 cases of AOSD with pruritic persistent papules and plaques.4 The study confirmed a linear, erythematous or brown rash on the back and neck in the majority of cases. Histologic findings were congruent with those reported in our 2 cases: necrotic keratinocytes in the upper epidermis with a neutrophilic infiltrate in the upper dermis without vasculitis. Most patients showed rapid resolution of the rash and symptoms with the use of prednisone, prednisolone, or intravenous pulsed methylprednisolone. Interestingly, a range of presentations were noted, including prurigo pigmentosalike urticarial papules; lichenoid papules; and dermatographismlike, dermatomyositislike, and lichen amyloidosis–like rashes.4 In our report, patient 2 presented with a rash in a dermat-omyositislike shawl distribution. It has been suggested that patients with dermatomyositislike rashes require more potent immunotherapy as compared to patients with other rash morphologies.4 The need for methotrexate in addition to a prednisone taper in the clinical course of patient 2 lends further support to this observation.
Conclusion
A clinically and pathologically distinct form of cutaneous disease—AOSD with persistent pruritic papules and plaques—was observed in our 2 patients. These histopathologic findings facilitated timely diagnosis in both patients. A range of clinical morphologies may exist in AOSD, an awareness of which is paramount. Adult-onset Still disease should be included in the differential diagnosis of a dermatomyositislike presentation in a shawl distribution. Prompt diagnosis is essential to ensure adequate therapy.
- Yamamoto T. Cutaneous manifestations associated with adult-onset Still’s disease: important diagnostic values. Rheumatol Int. 2012;32:2233-2237.
- Yamaguchi M, Ohta A, Tsunematsu T, et al. Preliminary criteria for classification of adult Still’s disease. J Rheumatol. 1992;19:424-431.
- Lee JY, Yang CC, Hsu MM. Histopathology of persistent papules and plaques in adult-onset Still’s disease. J Am Acad Dermatol. 2005;52:1003-1008.
- Sun NZ, Brezinski EA, Berliner J, et al. Updates in adult-onset Still disease: atypical cutaneous manifestations and associates with delayed malignancy [published online June 6, 2015]. J Am Acad Dermatol. 2015;73:294-303.
- Schwarz-Eywill M, Heilig B, Bauer H, et al. Evaluation of serum ferritin as a marker for adult Still’s disease activity. Ann Rheum Dis. 1992;51:683-685.
- Ohta A, Yamaguchi M, Tsunematsu T, et al. Adult Still’s disease: a multicenter survey of Japanese patients. J Rheumatol. 1990;17:1058-1063.
- Kaur S, Bambery P, Dhar S. Persistent dermal plaque lesions in adult onset Still’s disease. Dermatology. 1994;188:241-242.
- Lübbe J, Hofer M, Chavaz P, et al. Adult onset Still’s disease with persistent plaques. Br J Dermatol. 1999;141:710-713.
- Suzuki K, Kimura Y, Aoki M, et al. Persistent plaques and linear pigmentation in adult-onset Still’s disease. Dermatology. 2001;202:333-335.
- Fujii K, Konishi K, Kanno Y, et al. Persistent generalized erythema in adult-onset Still’s disease. Int J Dermatol. 2003;42:824-825.
- Thien Huong NT, Pitche P, Minh Hoa T, et al. Persistent pigmented plaques in adult-onset Still’s disease. Ann Dermatol Venereol. 2005;132:693-696.
- Lee JY, Yang CC, Hsu MM. Histopathology of persistent papules and plaques in adult-onset Still’s disease. J Am Acad Dermatol. 2005;52:1003-1008.
- Wolgamot G, Yoo J, Hurst S, et al. Unique histopathologic findings in a patient with adult-onset Still’s disease. Am J Dermatopathol. 2007;49:194-196.
- Fortna RR, Gudjonsson JE, Seidel G, et al. Persistent pruritic papules and plaques: a characteristic histopathologic presentation seen in a subset of patients with adult-onset and juvenile Still’s disease. J Cutan Pathol. 2010;37:932-937.
- Yang CC, Lee JY, Liu MF, et al. Adult-onset Still’s disease with persistent skin eruption and fatal respiratory failure in a Taiwanese woman. Eur J Dermatol. 2006;16:593-594.
- Azeck AG, Littlewood SM. Adult-onset Still’s disease with atypical cutaneous features. J Eur Acad Dermatol Venereol. 2005;19:360-363.
Practice Points
- Serologic testing and skin biopsy are necessary in the timely and appropriate diagnosis of adult-onset Still disease (AOSD).
- In patients with a persistent pruritic papular rash, consider AOSD if there is a supporting history.
- Skin biopsy is diagnostic of AOSD with the unique histopathologic findings of dyskeratotic keratinocytes in the cornified layers as well as in the epidermis and a sparse neutrophilic and/or lymphocytic infiltrate in the papillary dermis without vasculitis.
New System Classifies Idiopathic Inflammatory Myopathies
A clinical and serologic approach to identifying these disorders may eliminate the need for muscle biopsy.
A new system that incorporates clinical and serologic data may help classify idiopathic inflammatory myopathies, according to an analysis published online ahead of print September 10 in JAMA Neurology.
By analyzing the patterns of relationships between 47 variables in this observational, retrospective cohort study, investigators identified four clusters of patients that corresponded to known subtypes of idiopathic inflammatory myopathy. Myositis-specific autoantibodies played a key role in predicting whether a patient belonged in a given cluster, according to the investigators. Myositis-specific antibodies known to be associated with certain subgroups were observed in the corresponding clusters that the researchers identified.
“This [finding] emphasizes that muscle biopsy may no longer be necessary for diagnosis of idiopathic inflammatory myopathies in patients with myositis-specific antibodies and corresponding phenotypes,” said Kubéraka Mariampillai, PhD, of the Université Pierre et Marie Curie, Institut National de la Santé et de la Recherche Médicale (INSERM) in Paris, and colleagues.
The study was based on data for 260 patients in the database of the French Myositis Network. Patients’ mean age was 60, and 63% were women.
Investigators conducted a multiple correspondence analysis based on 47 selected variables, including age, ethnicity, historical and recent diagnoses, dermatologic changes, creatine kinase levels, myositis-specific antibodies, and pathologic characteristics. They identified four subgroups of patients corresponding to dermatomyositis, inclusion body myositis, immune-mediated necrotizing myopathy, and antisynthetase syndrome.
Using decisional algorithm trees, investigators found that the pathologic data were “dispensable,” said the authors. The best tree omitted variables related to muscle biopsy and had a 78% correct estimation based on antisynthetase syndrome antibodies, dermatomyositis rash, and finger flexor scores of 3 or less, said the investigators. “The classification quality of the tree was appreciated on the basis of all classification criteria, with an overall sensitivity of 77.0% and a specificity of 92.0%.”
Patients with polymyositis were included in the study, but were grouped mainly in the clusters corresponding to immune-mediated necrotizing myopathy and antisynthetase syndrome. “This finding indicates that patients with polymyositis do not represent a subgroup of patients, and use of this term should probably be discontinued,” Dr. Mariampillai and colleagues concluded.
—Andrew D. Bowser
Mariampillai K, Granger B, Amelin D, et al. Development of a new classification system for idiopathic inflammatory myopathies based on clinical manifestations and myositis-specific autoantibodies. JAMA Neurol. 2018 Sep 10 [Epub ahead of print].
A clinical and serologic approach to identifying these disorders may eliminate the need for muscle biopsy.
A clinical and serologic approach to identifying these disorders may eliminate the need for muscle biopsy.
A new system that incorporates clinical and serologic data may help classify idiopathic inflammatory myopathies, according to an analysis published online ahead of print September 10 in JAMA Neurology.
By analyzing the patterns of relationships between 47 variables in this observational, retrospective cohort study, investigators identified four clusters of patients that corresponded to known subtypes of idiopathic inflammatory myopathy. Myositis-specific autoantibodies played a key role in predicting whether a patient belonged in a given cluster, according to the investigators. Myositis-specific antibodies known to be associated with certain subgroups were observed in the corresponding clusters that the researchers identified.
“This [finding] emphasizes that muscle biopsy may no longer be necessary for diagnosis of idiopathic inflammatory myopathies in patients with myositis-specific antibodies and corresponding phenotypes,” said Kubéraka Mariampillai, PhD, of the Université Pierre et Marie Curie, Institut National de la Santé et de la Recherche Médicale (INSERM) in Paris, and colleagues.
The study was based on data for 260 patients in the database of the French Myositis Network. Patients’ mean age was 60, and 63% were women.
Investigators conducted a multiple correspondence analysis based on 47 selected variables, including age, ethnicity, historical and recent diagnoses, dermatologic changes, creatine kinase levels, myositis-specific antibodies, and pathologic characteristics. They identified four subgroups of patients corresponding to dermatomyositis, inclusion body myositis, immune-mediated necrotizing myopathy, and antisynthetase syndrome.
Using decisional algorithm trees, investigators found that the pathologic data were “dispensable,” said the authors. The best tree omitted variables related to muscle biopsy and had a 78% correct estimation based on antisynthetase syndrome antibodies, dermatomyositis rash, and finger flexor scores of 3 or less, said the investigators. “The classification quality of the tree was appreciated on the basis of all classification criteria, with an overall sensitivity of 77.0% and a specificity of 92.0%.”
Patients with polymyositis were included in the study, but were grouped mainly in the clusters corresponding to immune-mediated necrotizing myopathy and antisynthetase syndrome. “This finding indicates that patients with polymyositis do not represent a subgroup of patients, and use of this term should probably be discontinued,” Dr. Mariampillai and colleagues concluded.
—Andrew D. Bowser
Mariampillai K, Granger B, Amelin D, et al. Development of a new classification system for idiopathic inflammatory myopathies based on clinical manifestations and myositis-specific autoantibodies. JAMA Neurol. 2018 Sep 10 [Epub ahead of print].
Timing of Adverse Events Following Geriatric Hip Fracture Surgery: A Study of 19,873 Patients in the American College of Surgeons National Surgical Quality Improvement Program
ABSTRACT
This study uses a prospective surgical registry to characterize the timing of 10 postoperative adverse events following geriatric hip fracture surgery. There were 19,873 patients identified who were ≥70 years undergoing surgery for hip fracture as part of the American College of Surgeons National Surgical Quality Improvement Program (ACS-NSQIP). The median postoperative day of diagnosis (and interquartile range) for myocardial infarction was 3 (1-5), cardiac arrest requiring cardiopulmonary resuscitation 3 (0-8), stroke 3 (1-10), pneumonia 4 (2-10), pulmonary embolism 4 (2-11), urinary tract infection 7 (2-13), deep vein thrombosis 9 (4-16), sepsis 9 (4-18), mortality 11 (6-19), and surgical site infection 16 (11-22). For the earliest diagnosed adverse events, the rate of adverse events had diminished by postoperative day 30. For the later diagnosed adverse events, the rate of adverse events remained high at postoperative day 30. Findings help to enable more targeted clinical surveillance, inform patient counseling, and determine the duration of follow-up required to study specific adverse events effectively. Orthopedic surgeons should have the lowest threshold for testing for each adverse event during the time period of greatest risk.
Continue to: Geriatric hip fracture surgery is associated with...
Geriatric hip fracture surgery is associated with a higher rate of occurrence of postoperative adverse events than any other commonly performed orthopedic procedure.1-4 Indeed, the 90-day mortality rate following a geriatric hip fracture surgery may be as high as 15%2 and the 30-day morbidity rate as high as 30%.3 Furthermore, more than half of postoperative mortalities following orthopedic procedures occur after surgery for hip fracture.4 Therefore, extensive research has been conducted regarding interventions to reduce the rates of adverse events following a hip fracture surgery.5-12 For example, randomized trials have been conducted involving venous thromboembolism prophylaxis,5,6nutritional supplementation,7 delirium prevention,8-10 anemia correction,11 geriatrics consultation,9 and anesthetic technique.12
Despite these extensive research efforts, there is currently little information in the literature regarding when postoperative adverse events occur. A clear depiction of the timing of adverse events could help target clinical surveillance, inform patient counseling, and determine the duration of follow-up required for studies. The reason that the timing of adverse events has not been previously characterized may be that the sample sizes available through standard single- or multi-institutional studies may be insufficient to accurately characterize the timing of rare adverse events (eg, myocardial infarction, stroke, etc.). Moreover, although administrative datasets have become common data sources for investigation of rare postoperative adverse events,13-16 such data sources often do not contain data on the timing of diagnosis.
The American College of Surgeons National Surgical Quality Improvement Program (ACS-NSQIP) is a relatively new and growing surgical registry.1,3,13-22 The registry follows up patients undergoing surgical procedures at several hundred community and academic institutions nationwide. Unlike the administrative datasets discussed above, the ACS-NSQIP characterizes the postoperative day of diagnosis of well-defined adverse events during the first 30 postoperative days.22
In this study, data collected by the ACS-NSQIP are used to characterize the timing of 10 specific postoperative adverse events following a geriatric hip fracture surgery.
Continue to: METHODS...
METHODS
A retrospective analysis of data collected prospectively through the ACS-NSQIP was conducted. Geriatric patients who underwent hip fracture surgery during 2010 to 2013 were identified. Specific inclusion criteria were (1) International Classification of Diseases, Ninth Revision, diagnosis code 820, (2) primary Current Procedural Terminology codes 27125, 27130, 27235, 27236, 27244, or 27245, and (3) age ≥70 years.
The ACS-NSQIP captures patient demographic, comorbidity, and procedural characteristics at baseline.22 At the end of the 30-day follow-up period, the ACS-NSQIP personnel review both inpatient and outpatient charts to characterize the occurrence vs nonoccurrence of specific postoperative adverse events.22-25 When an adverse event does occur, the postoperative day of diagnosis is recorded.
For this study, the following adverse event categories were investigated: myocardial infarction, cardiac arrest requiring cardiopulmonary resuscitation, stroke, pneumonia, pulmonary embolism, urinary tract infection, deep vein thrombosis, sepsis (either with or without shock), mortality, and surgical site infection (including superficial surgical site infection, deep surgical site infection, and organ or space surgical site infection). Detailed definitions of each adverse event are provided in ACS-NSQIP materials.22
First, the 30-day incidence (and the associated 95% confidence interval) was determined for each adverse event. Second, the median postoperative day of diagnosis (and the associated interquartile range) was determined for each adverse event. Third, the postoperative length of stay was used to estimate the proportion of diagnoses occurring prior to vs following discharge for each adverse event. Finally, multivariate Cox proportional hazards models were used to identify independent risk factors for earlier occurrence of postoperative adverse events. The final models were selected using a backward stepwise process that sequentially eliminated variables with the weakest associations until all variables had P < .05.
Because the ACS-NSQIP reports timing data in calendar days, when the postoperative length of stay was equivalent to the postoperative day of diagnosis, it was not possible to ascertain whether the diagnosis occurred prior to or following discharge. For this study, when the postoperative length of stay was equivalent to the postoperative day of diagnosis, the adverse event was considered to have been diagnosed following discharge. The rationale for this is that for most of the adverse events, it was thought to be unlikely that an inpatient would be discharged before the end of the same day as an inpatient diagnosis. However, there was one exception to this rule; when the postoperative day of discharge, the postoperative length of stay, and the postoperative day of death were all equivalent, the adverse event was considered to have occurred prior to discharge. This is because when a patient dies during the initial inpatient stay, the ACS-NSQIP considers the postoperative length of stay to be equivalent to the postoperative day of death. This makes it much more likely that a diagnosis on the final hospital day had occurred in a patient who had not been discharged.
The mandatory ACS-NSQIP statement is “The American College of Surgeons National Surgical Quality Improvement Program and the hospitals participating in the ACS-NSQIP are the source of the data used herein; they have not verified and are not responsible for the statistical validity of the data analysis or the conclusions derived by the authors.”26
Continue to: RESULTS...
RESULTS
In total, 19,873 geriatric patients undergoing a hip fracture surgery were identified (Table 1). The rates of adverse events ranged from 6.7% for urinary tract infection to 0.6% for pulmonary embolism (Table 2).
Table 1. Patient Population
| Number | Percent |
Total | 19,873 | 100.0% |
Age |
|
|
70-74 years | 1852 | 9.3% |
75-79 years | 2764 | 13.9% |
80-84 years | 4328 | 21.8% |
85-89 years | 5525 | 27.8% |
≥90 years | 5404 | 27.2% |
Sex |
|
|
Male | 5359 | 27.0% |
Female | 14,514 | 73.0% |
Body mass index |
|
|
<30 kg/m2 | 17,733 | 89.2% |
≥30 kg/m2 | 2140 | 10.8% |
Functional status |
|
|
Independent | 14,348 | 72.2% |
Dependent | 5525 | 27.8% |
Diabetes | 3321 | 16.7% |
Congestive heart failure | 738 | 3.7% |
Dyspnea on exertion | 1542 | 7.8% |
Hypertension | 14,265 | 71.8% |
End-stage renal disease | 322 | 1.6% |
COPD | 2239 | 11.3% |
Current smoker | 1506 | 7.6% |
Abbreviation: COPD, chronic obstructive pulmonary disease.
Table 2. Patients with Adverse Events Diagnosed During the First 30 postoperative days (N = 19,873)
Adverse Event | Number | Percent | 95% CI |
Urinary tract infection | 1321 | 6.7% | 6.3%-7.0% |
Mortality | 1240 | 6.2% | 5.9%-6.6% |
Pneumonia | 771 | 3.9% | 3.6%-4.2% |
Sepsis | 428 | 2.2% | 2.0%-2.4% |
Myocardial infarction | 347 | 1.8% | 1.6%-1.9% |
Surgical site infection | 247 | 1.2% | 1.1%-1.4% |
Deep vein thrombosis | 199 | 1.0% | 0.9%-1.1% |
Stroke | 144 | 0.7% | 0.6%-0.8% |
Cardiac arrest | 136 | 0.7% | 0.6%-0.8% |
Pulmonary embolism | 126 | 0.6% | 0.5%-0.7% |
Abbreviation: CI, confidence interval.
Figure 1 depicts the timing of postoperative adverse events in detail in histograms and timing curves. For the earliest diagnosed adverse events, the rate of adverse events had diminished by postoperative day 30. For the later diagnosed adverse events, the rate of adverse events remained high at postoperative day 30.
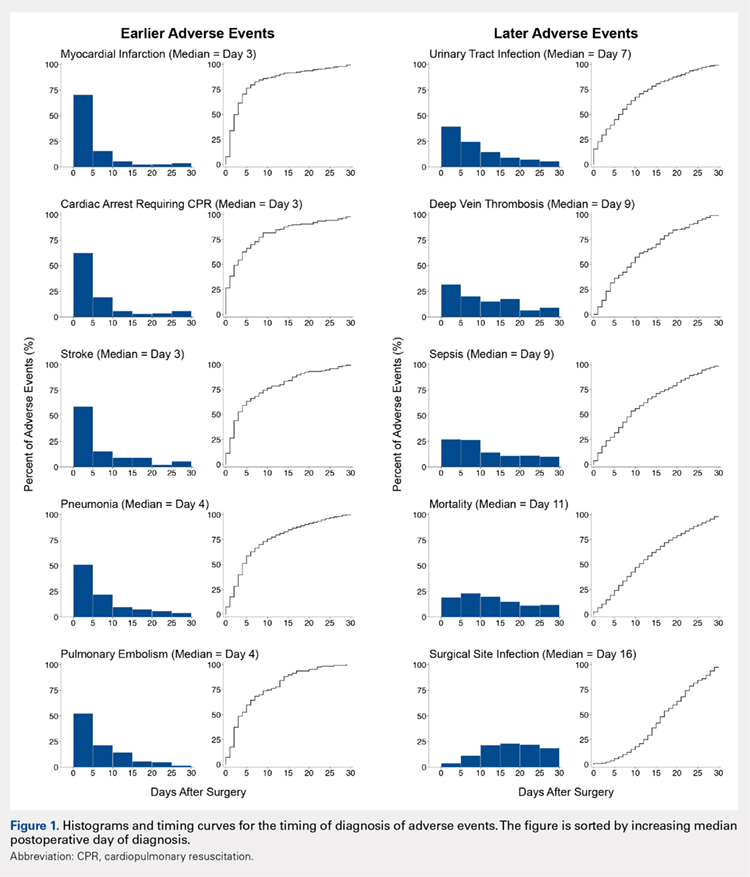
Figure 2 provides the summary statistics for adverse events diagnosed in the first 30 postoperative days. The median postoperative day of diagnosis (and the interquartile range) was 3 (1-5) for myocardial infarction, 3 (0-8) for cardiac arrest requiring cardiopulmonary resuscitation, 3 (1-10) for stroke, 4 (2-10) for pneumonia, 4 (2-11) for pulmonary embolism, 7 (2-13) for urinary tract infection, 9 (4-16) for deep vein thrombosis, 9 (4-18) for sepsis, 11 (6-19) for mortality, and 16 (11-22) for surgical site infection.
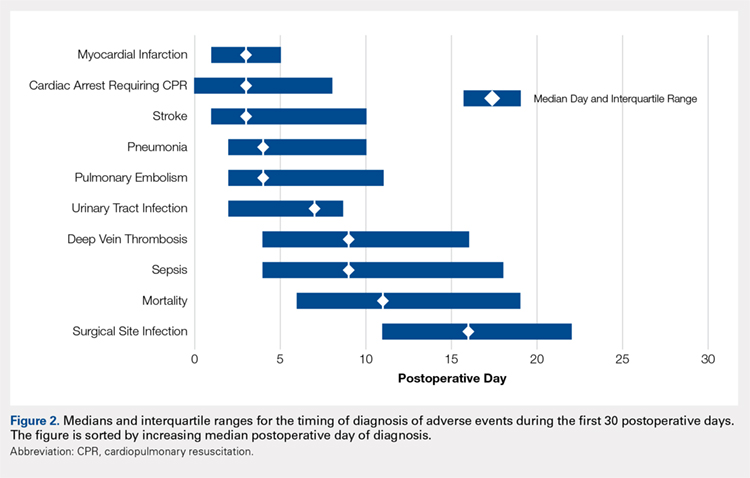
Figure 3 depicts the timing of adverse events relative to discharge. The proportions of adverse events diagnosed prior to discharge were 81.0% for myocardial infarction, 77.8% for stroke, 76.1% for cardiac arrest requiring cardiopulmonary resuscitation, 71.9% for pulmonary embolism, 71.1% for pneumonia, 58.0% for urinary tract infection, 52.1% for sepsis, 46.9% for deep vein thrombosis, 44.3% for mortality, and 27.6% for surgical site infection.
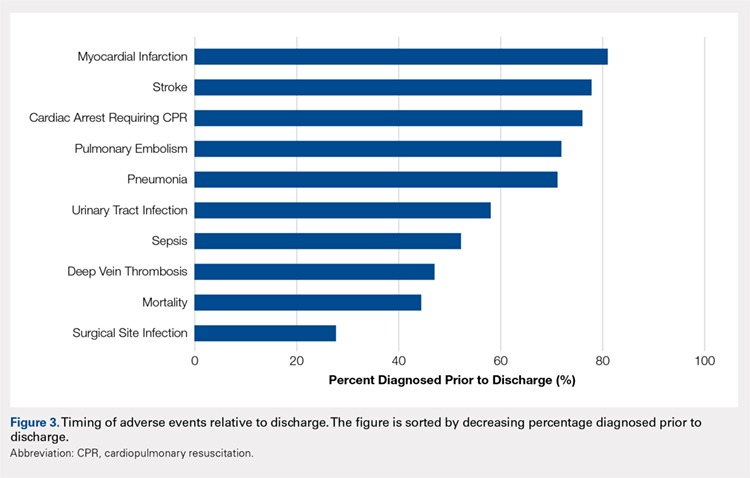
Table 3 shows the independent risk factors for earlier occurrence of adverse events. Following multivariate stepwise selection of final models, at least 1 patient characteristic was independently associated with the timing of cardiac arrest, stroke, urinary tract infection, deep vein thrombosis, and death. In contrast, no patient characteristics were independently associated with the timing of myocardial infarction, pneumonia, pulmonary embolism, sepsis, and surgical site infection.
Table 3. Timing of Diagnosis of Adverse Eventsa
Adverse events and associated baseline characteristic(s) | Median postoperative day of diagnosis with vs without baseline characteristic | P-valueb |
Cardiac arrest |
|
|
End-stage renal disease | 1 vs 3 | .005 |
Stroke |
|
|
Hypertension | 4 vs 2 | .025 |
Dependent functional status | 2 vs 4 | .027 |
Urinary tract infection |
|
|
Female sex | 6 vs 8 | .009 |
Deep vein thrombosis |
|
|
Body mass index ≥30 kg/m2 | 5 vs 10 | .015 |
Death |
|
|
End-stage renal disease | 10 vs 11 | .031 |
aBaseline characteristics that were independently associated with the timing of each adverse event were identified through a backwards stepwise selection process initially including all characteristics listed in Table 1, and sequentially excluding characteristics with the weakest associations until only characteristics with P < .05 remained. Independent associations with the timing of cardiac arrest, stroke, urinary tract infection, deep vein thrombosis, and death are shown. There were no characteristics independently associated with timing of myocardial infarction, pneumonia, pulmonary embolism, sepsis, or surgical site infection; hence, these adverse events are not listed in the table.
bFrom final Cox proportional hazards models identified through multivariate stepwise selection.
Continue to: DISCUSSION...
DISCUSSION
Adverse events are extremely common following a geriatric hip fracture surgery.1-4 Despite extensive investigation regarding methods to prevent these events,5-12 there is limited published description of the timing at which such events occur. This study used a large prospectively followed up cohort of geriatric patients undergoing a hip fracture surgery to deliver a better description of the timing of adverse events than was previously available. The findings of this study should enable more targeted clinical surveillance, inform patient counseling, and help determine the duration of follow-up required for studies on adverse events.
There was wide variability in the timing at which the different postoperative adverse events were diagnosed (Figures 1, 2). Myocardial infarction was diagnosed the earliest, with more than three-fourth of diagnoses in the first postoperative week. Other relatively early-diagnosed adverse events included cardiac arrest requiring cardiopulmonary resuscitation, stroke, pneumonia, and pulmonary embolism.
The latest-diagnosed adverse event was surgical site infection (Figures 1, 2). Surgical site infection was actually the only adverse event with a rate of diagnosis during the first week that was lower than the rate of diagnosis later in the month (as can be seen by the inflection in the timing curve for surgical site infection in Figure 1). Mortality showed a relatively consistent rate of diagnosis throughout the entire first postoperative month. Other relatively late-diagnosed postoperative events, including sepsis, deep vein thrombosis, and urinary tract infection, showed varying degrees of decreased rate of diagnosis near the end of the first postoperative month. Of note, for the later-diagnosed adverse events, the estimated median and interquartile ranges (Figure 2) were presumably quite biased toward earlier diagnosis, as the 30-day follow-up period clearly failed to capture a large proportion of later-occurring adverse events (Figure 1).
Certain risk factors were independently associated with earlier occurrence of adverse events. Perhaps most strikingly, body mass index in the obese range was associated with substantially earlier occurrence of deep vein thrombosis (median of 5 vs 10 days). This finding suggests that clinical monitoring for deep vein thrombosis should be performed earlier in patients with greater body mass index. Also notable is the earlier occurrence of cardiac arrest and death among patients with end-stage renal disease than among those without. Patients with end-stage renal disease may have a greater risk for these adverse events immediately following the cardiac stresses of surgery.27 Similarly, such patients may be more prone to early electrolyte abnormalities and arrhythmia.
Continue to: In addition to its clinical implications, this study...
In addition to its clinical implications, this study informs about the interpretation of the many studies of adverse events following hip fracture procedures that have been conducted using retrospective data. Several such studies have relied on inpatient-only administrative databases.4,13,14,28-35 As clearly demonstrated in Figure 3, for most of the commonly studied adverse events, inpatient-only databases failed to capture a large proportion of adverse events occurring in the first postoperative month. This highlights a substantial limitation of this commonly published type of study that is often not emphasized in the literature.
There has also been an increase in the publication of studies of adverse events following a hip fracture surgery using the ACS-NSQIP data.3,13,14,17,18,21 As discussed, the ACS-NSQIP provides data on 30-days of follow-up. This relatively extended follow-up is often touted as a distinct advantage. However, this study demonstrates that even the 30-day follow-up afforded by the ACS-NSQIP is limited in its ability to enable investigation of the later-occurring adverse events (Figure 1). In particular, the rate of surgical site infection shows little sign of slowing by postoperative day 30. Similarly, the rates of mortality, sepsis, deep vein thrombosis, and urinary tract infection remain substantial.
This study does have limitations. First, as discussed, the duration of follow-up is a limitation of any ACS-NSQIP-based investigation, including this study. Second, the ACS-NSQIP does not capture relevant orthopedic-specific outcomes (eg, screw cutout). In addition, it could not be determined with certainty whether adverse events occurring on the final hospital day occurred prior to or following discharge. However, only a small proportion of most of the adverse events was diagnosed on the final hospital day. Finally, the ACS-NSQIP reports on days from the operation until diagnosis of the adverse event. Although some adverse events are probably diagnosed quickly after they have occurred (eg, myocardial infarction and cardiac arrest), other adverse events may have a delayed diagnosis (eg, surgical site infection may be identified days after its initial occurrence during a follow-up examination). Therefore, it is important to note the subtle distinction between occurrence and diagnosis throughout the article. This article reports on the timing of diagnosis, not actual occurrence.
CONCLUSION
The timing of postoperative adverse events has been understudied in the past. This may be due to an inability of standard single- or multi-institutional investigations to achieve sample sizes adequate to study the less commonly occurring adverse events. Using a relatively new prospective surgical registry, this study provides a far more detailed description of the timing of adverse events following surgery than was previously available. The authors anticipate that these data can be used to inform patient counseling, target clinical surveillance, and direct clinical research. The authors chose to study the timing of postoperative adverse events following geriatric hip fracture surgery because of the high rate of adverse events associated with the procedure. However, future ACS-NSQIP studies may involve characterization of the timing of adverse events following other orthopedic and non-orthopedic procedures.
This paper will be judged for the Resident Writer’s Award.
1. Schilling PL, Hallstrom BR, Birkmeyer JD, Carpenter JE. Prioritizing perioperative quality improvement in orthopaedic surgery. J Bone Joint Surg Am. 2010;92(9):1884-1889. doi:10.2106/jbjs.i.00735.
2. Forte ML, Virnig BA, Swiontkowski MF, et al. Ninety-day mortality after intertrochanteric hip fracture: does provider volume matter? J Bone Joint Surg Am. 2010;92(4):799-806. doi:10.2106/jbjs.h.01204.
3. Pugely AJ, Martin CT, Gao Y, Klocke NF, Callaghan JJ, Marsh JL. A risk calculator for short-term morbidity and mortality after hip fracture surgery. J Orthop Trauma.2014;28(2):63-69. doi:10.1097/BOT.0b013e3182a22744.
4. Bhattacharyya T, Iorio R, Healy WL. Rate of and risk factors for acute inpatient mortality after orthopaedic surgery. J Bone Joint Surg Am. 2002;84-a(4):562-572.
5. Eriksson BI, Lassen MR. Duration of prophylaxis against venous thromboembolism with fondaparinux after hip fracture surgery: a multicenter, randomized, placebo-controlled, double-blind study. Arch Intern Med. 2003;163(11):1337-1342. doi:10.1001/archinte.163.11.1337.
6. Handoll HH, Farrar MJ, McBirnie J, Tytherleigh-Strong G, Milne AA, Gillespie WJ. Heparin, low molecular weight heparin and physical methods for preventing deep vein thrombosis and pulmonary embolism following surgery for hip fractures. Cochrane Database Syst Rev.2002;(4):Cd000305. doi:10.1002/14651858.cd000305.
7. Avenell A, Handoll HH. Nutritional supplementation for hip fracture aftercare in the elderly. Cochrane Database Syst Rev. 2004;(1):Cd001880. doi:10.1002/14651858.CD001880.pub2.
8. Marcantonio ER, Flacker JM, Wright RJ, Resnick NM. Reducing delirium after hip fracture: a randomized trial. J Am Geriatr Soc. 2001;49(5):516-522. doi:10.1046/j.1532-5415.2001.49108.x.
9. Deschodt M, Braes T, Flamaing J, et al. Preventing delirium in older adults with recent hip fracture through multidisciplinary geriatric consultation. J Am Geriatr Soc. 2012;60(4):733-739. doi:10.1111/j.1532-5415.2012.03899.x.
10. Marcantonio ER, Palihnich K, Appleton P, Davis RB. Pilot randomized trial of donepezil hydrochloride for delirium after hip fracture. J Am Geriatr Soc. 2011;59 Suppl 2:S282-S288. doi:10.1111/j.1532-5415.2011.03691.x.
11. Parker MJ. Iron supplementation for anemia after hip fracture surgery: a randomized trial of 300 patients. J Bone Joint Surg Am. 2010;92(2):265-269. doi:10.2106/jbjs.i.00883.
12. Urwin SC, Parker MJ, Griffiths R. General versus regional anaesthesia for hip fracture surgery: a meta-analysis of randomized trials. Br J Anaesth. 2000;84(4):450-455. doi:10.1093/oxfordjournals.bja.a013468.
13. Bohl DD, Basques BA, Golinvaux NS, Baumgaertner MR, Grauer JN. Nationwide Inpatient Sample and National Surgical Quality Improvement Program give different results in hip fracture studies. Clin Orthop Relat Res. 2014;472(6):1672-1680. doi:10.1007/s11999-014-3559-0.
14. Bohl DD, Grauer JN, Leopold SS. Editor's spotlight/Take 5: nationwide inpatient sample and national surgical quality improvement program give different results in hip fracture studies. Clin Orthop Relat Res. 2014;472(6):1667-1671. doi:10.1007/s11999-014-3595-9.
15. Bohl DD, Russo GS, Basques BA, et al. Variations in data collection methods between national databases affect study results: a comparison of the nationwide inpatient sample and national surgical quality improvement program databases for lumbar spine fusion procedures. J Bone Joint Surg Am. 2014;96(23):e193. doi:10.2106/jbjs.m.01490.
16. Levin PE. Apples, oranges, and national databases: commentary on an article by Daniel D. Bohl, MPH, et al.: "Variations in data collection methods between national databases affect study results: a comparison of the nationwide inpatient sample and national surgical quality improvement program databases for lumbar spine fusion procedures.” J Bone Joint Surg Am. 2014;96(23):e198. doi:10.2106/jbjs.n.00890.
17. Basques BA, Bohl DD, Golinvaux NS, Leslie MP, Baumgaertner MR, Grauer JN. Postoperative length of stay and thirty-day readmission following geriatric hip fracture: an analysis of 8,434 patients. J Orthop Trauma. 2015;29(3):e115-e120. doi:10.1097/bot.0000000000000222.
18. Golinvaux NS, Bohl DD, Basques BA, Baumgaertner MR, Grauer JN. Diabetes confers little to no increased risk of postoperative complications after hip fracture surgery in geriatric patients. Clin Orthop Relat Res. 2015;473(3):1043-1051. doi:10.1007/s11999-014-3945-7.
19. Maciejewski ML, Radcliff TA, Henderson WG, et al. Determinants of postsurgical discharge setting for male hip fracture patients. J Rehabil Res Dev. 2013;50(9):1267-1276. doi:10.1682/jrrd.2013.02.0041.
20. Molina CS, Thakore RV, Blumer A, Obremskey WT, Sethi MK. Use of the National Surgical Quality Improvement Program in orthopaedic surgery. Clin Orthop Relat Res.2015;473(5):1574-1581. doi:10.1007/s11999-014-3597-7.
21. Bohl DD, Basques BA, Golinvaux NS, Miller CP, Baumgaertner MR, Grauer JN. Extramedullary compared with intramedullary implants for intertrochanteric hip fractures: thirty-day outcomes of 4432 procedures from the ACS NSQIP database. J Bone Joint Surg Am. 2014;96(22):1871-1877. doi:10.2106/jbjs.n.00041.
22. Alosh H, Riley LH 3rd, Skolasky RL. Insurance status, geography, race, and ethnicity as predictors of anterior cervical spine surgery rates and in-hospital mortality: an examination of United States trends from 1992 to 2005. Spine (Phila Pa 1976). 2009;34(18):1956-1962. doi:10.1097/BRS.0b013e3181ab930e.
23. Cahill KS, Chi JH, Day A, Claus EB. Prevalence, complications, and hospital charges associated with use of bone-morphogenetic proteins in spinal fusion procedures. JAMA.2009;302(1):58-66. doi:10.1001/jama.2009.956.
24. Ingraham AM, Richards KE, Hall BL, Ko CY. Quality improvement in surgery: the American College of Surgeons National Surgical Quality Improvement Program approach. Adv Surg. 2010;44(1):251-267. doi:10.1016/j.yasu.2010.05.003.
25. Shiloach M, Frencher SK Jr, Steeger JE, et al. Toward robust information: data quality and inter-rater reliability in the American College of Surgeons National Surgical Quality Improvement Program. J Am Coll Surg. 2010;210(1):6-16. doi:10.1016/j.jamcollsurg.2009.09.031.
26. ACS-NSQIP. Data Use Agreement. American College of Surgeons Web site. https://www.facs.org/quality-programs/acs-nsqip/participant-use/puf-form. Accessed September 20, 2018.
27. Blacher J, Guerin AP, Pannier B, Marchais SJ, London GM. Arterial calcifications, arterial stiffness, and cardiovascular risk in end-stage renal disease. Hypertension. 2001;38(4):938-942. doi:10.1161/hy1001.096358.
28. Browne JA, Cook C, Olson SA, Bolognesi MP. Resident duty-hour reform associated with increased morbidity following hip fracture. J Bone Joint Surg Am. 2009;91(9):2079-2085. doi:10.2106/jbjs.h.01240.
29. Browne JA, Pietrobon R, Olson SA. Hip fracture outcomes: does surgeon or hospital volume really matter? J Trauma. 2009;66(3):809-814. doi:10.1097/TA.0b013e31816166bb.
30. Menendez ME, Ring D. Failure to rescue after proximal femur fracture surgery. J Orthop Trauma. 2015;29(3):e96-e102. doi:10.1097/bot.0000000000000234.
31. Nikkel LE, Fox EJ, Black KP, Davis C, Andersen L, Hollenbeak CS. Impact of comorbidities on hospitalization costs following hip fracture. J Bone Joint Surg Am. 2012;94(1):9-17. doi:10.2106/jbjs.j.01077.
32. Anderson KL, Koval KJ, Spratt KF. Hip fracture outcome: is there a “July effect”? Am J Orthop. 2009;38(12):606-611.
33. Koval KJ, Rust CL, Spratt KF. The effect of hospital setting and teaching status on outcomes after hip fracture. Am J Orthop. 2011;40(1):19-28.
34. Bacon WE. Secular trends in hip fracture occurrence and survival: age and sex differences. J Aging Health. 1996;8(4):538-553. doi:10.1177/089826439600800404.
35. Orces CH. In-hospital hip fracture mortality trends in older adults: the National Hospital Discharge Survey, 1988-2007. J Am Geriatr Soc. 2013;61(12):2248-2249. doi:10.1111/jgs.12567.
ABSTRACT
This study uses a prospective surgical registry to characterize the timing of 10 postoperative adverse events following geriatric hip fracture surgery. There were 19,873 patients identified who were ≥70 years undergoing surgery for hip fracture as part of the American College of Surgeons National Surgical Quality Improvement Program (ACS-NSQIP). The median postoperative day of diagnosis (and interquartile range) for myocardial infarction was 3 (1-5), cardiac arrest requiring cardiopulmonary resuscitation 3 (0-8), stroke 3 (1-10), pneumonia 4 (2-10), pulmonary embolism 4 (2-11), urinary tract infection 7 (2-13), deep vein thrombosis 9 (4-16), sepsis 9 (4-18), mortality 11 (6-19), and surgical site infection 16 (11-22). For the earliest diagnosed adverse events, the rate of adverse events had diminished by postoperative day 30. For the later diagnosed adverse events, the rate of adverse events remained high at postoperative day 30. Findings help to enable more targeted clinical surveillance, inform patient counseling, and determine the duration of follow-up required to study specific adverse events effectively. Orthopedic surgeons should have the lowest threshold for testing for each adverse event during the time period of greatest risk.
Continue to: Geriatric hip fracture surgery is associated with...
Geriatric hip fracture surgery is associated with a higher rate of occurrence of postoperative adverse events than any other commonly performed orthopedic procedure.1-4 Indeed, the 90-day mortality rate following a geriatric hip fracture surgery may be as high as 15%2 and the 30-day morbidity rate as high as 30%.3 Furthermore, more than half of postoperative mortalities following orthopedic procedures occur after surgery for hip fracture.4 Therefore, extensive research has been conducted regarding interventions to reduce the rates of adverse events following a hip fracture surgery.5-12 For example, randomized trials have been conducted involving venous thromboembolism prophylaxis,5,6nutritional supplementation,7 delirium prevention,8-10 anemia correction,11 geriatrics consultation,9 and anesthetic technique.12
Despite these extensive research efforts, there is currently little information in the literature regarding when postoperative adverse events occur. A clear depiction of the timing of adverse events could help target clinical surveillance, inform patient counseling, and determine the duration of follow-up required for studies. The reason that the timing of adverse events has not been previously characterized may be that the sample sizes available through standard single- or multi-institutional studies may be insufficient to accurately characterize the timing of rare adverse events (eg, myocardial infarction, stroke, etc.). Moreover, although administrative datasets have become common data sources for investigation of rare postoperative adverse events,13-16 such data sources often do not contain data on the timing of diagnosis.
The American College of Surgeons National Surgical Quality Improvement Program (ACS-NSQIP) is a relatively new and growing surgical registry.1,3,13-22 The registry follows up patients undergoing surgical procedures at several hundred community and academic institutions nationwide. Unlike the administrative datasets discussed above, the ACS-NSQIP characterizes the postoperative day of diagnosis of well-defined adverse events during the first 30 postoperative days.22
In this study, data collected by the ACS-NSQIP are used to characterize the timing of 10 specific postoperative adverse events following a geriatric hip fracture surgery.
Continue to: METHODS...
METHODS
A retrospective analysis of data collected prospectively through the ACS-NSQIP was conducted. Geriatric patients who underwent hip fracture surgery during 2010 to 2013 were identified. Specific inclusion criteria were (1) International Classification of Diseases, Ninth Revision, diagnosis code 820, (2) primary Current Procedural Terminology codes 27125, 27130, 27235, 27236, 27244, or 27245, and (3) age ≥70 years.
The ACS-NSQIP captures patient demographic, comorbidity, and procedural characteristics at baseline.22 At the end of the 30-day follow-up period, the ACS-NSQIP personnel review both inpatient and outpatient charts to characterize the occurrence vs nonoccurrence of specific postoperative adverse events.22-25 When an adverse event does occur, the postoperative day of diagnosis is recorded.
For this study, the following adverse event categories were investigated: myocardial infarction, cardiac arrest requiring cardiopulmonary resuscitation, stroke, pneumonia, pulmonary embolism, urinary tract infection, deep vein thrombosis, sepsis (either with or without shock), mortality, and surgical site infection (including superficial surgical site infection, deep surgical site infection, and organ or space surgical site infection). Detailed definitions of each adverse event are provided in ACS-NSQIP materials.22
First, the 30-day incidence (and the associated 95% confidence interval) was determined for each adverse event. Second, the median postoperative day of diagnosis (and the associated interquartile range) was determined for each adverse event. Third, the postoperative length of stay was used to estimate the proportion of diagnoses occurring prior to vs following discharge for each adverse event. Finally, multivariate Cox proportional hazards models were used to identify independent risk factors for earlier occurrence of postoperative adverse events. The final models were selected using a backward stepwise process that sequentially eliminated variables with the weakest associations until all variables had P < .05.
Because the ACS-NSQIP reports timing data in calendar days, when the postoperative length of stay was equivalent to the postoperative day of diagnosis, it was not possible to ascertain whether the diagnosis occurred prior to or following discharge. For this study, when the postoperative length of stay was equivalent to the postoperative day of diagnosis, the adverse event was considered to have been diagnosed following discharge. The rationale for this is that for most of the adverse events, it was thought to be unlikely that an inpatient would be discharged before the end of the same day as an inpatient diagnosis. However, there was one exception to this rule; when the postoperative day of discharge, the postoperative length of stay, and the postoperative day of death were all equivalent, the adverse event was considered to have occurred prior to discharge. This is because when a patient dies during the initial inpatient stay, the ACS-NSQIP considers the postoperative length of stay to be equivalent to the postoperative day of death. This makes it much more likely that a diagnosis on the final hospital day had occurred in a patient who had not been discharged.
The mandatory ACS-NSQIP statement is “The American College of Surgeons National Surgical Quality Improvement Program and the hospitals participating in the ACS-NSQIP are the source of the data used herein; they have not verified and are not responsible for the statistical validity of the data analysis or the conclusions derived by the authors.”26
Continue to: RESULTS...
RESULTS
In total, 19,873 geriatric patients undergoing a hip fracture surgery were identified (Table 1). The rates of adverse events ranged from 6.7% for urinary tract infection to 0.6% for pulmonary embolism (Table 2).
Table 1. Patient Population
| Number | Percent |
Total | 19,873 | 100.0% |
Age |
|
|
70-74 years | 1852 | 9.3% |
75-79 years | 2764 | 13.9% |
80-84 years | 4328 | 21.8% |
85-89 years | 5525 | 27.8% |
≥90 years | 5404 | 27.2% |
Sex |
|
|
Male | 5359 | 27.0% |
Female | 14,514 | 73.0% |
Body mass index |
|
|
<30 kg/m2 | 17,733 | 89.2% |
≥30 kg/m2 | 2140 | 10.8% |
Functional status |
|
|
Independent | 14,348 | 72.2% |
Dependent | 5525 | 27.8% |
Diabetes | 3321 | 16.7% |
Congestive heart failure | 738 | 3.7% |
Dyspnea on exertion | 1542 | 7.8% |
Hypertension | 14,265 | 71.8% |
End-stage renal disease | 322 | 1.6% |
COPD | 2239 | 11.3% |
Current smoker | 1506 | 7.6% |
Abbreviation: COPD, chronic obstructive pulmonary disease.
Table 2. Patients with Adverse Events Diagnosed During the First 30 postoperative days (N = 19,873)
Adverse Event | Number | Percent | 95% CI |
Urinary tract infection | 1321 | 6.7% | 6.3%-7.0% |
Mortality | 1240 | 6.2% | 5.9%-6.6% |
Pneumonia | 771 | 3.9% | 3.6%-4.2% |
Sepsis | 428 | 2.2% | 2.0%-2.4% |
Myocardial infarction | 347 | 1.8% | 1.6%-1.9% |
Surgical site infection | 247 | 1.2% | 1.1%-1.4% |
Deep vein thrombosis | 199 | 1.0% | 0.9%-1.1% |
Stroke | 144 | 0.7% | 0.6%-0.8% |
Cardiac arrest | 136 | 0.7% | 0.6%-0.8% |
Pulmonary embolism | 126 | 0.6% | 0.5%-0.7% |
Abbreviation: CI, confidence interval.
Figure 1 depicts the timing of postoperative adverse events in detail in histograms and timing curves. For the earliest diagnosed adverse events, the rate of adverse events had diminished by postoperative day 30. For the later diagnosed adverse events, the rate of adverse events remained high at postoperative day 30.
Figure 2 provides the summary statistics for adverse events diagnosed in the first 30 postoperative days. The median postoperative day of diagnosis (and the interquartile range) was 3 (1-5) for myocardial infarction, 3 (0-8) for cardiac arrest requiring cardiopulmonary resuscitation, 3 (1-10) for stroke, 4 (2-10) for pneumonia, 4 (2-11) for pulmonary embolism, 7 (2-13) for urinary tract infection, 9 (4-16) for deep vein thrombosis, 9 (4-18) for sepsis, 11 (6-19) for mortality, and 16 (11-22) for surgical site infection.
Figure 3 depicts the timing of adverse events relative to discharge. The proportions of adverse events diagnosed prior to discharge were 81.0% for myocardial infarction, 77.8% for stroke, 76.1% for cardiac arrest requiring cardiopulmonary resuscitation, 71.9% for pulmonary embolism, 71.1% for pneumonia, 58.0% for urinary tract infection, 52.1% for sepsis, 46.9% for deep vein thrombosis, 44.3% for mortality, and 27.6% for surgical site infection.
Table 3 shows the independent risk factors for earlier occurrence of adverse events. Following multivariate stepwise selection of final models, at least 1 patient characteristic was independently associated with the timing of cardiac arrest, stroke, urinary tract infection, deep vein thrombosis, and death. In contrast, no patient characteristics were independently associated with the timing of myocardial infarction, pneumonia, pulmonary embolism, sepsis, and surgical site infection.
Table 3. Timing of Diagnosis of Adverse Eventsa
Adverse events and associated baseline characteristic(s) | Median postoperative day of diagnosis with vs without baseline characteristic | P-valueb |
Cardiac arrest |
|
|
End-stage renal disease | 1 vs 3 | .005 |
Stroke |
|
|
Hypertension | 4 vs 2 | .025 |
Dependent functional status | 2 vs 4 | .027 |
Urinary tract infection |
|
|
Female sex | 6 vs 8 | .009 |
Deep vein thrombosis |
|
|
Body mass index ≥30 kg/m2 | 5 vs 10 | .015 |
Death |
|
|
End-stage renal disease | 10 vs 11 | .031 |
aBaseline characteristics that were independently associated with the timing of each adverse event were identified through a backwards stepwise selection process initially including all characteristics listed in Table 1, and sequentially excluding characteristics with the weakest associations until only characteristics with P < .05 remained. Independent associations with the timing of cardiac arrest, stroke, urinary tract infection, deep vein thrombosis, and death are shown. There were no characteristics independently associated with timing of myocardial infarction, pneumonia, pulmonary embolism, sepsis, or surgical site infection; hence, these adverse events are not listed in the table.
bFrom final Cox proportional hazards models identified through multivariate stepwise selection.
Continue to: DISCUSSION...
DISCUSSION
Adverse events are extremely common following a geriatric hip fracture surgery.1-4 Despite extensive investigation regarding methods to prevent these events,5-12 there is limited published description of the timing at which such events occur. This study used a large prospectively followed up cohort of geriatric patients undergoing a hip fracture surgery to deliver a better description of the timing of adverse events than was previously available. The findings of this study should enable more targeted clinical surveillance, inform patient counseling, and help determine the duration of follow-up required for studies on adverse events.
There was wide variability in the timing at which the different postoperative adverse events were diagnosed (Figures 1, 2). Myocardial infarction was diagnosed the earliest, with more than three-fourth of diagnoses in the first postoperative week. Other relatively early-diagnosed adverse events included cardiac arrest requiring cardiopulmonary resuscitation, stroke, pneumonia, and pulmonary embolism.
The latest-diagnosed adverse event was surgical site infection (Figures 1, 2). Surgical site infection was actually the only adverse event with a rate of diagnosis during the first week that was lower than the rate of diagnosis later in the month (as can be seen by the inflection in the timing curve for surgical site infection in Figure 1). Mortality showed a relatively consistent rate of diagnosis throughout the entire first postoperative month. Other relatively late-diagnosed postoperative events, including sepsis, deep vein thrombosis, and urinary tract infection, showed varying degrees of decreased rate of diagnosis near the end of the first postoperative month. Of note, for the later-diagnosed adverse events, the estimated median and interquartile ranges (Figure 2) were presumably quite biased toward earlier diagnosis, as the 30-day follow-up period clearly failed to capture a large proportion of later-occurring adverse events (Figure 1).
Certain risk factors were independently associated with earlier occurrence of adverse events. Perhaps most strikingly, body mass index in the obese range was associated with substantially earlier occurrence of deep vein thrombosis (median of 5 vs 10 days). This finding suggests that clinical monitoring for deep vein thrombosis should be performed earlier in patients with greater body mass index. Also notable is the earlier occurrence of cardiac arrest and death among patients with end-stage renal disease than among those without. Patients with end-stage renal disease may have a greater risk for these adverse events immediately following the cardiac stresses of surgery.27 Similarly, such patients may be more prone to early electrolyte abnormalities and arrhythmia.
Continue to: In addition to its clinical implications, this study...
In addition to its clinical implications, this study informs about the interpretation of the many studies of adverse events following hip fracture procedures that have been conducted using retrospective data. Several such studies have relied on inpatient-only administrative databases.4,13,14,28-35 As clearly demonstrated in Figure 3, for most of the commonly studied adverse events, inpatient-only databases failed to capture a large proportion of adverse events occurring in the first postoperative month. This highlights a substantial limitation of this commonly published type of study that is often not emphasized in the literature.
There has also been an increase in the publication of studies of adverse events following a hip fracture surgery using the ACS-NSQIP data.3,13,14,17,18,21 As discussed, the ACS-NSQIP provides data on 30-days of follow-up. This relatively extended follow-up is often touted as a distinct advantage. However, this study demonstrates that even the 30-day follow-up afforded by the ACS-NSQIP is limited in its ability to enable investigation of the later-occurring adverse events (Figure 1). In particular, the rate of surgical site infection shows little sign of slowing by postoperative day 30. Similarly, the rates of mortality, sepsis, deep vein thrombosis, and urinary tract infection remain substantial.
This study does have limitations. First, as discussed, the duration of follow-up is a limitation of any ACS-NSQIP-based investigation, including this study. Second, the ACS-NSQIP does not capture relevant orthopedic-specific outcomes (eg, screw cutout). In addition, it could not be determined with certainty whether adverse events occurring on the final hospital day occurred prior to or following discharge. However, only a small proportion of most of the adverse events was diagnosed on the final hospital day. Finally, the ACS-NSQIP reports on days from the operation until diagnosis of the adverse event. Although some adverse events are probably diagnosed quickly after they have occurred (eg, myocardial infarction and cardiac arrest), other adverse events may have a delayed diagnosis (eg, surgical site infection may be identified days after its initial occurrence during a follow-up examination). Therefore, it is important to note the subtle distinction between occurrence and diagnosis throughout the article. This article reports on the timing of diagnosis, not actual occurrence.
CONCLUSION
The timing of postoperative adverse events has been understudied in the past. This may be due to an inability of standard single- or multi-institutional investigations to achieve sample sizes adequate to study the less commonly occurring adverse events. Using a relatively new prospective surgical registry, this study provides a far more detailed description of the timing of adverse events following surgery than was previously available. The authors anticipate that these data can be used to inform patient counseling, target clinical surveillance, and direct clinical research. The authors chose to study the timing of postoperative adverse events following geriatric hip fracture surgery because of the high rate of adverse events associated with the procedure. However, future ACS-NSQIP studies may involve characterization of the timing of adverse events following other orthopedic and non-orthopedic procedures.
This paper will be judged for the Resident Writer’s Award.
1. Schilling PL, Hallstrom BR, Birkmeyer JD, Carpenter JE. Prioritizing perioperative quality improvement in orthopaedic surgery. J Bone Joint Surg Am. 2010;92(9):1884-1889. doi:10.2106/jbjs.i.00735.
2. Forte ML, Virnig BA, Swiontkowski MF, et al. Ninety-day mortality after intertrochanteric hip fracture: does provider volume matter? J Bone Joint Surg Am. 2010;92(4):799-806. doi:10.2106/jbjs.h.01204.
3. Pugely AJ, Martin CT, Gao Y, Klocke NF, Callaghan JJ, Marsh JL. A risk calculator for short-term morbidity and mortality after hip fracture surgery. J Orthop Trauma.2014;28(2):63-69. doi:10.1097/BOT.0b013e3182a22744.
4. Bhattacharyya T, Iorio R, Healy WL. Rate of and risk factors for acute inpatient mortality after orthopaedic surgery. J Bone Joint Surg Am. 2002;84-a(4):562-572.
5. Eriksson BI, Lassen MR. Duration of prophylaxis against venous thromboembolism with fondaparinux after hip fracture surgery: a multicenter, randomized, placebo-controlled, double-blind study. Arch Intern Med. 2003;163(11):1337-1342. doi:10.1001/archinte.163.11.1337.
6. Handoll HH, Farrar MJ, McBirnie J, Tytherleigh-Strong G, Milne AA, Gillespie WJ. Heparin, low molecular weight heparin and physical methods for preventing deep vein thrombosis and pulmonary embolism following surgery for hip fractures. Cochrane Database Syst Rev.2002;(4):Cd000305. doi:10.1002/14651858.cd000305.
7. Avenell A, Handoll HH. Nutritional supplementation for hip fracture aftercare in the elderly. Cochrane Database Syst Rev. 2004;(1):Cd001880. doi:10.1002/14651858.CD001880.pub2.
8. Marcantonio ER, Flacker JM, Wright RJ, Resnick NM. Reducing delirium after hip fracture: a randomized trial. J Am Geriatr Soc. 2001;49(5):516-522. doi:10.1046/j.1532-5415.2001.49108.x.
9. Deschodt M, Braes T, Flamaing J, et al. Preventing delirium in older adults with recent hip fracture through multidisciplinary geriatric consultation. J Am Geriatr Soc. 2012;60(4):733-739. doi:10.1111/j.1532-5415.2012.03899.x.
10. Marcantonio ER, Palihnich K, Appleton P, Davis RB. Pilot randomized trial of donepezil hydrochloride for delirium after hip fracture. J Am Geriatr Soc. 2011;59 Suppl 2:S282-S288. doi:10.1111/j.1532-5415.2011.03691.x.
11. Parker MJ. Iron supplementation for anemia after hip fracture surgery: a randomized trial of 300 patients. J Bone Joint Surg Am. 2010;92(2):265-269. doi:10.2106/jbjs.i.00883.
12. Urwin SC, Parker MJ, Griffiths R. General versus regional anaesthesia for hip fracture surgery: a meta-analysis of randomized trials. Br J Anaesth. 2000;84(4):450-455. doi:10.1093/oxfordjournals.bja.a013468.
13. Bohl DD, Basques BA, Golinvaux NS, Baumgaertner MR, Grauer JN. Nationwide Inpatient Sample and National Surgical Quality Improvement Program give different results in hip fracture studies. Clin Orthop Relat Res. 2014;472(6):1672-1680. doi:10.1007/s11999-014-3559-0.
14. Bohl DD, Grauer JN, Leopold SS. Editor's spotlight/Take 5: nationwide inpatient sample and national surgical quality improvement program give different results in hip fracture studies. Clin Orthop Relat Res. 2014;472(6):1667-1671. doi:10.1007/s11999-014-3595-9.
15. Bohl DD, Russo GS, Basques BA, et al. Variations in data collection methods between national databases affect study results: a comparison of the nationwide inpatient sample and national surgical quality improvement program databases for lumbar spine fusion procedures. J Bone Joint Surg Am. 2014;96(23):e193. doi:10.2106/jbjs.m.01490.
16. Levin PE. Apples, oranges, and national databases: commentary on an article by Daniel D. Bohl, MPH, et al.: "Variations in data collection methods between national databases affect study results: a comparison of the nationwide inpatient sample and national surgical quality improvement program databases for lumbar spine fusion procedures.” J Bone Joint Surg Am. 2014;96(23):e198. doi:10.2106/jbjs.n.00890.
17. Basques BA, Bohl DD, Golinvaux NS, Leslie MP, Baumgaertner MR, Grauer JN. Postoperative length of stay and thirty-day readmission following geriatric hip fracture: an analysis of 8,434 patients. J Orthop Trauma. 2015;29(3):e115-e120. doi:10.1097/bot.0000000000000222.
18. Golinvaux NS, Bohl DD, Basques BA, Baumgaertner MR, Grauer JN. Diabetes confers little to no increased risk of postoperative complications after hip fracture surgery in geriatric patients. Clin Orthop Relat Res. 2015;473(3):1043-1051. doi:10.1007/s11999-014-3945-7.
19. Maciejewski ML, Radcliff TA, Henderson WG, et al. Determinants of postsurgical discharge setting for male hip fracture patients. J Rehabil Res Dev. 2013;50(9):1267-1276. doi:10.1682/jrrd.2013.02.0041.
20. Molina CS, Thakore RV, Blumer A, Obremskey WT, Sethi MK. Use of the National Surgical Quality Improvement Program in orthopaedic surgery. Clin Orthop Relat Res.2015;473(5):1574-1581. doi:10.1007/s11999-014-3597-7.
21. Bohl DD, Basques BA, Golinvaux NS, Miller CP, Baumgaertner MR, Grauer JN. Extramedullary compared with intramedullary implants for intertrochanteric hip fractures: thirty-day outcomes of 4432 procedures from the ACS NSQIP database. J Bone Joint Surg Am. 2014;96(22):1871-1877. doi:10.2106/jbjs.n.00041.
22. Alosh H, Riley LH 3rd, Skolasky RL. Insurance status, geography, race, and ethnicity as predictors of anterior cervical spine surgery rates and in-hospital mortality: an examination of United States trends from 1992 to 2005. Spine (Phila Pa 1976). 2009;34(18):1956-1962. doi:10.1097/BRS.0b013e3181ab930e.
23. Cahill KS, Chi JH, Day A, Claus EB. Prevalence, complications, and hospital charges associated with use of bone-morphogenetic proteins in spinal fusion procedures. JAMA.2009;302(1):58-66. doi:10.1001/jama.2009.956.
24. Ingraham AM, Richards KE, Hall BL, Ko CY. Quality improvement in surgery: the American College of Surgeons National Surgical Quality Improvement Program approach. Adv Surg. 2010;44(1):251-267. doi:10.1016/j.yasu.2010.05.003.
25. Shiloach M, Frencher SK Jr, Steeger JE, et al. Toward robust information: data quality and inter-rater reliability in the American College of Surgeons National Surgical Quality Improvement Program. J Am Coll Surg. 2010;210(1):6-16. doi:10.1016/j.jamcollsurg.2009.09.031.
26. ACS-NSQIP. Data Use Agreement. American College of Surgeons Web site. https://www.facs.org/quality-programs/acs-nsqip/participant-use/puf-form. Accessed September 20, 2018.
27. Blacher J, Guerin AP, Pannier B, Marchais SJ, London GM. Arterial calcifications, arterial stiffness, and cardiovascular risk in end-stage renal disease. Hypertension. 2001;38(4):938-942. doi:10.1161/hy1001.096358.
28. Browne JA, Cook C, Olson SA, Bolognesi MP. Resident duty-hour reform associated with increased morbidity following hip fracture. J Bone Joint Surg Am. 2009;91(9):2079-2085. doi:10.2106/jbjs.h.01240.
29. Browne JA, Pietrobon R, Olson SA. Hip fracture outcomes: does surgeon or hospital volume really matter? J Trauma. 2009;66(3):809-814. doi:10.1097/TA.0b013e31816166bb.
30. Menendez ME, Ring D. Failure to rescue after proximal femur fracture surgery. J Orthop Trauma. 2015;29(3):e96-e102. doi:10.1097/bot.0000000000000234.
31. Nikkel LE, Fox EJ, Black KP, Davis C, Andersen L, Hollenbeak CS. Impact of comorbidities on hospitalization costs following hip fracture. J Bone Joint Surg Am. 2012;94(1):9-17. doi:10.2106/jbjs.j.01077.
32. Anderson KL, Koval KJ, Spratt KF. Hip fracture outcome: is there a “July effect”? Am J Orthop. 2009;38(12):606-611.
33. Koval KJ, Rust CL, Spratt KF. The effect of hospital setting and teaching status on outcomes after hip fracture. Am J Orthop. 2011;40(1):19-28.
34. Bacon WE. Secular trends in hip fracture occurrence and survival: age and sex differences. J Aging Health. 1996;8(4):538-553. doi:10.1177/089826439600800404.
35. Orces CH. In-hospital hip fracture mortality trends in older adults: the National Hospital Discharge Survey, 1988-2007. J Am Geriatr Soc. 2013;61(12):2248-2249. doi:10.1111/jgs.12567.
TAKE-HOME POINTS
- The median postoperative day of diagnosis for myocardial infarction was 3, 3 for cardiac arrest requiring cardiopulmonary resuscitation, 3 for stroke, 4 for pneumonia, 4 for pulmonary embolism, 7 for urinary tract infection, 9 for deep vein thrombosis, 9 for sepsis, 11 for mortality, and 16 for surgical site infection.
- For the earliest diagnosed adverse events, the rate of adverse events had diminished by postoperative day 30; however, for the later diagnosed adverse events, the rate of adverse events remained high at postoperative day 30.
- The proportions of adverse events diagnosed prior to discharge were 81.0% for myocardial infarction, 77.8% for stroke, 76.1% for cardiac arrest requiring cardiopulmonary resuscitation, 71.9% for pulmonary embolism, 71.1% for pneumonia, 58.0% for urinary tract infection, 52.1% for sepsis, 46.9% for deep vein thrombosis, 44.3% for mortality, and 27.6% for surgical site infection.
- These results facilitate targeted clinical surveillance, guide patient counseling, and inform the duration of follow-up required in research studies.
- Clinicians should have the lowest threshold for testing for each adverse event during the time period of greatest risk.
Vemurafenib-Induced Plantar Hyperkeratosis
To the Editor:
Vemurafenib, a selective BRAF inhibitor, is a chemotherapeutic agent used in the treatment of metastatic melanoma with BRAF mutations. It has been associated with various cutaneous side effects. We report a case of metastatic melanoma with acquired plantar hyperkeratosis secondary to vemurafenib therapy.
A 49-year-old man presented for evaluation of a pigmented plaque on the left pretibial region that had been enlarging over the last 2 months. The lesion had been diagnosed as folliculitis by his primary care physician 1 month prior to the current presentation and was being treated with oral antibiotics. The patient reported occasional bleeding from the lesion but denied other symptoms. Physical examination revealed a 1.4-cm pigmented plaque distributed over the left shin. Excisional biopsy was performed to rule out melanoma. Histopathology revealed well-circumscribed and symmetric proliferation of nested and single atypical melanocytes throughout all layers to the deep reticular dermis, confirming a clinical diagnosis of malignant melanoma. The lesion demonstrated angiolymphatic invasion, mitotic activity, and a Breslow depth of 2.5 mm. The patient underwent wide local excision with 3-cm margins and left inguinal sentinel lymph node biopsy; 2 of 14 lymph nodes were positive for melanoma. Positron emission tomography–computed tomography was negative for further metastatic disease. The patient underwent isolated limb perfusion with ipilimumab, but treatment was discontinued due to regional progression of multiple cutaneous metastases that were positive for the BRAF V600E mutation.
The patient was then started on vemurafenib therapy. Within 2 weeks, the patient reported various cutaneous symptoms, including morbilliform drug eruption covering approximately 70% of the body surface area that resolved with topical steroids and oral antihistamines, as well as the appearance of melanocytic nevi on the posterior neck, back, and abdomen. After 5 months of vemurafenib therapy, the patient began to develop hyperkeratosis of the bilateral soles of the feet (Figure). A diagnosis of acquired plantar hyperkeratosis secondary to vemurafenib therapy was made. Treatment with keratolytics was initiated and vemurafenib was not discontinued. The patient died approximately 1 year after therapy was started.
Metastatic melanoma is challenging to treat and continues to have a high mortality rate; however, newer chemotherapeutic agents targeting specific mutations found in melanoma, including the BRAF V600E mutation, are promising.
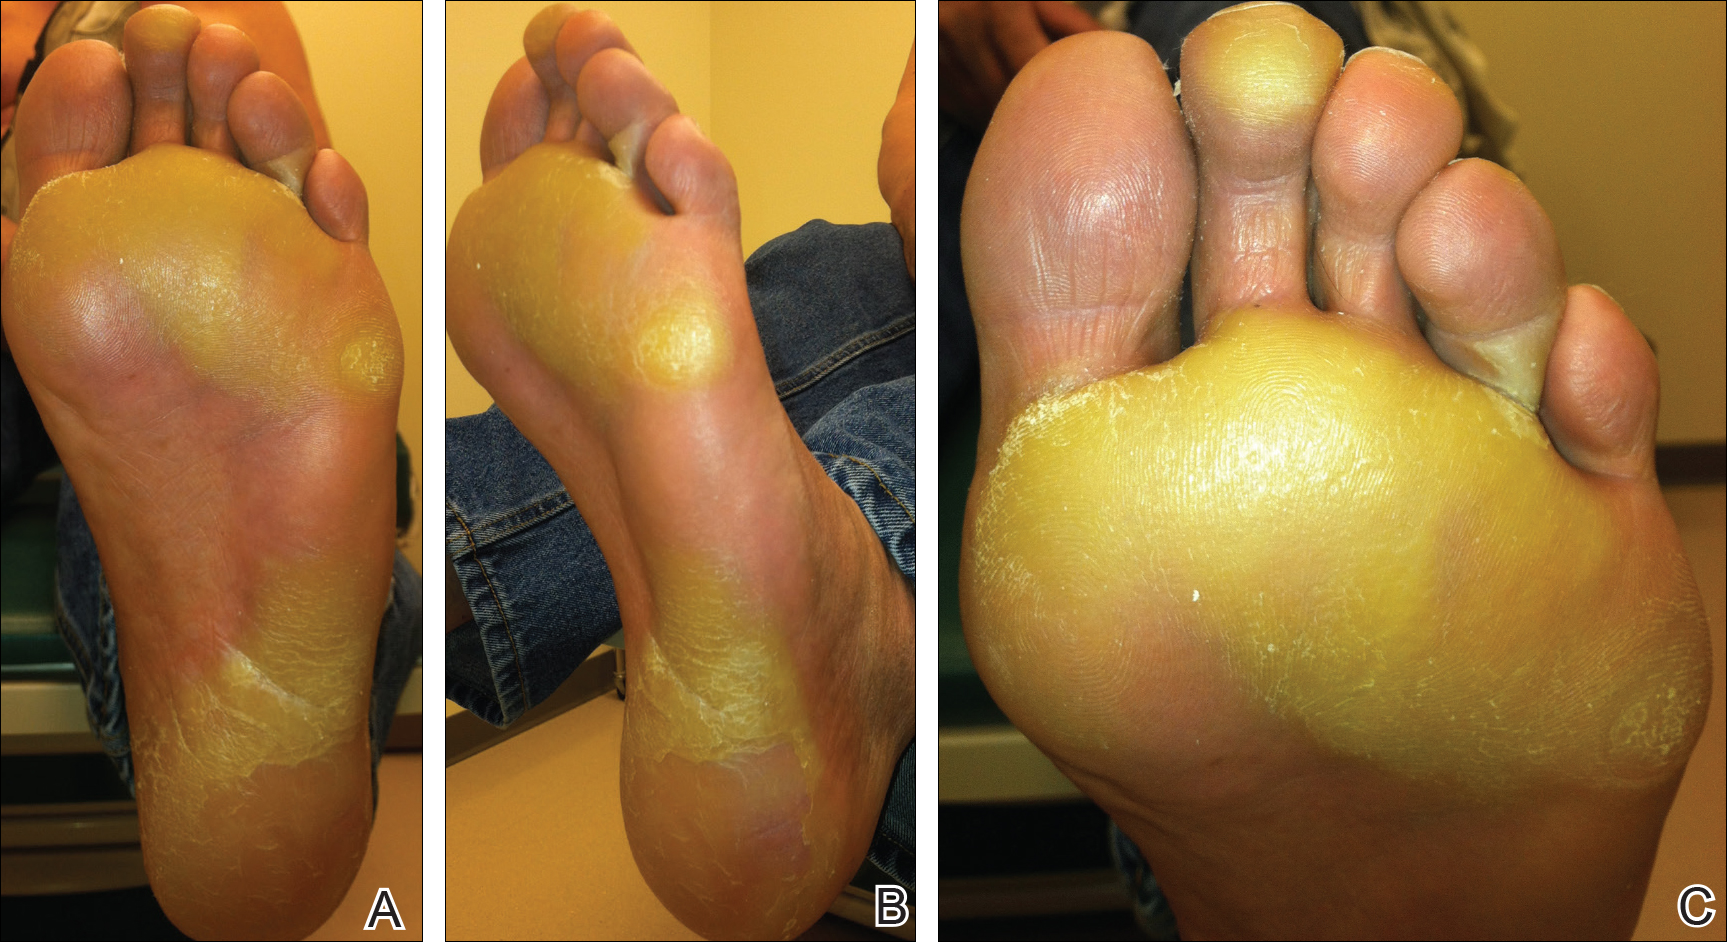
The US Food and Drug Administration first approved vemurafenib, a selective BRAF inhibitor, in 2011 for treatment of metastatic melanoma. Activating BRAF mutations have been detected in up to 60% of cutaneous melanomas.1 In the majority of these mutations, valine (V) is inserted at codon 600 instead of glutamic acid (E); therefore, the mutation is named V600E.2 In a phase 3 trial of 675 metastatic melanoma patients with positive V600E who were randomized to receive either vemurafenib or dacarbazine, the overall survival rate in the vemurafenib group improved by 84% versus 64% in the dacarbazine group at 6 months.3
Vemurafenib and other BRAF inhibitors have been associated with multiple cutaneous side effects, including rash, alopecia, squamous cell carcinoma, photosensitivity, evolution of existing nevi, and less commonly palmoplantar hyperkeratosis.2-5 Constitutional symptoms including arthralgia, nausea, and fatigue also have been commonly reported.2-5 In several large studies comprising 1138 patients, cutaneous side effects were seen in 92% to 95% of patients.3,5 Adverse effects caused interruption or modification of therapy in 38% of patients.3
Palmoplantar keratoderma is a known side effect of vemurafenib therapy, but it is less commonly reported than other cutaneous adverse effects. It is believed that vemurafenib has the ability to paradoxically activate the mitogen-activated protein kinase pathway, leading to keratinocyte proliferation in cells without BRAF mutations.6-8 In the phase 3 trial, approximately 23% to 30% of patients developed some form of hyperkeratosis.5 Comparatively, 64% of patients developed a rash and 23% developed cutaneous squamous cell carcinoma. Incidence of palmoplantar hyperkeratosis was similar in the vemurafenib and dabrafenib groups (6% vs 8%).3,9 Development of keratoderma also has been associated with other multikinase inhibitors (eg, sorafenib, sunitinib).10,11
In our case, the patient displayed multiple side effects while undergoing vemurafenib therapy. Within the first 2 weeks of therapy, he experienced a drug eruption that affected approximately 70% of the body surface area. The eruption resolved with topical steroids and oral antihistamines. The patient also noted the appearance of several new melanocytic nevi on the posterior neck as well as several evolving nevi on the back and abdomen. Five months into the treatment cycle, the patient began to develop hyperkeratosis on the bilateral plantar feet. Treatment consisted of keratolytics. Vemurafenib therapy was not discontinued secondary to any adverse effects.
Vemurafenib and other BRAF inhibitors are efficacious in the treatment of metastatic melanoma with V600E mutations. The use of these therapies is likely to continue and increase in the future. BRAF inhibitors have been associated with a variety of side effects, including palmoplantar hyperkeratosis. Awareness of and appropriate response to adverse reactions is essential to proper patient care and continuation of potentially life-extending therapies.
- Davies H, Bignell GR, Cox C, et al. Mutations in the BRAF gene in human cancer. Nature. 2002;417:949-954.
- Cohen PR, Bedikian AY, Kim KB. Appearance of new vemurafenib-associated melanocytic nevi on normal-appearing skin: case series and a review of changing or new pigmented lesions in patients with metastatic malignant melanoma after initiating treatment with vemurafenib. J Clin Aesthet Dermatol. 2013;6:27-37.
- Chapman PB, Hauschild A, Robert C, et al; BRIM-3 Study Group. Improved survival with vemurafenib in melanoma with BRAF V600E mutation. N Engl J Med. 2011;364:2507-2516.
- Rinderknecht JD, Goldinger SM, Rozati S, et al. RASopathic skin eruptions during vemurafenib therapy [published online March 13, 2014]. PLoS One. 2013;8:e58721.
- Lacouture ME, Duvic M, Hauschild A, et al. Analysis of dermatologic events in vemurafenib-treated patients with melanoma. Oncologist. 2013;18:314-322.
- Boussemart L, Routier E, Mateus C, et al. Prospective study of cutaneous side-effects associated with the BRAF inhibitor vemurafenib: a study of 42 patients. Ann Oncol. 2013;24:1691-1697.
- Su F, Bradley WD, Wang Q, et al. Resistance to selective BRAF inhibition can be mediated by modest upstream pathway activation. Cancer Res. 2012;72:969-978.
- Hatzivassiliou G, Song K, Yen I, et al. RAF inhibitors prime wild-type RAF to activate the MAPK pathway and enhance growth. Nature. 2010;464:431-435.
- Hauschild A, Grob JJ, Demidov LV, et al. Dabrafenib in BRAF-mutated metastatic melanoma: a multicentre, open-label, phase 3 randomised controlled trial. Lancet. 2012;380:358-365.
- Autier J, Escudier B, Wechsler J, et al. Prospective study of the cutaneous adverse effects of sorafenib, a novel multikinase inhibitor. Arch Dermatol. 2008;144:886-892.
- Degen A, Alter M, Schenck F, et al. The hand-foot-syndrome associated with medical tumor therapy—classification and management. J Dtsch Dermatol Ges. 2010;8:652-661.
To the Editor:
Vemurafenib, a selective BRAF inhibitor, is a chemotherapeutic agent used in the treatment of metastatic melanoma with BRAF mutations. It has been associated with various cutaneous side effects. We report a case of metastatic melanoma with acquired plantar hyperkeratosis secondary to vemurafenib therapy.
A 49-year-old man presented for evaluation of a pigmented plaque on the left pretibial region that had been enlarging over the last 2 months. The lesion had been diagnosed as folliculitis by his primary care physician 1 month prior to the current presentation and was being treated with oral antibiotics. The patient reported occasional bleeding from the lesion but denied other symptoms. Physical examination revealed a 1.4-cm pigmented plaque distributed over the left shin. Excisional biopsy was performed to rule out melanoma. Histopathology revealed well-circumscribed and symmetric proliferation of nested and single atypical melanocytes throughout all layers to the deep reticular dermis, confirming a clinical diagnosis of malignant melanoma. The lesion demonstrated angiolymphatic invasion, mitotic activity, and a Breslow depth of 2.5 mm. The patient underwent wide local excision with 3-cm margins and left inguinal sentinel lymph node biopsy; 2 of 14 lymph nodes were positive for melanoma. Positron emission tomography–computed tomography was negative for further metastatic disease. The patient underwent isolated limb perfusion with ipilimumab, but treatment was discontinued due to regional progression of multiple cutaneous metastases that were positive for the BRAF V600E mutation.
The patient was then started on vemurafenib therapy. Within 2 weeks, the patient reported various cutaneous symptoms, including morbilliform drug eruption covering approximately 70% of the body surface area that resolved with topical steroids and oral antihistamines, as well as the appearance of melanocytic nevi on the posterior neck, back, and abdomen. After 5 months of vemurafenib therapy, the patient began to develop hyperkeratosis of the bilateral soles of the feet (Figure). A diagnosis of acquired plantar hyperkeratosis secondary to vemurafenib therapy was made. Treatment with keratolytics was initiated and vemurafenib was not discontinued. The patient died approximately 1 year after therapy was started.
Metastatic melanoma is challenging to treat and continues to have a high mortality rate; however, newer chemotherapeutic agents targeting specific mutations found in melanoma, including the BRAF V600E mutation, are promising.
The US Food and Drug Administration first approved vemurafenib, a selective BRAF inhibitor, in 2011 for treatment of metastatic melanoma. Activating BRAF mutations have been detected in up to 60% of cutaneous melanomas.1 In the majority of these mutations, valine (V) is inserted at codon 600 instead of glutamic acid (E); therefore, the mutation is named V600E.2 In a phase 3 trial of 675 metastatic melanoma patients with positive V600E who were randomized to receive either vemurafenib or dacarbazine, the overall survival rate in the vemurafenib group improved by 84% versus 64% in the dacarbazine group at 6 months.3
Vemurafenib and other BRAF inhibitors have been associated with multiple cutaneous side effects, including rash, alopecia, squamous cell carcinoma, photosensitivity, evolution of existing nevi, and less commonly palmoplantar hyperkeratosis.2-5 Constitutional symptoms including arthralgia, nausea, and fatigue also have been commonly reported.2-5 In several large studies comprising 1138 patients, cutaneous side effects were seen in 92% to 95% of patients.3,5 Adverse effects caused interruption or modification of therapy in 38% of patients.3
Palmoplantar keratoderma is a known side effect of vemurafenib therapy, but it is less commonly reported than other cutaneous adverse effects. It is believed that vemurafenib has the ability to paradoxically activate the mitogen-activated protein kinase pathway, leading to keratinocyte proliferation in cells without BRAF mutations.6-8 In the phase 3 trial, approximately 23% to 30% of patients developed some form of hyperkeratosis.5 Comparatively, 64% of patients developed a rash and 23% developed cutaneous squamous cell carcinoma. Incidence of palmoplantar hyperkeratosis was similar in the vemurafenib and dabrafenib groups (6% vs 8%).3,9 Development of keratoderma also has been associated with other multikinase inhibitors (eg, sorafenib, sunitinib).10,11
In our case, the patient displayed multiple side effects while undergoing vemurafenib therapy. Within the first 2 weeks of therapy, he experienced a drug eruption that affected approximately 70% of the body surface area. The eruption resolved with topical steroids and oral antihistamines. The patient also noted the appearance of several new melanocytic nevi on the posterior neck as well as several evolving nevi on the back and abdomen. Five months into the treatment cycle, the patient began to develop hyperkeratosis on the bilateral plantar feet. Treatment consisted of keratolytics. Vemurafenib therapy was not discontinued secondary to any adverse effects.
Vemurafenib and other BRAF inhibitors are efficacious in the treatment of metastatic melanoma with V600E mutations. The use of these therapies is likely to continue and increase in the future. BRAF inhibitors have been associated with a variety of side effects, including palmoplantar hyperkeratosis. Awareness of and appropriate response to adverse reactions is essential to proper patient care and continuation of potentially life-extending therapies.
- Davies H, Bignell GR, Cox C, et al. Mutations in the BRAF gene in human cancer. Nature. 2002;417:949-954.
- Cohen PR, Bedikian AY, Kim KB. Appearance of new vemurafenib-associated melanocytic nevi on normal-appearing skin: case series and a review of changing or new pigmented lesions in patients with metastatic malignant melanoma after initiating treatment with vemurafenib. J Clin Aesthet Dermatol. 2013;6:27-37.
- Chapman PB, Hauschild A, Robert C, et al; BRIM-3 Study Group. Improved survival with vemurafenib in melanoma with BRAF V600E mutation. N Engl J Med. 2011;364:2507-2516.
- Rinderknecht JD, Goldinger SM, Rozati S, et al. RASopathic skin eruptions during vemurafenib therapy [published online March 13, 2014]. PLoS One. 2013;8:e58721.
- Lacouture ME, Duvic M, Hauschild A, et al. Analysis of dermatologic events in vemurafenib-treated patients with melanoma. Oncologist. 2013;18:314-322.
- Boussemart L, Routier E, Mateus C, et al. Prospective study of cutaneous side-effects associated with the BRAF inhibitor vemurafenib: a study of 42 patients. Ann Oncol. 2013;24:1691-1697.
- Su F, Bradley WD, Wang Q, et al. Resistance to selective BRAF inhibition can be mediated by modest upstream pathway activation. Cancer Res. 2012;72:969-978.
- Hatzivassiliou G, Song K, Yen I, et al. RAF inhibitors prime wild-type RAF to activate the MAPK pathway and enhance growth. Nature. 2010;464:431-435.
- Hauschild A, Grob JJ, Demidov LV, et al. Dabrafenib in BRAF-mutated metastatic melanoma: a multicentre, open-label, phase 3 randomised controlled trial. Lancet. 2012;380:358-365.
- Autier J, Escudier B, Wechsler J, et al. Prospective study of the cutaneous adverse effects of sorafenib, a novel multikinase inhibitor. Arch Dermatol. 2008;144:886-892.
- Degen A, Alter M, Schenck F, et al. The hand-foot-syndrome associated with medical tumor therapy—classification and management. J Dtsch Dermatol Ges. 2010;8:652-661.
Practice Points
- BRAF inhibitors such as vemurafenib are associated with a high incidence of cutaneous side effects, including rash, hyperkeratosis, and cutaneous squamous cell carcinoma.
- Practitioners should be aware of these side effects and their management to avoid discontinuation or interruption of therapy.