User login
ATLAS: High-risk RCC patients might benefit from adjuvant axitinib
While adjuvant axitinib failed to improve disease-free survival in a recent phase 3 renal cell carcinoma (RCC) trial, the highest-risk subgroup appeared to benefit, according to a report on the study.
The phase 3 ATLAS trial was stopped early because of a lack of benefit for axitinib versus placebo in the study, which included patients with locoregional RCC at risk of recurrence after nephrectomy.
However, a prespecified analysis showed that axitinib reduced risk of disease-free survival events by about one-third in the highest-risk subset of patients, according to investigator David I. Quinn, MD, USC Norris Comprehensive Cancer Center, Los Angeles, and colleagues.
That finding tracks with results of the earlier S-TRAC trial, in which patients at high risk of tumor recurrence after nephrectomy had significantly longer disease-free survival with sunitinib versus placebo, Dr. Quinn and coauthors said.
“Taken together, these results support that patients at highest risk for RCC recurrence benefit from adjuvant treatment,” they wrote in Annals of Oncology.
In the ATLAS trial, Dr. Quinn and coinvestigators at 137 centers in eight countries enrolled 724 adults with newly diagnosed renal cell carcinoma (greater than or equal to pT2 and/or N+, any Fuhrman grade) with Eastern Cooperative Oncology Group status of 0 or 1 and prior nephrectomy.
Patients were randomly assigned to oral, twice-daily axitinib 5 mg or placebo for up to 3 years of treatment, and at least 1 year of treatment provided there was no recurrence, substantial toxicity, or withdrawal of consent.
For the primary endpoint, disease-free survival per independent review committee assessment, the hazard ratio was 0.870 (95% confidence interval, 0.660-1.147; P = .3211), according to the report. Disease-free survival as rated by investigators showed a somewhat larger but still not statistically significant reduction in risk of an event, Dr. Quinn and colleagues said.
However, in the prespecified subgroup analyses, the patients at highest risk (pT3 with Fuhrman grade greater than or equal to 3 or pT4 and/or N+, any T, any Fuhrman grade) had a reduction of risk with hazard ratios of 0.735 per independent review committee (P = .0704) and 0.641 per investigator (P = .0051).
The ATLAS study was designed before results of the S-TRAC study were known, and so patients at lower risk of recurrence were included, said Dr. Quinn and coauthors.
Ongoing trials are looking at sorafenib, everolimus, and immune checkpoint inhibitors in the adjuvant RCC setting, they noted in their discussion of ATLAS, S-TRAC, and other investigations.
Results from these trials may provide clarification on the future of adjuvant treatment for RCC, and whether angiogenesis inhibition is the key mechanism to obtain a reduction in risk of relapse after nephrectomy,” they said.
The study was sponsored by Pfizer and SFJ Pharmaceuticals. Dr. Quinn reported providing advisory board services for Pfizer, Bayer, Novartis, Bristol-Myers Squibb, Merck, Exelixis, Genentech, Roche, AstraZeneca, and Astellas. Coauthors reported disclosures related to Bristol-Myers Squibb, Ipsen, MSD, Novartis, Pfizer, and Roche, among others.
SOURCE: Quinn DI et al. Ann Oncol. 2018 Oct 20. doi: 10.1093/annonc/mdy454.
FROM ANNALS OF ONCOLOGY
Key clinical point: While adjuvant axitinib failed to improve disease-free survival in a recent phase 3 renal cell carcinoma trial, the highest-risk subgroup appeared to benefit.
Major finding: The highest-risk subpopulation (pT3 with Fuhrman grade greater than or equal to 3 or pT4 and/or N+, any T, any Fuhrman grade) had a reduction of risk per assessments by independent review committee (HR, 0.735; P = .0704) and investigators (HR, 0.641; P = .0051).
Study details: Results from ATLAS, a phase 3, randomized trial including 724 patients with locoregional RCC.
Disclosures: The study was sponsored by Pfizer and SFJ Pharmaceuticals. Study authors reported disclosures related to Pfizer, Bayer, Novartis, Bristol-Myers Squibb, Merck, Exelixis, Genentech, Roche, AstraZeneca, and Astellas, among others.
Source: Quinn DI et al. Ann Oncol. 2018 Oct 20. doi: 10.1093/annonc/mdy454.
Where to go with wearables
On Sept. 14 of this year, Apple executives took to the stage to tout the incredible benefits of their new Apple Watch Series 4. While impressively presented in typical Apple fashion, the watch appeared to be only an evolution – not a revolution – in wearable technology. Still, there were a few noteworthy aspects of the new model that seemed to shine a light on the direction of the industry as a whole, and these were all focused on health care.

Like products from FitBit, Garmin, and others, the new Apple Watch can monitor a user’s heart rate and notify if it goes too high or too low. In addition, the watch now includes “fall detection,” and can automatically call for help if its wearer has taken a spill and become unresponsive. Soon it will even be capable of recording a single-lead ECG and detecting atrial fibrillation. While this all sounds fantastic, it also raises an important question in the minds of many physicians (including us): What do we do with all of these new data?
Findings from a Digital Health Study published by the American Medical Association in 20161 reveal that most doctors are aware of growing advances in Mobile Health (mHealth). Interestingly, however, while 85% see potential advantages in mHealth, less than 30% have begun employing it in their practices. This speaks to an adoption divide and highlights the many barriers to overcome before we can bridge it.
First and foremost, providers need confidence in the accuracy of the monitoring equipment, and, thus far, that accuracy has been questionable. Heart rate measurement, for example, is a staple of all currently available fitness wearables, yet is replete with technological pitfalls. This is because most consumer devices rely on optical sensors to measure heart rate. While inexpensive and noninvasive, the accuracy of these sensors can be affected by the interference of sweat, movement, and even the patient’s skin conditions – so much so that FitBit is currently embroiled in a class action lawsuit2 over the issue, in spite of providing disclaimers that a FitBit is “not a medical device.” To improve heart-monitoring capability, Apple has changed to a new sensor technology for this latest generation of Apple Watch. So far its accuracy has yet to be proven, and Apple’s delay in releasing the ECG features until “later this year” suggests there may still be bugs to work out.
Another significant concern raised by the onslaught of wearable health data is how to incorporate it into the electronic health record. Physicians care about efficient data integration, and, when asked in the aforementioned AMA study, physicians named this as their No. 1 functional requirement. EHR vendors have made some strides to allow patients to upload monitoring data directly through an online portal, but the large variety of available consumer devices has made standardizing this process difficult. Doctors have also made it clear that they want it to be straightforward to access and use the information provided by patients, and don’t want it to require special training. These are considerable challenges that will require collaboration between EHR vendors and wearable manufacturers to solve.
The introduction of additional players into the health care space also evokes questions of who owns this new health data set, and who is accountable for its integrity. If history is any indicator, device manufacturers will try their best to eschew any liability, and shift culpability onto patients and physicians. This is causing malpractice insurers to rethink policy coverage and forcing doctors to face a new reality of having “too much information.” While we are excited about the potential for better access to patient monitoring data, we agree that physicians need to understand where their responsibility for these data begins and ends.
Likewise, patients need to understand who has access to their personal health information, and how it’s being used. Privacy concerns will only become more evident as our society becomes ever more connected and as technologies become more invasive. The term “wearable” may soon become antiquated, as more products are coming to market that cross the skin barrier to collect samples directly from the blood or interstitial fluid. Devices such as Abbott’s new FreeStyle Libre continuous blood glucose monitor can be worn for weeks at a time, with its tiny sensor placed just under the skin. It constantly monitors trends in blood sugar and produces enough data points to determine the eating, sleeping, and activity habits of its wearer. This is all uploadable to Abbott’s servers, allowing patients and their providers to review it, thereby further expanding their personal health information footprint.
One encouraging aspect of the expansion mobile health technology is its organic, patient-led adoption. This is quite different from the epoch of electronic health records, which was motivated largely by government financial incentives and resulted in expensive, inefficient software. Patients are expressing a greater desire to take ownership of their health and have a growing interest in personal fitness. Also, the size of the consumer marketplace is forcing vendors to create competitive, high-value, and user-friendly mHealth devices. These products may seem to offer endless possibilities, but patients, vendors, and providers must fully acknowledge existing limitations in order to truly spark a revolution in wearable technology and actually improve patient care.
Dr. Notte is a family physician and clinical informaticist for Abington (Pa.) Memorial Hospital. He is a partner in EHR Practice Consultants, a firm that aids physicians in adopting electronic health records. Dr. Skolnik is a professor of family and community medicine at Jefferson Medical College, Philadelphia, and an associate director of the family medicine residency program at Abington Jefferson Health.
References
1. Digital Health Study: Physicians’ motivations and requirements for adopting digital clinical tools. (2016) American Medical Association.
2. Kate Mclellan et al. v. Fitbit Inc. Fitbit Heart Rate Monitors Fraud & Defects Lawsuit.
On Sept. 14 of this year, Apple executives took to the stage to tout the incredible benefits of their new Apple Watch Series 4. While impressively presented in typical Apple fashion, the watch appeared to be only an evolution – not a revolution – in wearable technology. Still, there were a few noteworthy aspects of the new model that seemed to shine a light on the direction of the industry as a whole, and these were all focused on health care.
Like products from FitBit, Garmin, and others, the new Apple Watch can monitor a user’s heart rate and notify if it goes too high or too low. In addition, the watch now includes “fall detection,” and can automatically call for help if its wearer has taken a spill and become unresponsive. Soon it will even be capable of recording a single-lead ECG and detecting atrial fibrillation. While this all sounds fantastic, it also raises an important question in the minds of many physicians (including us): What do we do with all of these new data?
Findings from a Digital Health Study published by the American Medical Association in 20161 reveal that most doctors are aware of growing advances in Mobile Health (mHealth). Interestingly, however, while 85% see potential advantages in mHealth, less than 30% have begun employing it in their practices. This speaks to an adoption divide and highlights the many barriers to overcome before we can bridge it.
First and foremost, providers need confidence in the accuracy of the monitoring equipment, and, thus far, that accuracy has been questionable. Heart rate measurement, for example, is a staple of all currently available fitness wearables, yet is replete with technological pitfalls. This is because most consumer devices rely on optical sensors to measure heart rate. While inexpensive and noninvasive, the accuracy of these sensors can be affected by the interference of sweat, movement, and even the patient’s skin conditions – so much so that FitBit is currently embroiled in a class action lawsuit2 over the issue, in spite of providing disclaimers that a FitBit is “not a medical device.” To improve heart-monitoring capability, Apple has changed to a new sensor technology for this latest generation of Apple Watch. So far its accuracy has yet to be proven, and Apple’s delay in releasing the ECG features until “later this year” suggests there may still be bugs to work out.
Another significant concern raised by the onslaught of wearable health data is how to incorporate it into the electronic health record. Physicians care about efficient data integration, and, when asked in the aforementioned AMA study, physicians named this as their No. 1 functional requirement. EHR vendors have made some strides to allow patients to upload monitoring data directly through an online portal, but the large variety of available consumer devices has made standardizing this process difficult. Doctors have also made it clear that they want it to be straightforward to access and use the information provided by patients, and don’t want it to require special training. These are considerable challenges that will require collaboration between EHR vendors and wearable manufacturers to solve.
The introduction of additional players into the health care space also evokes questions of who owns this new health data set, and who is accountable for its integrity. If history is any indicator, device manufacturers will try their best to eschew any liability, and shift culpability onto patients and physicians. This is causing malpractice insurers to rethink policy coverage and forcing doctors to face a new reality of having “too much information.” While we are excited about the potential for better access to patient monitoring data, we agree that physicians need to understand where their responsibility for these data begins and ends.
Likewise, patients need to understand who has access to their personal health information, and how it’s being used. Privacy concerns will only become more evident as our society becomes ever more connected and as technologies become more invasive. The term “wearable” may soon become antiquated, as more products are coming to market that cross the skin barrier to collect samples directly from the blood or interstitial fluid. Devices such as Abbott’s new FreeStyle Libre continuous blood glucose monitor can be worn for weeks at a time, with its tiny sensor placed just under the skin. It constantly monitors trends in blood sugar and produces enough data points to determine the eating, sleeping, and activity habits of its wearer. This is all uploadable to Abbott’s servers, allowing patients and their providers to review it, thereby further expanding their personal health information footprint.
One encouraging aspect of the expansion mobile health technology is its organic, patient-led adoption. This is quite different from the epoch of electronic health records, which was motivated largely by government financial incentives and resulted in expensive, inefficient software. Patients are expressing a greater desire to take ownership of their health and have a growing interest in personal fitness. Also, the size of the consumer marketplace is forcing vendors to create competitive, high-value, and user-friendly mHealth devices. These products may seem to offer endless possibilities, but patients, vendors, and providers must fully acknowledge existing limitations in order to truly spark a revolution in wearable technology and actually improve patient care.
Dr. Notte is a family physician and clinical informaticist for Abington (Pa.) Memorial Hospital. He is a partner in EHR Practice Consultants, a firm that aids physicians in adopting electronic health records. Dr. Skolnik is a professor of family and community medicine at Jefferson Medical College, Philadelphia, and an associate director of the family medicine residency program at Abington Jefferson Health.
References
1. Digital Health Study: Physicians’ motivations and requirements for adopting digital clinical tools. (2016) American Medical Association.
2. Kate Mclellan et al. v. Fitbit Inc. Fitbit Heart Rate Monitors Fraud & Defects Lawsuit.
Low sexual desire: Appropriate use of testosterone in menopausal women
CASE Midlife woman with low libido causing distress
At her annual gynecologic visit, a 55-year-old woman notes that she has almost no interest in sex. In the past, her libido was good and relations were pleasurable. Since her mid-40s, she has noticed a gradual decline in libido and orgasmic response. Sexual frequency has declined from once or twice weekly to just a few times per month. She has been married for 25 years and describes the relationship as caring and strong. Her husband is healthy with a good libido; his intermittent erectile dysfunction is treated with a phosphodiesterase-5 inhibitor. The patient’s low libido is distressing, as the decline in sexual frequency is causing some conflict for the couple. She requests that her testosterone level be checked because she heard that treatment with testosterone cream will solve this problem.
Evaluating and treating low libido in menopausal women
Low libido is a very common sexual problem for women. When sexual problems are accompanied by distress, they are classified as sexual dysfunctions. Although ObGyns should discuss sexual concerns at every comprehensive visit, if the patient has no associated distress, treatment is not necessarily indicated. A woman with low libido or anorgasmia who is satisfied with her sex life and is not bothered by these issues does not require any intervention.
Currently, the only indication for testosterone therapy that is supported by clinical trial evidence is low sexual desire with associated distress, known as hypoactive sexual desire disorder (HSDD). Although other sexual problems also commonly occur in menopausal women, such as disorders of orgasm and pain, testosterone is not recommended for these problems. In addition, testosterone is not approved by the US Food and Drug Administration (FDA) for the treatment of female sexual dysfunction.
Routinely inquire about sexual functioning
Ask your patients about sexual concerns at every comprehensive visit. You can easily incorporate into the review of systems a general question, such as, “Do you have any sexual concerns?” If the patient does mention a sexual problem, schedule a separate visit (given appointment time constraints) to address it. History and physical examination information you gather during the comprehensive visit will be helpful in the subsequent problem-focused visit.
Taking a thorough history is key when addressing a patient’s sexual problems, since identifying possible etiologies guides treatment. Often, the cause of female sexual dysfunction is multifactorial and includes physiologic, psychologic, and relationship issues.
- Evidence supports low-dose transdermal testosterone in carefully selected menopausal women with HSDD and no other identifiable reason for the sexual dysfunction
- Inform women considering testosterone for HSDD of the limited effectiveness and high placebo responses seen in clinical trials
- Women also must be informed that treatment is off-label (no testosterone formulations are FDA approved for women)
- Review with patients the limitations of compounded medications, and discuss possible adverse effects of androgens. Long-term safety is unknown and, as androgens are converted to estrogens
Explore potential causes, recommend standard therapies
Common causes of low libido in menopausal women include vasomotor symptoms, insomnia, urinary incontinence, cancer or another major medical problem, weight gain, poor body image, genitourinary syndrome of menopause (GSM) with dyspareunia, fatigue, stress, aging, relationship duration, lack of novelty, relationship conflict, and a partner’s sexual problems. Other common etiologies include depression, anxiety, and substance use disorders, as well as medications used to treat these disorders, including selective serotonin reuptake inhibitors (SSRIs).
Continue to: There are many effective therapies...
There are many effective therapies for low sexual desire to consider prior to initiating a trial of testosterone, which should be considered for HSDD only if the disorder persists after addressing all other possible contributing factors (TABLE 1).
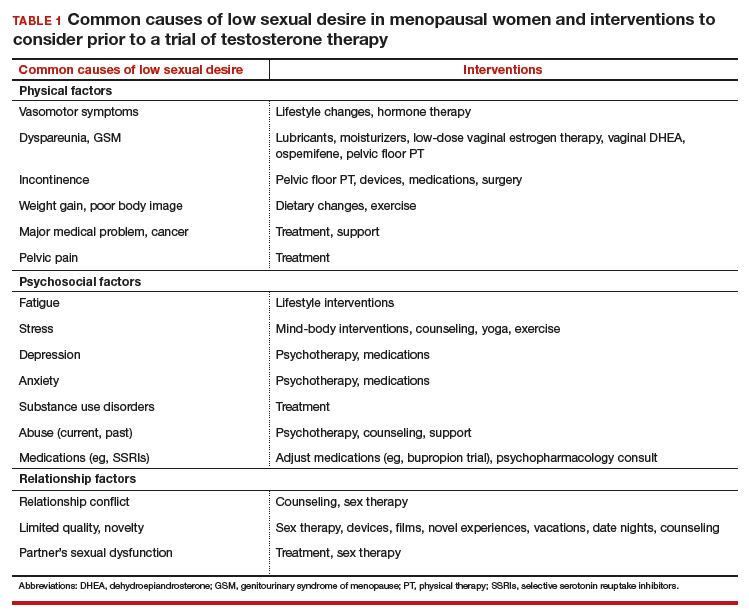
Sex therapy, for example, provides information on sexual functioning and helps improve communication and mutual pleasure and satisfaction. Strongly encourage—if not require—a consultation with a sex therapist before prescribing testosterone for low libido. Any testosterone-derived improvement in sexual functioning will be enhanced by improved communication and additional strategies to achieve mutual pleasure.
Hormone therapy. Vasomotor symptoms, with their associated sleep disruption, fatigue, and reduced quality of life (QOL), often adversely impact sexual desire. Estrogen therapy does not appear to improve libido in otherwise asymptomatic women; however, in women with bothersome vasomotor symptoms treated with estrogen, sexual interest may increase as a result of improved sleep, fatigue, and overall QOL. The benefits of systemic hormone therapy generally outweigh its risks for most healthy women younger than age 60 who have bothersome hot flashes and night sweats.1
Nonhormonal and other therapies. GSM with dyspareunia is a principal cause of sexual dysfunction in older women.2 Many safe and effective treatments are available, including low-dose vaginal estrogen therapy, nonhormonal moisturizers and lubricants, ospemifene, vaginal dehydroepiandrosterone, and pelvic floor physical therapy.3 Urinary incontinence commonly occurs in midlife women and contributes to low libido.4
Lifestyle approaches. Address fatigue and stress by having the patient adjust her work and sleep schedules, obtain help with housework and meals, and engage in mind-body interventions, counseling, or yoga. Sexual function may benefit from yoga practice, likely as a result of the patient experiencing reduced stress and enhanced body image. Improving overall health and body image with regular exercise, optimal diet, and weight management may contribute to a more satisfying sex life after the onset of menopause.
Relationship refresh. Women’s sexual interest often declines with relationship duration, and both men and women who are in new relationships generally have increased libido, affirming the importance of novelty over the long term. Couples will benefit from “date nights,” weekends away from home, and trying novel positions, locations, and times for sex. Couple’s counseling may address relationship conflict.
Expert referral. Depression, anxiety, and substance use disorders are prevalent in menopausal women and contribute to sexual dysfunction. Effective therapy is available, although some pharmacologic treatments (including SSRIs) may be an additional cause of sexual dysfunction. In addition to recommending appropriate counseling and support, referring the patient to a psychopharmacologist with expertise in managing sexual adverse effects of medications may optimize care.
Continue to: Sexual function improves, but patient still wants to try testosterone
CASE Sexual function improves, but patient still wants to try testosterone
The patient returns for follow-up visits scheduled specifically to address her sexual concerns. Sex is more comfortable and pleasurable since initiating low-dose vaginal estrogen therapy. Having been on an SSRI since her mid-40s for mild depression, the patient switched to bupropion and notes improved libido and orgasmic response. She is exercising more regularly and working with a nutritionist to address a 15-lb weight gain after menopause. The couple saw a sex therapist and is communicating better about sex with more novelty in their repertoire. They are enjoying a regular date night. Although the patient’s sex life has improved with these interventions, she is still very interested in trying testosterone.
Testosterone’s effects on HSDD in menopausal women
After addressing the many factors that contribute to sexual disinterest, a trial of testosterone may be appropriate for a menopausal woman who continues to experience low libido with associated distress.
Testosterone levels decrease with aging in both men and women. Although testosterone levels decline by approximately 50% with bilateral oophorectomy, there is no decline in androgen levels with natural menopause.5 Testosterone circulates tightly bound to sex hormone–binding globulin (SHBG), so free or active testosterone will be reduced by oral estrogens, which increase SHBG levels.6 As most menopausal women will have a low testosterone level due to aging, measuring the testosterone level does not provide information about the etiology of the sexual problem.
Although some studies have identified an association between endogenous androgen levels and sexual function, the associations are modest and are of uncertain clinical significance.7-9 Not surprisingly, other factors, such as physical and psychologic health and the quality of the relationship, often are reported as more important predictors of sexual satisfaction than androgen levels.10
While endogenous testosterone levels may not correlate with sexual function, clinical trials of carefully selected menopausal women with HSDD have shown that androgen treatment generally results in improved sexual function.11 Studies demonstrate substantial improvements in sexual desire, orgasmic response, and frequency in menopausal women treated with high doses of intramuscular testosterone, which result in supraphysiologic androgen levels.12,13 While it is interesting that women with testosterone levels in the male low range have sizeable increases in sexual desire and response, long-term use of high-dose testosterone would result in unacceptable androgenic adverse effects and risks.
Continue to: Testosterone in low doses...
Testosterone in low doses. It is more relevant to consider the impact on female sexual function of low doses of testosterone, which raise the reduced testosterone levels seen in older women to the higher levels seen in reproductive-aged women.
A series of double-blind, multicenter, randomized, placebo-controlled trials in menopausal women with HSDD examined the impact on sexual function of a transdermal testosterone patch (300 μg) that increased blood testosterone levels to the upper limit of normal for young women.14-17 In these studies, compared with placebo, women using testosterone reported significant improvements in sexual desire, arousal, orgasmic response, frequency, and sexually related distress. Findings were consistent in surgically and naturally menopausal women, with and without the use of concurrent estrogen therapy. Improvements were clinically limited, however. On average, testosterone-treated women experienced 1 to 1.5 additional satisfying sexual events in a 4-week period compared with those treated with placebo. The percentage of women reporting a clinically meaningful benefit from treatment was significantly greater in women treated with testosterone (52%) compared with the placebo-treated women (31%).18 An appreciable placebo response was seen, typical of most studies of therapies for sexual dysfunction.
Safety concerns
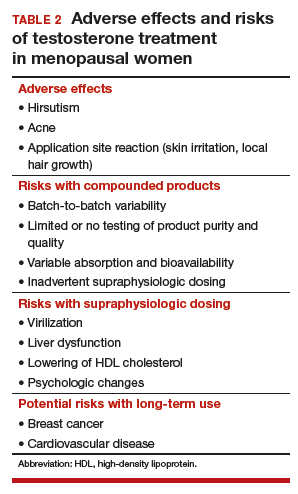
Potential risks of testosterone treatment include acne, hirsutism, irreversible deepening of the voice, and adverse changes in lipids and liver function (TABLE 2).19 Adverse effects are dose dependent and are unlikely with physiologically dosed testosterone.
A 1-year study of testosterone patches in approximately 800 menopausal women with HSDD (with a subgroup of women followed for an additional year) provides the most comprehensive safety data available.17 Unwanted hair growth occurred more often in women receiving testosterone, without significant differences in blood biochemistry,hematologic parameters, carbohydrate metabolism, or lipids. Breast cancer was diagnosed in more women receiving testosterone than placebo. Although this finding may have been due to chance, the investigators concluded that long-term effects of testosterone treatment remain uncertain.
The FDA reviewed the data from the testosterone patch studies and determined that testosterone patches were effective for the treatment of HSDD in menopausal women, but more information was needed on long-term safety before approval could be granted. Another company then developed a testosterone gel product that produced similar blood levels as the testosterone patch. It was presumed that there would be similar efficacy; the principal goal of these studies was to examine long-term safety, particularly with respect to breast cancer and cardiovascular disease. Unexpectedly, although it raised testosterone blood levels to the upper limit of normal for young women, the testosterone gel product was no more effective than placebo.20 The clinical trial was ended, with safety data never published.
Continue to: Availability of testosterone formulations
Availability of testosterone formulations
Currently, no androgen therapies are FDA approved for the treatment of female sexual dysfunction. Although the best evidence regarding testosterone efficacy and safety involves the use of testosterone patches (300 μg), appropriately dosed for women, these patches are not currently available. FDA-approved testosterone patches are approved for the treatment of male hypogonadism, but use of these patches in women is not recommended since they would result in very high circulating testosterone levels.
Testosterone subcutaneous implants, pellets, and intramuscular injections also are not recommended for women because of the risk of excessive dosing. Small trials of menopausal women taking oral estrogen with low sexual desire found that oral formulations of testosterone improved libido in this study population.21 The combination of esterified estrogens (0.625 mg) and methyltestosterone (1.25 mg) is available as a compounded, non-FDA approved product. Oral androgen formulations generally are not advised, due to potential adverse effects on lipids and liver function.22
Compounded testosterone products. Ointments and creams may be compounded by prescription (TABLE 3). Product purity, dose, bioavailability, and quality typically are untested, and substantial variability exists between formulations and batches.23 Applying 1% testosterone cream or gel (0.5 g/day) topically to the thigh or lower abdomen should increase the low testosterone levels typically seen in menopausal women to the higher levels seen in younger women.24,25 Application to the vulva or vagina is not advised, as it may cause local irritation and is unpredictably absorbed.

Adapting male testosterone products. High-quality FDA-approved testosterone gel formulations are available for male hypogonadism. However, since women have approximately one-tenth the circulating testosterone levels of men, supraphysiologic dosing is a risk when these products are prescribed for women. Most testosterone products approved for men are provided in pumps or packets, and they are difficult to dose-adjust for women. Applying one-tenth the male dose of 1% testosterone gel (Testim), which comes in a resealable unit-dose tube, is an alternative to compounding. For men, the dose is 1 tube per day, so women should make 1 tube last for 10 days by using 3 to 4 drops of testosterone gel per day. Close physical contact must be avoided immediately after application, as topical hormone creams and gels are easily transferred to others. The safety and efficacy of compounded or dose-adjusted male testosterone products used in women are unknown.
Follow treated women closely. Women who elect to use transdermal testosterone therapy should be seen at 8 to 12 weeks to assess treatment response. Regular follow-up visits are required to assess response, satisfaction, and adverse effects, including acne and hirsutism. Since there may be little correlation between serum testosterone levels and the prescribed dose of a compounded testosterone product, testosterone levels should be measured regularly as a safety measure. The goal is to keep serum testosterone concentrations within the normal range for reproductive-aged women to reduce the likelihood of adverse effects. Testosterone levels should not be tested as an efficacy measure, however, as there is no testosterone level that will assure a satisfactory sex life.
CASE Conclusion
After a thorough discussion of high placebo response rates, potential adverse effects, unknown long-term risks, and off-label nature of testosterone use, the patient elects a trial of compounded 1% testosterone cream. Her clinician informs her of the limitations of compounded formulations and the need for regular testing of testosterone levels to prevent supraphysiologic dosing. At a follow-up visit 8 weeks later, she reports improved sexual desire and elects to continue treatment and monitoring. After using testosterone for 2 years, the patient is uncertain that she still is experiencing a significant benefit, stops testosterone treatment, and remains satisfied with her sex life.
Share your thoughts! Send your Letter to the Editor to [email protected]. Please include your name and the city and state in which you practice.
- The North American Menopause Society Hormone Therapy Position Statement Advisory Panel. The 2017 hormone therapy position statement of The North American Menopause Society. Menopause. 2017;24:728-753.
- Simon JA, Nappi RE, Kingsberg SA, et al. Clarifying Vaginal Atrophy's Impact on Sex and Relationships (CLOSER) survey: emotional and physical impact of vaginal discomfort on North American postmenopausal women and their partners. Menopause. 2014;21:137-142.
- The North American Menopause Society. Management of symptomatic vulvovaginal atrophy: 2013 position statement of The North American Menopause Society. Menopause. 2013;20:888-902.
- Shifren J, Monz B, Russo P, et al. Sexual problems and distress in United States women: prevalence and correlates. Obstet Gynecol. 2008;112:970-978.
- Davison S, Bell R, Donath S, et al. Androgen levels in adult females: changes with age, menopause, and oophorectomy. J Clin Endocrinol Metab. 2005;90:3847-3853.
- Shifren JL, Desindes S, McIlwain M, et al. A randomized, open-label, crossover study comparing the effects of oral versus transdermal estrogen therapy on serum androgens, thyroid hormones, and adrenal hormones in naturally menopausal women. Menopause. 2007;14:985-994.
- Davis SR, Davison SL, Donath S, et al. Circulating androgen levels and self-reported sexual function in women. JAMA. 2005;294:91-96.
- Wahlin-Jacobsen S, Pedersen AT, Kristensen E, et al. Is there a correlation between androgens and sexual desire in women? J Sex Med. 2015;12:358-373.
- Randolph JF Jr, Zheng H, Avis NE, et al. Masturbation frequency and sexual function domains are associated with serum reproductive hormone levels across the menopausal transition. J Clin Endocrinol Metab. 2015;100:258-266.
- Dennerstein L, Lehert P, Burger H. The relative effects of hormones and relationship factors on sexual function of women through the natural menopausal transition. Fertil Steril. 2005;84:174-180.
- Shifren JL, Davis SR. Androgens in postmenopausal women: a review. Menopause. 2017;24:970-979.
- Sherwin BB, Gelfand MM, Brender W. Androgen enhances sexual motivation in females: a prospective, crossover study of sex steroid administration in the surgical menopause. Psychosom Med. 1985;47:339-351.
- Huang G, Basaria S, Travison TG, et al. Testosterone dose-response relationships in hysterectomized women with or without oophorectomy: effects on sexual function, body composition, muscle performance and physical function in a randomized trial. Menopause. 2014;21:612-623.
- Shifren JL, Braunstein GD, Simon JA, et al. Transdermal testosterone treatment in women with impaired sexual function after oophorectomy. N Engl J Med. 2000;343:682-688.
- Simon J, Braunstein G, Nachtigall L, et al. Testosterone patch increases sexual activity and desire in surgically menopausal women with hypoactive sexual desire disorder. J Clin Endocrinol Metab. 2005;90:5226-5233.
- Shifren JL, Davis SR, Moreau M, et al. Testosterone patch for the treatment of hypoactive sexual desire disorder in naturally menopausal women: results from the INTIMATE NM1 study. Menopause. 2006;13:770-779.
- Davis SR, Moreau M, Kroll R, et al; APHRODITE Study Team. Testosterone for low libido in postmenopausal women not taking estrogen. N Engl J Med. 2008;359:2005-2017.
- Kingsberg S, Shifren J, Wekselman K, et al. Evaluation of the clinical relevance of benefits associated with transdermal testosterone treatment in postmenopausal women with hypoactive sexual desire disorder. J Sex Med. 2007;4:1001-1008.
- Wierman ME, Arlt W, Basson R, et al. Androgen therapy in women: a reappraisal: an Endocrine Society clinical practice guideline. J Clin Endocrinol Metab. 2014;99:3489-3510.
- Snabes M, Zborowski J, Simes S. Libigel (testosterone gel) does not differentiate from placebo therapy in the treatment of hypoactive sexual desire in postmenopausal women (abstract). J Sex Med. 2012;9(suppl 3):171.
- Lobo RA, Rosen RC, Yang HM, et al. Comparative effects of oral esterified estrogens with and without methyltestosterone on endocrine profiles and dimensions of sexual function in postmenopausal women with hypoactive sexual desire. Fertil Steril. 2003;79:1341-1352.
- Somboonporn W, Davis S, Seif M, et al. Testsoterone for peri- and postmenopausal women. Cochrane Database Syst Rev. 2005;19:CD004509.
- American College of Obstetricians and Gynecologists Committee on Gynecologic Practice and American Society for Reproductive Medicine. Committee opinion 532: compounded bioidentical menopausal hormone therapy. Obstet Gynecol. 2012;(2 pt 1):411-415.
- Fooladi E, Reuter SE, Bell RJ, et al. Pharmacokinetics of a transdermal testosterone cream in healthy postmenopausal women. Menopause. 2015;22:44-49.
- Shifren JL. Testosterone for midlife women: the hormone of desire? Menopause. 2015;22:1147-1149.

Dr. Shifren is Director, Midlife Women’s Health Center, Department of Obstetrics and Gynecology, Massachusetts General Hospital, and Vincent Trustees Professor of Obstetrics, Gynecology and Reproductive Biology; Harvard Medical School, Boston, Massachusetts.
The author reports that she is a consultant for the New England Research Institutes.
CASE Midlife woman with low libido causing distress
At her annual gynecologic visit, a 55-year-old woman notes that she has almost no interest in sex. In the past, her libido was good and relations were pleasurable. Since her mid-40s, she has noticed a gradual decline in libido and orgasmic response. Sexual frequency has declined from once or twice weekly to just a few times per month. She has been married for 25 years and describes the relationship as caring and strong. Her husband is healthy with a good libido; his intermittent erectile dysfunction is treated with a phosphodiesterase-5 inhibitor. The patient’s low libido is distressing, as the decline in sexual frequency is causing some conflict for the couple. She requests that her testosterone level be checked because she heard that treatment with testosterone cream will solve this problem.
Evaluating and treating low libido in menopausal women
Low libido is a very common sexual problem for women. When sexual problems are accompanied by distress, they are classified as sexual dysfunctions. Although ObGyns should discuss sexual concerns at every comprehensive visit, if the patient has no associated distress, treatment is not necessarily indicated. A woman with low libido or anorgasmia who is satisfied with her sex life and is not bothered by these issues does not require any intervention.
Currently, the only indication for testosterone therapy that is supported by clinical trial evidence is low sexual desire with associated distress, known as hypoactive sexual desire disorder (HSDD). Although other sexual problems also commonly occur in menopausal women, such as disorders of orgasm and pain, testosterone is not recommended for these problems. In addition, testosterone is not approved by the US Food and Drug Administration (FDA) for the treatment of female sexual dysfunction.
Routinely inquire about sexual functioning
Ask your patients about sexual concerns at every comprehensive visit. You can easily incorporate into the review of systems a general question, such as, “Do you have any sexual concerns?” If the patient does mention a sexual problem, schedule a separate visit (given appointment time constraints) to address it. History and physical examination information you gather during the comprehensive visit will be helpful in the subsequent problem-focused visit.
Taking a thorough history is key when addressing a patient’s sexual problems, since identifying possible etiologies guides treatment. Often, the cause of female sexual dysfunction is multifactorial and includes physiologic, psychologic, and relationship issues.
- Evidence supports low-dose transdermal testosterone in carefully selected menopausal women with HSDD and no other identifiable reason for the sexual dysfunction
- Inform women considering testosterone for HSDD of the limited effectiveness and high placebo responses seen in clinical trials
- Women also must be informed that treatment is off-label (no testosterone formulations are FDA approved for women)
- Review with patients the limitations of compounded medications, and discuss possible adverse effects of androgens. Long-term safety is unknown and, as androgens are converted to estrogens
Explore potential causes, recommend standard therapies
Common causes of low libido in menopausal women include vasomotor symptoms, insomnia, urinary incontinence, cancer or another major medical problem, weight gain, poor body image, genitourinary syndrome of menopause (GSM) with dyspareunia, fatigue, stress, aging, relationship duration, lack of novelty, relationship conflict, and a partner’s sexual problems. Other common etiologies include depression, anxiety, and substance use disorders, as well as medications used to treat these disorders, including selective serotonin reuptake inhibitors (SSRIs).
Continue to: There are many effective therapies...
There are many effective therapies for low sexual desire to consider prior to initiating a trial of testosterone, which should be considered for HSDD only if the disorder persists after addressing all other possible contributing factors (TABLE 1).
Sex therapy, for example, provides information on sexual functioning and helps improve communication and mutual pleasure and satisfaction. Strongly encourage—if not require—a consultation with a sex therapist before prescribing testosterone for low libido. Any testosterone-derived improvement in sexual functioning will be enhanced by improved communication and additional strategies to achieve mutual pleasure.
Hormone therapy. Vasomotor symptoms, with their associated sleep disruption, fatigue, and reduced quality of life (QOL), often adversely impact sexual desire. Estrogen therapy does not appear to improve libido in otherwise asymptomatic women; however, in women with bothersome vasomotor symptoms treated with estrogen, sexual interest may increase as a result of improved sleep, fatigue, and overall QOL. The benefits of systemic hormone therapy generally outweigh its risks for most healthy women younger than age 60 who have bothersome hot flashes and night sweats.1
Nonhormonal and other therapies. GSM with dyspareunia is a principal cause of sexual dysfunction in older women.2 Many safe and effective treatments are available, including low-dose vaginal estrogen therapy, nonhormonal moisturizers and lubricants, ospemifene, vaginal dehydroepiandrosterone, and pelvic floor physical therapy.3 Urinary incontinence commonly occurs in midlife women and contributes to low libido.4
Lifestyle approaches. Address fatigue and stress by having the patient adjust her work and sleep schedules, obtain help with housework and meals, and engage in mind-body interventions, counseling, or yoga. Sexual function may benefit from yoga practice, likely as a result of the patient experiencing reduced stress and enhanced body image. Improving overall health and body image with regular exercise, optimal diet, and weight management may contribute to a more satisfying sex life after the onset of menopause.
Relationship refresh. Women’s sexual interest often declines with relationship duration, and both men and women who are in new relationships generally have increased libido, affirming the importance of novelty over the long term. Couples will benefit from “date nights,” weekends away from home, and trying novel positions, locations, and times for sex. Couple’s counseling may address relationship conflict.
Expert referral. Depression, anxiety, and substance use disorders are prevalent in menopausal women and contribute to sexual dysfunction. Effective therapy is available, although some pharmacologic treatments (including SSRIs) may be an additional cause of sexual dysfunction. In addition to recommending appropriate counseling and support, referring the patient to a psychopharmacologist with expertise in managing sexual adverse effects of medications may optimize care.
Continue to: Sexual function improves, but patient still wants to try testosterone
CASE Sexual function improves, but patient still wants to try testosterone
The patient returns for follow-up visits scheduled specifically to address her sexual concerns. Sex is more comfortable and pleasurable since initiating low-dose vaginal estrogen therapy. Having been on an SSRI since her mid-40s for mild depression, the patient switched to bupropion and notes improved libido and orgasmic response. She is exercising more regularly and working with a nutritionist to address a 15-lb weight gain after menopause. The couple saw a sex therapist and is communicating better about sex with more novelty in their repertoire. They are enjoying a regular date night. Although the patient’s sex life has improved with these interventions, she is still very interested in trying testosterone.
Testosterone’s effects on HSDD in menopausal women
After addressing the many factors that contribute to sexual disinterest, a trial of testosterone may be appropriate for a menopausal woman who continues to experience low libido with associated distress.
Testosterone levels decrease with aging in both men and women. Although testosterone levels decline by approximately 50% with bilateral oophorectomy, there is no decline in androgen levels with natural menopause.5 Testosterone circulates tightly bound to sex hormone–binding globulin (SHBG), so free or active testosterone will be reduced by oral estrogens, which increase SHBG levels.6 As most menopausal women will have a low testosterone level due to aging, measuring the testosterone level does not provide information about the etiology of the sexual problem.
Although some studies have identified an association between endogenous androgen levels and sexual function, the associations are modest and are of uncertain clinical significance.7-9 Not surprisingly, other factors, such as physical and psychologic health and the quality of the relationship, often are reported as more important predictors of sexual satisfaction than androgen levels.10
While endogenous testosterone levels may not correlate with sexual function, clinical trials of carefully selected menopausal women with HSDD have shown that androgen treatment generally results in improved sexual function.11 Studies demonstrate substantial improvements in sexual desire, orgasmic response, and frequency in menopausal women treated with high doses of intramuscular testosterone, which result in supraphysiologic androgen levels.12,13 While it is interesting that women with testosterone levels in the male low range have sizeable increases in sexual desire and response, long-term use of high-dose testosterone would result in unacceptable androgenic adverse effects and risks.
Continue to: Testosterone in low doses...
Testosterone in low doses. It is more relevant to consider the impact on female sexual function of low doses of testosterone, which raise the reduced testosterone levels seen in older women to the higher levels seen in reproductive-aged women.
A series of double-blind, multicenter, randomized, placebo-controlled trials in menopausal women with HSDD examined the impact on sexual function of a transdermal testosterone patch (300 μg) that increased blood testosterone levels to the upper limit of normal for young women.14-17 In these studies, compared with placebo, women using testosterone reported significant improvements in sexual desire, arousal, orgasmic response, frequency, and sexually related distress. Findings were consistent in surgically and naturally menopausal women, with and without the use of concurrent estrogen therapy. Improvements were clinically limited, however. On average, testosterone-treated women experienced 1 to 1.5 additional satisfying sexual events in a 4-week period compared with those treated with placebo. The percentage of women reporting a clinically meaningful benefit from treatment was significantly greater in women treated with testosterone (52%) compared with the placebo-treated women (31%).18 An appreciable placebo response was seen, typical of most studies of therapies for sexual dysfunction.
Safety concerns
Potential risks of testosterone treatment include acne, hirsutism, irreversible deepening of the voice, and adverse changes in lipids and liver function (TABLE 2).19 Adverse effects are dose dependent and are unlikely with physiologically dosed testosterone.
A 1-year study of testosterone patches in approximately 800 menopausal women with HSDD (with a subgroup of women followed for an additional year) provides the most comprehensive safety data available.17 Unwanted hair growth occurred more often in women receiving testosterone, without significant differences in blood biochemistry,hematologic parameters, carbohydrate metabolism, or lipids. Breast cancer was diagnosed in more women receiving testosterone than placebo. Although this finding may have been due to chance, the investigators concluded that long-term effects of testosterone treatment remain uncertain.
The FDA reviewed the data from the testosterone patch studies and determined that testosterone patches were effective for the treatment of HSDD in menopausal women, but more information was needed on long-term safety before approval could be granted. Another company then developed a testosterone gel product that produced similar blood levels as the testosterone patch. It was presumed that there would be similar efficacy; the principal goal of these studies was to examine long-term safety, particularly with respect to breast cancer and cardiovascular disease. Unexpectedly, although it raised testosterone blood levels to the upper limit of normal for young women, the testosterone gel product was no more effective than placebo.20 The clinical trial was ended, with safety data never published.
Continue to: Availability of testosterone formulations
Availability of testosterone formulations
Currently, no androgen therapies are FDA approved for the treatment of female sexual dysfunction. Although the best evidence regarding testosterone efficacy and safety involves the use of testosterone patches (300 μg), appropriately dosed for women, these patches are not currently available. FDA-approved testosterone patches are approved for the treatment of male hypogonadism, but use of these patches in women is not recommended since they would result in very high circulating testosterone levels.
Testosterone subcutaneous implants, pellets, and intramuscular injections also are not recommended for women because of the risk of excessive dosing. Small trials of menopausal women taking oral estrogen with low sexual desire found that oral formulations of testosterone improved libido in this study population.21 The combination of esterified estrogens (0.625 mg) and methyltestosterone (1.25 mg) is available as a compounded, non-FDA approved product. Oral androgen formulations generally are not advised, due to potential adverse effects on lipids and liver function.22
Compounded testosterone products. Ointments and creams may be compounded by prescription (TABLE 3). Product purity, dose, bioavailability, and quality typically are untested, and substantial variability exists between formulations and batches.23 Applying 1% testosterone cream or gel (0.5 g/day) topically to the thigh or lower abdomen should increase the low testosterone levels typically seen in menopausal women to the higher levels seen in younger women.24,25 Application to the vulva or vagina is not advised, as it may cause local irritation and is unpredictably absorbed.
Adapting male testosterone products. High-quality FDA-approved testosterone gel formulations are available for male hypogonadism. However, since women have approximately one-tenth the circulating testosterone levels of men, supraphysiologic dosing is a risk when these products are prescribed for women. Most testosterone products approved for men are provided in pumps or packets, and they are difficult to dose-adjust for women. Applying one-tenth the male dose of 1% testosterone gel (Testim), which comes in a resealable unit-dose tube, is an alternative to compounding. For men, the dose is 1 tube per day, so women should make 1 tube last for 10 days by using 3 to 4 drops of testosterone gel per day. Close physical contact must be avoided immediately after application, as topical hormone creams and gels are easily transferred to others. The safety and efficacy of compounded or dose-adjusted male testosterone products used in women are unknown.
Follow treated women closely. Women who elect to use transdermal testosterone therapy should be seen at 8 to 12 weeks to assess treatment response. Regular follow-up visits are required to assess response, satisfaction, and adverse effects, including acne and hirsutism. Since there may be little correlation between serum testosterone levels and the prescribed dose of a compounded testosterone product, testosterone levels should be measured regularly as a safety measure. The goal is to keep serum testosterone concentrations within the normal range for reproductive-aged women to reduce the likelihood of adverse effects. Testosterone levels should not be tested as an efficacy measure, however, as there is no testosterone level that will assure a satisfactory sex life.
CASE Conclusion
After a thorough discussion of high placebo response rates, potential adverse effects, unknown long-term risks, and off-label nature of testosterone use, the patient elects a trial of compounded 1% testosterone cream. Her clinician informs her of the limitations of compounded formulations and the need for regular testing of testosterone levels to prevent supraphysiologic dosing. At a follow-up visit 8 weeks later, she reports improved sexual desire and elects to continue treatment and monitoring. After using testosterone for 2 years, the patient is uncertain that she still is experiencing a significant benefit, stops testosterone treatment, and remains satisfied with her sex life.
Share your thoughts! Send your Letter to the Editor to [email protected]. Please include your name and the city and state in which you practice.
- The North American Menopause Society Hormone Therapy Position Statement Advisory Panel. The 2017 hormone therapy position statement of The North American Menopause Society. Menopause. 2017;24:728-753.
- Simon JA, Nappi RE, Kingsberg SA, et al. Clarifying Vaginal Atrophy's Impact on Sex and Relationships (CLOSER) survey: emotional and physical impact of vaginal discomfort on North American postmenopausal women and their partners. Menopause. 2014;21:137-142.
- The North American Menopause Society. Management of symptomatic vulvovaginal atrophy: 2013 position statement of The North American Menopause Society. Menopause. 2013;20:888-902.
- Shifren J, Monz B, Russo P, et al. Sexual problems and distress in United States women: prevalence and correlates. Obstet Gynecol. 2008;112:970-978.
- Davison S, Bell R, Donath S, et al. Androgen levels in adult females: changes with age, menopause, and oophorectomy. J Clin Endocrinol Metab. 2005;90:3847-3853.
- Shifren JL, Desindes S, McIlwain M, et al. A randomized, open-label, crossover study comparing the effects of oral versus transdermal estrogen therapy on serum androgens, thyroid hormones, and adrenal hormones in naturally menopausal women. Menopause. 2007;14:985-994.
- Davis SR, Davison SL, Donath S, et al. Circulating androgen levels and self-reported sexual function in women. JAMA. 2005;294:91-96.
- Wahlin-Jacobsen S, Pedersen AT, Kristensen E, et al. Is there a correlation between androgens and sexual desire in women? J Sex Med. 2015;12:358-373.
- Randolph JF Jr, Zheng H, Avis NE, et al. Masturbation frequency and sexual function domains are associated with serum reproductive hormone levels across the menopausal transition. J Clin Endocrinol Metab. 2015;100:258-266.
- Dennerstein L, Lehert P, Burger H. The relative effects of hormones and relationship factors on sexual function of women through the natural menopausal transition. Fertil Steril. 2005;84:174-180.
- Shifren JL, Davis SR. Androgens in postmenopausal women: a review. Menopause. 2017;24:970-979.
- Sherwin BB, Gelfand MM, Brender W. Androgen enhances sexual motivation in females: a prospective, crossover study of sex steroid administration in the surgical menopause. Psychosom Med. 1985;47:339-351.
- Huang G, Basaria S, Travison TG, et al. Testosterone dose-response relationships in hysterectomized women with or without oophorectomy: effects on sexual function, body composition, muscle performance and physical function in a randomized trial. Menopause. 2014;21:612-623.
- Shifren JL, Braunstein GD, Simon JA, et al. Transdermal testosterone treatment in women with impaired sexual function after oophorectomy. N Engl J Med. 2000;343:682-688.
- Simon J, Braunstein G, Nachtigall L, et al. Testosterone patch increases sexual activity and desire in surgically menopausal women with hypoactive sexual desire disorder. J Clin Endocrinol Metab. 2005;90:5226-5233.
- Shifren JL, Davis SR, Moreau M, et al. Testosterone patch for the treatment of hypoactive sexual desire disorder in naturally menopausal women: results from the INTIMATE NM1 study. Menopause. 2006;13:770-779.
- Davis SR, Moreau M, Kroll R, et al; APHRODITE Study Team. Testosterone for low libido in postmenopausal women not taking estrogen. N Engl J Med. 2008;359:2005-2017.
- Kingsberg S, Shifren J, Wekselman K, et al. Evaluation of the clinical relevance of benefits associated with transdermal testosterone treatment in postmenopausal women with hypoactive sexual desire disorder. J Sex Med. 2007;4:1001-1008.
- Wierman ME, Arlt W, Basson R, et al. Androgen therapy in women: a reappraisal: an Endocrine Society clinical practice guideline. J Clin Endocrinol Metab. 2014;99:3489-3510.
- Snabes M, Zborowski J, Simes S. Libigel (testosterone gel) does not differentiate from placebo therapy in the treatment of hypoactive sexual desire in postmenopausal women (abstract). J Sex Med. 2012;9(suppl 3):171.
- Lobo RA, Rosen RC, Yang HM, et al. Comparative effects of oral esterified estrogens with and without methyltestosterone on endocrine profiles and dimensions of sexual function in postmenopausal women with hypoactive sexual desire. Fertil Steril. 2003;79:1341-1352.
- Somboonporn W, Davis S, Seif M, et al. Testsoterone for peri- and postmenopausal women. Cochrane Database Syst Rev. 2005;19:CD004509.
- American College of Obstetricians and Gynecologists Committee on Gynecologic Practice and American Society for Reproductive Medicine. Committee opinion 532: compounded bioidentical menopausal hormone therapy. Obstet Gynecol. 2012;(2 pt 1):411-415.
- Fooladi E, Reuter SE, Bell RJ, et al. Pharmacokinetics of a transdermal testosterone cream in healthy postmenopausal women. Menopause. 2015;22:44-49.
- Shifren JL. Testosterone for midlife women: the hormone of desire? Menopause. 2015;22:1147-1149.

Data support revising ASCVD cardiovascular risk threshold
MUNICH – Revising the threshold for actionable high cardiovascular risk from the current 7.5% or greater risk of an event within 10 years as defined in American College of Cardiology/American Heart Association guidelines using the Atherosclerotic Cardiovascular Disease (ASCVD ) Risk Calculator to a 10% or greater 10-year risk would provide the optimal balance of sensitivity and specificity for discriminating future risk of cardiovascular events, according to Robert S. Rosenman, MD.

“I think this is very important from a public health policy perspective,” Dr. Rosenman, a cardiologist who is professor of medicine at Mount Sinai School of Medicine in New York, said at the annual congress of the European Society of Cardiology.
He elaborated: “This would eliminate 11.4 million people who are currently candidates for a statin but may not be getting the benefits of statin therapy. We feel that this information is actually quite important for the primary prevention population because there’s been a lot of pushback from our primary care physician colleagues about the overtreatment of low-risk individuals” under the current guidelines (Circulation. 2014 Jun 24;129[25 Suppl 2]:S49-73).
Dr. Rosenman and his coinvestigators conducted a secondary analysis of data on 21,343 adults in the REGARDS (Reasons for Geographic and Racial Differences in Stroke) study. All participants were free of a baseline history of heart disease or stroke. During a median 8.5 years of follow-up, 1,717 of them experienced adjudicated coronary heart disease or stroke events.
In multivariate analyses adjusted for standard cardiovascular risk factors, socioeconomic and demographic factors, and the use of statins and/or antihypertensive drugs, the higher the baseline 10-year predicted risk using the ACC/AHA ASCVD Risk Calculator based on the Pooled Cohort risk equations, the higher the incidence rate of cardiovascular events. No surprise there.
What was impressive, however, was that the optimal combination of sensitivity and specificity as captured in a statistic known as Youden’s index occurred at a 10-year predicted risk of 10%-12%. The biggest net improvement obtained through reclassification resulted from moving the threshold for elevated 10-year cardiovascular risk warranting statin therapy from 7.5% or greater to 10% or more, rather than using thresholds of 15% or 20%.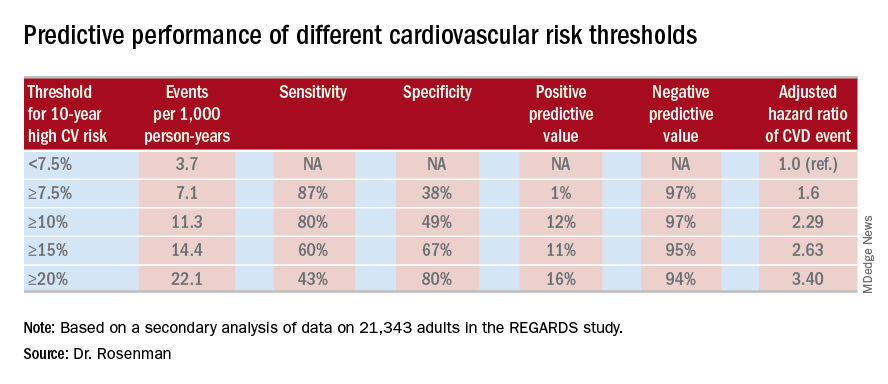
He cited data from the 2011-2014 National Health and Nutrition Examination Survey in support of his estimate that switching to a 10% threshold from the current 7.5% threshold would reduce the number of Americans deemed at high cardiovascular risk from 57.1 million to 45.8 million.
“This cutoff value of 10%, by the way, is the same cutoff value used in the recently published ACC/AHA guideline on hypertension. And it’s also the same cutoff value used for antiplatelet therapy in looking at the benefit/risk ratio. So this value of 10% is, I think, really the right number. Our study is the first effort that has been shown to validate that number, and it brings the cutoff values in the various guidelines in line,” the cardiologist observed.
Asked if these new findings are likely to result in a revision of the ACC/AHA cardiovascular risk assessment guidelines, Dr. Rosenman replied that the guidelines are under revision, with the draft update now circulating for comment. So the timing is dicey: His study is now in prepublication peer review, but hasn’t yet been published and thus may not carry persuasive weight.
“Hopefully, the guideline panel is going to make an adjustment to make the 10% figure in line with the blood pressure guidelines,” he said.
The new analysis of the REGARDS study was funded by a collaboration between Amgen, Mount Sinai School of Medicine, and the University of Alabama. Dr. Rosenman reported receiving research funding from and serving as an advisor to Amgen and a handful of other companies.
MUNICH – Revising the threshold for actionable high cardiovascular risk from the current 7.5% or greater risk of an event within 10 years as defined in American College of Cardiology/American Heart Association guidelines using the Atherosclerotic Cardiovascular Disease (ASCVD ) Risk Calculator to a 10% or greater 10-year risk would provide the optimal balance of sensitivity and specificity for discriminating future risk of cardiovascular events, according to Robert S. Rosenman, MD.
“I think this is very important from a public health policy perspective,” Dr. Rosenman, a cardiologist who is professor of medicine at Mount Sinai School of Medicine in New York, said at the annual congress of the European Society of Cardiology.
He elaborated: “This would eliminate 11.4 million people who are currently candidates for a statin but may not be getting the benefits of statin therapy. We feel that this information is actually quite important for the primary prevention population because there’s been a lot of pushback from our primary care physician colleagues about the overtreatment of low-risk individuals” under the current guidelines (Circulation. 2014 Jun 24;129[25 Suppl 2]:S49-73).
Dr. Rosenman and his coinvestigators conducted a secondary analysis of data on 21,343 adults in the REGARDS (Reasons for Geographic and Racial Differences in Stroke) study. All participants were free of a baseline history of heart disease or stroke. During a median 8.5 years of follow-up, 1,717 of them experienced adjudicated coronary heart disease or stroke events.
In multivariate analyses adjusted for standard cardiovascular risk factors, socioeconomic and demographic factors, and the use of statins and/or antihypertensive drugs, the higher the baseline 10-year predicted risk using the ACC/AHA ASCVD Risk Calculator based on the Pooled Cohort risk equations, the higher the incidence rate of cardiovascular events. No surprise there.
What was impressive, however, was that the optimal combination of sensitivity and specificity as captured in a statistic known as Youden’s index occurred at a 10-year predicted risk of 10%-12%. The biggest net improvement obtained through reclassification resulted from moving the threshold for elevated 10-year cardiovascular risk warranting statin therapy from 7.5% or greater to 10% or more, rather than using thresholds of 15% or 20%.
He cited data from the 2011-2014 National Health and Nutrition Examination Survey in support of his estimate that switching to a 10% threshold from the current 7.5% threshold would reduce the number of Americans deemed at high cardiovascular risk from 57.1 million to 45.8 million.
“This cutoff value of 10%, by the way, is the same cutoff value used in the recently published ACC/AHA guideline on hypertension. And it’s also the same cutoff value used for antiplatelet therapy in looking at the benefit/risk ratio. So this value of 10% is, I think, really the right number. Our study is the first effort that has been shown to validate that number, and it brings the cutoff values in the various guidelines in line,” the cardiologist observed.
Asked if these new findings are likely to result in a revision of the ACC/AHA cardiovascular risk assessment guidelines, Dr. Rosenman replied that the guidelines are under revision, with the draft update now circulating for comment. So the timing is dicey: His study is now in prepublication peer review, but hasn’t yet been published and thus may not carry persuasive weight.
“Hopefully, the guideline panel is going to make an adjustment to make the 10% figure in line with the blood pressure guidelines,” he said.
The new analysis of the REGARDS study was funded by a collaboration between Amgen, Mount Sinai School of Medicine, and the University of Alabama. Dr. Rosenman reported receiving research funding from and serving as an advisor to Amgen and a handful of other companies.
REPORTING FROM THE ESC CONGRESS 2018
Key clinical point:
Major finding: Redefining the threshold for high 10-year cardiovascular risk from the current 7.5% to 10% would reduce the number of Americans warranting statin therapy by 11.4 million.
Study details: This was a secondary analysis of data on 21,343 adults in the REGARDS study, 1,717 of whom experienced coronary heart disease or stroke events during a median 8.5 years of prospective follow-up.
Disclosures: The new analysis of the REGARDS study was funded by a collaboration between Amgen, Mount Sinai School of Medicine, and the University of Alabama. The presenter reported ties to Amgen and a handful of other companies.
FDA approves adalimumab biosimilar Hyrimoz
The Food and Drug Administration has approved the adalimumab biosimilar Hyrimoz (adalimumab-adaz) for a variety of conditions, according to Sandoz, the drug’s manufacturer and a division of Novartis.

FDA approval for Hyrimoz is based on a randomized, double-blind, three-arm, parallel biosimilarity study that demonstrated equivalence for all primary pharmacokinetic parameters, according to the press release. A second study confirmed these results in patients with moderate to severe plaque psoriasis, with Hyrimoz having a safety profile similar to that of adalimumab. Hyrimoz was approved in Europe in July 2018.
Hyrimoz has been approved to treat rheumatoid arthritis, juvenile idiopathic arthritis in patients aged 4 years and older, psoriatic arthritis, ankylosing spondylitis, adult Crohn’s disease, ulcerative colitis, and plaque psoriasis. The most common adverse events associated with the drug, according to the label, are infections, injection site reactions, headache, and rash.
Hyrimoz is the third adalimumab biosimilar approved by the FDA.
“Biosimilars can help people suffering from chronic, debilitating conditions gain expanded access to important medicines that may change the outcome of their disease. With the FDA approval of Hyrimoz, Sandoz is one step closer to offering U.S. patients with autoimmune diseases the same critical access already available in Europe,” Stefan Hendriks, global head of biopharmaceuticals at Sandoz, said in the press release.
Find the full press release on the Novartis website.
The Food and Drug Administration has approved the adalimumab biosimilar Hyrimoz (adalimumab-adaz) for a variety of conditions, according to Sandoz, the drug’s manufacturer and a division of Novartis.
FDA approval for Hyrimoz is based on a randomized, double-blind, three-arm, parallel biosimilarity study that demonstrated equivalence for all primary pharmacokinetic parameters, according to the press release. A second study confirmed these results in patients with moderate to severe plaque psoriasis, with Hyrimoz having a safety profile similar to that of adalimumab. Hyrimoz was approved in Europe in July 2018.
Hyrimoz has been approved to treat rheumatoid arthritis, juvenile idiopathic arthritis in patients aged 4 years and older, psoriatic arthritis, ankylosing spondylitis, adult Crohn’s disease, ulcerative colitis, and plaque psoriasis. The most common adverse events associated with the drug, according to the label, are infections, injection site reactions, headache, and rash.
Hyrimoz is the third adalimumab biosimilar approved by the FDA.
“Biosimilars can help people suffering from chronic, debilitating conditions gain expanded access to important medicines that may change the outcome of their disease. With the FDA approval of Hyrimoz, Sandoz is one step closer to offering U.S. patients with autoimmune diseases the same critical access already available in Europe,” Stefan Hendriks, global head of biopharmaceuticals at Sandoz, said in the press release.
Find the full press release on the Novartis website.
Sickle cell disease gene therapy seen advancing
BETHESDA, MD. – Experimental gene therapies for sickle cell disease and thalassemia appear to be advancing, with BCL11A among the most promising targets in this field, researchers said at Sickle Cell in Focus, a conference held by the National Institutes of Health.

Several highly anticipated presentations on the topic are expected for December meeting of the American Society of Hematology.
Alexis A. Thompson, MD, of Northwestern University, Chicago, reviewed highlights from a study in which the majority of patients given a gene therapy for transfusion dependent beta-thalassemia didn’t need subsequent blood transfusions. The New England Journal of Medicine in April published the results of this work done with Bluebird Bio’s LentiGlobin gene therapy (N Engl J Med. 2018; 378:1479-93).
Of the 22 patients in this trial, 15 have become transfusion independent, Dr. Thompson said in her presentation. Those patients that did not have this positive outcome still appear to have been helped by the gene therapy, she said. They had a median of 60% reduction in their transfusion volumes and nearly 60% in their number of transfusions.
“Whether it was transfusion independence or reduction in their transfusion volume or number, the vast majority of individuals in this first large-scale study had clinical benefit” from the therapy, said Dr. Thompson, who was the lead author of the study.
Dr. Thompson, the current president of the American Society of Hematology (ASH), said she’s looking forward to presentations on some of the most advanced gene therapies for sickle cell disease and thalassemia at the group’s annual meeting in December. The ASH presentations include those of John F. Tisdale, MD, who will report the latest data on LentiGlobin gene therapy in sickle cell disease, and Punam Malik, MD, of Cincinnati Children’s Hospital, who has developed a gamma globin lentivirus vector. There also will be a first readout on a particularly novel approach taken by researchers at Boston Children’s Hospital, led by David Williams, MD.
The development of CRISPR-Cas9 “has really opened up the field” of gene therapy, aiding researchers at Boston Children’s in their efforts to develop a treatment to maintain fetal hemoglobin production, Daniel E. Bauer, MD, PhD, of Boston Children’s Hospital, said during his presentation at the NIH conference.

Dr. Bauer provided an update on the BCL11A research that seeks to block what amounts to a genetic “off switch” for production of fetal hemoglobin. It’s long been known that erythrocytes of newborns with sickle cell disease are protected from sickling by high levels of fetal hemoglobin. Clinical manifestations of sickle cell disease then emerge in the first year of life as fetal hemoglobin levels decline.
“A main goal in hematology has been to understand how is it that these alternative fetal hemoglobin genes get silenced and how can we turn them back on,” said Dr. Bauer, a staff physician in pediatric hematology/oncology.
The gene BCL11A also plays key roles in the development of the central nervous system, B lymphatic lymphocyte maturation, and hematopoietic stem cell self-renewal. That led the researchers to hone in on targeting sequences around the BCL11A gene that act as erythroid enhancers, intending to limit potential complications by creating a very specific therapy for sickle cell disease.
In a related clinical trial, using lentiviral gene therapy rather than gene editing, researchers at Boston Children’s began an open-label, nonrandomized, single-center pilot study that involves a single infusion of autologous bone marrow derived CD34+ HSC cells transduced by a vector containing a short-hairpin segment of RNA targeting the gene BCL11A.
The study has a maximum accrual of seven evaluable patients, according to the NIH’s clinical trials website. The protocol is similar to bone marrow transplant, in that native blood stem cells are eliminated by myeloablative conditioning therapy. In this gene therapy, the patient’s own blood stem cells are then infused after the new genetic material has been added to counter the normal BCL11A off switch.
Swee Lay Thein, MBBS, an organizer of the NIH’s sickle cell conference, said in an interview that the “gene therapy side is really looking very optimistic.”
Dr. Thein, a senior investigator for sickle-cell genetics at the National Heart, Lung, and Blood Institute, earlier in her career discovered segments of DNA, including the BCL11A gene. She said that gaining greater understanding about genomic variation might someday aid in determining which people need more intense intervention for their sickle cell disease.
“You would be able to predict who will have more severe disease; we could monitor them more closely and perhaps even advocate for gene therapy or bone marrow transplant before complications have occurred rather than waiting for them to occur,” Dr. Thein said.
She referred to this as her “dream” for care of people with sickle cell disease. “This is still far off in the horizon.”
The NHLBI in September 2018 launched its Cure Sickle Cell Initiative. The agency estimates that it spends about $100 million on sickle cell disease research each year. The inherited blood disorder affects about 100,000 people in the United States and 20 million individuals worldwide. In sickle cell disease, a single genetic mutation causes red blood cells to form abnormal, sickle shapes that can clog the blood vessels and deprive cells of oxygen.
Dr. Thompson reported research funding and consulting agreements with Biomarin, Bluebird Bio, Celgene, Novartis, and Shire. Dr. Bauer reported patents related to BCL11A enhancer editing, consulting agreements with Merck and Pfizer, and research support from Bioverativ.
BETHESDA, MD. – Experimental gene therapies for sickle cell disease and thalassemia appear to be advancing, with BCL11A among the most promising targets in this field, researchers said at Sickle Cell in Focus, a conference held by the National Institutes of Health.
Several highly anticipated presentations on the topic are expected for December meeting of the American Society of Hematology.
Alexis A. Thompson, MD, of Northwestern University, Chicago, reviewed highlights from a study in which the majority of patients given a gene therapy for transfusion dependent beta-thalassemia didn’t need subsequent blood transfusions. The New England Journal of Medicine in April published the results of this work done with Bluebird Bio’s LentiGlobin gene therapy (N Engl J Med. 2018; 378:1479-93).
Of the 22 patients in this trial, 15 have become transfusion independent, Dr. Thompson said in her presentation. Those patients that did not have this positive outcome still appear to have been helped by the gene therapy, she said. They had a median of 60% reduction in their transfusion volumes and nearly 60% in their number of transfusions.
“Whether it was transfusion independence or reduction in their transfusion volume or number, the vast majority of individuals in this first large-scale study had clinical benefit” from the therapy, said Dr. Thompson, who was the lead author of the study.
Dr. Thompson, the current president of the American Society of Hematology (ASH), said she’s looking forward to presentations on some of the most advanced gene therapies for sickle cell disease and thalassemia at the group’s annual meeting in December. The ASH presentations include those of John F. Tisdale, MD, who will report the latest data on LentiGlobin gene therapy in sickle cell disease, and Punam Malik, MD, of Cincinnati Children’s Hospital, who has developed a gamma globin lentivirus vector. There also will be a first readout on a particularly novel approach taken by researchers at Boston Children’s Hospital, led by David Williams, MD.
The development of CRISPR-Cas9 “has really opened up the field” of gene therapy, aiding researchers at Boston Children’s in their efforts to develop a treatment to maintain fetal hemoglobin production, Daniel E. Bauer, MD, PhD, of Boston Children’s Hospital, said during his presentation at the NIH conference.
Dr. Bauer provided an update on the BCL11A research that seeks to block what amounts to a genetic “off switch” for production of fetal hemoglobin. It’s long been known that erythrocytes of newborns with sickle cell disease are protected from sickling by high levels of fetal hemoglobin. Clinical manifestations of sickle cell disease then emerge in the first year of life as fetal hemoglobin levels decline.
“A main goal in hematology has been to understand how is it that these alternative fetal hemoglobin genes get silenced and how can we turn them back on,” said Dr. Bauer, a staff physician in pediatric hematology/oncology.
The gene BCL11A also plays key roles in the development of the central nervous system, B lymphatic lymphocyte maturation, and hematopoietic stem cell self-renewal. That led the researchers to hone in on targeting sequences around the BCL11A gene that act as erythroid enhancers, intending to limit potential complications by creating a very specific therapy for sickle cell disease.
In a related clinical trial, using lentiviral gene therapy rather than gene editing, researchers at Boston Children’s began an open-label, nonrandomized, single-center pilot study that involves a single infusion of autologous bone marrow derived CD34+ HSC cells transduced by a vector containing a short-hairpin segment of RNA targeting the gene BCL11A.
The study has a maximum accrual of seven evaluable patients, according to the NIH’s clinical trials website. The protocol is similar to bone marrow transplant, in that native blood stem cells are eliminated by myeloablative conditioning therapy. In this gene therapy, the patient’s own blood stem cells are then infused after the new genetic material has been added to counter the normal BCL11A off switch.
Swee Lay Thein, MBBS, an organizer of the NIH’s sickle cell conference, said in an interview that the “gene therapy side is really looking very optimistic.”
Dr. Thein, a senior investigator for sickle-cell genetics at the National Heart, Lung, and Blood Institute, earlier in her career discovered segments of DNA, including the BCL11A gene. She said that gaining greater understanding about genomic variation might someday aid in determining which people need more intense intervention for their sickle cell disease.
“You would be able to predict who will have more severe disease; we could monitor them more closely and perhaps even advocate for gene therapy or bone marrow transplant before complications have occurred rather than waiting for them to occur,” Dr. Thein said.
She referred to this as her “dream” for care of people with sickle cell disease. “This is still far off in the horizon.”
The NHLBI in September 2018 launched its Cure Sickle Cell Initiative. The agency estimates that it spends about $100 million on sickle cell disease research each year. The inherited blood disorder affects about 100,000 people in the United States and 20 million individuals worldwide. In sickle cell disease, a single genetic mutation causes red blood cells to form abnormal, sickle shapes that can clog the blood vessels and deprive cells of oxygen.
Dr. Thompson reported research funding and consulting agreements with Biomarin, Bluebird Bio, Celgene, Novartis, and Shire. Dr. Bauer reported patents related to BCL11A enhancer editing, consulting agreements with Merck and Pfizer, and research support from Bioverativ.
REPORTING FROM SICKLE CELL IN FOCUS
Award-winning news coverage
We are proud to announce that Doug Brunk, staff reporter for MDedge News, is the winner of an award from the San Diego Press Club. His article "Gun policy's ties to mental illness a complex puzzle," originally published in Clinical Psychiatry News, placed in the Health and Medicine category.
We are proud to announce that Doug Brunk, staff reporter for MDedge News, is the winner of an award from the San Diego Press Club. His article "Gun policy's ties to mental illness a complex puzzle," originally published in Clinical Psychiatry News, placed in the Health and Medicine category.
We are proud to announce that Doug Brunk, staff reporter for MDedge News, is the winner of an award from the San Diego Press Club. His article "Gun policy's ties to mental illness a complex puzzle," originally published in Clinical Psychiatry News, placed in the Health and Medicine category.
Frontal Fibrosing Alopecia: Cutaneous Associations in Women With Skin of Color
Frontal fibrosing alopecia (FFA) has been reported in association with lichen planus pigmentosus (LPP) and facial papules.1-3 Lichen planus pigmentosus is a variant of lichen planus that causes hyperpigmentation of the face, neck, and/or intertriginous areas that may be useful as a clinical indicator in the development of FFA.1 Facial papules in association with FFA are secondary to fibrosed vellus hairs.2,3 Currently, reports of concomitant FFA, LPP, and facial papules in women with skin of color are limited in the literature. This case series includes 5 women of color (Hispanic and black) who presented to our clinic with FFA and various cutaneous associations. A review of the current literature on cutaneous associations of FFA also is provided.
Case Reports
Patient 1
A 50-year-old Hispanic woman who was previously presumed to have melasma by an outside physician presented with pruritus of the scalp and eyebrows of 1 month’s duration. Physical examination revealed decreased frontal scalp hair density with perifollicular erythema and scale with thinning of the lateral eyebrows. Hyperpigmented coalesced macules (Figure 1A) and erythematous perifollicular papules were noted along the temples and on the perioral skin. Depressed forehead and temporal veins also were noted (Figure 1B). A biopsy of the scalp demonstrated perifollicular and perivascular lymphocytic inflammation and fibrosed hair follicles, and a biopsy of the perioral skin demonstrated perivascular lymphocytic inflammation with melanophages in the papillary dermis. A diagnosis of FFA with LPP was established with these biopsies.
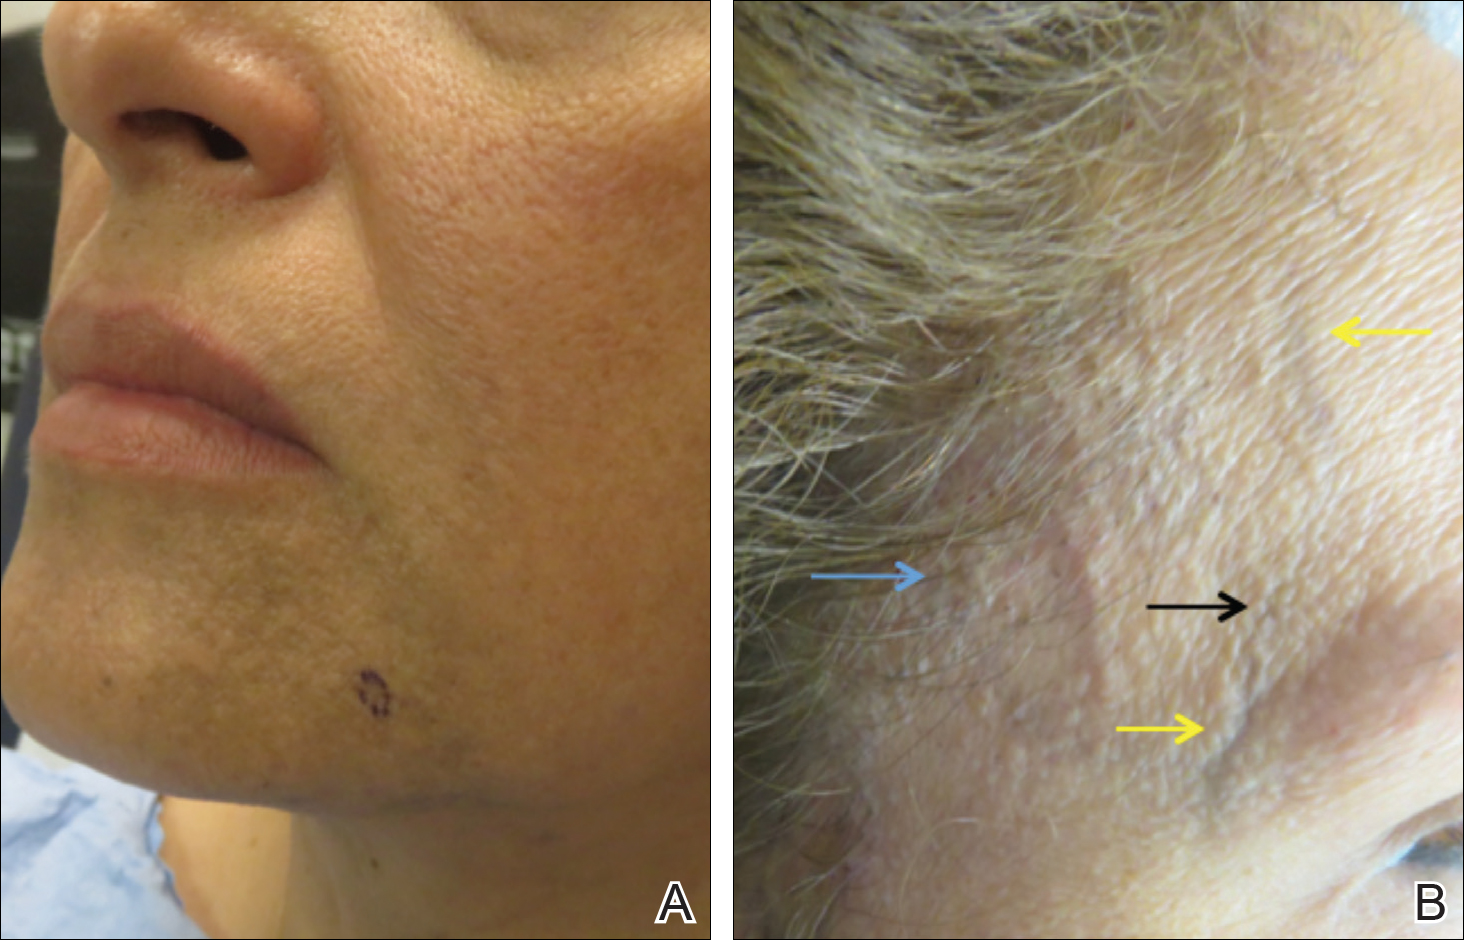
Patient 2
A 61-year-old black woman presented with asymptomatic hair loss along the frontal hairline for an unknown duration. On physical examination the frontal scalp and lateral eyebrows demonstrated decreased hair density with loss of follicular ostia. Fine, flesh-colored, monomorphic papules were scattered along the forehead and temples, and ill-defined brown pigmentation was present along the forehead, temples, and cheeks. Biopsy of the frontal scalp demonstrated patchy lichenoid inflammation with decreased number of follicles with replacement by follicular scars, confirming the diagnosis of FFA.
Patient 3
A 47-year-old Hispanic woman presented with hair loss of the frontal scalp and bilateral eyebrows with associated burning of 2 years’ duration. Physical examination demonstrated recession of the frontotemporal hairline with scattered lone hairs and thinning of the eyebrows. Innumerable flesh-colored papules were present on the forehead and temples (Figure 2A). Glabellar and eyebrow erythema was noted (Figure 2B). Biopsy of the frontal scalp demonstrated decreased terminal anagen hair follicles with perifollicular lymphoid infiltrate and fibrosis, consistent with a diagnosis of FFA. The patient was started on oral hydroxychloroquine 400 mg once daily, and 3 months later hyperpigmentation of the forehead and perioral skin was noted. The patient reported that she had facial hyperpigmentation prior to starting hydroxychloroquine and declined a biopsy.
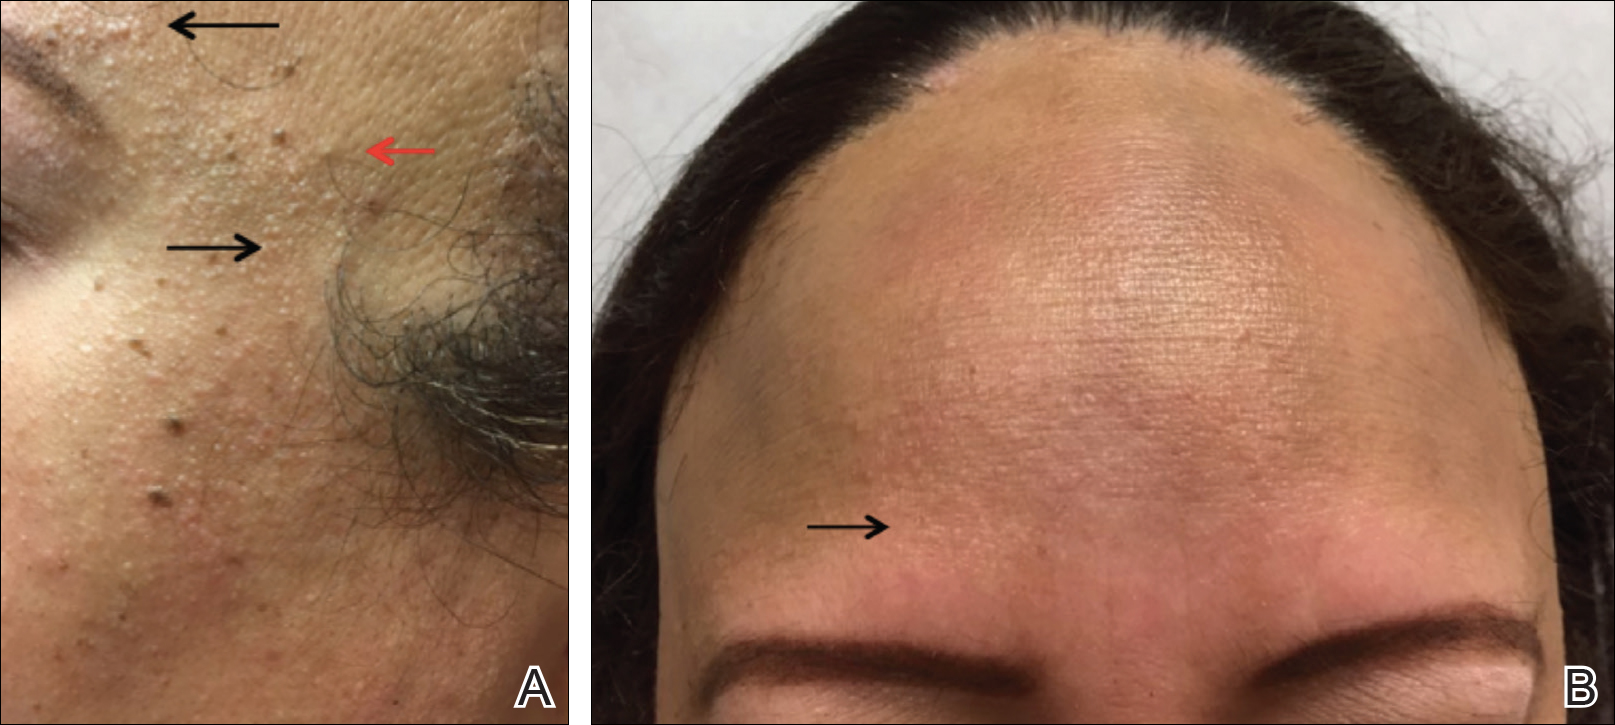
Patient 4
A 40-year-old black woman presented with brown pruritic macles of the face, neck, arms, and forearms of 4 years’ duration. She also reported hair loss on the frontal and occipital scalp, eyebrows, and arms. On physical examination, ill-defined brown macules and patches were noted on the neck (Figure 3), face, arms, and forearms. Decreased hair density was noted on the frontal and occipital scalp with follicular dropout and perifollicular hyperpigmentation. Biopsy of the scalp demonstrated perivascular lymphocytic inflammation with sparse anagen follicles and fibrous tracts, and biopsy of the neck revealed superficial perivascular inflammation with numerous melanophages in the upper dermis; these histopathologic findings were consistent with FFA and LPP, respectively.
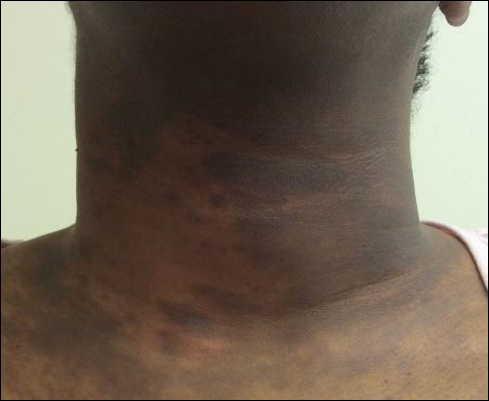
Patient 5
A 46-year-old black woman with history of hair loss presented with hyperpigmentation of the face and neck of 2 years’ duration. On physical examination decreased hair density of the frontal and vertex scalp and lateral eyebrows was noted. Flesh-colored papules were noted on the forehead and cheeks, and confluent dark brown patches were present on the temples and neck. Three punch biopsies were performed. Biopsy of the scalp revealed lymphocytic inflammation with surrounding fibroplasia with overlapping features of FFA and central centrifugal cicatricial alopecia (Figure 4). Biopsy of the neck revealed vacuolar interface dermatitis. Additionally, biopsy of a facial papule revealed lichenoid inflammation involving a vellus hair follicle. Clinical and histopathological correlation confirmed the diagnosis of FFA with LPP and facial papules.
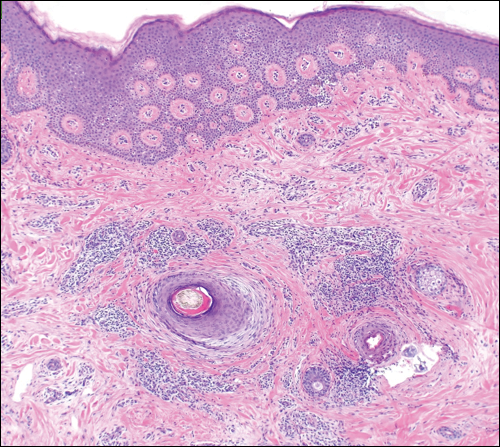
Comment
Current understanding of FFA as a progressive, lymphocytic, scarring alopecia has expanded in recent years. Clinical observation suggests that the incidence of FFA is increasing4; however more epidemiologic data are needed. Frontal fibrosing alopecia presents clinically with symmetrical frontotemporal hair loss with lone hairs. Trichoscopy reveals perifollicular hyperkeratosis, perifollicular erythema, and follicular plugging in 72%, 66%, and 44% of cases, respectively.5 In one study (N=242), patients were classified into 3 clinical patterns of FFA: pattern I (linear) showed bandlike loss of frontal hair with normal density directly behind the hairline; pattern II (diffuse) showed loss of density behind the frontal hairline; and pattern III (double line) showed a pseudo–“fringe sign” appearance. The majority of patients were classified as either pattern I or II, with pattern II predicting a poorer prognosis.6
rontal fibrosing alopecia is increasingly recognized in men, with prevalence as high as 5%.1 Facial hair involvement, particularly of the upper lip and sideburns, is an important consideration in men.7 Most studies suggest that 80% to 90% of affected women are postmenopausal,8 though a case series presented by Dlova1 identified 27% of affected women as postmenopausal. The coexistence of premature menopause and hysterectomy in FFA patients suggests a hormonal contribution, but this association is still poorly understood.8 Epidemiologic data on ethnicity in FFA are sparse but suggest that white individuals are more likely to be affected. Frontal fibrosing alopecia also may be misdiagnosed as traction alopecia in Hispanic and black patients.8
It is prudent for physicians to assess for and recognize clinical clues to severe forms of FFA. A 2014 multicenter review of 355 patients identified 3 clinical entities that predicted more severe forms of FFA: eyelash loss (madarosis), loss of body hair, and facial papules.8 Madarosis occurs due to perifollicular inflammation and fibrosis of eyelash hair follicles. Similarly, perifollicular inflammation of body hair was present in 24% of patients (N=86), most commonly of the axillary and pubic hair. Facial papules form due to facial vellus hair inflammation and fibrosis and were identified in 14% of patients (N=49).8 These clinical findings may allow providers to predict more extensive clinical involvement of FFA.
Frontal fibrosing alopecia and LPP occur concomitantly in up 54% of patients, more commonly in darker-skinned patients.1,9,10 Lichen planus pigmentosus frequently occurs on the face and neck, most commonly in a diffuse pattern, though reticulated and macular patterns also have been identified.11 In some patients, LPP precedes the development of FFA and may be useful as a herald sign1; therefore, it is important for dermatologists to evaluate for signs of FFA when evaluating those with LPP. Thorough evaluation in patients with skin of color also is important because FFA may be misdiagnosed as traction alopecia.
Additional cutaneous associations of FFA include eyebrow loss, glabellar red dots, and prominent frontal veins. Eyebrow loss occurs secondary to fibrosis of eyebrow hair follicles and has been found in 40% to 80% of patients with FFA; it is thought to be associated with milder forms of FFA.8 Glabellar red dots correlate with histopathologic lymphocytic inflammation of vellus hair follicles.12 Additionally, frontal vein prominence has been described in FFA and is thought to be secondary to atrophy in this scarring process, perhaps worsened by local steroid treatments.13 Mucocutaneous lichen planus, rosacea, thyroid disease, vitiligo, and other autoimmune disorders also have been reported in patients with FFA.14
Conclusion
Concomitant FFA, LPP, and facial papules have been rarely reported and exemplify the spectrum of cutaneous associations with FFA, particularly in individuals with skin of color. Clinical variants and associations of FFA are broad, including predictors of poorer prognosis such as eyelash loss and vellus hair involvement seen as facial papules. Lichen planus pigmentosus is well described in association with FFA and may serve as a herald sign that frontal hair loss should not be mistaken for traction alopecia in early stages. Eyebrow loss is thought to represent milder disease. It is important for dermatologists to be aware of these findings to understand the breadth of this disease and for appropriate evaluation and management of patients with FFA.
- Dlova NC. Frontal fibrosing alopecia and lichen planus pigmentosus: is there a link? Br J Dermatol. 2013;168:439-432.
- Donati A, Molina L, Doche I, et al. Facial papules in frontal fibrosing alopecia: evidence of vellus follicle involvement. Arch Dermatol. 2011;147:1424-1427.
- Tan KT, Messenger AG. Frontal fibrosing alopecia: clinical presentations and prognosis. Br J Dermatol. 2009;160:75-79.
- Rudnicka L, Rakowska A. The increasing incidence of frontal fibrosing alopecia. in search of triggering factors. J Eur Acad Dermatol Venereol. 2017;31:1579-1580.
- Toledo-Pastrana T, Hernández MJ, Camacho Martínez FM. Perifollicular erythema as a trichoscopy sign of progression in frontal fibrosing alopecia. Int J Trichology. 2013;5:151-153.
- Moreno-Arrones OM, Saceda-Corralo D, Fonda-Pascual P, et al. Frontal fibrosing alopecia: clinical and prognostic classification. J Eur Acad Dermatol Venereol. 2017;31:1739-1745.
- Tolkachjov SN, Chaudhry HM, Camilleri MJ, et al. Frontal fibrosing alopecia among men: a clinicopathologic study of 7 cases. J Am Acad Dermatol. 2017;77:683-690.e2.
- Vañó-Galván S, Molina-Ruiz AM, Serrano-Falcón C, et al. Frontal fibrosing alopecia: a multicenter review of 355 patients. J Am Acad Dermatol. 2014;70:670-678.
- Berliner JG, McCalmont TH, Price VH, et al. Frontal fibrosing alopecia and lichen planus pigmentosus. J Am Acad Dermatol. 2014;71:E26-E27.
- Rao R, Sarda A, Khanna R, et al. Coexistence of frontal fibrosing alopecia with lichen planus pigmentosus. Int J Dermatol. 2014;53:622-624.
- Pirmez R, Duque-Estrada B, Donati A, et al. Clinical and dermoscopic features of lichen planus pigmentosus in 37 patients with frontal fibrosing alopecia. Br J Dermatol. 2016;175:1387-1390.
- Pirmez R, Donati A, Valente NS, et al. Glabellar red dots in frontal fibrosing alopecia: a further clinical sign of vellus follicle involvement. Br J Dermatol. 2014;170:745-746.
- Vañó-Galván S, Rodrigues-Barata AR, Urech M, et al. Depression of the frontal veins: a new clinical sign of frontal fibrosing alopecia. J Am Acad Dermatol. 2015;72:1087-1088.
- Pindado-Ortega C, Saceda-Corralo D, Buendía-Castaño D, et al. Frontal fibrosing alopecia and cutaneous comorbidities: a potential relationship with rosacea. J Am Acad Dermatol. 2018;78:596-597.e1.
Frontal fibrosing alopecia (FFA) has been reported in association with lichen planus pigmentosus (LPP) and facial papules.1-3 Lichen planus pigmentosus is a variant of lichen planus that causes hyperpigmentation of the face, neck, and/or intertriginous areas that may be useful as a clinical indicator in the development of FFA.1 Facial papules in association with FFA are secondary to fibrosed vellus hairs.2,3 Currently, reports of concomitant FFA, LPP, and facial papules in women with skin of color are limited in the literature. This case series includes 5 women of color (Hispanic and black) who presented to our clinic with FFA and various cutaneous associations. A review of the current literature on cutaneous associations of FFA also is provided.
Case Reports
Patient 1
A 50-year-old Hispanic woman who was previously presumed to have melasma by an outside physician presented with pruritus of the scalp and eyebrows of 1 month’s duration. Physical examination revealed decreased frontal scalp hair density with perifollicular erythema and scale with thinning of the lateral eyebrows. Hyperpigmented coalesced macules (Figure 1A) and erythematous perifollicular papules were noted along the temples and on the perioral skin. Depressed forehead and temporal veins also were noted (Figure 1B). A biopsy of the scalp demonstrated perifollicular and perivascular lymphocytic inflammation and fibrosed hair follicles, and a biopsy of the perioral skin demonstrated perivascular lymphocytic inflammation with melanophages in the papillary dermis. A diagnosis of FFA with LPP was established with these biopsies.
Patient 2
A 61-year-old black woman presented with asymptomatic hair loss along the frontal hairline for an unknown duration. On physical examination the frontal scalp and lateral eyebrows demonstrated decreased hair density with loss of follicular ostia. Fine, flesh-colored, monomorphic papules were scattered along the forehead and temples, and ill-defined brown pigmentation was present along the forehead, temples, and cheeks. Biopsy of the frontal scalp demonstrated patchy lichenoid inflammation with decreased number of follicles with replacement by follicular scars, confirming the diagnosis of FFA.
Patient 3
A 47-year-old Hispanic woman presented with hair loss of the frontal scalp and bilateral eyebrows with associated burning of 2 years’ duration. Physical examination demonstrated recession of the frontotemporal hairline with scattered lone hairs and thinning of the eyebrows. Innumerable flesh-colored papules were present on the forehead and temples (Figure 2A). Glabellar and eyebrow erythema was noted (Figure 2B). Biopsy of the frontal scalp demonstrated decreased terminal anagen hair follicles with perifollicular lymphoid infiltrate and fibrosis, consistent with a diagnosis of FFA. The patient was started on oral hydroxychloroquine 400 mg once daily, and 3 months later hyperpigmentation of the forehead and perioral skin was noted. The patient reported that she had facial hyperpigmentation prior to starting hydroxychloroquine and declined a biopsy.
Patient 4
A 40-year-old black woman presented with brown pruritic macles of the face, neck, arms, and forearms of 4 years’ duration. She also reported hair loss on the frontal and occipital scalp, eyebrows, and arms. On physical examination, ill-defined brown macules and patches were noted on the neck (Figure 3), face, arms, and forearms. Decreased hair density was noted on the frontal and occipital scalp with follicular dropout and perifollicular hyperpigmentation. Biopsy of the scalp demonstrated perivascular lymphocytic inflammation with sparse anagen follicles and fibrous tracts, and biopsy of the neck revealed superficial perivascular inflammation with numerous melanophages in the upper dermis; these histopathologic findings were consistent with FFA and LPP, respectively.
Patient 5
A 46-year-old black woman with history of hair loss presented with hyperpigmentation of the face and neck of 2 years’ duration. On physical examination decreased hair density of the frontal and vertex scalp and lateral eyebrows was noted. Flesh-colored papules were noted on the forehead and cheeks, and confluent dark brown patches were present on the temples and neck. Three punch biopsies were performed. Biopsy of the scalp revealed lymphocytic inflammation with surrounding fibroplasia with overlapping features of FFA and central centrifugal cicatricial alopecia (Figure 4). Biopsy of the neck revealed vacuolar interface dermatitis. Additionally, biopsy of a facial papule revealed lichenoid inflammation involving a vellus hair follicle. Clinical and histopathological correlation confirmed the diagnosis of FFA with LPP and facial papules.
Comment
Current understanding of FFA as a progressive, lymphocytic, scarring alopecia has expanded in recent years. Clinical observation suggests that the incidence of FFA is increasing4; however more epidemiologic data are needed. Frontal fibrosing alopecia presents clinically with symmetrical frontotemporal hair loss with lone hairs. Trichoscopy reveals perifollicular hyperkeratosis, perifollicular erythema, and follicular plugging in 72%, 66%, and 44% of cases, respectively.5 In one study (N=242), patients were classified into 3 clinical patterns of FFA: pattern I (linear) showed bandlike loss of frontal hair with normal density directly behind the hairline; pattern II (diffuse) showed loss of density behind the frontal hairline; and pattern III (double line) showed a pseudo–“fringe sign” appearance. The majority of patients were classified as either pattern I or II, with pattern II predicting a poorer prognosis.6
rontal fibrosing alopecia is increasingly recognized in men, with prevalence as high as 5%.1 Facial hair involvement, particularly of the upper lip and sideburns, is an important consideration in men.7 Most studies suggest that 80% to 90% of affected women are postmenopausal,8 though a case series presented by Dlova1 identified 27% of affected women as postmenopausal. The coexistence of premature menopause and hysterectomy in FFA patients suggests a hormonal contribution, but this association is still poorly understood.8 Epidemiologic data on ethnicity in FFA are sparse but suggest that white individuals are more likely to be affected. Frontal fibrosing alopecia also may be misdiagnosed as traction alopecia in Hispanic and black patients.8
It is prudent for physicians to assess for and recognize clinical clues to severe forms of FFA. A 2014 multicenter review of 355 patients identified 3 clinical entities that predicted more severe forms of FFA: eyelash loss (madarosis), loss of body hair, and facial papules.8 Madarosis occurs due to perifollicular inflammation and fibrosis of eyelash hair follicles. Similarly, perifollicular inflammation of body hair was present in 24% of patients (N=86), most commonly of the axillary and pubic hair. Facial papules form due to facial vellus hair inflammation and fibrosis and were identified in 14% of patients (N=49).8 These clinical findings may allow providers to predict more extensive clinical involvement of FFA.
Frontal fibrosing alopecia and LPP occur concomitantly in up 54% of patients, more commonly in darker-skinned patients.1,9,10 Lichen planus pigmentosus frequently occurs on the face and neck, most commonly in a diffuse pattern, though reticulated and macular patterns also have been identified.11 In some patients, LPP precedes the development of FFA and may be useful as a herald sign1; therefore, it is important for dermatologists to evaluate for signs of FFA when evaluating those with LPP. Thorough evaluation in patients with skin of color also is important because FFA may be misdiagnosed as traction alopecia.
Additional cutaneous associations of FFA include eyebrow loss, glabellar red dots, and prominent frontal veins. Eyebrow loss occurs secondary to fibrosis of eyebrow hair follicles and has been found in 40% to 80% of patients with FFA; it is thought to be associated with milder forms of FFA.8 Glabellar red dots correlate with histopathologic lymphocytic inflammation of vellus hair follicles.12 Additionally, frontal vein prominence has been described in FFA and is thought to be secondary to atrophy in this scarring process, perhaps worsened by local steroid treatments.13 Mucocutaneous lichen planus, rosacea, thyroid disease, vitiligo, and other autoimmune disorders also have been reported in patients with FFA.14
Conclusion
Concomitant FFA, LPP, and facial papules have been rarely reported and exemplify the spectrum of cutaneous associations with FFA, particularly in individuals with skin of color. Clinical variants and associations of FFA are broad, including predictors of poorer prognosis such as eyelash loss and vellus hair involvement seen as facial papules. Lichen planus pigmentosus is well described in association with FFA and may serve as a herald sign that frontal hair loss should not be mistaken for traction alopecia in early stages. Eyebrow loss is thought to represent milder disease. It is important for dermatologists to be aware of these findings to understand the breadth of this disease and for appropriate evaluation and management of patients with FFA.
- Dlova NC. Frontal fibrosing alopecia and lichen planus pigmentosus: is there a link? Br J Dermatol. 2013;168:439-432.
- Donati A, Molina L, Doche I, et al. Facial papules in frontal fibrosing alopecia: evidence of vellus follicle involvement. Arch Dermatol. 2011;147:1424-1427.
- Tan KT, Messenger AG. Frontal fibrosing alopecia: clinical presentations and prognosis. Br J Dermatol. 2009;160:75-79.
- Rudnicka L, Rakowska A. The increasing incidence of frontal fibrosing alopecia. in search of triggering factors. J Eur Acad Dermatol Venereol. 2017;31:1579-1580.
- Toledo-Pastrana T, Hernández MJ, Camacho Martínez FM. Perifollicular erythema as a trichoscopy sign of progression in frontal fibrosing alopecia. Int J Trichology. 2013;5:151-153.
- Moreno-Arrones OM, Saceda-Corralo D, Fonda-Pascual P, et al. Frontal fibrosing alopecia: clinical and prognostic classification. J Eur Acad Dermatol Venereol. 2017;31:1739-1745.
- Tolkachjov SN, Chaudhry HM, Camilleri MJ, et al. Frontal fibrosing alopecia among men: a clinicopathologic study of 7 cases. J Am Acad Dermatol. 2017;77:683-690.e2.
- Vañó-Galván S, Molina-Ruiz AM, Serrano-Falcón C, et al. Frontal fibrosing alopecia: a multicenter review of 355 patients. J Am Acad Dermatol. 2014;70:670-678.
- Berliner JG, McCalmont TH, Price VH, et al. Frontal fibrosing alopecia and lichen planus pigmentosus. J Am Acad Dermatol. 2014;71:E26-E27.
- Rao R, Sarda A, Khanna R, et al. Coexistence of frontal fibrosing alopecia with lichen planus pigmentosus. Int J Dermatol. 2014;53:622-624.
- Pirmez R, Duque-Estrada B, Donati A, et al. Clinical and dermoscopic features of lichen planus pigmentosus in 37 patients with frontal fibrosing alopecia. Br J Dermatol. 2016;175:1387-1390.
- Pirmez R, Donati A, Valente NS, et al. Glabellar red dots in frontal fibrosing alopecia: a further clinical sign of vellus follicle involvement. Br J Dermatol. 2014;170:745-746.
- Vañó-Galván S, Rodrigues-Barata AR, Urech M, et al. Depression of the frontal veins: a new clinical sign of frontal fibrosing alopecia. J Am Acad Dermatol. 2015;72:1087-1088.
- Pindado-Ortega C, Saceda-Corralo D, Buendía-Castaño D, et al. Frontal fibrosing alopecia and cutaneous comorbidities: a potential relationship with rosacea. J Am Acad Dermatol. 2018;78:596-597.e1.
Practice Points
- Frontal fibrosing alopecia (FFA) is associated with lichen planus pigmentosus, especially in patients with skin of color.
- Patients with FFA should be evaluated for additional cutaneous features including facial papules, glabellar red dots, and depressed frontal veins.
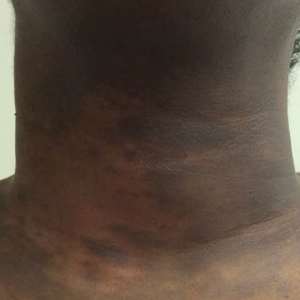
DRESS Syndrome: Clinical Myths and Pearls
Drug rash with eosinophilia and systemic symptoms (DRESS syndrome), also known as drug-induced hypersensitivity syndrome, is an uncommon severe systemic hypersensitivity drug reaction. It is estimated to occur in 1 in every 1000 to 10,000 drug exposures.1 It can affect patients of all ages and typically presents 2 to 6 weeks after exposure to a culprit medication. Classically, DRESS syndrome presents with often widespread rash, facial edema, systemic symptoms such as fever, lymphadenopathy, and evidence of visceral organ involvement. Peripheral blood eosinophilia is frequently but not universally observed.1,2
Even with proper management, reported DRESS syndrome mortality rates worldwide are approximately 10%2 or higher depending on the degree and type of other organ involvement (eg, cardiac).3 Beyond the acute manifestations of DRESS syndrome, this condition is unique in that some patients develop late-onset sequelae such as myocarditis or autoimmune conditions even years after the initial cutaneous eruption.4 Therefore, longitudinal evaluation is a key component of management.
The clinical myths and pearls presented here highlight some of the commonly held assumptions regarding DRESS syndrome in an effort to illuminate subtleties of managing patients with this condition (Table).
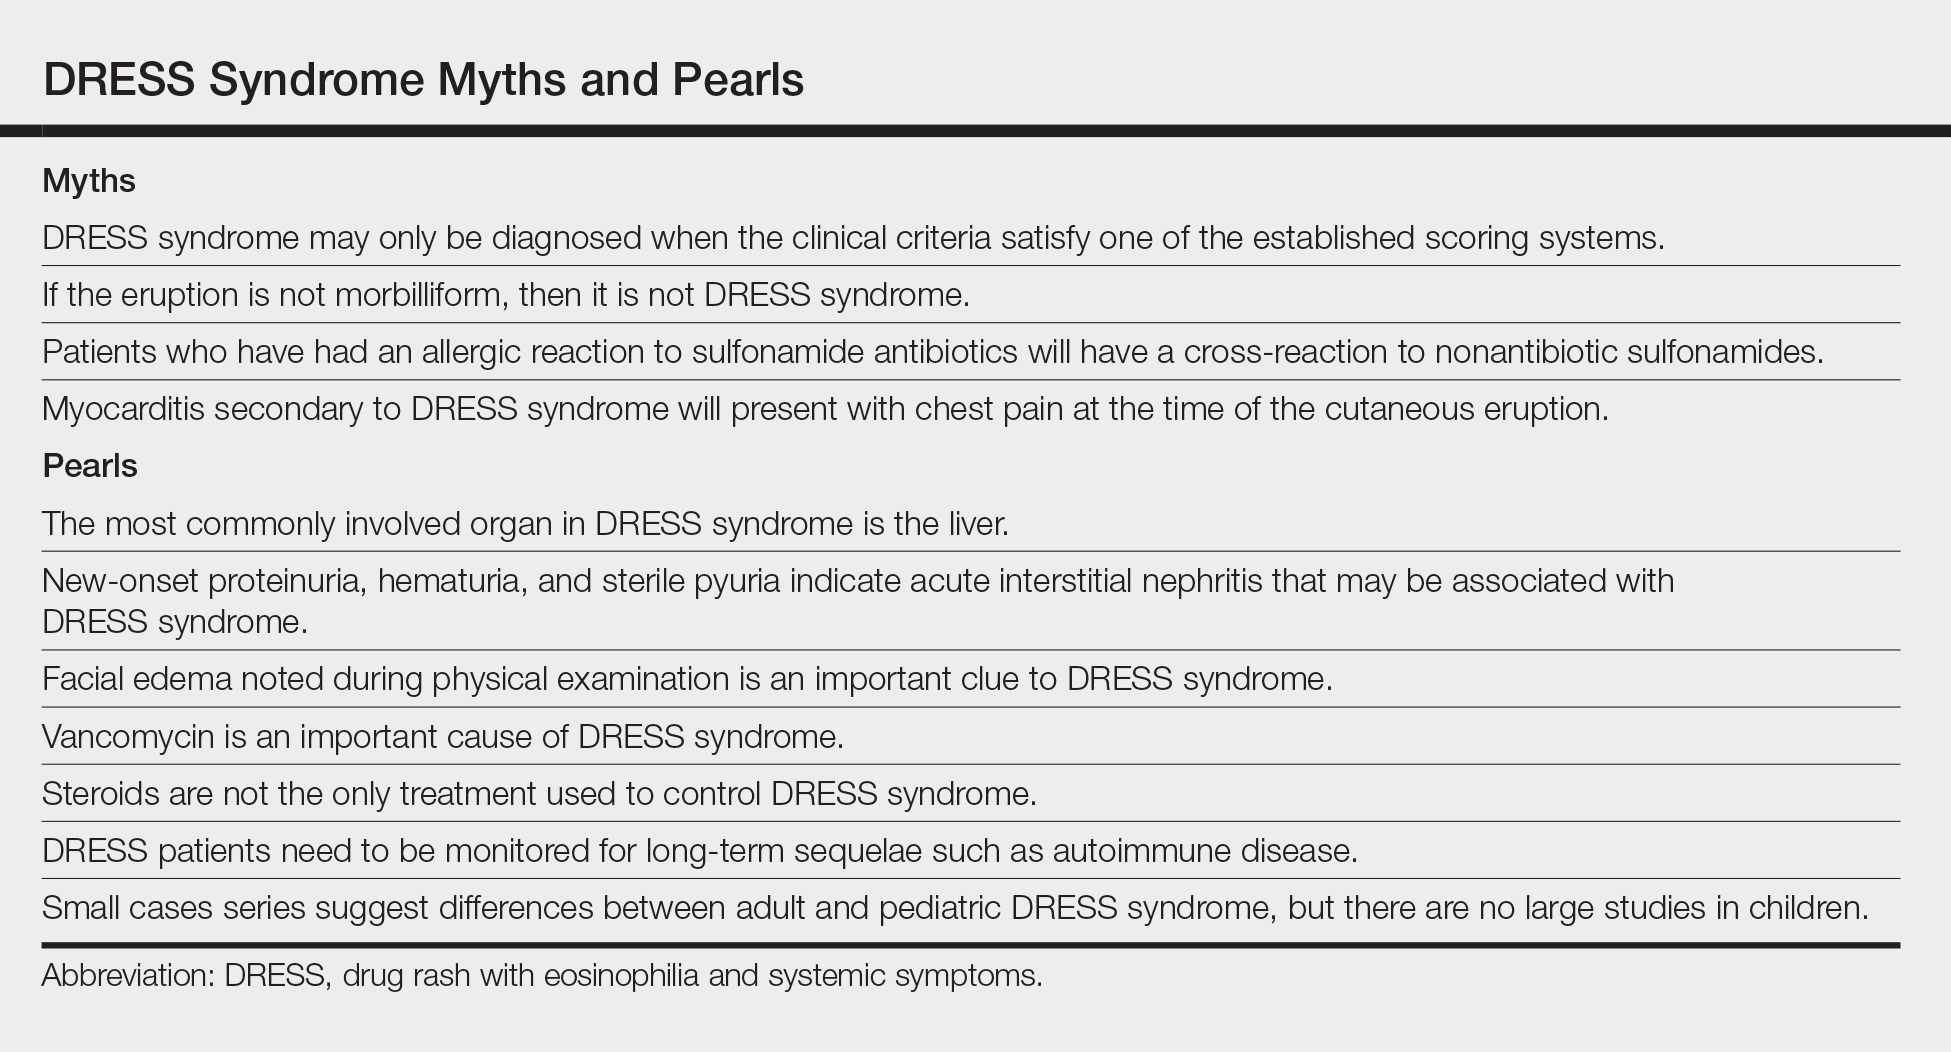
Myth: DRESS syndrome may only be diagnosed when the clinical criteria satisfy one of the established scoring systems.
Patients with DRESS syndrome can have heterogeneous manifestations. As a result, patients may develop a drug hypersensitivity with biological behavior and a natural history compatible with DRESS syndrome that does not fulfill published diagnostic criteria.5 The syndrome also may reveal its component manifestations gradually, thus delaying the diagnosis. The terms mini-DRESS and skirt syndrome have been employed to describe drug eruptions that clearly have systemic symptoms and more complex and pernicious biologic behavior than a simple drug exanthema but do not meet DRESS syndrome criteria. Ultimately, it is important to note that in clinical practice, DRESS syndrome exists on a spectrum of severity and the diagnosis remains a clinical one.
Pearl: The most commonly involved organ in DRESS syndrome is the liver.
Liver involvement is the most common visceral organ involved in DRESS syndrome and is estimated to occur in approximately 45.0% to 86.1% of cases.6,7 If a patient develops the characteristic rash, peripheral blood eosinophilia, and evidence of liver injury, DRESS syndrome must be included in the differential diagnosis.
Hepatitis presenting in DRESS syndrome can be hepatocellular, cholestatic, or mixed.6,7 Case series are varied in whether the transaminitis of DRESS syndrome tends to be more hepatocellular8 or cholestatic.7 Liver dysfunction in DRESS syndrome often lasts longer than in other severe cutaneous adverse drug reactions, and patients may improve anywhere from a few days in milder cases to months to achieve resolution of abnormalities.6,7 Severe hepatic involvement is thought to be the most notable cause of mortality.9
Pearl: New-onset proteinuria, hematuria, and sterile pyuria indicate acute interstitial nephritis that may be associated with DRESS syndrome.
Acute interstitial nephritis (AIN) is a drug-induced form of acute kidney injury that can co-occur with DRESS syndrome. Acute interstitial nephritis can present with some combination of acute kidney injury, morbilliform eruption, eosinophilia, fever, and sometimes eosinophiluria. Although AIN can be distinct from DRESS syndrome, there are cases of DRESS syndrome associated with AIN.10 In the correct clinical context, urinalysis may help by showing new-onset proteinuria, new-onset hematuria, and sterile pyuria. More common causes of acute kidney injury such as prerenal etiologies and acute tubular necrosis have a bland urinary sediment.
Myth: If the eruption is not morbilliform, then it is not DRESS syndrome.
The most common morphology of DRESS syndrome is a morbilliform eruption (Figure 1), but urticarial and atypical targetoid (erythema multiforme–like) eruptions also have been described.9 Rarely, DRESS syndrome secondary to use of allopurinol or anticonvulsants may have a pustular morphology (Figure 2), which is distinguished from acute generalized exanthematous pustulosis by its delayed onset, more severe visceral involvement, and prolonged course.11

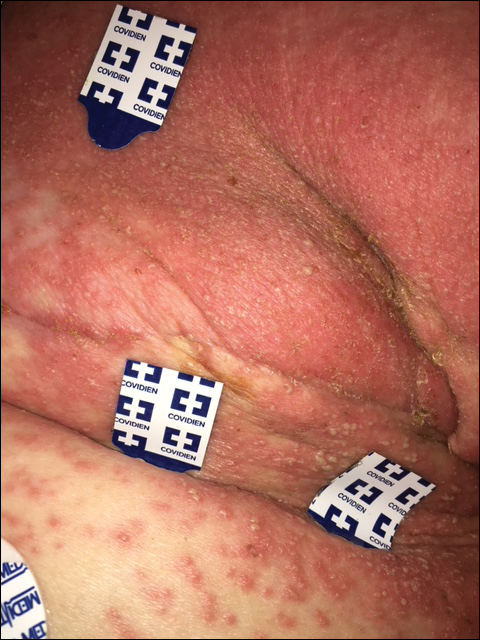
Another reported variant demonstrates overlapping features between Stevens-Johnson syndrome/toxic epidermal necrolysis and DRESS syndrome. It may present with mucositis, atypical targetoid lesions, and vesiculobullous lesions.12 It is unclear whether this reported variant is indeed a true subtype of DRESS syndrome, as Stevens-Johnson syndrome/toxic epidermal necrolysis may present with systemic symptoms, lymphadenopathy, hepatic, renal, and pulmonary complications, among other systemic disturbances.12
Pearl: Facial edema noted during physical examination is an important clue of DRESS syndrome.
Perhaps the most helpful findings in the diagnosis of DRESS syndrome are facial edema and anasarca (Figure 3), as facial edema is not a usual finding in sepsis. Facial edema can be severe enough that the patient’s features are dramatically altered. It may be useful to ask family members if the patient’s face appears swollen or to compare the current appearance to the patient’s driver’s license photograph. An important complication to note is laryngeal edema, which may complicate airway management and may manifest as respiratory distress, stridor, and the need for emergent intubation.13

Myth: Patients who have had an allergic reaction to sulfonamide antibiotics will have a cross-reaction to nonantibiotic sulfonamides.
A common question is, if a patient has had a prior allergy to sulfonamide antibiotics, then are nonantibiotic sulfones such as a sulfonylurea, thiazide diuretic, or furosemide likely to cause a a cross-reaction? In one study (N=969), only 9.9% of patients with a prior sulfone antibiotic allergy developed hypersensitivity when exposed to a nonantibiotic sulfone, which is thought to be due to an overall increased propensity for hypersensitivity rather than a true cross-reaction. In fact, the risk for developing a hypersensitivity reaction to penicillin (14.0% [717/5115]) was higher than the risk for developing a reaction from a nonantibiotic sulfone among these patients.14 This study bolsters the argument that if there are other potential culprit medications and the time course for a patient’s nonantibiotic sulfone is not consistent with the timeline for DRESS syndrome, it may be beneficial to look for a different causative agent.
Pearl: Vancomycin is an important cause of DRESS syndrome.
Guidelines for treating endocarditis and osteomyelitis caused by methicillin-resistant Staphylococcus aureus infection recommend intravenous vancomycin for 4 to 6 weeks.15 This duration is within the relevant time frame of exposure for the development of DRESS syndrome de novo.
One case series noted that 37.5% (12/32) of DRESS syndrome cases in a 3-year period were caused by vancomycin, which notably was the most common medication associated with DRESS syndrome.16 There were caveats to this case series in that no standardized drug causality score was used and the sample size over the 3-year period was small; however, the increased use (and misuse) of antibiotics and perhaps increased recognition of rash in outpatient parenteral antibiotic therapy clinics may play a role if vancomycin-induced DRESS syndrome is indeed becoming more common.
Myth: Myocarditis secondary to DRESS syndrome will present with chest pain at the time of the cutaneous eruption.
Few patients with DRESS syndrome–associated myocarditis actually are symptomatic during their hospitalization.4 In asymptomatic patients, the primary team and consultants should be vigilant for the potential of subclinical myocarditis or the possibility of developing cardiac involvement after discharge, as myocarditis secondary to DRESS syndrome may present any time from rash onset up to 4 months later.4 Therefore, DRESS patients should be especially attentive to any new cardiac symptoms and notify their provider if any develop.
Although no standard cardiac screening guidelines exist for DRESS syndrome, some have recommended that baseline cardiac screening tests including electrocardiogram, troponin levels, and echocardiogram be considered at the time of diagnosis.5 If any testing is abnormal, DRESS syndrome–associated myocarditis should be suspected and an endomyocardial biopsy, which is the diagnostic gold standard, may be necessary.4 If the cardiac screening tests are normal, some investigators recommend serial outpatient echocardiograms for all DRESS patients, even those who remain asymptomatic.17 An alternative is an empiric approach in which a thorough review of systems is performed and testing is done if patients develop symptoms that are concerning for myocarditis.
Pearl: Steroids are not the only treatment used to control DRESS syndrome.
A prolonged taper of systemic steroids is the first-line treatment of DRESS syndrome. Steroids at the equivalent of 1 to 2 mg/kg daily (once or divided into 2 doses) of prednisone typically are used. For severe and/or recalcitrant DRESS syndrome, 2 mg/kg daily (once or divided into 2 doses) typically is used, and less than 1 mg/kg daily may be used for mini-DRESS syndrome.
Clinical improvement of DRESS syndrome has been demonstrated in several case reports with intravenous immunoglobulin, cyclosporine, cyclophosphamide, mycophenolate mofetil, and plasmapheresis.18-21 Each of these therapies typically were initiated as second-line therapeutic agents when initial treatment with steroids failed. It is important to note that large prospective studies regarding these treatments are lacking; however, there have been case reports of acute necrotizing eosinophilic myocarditis that did not respond to the combination of steroids and cyclosporine.4,22
Although there have been successful case reports using intravenous immunoglobulin, a 2012 prospective open-label clinical trial reported notable side effects in 5 of 6 (83.3%) patients with only 1 of 6 (16.6%) achieving the primary end point of control of fever/symptoms at day 7 and clinical remission without steroids on day 30.23
Pearl: DRESS patients need to be monitored for long-term sequelae such as autoimmune disease.
Several autoimmune conditions may develop as a delayed complication of DRESS syndrome, including autoimmune thyroiditis, systemic lupus erythematosus, type 1 diabetes mellitus, and autoimmune hemolytic anemia.24-26 Incidence rates of autoimmunity following DRESS syndrome range from 3% to 5% among small case series.24,25
Autoimmune thyroiditis, which may present as Graves disease, Hashimoto thyroiditis, or painless thyroiditis, is the most common autoimmune disorder to develop in DRESS patients and appears from several weeks to up to 3 years after DRESS.24 Therefore, all DRESS patients should be monitored longitudinally for several years for signs or symptoms suggestive of an autoimmune condition.5,24,26
Because no guidelines exist regarding serial monitoring for autoimmune sequelae, it may be reasonable to check thyroid function tests at the time of diagnosis and regularly for at least 2 years after diagnosis.5 Alternatively, clinicians may consider an empiric approach to laboratory testing that is guided by the development of clinical symptoms.
Pearl: Small cases series suggest differences between adult and pediatric DRESS syndrome, but there are no large studies in children.
Small case series have suggested there may be noteworthy differences between DRESS syndrome in adults and children. Although human herpesvirus 6 (HHV-6) positivity in DRESS syndrome in adults may be as high as 80%, 13% of pediatric patients in one cohort tested positive for HHV-6, though the study size was limited at 29 total patients.27 In children, DRESS syndrome secondary to antibiotics was associated with a shorter latency time as compared to cases secondary to nonantibiotics. In contrast to the typical 2- to 6-week timeline, Sasidharanpillai et al28 reported an average onset 5.8 days after drug administration in antibiotic-associated DRESS syndrome compared to 23.9 days for anticonvulsants, though this study only included 11 total patients. Other reports have suggested a similar trend.27
The role of HHV-6 positivity in pediatric DRESS syndrome and its influence on prognosis remains unclear. One study showed a worse prognosis for pediatric patients with positive HHV-6 antibodies.27 However, with such a small sample size—only 4 HHV-6–positive patients of 29 pediatric DRESS cases—larger studies are needed to better characterize the relationship between HHV-6 positivity and prognosis.
- Cacoub P, Musette P, Descamps V, et al. The DRESS syndrome: a literature review. Am J Med, 2011;124:588-597.
- Kardaun SH, Sekula P, Valeyrie-Allanore L, et al. Drug reaction with eosinophilia and systemic symptoms (DRESS): an original multisystem adverse drug reaction. results from the prospective RegiSCAR study. Br J Dermatol. 2013;169:1071-1080.
- Intarasupht J, Kanchanomai A, Leelasattakul W, et al. Prevalence, risk factors, and mortality outcome in the drug reaction with eosinophilia and systemic symptoms patients with cardiac involvement. Int J Dermatol. 2018;57:1187-1191.
- Bourgeois GP, Cafardi JA, Groysman V, et al. A review of DRESS-associated myocarditis. J Am Acad Dermatol. 2012;66:E229-E236.
- Husain Z, Reddy BY, Schwartz RA. DRESS syndrome: part I. clinical perspectives. J Am Acad Dermatol. 2013;68:693.e1-693.e14; quiz 706-708.
- Lee T, Lee YS, Yoon SY, et al. Characteristics of liver injury in drug-induced systemic hypersensitivity reactions. J Am Acad Dermatol. 2013;69:407-415.
- Lin IC, Yang HC, Strong C, et al. Liver injury in patients with DRESS: a clinical study of 72 cases. J Am Acad Dermatol. 2015;72:984-991.
- Peyrière H, Dereure O, Breton H, et al. Variability in the clinical pattern of cutaneous side-effects of drugs with systemic symptoms: does a DRESS syndrome really exist? Br J Dermatol. 2006;155:422-428.
- Walsh S, Diaz-Cano S, Higgins E, et al. Drug reaction with eosinophilia and systemic symptoms: is cutaneous phenotype a prognostic marker for outcome? a review of clinicopathological features of 27 cases. Br J Dermatol. 2013;168:391-401.
- Raghavan R, Eknoyan G. Acute interstitial nephritis—a reappraisal and update. Clin Nephrol. 2014;82:149-162.
- Matsuda H, Saito K, Takayanagi Y, et al. Pustular-type drug-induced hypersensitivity syndrome/drug reaction with eosinophilia and systemic symptoms due to carbamazepine with systemic muscle involvement. J Dermatol. 2013;40:118-122.
- Wolf R, Davidovici B, Matz H, et al. Drug rash with eosinophilia and systemic symptoms versus Stevens-Johnson Syndrome—a case that indicates a stumbling block in the current classification. Int Arch Allergy Immunol. 2006;141:308-310.
- Kumar A, Goldfarb JW, Bittner EA. A case of drug rash with eosinophilia and systemic symptoms (DRESS) syndrome complicating airway management. Can J Anaesth. 2012;59:295-298.
- Strom BL, Schinnar R, Apter AJ, et al. Absence of cross-reactivity between sulfonamide antibiotics and sulfonamide nonantibiotics. N Engl J Med. 2003;349:1628-1635.
- Berbari EF, Kanj SS, Kowalski TJ, et al; Infectious Diseases Society of America. 2015 Infectious Diseases Society of America (IDSA) clinical practice guidelines for the diagnosis and treatment of native vertebral osteomyelitis in adults. Clin Infect Dis. 2015;61:E26-E46.
- Lam BD, Miller MM, Sutton AV, et al. Vancomycin and DRESS: a retrospective chart review of 32 cases in Los Angeles, California. J Am Acad Dermatol. 2017;77:973-975.
- Eppenberger M, Hack D, Ammann P, et al. Acute eosinophilic myocarditis with dramatic response to steroid therapy: the central role of echocardiography in diagnosis and follow-up. Tex Heart Inst J. 2013;40:326-330.
- Kirchhof MG, Wong A, Dutz JP. Cyclosporine treatment of drug-induced hypersensitivity syndrome. JAMA Dermatol. 2016;152:1254-1257.
- Singer EM, Wanat KA, Rosenbach MA. A case of recalcitrant DRESS syndrome with multiple autoimmune sequelae treated with intravenous immunoglobulins. JAMA Dermatol. 2013;149:494-495.
- Bommersbach TJ, Lapid MI, Leung JG, et al. Management of psychotropic drug-induced DRESS syndrome: a systematic review. Mayo Clin Proc. 2016;91:787-801.
- Alexander T, Iglesia E, Park Y, et al. Severe DRESS syndrome managed with therapeutic plasma exchange. Pediatrics. 2013;131:E945-E949.
- Daoulah A, Alqahtani AA, Ocheltree SR, et al. Acute myocardial infarction in a 56-year-old female patient treated with sulfasalazine. Am J Emerg Med. 2012;30:638.e1-638.e3.
- Joly P, Janela B, Tetart F, et al. Poor benefit/risk balance of intravenous immunoglobulins in DRESS. Arch Dermatol. 2012;148:543-544.
- Kano Y, Tohyama M, Aihara M, et al. Sequelae in 145 patients with drug-induced hypersensitivity syndrome/drug reaction with eosinophilia and systemic symptoms: survey conducted by the Asian Research Committee on Severe Cutaneous Adverse Reactions (ASCAR). J Dermatol. 2015;42:276-282.
- Ushigome Y, Kano Y, Ishida T, et al. Short- and long-term outcomes of 34 patients with drug-induced hypersensitivity syndrome in a single institution. J Am Acad Dermatol. 2013;68:721-728.
- Matta JM, Flores SM, Cherit JD. Drug reaction with eosinophilia and systemic symptoms (DRESS) and its relation with autoimmunity in a reference center in Mexico. An Bras Dermatol. 2017;92:30-33.
- Ahluwalia J, Abuabara K, Perman MJ, et al. Human herpesvirus 6 involvement in paediatric drug hypersensitivity syndrome. Br J Dermatol. 2015;172:1090-1095.
- Sasidharanpillai S, Sabitha S, Riyaz N, et al. Drug reaction with eosinophilia and systemic symptoms in children: a prospective study. Pediatr Dermatol. 2016;33:E162-E165.
Drug rash with eosinophilia and systemic symptoms (DRESS syndrome), also known as drug-induced hypersensitivity syndrome, is an uncommon severe systemic hypersensitivity drug reaction. It is estimated to occur in 1 in every 1000 to 10,000 drug exposures.1 It can affect patients of all ages and typically presents 2 to 6 weeks after exposure to a culprit medication. Classically, DRESS syndrome presents with often widespread rash, facial edema, systemic symptoms such as fever, lymphadenopathy, and evidence of visceral organ involvement. Peripheral blood eosinophilia is frequently but not universally observed.1,2
Even with proper management, reported DRESS syndrome mortality rates worldwide are approximately 10%2 or higher depending on the degree and type of other organ involvement (eg, cardiac).3 Beyond the acute manifestations of DRESS syndrome, this condition is unique in that some patients develop late-onset sequelae such as myocarditis or autoimmune conditions even years after the initial cutaneous eruption.4 Therefore, longitudinal evaluation is a key component of management.
The clinical myths and pearls presented here highlight some of the commonly held assumptions regarding DRESS syndrome in an effort to illuminate subtleties of managing patients with this condition (Table).
Myth: DRESS syndrome may only be diagnosed when the clinical criteria satisfy one of the established scoring systems.
Patients with DRESS syndrome can have heterogeneous manifestations. As a result, patients may develop a drug hypersensitivity with biological behavior and a natural history compatible with DRESS syndrome that does not fulfill published diagnostic criteria.5 The syndrome also may reveal its component manifestations gradually, thus delaying the diagnosis. The terms mini-DRESS and skirt syndrome have been employed to describe drug eruptions that clearly have systemic symptoms and more complex and pernicious biologic behavior than a simple drug exanthema but do not meet DRESS syndrome criteria. Ultimately, it is important to note that in clinical practice, DRESS syndrome exists on a spectrum of severity and the diagnosis remains a clinical one.
Pearl: The most commonly involved organ in DRESS syndrome is the liver.
Liver involvement is the most common visceral organ involved in DRESS syndrome and is estimated to occur in approximately 45.0% to 86.1% of cases.6,7 If a patient develops the characteristic rash, peripheral blood eosinophilia, and evidence of liver injury, DRESS syndrome must be included in the differential diagnosis.
Hepatitis presenting in DRESS syndrome can be hepatocellular, cholestatic, or mixed.6,7 Case series are varied in whether the transaminitis of DRESS syndrome tends to be more hepatocellular8 or cholestatic.7 Liver dysfunction in DRESS syndrome often lasts longer than in other severe cutaneous adverse drug reactions, and patients may improve anywhere from a few days in milder cases to months to achieve resolution of abnormalities.6,7 Severe hepatic involvement is thought to be the most notable cause of mortality.9
Pearl: New-onset proteinuria, hematuria, and sterile pyuria indicate acute interstitial nephritis that may be associated with DRESS syndrome.
Acute interstitial nephritis (AIN) is a drug-induced form of acute kidney injury that can co-occur with DRESS syndrome. Acute interstitial nephritis can present with some combination of acute kidney injury, morbilliform eruption, eosinophilia, fever, and sometimes eosinophiluria. Although AIN can be distinct from DRESS syndrome, there are cases of DRESS syndrome associated with AIN.10 In the correct clinical context, urinalysis may help by showing new-onset proteinuria, new-onset hematuria, and sterile pyuria. More common causes of acute kidney injury such as prerenal etiologies and acute tubular necrosis have a bland urinary sediment.
Myth: If the eruption is not morbilliform, then it is not DRESS syndrome.
The most common morphology of DRESS syndrome is a morbilliform eruption (Figure 1), but urticarial and atypical targetoid (erythema multiforme–like) eruptions also have been described.9 Rarely, DRESS syndrome secondary to use of allopurinol or anticonvulsants may have a pustular morphology (Figure 2), which is distinguished from acute generalized exanthematous pustulosis by its delayed onset, more severe visceral involvement, and prolonged course.11
Another reported variant demonstrates overlapping features between Stevens-Johnson syndrome/toxic epidermal necrolysis and DRESS syndrome. It may present with mucositis, atypical targetoid lesions, and vesiculobullous lesions.12 It is unclear whether this reported variant is indeed a true subtype of DRESS syndrome, as Stevens-Johnson syndrome/toxic epidermal necrolysis may present with systemic symptoms, lymphadenopathy, hepatic, renal, and pulmonary complications, among other systemic disturbances.12
Pearl: Facial edema noted during physical examination is an important clue of DRESS syndrome.
Perhaps the most helpful findings in the diagnosis of DRESS syndrome are facial edema and anasarca (Figure 3), as facial edema is not a usual finding in sepsis. Facial edema can be severe enough that the patient’s features are dramatically altered. It may be useful to ask family members if the patient’s face appears swollen or to compare the current appearance to the patient’s driver’s license photograph. An important complication to note is laryngeal edema, which may complicate airway management and may manifest as respiratory distress, stridor, and the need for emergent intubation.13
Myth: Patients who have had an allergic reaction to sulfonamide antibiotics will have a cross-reaction to nonantibiotic sulfonamides.
A common question is, if a patient has had a prior allergy to sulfonamide antibiotics, then are nonantibiotic sulfones such as a sulfonylurea, thiazide diuretic, or furosemide likely to cause a a cross-reaction? In one study (N=969), only 9.9% of patients with a prior sulfone antibiotic allergy developed hypersensitivity when exposed to a nonantibiotic sulfone, which is thought to be due to an overall increased propensity for hypersensitivity rather than a true cross-reaction. In fact, the risk for developing a hypersensitivity reaction to penicillin (14.0% [717/5115]) was higher than the risk for developing a reaction from a nonantibiotic sulfone among these patients.14 This study bolsters the argument that if there are other potential culprit medications and the time course for a patient’s nonantibiotic sulfone is not consistent with the timeline for DRESS syndrome, it may be beneficial to look for a different causative agent.
Pearl: Vancomycin is an important cause of DRESS syndrome.
Guidelines for treating endocarditis and osteomyelitis caused by methicillin-resistant Staphylococcus aureus infection recommend intravenous vancomycin for 4 to 6 weeks.15 This duration is within the relevant time frame of exposure for the development of DRESS syndrome de novo.
One case series noted that 37.5% (12/32) of DRESS syndrome cases in a 3-year period were caused by vancomycin, which notably was the most common medication associated with DRESS syndrome.16 There were caveats to this case series in that no standardized drug causality score was used and the sample size over the 3-year period was small; however, the increased use (and misuse) of antibiotics and perhaps increased recognition of rash in outpatient parenteral antibiotic therapy clinics may play a role if vancomycin-induced DRESS syndrome is indeed becoming more common.
Myth: Myocarditis secondary to DRESS syndrome will present with chest pain at the time of the cutaneous eruption.
Few patients with DRESS syndrome–associated myocarditis actually are symptomatic during their hospitalization.4 In asymptomatic patients, the primary team and consultants should be vigilant for the potential of subclinical myocarditis or the possibility of developing cardiac involvement after discharge, as myocarditis secondary to DRESS syndrome may present any time from rash onset up to 4 months later.4 Therefore, DRESS patients should be especially attentive to any new cardiac symptoms and notify their provider if any develop.
Although no standard cardiac screening guidelines exist for DRESS syndrome, some have recommended that baseline cardiac screening tests including electrocardiogram, troponin levels, and echocardiogram be considered at the time of diagnosis.5 If any testing is abnormal, DRESS syndrome–associated myocarditis should be suspected and an endomyocardial biopsy, which is the diagnostic gold standard, may be necessary.4 If the cardiac screening tests are normal, some investigators recommend serial outpatient echocardiograms for all DRESS patients, even those who remain asymptomatic.17 An alternative is an empiric approach in which a thorough review of systems is performed and testing is done if patients develop symptoms that are concerning for myocarditis.
Pearl: Steroids are not the only treatment used to control DRESS syndrome.
A prolonged taper of systemic steroids is the first-line treatment of DRESS syndrome. Steroids at the equivalent of 1 to 2 mg/kg daily (once or divided into 2 doses) of prednisone typically are used. For severe and/or recalcitrant DRESS syndrome, 2 mg/kg daily (once or divided into 2 doses) typically is used, and less than 1 mg/kg daily may be used for mini-DRESS syndrome.
Clinical improvement of DRESS syndrome has been demonstrated in several case reports with intravenous immunoglobulin, cyclosporine, cyclophosphamide, mycophenolate mofetil, and plasmapheresis.18-21 Each of these therapies typically were initiated as second-line therapeutic agents when initial treatment with steroids failed. It is important to note that large prospective studies regarding these treatments are lacking; however, there have been case reports of acute necrotizing eosinophilic myocarditis that did not respond to the combination of steroids and cyclosporine.4,22
Although there have been successful case reports using intravenous immunoglobulin, a 2012 prospective open-label clinical trial reported notable side effects in 5 of 6 (83.3%) patients with only 1 of 6 (16.6%) achieving the primary end point of control of fever/symptoms at day 7 and clinical remission without steroids on day 30.23
Pearl: DRESS patients need to be monitored for long-term sequelae such as autoimmune disease.
Several autoimmune conditions may develop as a delayed complication of DRESS syndrome, including autoimmune thyroiditis, systemic lupus erythematosus, type 1 diabetes mellitus, and autoimmune hemolytic anemia.24-26 Incidence rates of autoimmunity following DRESS syndrome range from 3% to 5% among small case series.24,25
Autoimmune thyroiditis, which may present as Graves disease, Hashimoto thyroiditis, or painless thyroiditis, is the most common autoimmune disorder to develop in DRESS patients and appears from several weeks to up to 3 years after DRESS.24 Therefore, all DRESS patients should be monitored longitudinally for several years for signs or symptoms suggestive of an autoimmune condition.5,24,26
Because no guidelines exist regarding serial monitoring for autoimmune sequelae, it may be reasonable to check thyroid function tests at the time of diagnosis and regularly for at least 2 years after diagnosis.5 Alternatively, clinicians may consider an empiric approach to laboratory testing that is guided by the development of clinical symptoms.
Pearl: Small cases series suggest differences between adult and pediatric DRESS syndrome, but there are no large studies in children.
Small case series have suggested there may be noteworthy differences between DRESS syndrome in adults and children. Although human herpesvirus 6 (HHV-6) positivity in DRESS syndrome in adults may be as high as 80%, 13% of pediatric patients in one cohort tested positive for HHV-6, though the study size was limited at 29 total patients.27 In children, DRESS syndrome secondary to antibiotics was associated with a shorter latency time as compared to cases secondary to nonantibiotics. In contrast to the typical 2- to 6-week timeline, Sasidharanpillai et al28 reported an average onset 5.8 days after drug administration in antibiotic-associated DRESS syndrome compared to 23.9 days for anticonvulsants, though this study only included 11 total patients. Other reports have suggested a similar trend.27
The role of HHV-6 positivity in pediatric DRESS syndrome and its influence on prognosis remains unclear. One study showed a worse prognosis for pediatric patients with positive HHV-6 antibodies.27 However, with such a small sample size—only 4 HHV-6–positive patients of 29 pediatric DRESS cases—larger studies are needed to better characterize the relationship between HHV-6 positivity and prognosis.
- Cacoub P, Musette P, Descamps V, et al. The DRESS syndrome: a literature review. Am J Med, 2011;124:588-597.
- Kardaun SH, Sekula P, Valeyrie-Allanore L, et al. Drug reaction with eosinophilia and systemic symptoms (DRESS): an original multisystem adverse drug reaction. results from the prospective RegiSCAR study. Br J Dermatol. 2013;169:1071-1080.
- Intarasupht J, Kanchanomai A, Leelasattakul W, et al. Prevalence, risk factors, and mortality outcome in the drug reaction with eosinophilia and systemic symptoms patients with cardiac involvement. Int J Dermatol. 2018;57:1187-1191.
- Bourgeois GP, Cafardi JA, Groysman V, et al. A review of DRESS-associated myocarditis. J Am Acad Dermatol. 2012;66:E229-E236.
- Husain Z, Reddy BY, Schwartz RA. DRESS syndrome: part I. clinical perspectives. J Am Acad Dermatol. 2013;68:693.e1-693.e14; quiz 706-708.
- Lee T, Lee YS, Yoon SY, et al. Characteristics of liver injury in drug-induced systemic hypersensitivity reactions. J Am Acad Dermatol. 2013;69:407-415.
- Lin IC, Yang HC, Strong C, et al. Liver injury in patients with DRESS: a clinical study of 72 cases. J Am Acad Dermatol. 2015;72:984-991.
- Peyrière H, Dereure O, Breton H, et al. Variability in the clinical pattern of cutaneous side-effects of drugs with systemic symptoms: does a DRESS syndrome really exist? Br J Dermatol. 2006;155:422-428.
- Walsh S, Diaz-Cano S, Higgins E, et al. Drug reaction with eosinophilia and systemic symptoms: is cutaneous phenotype a prognostic marker for outcome? a review of clinicopathological features of 27 cases. Br J Dermatol. 2013;168:391-401.
- Raghavan R, Eknoyan G. Acute interstitial nephritis—a reappraisal and update. Clin Nephrol. 2014;82:149-162.
- Matsuda H, Saito K, Takayanagi Y, et al. Pustular-type drug-induced hypersensitivity syndrome/drug reaction with eosinophilia and systemic symptoms due to carbamazepine with systemic muscle involvement. J Dermatol. 2013;40:118-122.
- Wolf R, Davidovici B, Matz H, et al. Drug rash with eosinophilia and systemic symptoms versus Stevens-Johnson Syndrome—a case that indicates a stumbling block in the current classification. Int Arch Allergy Immunol. 2006;141:308-310.
- Kumar A, Goldfarb JW, Bittner EA. A case of drug rash with eosinophilia and systemic symptoms (DRESS) syndrome complicating airway management. Can J Anaesth. 2012;59:295-298.
- Strom BL, Schinnar R, Apter AJ, et al. Absence of cross-reactivity between sulfonamide antibiotics and sulfonamide nonantibiotics. N Engl J Med. 2003;349:1628-1635.
- Berbari EF, Kanj SS, Kowalski TJ, et al; Infectious Diseases Society of America. 2015 Infectious Diseases Society of America (IDSA) clinical practice guidelines for the diagnosis and treatment of native vertebral osteomyelitis in adults. Clin Infect Dis. 2015;61:E26-E46.
- Lam BD, Miller MM, Sutton AV, et al. Vancomycin and DRESS: a retrospective chart review of 32 cases in Los Angeles, California. J Am Acad Dermatol. 2017;77:973-975.
- Eppenberger M, Hack D, Ammann P, et al. Acute eosinophilic myocarditis with dramatic response to steroid therapy: the central role of echocardiography in diagnosis and follow-up. Tex Heart Inst J. 2013;40:326-330.
- Kirchhof MG, Wong A, Dutz JP. Cyclosporine treatment of drug-induced hypersensitivity syndrome. JAMA Dermatol. 2016;152:1254-1257.
- Singer EM, Wanat KA, Rosenbach MA. A case of recalcitrant DRESS syndrome with multiple autoimmune sequelae treated with intravenous immunoglobulins. JAMA Dermatol. 2013;149:494-495.
- Bommersbach TJ, Lapid MI, Leung JG, et al. Management of psychotropic drug-induced DRESS syndrome: a systematic review. Mayo Clin Proc. 2016;91:787-801.
- Alexander T, Iglesia E, Park Y, et al. Severe DRESS syndrome managed with therapeutic plasma exchange. Pediatrics. 2013;131:E945-E949.
- Daoulah A, Alqahtani AA, Ocheltree SR, et al. Acute myocardial infarction in a 56-year-old female patient treated with sulfasalazine. Am J Emerg Med. 2012;30:638.e1-638.e3.
- Joly P, Janela B, Tetart F, et al. Poor benefit/risk balance of intravenous immunoglobulins in DRESS. Arch Dermatol. 2012;148:543-544.
- Kano Y, Tohyama M, Aihara M, et al. Sequelae in 145 patients with drug-induced hypersensitivity syndrome/drug reaction with eosinophilia and systemic symptoms: survey conducted by the Asian Research Committee on Severe Cutaneous Adverse Reactions (ASCAR). J Dermatol. 2015;42:276-282.
- Ushigome Y, Kano Y, Ishida T, et al. Short- and long-term outcomes of 34 patients with drug-induced hypersensitivity syndrome in a single institution. J Am Acad Dermatol. 2013;68:721-728.
- Matta JM, Flores SM, Cherit JD. Drug reaction with eosinophilia and systemic symptoms (DRESS) and its relation with autoimmunity in a reference center in Mexico. An Bras Dermatol. 2017;92:30-33.
- Ahluwalia J, Abuabara K, Perman MJ, et al. Human herpesvirus 6 involvement in paediatric drug hypersensitivity syndrome. Br J Dermatol. 2015;172:1090-1095.
- Sasidharanpillai S, Sabitha S, Riyaz N, et al. Drug reaction with eosinophilia and systemic symptoms in children: a prospective study. Pediatr Dermatol. 2016;33:E162-E165.
Practice Points
- Drug rash with eosinophilia and systemic symptoms (DRESS syndrome) is a clinical diagnosis, and incomplete forms may not meet formal criteria-based diagnosis.
- Although DRESS syndrome typically has a morbilliform eruption, different rash morphologies may be observed.
- The myocarditis of DRESS syndrome may not present with chest pain; a high index of suspicion is warranted.
- Autoimmune sequelae are more frequent in patients who have had an episode of DRESS syndrome.
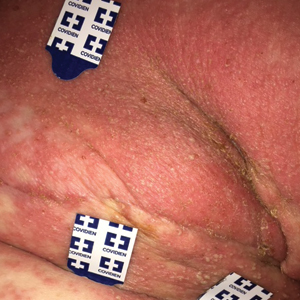
2018 Update on minimally invasive gynecologic surgery
Uterine fibroids are the most common solid pelvic tumor in women and a leading indication for hysterectomy in the United States.1 As a result, they represent significant morbidity for many women and are a major public health problem. By age 50, 70% of white women and 80% of black women have fibroids.2
Although fibroids are sometimes asymptomatic, the symptoms most commonly reported are abnormal uterine bleeding (AUB) with resultant anemia and bulk/pressure symptoms. Uterine fibroids also are associated with reproductive dysfunction, such as recurrent pregnancy loss, and even infertility.3
The clinical diagnosis of uterine fibroids is made based on a combination of physical examination and imaging studies, including pelvic ultrasonography, saline infusion sonography, and magnetic resonance imaging (MRI). When medical management, such as combination oral contraceptive pills, fails in patients with AUB and/or bulk predominant symptoms or patients present with compromised fertility, the only option for conservative surgical management is a myomectomy.4
The route of myomectomy—hysteroscopy, laparotomy, conventional laparoscopic myomectomy (LM), or robot-assisted laparoscopic myomectomy (RALM)—depends on the size, number, location, and consistency of the uterine fibroids and, to a certain extent, the indication for the myomectomy. In some cases, multiple routes must be used to achieve optimal results, and sometimes these procedures have to be staged. In this literature review and technical summary, we focus on conventional LM and RALM approaches.
Literature review: In the right hands, LM and RALM have clear benefits
In the past, laparotomy was the surgical route of choice for fibroid removal. This surgery was associated with a long hospital stay, a high rate of blood transfusions, postoperative pain, and a lengthy recovery period. As minimally invasive surgery gained popularity, conventional LM became more commonly performed and was accepted by many as the gold standard approach for myomectomy.5
LM has considerable advantages over laparotomy
Compared with the traditional, more invasive route, the conventional LM approach has many benefits. These include less blood loss, decreased postoperative pain, shorter recovery time, shorter hospitalization stay, and decreased perioperative complications.6 LM should be considered the first-line approach unless the size of an intramural myoma exceeds 10 to 12 cm or multiple myomas (consensus, approximately 4 or more) are present and necessitate several incisions according to their varying locations within the uterus.7,8 While this is a recommendation, reports have been published on the successful laparoscopic approach to myomas larger than 20 cm, demonstrating that a skilled, experienced surgeon can perform this procedure safely.9-11
Many studies comparing LM with the abdominal approach showed that LM is associated with decreased blood loss, less postoperative pain, shorter hospital stay, and quicker recovery.12-14 Unfortunately, myomectomy via conventional laparoscopy can be technically challenging, thereby limiting patient accessibility to this approach. Major challenges with conventional LM include enucleation of the fibroid along the correct plane and a multilayered hysterotomy closure.15 The obvious concern with the latter is the potential risk for uterine rupture when improperly performed as a result of deficient suturing skills. Accordingly, several cases of uterine rupture in the second and third trimester of pregnancy after LM led to recommendations for stricter selection criteria, which excluded patients with fibroids larger than 5 cm, multiple fibroids, and deep intramural fibroids.16
Continue to: The RALM approach
The RALM approach
RALM was developed as a surgical alternative and to help overcome conventional laparoscopy challenges, such as suturing, as well as to offer minimally invasive options to a broader patient pool. In 2004, Advincula and colleagues reported the first case series of 35 women who underwent RALM.17 Since that report was published, multiple retrospective studies have confirmed RALM’s safety, feasibility, and efficacy.
How RALM stacks up against laparotomy. Compared with traditional abdominal myomectomy (AM), RALM has been associated with less blood loss, shorter hospital stay, quicker recovery time, fewer complications, and higher costs.18 In a comparative analysis of surgical outcomes and costs of RALM versus AM, Nash and colleagues found that RALM patients required less intravenous narcotics, had shorter hospital stays, and had equivalent clinical outcomes compared with AM-treated patients.19 In addition, the authors observed a correlation between increased specimen size and decreased operative efficiency with RALM. Retrospective cohort studies by Mansour and colleagues and Sangha and colleagues echoed similar conclusions.20,21
RALM versus conventional LM. The comparisons between conventional LM and RALM are not as clear-cut, and although evidence strongly suggests a role for RALM, more comparative studies are needed.
In 2013, Pundir and colleagues completed a meta-analysis and systematic review comparing RALM with AM and LM.22 They reviewed 10 observational studies; 7 compared RALM with AM, 4 compared RALM with LM, and 1 study compared RALM with AM and LM (this was included in both groups). In the comparison between RALM and AM, estimated blood loss, blood transfusion, and length of hospital stay were significantly lower with RALM, risk of complication was similar, and operating time and costs were significantly higher. The cost findings were not too dissimilar to conclusions drawn by Advincula and colleagues in an earlier study.18
Further, when Pundir and colleagues compared RALM with LM, blood transfusion risk and costs were higher with RALM, but no significant differences were noted in estimated blood loss, operating time, length of hospital stay, and complications.22 In this analysis, RALM showed significant short-term benefits when compared with AM but no benefit when compared with LM.
Continue to: Benefits after RALM over time
Benefits after RALM over time
Long-term benefits from RALM, such as symptom recurrence rates and fertility outcomes, have been demonstrated. In 2015, Pitter and colleagues published the first paper on symptom recurrence after RALM.23 In this retrospective survey, 426 women underwent RALM for symptom relief or infertility across 3 practice sites; 62.9% reported being symptom free after 3 years. In addition, 80% of symptom-free women who had undergone RALM to improve fertility outcomes conceived after 3 years. The mean (SD) time to pregnancy was 7.9 (9.4) months. Overall, pregnancy rates improved and symptom recurrence increased with the interval of time since surgery.23
In another study, Pitter and colleagues reported on pregnancy outcomes in greater detail.24 They evaluated 872 women who underwent RALM between October 2005 and November 2010 at 3 centers. Of these women, 107 conceived, resulting in 127 pregnancies and 92 deliveries through 2011. The means (SD) for age at myomectomy, number of myomas removed, and myoma size were 34.8 (4.5) years, 3.9 (3.2), and 7.5 (3.0) cm (weight, 191.7 [144.8] g), respectively. Overall, the pregnancy outcomes in this study were comparable to those reported in the literature for conventional LM.
Cela and colleagues reported similar outcomes based on their review of 48 patients who underwent RALM between 2007 and 2011.25 Seven women became pregnant (8 pregnancies). There were no spontaneous abortions or uterine ruptures. Following suit, Kang and colleagues reported outcomes in 100 women who underwent RALM for deep intramural fibroids (FIGO type 2 to 5).26 The average (SD) number of fibroids was 3.8 (3.5) with a mean (SD) size of 7.5 (2.1) cm. All patients recovered without major complications, and 75% of those pursuing pregnancy conceived.
The importance of LM and RALM
After this brief review of the data on conventional LM and RALM, it is fair to conclude that both surgical options are a game changer for the minimally invasive management of uterine fibroids. Despite strong evidence that suggests laparoscopy is superior to laparotomy for myomectomy, the technical demands required for performing conventional LM may explain why it is underutilized and why the advantages of robotic surgery—with its 3-dimensional imaging and articulated instruments—make this approach an attractive alternative.
The myomectomy technique we prefer at our institution
At our medical center, we approach the majority of abdominal myomectomies via conventional LM or RALM. We carefully select candidates with the goal of ensuring a successful procedure and minimizing the risk of conversion. When selecting candidates, we consider these factors:
- size, number, location, and consistency of the fibroids
- patient’s body habitus, and
- relative size of the uterus to the length of the patient’s torso.
Additionally, any concerns raised during the preoperative workup regarding a suspected risk of occult leiomyosarcoma preclude a minimally invasive approach. Otherwise, deciding between
conventional LM and RALM is based on surgeon preference.
View these surgical techniques on the multimedia channel
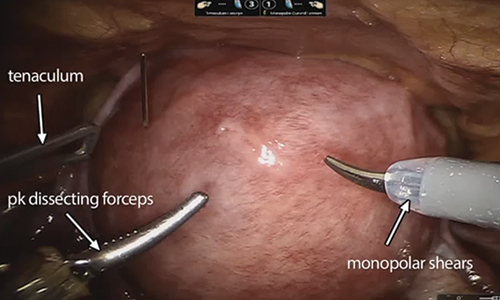
Robot-assisted laparoscopic myomectomy
Arnold P. Advincula, MD, Victoria M. Fratto, MD, and Caroline Key
A systematic approach to surgery in a 39-year-old woman with heavy menstrual bleeding who desires future fertility. Features include robot-specific techniques that facilitate fibroid enucleation and hysterotomy repair and demonstration of the ExCITE technique for tissue extraction.
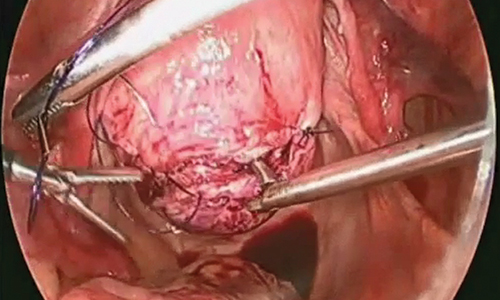
Laparoscopic myomectomy technique
William H. Parker, MD
A step-by-step demonstration of the laparoscopic myomectomy technique used to resect a 7-cm posterior fibroid in a 44-year-old woman.
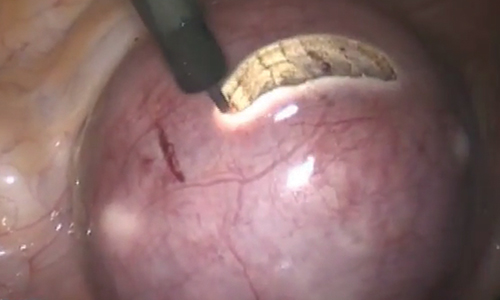
Laparoscopic myomectomy with enclosed transvaginal tissue extraction
Ceana Nezhat, MD, and Erica Dun, MD, MPH
A surgical case of a 41-yearold woman with radiating lower abdominal pain and menorrhagia who desired removal of symptomatic myomas. Preoperative transvaginal ultrasonography revealed a 4-cm posterior pedunculated myoma and a 5-cm fundal intramural myoma.
Continue to: Preoperative MRI guides surgical approach
Preoperative MRI guides surgical approach
An MRI scan is a critical component of the patient’s preoperative evaluation. It helps to define the uterine architecture as it relates to fibroids and to rule out the presence of adenomyosis. In general, we do not offer RALM to patients who have more than 15 myomas, a single myoma that is larger than 12 to 15 cm, or when the uterus is more than 2 fingerbreadths above the umbilicus (unless the patient’s torso allows for an adequate insufflated workspace). We also try to avoid preoperative treatment with a gonadotropin–releasing hormone agonist to minimize softening of the myoma and blurring of the dissection planes.
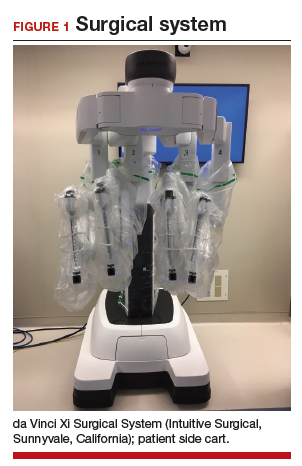
Steps in the procedure
Once the patient is intubated, properly positioned, prepped, and draped, we turn our attention toward peritoneal entry. Factors that influence entry include the patient’s surgical history, radiologic imaging, physical examination (particularly the exam under anesthesia), and surgeon preference for optimizing access. Quite often we use a left upper quadrant entry via Palmer’s point, with subsequent port placement individualized to the patient’s pathology and abdominal topography. Three or more incisions are required to accommodate the camera and at least 2 to 3 operative instruments. Port sizes vary from 5 to 12 mm depending on the desired equipment and surgeon preference (conventional LM versus RALM [FIGURE 1]).
A uterine manipulator is a crucial tool used when performing LM.27 This instrument enables elevation of the uterus to allow for adequate visualization of the targeted myomas, traction-countertraction during enucleation, and strategic positioning during hysterotomy repair. We also use a bedside-mounted electric uterine positioning system that provides static orientation of the uterus by interfacing with the uterine manipulator, thereby obviating the need for a bedside assistant to provide that service (FIGURE 2).
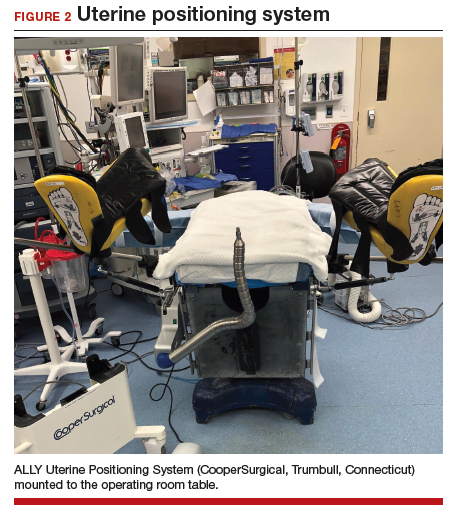
To minimize blood loss during the course of the myomectomy, we inject a dilute concentration of vasopressin (20 U in 50 mL of saline) via a 7-inch, 22-gauge spinal needle into the myometrium surrounding the targeted myomas (FIGURE 3). Additional methods for mitigating blood loss include the use of vascular clamps, clips, or ties (both permanent and temporary) on the bilateral uterine arteries; intravaginal prostaglandins; intravenous tranexamic acid; gelatin-thrombin matrices; and cell salvage systems.28
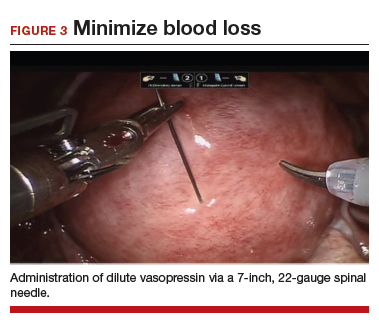
Once we observe adequate myometrial blanching from the vasopressin administration, we make a strategic hysterotomy incision (preferably transverse) to allow the surgeon to more ergonomically close the defect. We then identify the pseudocapsule so that the surgeon can circumferentially enucleate the myoma and dissect it from its fibrous attachments to the surrounding myometrium.
Continue to: The energy devices used to perform the hysterotomy...
The energy devices used to perform the hysterotomy and enucleation are selected largely based on surgeon preference, but various instruments can be used to accomplish these steps, including an ultrasonically activated scalpel or such electrosurgical instruments as monopolar scissors or hooks.
A reliable tenaculum is critical to the success of any enucleation, whether the approach is conventional LM or RALM, in order to provide adequate traction on the myoma (FIGURE 4). We try to minimize the number of hysterotomy incisions not only to reduce further blood loss, as the majority of bleeding ensues from the surrounding myometrium, but also to minimize compromise of myometrial integrity. Additionally, we take care to avoid entry into the endometrial cavity.
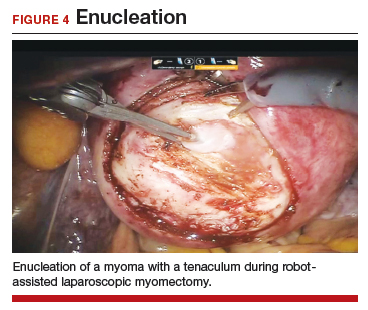
As we enucleate a myoma, we place it in either the anterior or posterior cul de sac. Most important, if we enucleate multiple myomas, we keep careful track of their number. We string the myomas together with suture until we extract them to ensure this.
While hysterotomy closure can be performed with either barbed or nonbarbed sutures in a single- or a multi-layered fashion, we prefer to use a barbed suture.29,30 Just as enucleation requires appropriate instruments, suturing requires proper needle drivers (FIGURE 5). We advise judicious use of energy to minimize thermal effects and maintain the viability of the surrounding myometrium. Once we have sutured the myometrium closed, we place an adhesion barrier.
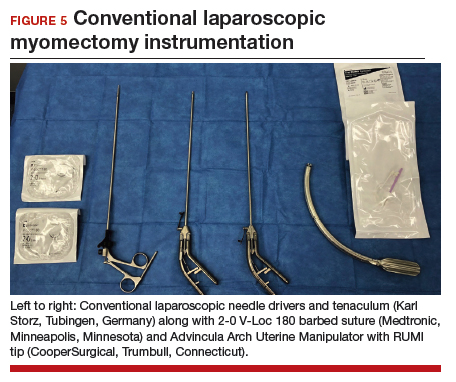
Although discussion of tissue extraction is beyond the scope of this Update, any surgeon embarking on either conventional LM or RALM must have a strategy for safe contained tissue extraction given the recent concerns over uncontained power morcellation.31,32
Surgical skill and careful patient selection are key to optimal outcomes
Patients seeking conservative surgical management of their uterine fibroids should be considered candidates for either a conventional LM or RALM. Both the scientific literature and technologic advances make these approaches viable options, especially when the surgeon’s skill is appropriate and the patient’s candidacy is adequately vetted. A well thought out surgical strategy from start to finish will ensure the chances for successful completion and optimized outcomes.
Share your thoughts! Send your Letter to the Editor to [email protected]. Please include your name and the city and state in which you practice.
- Matchar DB, Myers ER, Barber MW, et al. Management of uterine fibroids: summary. AHRQ Evidence Report Summaries. Rockville, MD; Agency for Healthcare Research and Quality; 2001. AHRQ Publication No. 01-E051.
- Baird DD, Dunson DB, Hill MC, et al. High cumulative incidence of uterine leiomyoma in black and white women: ultrasound evidence. Am J Obstet Gynecol. 2003;188:100-107.
- Stewart EA. Uterine fibroids. Lancet. 2001;357:293-298.
- Nash K, Feinglass J, Zei C, et al. Robotic-assisted laparoscopic myomectomy versus abdominal myomectomy: a comparative analysis of surgical outcomes and costs. Arch Gynecol Obstet. 2012;285:435-440.
- Herrmann A, De Wilde RL. Laparoscopic myomectomy—the gold standard. Gynecol Minim Invasive Ther. 2014;3:31-38.
- Stoica RA, Bistriceanu I, Sima R, et al. Laparoscopic myomectomy. J Med Life. 2014;7:522-524.
- Donnez J, Dolmans MM. Uterine fibroid management: from the present to the future. Hum Reprod Update. 2016;22:665-686.
- Holub Z. Laparoscopic myomectomy: indications and limits. Ceska Gynekol. 2007;72:64-68.
- Sinha R, Hegde A, Mahajan C, et al. Laparoscopic myomectomy: do size, number, and location of the myomas form limiting factors for laparoscopic myomectomy? J Minim Invasive Gynecol. 2008;15:292-300.
- Aksoy H, Aydin T, Ozdamar O, et al. Successful use of laparoscopic myomectomy to remove a giant uterine myoma: a case report. J Med Case Rep. 2015;9:286.
- Damiani A, Melgrati L, Marziali M, et al. Laparoscopic myomectomy for very large myomas using an isobaric (gasless) technique. JSLS. 2005;9:434-438.
- Holzer A, Jirecek ST, Illievich UM, et al. Laparoscopic versus open myomectomy: a double-blind study to evaluate postoperative pain. Anesth Analg. 2006;102:1480-1484.
- Mais V, Ajossa S, Guerriero S, et al. Laparoscopic versus abdominal myomectomy: a prospective, randomized trial to evaluate benefits in early outcome. Am J Obstet Gynecol. 1996;174:654-658.
- Jin C, Hu Y, Chen XC, et al. Laparoscopic versus open myomectomy—a meta-analysis of randomized controlled trials. Eur J Obstet Gynecol Reprod Biol. 2009;145:14-21.
- Pluchino N, Litta P, Freschi L, et al. Comparison of the initial surgical experience with robotic and laparoscopic myomectomy. Int J Med Robot. 2014;10:208-212.
- Parker WH, Iacampo K, Long T. Uterine rupture after laparoscopic removal of a pedunculated myoma. J Minim Invasive Gynecol. 2007;14:362-364.
- Advincula AP, Song A, Burke W, et al. Preliminary experience with robot-assisted laparoscopic myomectomy. J Am Assoc Gynecol Laparosc. 2004;11:511-518.
- Advincula AP, Xu X, Goudeau S 4th, et al. Robot-assisted laparoscopic myomectomy versus abdominal myomectomy: a comparison of short-term surgical outcomes and immediate costs. J Minim Invasive Gynecol. 2007;14:698-705.
- Nash K, Feinglass J, Zei C, et al. Robotic-assisted laparoscopic myomectomy versus abdominal myomectomy: a comparative analysis of surgical outcomes and costs. Arch Gynecol Obstet. 2012;285:435-440.
- Mansour FW, Kives S, Urbach DR, et al. Robotically assisted laparoscopic myomectomy: a Canadian experience. J Obstet Gynaecol Canada. 2012;34:353-358.
- Sangha R, Eisenstein D, George A, et al. Comparison of surgical outcomes for robotic assisted laparoscopic myomectomy compared to abdominal myomectomy (abstract 373). J Minim Invasive Gynecol. 2010;17(suppl):S90-S108.
- Pundir J, Pundir V, Walavalkar R, et al. Robotic-assisted laparoscopic vs abdominal and laparoscopic myomectomy: systematic review and meta-analysis. J Minim Invasive Gynecol. 2013; 20:335–345.
- Pitter MC, Srouji SS, Gargiulo AR, et al. Fertility and symptom relief following robot-assisted laparoscopic myomectomy. Obstet Gynecol Int. 2015. doi:10.1155/2015/967568.
- Pitter MC, Gargiulo AR, Bonaventura LM, et al. Pregnancy outcomes following robot-assisted myomectomy. Hum Reprod. 2013; 28:99-108.
- Cela V, Freschi L, Simi G, et al. Fertility and endocrine outcome after robot-assisted laparoscopic myomectomy (RALM). Gynecol Endocrinol. 2013;29:79-82.
- Kang SY, Jeung IC, Chung YJ, et al. Robot-assisted laparoscopic myomectomy for deep intramural myomas. Int J Med Robot. 2017;13. doi:10.1002/rcs.1742.
- van den Haak L, Alleblas C, Nieboer TE, et al. Efficacy and safety of uterine manipulators in laparoscopic surgery: a review. Arch Gynecol Obstet. 2015;292:1003-1011.
- Hickman LC, Kotlyar A, Shue S, et al. Hemostatic techniques for myomectomy: an evidence-based approach. J Minim Invasive Gynecol. 2016;23:497-504.
- Tulandi T, Einarsson JI. The use of barbed suture for laparoscopic hysterectomy and myomectomy: a systematic review and meta-analysis. J Minim Invasive Gynecol. 2014;21:210-216.
- Alessandri F, Remorgida V, Venturini PL, et al. Unidirectional barbed suture versus continuous suture with intracorporeal knots in laparoscopic myomectomy: a randomized study. J Minim Invasive Gynecol. 2010;17:725-729.
- AAGL Advancing Minimally Invasive Gynecology Worldwide. AAGL practice report: morcellation during uterine tissue extraction. J Minim Invasive Gynecol. 2014;21:517-530.
- Meurs EA, Brito LG, Ajao MO, et al. Comparison of morcellation techniques at the time of laparoscopic hysterectomy and myomectomy. J Minim Invasive Gynecol. 2017;24:843-849.

Dr. Arora is Minimally Invasive Gynecologic Surgery Fellow, Division of Gynecologic Specialty Surgery, Department of Obstetrics and Gynecology, Columbia University Medical Center/New York–Presbyterian Hospital, New York, New York.

Dr. Advincula is Levine Family Professor of Women’s Health, Vice-Chair, Department of Obstetrics & Gynecology, Chief of Gynecologic Specialty Surgery, Sloane Hospital for Women; Medical Director, Mary and Michael Jaharis Simulation Center, Columbia University Medical Center/New York–Presbyterian Hospital.
Dr. Advincula reports serving as a consultant to AbbVie, Applied Medical, ConMed, CooperSurgical, Intuitive Surgical, and Titan Medical and receiving royalties from CooperSurgical. Dr. Arora reports receiving research support from Applied Medical, CooperSurgical, and Medtronic.
Dr. Arora is Minimally Invasive Gynecologic Surgery Fellow, Division of Gynecologic Specialty Surgery, Department of Obstetrics and Gynecology, Columbia University Medical Center/New York–Presbyterian Hospital, New York, New York.
Dr. Advincula is Levine Family Professor of Women’s Health, Vice-Chair, Department of Obstetrics & Gynecology, Chief of Gynecologic Specialty Surgery, Sloane Hospital for Women; Medical Director, Mary and Michael Jaharis Simulation Center, Columbia University Medical Center/New York–Presbyterian Hospital.
Dr. Advincula reports serving as a consultant to AbbVie, Applied Medical, ConMed, CooperSurgical, Intuitive Surgical, and Titan Medical and receiving royalties from CooperSurgical. Dr. Arora reports receiving research support from Applied Medical, CooperSurgical, and Medtronic.
Uterine fibroids are the most common solid pelvic tumor in women and a leading indication for hysterectomy in the United States.1 As a result, they represent significant morbidity for many women and are a major public health problem. By age 50, 70% of white women and 80% of black women have fibroids.2
Although fibroids are sometimes asymptomatic, the symptoms most commonly reported are abnormal uterine bleeding (AUB) with resultant anemia and bulk/pressure symptoms. Uterine fibroids also are associated with reproductive dysfunction, such as recurrent pregnancy loss, and even infertility.3
The clinical diagnosis of uterine fibroids is made based on a combination of physical examination and imaging studies, including pelvic ultrasonography, saline infusion sonography, and magnetic resonance imaging (MRI). When medical management, such as combination oral contraceptive pills, fails in patients with AUB and/or bulk predominant symptoms or patients present with compromised fertility, the only option for conservative surgical management is a myomectomy.4
The route of myomectomy—hysteroscopy, laparotomy, conventional laparoscopic myomectomy (LM), or robot-assisted laparoscopic myomectomy (RALM)—depends on the size, number, location, and consistency of the uterine fibroids and, to a certain extent, the indication for the myomectomy. In some cases, multiple routes must be used to achieve optimal results, and sometimes these procedures have to be staged. In this literature review and technical summary, we focus on conventional LM and RALM approaches.
Literature review: In the right hands, LM and RALM have clear benefits
In the past, laparotomy was the surgical route of choice for fibroid removal. This surgery was associated with a long hospital stay, a high rate of blood transfusions, postoperative pain, and a lengthy recovery period. As minimally invasive surgery gained popularity, conventional LM became more commonly performed and was accepted by many as the gold standard approach for myomectomy.5
LM has considerable advantages over laparotomy
Compared with the traditional, more invasive route, the conventional LM approach has many benefits. These include less blood loss, decreased postoperative pain, shorter recovery time, shorter hospitalization stay, and decreased perioperative complications.6 LM should be considered the first-line approach unless the size of an intramural myoma exceeds 10 to 12 cm or multiple myomas (consensus, approximately 4 or more) are present and necessitate several incisions according to their varying locations within the uterus.7,8 While this is a recommendation, reports have been published on the successful laparoscopic approach to myomas larger than 20 cm, demonstrating that a skilled, experienced surgeon can perform this procedure safely.9-11
Many studies comparing LM with the abdominal approach showed that LM is associated with decreased blood loss, less postoperative pain, shorter hospital stay, and quicker recovery.12-14 Unfortunately, myomectomy via conventional laparoscopy can be technically challenging, thereby limiting patient accessibility to this approach. Major challenges with conventional LM include enucleation of the fibroid along the correct plane and a multilayered hysterotomy closure.15 The obvious concern with the latter is the potential risk for uterine rupture when improperly performed as a result of deficient suturing skills. Accordingly, several cases of uterine rupture in the second and third trimester of pregnancy after LM led to recommendations for stricter selection criteria, which excluded patients with fibroids larger than 5 cm, multiple fibroids, and deep intramural fibroids.16
Continue to: The RALM approach
The RALM approach
RALM was developed as a surgical alternative and to help overcome conventional laparoscopy challenges, such as suturing, as well as to offer minimally invasive options to a broader patient pool. In 2004, Advincula and colleagues reported the first case series of 35 women who underwent RALM.17 Since that report was published, multiple retrospective studies have confirmed RALM’s safety, feasibility, and efficacy.
How RALM stacks up against laparotomy. Compared with traditional abdominal myomectomy (AM), RALM has been associated with less blood loss, shorter hospital stay, quicker recovery time, fewer complications, and higher costs.18 In a comparative analysis of surgical outcomes and costs of RALM versus AM, Nash and colleagues found that RALM patients required less intravenous narcotics, had shorter hospital stays, and had equivalent clinical outcomes compared with AM-treated patients.19 In addition, the authors observed a correlation between increased specimen size and decreased operative efficiency with RALM. Retrospective cohort studies by Mansour and colleagues and Sangha and colleagues echoed similar conclusions.20,21
RALM versus conventional LM. The comparisons between conventional LM and RALM are not as clear-cut, and although evidence strongly suggests a role for RALM, more comparative studies are needed.
In 2013, Pundir and colleagues completed a meta-analysis and systematic review comparing RALM with AM and LM.22 They reviewed 10 observational studies; 7 compared RALM with AM, 4 compared RALM with LM, and 1 study compared RALM with AM and LM (this was included in both groups). In the comparison between RALM and AM, estimated blood loss, blood transfusion, and length of hospital stay were significantly lower with RALM, risk of complication was similar, and operating time and costs were significantly higher. The cost findings were not too dissimilar to conclusions drawn by Advincula and colleagues in an earlier study.18
Further, when Pundir and colleagues compared RALM with LM, blood transfusion risk and costs were higher with RALM, but no significant differences were noted in estimated blood loss, operating time, length of hospital stay, and complications.22 In this analysis, RALM showed significant short-term benefits when compared with AM but no benefit when compared with LM.
Continue to: Benefits after RALM over time
Benefits after RALM over time
Long-term benefits from RALM, such as symptom recurrence rates and fertility outcomes, have been demonstrated. In 2015, Pitter and colleagues published the first paper on symptom recurrence after RALM.23 In this retrospective survey, 426 women underwent RALM for symptom relief or infertility across 3 practice sites; 62.9% reported being symptom free after 3 years. In addition, 80% of symptom-free women who had undergone RALM to improve fertility outcomes conceived after 3 years. The mean (SD) time to pregnancy was 7.9 (9.4) months. Overall, pregnancy rates improved and symptom recurrence increased with the interval of time since surgery.23
In another study, Pitter and colleagues reported on pregnancy outcomes in greater detail.24 They evaluated 872 women who underwent RALM between October 2005 and November 2010 at 3 centers. Of these women, 107 conceived, resulting in 127 pregnancies and 92 deliveries through 2011. The means (SD) for age at myomectomy, number of myomas removed, and myoma size were 34.8 (4.5) years, 3.9 (3.2), and 7.5 (3.0) cm (weight, 191.7 [144.8] g), respectively. Overall, the pregnancy outcomes in this study were comparable to those reported in the literature for conventional LM.
Cela and colleagues reported similar outcomes based on their review of 48 patients who underwent RALM between 2007 and 2011.25 Seven women became pregnant (8 pregnancies). There were no spontaneous abortions or uterine ruptures. Following suit, Kang and colleagues reported outcomes in 100 women who underwent RALM for deep intramural fibroids (FIGO type 2 to 5).26 The average (SD) number of fibroids was 3.8 (3.5) with a mean (SD) size of 7.5 (2.1) cm. All patients recovered without major complications, and 75% of those pursuing pregnancy conceived.
The importance of LM and RALM
After this brief review of the data on conventional LM and RALM, it is fair to conclude that both surgical options are a game changer for the minimally invasive management of uterine fibroids. Despite strong evidence that suggests laparoscopy is superior to laparotomy for myomectomy, the technical demands required for performing conventional LM may explain why it is underutilized and why the advantages of robotic surgery—with its 3-dimensional imaging and articulated instruments—make this approach an attractive alternative.
The myomectomy technique we prefer at our institution
At our medical center, we approach the majority of abdominal myomectomies via conventional LM or RALM. We carefully select candidates with the goal of ensuring a successful procedure and minimizing the risk of conversion. When selecting candidates, we consider these factors:
- size, number, location, and consistency of the fibroids
- patient’s body habitus, and
- relative size of the uterus to the length of the patient’s torso.
Additionally, any concerns raised during the preoperative workup regarding a suspected risk of occult leiomyosarcoma preclude a minimally invasive approach. Otherwise, deciding between
conventional LM and RALM is based on surgeon preference.
View these surgical techniques on the multimedia channel
Robot-assisted laparoscopic myomectomy
Arnold P. Advincula, MD, Victoria M. Fratto, MD, and Caroline Key
A systematic approach to surgery in a 39-year-old woman with heavy menstrual bleeding who desires future fertility. Features include robot-specific techniques that facilitate fibroid enucleation and hysterotomy repair and demonstration of the ExCITE technique for tissue extraction.
Laparoscopic myomectomy technique
William H. Parker, MD
A step-by-step demonstration of the laparoscopic myomectomy technique used to resect a 7-cm posterior fibroid in a 44-year-old woman.
Laparoscopic myomectomy with enclosed transvaginal tissue extraction
Ceana Nezhat, MD, and Erica Dun, MD, MPH
A surgical case of a 41-yearold woman with radiating lower abdominal pain and menorrhagia who desired removal of symptomatic myomas. Preoperative transvaginal ultrasonography revealed a 4-cm posterior pedunculated myoma and a 5-cm fundal intramural myoma.
Continue to: Preoperative MRI guides surgical approach
Preoperative MRI guides surgical approach
An MRI scan is a critical component of the patient’s preoperative evaluation. It helps to define the uterine architecture as it relates to fibroids and to rule out the presence of adenomyosis. In general, we do not offer RALM to patients who have more than 15 myomas, a single myoma that is larger than 12 to 15 cm, or when the uterus is more than 2 fingerbreadths above the umbilicus (unless the patient’s torso allows for an adequate insufflated workspace). We also try to avoid preoperative treatment with a gonadotropin–releasing hormone agonist to minimize softening of the myoma and blurring of the dissection planes.
Steps in the procedure
Once the patient is intubated, properly positioned, prepped, and draped, we turn our attention toward peritoneal entry. Factors that influence entry include the patient’s surgical history, radiologic imaging, physical examination (particularly the exam under anesthesia), and surgeon preference for optimizing access. Quite often we use a left upper quadrant entry via Palmer’s point, with subsequent port placement individualized to the patient’s pathology and abdominal topography. Three or more incisions are required to accommodate the camera and at least 2 to 3 operative instruments. Port sizes vary from 5 to 12 mm depending on the desired equipment and surgeon preference (conventional LM versus RALM [FIGURE 1]).
A uterine manipulator is a crucial tool used when performing LM.27 This instrument enables elevation of the uterus to allow for adequate visualization of the targeted myomas, traction-countertraction during enucleation, and strategic positioning during hysterotomy repair. We also use a bedside-mounted electric uterine positioning system that provides static orientation of the uterus by interfacing with the uterine manipulator, thereby obviating the need for a bedside assistant to provide that service (FIGURE 2).
To minimize blood loss during the course of the myomectomy, we inject a dilute concentration of vasopressin (20 U in 50 mL of saline) via a 7-inch, 22-gauge spinal needle into the myometrium surrounding the targeted myomas (FIGURE 3). Additional methods for mitigating blood loss include the use of vascular clamps, clips, or ties (both permanent and temporary) on the bilateral uterine arteries; intravaginal prostaglandins; intravenous tranexamic acid; gelatin-thrombin matrices; and cell salvage systems.28
Once we observe adequate myometrial blanching from the vasopressin administration, we make a strategic hysterotomy incision (preferably transverse) to allow the surgeon to more ergonomically close the defect. We then identify the pseudocapsule so that the surgeon can circumferentially enucleate the myoma and dissect it from its fibrous attachments to the surrounding myometrium.
Continue to: The energy devices used to perform the hysterotomy...
The energy devices used to perform the hysterotomy and enucleation are selected largely based on surgeon preference, but various instruments can be used to accomplish these steps, including an ultrasonically activated scalpel or such electrosurgical instruments as monopolar scissors or hooks.
A reliable tenaculum is critical to the success of any enucleation, whether the approach is conventional LM or RALM, in order to provide adequate traction on the myoma (FIGURE 4). We try to minimize the number of hysterotomy incisions not only to reduce further blood loss, as the majority of bleeding ensues from the surrounding myometrium, but also to minimize compromise of myometrial integrity. Additionally, we take care to avoid entry into the endometrial cavity.
As we enucleate a myoma, we place it in either the anterior or posterior cul de sac. Most important, if we enucleate multiple myomas, we keep careful track of their number. We string the myomas together with suture until we extract them to ensure this.
While hysterotomy closure can be performed with either barbed or nonbarbed sutures in a single- or a multi-layered fashion, we prefer to use a barbed suture.29,30 Just as enucleation requires appropriate instruments, suturing requires proper needle drivers (FIGURE 5). We advise judicious use of energy to minimize thermal effects and maintain the viability of the surrounding myometrium. Once we have sutured the myometrium closed, we place an adhesion barrier.
Although discussion of tissue extraction is beyond the scope of this Update, any surgeon embarking on either conventional LM or RALM must have a strategy for safe contained tissue extraction given the recent concerns over uncontained power morcellation.31,32
Surgical skill and careful patient selection are key to optimal outcomes
Patients seeking conservative surgical management of their uterine fibroids should be considered candidates for either a conventional LM or RALM. Both the scientific literature and technologic advances make these approaches viable options, especially when the surgeon’s skill is appropriate and the patient’s candidacy is adequately vetted. A well thought out surgical strategy from start to finish will ensure the chances for successful completion and optimized outcomes.
Share your thoughts! Send your Letter to the Editor to [email protected]. Please include your name and the city and state in which you practice.
- Matchar DB, Myers ER, Barber MW, et al. Management of uterine fibroids: summary. AHRQ Evidence Report Summaries. Rockville, MD; Agency for Healthcare Research and Quality; 2001. AHRQ Publication No. 01-E051.
- Baird DD, Dunson DB, Hill MC, et al. High cumulative incidence of uterine leiomyoma in black and white women: ultrasound evidence. Am J Obstet Gynecol. 2003;188:100-107.
- Stewart EA. Uterine fibroids. Lancet. 2001;357:293-298.
- Nash K, Feinglass J, Zei C, et al. Robotic-assisted laparoscopic myomectomy versus abdominal myomectomy: a comparative analysis of surgical outcomes and costs. Arch Gynecol Obstet. 2012;285:435-440.
- Herrmann A, De Wilde RL. Laparoscopic myomectomy—the gold standard. Gynecol Minim Invasive Ther. 2014;3:31-38.
- Stoica RA, Bistriceanu I, Sima R, et al. Laparoscopic myomectomy. J Med Life. 2014;7:522-524.
- Donnez J, Dolmans MM. Uterine fibroid management: from the present to the future. Hum Reprod Update. 2016;22:665-686.
- Holub Z. Laparoscopic myomectomy: indications and limits. Ceska Gynekol. 2007;72:64-68.
- Sinha R, Hegde A, Mahajan C, et al. Laparoscopic myomectomy: do size, number, and location of the myomas form limiting factors for laparoscopic myomectomy? J Minim Invasive Gynecol. 2008;15:292-300.
- Aksoy H, Aydin T, Ozdamar O, et al. Successful use of laparoscopic myomectomy to remove a giant uterine myoma: a case report. J Med Case Rep. 2015;9:286.
- Damiani A, Melgrati L, Marziali M, et al. Laparoscopic myomectomy for very large myomas using an isobaric (gasless) technique. JSLS. 2005;9:434-438.
- Holzer A, Jirecek ST, Illievich UM, et al. Laparoscopic versus open myomectomy: a double-blind study to evaluate postoperative pain. Anesth Analg. 2006;102:1480-1484.
- Mais V, Ajossa S, Guerriero S, et al. Laparoscopic versus abdominal myomectomy: a prospective, randomized trial to evaluate benefits in early outcome. Am J Obstet Gynecol. 1996;174:654-658.
- Jin C, Hu Y, Chen XC, et al. Laparoscopic versus open myomectomy—a meta-analysis of randomized controlled trials. Eur J Obstet Gynecol Reprod Biol. 2009;145:14-21.
- Pluchino N, Litta P, Freschi L, et al. Comparison of the initial surgical experience with robotic and laparoscopic myomectomy. Int J Med Robot. 2014;10:208-212.
- Parker WH, Iacampo K, Long T. Uterine rupture after laparoscopic removal of a pedunculated myoma. J Minim Invasive Gynecol. 2007;14:362-364.
- Advincula AP, Song A, Burke W, et al. Preliminary experience with robot-assisted laparoscopic myomectomy. J Am Assoc Gynecol Laparosc. 2004;11:511-518.
- Advincula AP, Xu X, Goudeau S 4th, et al. Robot-assisted laparoscopic myomectomy versus abdominal myomectomy: a comparison of short-term surgical outcomes and immediate costs. J Minim Invasive Gynecol. 2007;14:698-705.
- Nash K, Feinglass J, Zei C, et al. Robotic-assisted laparoscopic myomectomy versus abdominal myomectomy: a comparative analysis of surgical outcomes and costs. Arch Gynecol Obstet. 2012;285:435-440.
- Mansour FW, Kives S, Urbach DR, et al. Robotically assisted laparoscopic myomectomy: a Canadian experience. J Obstet Gynaecol Canada. 2012;34:353-358.
- Sangha R, Eisenstein D, George A, et al. Comparison of surgical outcomes for robotic assisted laparoscopic myomectomy compared to abdominal myomectomy (abstract 373). J Minim Invasive Gynecol. 2010;17(suppl):S90-S108.
- Pundir J, Pundir V, Walavalkar R, et al. Robotic-assisted laparoscopic vs abdominal and laparoscopic myomectomy: systematic review and meta-analysis. J Minim Invasive Gynecol. 2013; 20:335–345.
- Pitter MC, Srouji SS, Gargiulo AR, et al. Fertility and symptom relief following robot-assisted laparoscopic myomectomy. Obstet Gynecol Int. 2015. doi:10.1155/2015/967568.
- Pitter MC, Gargiulo AR, Bonaventura LM, et al. Pregnancy outcomes following robot-assisted myomectomy. Hum Reprod. 2013; 28:99-108.
- Cela V, Freschi L, Simi G, et al. Fertility and endocrine outcome after robot-assisted laparoscopic myomectomy (RALM). Gynecol Endocrinol. 2013;29:79-82.
- Kang SY, Jeung IC, Chung YJ, et al. Robot-assisted laparoscopic myomectomy for deep intramural myomas. Int J Med Robot. 2017;13. doi:10.1002/rcs.1742.
- van den Haak L, Alleblas C, Nieboer TE, et al. Efficacy and safety of uterine manipulators in laparoscopic surgery: a review. Arch Gynecol Obstet. 2015;292:1003-1011.
- Hickman LC, Kotlyar A, Shue S, et al. Hemostatic techniques for myomectomy: an evidence-based approach. J Minim Invasive Gynecol. 2016;23:497-504.
- Tulandi T, Einarsson JI. The use of barbed suture for laparoscopic hysterectomy and myomectomy: a systematic review and meta-analysis. J Minim Invasive Gynecol. 2014;21:210-216.
- Alessandri F, Remorgida V, Venturini PL, et al. Unidirectional barbed suture versus continuous suture with intracorporeal knots in laparoscopic myomectomy: a randomized study. J Minim Invasive Gynecol. 2010;17:725-729.
- AAGL Advancing Minimally Invasive Gynecology Worldwide. AAGL practice report: morcellation during uterine tissue extraction. J Minim Invasive Gynecol. 2014;21:517-530.
- Meurs EA, Brito LG, Ajao MO, et al. Comparison of morcellation techniques at the time of laparoscopic hysterectomy and myomectomy. J Minim Invasive Gynecol. 2017;24:843-849.