User login
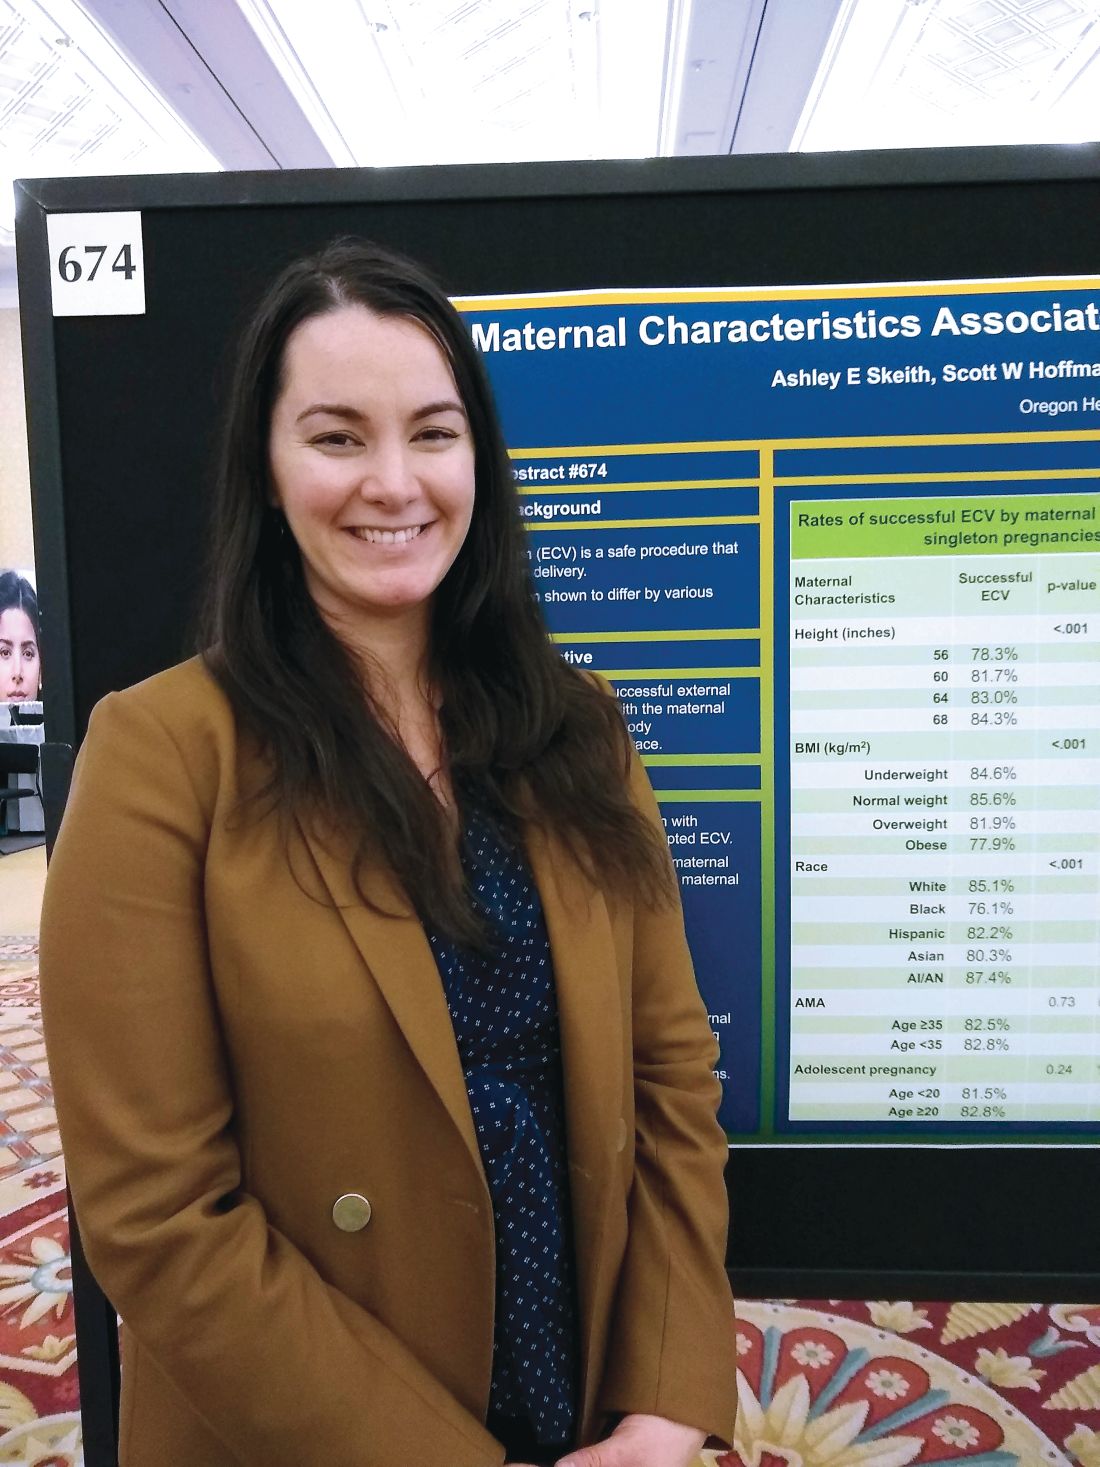
Successful external cephalic version more likely in taller, leaner women
LAS VEGAS – according to data shared in a poster session at the meeting sponsored by the Society for Maternal-Fetal Medicine.
Race/ethnicity also had an impact on the likelihood that external cephalic version (ECV) would be successful.
In an interview, first author Ashley E. Skeith, a medical student at Oregon Health and Sciences University, Portland, said that various characteristics of a pregnancy may affect the success of ECV, but it wasn’t known which maternal characteristics might be associated with greater success of the maneuver.
She and her collaborators found that rates of success were high overall, but that 84% of women 68 inches or taller had successful ECVs, compared with 78% of women less than 60 inches tall. Rates were 82% and 83% for women 60-64 inches and 64-68 inches tall, respectively (adjusted odds ratio, 1.03; P less than .001).
The retrospective cohort study used data from 18,896 women who had singleton, breech, term gestations for whom ECV was attempted. Variables extracted from the medical record included maternal age, height, race, and prepregnancy body mass index (BMI).
For analysis, maternal BMI was grouped into four categories: underweight (BMI, less than 18.5 kg/m2), normal weight (BMI, 18.5-24.9 kg/m2), overweight (BMI, 25-29 kg/m2), and obese (BMI, greater than 30 kg/m2).
Women who were normal weight had the highest likelihood of a successful ECV, at 86%, followed by underweight women at 85%. Women who were overweight and obese had lower success rates, at 82% and 78%, respectively (aOR, 0.86; P less than .001).
Compared with white women, black women had an aOR of 0.60 for successful ECV (P less than .001). The aOR for successful ECV for Asian women was 0.71; for Hispanic women, the aOR was 0.82. American Indian and Alaska Native women were slightly more likely to have successful ECV than white women, but the difference was not significant after statistical adjustment.
Neither advanced maternal age (greater than 35 years) nor adolescent pregnancy were associated with decreased likelihood of successful ECV.
Potential confounders included maternal education level and insurance status, how much weight was gained during pregnancy, whether an epidural was administered, and whether the mother had diabetes. Multivariable regression analysis adjusted for these variables, said Ms. Skeith.
“External cephalic version is a safe procedure that reduces risk of cesarean delivery,” wrote Ms. Skeith and her colleagues. “Though fetal positioning and analgesia have been considered in the prediction of ECV success, [these] data [suggest] that maternal stature and race/ethnicity could be incorporated into potential prediction tools.”
Ms. Skeith reported no outside sources of funding or conflicts of interest.
SOURCE: Skeith AE et al. Am J Obstet Gynecol. 2019 Jan;220(1):S445-7, Abstract 674.
REPORTING FROM THE PREGNANCY MEETING
Optical coherence tomography emerging as a promising biomarker for MS
DALLAS – Optical coherence tomography (OCT) has emerged as a promising biomarker in multiple sclerosis.

Thanks to OCT, clinicians are gaining an improved understanding of how MS affects certain eye structures. An optical analogue of ultrasound B mode imaging, OCT achieves a resolution of about 3-6 microns with commercially available devices. “That allows us to quantify the layers of the retina with quite a degree of accuracy,” Shiv Saidha, MD, said at ACTRIMS Forum 2019, the meeting held by the Americas Committee for Treatment and Research in Multiple Sclerosis.
At postmortem, up to 99% of MS patients have demyelinated plaques in their optic nerves. “This implies that optic neuropathy is an ubiquitous phenomenon as part of the MS disease process,” said Dr. Saidha, a neurologist at Johns Hopkins University, Baltimore. “The prevailing hypothesis is that there is demyelination or axonal transection related to acute inflammation that occurs within the optic nerve. There’s a retrograde degeneration of its constituent axons, and that results in thinning of the inner retinal nerve fiber layer as well as the neuronal derivative of this layer called the ganglion cell layer. In addition to neurodegenerative mechanisms in the retina, there is also perivascular inflammation, called retinal periphlebitis, which we know occurs in about 20% of MS patients. At postmortem, there are also activate microglia present within the retina of MS patients.”
One of the principal findings of OCT in MS to date is that the retinal nerve fiber layer (RNFL) and ganglion cell plus inner plexiform layer (GCIP) thinning reflects MS-related optic nerve neurodegeneration. In addition, RNFL and GCIP thinning occur after optic neuritis and also as part of the MS disease course in eyes without a history of optic neuritis. “RNFL and GCIP thinning in MS are clinically relevant and correlate with visual function, global disability, and brain atrophy,” Dr. Saidha said. Researchers have also found that rates of GCIP thinning are accelerated in MS patients exhibiting clinical and/or radiological disease activity and are altered by disease-modifying therapies, and that increased inner nuclear layer (INL) thickness correlates with T2 lesion volume and predicts clinical and radiological disease activity. “In numerous trials of putatively neuroprotective and restorative treatments, we see OCT incorporated more and more, either as a secondary or a primary outcome,” he said.
Predicting disability and brain atrophy
In a study expected to be appear in a forthcoming issue of the Annals of Translational and Clinical Neurology, colleagues of Dr. Saidha found that OCT derived retinal layer measurements and visual function predict disability at 10 years in patients with MS. The researchers used an earlier generation, lower quality OCT device to examine tertiles of total macular volume, “an old, nonspecific composite measure of all of the retinal components,” he explained. “Even with inferior technology, a single measurement at a point in time not only could predict the change in EDSS [Expanded Disability Status Scale] scores from baseline to 10 years, but the accumulation of meaningful disability.”
In an earlier study, Dr. Saidha and his colleagues conducted a 4-year study of OCT and MRI in MS (Ann Neurol 2015; 78[5]:801-13). It consisted of six monthly spectral domain OCT scans (including automated intra-retinal segmentation) and baseline and annual 3 T brain MRI (including substructure volumetrics). Patients with ocular relapses (optic neuritis) during the study were excluded. The researchers correlated individual-specific rates of change in retinal and brain measurements, adjusting for age, sex, disease duration, and optic neuritis history. They found that cerebral volume fraction (analogous to whole brain volume) “had a decent correlation between rates of GCIP atrophy and rates of whole brain volume loss,” he said. “That was predominately driven by cortical gray matter atrophy.”
Measuring effects of disease-modifying therapies
What about the effects of disease-modifying therapies? According to Dr. Saidha, there has been a paucity of studies assessing the effects of DMTs on retinal layer thickness, and they are limited by small patient numbers, cross-sectional design, and/or short periods of observation. In a retrospective analysis, he and his associates examined the effects of treatments in relapsing-remitting MS patients at his center who underwent OCT (Neurology. 2017;88[6]:525-32). Over a mean 3 years of follow-up, they examined the effects of glatiramer acetate (Copaxone), natalizumab (Tysabri), and interferon beta-1a subcutaneously (Rebif) and intramuscularly (Avonex). They adjusted for gap time, which is the interval between when a patient started a treatment and when they started to undergo retinal observation with OCT. “This is to try to account for some of the biological changes that might have occurred during that period of time,” he explained. The researchers observed that rates of GCIP atrophy as well as other retinal measures were significantly lower in people treated with natalizumab, relative to all other DMTs. “What I found fascinating was the rate of GCIP atrophy of those on natalizumab was basically the same as healthy controls,” Dr. Saidha said. “It didn’t differ.”
Retinal inflammation and treatment’s impact
Significant inflammation in the unmyelinated retina may inform clinicians about other aspects of MS, he continued. For example, retinal periphlebitis occurs in about 20% of MS patients and may be a marker of CNS inflammation. In addition, intermediate uveitis occurs in about 16% of MS patients, and postmortem studies reveal retinal inflammation with microglia. Specifically, macular microcystoid changes occur in the eyes of about 5% of MS patients and may represent a breakdown of the blood-retinal barrier and inflammation. “Since it’s a dynamic process, increased thickness of the INL in the absence of visible microcystoid changes might occur,” Dr. Saidha said. “We found that baseline INL thickness is predictive of clinico-radiologic disease activity.”
In a separate analysis of 108 MS patients and 40 healthy controls, German researchers evaluated the impact of DMTs on INL volume (Brain. 2016;11[1]:2855-63). They found that higher baseline INL volume correlated with new T2 and GAD lesions over 1 year. The reduction in INL volume was significantly associated with reduced activity, and overall, DMTs reduced INL volume over 6 months. Patients who were not treated, or who were treated and did not achieve NEDA-3 (no evidence of disease activity) did not show reductions in INL volume. They concluded that INL volume might be a novel outcome of DMT treatment.
Finding prognostic and diagnostic biomarkers
In an ongoing multisite study, Dr. Saidha and his colleagues are assessing the use of OCT in patients with progressive MS (including 186 patients from Johns Hopkins), and also determining if OCT changes differ over time between relapsing-remitting MS and different subtypes of progressive MS. So far, they have found that progressive MS is associated with accelerated inner and in particular outer layer retinal atrophy. “Although this is a decent-sized cohort, at this stage I’m not sure I would definitively say that these novel retinal biomarkers have utility specific to progressive MS, but I’m very excited about it,” he said. “The goal is to take a much deeper look at this.”
Findings from a large collaborative IMSVISUAL inter-eye asymmetry study showed that peripapillary RNFL and ganglion cell–inner plexiform layer inter-eye differences of 5 microns, respectively, were optimal for identifying patients with prior unilateral optic neuritis in the MS cohort. “In the future, the possibility of using OCT to identify subclinical optic neuropathy so we can define when a lesion is present in the optic nerve has huge diagnostic implications for MS, because the optic nerve is not currently recognized as a lesion site in current MS diagnostic criteria,” Dr. Saidha said.
Dr. Saidha disclosed that he has served on scientific advisory boards for Biogen, Genzyme, Genentech, EMD Serono, and Novartis. He has also received consulting fees from JuneBrain LLC and is the site investigator of a trial sponsored by MedDay Pharmaceuticals.
DALLAS – Optical coherence tomography (OCT) has emerged as a promising biomarker in multiple sclerosis.
Thanks to OCT, clinicians are gaining an improved understanding of how MS affects certain eye structures. An optical analogue of ultrasound B mode imaging, OCT achieves a resolution of about 3-6 microns with commercially available devices. “That allows us to quantify the layers of the retina with quite a degree of accuracy,” Shiv Saidha, MD, said at ACTRIMS Forum 2019, the meeting held by the Americas Committee for Treatment and Research in Multiple Sclerosis.
At postmortem, up to 99% of MS patients have demyelinated plaques in their optic nerves. “This implies that optic neuropathy is an ubiquitous phenomenon as part of the MS disease process,” said Dr. Saidha, a neurologist at Johns Hopkins University, Baltimore. “The prevailing hypothesis is that there is demyelination or axonal transection related to acute inflammation that occurs within the optic nerve. There’s a retrograde degeneration of its constituent axons, and that results in thinning of the inner retinal nerve fiber layer as well as the neuronal derivative of this layer called the ganglion cell layer. In addition to neurodegenerative mechanisms in the retina, there is also perivascular inflammation, called retinal periphlebitis, which we know occurs in about 20% of MS patients. At postmortem, there are also activate microglia present within the retina of MS patients.”
One of the principal findings of OCT in MS to date is that the retinal nerve fiber layer (RNFL) and ganglion cell plus inner plexiform layer (GCIP) thinning reflects MS-related optic nerve neurodegeneration. In addition, RNFL and GCIP thinning occur after optic neuritis and also as part of the MS disease course in eyes without a history of optic neuritis. “RNFL and GCIP thinning in MS are clinically relevant and correlate with visual function, global disability, and brain atrophy,” Dr. Saidha said. Researchers have also found that rates of GCIP thinning are accelerated in MS patients exhibiting clinical and/or radiological disease activity and are altered by disease-modifying therapies, and that increased inner nuclear layer (INL) thickness correlates with T2 lesion volume and predicts clinical and radiological disease activity. “In numerous trials of putatively neuroprotective and restorative treatments, we see OCT incorporated more and more, either as a secondary or a primary outcome,” he said.
Predicting disability and brain atrophy
In a study expected to be appear in a forthcoming issue of the Annals of Translational and Clinical Neurology, colleagues of Dr. Saidha found that OCT derived retinal layer measurements and visual function predict disability at 10 years in patients with MS. The researchers used an earlier generation, lower quality OCT device to examine tertiles of total macular volume, “an old, nonspecific composite measure of all of the retinal components,” he explained. “Even with inferior technology, a single measurement at a point in time not only could predict the change in EDSS [Expanded Disability Status Scale] scores from baseline to 10 years, but the accumulation of meaningful disability.”
In an earlier study, Dr. Saidha and his colleagues conducted a 4-year study of OCT and MRI in MS (Ann Neurol 2015; 78[5]:801-13). It consisted of six monthly spectral domain OCT scans (including automated intra-retinal segmentation) and baseline and annual 3 T brain MRI (including substructure volumetrics). Patients with ocular relapses (optic neuritis) during the study were excluded. The researchers correlated individual-specific rates of change in retinal and brain measurements, adjusting for age, sex, disease duration, and optic neuritis history. They found that cerebral volume fraction (analogous to whole brain volume) “had a decent correlation between rates of GCIP atrophy and rates of whole brain volume loss,” he said. “That was predominately driven by cortical gray matter atrophy.”
Measuring effects of disease-modifying therapies
What about the effects of disease-modifying therapies? According to Dr. Saidha, there has been a paucity of studies assessing the effects of DMTs on retinal layer thickness, and they are limited by small patient numbers, cross-sectional design, and/or short periods of observation. In a retrospective analysis, he and his associates examined the effects of treatments in relapsing-remitting MS patients at his center who underwent OCT (Neurology. 2017;88[6]:525-32). Over a mean 3 years of follow-up, they examined the effects of glatiramer acetate (Copaxone), natalizumab (Tysabri), and interferon beta-1a subcutaneously (Rebif) and intramuscularly (Avonex). They adjusted for gap time, which is the interval between when a patient started a treatment and when they started to undergo retinal observation with OCT. “This is to try to account for some of the biological changes that might have occurred during that period of time,” he explained. The researchers observed that rates of GCIP atrophy as well as other retinal measures were significantly lower in people treated with natalizumab, relative to all other DMTs. “What I found fascinating was the rate of GCIP atrophy of those on natalizumab was basically the same as healthy controls,” Dr. Saidha said. “It didn’t differ.”
Retinal inflammation and treatment’s impact
Significant inflammation in the unmyelinated retina may inform clinicians about other aspects of MS, he continued. For example, retinal periphlebitis occurs in about 20% of MS patients and may be a marker of CNS inflammation. In addition, intermediate uveitis occurs in about 16% of MS patients, and postmortem studies reveal retinal inflammation with microglia. Specifically, macular microcystoid changes occur in the eyes of about 5% of MS patients and may represent a breakdown of the blood-retinal barrier and inflammation. “Since it’s a dynamic process, increased thickness of the INL in the absence of visible microcystoid changes might occur,” Dr. Saidha said. “We found that baseline INL thickness is predictive of clinico-radiologic disease activity.”
In a separate analysis of 108 MS patients and 40 healthy controls, German researchers evaluated the impact of DMTs on INL volume (Brain. 2016;11[1]:2855-63). They found that higher baseline INL volume correlated with new T2 and GAD lesions over 1 year. The reduction in INL volume was significantly associated with reduced activity, and overall, DMTs reduced INL volume over 6 months. Patients who were not treated, or who were treated and did not achieve NEDA-3 (no evidence of disease activity) did not show reductions in INL volume. They concluded that INL volume might be a novel outcome of DMT treatment.
Finding prognostic and diagnostic biomarkers
In an ongoing multisite study, Dr. Saidha and his colleagues are assessing the use of OCT in patients with progressive MS (including 186 patients from Johns Hopkins), and also determining if OCT changes differ over time between relapsing-remitting MS and different subtypes of progressive MS. So far, they have found that progressive MS is associated with accelerated inner and in particular outer layer retinal atrophy. “Although this is a decent-sized cohort, at this stage I’m not sure I would definitively say that these novel retinal biomarkers have utility specific to progressive MS, but I’m very excited about it,” he said. “The goal is to take a much deeper look at this.”
Findings from a large collaborative IMSVISUAL inter-eye asymmetry study showed that peripapillary RNFL and ganglion cell–inner plexiform layer inter-eye differences of 5 microns, respectively, were optimal for identifying patients with prior unilateral optic neuritis in the MS cohort. “In the future, the possibility of using OCT to identify subclinical optic neuropathy so we can define when a lesion is present in the optic nerve has huge diagnostic implications for MS, because the optic nerve is not currently recognized as a lesion site in current MS diagnostic criteria,” Dr. Saidha said.
Dr. Saidha disclosed that he has served on scientific advisory boards for Biogen, Genzyme, Genentech, EMD Serono, and Novartis. He has also received consulting fees from JuneBrain LLC and is the site investigator of a trial sponsored by MedDay Pharmaceuticals.
EXPERT ANALYSIS FROM ACTRIMS FORUM 2019
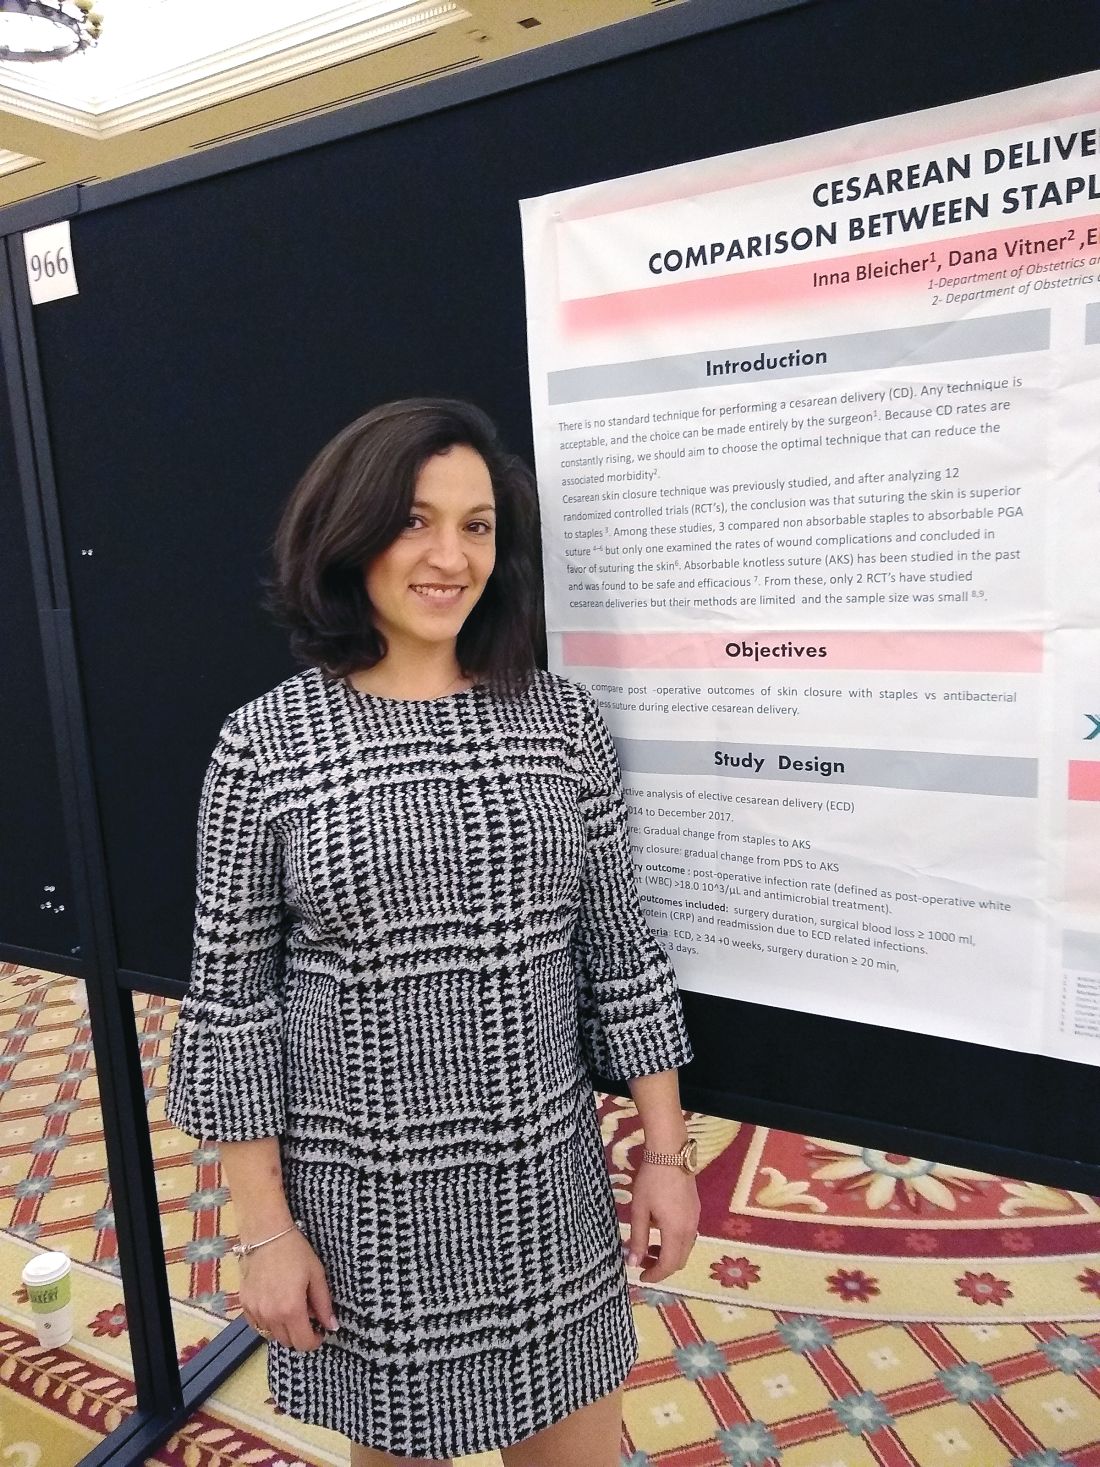
Knotless, absorbable sutures best staples for postcesarean skin closure
LAS VEGAS – compared with staples, in a single-site, retrospective study.
For women whose skin incisions were closed with knotless sutures, mean surgical time was 38 minutes; for women who received a staple closure, mean surgical time was 44 minutes (P less than .001). Also, fewer women whose incisions were closed with knotless sutures experienced surgical bleeding greater than 1,000 mL, compared with those who received staples (0.3% vs. 3.0%; P less than .001).
Two previous randomized, controlled trials comparing knotless sutures with staples for skin closure after cesarean delivery were small and had methodological limitations, Inna Bleicher, MD, said in an interview during a poster session at the meeting sponsored by the Society for Maternal-Fetal Medicine.
Dr. Bleicher and her colleagues reviewed records from 2,173 elective cesarean deliveries over a period of 4 years. Absorbable, antibacterial, knotless sutures were used for closure for 1,172 women, while staples were used for the remaining 1,001 women.
Over the study period, Dr. Bleicher noted that there was a gradual transition from the use of staples to absorbable, knotless sutures, which also were increasingly used for the hysterotomy closure. She added that, in conversation with peers at Bnai-Zion Medical Center, Haifa, Israel, where she practices as an ob.gyn, she’s found that physicians find the sutures easy and quick to use, because the sutures are double ended, allowing the possibility for two operators to work together in wound closure.
The study’s primary outcome measure was the rate of postoperative infection, defined as postoperative white blood count greater than 18,000 per microliter and antimicrobial treatment. Secondary outcome measures included C-reactive protein levels, hospital readmission for infection related to the delivery, duration of surgery, and surgical blood loss estimated at 1,000 mL or more.
A higher proportion of women in the staple closure group than the knotless suture group required postsurgical antibiotic treatment (11% vs. 10%), but this difference didn’t reach statistical significance (P = .243).
There were no significant differences in the groups in terms of maternal age (about 32 years), or gestational age at delivery (about 39 weeks).
“Our results suggest that cesarean scar skin closure with antibacterial knotless sutures did not increase, and may even reduce, the rates of postoperative infection, morbidity, surgical blood loss, and may shorten operation time,” wrote Dr. Bleicher and her colleagues.
Dr. Bleicher reported no outside sources of funding and no conflicts of interest.
SOURCE: Bleicher I et al. Am J Obstet Gynecol. 2019 Jan. 220;1:S622, Abstract 966.
REPORTING FROM THE PREGNANCY MEETING
Sexuality throughout life: Stephen Levine
Dr. Levine, professor of psychiatry at Case Western Reserve University in Cleveland, checked in from the 2018 AACP Encore meeting in Las Vegas. And later, Dr. RK discusses bipolar disorder in part I of her new series.
Dr. Levine, professor of psychiatry at Case Western Reserve University in Cleveland, checked in from the 2018 AACP Encore meeting in Las Vegas. And later, Dr. RK discusses bipolar disorder in part I of her new series.
Dr. Levine, professor of psychiatry at Case Western Reserve University in Cleveland, checked in from the 2018 AACP Encore meeting in Las Vegas. And later, Dr. RK discusses bipolar disorder in part I of her new series.

Prurigo Pigmentosa Induced by Ketosis: Resolution Through Dietary Modification
To the Editor:
A 40-year-old white woman presented with a waxing and waning erythematous pruritic rash on the chest, back, and axillae of 3 years’ duration. The appearance of the rash coincided with an intentional weight loss of more than 100 lb, achieved through various diets, most recently a Paleolithic (paleo) diet that was high in protein; low in carbohydrates; and specifically restricted dairy, cereal grains, refined sugars, processed foods, white potatoes, salt, refined oils, and legumes.1 The patient had been monitoring blood glucose and ketone levels. Prior to presentation, she received various treatments including clotrimazole cream and topical steroids with no improvement.
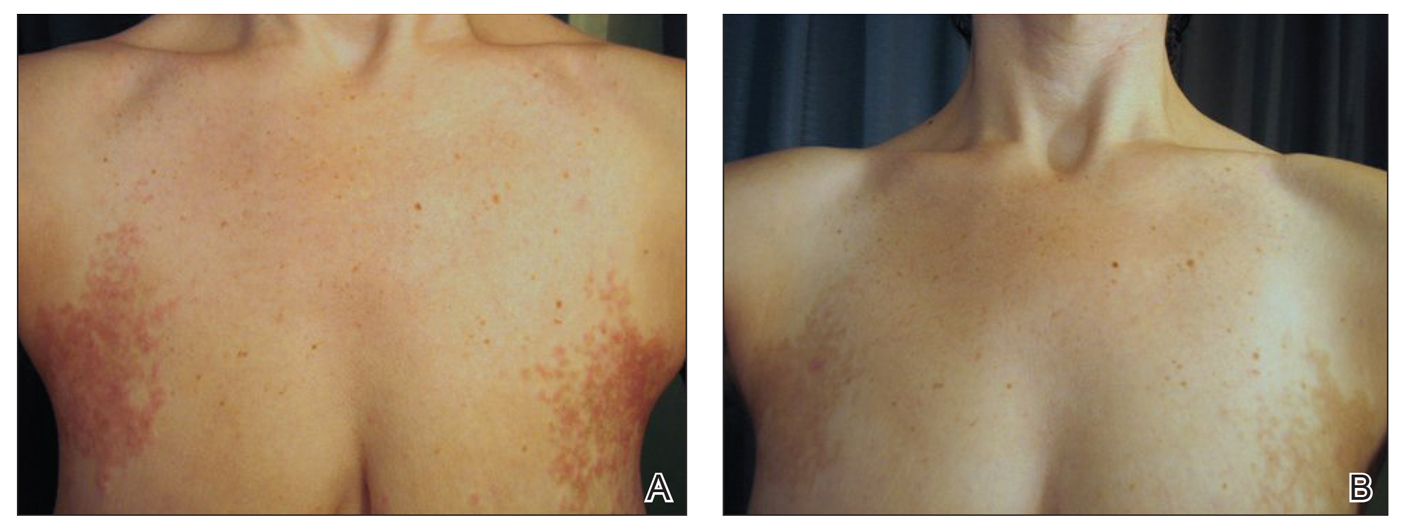
On physical examination, there were scaly, pink-red, reticulated papules and plaques coexisting with tan reticulated patches that were symmetrically distributed on the central back, lateral and central chest (Figure 1A), breasts, and inframammary areas. During the most severe flare-up, the blood ketones measured 1 mmol/L. There was no relevant medical history. She was of Spanish and Italian descent.
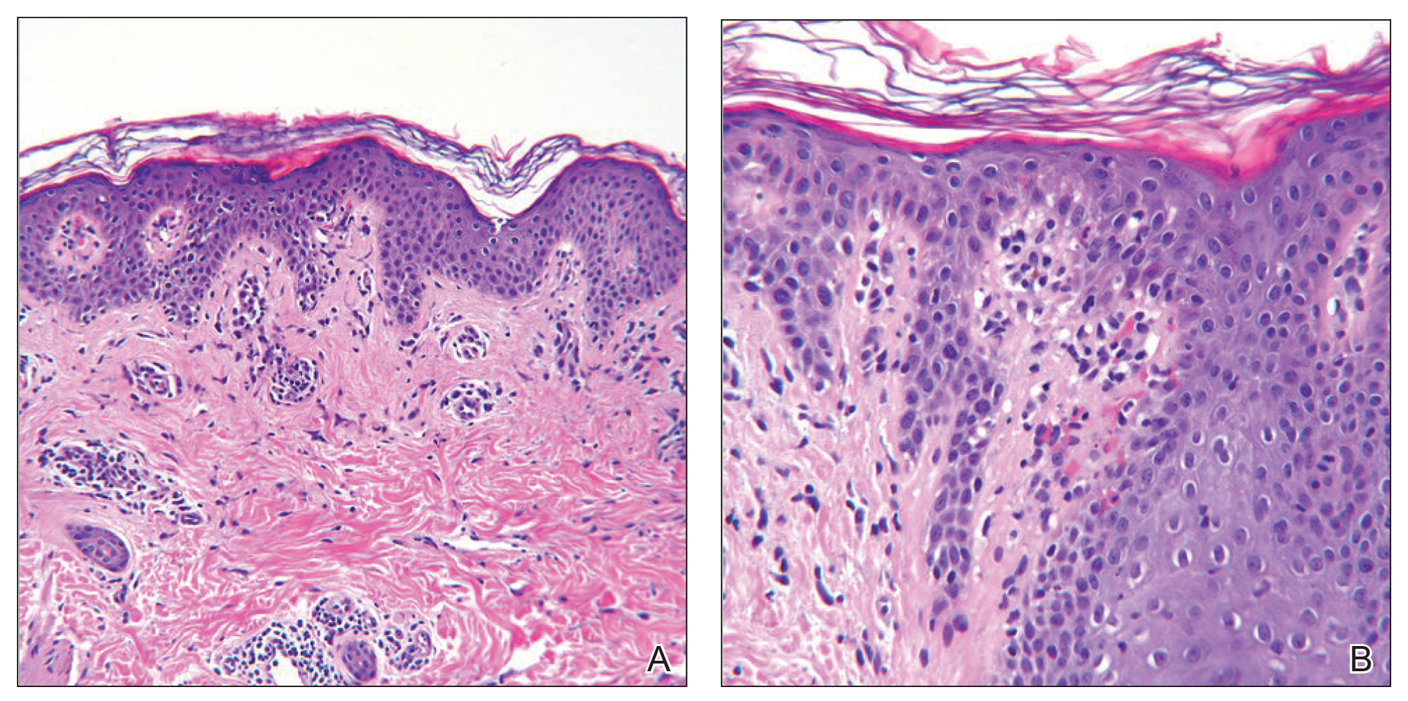
Histologic sections showed a sparse infiltrate of lymphocytes surrounding superficial dermal vessels and a mildly acanthotic epidermis with a focally parakeratotic stratum corneum (Figure 2A). Pigmentary incontinence and subtle interface changes were apparent, including rare necrotic keratinocytes (Figure 2B). No eosinophils or neutrophils were present.
After the initial presentation, carbohydrates were added back into her diet and both the ketosis and eruption remarkably resolved. When carbohydrate restriction was rechallenged, she again entered ketosis (0.5 mmol/L), followed by subsequent recurrence of the pruritic lesions. With re-introduction of carbohydrates, the eruption and ketosis once more resolved, leaving only postinflammatory reticulated hyperpigmentation (Figure 1B). Based on the clinical presentation, supportive histopathologic findings, and interesting response to ketones and diet modification, the patient was diagnosed with prurigo pigmentosa (PP).
Prurigo pigmentosa is a rare inflammatory dermatosis that was initially described in 1971 as “a peculiar pruriginous dermatosis with gross reticular pigmentation” by Nagashima et al.2 Prurigo pigmentosa is most frequently diagnosed in Japan, and since its discovery, it has been reported in more than 300 cases worldwide.2-4
Fewer than 50 non-Japanese cases have been reported, with the possibility of an additional ethnic predisposition among the Turkish and Sicilian populations, though only 6 cases have been reported in the United States.3-6 Prurigo pigmentosa tends to occur in the spring and summer months and is most common among young females, with a mean age of 24 years. The typical lesions of PP are symmetrically distributed on the trunk with a tendency to localize on the upper back, nape of the neck, and intermammary and inframammary regions. Eruptions have been reported to occur on additional areas; however, mucus membranes are always spared.6
Individual lesions differ in appearance depending on the stage of presentation and are categorized as early, fully developed, resolving, and late lesions.6 Pruritic macules and papules are present early in the disease state and resolve into crusted and/or scaly papules followed by pigmented macules. Early lesions tend to be intensely pruritic with signs of excoriation, while resolving lesions lack symptoms. Lesions last approximately 1 week but tend to reappear at the site where they were previously present, which allows for lesions of different ages to coexist, appearing in a reticular arrangement with hyperpigmented mottling lasting from a few weeks to months.6
Just as the clinical picture transpires rapidly within 1 week, so do the histopathologic findings.6 Early lesions are categorized by a superficial perivascular and interstitial infiltrate of neutrophils, spongiosis, ballooning, and necrotic keratinocytes. These early lesions are present for less than 48 hours, and these histopathologic findings are diagnostic of PP. Within 2 days, lymphocytes predominate in the dermal infiltrate, and a patchy lichenoid aspect is established in the fully developed lesion along with reticular and vacuolar alterations. Late lesions show a parakeratotic and hyperpigmented epidermis with melanophages present in the papillary and reticular dermis. At this last stage, the histopathologic features of PP are indistinguishable from any other disease that results in postinflammatory hyperpigmentation, making diagnosis difficult.6
A variety of therapeutic options are used in the treatment of PP, with the most effective agents being oral antibiotics including dapsone, minocycline, and doxycycline, all of which limit the local tissue inflammatory response and cytotoxic effects. Topical and systemic antihistamines as well as corticosteroids are ineffective and have not been shown to prevent the postinflammatory reticular pigmentation.6-10
Various underlying factors have been associated with PP, including friction, heat, sunlight, sweating, allergic contact sensitization, and ketosis due to nutritional deficiency or diabetes mellitus; however; the exact etiology remains ambiguous.2-7 The association with ketosis and nutrition is of particular interest in this case. Onset of PP has been reported to coincide with dieting, fasting, weight loss, anorexia nervosa, and diabetes mellitus.3,6-9 Roughly 50 patients with PP had ketosis subsequent to these metabolic disturbances.3,6-10 As of now, the only reported correlation between ketosis and PP is that upon diet modification, lesions resolved following ketone normalization, as was observed in our patient.3,6-8 Reports of PP in diabetic patients while in ketoacidosis describe resolution of lesions with insulin administration.6-9 The pathophysiology of ketosis and its association with PP is unclear; however, the similarities seen in the immune response of PP and that stimulated by ketosis may expose an associated mechanism.
Ketosis is a temporary condition characterized by elevated serum ketones that are used as an alternative energy source when blood glucose is low or insulin is deficient.11 The most common causes of ketosis are the physiologic responses to fasting, prolonged exercise, or a high-protein/low-carbohydrate diet, though pathologic causes include insulin-dependent diabetes mellitus, alcoholism, and salicylate overdose.11 In healthy individuals, blood ketone levels rarely approach 0.5 mmol/L. Prolonged fasting or restricting intake of carbohydrates to less than 40 g daily can induce mild ketosis that resolves with re-introduction of carbohydrates.11
Ketone bodies pass from the circulating blood into tissues or remain near the blood vessels, inducing cytotoxic effects and perivascular inflammation.10,11 Increased ketone bodies have been shown to upregulate intercellular adhesion molecule 1 (ICAM-1) and leukocyte function-associated antigen 1 (LFA-1), a phenomenon also seen in lesional keratinocytes of PP.12,13 Teraki et al13 observed that epidermal keratinocytes exhibited increased expression of ICAM-1 as well as intense expression of LFA-1 on dermal and epidermotropic leukocytes, which was thought to be due to cell-mediated cytotoxicity. Not only do increased ketone bodies upregulate ICAM-1 and LFA-1, but they also are involved in increasing many proinflammatory mediators that may be capable of inducing the response seen in PP keratinocytes.12,13
Intercellular adhesion molecule 1 is important in initiating cellular interactions in the immune response and is the ligand for LFA-1 found on most leukocytes.14 Increased ICAM-1/LFA-1 interaction is thought to be the major pathway by which leukocytes are able to attach to keratinocytes and endothelial cells, allowing for leukocyte tissue migration and specific immunologic reactions, including leukocyte-mediated cytotoxicity. Interestingly, glucocorticoids are ineffective in reducing the expression of ICAM-1 in cultured keratinocytes.14 This connection between ketosis and inflammation that results in leukocyte migration and ultimately keratinocyte cytotoxicity may well be fundamental to the pathophysiology of PP and may provide a possible explanation for the ineffectiveness of corticosteroid treatment.
Middleton and Norris15 observed that individual keratinocyte strains show considerable variability in ICAM-1 expression that was found to be attributable to genetic polymorphisms. The presence of a particular polymorphism affecting ICAM-1 expression on human keratinocytes may explain the apparent ethnogeographic predisposition of PP as well as the ease at which ICAM-1 is expressed in the presence of ketones.
We describe a case of a 40-year-old white woman who was diagnosed with PP that was prompted by a 100-lb weight loss and self-induced ketosis while following a paleo diet with carbohydrate restriction. Successful treatment was attained through diet modification alone. This interesting case was another instance in which the pathophysiology of PP was attributed to ketosis. Because not all patients that are in ketosis have PP, larger prospective cohort studies are needed to further elucidate the association of PP and ketosis.
- What is the paleo diet? The Paleo Diet website. http://thepaleodiet.com/the-paleo-diet-premise. Accessed March 9, 2019.
- Nagashima M, Ohshiro A, Shimizu N. A peculiar pruriginous dermatosis with gross reticular pigmentation [in Japanese]. Japanese J Dermatol. 1971;81:38-39.
- Michaels JD, Hoss E, DiCaudo DJ, et al. Prurigo pigmentosa after a strict ketogenic diet [published online December 30, 2013]. Pediatr Dermatol. 2015;32:248-251.
- Baykal C, Buyukbabani N, Akinturk S, et al. Prurigo pigmentosa: not an uncommon disease in the Turkish population. Int J Dermatol. 2006;45:1164-1168.
- Whang T, Kirkorian Y, Krishtul A, et al. Prurigo pigmentosa: report of two cases in the United States and review of the literature. Dermatology Online J. 2011;17:2.
- Böer A, Ackerman AB. Prurigo Pigmentosa (Nagashima Disease): Textbook and Atlas of a Distinctive Inflammatory Disease of the Skin. New York, NY: Ardor Scribendi Ltd; 2004.
- Teraki Y, Teraki E, Kawashima M, at al. Ketosis is involved in the origin of prurigo pigmentosa. J Am Acad Dermatol. 1996;34:509-511.
- Oh YJ, Lee MH. Prurigo pigmentosa: a clinicopathologic study of 16 cases. J Eur Acad Dermatol Venereol. 2011;26:1149-1153.
- Yokozeki M, Watanabe J, Hotsubo T, et al. Prurigo pigmentosa disappeared following improvement of diabetic ketosis by insulin. J Dermatol. 2003;30:257-258.
- Kim JK, Chung WK, Chang SE, et al. Prurigo pigmentosa: clinicopathological study and analysis of 50 cases in Korea. J Dermatol. 2012;39:891-897.
- VanItallie TB, Nufert TH. Ketones: metabolism’s ugly duckling. Annu Rev Nutr. 2003;61:327-341.
- Rains JL, Jain SK. Hyperketonemia increases monocyte adhesion to endothelial cells and is mediated by LFA-1 expression in monocytes and ICAM-1 expression in endothelial cells. Am J Physiol Endocrinol Metab. 2011;301:e298-e306.
- Teraki Y, Shiohara T, Nagashima M, et al. Prurigo pigmentosa: role of ICAM-1 in the localization of the eruption. Br J Dermatol. 1991;125:360-363.
- Kashihara-Sawami M, Norris DA. The state of differentiation of cultured human keratinocytes determines the level of intercellular adhesion molecule-1 (ICAM-1) expression induced by gamma interferon. J Invest Dermatol. 1992;98:741-747.
- Middleton MH, Norris DA. Cytokine-induced ICAM-1 expression in human keratinocytes is highly variable in keratinocyte strains from different donors. J Invest Dermatol. 1995;104:489-496.
To the Editor:
A 40-year-old white woman presented with a waxing and waning erythematous pruritic rash on the chest, back, and axillae of 3 years’ duration. The appearance of the rash coincided with an intentional weight loss of more than 100 lb, achieved through various diets, most recently a Paleolithic (paleo) diet that was high in protein; low in carbohydrates; and specifically restricted dairy, cereal grains, refined sugars, processed foods, white potatoes, salt, refined oils, and legumes.1 The patient had been monitoring blood glucose and ketone levels. Prior to presentation, she received various treatments including clotrimazole cream and topical steroids with no improvement.
On physical examination, there were scaly, pink-red, reticulated papules and plaques coexisting with tan reticulated patches that were symmetrically distributed on the central back, lateral and central chest (Figure 1A), breasts, and inframammary areas. During the most severe flare-up, the blood ketones measured 1 mmol/L. There was no relevant medical history. She was of Spanish and Italian descent.
Histologic sections showed a sparse infiltrate of lymphocytes surrounding superficial dermal vessels and a mildly acanthotic epidermis with a focally parakeratotic stratum corneum (Figure 2A). Pigmentary incontinence and subtle interface changes were apparent, including rare necrotic keratinocytes (Figure 2B). No eosinophils or neutrophils were present.
After the initial presentation, carbohydrates were added back into her diet and both the ketosis and eruption remarkably resolved. When carbohydrate restriction was rechallenged, she again entered ketosis (0.5 mmol/L), followed by subsequent recurrence of the pruritic lesions. With re-introduction of carbohydrates, the eruption and ketosis once more resolved, leaving only postinflammatory reticulated hyperpigmentation (Figure 1B). Based on the clinical presentation, supportive histopathologic findings, and interesting response to ketones and diet modification, the patient was diagnosed with prurigo pigmentosa (PP).
Prurigo pigmentosa is a rare inflammatory dermatosis that was initially described in 1971 as “a peculiar pruriginous dermatosis with gross reticular pigmentation” by Nagashima et al.2 Prurigo pigmentosa is most frequently diagnosed in Japan, and since its discovery, it has been reported in more than 300 cases worldwide.2-4
Fewer than 50 non-Japanese cases have been reported, with the possibility of an additional ethnic predisposition among the Turkish and Sicilian populations, though only 6 cases have been reported in the United States.3-6 Prurigo pigmentosa tends to occur in the spring and summer months and is most common among young females, with a mean age of 24 years. The typical lesions of PP are symmetrically distributed on the trunk with a tendency to localize on the upper back, nape of the neck, and intermammary and inframammary regions. Eruptions have been reported to occur on additional areas; however, mucus membranes are always spared.6
Individual lesions differ in appearance depending on the stage of presentation and are categorized as early, fully developed, resolving, and late lesions.6 Pruritic macules and papules are present early in the disease state and resolve into crusted and/or scaly papules followed by pigmented macules. Early lesions tend to be intensely pruritic with signs of excoriation, while resolving lesions lack symptoms. Lesions last approximately 1 week but tend to reappear at the site where they were previously present, which allows for lesions of different ages to coexist, appearing in a reticular arrangement with hyperpigmented mottling lasting from a few weeks to months.6
Just as the clinical picture transpires rapidly within 1 week, so do the histopathologic findings.6 Early lesions are categorized by a superficial perivascular and interstitial infiltrate of neutrophils, spongiosis, ballooning, and necrotic keratinocytes. These early lesions are present for less than 48 hours, and these histopathologic findings are diagnostic of PP. Within 2 days, lymphocytes predominate in the dermal infiltrate, and a patchy lichenoid aspect is established in the fully developed lesion along with reticular and vacuolar alterations. Late lesions show a parakeratotic and hyperpigmented epidermis with melanophages present in the papillary and reticular dermis. At this last stage, the histopathologic features of PP are indistinguishable from any other disease that results in postinflammatory hyperpigmentation, making diagnosis difficult.6
A variety of therapeutic options are used in the treatment of PP, with the most effective agents being oral antibiotics including dapsone, minocycline, and doxycycline, all of which limit the local tissue inflammatory response and cytotoxic effects. Topical and systemic antihistamines as well as corticosteroids are ineffective and have not been shown to prevent the postinflammatory reticular pigmentation.6-10
Various underlying factors have been associated with PP, including friction, heat, sunlight, sweating, allergic contact sensitization, and ketosis due to nutritional deficiency or diabetes mellitus; however; the exact etiology remains ambiguous.2-7 The association with ketosis and nutrition is of particular interest in this case. Onset of PP has been reported to coincide with dieting, fasting, weight loss, anorexia nervosa, and diabetes mellitus.3,6-9 Roughly 50 patients with PP had ketosis subsequent to these metabolic disturbances.3,6-10 As of now, the only reported correlation between ketosis and PP is that upon diet modification, lesions resolved following ketone normalization, as was observed in our patient.3,6-8 Reports of PP in diabetic patients while in ketoacidosis describe resolution of lesions with insulin administration.6-9 The pathophysiology of ketosis and its association with PP is unclear; however, the similarities seen in the immune response of PP and that stimulated by ketosis may expose an associated mechanism.
Ketosis is a temporary condition characterized by elevated serum ketones that are used as an alternative energy source when blood glucose is low or insulin is deficient.11 The most common causes of ketosis are the physiologic responses to fasting, prolonged exercise, or a high-protein/low-carbohydrate diet, though pathologic causes include insulin-dependent diabetes mellitus, alcoholism, and salicylate overdose.11 In healthy individuals, blood ketone levels rarely approach 0.5 mmol/L. Prolonged fasting or restricting intake of carbohydrates to less than 40 g daily can induce mild ketosis that resolves with re-introduction of carbohydrates.11
Ketone bodies pass from the circulating blood into tissues or remain near the blood vessels, inducing cytotoxic effects and perivascular inflammation.10,11 Increased ketone bodies have been shown to upregulate intercellular adhesion molecule 1 (ICAM-1) and leukocyte function-associated antigen 1 (LFA-1), a phenomenon also seen in lesional keratinocytes of PP.12,13 Teraki et al13 observed that epidermal keratinocytes exhibited increased expression of ICAM-1 as well as intense expression of LFA-1 on dermal and epidermotropic leukocytes, which was thought to be due to cell-mediated cytotoxicity. Not only do increased ketone bodies upregulate ICAM-1 and LFA-1, but they also are involved in increasing many proinflammatory mediators that may be capable of inducing the response seen in PP keratinocytes.12,13
Intercellular adhesion molecule 1 is important in initiating cellular interactions in the immune response and is the ligand for LFA-1 found on most leukocytes.14 Increased ICAM-1/LFA-1 interaction is thought to be the major pathway by which leukocytes are able to attach to keratinocytes and endothelial cells, allowing for leukocyte tissue migration and specific immunologic reactions, including leukocyte-mediated cytotoxicity. Interestingly, glucocorticoids are ineffective in reducing the expression of ICAM-1 in cultured keratinocytes.14 This connection between ketosis and inflammation that results in leukocyte migration and ultimately keratinocyte cytotoxicity may well be fundamental to the pathophysiology of PP and may provide a possible explanation for the ineffectiveness of corticosteroid treatment.
Middleton and Norris15 observed that individual keratinocyte strains show considerable variability in ICAM-1 expression that was found to be attributable to genetic polymorphisms. The presence of a particular polymorphism affecting ICAM-1 expression on human keratinocytes may explain the apparent ethnogeographic predisposition of PP as well as the ease at which ICAM-1 is expressed in the presence of ketones.
We describe a case of a 40-year-old white woman who was diagnosed with PP that was prompted by a 100-lb weight loss and self-induced ketosis while following a paleo diet with carbohydrate restriction. Successful treatment was attained through diet modification alone. This interesting case was another instance in which the pathophysiology of PP was attributed to ketosis. Because not all patients that are in ketosis have PP, larger prospective cohort studies are needed to further elucidate the association of PP and ketosis.
- What is the paleo diet? The Paleo Diet website. http://thepaleodiet.com/the-paleo-diet-premise. Accessed March 9, 2019.
- Nagashima M, Ohshiro A, Shimizu N. A peculiar pruriginous dermatosis with gross reticular pigmentation [in Japanese]. Japanese J Dermatol. 1971;81:38-39.
- Michaels JD, Hoss E, DiCaudo DJ, et al. Prurigo pigmentosa after a strict ketogenic diet [published online December 30, 2013]. Pediatr Dermatol. 2015;32:248-251.
- Baykal C, Buyukbabani N, Akinturk S, et al. Prurigo pigmentosa: not an uncommon disease in the Turkish population. Int J Dermatol. 2006;45:1164-1168.
- Whang T, Kirkorian Y, Krishtul A, et al. Prurigo pigmentosa: report of two cases in the United States and review of the literature. Dermatology Online J. 2011;17:2.
- Böer A, Ackerman AB. Prurigo Pigmentosa (Nagashima Disease): Textbook and Atlas of a Distinctive Inflammatory Disease of the Skin. New York, NY: Ardor Scribendi Ltd; 2004.
- Teraki Y, Teraki E, Kawashima M, at al. Ketosis is involved in the origin of prurigo pigmentosa. J Am Acad Dermatol. 1996;34:509-511.
- Oh YJ, Lee MH. Prurigo pigmentosa: a clinicopathologic study of 16 cases. J Eur Acad Dermatol Venereol. 2011;26:1149-1153.
- Yokozeki M, Watanabe J, Hotsubo T, et al. Prurigo pigmentosa disappeared following improvement of diabetic ketosis by insulin. J Dermatol. 2003;30:257-258.
- Kim JK, Chung WK, Chang SE, et al. Prurigo pigmentosa: clinicopathological study and analysis of 50 cases in Korea. J Dermatol. 2012;39:891-897.
- VanItallie TB, Nufert TH. Ketones: metabolism’s ugly duckling. Annu Rev Nutr. 2003;61:327-341.
- Rains JL, Jain SK. Hyperketonemia increases monocyte adhesion to endothelial cells and is mediated by LFA-1 expression in monocytes and ICAM-1 expression in endothelial cells. Am J Physiol Endocrinol Metab. 2011;301:e298-e306.
- Teraki Y, Shiohara T, Nagashima M, et al. Prurigo pigmentosa: role of ICAM-1 in the localization of the eruption. Br J Dermatol. 1991;125:360-363.
- Kashihara-Sawami M, Norris DA. The state of differentiation of cultured human keratinocytes determines the level of intercellular adhesion molecule-1 (ICAM-1) expression induced by gamma interferon. J Invest Dermatol. 1992;98:741-747.
- Middleton MH, Norris DA. Cytokine-induced ICAM-1 expression in human keratinocytes is highly variable in keratinocyte strains from different donors. J Invest Dermatol. 1995;104:489-496.
Practice Points
- Ketosis can be associated with a specific rash known as prurigo pigmentosa (PP).
- Resolution of PP is related to re-introduction of carbohydrates into the diet.
- Consider asking about dietary modifications in patients presenting with a new rash.
A 13-month-old, healthy black male presented with a 6-month history of dry, scaly skin on the body
Ichthyosis vulgaris
Ichthyoses describe a group of disorders of cornification in which the epidermis differentiates abnormally, leading to generalized scaling of the skin. Ichthyosis is derived from the Greek word for fish, “ichthys.” Ichthyosis vulgaris is the most common of these conditions and often presents in early childhood during the first year of life. It is inherited in an autosomal-dominant pattern. Skin is dry and scaly over the entire body, although the antecubital and popliteal fossa may be uninvolved. The scalp may be involved as well. Atopy and keratosis pilaris may be associated. By adulthood, symptoms tend to abate.

X-linked ichthyosis is an X-linked recessive trait, in which males are affected and mothers are carriers. The condition is caused by a deficiency of steroid sulfatase. This deficiency can result in low levels of estrogen during pregnancy in the mother of an affected fetus, hampering labor progression, and often requiring C-section. Children usually present before 3 months of age. Scales are large and dark. The antecubital and popliteal fossa are usually spared. The neck almost always is involved, coining the term “dirty neck disease.” Corneal opacities are present upon ophthalmologic examination. There is an increased risk of cryptorchidism and testicular cancer. Skin symptoms tend to worsen into adulthood.
Lamellar ichthyosis generally occurs at birth with a striking collodion-type membrane covering the body and underlying erythroderma, which then desquamates. Ectropion is usually present as well. Resulting scales are large and gray-brown. Lamellar ichthyosis is inherited in an autosomal recessive pattern. Mutations in transglutaminase 1 (TGM1), ALOXE3, ALOX12B, and ABCA12 genes have been implicated in this disorder.
Acquired ichthyosis can appear clinically similar to ichthyosis vulgaris. It occurs in patients with systemic diseases such as Hodgkin disease, non-Hodgkin lymphoma, mycosis fungoides, multiple myeloma, hypothyroidism, sarcoidosis, AIDS, and others.
improve hyperkeratosis. Urea-containing products can be helpful. Salicylic acid may be used but merit caution in children because of salicylate toxicity. Oral and topical retinoid can be helpful in lamellar ichthyosis.

This case and photo were submitted by Dr. Bilu Martin.
Dr. Bilu Martin is a board-certified dermatologist in private practice at Premier Dermatology, MD, in Aventura, Fla. More diagnostic cases are available at mdedge.com/edermatologynews.com. To submit a case for possible publication, send an email to [email protected].
Ichthyosis vulgaris
Ichthyoses describe a group of disorders of cornification in which the epidermis differentiates abnormally, leading to generalized scaling of the skin. Ichthyosis is derived from the Greek word for fish, “ichthys.” Ichthyosis vulgaris is the most common of these conditions and often presents in early childhood during the first year of life. It is inherited in an autosomal-dominant pattern. Skin is dry and scaly over the entire body, although the antecubital and popliteal fossa may be uninvolved. The scalp may be involved as well. Atopy and keratosis pilaris may be associated. By adulthood, symptoms tend to abate.
X-linked ichthyosis is an X-linked recessive trait, in which males are affected and mothers are carriers. The condition is caused by a deficiency of steroid sulfatase. This deficiency can result in low levels of estrogen during pregnancy in the mother of an affected fetus, hampering labor progression, and often requiring C-section. Children usually present before 3 months of age. Scales are large and dark. The antecubital and popliteal fossa are usually spared. The neck almost always is involved, coining the term “dirty neck disease.” Corneal opacities are present upon ophthalmologic examination. There is an increased risk of cryptorchidism and testicular cancer. Skin symptoms tend to worsen into adulthood.
Lamellar ichthyosis generally occurs at birth with a striking collodion-type membrane covering the body and underlying erythroderma, which then desquamates. Ectropion is usually present as well. Resulting scales are large and gray-brown. Lamellar ichthyosis is inherited in an autosomal recessive pattern. Mutations in transglutaminase 1 (TGM1), ALOXE3, ALOX12B, and ABCA12 genes have been implicated in this disorder.
Acquired ichthyosis can appear clinically similar to ichthyosis vulgaris. It occurs in patients with systemic diseases such as Hodgkin disease, non-Hodgkin lymphoma, mycosis fungoides, multiple myeloma, hypothyroidism, sarcoidosis, AIDS, and others.
improve hyperkeratosis. Urea-containing products can be helpful. Salicylic acid may be used but merit caution in children because of salicylate toxicity. Oral and topical retinoid can be helpful in lamellar ichthyosis.
This case and photo were submitted by Dr. Bilu Martin.
Dr. Bilu Martin is a board-certified dermatologist in private practice at Premier Dermatology, MD, in Aventura, Fla. More diagnostic cases are available at mdedge.com/edermatologynews.com. To submit a case for possible publication, send an email to [email protected].
A 13-month-old, healthy black male presented with a 6-month history of dry, scaly skin on the body, including scalp and extremities. His neck was unaffected. His mother reports an uneventful pregnancy and natural childbirth. He had been prescribed triamcinolone in the past for eczema.
Rapid preeclampsia urine test is simple, noninvasive
according to a research letter in EClinicalMedicine.
The research team, led by Kara M. Rood, MD, of the department of obstetrics and gynecology at the Ohio State University, Columbus, said that their pragmatic study in 346 consecutive pregnant patients demonstrated that the test is not only inexpensive, but also easy to use and well received by the nursing staff. A positive Congo Red Dot Rapid Paper Test had 80% sensitivity, 89% specificity, 92% negative predictive value and 87% accuracy to correctly diagnose preeclampsia.
The patients were recruited from the labor and delivery triage unit at the Ohio State University Wexner Medical Center. Certain misfolded proteins typically are found in the urine of women with preeclampsia, so in prior research, the researchers had hypothesized that a urine test that could detect these proteins would carry “diagnostic and prognostic potential for” preeclampsia. The researchers were able to show that this was possible with a laboratory test that used Congo Red dye because those misfolded proteins bind with it. This current study explored the accuracy of a 3-minute, point-of-care urine test that uses a dot of Congo Red dye on a piece of paper.
Other serum and urine tests, which often have been more complicated or time intensive, have failed to gain traction in real-world practice, as well as in low-resource countries where mortality and morbidity from preeclampsia are highest, the authors noted. By contrast, the researchers hope the rapid paper test they studied in the current research will fulfill that unmet need.
The study was funded by the Saving Lives at Birth grant and a grant from the Eunice Kennedy Shriver National Institute of Child Health and Human Development.
SOURCE: Rood KM et al. EClinicalMedicine. 2019. doi: 10.1016/j.eclinm.2019.02.004.
FROM ECLINICALMEDICINE
Unintended consequences in the drive to simplify computerized test ordering
“X marks the spot!”
It’s one of the classic pirate tropes, bringing to mind images of Long John Silver, buried treasure, and a secret map with an “X” to show the hidden gold.
Today that “X” (or, in some cases, a check mark or radio button) seems to be indicating where the money is to be lost, rather than found.
Hospital computer systems are increasingly reliant on preprogrammed order lists that you check off rather than the actual test itself. We’ve gone from having to write out the tests we want, to typing them into a box, to checking them off with a mouse.
I’ve seen systems where you’re offered a menu such as:
A. Brain MRI (noncontrast)
B. Brain MRI (w/wo contrast)
C. Head MRA (noncontrast)
D. Head MRA (with contrast)
E. Neck MRA (noncontrast)
F. Neck MRA (with contrast)
G. Brain MRI and head/neck MRA (noncontrast)
H. Brain MRI and head/neck MRA (w/wo contrast)
And that’s just for the brain and its vascular supply. Expand that to the rest of the nervous system, then to the whole body, then to other tests (labs) ... and you get the idea.
I suppose the driving force here is to make the system easier to use. Doctors are busy. It saves time just have to check a box if you want three tests, rather than note all of them individually.
But it’s really not that hard to check off three. Probably less than 5 seconds (as of my last time on call). And this is where, to me, X marks the spot where the money isn’t.
Humans, like most animals, are pretty good at defaulting to a low-energy setting. So if you only have to check off one box instead of three, or five, or whatever, why bother?
If the patient is being admitted for a stroke/TIA, then it makes sense to do the brain MRI and head/neck MRA. But what if it’s just headaches, or a new seizure, or a concussion? I see plenty of times when more tests are done than necessary, simply because the ordering physician either didn’t know what was really needed or because it was easier to just check the box.
This is not, in my experience, rare. I’d say anywhere from one-third to half of patients I’ve consulted on had an overkill neurological work-up, in which tests with no medical indications had been ordered. They’ve generally already been put in the system, or even done, before I get to the bedside.

I suppose one could say they should wait for the specialist to get there before any of the costly tests are ordered, but that opens up another can of worms. What if a critical finding that needed to be acted upon isn’t found in time because of such a rule? Not only that, but waiting for me to show up and order tests means it will take longer to get them done, adding onto the hospital stay, and (again) running up costs.
So that’s not an answer, either. There really isn’t one, unfortunately.
But, in our haste to make things easier, or faster, or even just flashier, the trend seems to be at the cost of doing things reasonably. At the same time that we’re trying to save money, the single “X” may be marking the spot where we’re actually throwing it away.
Dr. Block has a solo neurology practice in Scottsdale, Ariz.
“X marks the spot!”
It’s one of the classic pirate tropes, bringing to mind images of Long John Silver, buried treasure, and a secret map with an “X” to show the hidden gold.
Today that “X” (or, in some cases, a check mark or radio button) seems to be indicating where the money is to be lost, rather than found.
Hospital computer systems are increasingly reliant on preprogrammed order lists that you check off rather than the actual test itself. We’ve gone from having to write out the tests we want, to typing them into a box, to checking them off with a mouse.
I’ve seen systems where you’re offered a menu such as:
A. Brain MRI (noncontrast)
B. Brain MRI (w/wo contrast)
C. Head MRA (noncontrast)
D. Head MRA (with contrast)
E. Neck MRA (noncontrast)
F. Neck MRA (with contrast)
G. Brain MRI and head/neck MRA (noncontrast)
H. Brain MRI and head/neck MRA (w/wo contrast)
And that’s just for the brain and its vascular supply. Expand that to the rest of the nervous system, then to the whole body, then to other tests (labs) ... and you get the idea.
I suppose the driving force here is to make the system easier to use. Doctors are busy. It saves time just have to check a box if you want three tests, rather than note all of them individually.
But it’s really not that hard to check off three. Probably less than 5 seconds (as of my last time on call). And this is where, to me, X marks the spot where the money isn’t.
Humans, like most animals, are pretty good at defaulting to a low-energy setting. So if you only have to check off one box instead of three, or five, or whatever, why bother?
If the patient is being admitted for a stroke/TIA, then it makes sense to do the brain MRI and head/neck MRA. But what if it’s just headaches, or a new seizure, or a concussion? I see plenty of times when more tests are done than necessary, simply because the ordering physician either didn’t know what was really needed or because it was easier to just check the box.
This is not, in my experience, rare. I’d say anywhere from one-third to half of patients I’ve consulted on had an overkill neurological work-up, in which tests with no medical indications had been ordered. They’ve generally already been put in the system, or even done, before I get to the bedside.
I suppose one could say they should wait for the specialist to get there before any of the costly tests are ordered, but that opens up another can of worms. What if a critical finding that needed to be acted upon isn’t found in time because of such a rule? Not only that, but waiting for me to show up and order tests means it will take longer to get them done, adding onto the hospital stay, and (again) running up costs.
So that’s not an answer, either. There really isn’t one, unfortunately.
But, in our haste to make things easier, or faster, or even just flashier, the trend seems to be at the cost of doing things reasonably. At the same time that we’re trying to save money, the single “X” may be marking the spot where we’re actually throwing it away.
Dr. Block has a solo neurology practice in Scottsdale, Ariz.
Frequently Hospitalized Patients’ Perceptions of Factors Contributing to High Hospital Use
In recent years, hospitals have made considerable efforts to improve transitions of care, in part due to financial incentives from the Medicare Hospital Readmission Reduction Program (HRRP).1 Initially focusing on three medical conditions, the HRRP has been associated with significant reductions in readmission rates.2 Importantly, a small proportion of patients accounts for a very large proportion of hospital readmissions and hospital use.3,4 Frequently hospitalized patients often have multiple chronic conditions and unique needs which may not be met by conventional approaches to healthcare delivery, including those influenced by the HRRP.4-6 In light of this challenge, some hospitals have developed programs specifically focused on frequently hospitalized patients. A recent systematic review of these programs found relatively few studies of high quality, providing only limited insight in designing interventions to support this population.7 Moreover, no studies appear to have incorporated the patients’ perspectives into the design or adaptation of the model. Members of our research team developed and implemented the Complex High Admission Management Program (CHAMP) in January 2016 to address the needs of frequently hospitalized patients in our hospital. To enhance CHAMP and inform the design of programs serving similar populations in other health systems, we sought to identify factors associated with the onset and continuation of high hospital use. Our research question was, from the patients’ perspective, what factors contribute to patients’ becoming and continuing to be high users of hospital care.
METHODS
Setting, Study Design, and Participants
This qualitative study took place at Northwestern Memorial Hospital (NMH), an 894-bed urban academic hospital located in Chicago, Illinois. Between December 2016 and September 2017, we recruited adult patients admitted to the general medicine services. Eligible participants were identified with the assistance of a daily Northwestern Medicine Electronic Data Warehouse (EDW) search and included patients with two unplanned 30-day inpatient readmissions to NMH within the prior 12 months, in addition to one or more of the following criteria: (1) at least one readmission in the last six months; (2) a referral from one of the patient’s medical providers; or (3) at least three observation visits. We excluded patients whose preferred language was not English and those disoriented to person, place, or time. Considering NMH data showing that approximately one-third of high-utilizer patients have sickle cell disease, we used purposive sampling with the goal to compare findings within and between two groups of participants; those with and those without sickle cell disease. Our study was deemed exempt by the Northwestern University Institutional Review Board.
Participant Enrollment and Data Collection
We created an interview guide based on the research team’s experience with this population, a literature review, and our research question (See Appendix).8,9 A research coordinator approached eligible participants during their hospital stay. The coordinator explained the study to eligible participants and obtained verbal consent for participation. The research coordinator then conducted one-on-one semi-structured interviews. Interviews were audio recorded for subsequent transcription and coding. Each interview lasted approximately 45 minutes. Participants were compensated with a $20 gift card for their time.
Analysis
Digital audio recordings from interviews were transcribed verbatim, deidentified, and analyzed using an iterative inductive team-based approach to coding.10 In our first cycle coding, all coders (KJO, SF, MMC, LO, KAC) independently reviewed and coded three transcripts using descriptive coding and subcoding to generate a preliminary codebook with code definitions.10,11 Following the meetings to compare and compile our initial coding, each researcher then independently recoded the three transcripts with the developed codebook. The researchers met again to triangulate perspectives and reach a consensus on the final codebook. Using multiple coders is a standard process to control for subjective bias that one coder could bring to the coding process.12 Following this meeting, the coders split into two teams of two (KJO, SF, and MMC, LO) to complete the coding of the remaining transcripts. Each team member independently coded the assigned transcripts and reconciled their codes with their counterpart; any discrepancies were resolved through discussion. Using this strategy, every transcript was coded by at least two team members. Our second coding cycle utilized pattern coding and involved identifying consistency both within and between transcripts; discovering associations between codes.10,11,13 Constant comparison was used to compare responses among all participants, as well as between sickle-cell and nonsickle-cell participants.13,14 Following team coding and reconciling, the analyses were presented to a broader research team for additional feedback and critique. All analyses were conducted using Dedoose version 8.0.35 (Los Angeles, California). Participant recruitment, interviews, and analysis of the transcripts continued until no new codes emerged and thematic saturation was achieved.
RESULTS
Participant Characteristics
Overall, we invited 34 patients to be interviewed; 26 consented and completed interviews (76.5%). Six (17.6%) patients declined participation, one (2.9%) was unable to complete the interview before hospital discharge, and one (2.9%) was excluded due to disorientation. Demographic characteristics of the 26 participants are shown in Table 1.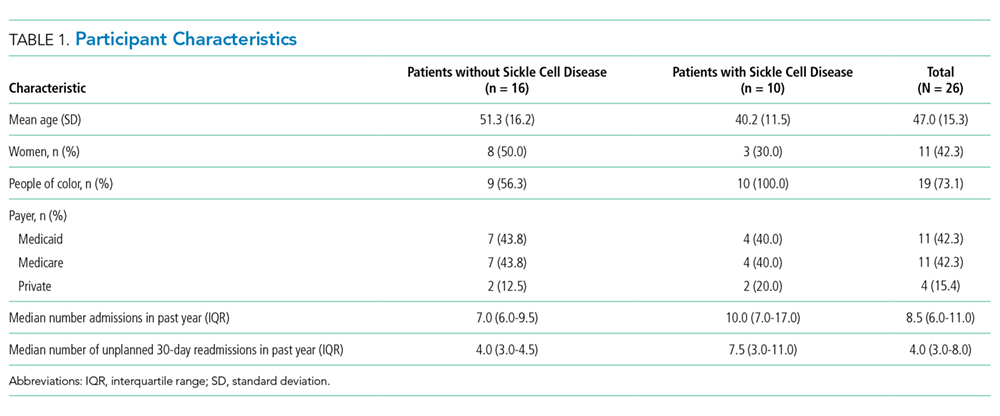
Four main themes emerged from our analysis. Table 2 summarizes these themes, subthemes, and provides representative quotes.
Major Medical Problem(s) are Universal, but High Hospital Use Varies in Onset
Not surprisingly, all participants described having at least one major medical problem. Some participants, such as those with genetic disorders, had experienced periods of high hospital use throughout their entire lifetime, while other participants experienced an onset of high hospital use as an adult after being previously healthy. Though most participants with genetic disorders had sickle cell anemia; one had a rare genetic disorder which caused chronic gastrointestinal symptoms. Participants typically described having a significant medical condition as well as other medical problems or complications from past surgery. Some participants described having a major medical problem which did not require frequent hospitalization until a complication or other medical problem arose, suggesting these new issues pushed them over a threshold beyond which self-management at home was less successful.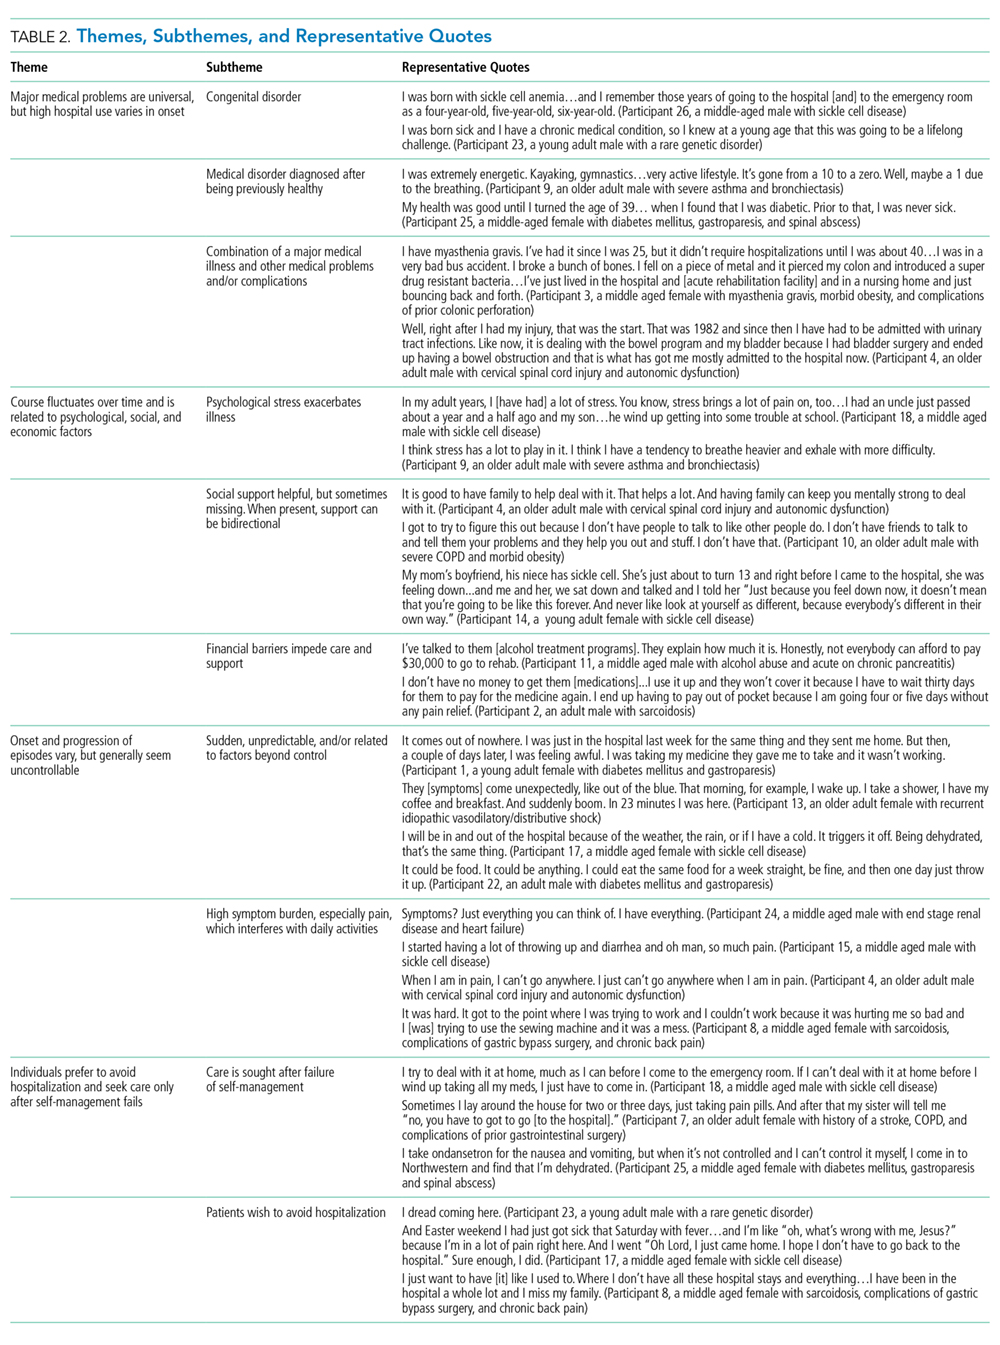
Course Fluctuates over Time and is Related to Psychological, Social, and Economic Factors
Participants identified psychological stress, social support, and financial constraints as factors which influence the course of their illness over time. Deaths in the family, breakups, and concerns about other family members were mentioned as specific forms of psychological stress and directly linked by participants to worsening of symptoms. Social support was present for most, but not all, participants, with no appreciable difference based on whether the participant had sickle cell disease. Social support was generally perceived as helpful, and several participants indicated a benefit to their own health when providing social support to others. Financial pressures also served as stressors and often impeded care due to lack of access to medications, other treatments, and housing.
Onset and Progression of Episodes Vary, but Generally Seem Uncontrollable
Regarding the onset of illness episodes, some participants described the sudden, unpredictable onset of symptoms, others described a more gradual onset which allowed them to attempt self-management. Regardless of the timing, episodes of illness were often perceived as spontaneous or triggered by factors outside of the participant’s control. Several participants, especially those with sickle cell disease, mentioned a relationship between their symptoms and the weather. Participants also noted the inconsistency in factors which may trigger an episode (ie, sometimes the factor exacerbated symptoms, while other times it did not). Participants also described having a high symptom burden with significant limitations in activities of daily living during episodes of illness. Pain was a very common component of symptoms regardless of whether or not the participant had sickle cell disease.
Individuals Seek Care after Self-Management Fails and Prefer to Avoid Hospitalization
Participants tried to control their symptoms with medications and typically sought care only when it was clear that this approach was not working, or they ran out of medications. This finding was consistent across both groups of participants (ie, those with and those without sickle cell disease). Many participants described very strong preferences not to come to the hospital; no participant described being in the hospital as a favorable or positive experience. Some participants mentioned that they had spent major holidays in the hospital and that they missed their family. No participant had a desire to come to the hospital.
DISCUSSION
In this study of frequently hospitalized patients, we found four major themes that illuminate patient perspectives about factors that contribute to high hospital use. While some of our findings corroborate those of previous studies, other emerging patterns were novel. Herein, we summarize key findings, provide context, and describe implications for the design of models of care for frequently hospitalized patients.
Similar to the findings of previous quantitative research, participants in our study described having a significant medical condition and typically had multiple medical conditions or complications.4-6 Importantly, some participants described having a major medical problem which did not require frequent hospitalization until another medical problem or complication arose. This finding suggests that there may be an opportunity to identify patients with significant medical problems who are at elevated risk before the onset of high hospital use. Early identification of these high-risk patients could allow for the provision of additional support to prevent potential complications or address other factors which may contribute to the need for frequent hospitalization.
Participants in our study directly linked psychological stress to fluctuations in their course of illness. Previous research by Mautner and colleagues queried participants about childhood experiences and early life stressors and reported that early life instabilities and traumas were prevalent among patients with high levels of emergency and hospital-based healthcare utilization.15 Our participants identified more recent traumatic events (eg, the death of a loved one and breakups) when reflecting on factors contributing to illness exacerbations; early life trauma did not emerge as an identified contributor. Of note, unlike Mautner et al., we did not ask participants to reflect on childhood determinants of disease and illness specifically. Our findings suggest that psychological stress contributes to illness exacerbation, even for those patients without other significant psychiatric conditions (eg, depressive disorder, schizophrenia). Incorporating mental health professionals into programs for this patient population may improve health by teaching specific coping strategies, including cognitive-behavioral therapy for an acute stress disorder.16,17
Social support was also a factor related to illness fluctuations over time. Notably, several participants indicated a benefit to their own health when providing social support to others, suggesting a role for peer support that may be reciprocally beneficial. This approach is supported by the literature. Williams and colleagues found that patients with sickle cell anemia experienced symptom improvement with peer support;18 while Johnson and colleagues recently reported a reduction in readmissions to acute care with the use of peer support for patients with severe mental illness.19
Financial constraints impeded care for some patients and served as a barrier to accessing medications, other treatments, and housing. Similar to the findings of prior quantitative research, our frequently hospitalized patients had a high proportion of patients with Medicaid and low proportion with private insurance, suggesting low socioeconomic status.9,20 We did not formally collect data on income or economic status. Interestingly, prior qualitative studies have not identified financial constraints as a major theme, though this may be explained by differences in study populations and the overall objectives of the studies.15,21 Importantly, the overwhelming majority of programs for frequently hospitalized patients identified in a recent systematic review included social workers.7 Our findings support the need to address financial constraints and the use of social workers in models of care for frequently hospitalized patients.
Many participants in our study felt that the factors contributing to exacerbations of illness were either inconsistent in their effect or out of their control. These findings have similarities to those from a qualitative study by Liu and colleagues in which they interviewed 20 “hospital-dependent” patients over 65 years of age.21 Though not explicitly focused on factors contributing to exacerbations, participants in their study felt that hospitalizations were generally inevitable. In our study, participants with sickle cell disease often identified changes in the weather as contributing to illness exacerbations. The relationship between weather and sickle cell disease remains incompletely understood, with an inconsistent association found in prior studies.22
Participants in our study strongly desired to avoid hospitalization and typically sought hospital care when symptoms could not be controlled at home. This finding is in contrast to that from the study by Liu and colleagues where they found that hospital-dependent patients over 65 years had favorable perspectives of hospitalization because they felt safer and more secure in the hospital.21 Our participants were younger than those from the study by Liu and colleagues, had a high symptom burden, and may have been more concerned about control of those symptoms than the risk for clinical deterioration. Programs should aim to strengthen their support of patients’ self-management efforts early in the episode of illness and potentially offer home visits or a day hospital to avoid hospitalization. A recent systematic review found evidence that alternatives to inpatient care (eg, hospital-at-home) for low risk medical patients can achieve comparable outcomes at lower costs.23 Similarly, some health systems have implemented day hospitals to treat low risk patients with uncomplicated sickle cell pain.24,25
The heavy symptom burden experienced by participants in our study is notable. Pain was especially common. Programs may wish to partner with palliative care and addiction specialists to balance symptom relief with the simultaneous need to address comorbid substance and opioid use disorders when they are present.4,9
Our study has several limitations. First, participants were recruited from the medicine service at a single academic hospital using criteria we developed to identify frequently hospitalized patients. Populations differ across hospitals and definitions of frequently hospitalized patients vary, limiting the generalizability of our findings. Second, we excluded patients whose preferred language was not English, as well as those disoriented to person, place, or time. It is possible that factors contributing to high hospital use differ for non-English speaking patients and those with cognitive deficits.
CONCLUSION
In this qualitative study, we identified factors associated with the onset and continuation of high hospital use. Emergent themes pointed to factors which influence patients’ onset of high hospital use, fluctuations in their illness over time, and triggers to seek care during an illness episode. These findings represent an important contribution to the literature because they allow patients’ perspectives to be incorporated into the design and adaptation of programs serving similar populations in other health systems. Programs that integrate patients’ perspectives into their design are likely to be better prepared to address patients’ needs and improve patient outcomes.
Acknowledgments
The authors thank the participants for their time and willingness to share their stories. The authors also thank Claire A. Knoten PhD and Erin Lambers PhD, former research team members who helped in the initial stages of the study.
Disclosures
The authors have nothing to disclose.
Funding
This project was funded by Northwestern Memorial Hospital and the Northwestern Medical Group.
1. Centers for Medicare & Medicaid Services. Readmissions Reduction Program. http://www.cms.gov/Medicare/Medicare-Fee-for-Service-Payment/AcuteInpatientPPS/Readmissions-Reduction-Program.html. Accessed September 17, 2018.
2. Wasfy JH, Zigler CM, Choirat C, Wang Y, Dominici F, Yeh RW. Readmission rates after passage of the hospital readmissions reduction program: a pre-post analysis. Ann Intern Med. 2016;166(5):324-331. https://doi.org/10.7326/m16-0185.
3. Blumenthal D, Chernof B, Fulmer T, Lumpkin J, Selberg J. Caring for high-need, high-cost patients-an urgent priority. N Engl J Med. 2016;375(10):909-911. https://doi.org/10.1056/nejmp1608511.
4. Szekendi MK, Williams MV, Carrier D, Hensley L, Thomas S, Cerese J. The characteristics of patients frequently admitted to academic medical centers in the United States. J Hosp Med. 2015;10(9):563-568. https://doi.org/10.1002/jhm.2375.
5. Dastidar JG, Jiang M. Characterization, categorization, and 5-year mortality of medicine high utilizer inpatients. J Palliat Care. 2018;33(3):167-174. https://doi.org/10.1177/0825859718769095.
6. Mudge AM, Kasper K, Clair A, et al. Recurrent readmissions in medical patients: a prospective study. J Hosp Med. 2010;6(2):61-67. https://doi.org/10.1002/jhm.811.
7. Goodwin A, Henschen BL, Odwyer LC, Nichols N, Oleary KJ. Interventions for frequently hospitalized patients and their effect on outcomes: a systematic review. J Hosp Med. 2018;13(12):853-859. https://doi.org/10.12788/jhm.3090.
8. Gelberg L, Andersen RM, Leake BD. The behavioral model for vulnerable populations: application to medical care use and outcomes for homeless people. Health Serv Res. 2000;34(6):1273-1302. PubMed
9. Rinehart DJ, Oronce C, Durfee MJ, et al. Identifying subgroups of adult superutilizers in an urban safety-net system using latent class analysis. Med Care. 2018;56(1):e1-e9. https://doi.org/10.1097/mlr.0000000000000628.
10. Miles MB, Huberman M, Saldana J. Qualitative Data Analysis. 3rd ed. Thousand Oaks, California: SAGE Publications; 2014.
11. Saldana J. The Coding Manual for Qualitative Researchers. Thousand Oaks, California: SAGE publications; 2013.
12. Lincoln YS, Guba EG. Naturalistic Inquiry. 1 ed. Beverly Hills, California: SAGE Publications; 1985.
13. Kolb SM. Grounded theory and the constant comparative method: valid research strategies for educators. J Emerging Trends Educ Res Policy Stud. 2012;3(1):83-86.
14. Glasser BG, Strauss AL. The Discovery of Grounded Theory: Strategies for Qualitative Research. New York: Taylor and Francis Group; 2017.
15. Mautner DB, Pang H, Brenner JC, et al. Generating hypotheses about care needs of high utilizers: lessons from patient interviews. Popul Health Manag. 2013;16(Suppl 1):S26-S33. https://doi.org/10.1089/pop.2013.0033.
16. Carpenter JK, Andrews LA, Witcraft SM, Powers MB, Smits JAJ, Hofmann SG. Cognitive behavioral therapy for anxiety and related disorders: a meta-analysis of randomized placebo-controlled trials. Depres Anxiety. 2018;35(6):502-514. https://doi.org/10.1002/da.22728.
17. Roberts NP, Kitchiner NJ, Kenardy J, Bisson JI. Systematic review and meta-analysis of multiple-session early interventions following traumatic events. Am J Psychiatry. 2009;166(3):293-301. https://doi.org/10.1176/appi.ajp.2008.08040590.
18. Williams H, Tanabe P. Sickle cell disease: a review of nonpharmacological approaches for pain. J Pain Symptom Manag. 2016;51(2):163-177. doi: 10.1016/j.jpainsymman.2015.10.017.
19. Johnson S, Lamb D, Marston L, et al. Peer-supported self-management for people discharged from a mental health crisis team: a randomised controlled trial. Lancet. 2018;392(10145):409-418.https://doi.org/10.1016/s0140-6736(18)31470-3.
20. Mercer T, Bae J, Kipnes J, Velazquez M, Thomas S, Setji N. The highest utilizers of care: individualized care plans to coordinate care, improve healthcare service utilization, and reduce costs at an academic tertiary care center. J Hosp Med. 2015;10(7):419-424. https://doi.org/10.1002/jhm.2351.
21. Liu T, Kiwak E, Tinetti ME. Perceptions of hospital-dependent patients on their needs for hospitalization. J Hosp Med. 2017;12(6):450-453. https://doi.org/10.12788/jhm.2756.
22. Piel FB, Steinberg MH, Rees DC. Sickle cell disease. N Engl J Med. 2017;376(16):1561-1573. https://doi.org/10.1056/nejmra1510865.
23. Conley J, O’Brien CW, Leff BA, Bolen S, Zulman D. Alternative strategies to inpatient hospitalization for acute medical conditions: a systematic review. JAMA Intern Med. 2016;176(11):1693-1702. https://doi.org/10.1001/jamainternmed.2016.5974.
24. Adewoye AH, Nolan V, McMahon L, Ma Q, Steinberg MH. Effectiveness of a dedicated day hospital for management of acute sickle cell pain. Haematologica. 2007;92(6):854-855. https://doi.org/10.3324/haematol.10757.
25. Benjamin LJ, Swinson GI, Nagel RL. Sickle cell anemia day hospital: an approach for the management of uncomplicated painful crises. Blood. 2000;95(4):1130-1136. PubMed
In recent years, hospitals have made considerable efforts to improve transitions of care, in part due to financial incentives from the Medicare Hospital Readmission Reduction Program (HRRP).1 Initially focusing on three medical conditions, the HRRP has been associated with significant reductions in readmission rates.2 Importantly, a small proportion of patients accounts for a very large proportion of hospital readmissions and hospital use.3,4 Frequently hospitalized patients often have multiple chronic conditions and unique needs which may not be met by conventional approaches to healthcare delivery, including those influenced by the HRRP.4-6 In light of this challenge, some hospitals have developed programs specifically focused on frequently hospitalized patients. A recent systematic review of these programs found relatively few studies of high quality, providing only limited insight in designing interventions to support this population.7 Moreover, no studies appear to have incorporated the patients’ perspectives into the design or adaptation of the model. Members of our research team developed and implemented the Complex High Admission Management Program (CHAMP) in January 2016 to address the needs of frequently hospitalized patients in our hospital. To enhance CHAMP and inform the design of programs serving similar populations in other health systems, we sought to identify factors associated with the onset and continuation of high hospital use. Our research question was, from the patients’ perspective, what factors contribute to patients’ becoming and continuing to be high users of hospital care.
METHODS
Setting, Study Design, and Participants
This qualitative study took place at Northwestern Memorial Hospital (NMH), an 894-bed urban academic hospital located in Chicago, Illinois. Between December 2016 and September 2017, we recruited adult patients admitted to the general medicine services. Eligible participants were identified with the assistance of a daily Northwestern Medicine Electronic Data Warehouse (EDW) search and included patients with two unplanned 30-day inpatient readmissions to NMH within the prior 12 months, in addition to one or more of the following criteria: (1) at least one readmission in the last six months; (2) a referral from one of the patient’s medical providers; or (3) at least three observation visits. We excluded patients whose preferred language was not English and those disoriented to person, place, or time. Considering NMH data showing that approximately one-third of high-utilizer patients have sickle cell disease, we used purposive sampling with the goal to compare findings within and between two groups of participants; those with and those without sickle cell disease. Our study was deemed exempt by the Northwestern University Institutional Review Board.
Participant Enrollment and Data Collection
We created an interview guide based on the research team’s experience with this population, a literature review, and our research question (See Appendix).8,9 A research coordinator approached eligible participants during their hospital stay. The coordinator explained the study to eligible participants and obtained verbal consent for participation. The research coordinator then conducted one-on-one semi-structured interviews. Interviews were audio recorded for subsequent transcription and coding. Each interview lasted approximately 45 minutes. Participants were compensated with a $20 gift card for their time.
Analysis
Digital audio recordings from interviews were transcribed verbatim, deidentified, and analyzed using an iterative inductive team-based approach to coding.10 In our first cycle coding, all coders (KJO, SF, MMC, LO, KAC) independently reviewed and coded three transcripts using descriptive coding and subcoding to generate a preliminary codebook with code definitions.10,11 Following the meetings to compare and compile our initial coding, each researcher then independently recoded the three transcripts with the developed codebook. The researchers met again to triangulate perspectives and reach a consensus on the final codebook. Using multiple coders is a standard process to control for subjective bias that one coder could bring to the coding process.12 Following this meeting, the coders split into two teams of two (KJO, SF, and MMC, LO) to complete the coding of the remaining transcripts. Each team member independently coded the assigned transcripts and reconciled their codes with their counterpart; any discrepancies were resolved through discussion. Using this strategy, every transcript was coded by at least two team members. Our second coding cycle utilized pattern coding and involved identifying consistency both within and between transcripts; discovering associations between codes.10,11,13 Constant comparison was used to compare responses among all participants, as well as between sickle-cell and nonsickle-cell participants.13,14 Following team coding and reconciling, the analyses were presented to a broader research team for additional feedback and critique. All analyses were conducted using Dedoose version 8.0.35 (Los Angeles, California). Participant recruitment, interviews, and analysis of the transcripts continued until no new codes emerged and thematic saturation was achieved.
RESULTS
Participant Characteristics
Overall, we invited 34 patients to be interviewed; 26 consented and completed interviews (76.5%). Six (17.6%) patients declined participation, one (2.9%) was unable to complete the interview before hospital discharge, and one (2.9%) was excluded due to disorientation. Demographic characteristics of the 26 participants are shown in Table 1.
Four main themes emerged from our analysis. Table 2 summarizes these themes, subthemes, and provides representative quotes.
Major Medical Problem(s) are Universal, but High Hospital Use Varies in Onset
Not surprisingly, all participants described having at least one major medical problem. Some participants, such as those with genetic disorders, had experienced periods of high hospital use throughout their entire lifetime, while other participants experienced an onset of high hospital use as an adult after being previously healthy. Though most participants with genetic disorders had sickle cell anemia; one had a rare genetic disorder which caused chronic gastrointestinal symptoms. Participants typically described having a significant medical condition as well as other medical problems or complications from past surgery. Some participants described having a major medical problem which did not require frequent hospitalization until a complication or other medical problem arose, suggesting these new issues pushed them over a threshold beyond which self-management at home was less successful.
Course Fluctuates over Time and is Related to Psychological, Social, and Economic Factors
Participants identified psychological stress, social support, and financial constraints as factors which influence the course of their illness over time. Deaths in the family, breakups, and concerns about other family members were mentioned as specific forms of psychological stress and directly linked by participants to worsening of symptoms. Social support was present for most, but not all, participants, with no appreciable difference based on whether the participant had sickle cell disease. Social support was generally perceived as helpful, and several participants indicated a benefit to their own health when providing social support to others. Financial pressures also served as stressors and often impeded care due to lack of access to medications, other treatments, and housing.
Onset and Progression of Episodes Vary, but Generally Seem Uncontrollable
Regarding the onset of illness episodes, some participants described the sudden, unpredictable onset of symptoms, others described a more gradual onset which allowed them to attempt self-management. Regardless of the timing, episodes of illness were often perceived as spontaneous or triggered by factors outside of the participant’s control. Several participants, especially those with sickle cell disease, mentioned a relationship between their symptoms and the weather. Participants also noted the inconsistency in factors which may trigger an episode (ie, sometimes the factor exacerbated symptoms, while other times it did not). Participants also described having a high symptom burden with significant limitations in activities of daily living during episodes of illness. Pain was a very common component of symptoms regardless of whether or not the participant had sickle cell disease.
Individuals Seek Care after Self-Management Fails and Prefer to Avoid Hospitalization
Participants tried to control their symptoms with medications and typically sought care only when it was clear that this approach was not working, or they ran out of medications. This finding was consistent across both groups of participants (ie, those with and those without sickle cell disease). Many participants described very strong preferences not to come to the hospital; no participant described being in the hospital as a favorable or positive experience. Some participants mentioned that they had spent major holidays in the hospital and that they missed their family. No participant had a desire to come to the hospital.
DISCUSSION
In this study of frequently hospitalized patients, we found four major themes that illuminate patient perspectives about factors that contribute to high hospital use. While some of our findings corroborate those of previous studies, other emerging patterns were novel. Herein, we summarize key findings, provide context, and describe implications for the design of models of care for frequently hospitalized patients.
Similar to the findings of previous quantitative research, participants in our study described having a significant medical condition and typically had multiple medical conditions or complications.4-6 Importantly, some participants described having a major medical problem which did not require frequent hospitalization until another medical problem or complication arose. This finding suggests that there may be an opportunity to identify patients with significant medical problems who are at elevated risk before the onset of high hospital use. Early identification of these high-risk patients could allow for the provision of additional support to prevent potential complications or address other factors which may contribute to the need for frequent hospitalization.
Participants in our study directly linked psychological stress to fluctuations in their course of illness. Previous research by Mautner and colleagues queried participants about childhood experiences and early life stressors and reported that early life instabilities and traumas were prevalent among patients with high levels of emergency and hospital-based healthcare utilization.15 Our participants identified more recent traumatic events (eg, the death of a loved one and breakups) when reflecting on factors contributing to illness exacerbations; early life trauma did not emerge as an identified contributor. Of note, unlike Mautner et al., we did not ask participants to reflect on childhood determinants of disease and illness specifically. Our findings suggest that psychological stress contributes to illness exacerbation, even for those patients without other significant psychiatric conditions (eg, depressive disorder, schizophrenia). Incorporating mental health professionals into programs for this patient population may improve health by teaching specific coping strategies, including cognitive-behavioral therapy for an acute stress disorder.16,17
Social support was also a factor related to illness fluctuations over time. Notably, several participants indicated a benefit to their own health when providing social support to others, suggesting a role for peer support that may be reciprocally beneficial. This approach is supported by the literature. Williams and colleagues found that patients with sickle cell anemia experienced symptom improvement with peer support;18 while Johnson and colleagues recently reported a reduction in readmissions to acute care with the use of peer support for patients with severe mental illness.19
Financial constraints impeded care for some patients and served as a barrier to accessing medications, other treatments, and housing. Similar to the findings of prior quantitative research, our frequently hospitalized patients had a high proportion of patients with Medicaid and low proportion with private insurance, suggesting low socioeconomic status.9,20 We did not formally collect data on income or economic status. Interestingly, prior qualitative studies have not identified financial constraints as a major theme, though this may be explained by differences in study populations and the overall objectives of the studies.15,21 Importantly, the overwhelming majority of programs for frequently hospitalized patients identified in a recent systematic review included social workers.7 Our findings support the need to address financial constraints and the use of social workers in models of care for frequently hospitalized patients.
Many participants in our study felt that the factors contributing to exacerbations of illness were either inconsistent in their effect or out of their control. These findings have similarities to those from a qualitative study by Liu and colleagues in which they interviewed 20 “hospital-dependent” patients over 65 years of age.21 Though not explicitly focused on factors contributing to exacerbations, participants in their study felt that hospitalizations were generally inevitable. In our study, participants with sickle cell disease often identified changes in the weather as contributing to illness exacerbations. The relationship between weather and sickle cell disease remains incompletely understood, with an inconsistent association found in prior studies.22
Participants in our study strongly desired to avoid hospitalization and typically sought hospital care when symptoms could not be controlled at home. This finding is in contrast to that from the study by Liu and colleagues where they found that hospital-dependent patients over 65 years had favorable perspectives of hospitalization because they felt safer and more secure in the hospital.21 Our participants were younger than those from the study by Liu and colleagues, had a high symptom burden, and may have been more concerned about control of those symptoms than the risk for clinical deterioration. Programs should aim to strengthen their support of patients’ self-management efforts early in the episode of illness and potentially offer home visits or a day hospital to avoid hospitalization. A recent systematic review found evidence that alternatives to inpatient care (eg, hospital-at-home) for low risk medical patients can achieve comparable outcomes at lower costs.23 Similarly, some health systems have implemented day hospitals to treat low risk patients with uncomplicated sickle cell pain.24,25
The heavy symptom burden experienced by participants in our study is notable. Pain was especially common. Programs may wish to partner with palliative care and addiction specialists to balance symptom relief with the simultaneous need to address comorbid substance and opioid use disorders when they are present.4,9
Our study has several limitations. First, participants were recruited from the medicine service at a single academic hospital using criteria we developed to identify frequently hospitalized patients. Populations differ across hospitals and definitions of frequently hospitalized patients vary, limiting the generalizability of our findings. Second, we excluded patients whose preferred language was not English, as well as those disoriented to person, place, or time. It is possible that factors contributing to high hospital use differ for non-English speaking patients and those with cognitive deficits.
CONCLUSION
In this qualitative study, we identified factors associated with the onset and continuation of high hospital use. Emergent themes pointed to factors which influence patients’ onset of high hospital use, fluctuations in their illness over time, and triggers to seek care during an illness episode. These findings represent an important contribution to the literature because they allow patients’ perspectives to be incorporated into the design and adaptation of programs serving similar populations in other health systems. Programs that integrate patients’ perspectives into their design are likely to be better prepared to address patients’ needs and improve patient outcomes.
Acknowledgments
The authors thank the participants for their time and willingness to share their stories. The authors also thank Claire A. Knoten PhD and Erin Lambers PhD, former research team members who helped in the initial stages of the study.
Disclosures
The authors have nothing to disclose.
Funding
This project was funded by Northwestern Memorial Hospital and the Northwestern Medical Group.
1. Centers for Medicare & Medicaid Services. Readmissions Reduction Program. http://www.cms.gov/Medicare/Medicare-Fee-for-Service-Payment/AcuteInpatientPPS/Readmissions-Reduction-Program.html. Accessed September 17, 2018.
2. Wasfy JH, Zigler CM, Choirat C, Wang Y, Dominici F, Yeh RW. Readmission rates after passage of the hospital readmissions reduction program: a pre-post analysis. Ann Intern Med. 2016;166(5):324-331. https://doi.org/10.7326/m16-0185.
3. Blumenthal D, Chernof B, Fulmer T, Lumpkin J, Selberg J. Caring for high-need, high-cost patients-an urgent priority. N Engl J Med. 2016;375(10):909-911. https://doi.org/10.1056/nejmp1608511.
4. Szekendi MK, Williams MV, Carrier D, Hensley L, Thomas S, Cerese J. The characteristics of patients frequently admitted to academic medical centers in the United States. J Hosp Med. 2015;10(9):563-568. https://doi.org/10.1002/jhm.2375.
5. Dastidar JG, Jiang M. Characterization, categorization, and 5-year mortality of medicine high utilizer inpatients. J Palliat Care. 2018;33(3):167-174. https://doi.org/10.1177/0825859718769095.
6. Mudge AM, Kasper K, Clair A, et al. Recurrent readmissions in medical patients: a prospective study. J Hosp Med. 2010;6(2):61-67. https://doi.org/10.1002/jhm.811.
7. Goodwin A, Henschen BL, Odwyer LC, Nichols N, Oleary KJ. Interventions for frequently hospitalized patients and their effect on outcomes: a systematic review. J Hosp Med. 2018;13(12):853-859. https://doi.org/10.12788/jhm.3090.
8. Gelberg L, Andersen RM, Leake BD. The behavioral model for vulnerable populations: application to medical care use and outcomes for homeless people. Health Serv Res. 2000;34(6):1273-1302. PubMed
9. Rinehart DJ, Oronce C, Durfee MJ, et al. Identifying subgroups of adult superutilizers in an urban safety-net system using latent class analysis. Med Care. 2018;56(1):e1-e9. https://doi.org/10.1097/mlr.0000000000000628.
10. Miles MB, Huberman M, Saldana J. Qualitative Data Analysis. 3rd ed. Thousand Oaks, California: SAGE Publications; 2014.
11. Saldana J. The Coding Manual for Qualitative Researchers. Thousand Oaks, California: SAGE publications; 2013.
12. Lincoln YS, Guba EG. Naturalistic Inquiry. 1 ed. Beverly Hills, California: SAGE Publications; 1985.
13. Kolb SM. Grounded theory and the constant comparative method: valid research strategies for educators. J Emerging Trends Educ Res Policy Stud. 2012;3(1):83-86.
14. Glasser BG, Strauss AL. The Discovery of Grounded Theory: Strategies for Qualitative Research. New York: Taylor and Francis Group; 2017.
15. Mautner DB, Pang H, Brenner JC, et al. Generating hypotheses about care needs of high utilizers: lessons from patient interviews. Popul Health Manag. 2013;16(Suppl 1):S26-S33. https://doi.org/10.1089/pop.2013.0033.
16. Carpenter JK, Andrews LA, Witcraft SM, Powers MB, Smits JAJ, Hofmann SG. Cognitive behavioral therapy for anxiety and related disorders: a meta-analysis of randomized placebo-controlled trials. Depres Anxiety. 2018;35(6):502-514. https://doi.org/10.1002/da.22728.
17. Roberts NP, Kitchiner NJ, Kenardy J, Bisson JI. Systematic review and meta-analysis of multiple-session early interventions following traumatic events. Am J Psychiatry. 2009;166(3):293-301. https://doi.org/10.1176/appi.ajp.2008.08040590.
18. Williams H, Tanabe P. Sickle cell disease: a review of nonpharmacological approaches for pain. J Pain Symptom Manag. 2016;51(2):163-177. doi: 10.1016/j.jpainsymman.2015.10.017.
19. Johnson S, Lamb D, Marston L, et al. Peer-supported self-management for people discharged from a mental health crisis team: a randomised controlled trial. Lancet. 2018;392(10145):409-418.https://doi.org/10.1016/s0140-6736(18)31470-3.
20. Mercer T, Bae J, Kipnes J, Velazquez M, Thomas S, Setji N. The highest utilizers of care: individualized care plans to coordinate care, improve healthcare service utilization, and reduce costs at an academic tertiary care center. J Hosp Med. 2015;10(7):419-424. https://doi.org/10.1002/jhm.2351.
21. Liu T, Kiwak E, Tinetti ME. Perceptions of hospital-dependent patients on their needs for hospitalization. J Hosp Med. 2017;12(6):450-453. https://doi.org/10.12788/jhm.2756.
22. Piel FB, Steinberg MH, Rees DC. Sickle cell disease. N Engl J Med. 2017;376(16):1561-1573. https://doi.org/10.1056/nejmra1510865.
23. Conley J, O’Brien CW, Leff BA, Bolen S, Zulman D. Alternative strategies to inpatient hospitalization for acute medical conditions: a systematic review. JAMA Intern Med. 2016;176(11):1693-1702. https://doi.org/10.1001/jamainternmed.2016.5974.
24. Adewoye AH, Nolan V, McMahon L, Ma Q, Steinberg MH. Effectiveness of a dedicated day hospital for management of acute sickle cell pain. Haematologica. 2007;92(6):854-855. https://doi.org/10.3324/haematol.10757.
25. Benjamin LJ, Swinson GI, Nagel RL. Sickle cell anemia day hospital: an approach for the management of uncomplicated painful crises. Blood. 2000;95(4):1130-1136. PubMed
© 2019 Society of Hospital Medicine
Frequency of Ethical Issues on a Hospitalist Teaching Service at an Urban, Tertiary Care Center
Much has been written about the sources of the hidden curriculum in clerkships and postgraduate medical education.1-3 However, these descriptions do not adequately account for the critical role that hospitalists play in the development of trainees when they encounter ethical challenges on teaching services.4 As a role model, teacher, and the attending of record, a hospitalist’s response to ethical issues in practice can have a pivotal influence on the life and work of trainees, either instilling positive virtues or perpetuating the negative impact of the hidden curriculum.5-8 Understanding the epidemiology of ethical issues arising on academic hospitalist services has important implications for medical education, clinical ethics, and professionalism, as well as for patient care.
METHODS
Study Setting and Design
We conducted a mixed-method observational study at NewYork–Presbyterian–Weill Cornell Medical Center, an 862-bed, tertiary-care, academic institution located in New York, New York. We performed a prospective description of the frequency of all consecutively identified ethical and contextual issues pertinent to clinical decision-making by observing morning rounds with housestaff hospitalist services. Ethical issues were categorized using a comprehensive standardized instrument previously developed and published by the Division of Medical Ethics.9
The Division of Hospital Medicine employs 79 physicians, 30 of whom are dedicated full-time to daytime care on house-staff (or teaching) or physician assistant services. Of these 30 physicians, two (7%) were coinvestigators in this project and were excluded from participation to avoid bias. Between September 2017 and May 2018, the attending physicians of record of all available housestaff services were invited to participate with their teams in our research study on a weekly basis. We observed 10 different Hospital Medicine attending physicians (10/28, 36% of the available physician sample) over 19 sessions. Before rounds, a brief introduction to the nature of the study was provided to each team. It was explicitly stated that the observers were present to identify and document possible ethical issues that may arise while discussing the patients on rounds, and that the purpose of the study was neither an evaluation of the team members or their decisions nor a critique or quality improvement exercise. Observing researchers were not allowed to participate in the discussion of any case.
To avoid potential case duplication, we allowed for a minimum two-week interval before rounding twice on any particular team. To control for interobserver variability, we observed in pairs during these sessions. Discrepancies between observers were resolved by post hoc discussion and application of the definitions of the standardized instrument used to identify and catalog ethical and contextual issues.
Study Variables and Definitions
The following variables were collected in all cases: observation date, name of reviewers, demographic characteristics of the patient (age, gender, race, ethnicity, marital status, religion, preferred language, insurance type, and living situation before the admission), patient’s location during the admission (emergency room, regular nursing floor, step-down unit, or other), and ethical and contextual issues. “Ethical issues” were defined as those situations involving a conflict of values or preferences among different stakeholders, including, but not limited to, providers, patients, and/or families. Explicit definitions of each issue were generated, and additional standard rules for completion were provided.
Statistical Analysis
Results are presented as n (%) or mean ± standard deviation. Percentages were rounded to the closest integer. Interobserver variability between the observers in relation to evaluating the presence or absence of ethical or contextual issues was assessed by the kappa statistic. All P values are two-sided, with statistical significance evaluated at the 0.05 alpha level. A 95% confidence interval (95% CI) for the kappa statistic (ie, for assessing interobserver variability) was calculated to assess the precision of the obtained kappa estimate. All analyses were performed in SAS Version 9.4 (SAS Institute, Inc., Cary, NC) and Stata Version 14.0 (StataCorp, College Station, TX).
RESULTS
General Characteristics of the Study Sample
In total, 270 patients were evaluated from the teaching hospitalist services during the observation period. Ethical issues were identified in 86 of these patients (31.8%). Observer ethicists disagreed in their initial evaluation of 17 cases (6.3%). After review of and adjudication, both observers agreed that nine of these 17 cases (3.3%) should be excluded from the final analysis, as none reached the necessary threshold to be considered as a true ethical issue. Hence, we report the results of 77 patients (28.5%). These cases comprised the Hospitalist group and involved 113 ethical issues (1.48 ± 0.5 ethical issues/case). Only five patients in the Hospitalist group had a formal clinical ethics consult before our observation (5/270 patients [1.9%] vs 77/270 patients [28.5%] with an ethical issue, respectively, P < .001). Although the majority of ethical issues were noted by members of the primary team (84%), 12 of the 77 cases in the Hospitalist group (16%) were identified only by the observing ethicists. The kappa statistic for interobserver variability between the observing ethicists was 0.85 (95% CI = 0.76-0.92). The major demographic characteristics are summarized in Table 1.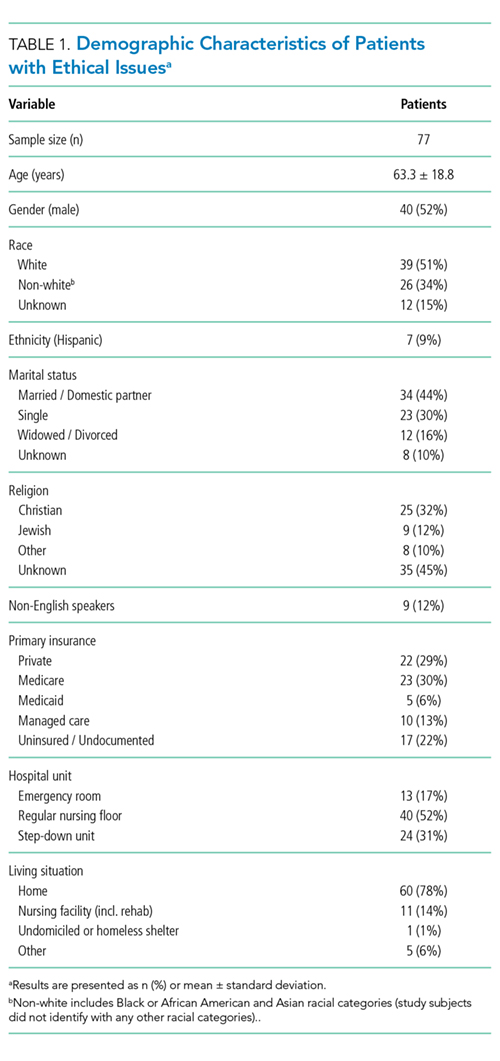
Ethical Challenges
The most common ethical issues hospitalists encountered involved discussions about goals of care (including decisions to pursue aggressive treatment versus hospice care, or debates about the team’s ambivalence about the benefits and risks of pursuing investigational chemotherapy), treatment refusals (including the decision to forgo biopsy of a suspected malignancy), or decision-making capacity (Table 2). Less common were issues pertaining to resource allocation (specially related to pressures to discharge patients), pain management (some patients were suspected of drug-seeking behavior), or surrogate decision-making (when alternative decision-makers were suspected to lack decision-making capacity). Discussions about forgoing life-sustaining treatments occurred only in four cases (5%). These involved considerations of withdrawing Bilevel Positive Airway Pressure (BiPAP), artificial nutrition and hydration, and/or stopping antibiotic treatment.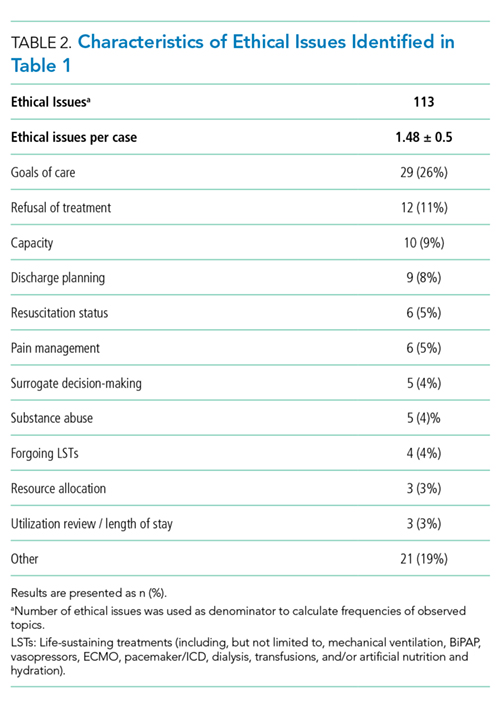
DISCUSSION
Our data are the first prospective description of ethical issues arising on an academic hospitalist teaching service. These results indicate that there is an ethics epidemiology in the routine practice of Hospital Medicine that has heretofore not been characterized. By this, we mean a discreet incidence and prevalence of ethical challenges in Hospital Medicine that is distinct from that which is encountered by clinical ethics consultation (CEC) services. Although most practitioners recognize the utility of a traditional ethics consultation, there is a surprising paucity of data about the sources of ethical conflict encountered by academic hospitalists at the bedside, particularly those addressed without CEC. This suggests that the criteria for requesting a formal ethics consult could be limited and restrictive, which is both undersensitive and overspecific.10 Because of these limitations, viewing traditional ethics consultation as a proxy for ethical issues arising in daily hospitalist practice would lead to an underestimation of the true prevalence, as our data indicate.
More than one-fourth of the patients admitted to hospitalist teaching services pose ethical conflicts. Some of these are addressed on rounds, some are not, and only a handful of these cases will ever be referred to an ethicist. CEC services are made aware of the “tip of the iceberg,” which accounts for a vanishingly small percentage of ethical issues that arise on daily rounds. Some hospitalists may not involve CEC simply because they believe that the services are not helpful. However, the failure to obtain consultation may also reflect an inability to recognize a “problematic situation” and formulate a referral that might benefit from the assistance of an ethics consultation.11
Our study faces several potential limitations. We are presenting a single-center experience that focuses on the perspective of physicians and trainees. Some ethical issues might have been underestimated because the perspectives of patients, families, nurses, social workers, or other ancillary staff were not directly included. Furthermore, since any ethical challenge could have been discussed on any moment other than on morning rounds, our results may underestimate the prevalence of ethical issues arising from the hospital floors. Moreover, medical teams participating in the study could have been subject to the Hawthorne effect and could have tried to identify a greater number of ethical issues on rounds, which would not reflect actual practice.
CONCLUSION
Almost two decades ago, Coulehan and Williams wrote about the positive impact that ethics and humanities could have if these disciplines could be embedded in the daily practice of medicine, which is as follows:
…ethics and humanities curricula are irrelevant unless they can produce a substantive and continuing impact on hospital culture (…) The idea, of course, is to infiltrate the culture by coopting residents and attending physicians(…) If an ethics program can somehow achieve a critical mass of ‘‘value-sensitive’’ clinical faculty, it may begin to influence the institution’s ethos.12
Coulehan and Williams wrote of a need to bring ethics to the bedside. Our data suggest that an ethics epidemiology is deeply embedded in hospitalist services and is waiting to be fully characterized to better inform the care of patients and guide the professional formation and education of students and trainees. Hospitalists frequently confront ethical problems in daily practice that do not come to the attention of the CEC services or the institutional ethics committee. Understanding this emerging epidemiology presents an unrealized opportunity to improve bedside teaching, reinforce normative reasoning, and enhance patient care.
Acknowledgments
The authors want to acknowledge Drs. Augustine I. Choi, Michael G. Stewart, Laura L. Forese, and Anthony Hollenberg for their support of the fellowship in medical ethics and thank Drs. Arthur T. Evans and Monika M. Safford for their guidance.
Disclosures
The authors report no conflicts of interest.
Funding
This work was supported by a Weill Cornell General Internal Medicine Primary Care Innovations Initiative seed grant. Dr. Paul Christos was partially supported by the following grant: Clinical and Translational Science Center at Weill Cornell Medical College (1-UL1-TR002384-01).
1. Doja A, Bould MD, Clarkin C, Eady K, Sutherland S, Writer H. The hidden and informal curriculum across the continuum of training: a cross-sectional qualitative study. Med Teach. 2016;38(4):410-418. doi: 10.3109/0142159X.2015.1073241. PubMed
2. Martimianakis MA, Hafferty FW. Exploring the interstitial space between the ideal and the practised: humanism and the hidden curriculum of system reform. Med Educ. 2016;50(3):278-280. doi: 10.1111/medu.12982. PubMed
3. Lawrence C, Mhlaba T, Stewart KA, Moletsane R, Gaede B, Moshabela M. The hidden curricula of medical education: a scoping review. Acad Med. 2017;93(4):648-656. doi: 10.1097/ACM.0000000000002004. PubMed
4. McCarthy MW, Real de Asua D, Fins JJ. The rise of hospitalists: an opportunity for clinical ethics. J Clin Ethics. 2017;28(4):325-332. PubMed
5. McCarthy M, Fins J. Teaching clinical ethics at the bedside: William Osler and the essential role of the hospitalist. AMA J Ethics. 2017;19(6):528-532. doi: 10.1001/journalofethics.2017.19.6.peer2-1706. PubMed
6. Gabbay E, McCarthy MW, Fins JJ. The care of the ultra-orthodox Jewish patient. J Relig Health. 2017;56(2):545-560. doi: 10.1007/s10943-017-0356-6. PubMed
7. Wachter RM, Goldman L. The emerging role of “hospitalists” in the American health care system. N Engl J Med. 1996;335(7):514-517. doi: 10.1056/NEJM199608153350713. PubMed
8. Hauer KE, Wachter RM, McCulloch CE, Woo GA, Auerbach AD. Effects of hospitalist attending physicians on trainee satisfaction with teaching and with internal medicine rotations. Arch Intern Med. 2004;164(17):1866-1871. doi: 10.1001/archinte.164.17.1866. PubMed
9. Nilson EG, Acres CA, Tamerin NG, Fins JJ. Clinical ethics and the quality initiative: a pilot study for the empirical evaluation of ethics case consultation. Am J Med Qual. 2008;23(5):356-364. doi: 10.1177/1062860608316729. PubMed
10. Hurst SA, Reiter-Theil S, Perrier A, et al. Physicians’ access to ethics support services in four European countries. Health Care Anal. 2007;15(4):321-335. doi: 10.1007/s10728-007-0072-6. PubMed
11. Fins JJ, Bacchetta MD, Miller FG. Clinical pragmatism: a method of moral problem solving. Kennedy Inst Ethics J. 1997;7(2):129-145. doi: 10.1353/ken.1997.0013. PubMed
12. Coulehan J, Williams PC. Vanquishing virtue: the impact of medical education. Acad Med. 2001;76(6):598-605. PubMed
Much has been written about the sources of the hidden curriculum in clerkships and postgraduate medical education.1-3 However, these descriptions do not adequately account for the critical role that hospitalists play in the development of trainees when they encounter ethical challenges on teaching services.4 As a role model, teacher, and the attending of record, a hospitalist’s response to ethical issues in practice can have a pivotal influence on the life and work of trainees, either instilling positive virtues or perpetuating the negative impact of the hidden curriculum.5-8 Understanding the epidemiology of ethical issues arising on academic hospitalist services has important implications for medical education, clinical ethics, and professionalism, as well as for patient care.
METHODS
Study Setting and Design
We conducted a mixed-method observational study at NewYork–Presbyterian–Weill Cornell Medical Center, an 862-bed, tertiary-care, academic institution located in New York, New York. We performed a prospective description of the frequency of all consecutively identified ethical and contextual issues pertinent to clinical decision-making by observing morning rounds with housestaff hospitalist services. Ethical issues were categorized using a comprehensive standardized instrument previously developed and published by the Division of Medical Ethics.9
The Division of Hospital Medicine employs 79 physicians, 30 of whom are dedicated full-time to daytime care on house-staff (or teaching) or physician assistant services. Of these 30 physicians, two (7%) were coinvestigators in this project and were excluded from participation to avoid bias. Between September 2017 and May 2018, the attending physicians of record of all available housestaff services were invited to participate with their teams in our research study on a weekly basis. We observed 10 different Hospital Medicine attending physicians (10/28, 36% of the available physician sample) over 19 sessions. Before rounds, a brief introduction to the nature of the study was provided to each team. It was explicitly stated that the observers were present to identify and document possible ethical issues that may arise while discussing the patients on rounds, and that the purpose of the study was neither an evaluation of the team members or their decisions nor a critique or quality improvement exercise. Observing researchers were not allowed to participate in the discussion of any case.
To avoid potential case duplication, we allowed for a minimum two-week interval before rounding twice on any particular team. To control for interobserver variability, we observed in pairs during these sessions. Discrepancies between observers were resolved by post hoc discussion and application of the definitions of the standardized instrument used to identify and catalog ethical and contextual issues.
Study Variables and Definitions
The following variables were collected in all cases: observation date, name of reviewers, demographic characteristics of the patient (age, gender, race, ethnicity, marital status, religion, preferred language, insurance type, and living situation before the admission), patient’s location during the admission (emergency room, regular nursing floor, step-down unit, or other), and ethical and contextual issues. “Ethical issues” were defined as those situations involving a conflict of values or preferences among different stakeholders, including, but not limited to, providers, patients, and/or families. Explicit definitions of each issue were generated, and additional standard rules for completion were provided.
Statistical Analysis
Results are presented as n (%) or mean ± standard deviation. Percentages were rounded to the closest integer. Interobserver variability between the observers in relation to evaluating the presence or absence of ethical or contextual issues was assessed by the kappa statistic. All P values are two-sided, with statistical significance evaluated at the 0.05 alpha level. A 95% confidence interval (95% CI) for the kappa statistic (ie, for assessing interobserver variability) was calculated to assess the precision of the obtained kappa estimate. All analyses were performed in SAS Version 9.4 (SAS Institute, Inc., Cary, NC) and Stata Version 14.0 (StataCorp, College Station, TX).
RESULTS
General Characteristics of the Study Sample
In total, 270 patients were evaluated from the teaching hospitalist services during the observation period. Ethical issues were identified in 86 of these patients (31.8%). Observer ethicists disagreed in their initial evaluation of 17 cases (6.3%). After review of and adjudication, both observers agreed that nine of these 17 cases (3.3%) should be excluded from the final analysis, as none reached the necessary threshold to be considered as a true ethical issue. Hence, we report the results of 77 patients (28.5%). These cases comprised the Hospitalist group and involved 113 ethical issues (1.48 ± 0.5 ethical issues/case). Only five patients in the Hospitalist group had a formal clinical ethics consult before our observation (5/270 patients [1.9%] vs 77/270 patients [28.5%] with an ethical issue, respectively, P < .001). Although the majority of ethical issues were noted by members of the primary team (84%), 12 of the 77 cases in the Hospitalist group (16%) were identified only by the observing ethicists. The kappa statistic for interobserver variability between the observing ethicists was 0.85 (95% CI = 0.76-0.92). The major demographic characteristics are summarized in Table 1.
Ethical Challenges
The most common ethical issues hospitalists encountered involved discussions about goals of care (including decisions to pursue aggressive treatment versus hospice care, or debates about the team’s ambivalence about the benefits and risks of pursuing investigational chemotherapy), treatment refusals (including the decision to forgo biopsy of a suspected malignancy), or decision-making capacity (Table 2). Less common were issues pertaining to resource allocation (specially related to pressures to discharge patients), pain management (some patients were suspected of drug-seeking behavior), or surrogate decision-making (when alternative decision-makers were suspected to lack decision-making capacity). Discussions about forgoing life-sustaining treatments occurred only in four cases (5%). These involved considerations of withdrawing Bilevel Positive Airway Pressure (BiPAP), artificial nutrition and hydration, and/or stopping antibiotic treatment.
DISCUSSION
Our data are the first prospective description of ethical issues arising on an academic hospitalist teaching service. These results indicate that there is an ethics epidemiology in the routine practice of Hospital Medicine that has heretofore not been characterized. By this, we mean a discreet incidence and prevalence of ethical challenges in Hospital Medicine that is distinct from that which is encountered by clinical ethics consultation (CEC) services. Although most practitioners recognize the utility of a traditional ethics consultation, there is a surprising paucity of data about the sources of ethical conflict encountered by academic hospitalists at the bedside, particularly those addressed without CEC. This suggests that the criteria for requesting a formal ethics consult could be limited and restrictive, which is both undersensitive and overspecific.10 Because of these limitations, viewing traditional ethics consultation as a proxy for ethical issues arising in daily hospitalist practice would lead to an underestimation of the true prevalence, as our data indicate.
More than one-fourth of the patients admitted to hospitalist teaching services pose ethical conflicts. Some of these are addressed on rounds, some are not, and only a handful of these cases will ever be referred to an ethicist. CEC services are made aware of the “tip of the iceberg,” which accounts for a vanishingly small percentage of ethical issues that arise on daily rounds. Some hospitalists may not involve CEC simply because they believe that the services are not helpful. However, the failure to obtain consultation may also reflect an inability to recognize a “problematic situation” and formulate a referral that might benefit from the assistance of an ethics consultation.11
Our study faces several potential limitations. We are presenting a single-center experience that focuses on the perspective of physicians and trainees. Some ethical issues might have been underestimated because the perspectives of patients, families, nurses, social workers, or other ancillary staff were not directly included. Furthermore, since any ethical challenge could have been discussed on any moment other than on morning rounds, our results may underestimate the prevalence of ethical issues arising from the hospital floors. Moreover, medical teams participating in the study could have been subject to the Hawthorne effect and could have tried to identify a greater number of ethical issues on rounds, which would not reflect actual practice.
CONCLUSION
Almost two decades ago, Coulehan and Williams wrote about the positive impact that ethics and humanities could have if these disciplines could be embedded in the daily practice of medicine, which is as follows:
…ethics and humanities curricula are irrelevant unless they can produce a substantive and continuing impact on hospital culture (…) The idea, of course, is to infiltrate the culture by coopting residents and attending physicians(…) If an ethics program can somehow achieve a critical mass of ‘‘value-sensitive’’ clinical faculty, it may begin to influence the institution’s ethos.12
Coulehan and Williams wrote of a need to bring ethics to the bedside. Our data suggest that an ethics epidemiology is deeply embedded in hospitalist services and is waiting to be fully characterized to better inform the care of patients and guide the professional formation and education of students and trainees. Hospitalists frequently confront ethical problems in daily practice that do not come to the attention of the CEC services or the institutional ethics committee. Understanding this emerging epidemiology presents an unrealized opportunity to improve bedside teaching, reinforce normative reasoning, and enhance patient care.
Acknowledgments
The authors want to acknowledge Drs. Augustine I. Choi, Michael G. Stewart, Laura L. Forese, and Anthony Hollenberg for their support of the fellowship in medical ethics and thank Drs. Arthur T. Evans and Monika M. Safford for their guidance.
Disclosures
The authors report no conflicts of interest.
Funding
This work was supported by a Weill Cornell General Internal Medicine Primary Care Innovations Initiative seed grant. Dr. Paul Christos was partially supported by the following grant: Clinical and Translational Science Center at Weill Cornell Medical College (1-UL1-TR002384-01).
1. Doja A, Bould MD, Clarkin C, Eady K, Sutherland S, Writer H. The hidden and informal curriculum across the continuum of training: a cross-sectional qualitative study. Med Teach. 2016;38(4):410-418. doi: 10.3109/0142159X.2015.1073241. PubMed
2. Martimianakis MA, Hafferty FW. Exploring the interstitial space between the ideal and the practised: humanism and the hidden curriculum of system reform. Med Educ. 2016;50(3):278-280. doi: 10.1111/medu.12982. PubMed
3. Lawrence C, Mhlaba T, Stewart KA, Moletsane R, Gaede B, Moshabela M. The hidden curricula of medical education: a scoping review. Acad Med. 2017;93(4):648-656. doi: 10.1097/ACM.0000000000002004. PubMed
4. McCarthy MW, Real de Asua D, Fins JJ. The rise of hospitalists: an opportunity for clinical ethics. J Clin Ethics. 2017;28(4):325-332. PubMed
5. McCarthy M, Fins J. Teaching clinical ethics at the bedside: William Osler and the essential role of the hospitalist. AMA J Ethics. 2017;19(6):528-532. doi: 10.1001/journalofethics.2017.19.6.peer2-1706. PubMed
6. Gabbay E, McCarthy MW, Fins JJ. The care of the ultra-orthodox Jewish patient. J Relig Health. 2017;56(2):545-560. doi: 10.1007/s10943-017-0356-6. PubMed
7. Wachter RM, Goldman L. The emerging role of “hospitalists” in the American health care system. N Engl J Med. 1996;335(7):514-517. doi: 10.1056/NEJM199608153350713. PubMed
8. Hauer KE, Wachter RM, McCulloch CE, Woo GA, Auerbach AD. Effects of hospitalist attending physicians on trainee satisfaction with teaching and with internal medicine rotations. Arch Intern Med. 2004;164(17):1866-1871. doi: 10.1001/archinte.164.17.1866. PubMed
9. Nilson EG, Acres CA, Tamerin NG, Fins JJ. Clinical ethics and the quality initiative: a pilot study for the empirical evaluation of ethics case consultation. Am J Med Qual. 2008;23(5):356-364. doi: 10.1177/1062860608316729. PubMed
10. Hurst SA, Reiter-Theil S, Perrier A, et al. Physicians’ access to ethics support services in four European countries. Health Care Anal. 2007;15(4):321-335. doi: 10.1007/s10728-007-0072-6. PubMed
11. Fins JJ, Bacchetta MD, Miller FG. Clinical pragmatism: a method of moral problem solving. Kennedy Inst Ethics J. 1997;7(2):129-145. doi: 10.1353/ken.1997.0013. PubMed
12. Coulehan J, Williams PC. Vanquishing virtue: the impact of medical education. Acad Med. 2001;76(6):598-605. PubMed
© 2019 Society of Hospital Medicine